Cities with the Highest Percentage of Population with a Degree in Social Sciences in Delaware
RELATED REPORTS & OPTIONS
Social Sciences
Delaware
Compare Cities
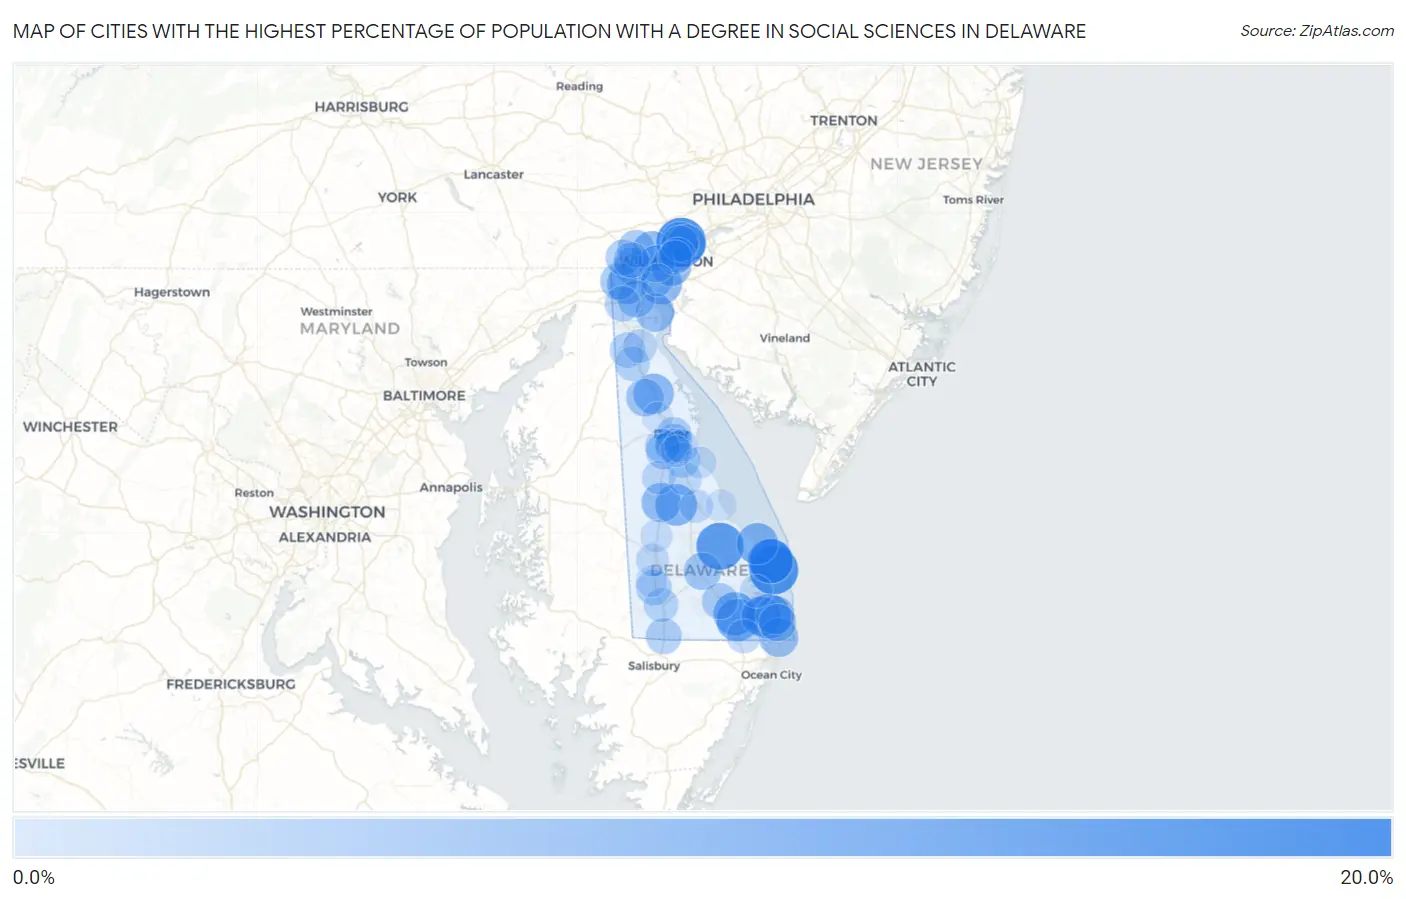
Map of Cities with the Highest Percentage of Population with a Degree in Social Sciences in Delaware
0.0%
20.0%
Cities with the Highest Percentage of Population with a Degree in Social Sciences in Delaware
| City | % Graduates | vs State | vs National | |
| 1. | Ardentown | 19.9% | 7.4%(+12.4)#1 | 8.1%(+11.8)#1,357 |
| 2. | Dewey Beach | 19.2% | 7.4%(+11.8)#2 | 8.1%(+11.2)#1,441 |
| 3. | Milton | 17.5% | 7.4%(+10.1)#3 | 8.1%(+9.41)#1,745 |
| 4. | Rehoboth Beach | 14.7% | 7.4%(+7.24)#4 | 8.1%(+6.58)#2,512 |
| 5. | Ocean View | 14.6% | 7.4%(+7.20)#5 | 8.1%(+6.55)#2,528 |
| 6. | Henlopen Acres | 14.4% | 7.4%(+6.96)#6 | 8.1%(+6.30)#2,603 |
| 7. | Dagsboro | 13.1% | 7.4%(+5.67)#7 | 8.1%(+5.01)#3,190 |
| 8. | Frankford | 12.5% | 7.4%(+5.08)#8 | 8.1%(+4.43)#3,517 |
| 9. | Houston | 11.8% | 7.4%(+4.35)#9 | 8.1%(+3.69)#3,957 |
| 10. | Lewes | 11.6% | 7.4%(+4.20)#10 | 8.1%(+3.55)#4,062 |
| 11. | New Castle | 11.4% | 7.4%(+4.03)#11 | 8.1%(+3.38)#4,186 |
| 12. | Brookside | 10.6% | 7.4%(+3.20)#12 | 8.1%(+2.54)#4,882 |
| 13. | Greenville | 10.4% | 7.4%(+2.98)#13 | 8.1%(+2.33)#5,079 |
| 14. | Smyrna | 10.3% | 7.4%(+2.85)#14 | 8.1%(+2.20)#5,196 |
| 15. | Millville | 10.0% | 7.4%(+2.55)#15 | 8.1%(+1.90)#5,513 |
| 16. | Wilmington | 9.9% | 7.4%(+2.49)#16 | 8.1%(+1.84)#5,573 |
| 17. | Harrington | 9.4% | 7.4%(+2.00)#17 | 8.1%(+1.34)#6,108 |
| 18. | Arden | 9.0% | 7.4%(+1.54)#18 | 8.1%(+0.884)#6,659 |
| 19. | Fenwick Island | 8.9% | 7.4%(+1.46)#19 | 8.1%(+0.807)#6,753 |
| 20. | Delaware City | 8.6% | 7.4%(+1.18)#20 | 8.1%(+0.523)#7,109 |
| 21. | Claymont | 8.6% | 7.4%(+1.17)#21 | 8.1%(+0.518)#7,115 |
| 22. | Bethany Beach | 8.5% | 7.4%(+1.05)#22 | 8.1%(+0.401)#7,270 |
| 23. | Clayton | 7.7% | 7.4%(+0.322)#23 | 8.1%(-0.331)#8,363 |
| 24. | Pike Creek Valley | 7.5% | 7.4%(+0.101)#24 | 8.1%(-0.552)#8,709 |
| 25. | Georgetown | 7.4% | 7.4%(-0.051)#25 | 8.1%(-0.704)#8,971 |
| 26. | Hockessin | 7.3% | 7.4%(-0.119)#26 | 8.1%(-0.772)#9,063 |
| 27. | South Bethany | 7.3% | 7.4%(-0.164)#27 | 8.1%(-0.817)#9,132 |
| 28. | Bear | 7.1% | 7.4%(-0.343)#28 | 8.1%(-0.996)#9,440 |
| 29. | Elsmere | 7.0% | 7.4%(-0.411)#29 | 8.1%(-1.06)#9,552 |
| 30. | Newark | 6.9% | 7.4%(-0.498)#30 | 8.1%(-1.15)#9,668 |
| 31. | Kent Acres | 6.7% | 7.4%(-0.672)#31 | 8.1%(-1.33)#9,948 |
| 32. | Ardencroft | 6.4% | 7.4%(-0.996)#32 | 8.1%(-1.65)#10,513 |
| 33. | North Star | 6.2% | 7.4%(-1.26)#33 | 8.1%(-1.91)#10,948 |
| 34. | Millsboro | 6.0% | 7.4%(-1.38)#34 | 8.1%(-2.04)#11,167 |
| 35. | Camden | 6.0% | 7.4%(-1.44)#35 | 8.1%(-2.09)#11,270 |
| 36. | Delmar | 5.8% | 7.4%(-1.57)#36 | 8.1%(-2.22)#11,528 |
| 37. | Dover | 5.7% | 7.4%(-1.68)#37 | 8.1%(-2.33)#11,709 |
| 38. | Pike Creek | 5.5% | 7.4%(-1.95)#38 | 8.1%(-2.60)#12,170 |
| 39. | Blades | 5.5% | 7.4%(-1.96)#39 | 8.1%(-2.62)#12,197 |
| 40. | Glasgow | 5.4% | 7.4%(-2.01)#40 | 8.1%(-2.66)#12,281 |
| 41. | Middletown | 5.3% | 7.4%(-2.13)#41 | 8.1%(-2.79)#12,501 |
| 42. | Highland Acres | 5.2% | 7.4%(-2.20)#42 | 8.1%(-2.85)#12,645 |
| 43. | Magnolia | 5.2% | 7.4%(-2.25)#43 | 8.1%(-2.90)#12,723 |
| 44. | Bellefonte | 5.0% | 7.4%(-2.43)#44 | 8.1%(-3.08)#13,033 |
| 45. | Wyoming | 4.6% | 7.4%(-2.85)#45 | 8.1%(-3.50)#13,757 |
| 46. | Townsend | 4.5% | 7.4%(-2.96)#46 | 8.1%(-3.61)#13,959 |
| 47. | Laurel | 4.4% | 7.4%(-3.02)#47 | 8.1%(-3.68)#14,060 |
| 48. | Edgemoor | 4.2% | 7.4%(-3.17)#48 | 8.1%(-3.82)#14,344 |
| 49. | Selbyville | 3.9% | 7.4%(-3.49)#49 | 8.1%(-4.14)#14,872 |
| 50. | Odessa | 3.8% | 7.4%(-3.60)#50 | 8.1%(-4.25)#15,081 |
| 51. | Dover Base Housing | 3.8% | 7.4%(-3.61)#51 | 8.1%(-4.26)#15,100 |
| 52. | Felton | 3.5% | 7.4%(-3.94)#52 | 8.1%(-4.59)#15,678 |
| 53. | Frederica | 3.4% | 7.4%(-4.05)#53 | 8.1%(-4.70)#15,846 |
| 54. | Milford | 3.3% | 7.4%(-4.11)#54 | 8.1%(-4.77)#15,952 |
| 55. | Long Neck | 3.1% | 7.4%(-4.33)#55 | 8.1%(-4.99)#16,301 |
| 56. | Bridgeville | 2.9% | 7.4%(-4.56)#56 | 8.1%(-5.22)#16,681 |
| 57. | Wilmington Manor | 2.7% | 7.4%(-4.67)#57 | 8.1%(-5.32)#16,852 |
| 58. | Greenwood | 2.5% | 7.4%(-4.95)#58 | 8.1%(-5.60)#17,270 |
| 59. | Bowers | 2.2% | 7.4%(-5.27)#59 | 8.1%(-5.92)#17,711 |
| 60. | Rising Sun Lebanon | 1.7% | 7.4%(-5.70)#60 | 8.1%(-6.35)#18,232 |
| 61. | Seaford | 1.6% | 7.4%(-5.80)#61 | 8.1%(-6.45)#18,344 |
| 62. | Slaughter Beach | 1.1% | 7.4%(-6.29)#62 | 8.1%(-6.94)#18,796 |
| 63. | Cheswold | 1.1% | 7.4%(-6.35)#63 | 8.1%(-7.00)#18,842 |
1
Common Questions
What are the Top 10 Cities with the Highest Percentage of Population with a Degree in Social Sciences in Delaware?
Top 10 Cities with the Highest Percentage of Population with a Degree in Social Sciences in Delaware are:
#1
19.9%
#2
19.2%
#3
17.5%
#4
14.7%
#5
14.6%
#6
14.4%
#7
13.1%
#8
12.5%
#9
11.8%
#10
11.6%
What city has the Highest Percentage of Population with a Degree in Social Sciences in Delaware?
Ardentown has the Highest Percentage of Population with a Degree in Social Sciences in Delaware with 19.9%.
What is the Percentage of Population with a Degree in Social Sciences in the State of Delaware?
Percentage of Population with a Degree in Social Sciences in Delaware is 7.4%.
What is the Percentage of Population with a Degree in Social Sciences in the United States?
Percentage of Population with a Degree in Social Sciences in the United States is 8.1%.