Vienna, NJ
Vienna Map
Vienna Overview
766
TOTAL POPULATION
378
MALE POPULATION
388
FEMALE POPULATION
97.42
MALES / 100 FEMALES
102.65
FEMALES / 100 MALES
36.7
MEDIAN AGE
4.2
AVG FAMILY SIZE
3.9
AVG HOUSEHOLD SIZE
$52,244
PER CAPITA INCOME
$161,023
AVG FAMILY INCOME
$156,750
AVG HOUSEHOLD INCOME
36.4%
WAGE / INCOME GAP [ % ]
63.6¢/ $1
WAGE / INCOME GAP [ $ ]
0.36
INEQUALITY / GINI INDEX
488
LABOR FORCE [ PEOPLE ]
77.2%
PERCENT IN LABOR FORCE
Vienna Zip Codes
Vienna Area Codes
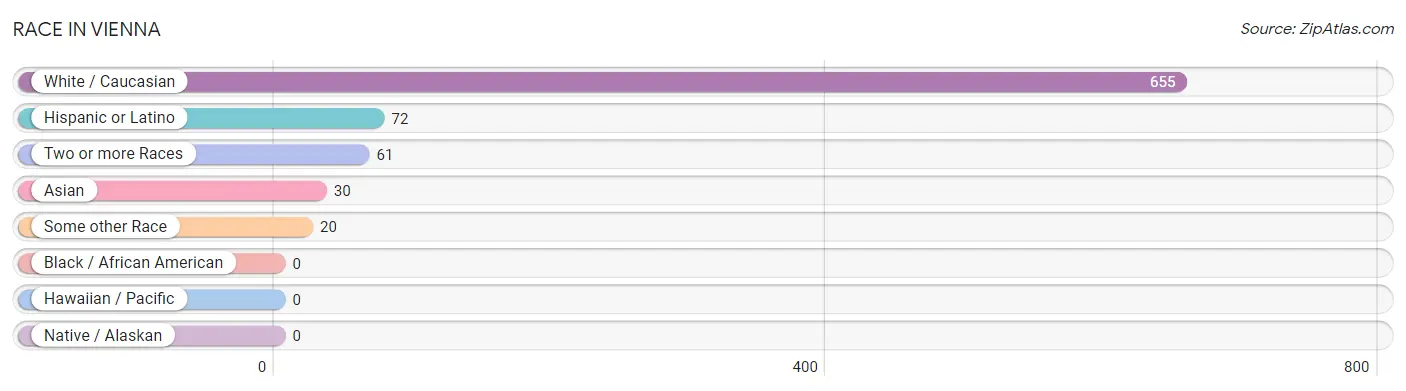
Race in Vienna
The most populous races in Vienna are White / Caucasian (655 | 85.5%), Hispanic or Latino (72 | 9.4%), and Two or more Races (61 | 8.0%).
| Race | # Population | % Population |
| Asian | 30 | 3.9% |
| Black / African American | 0 | 0.0% |
| Hawaiian / Pacific | 0 | 0.0% |
| Hispanic or Latino | 72 | 9.4% |
| Native / Alaskan | 0 | 0.0% |
| White / Caucasian | 655 | 85.5% |
| Two or more Races | 61 | 8.0% |
| Some other Race | 20 | 2.6% |
| Total | 766 | 100.0% |
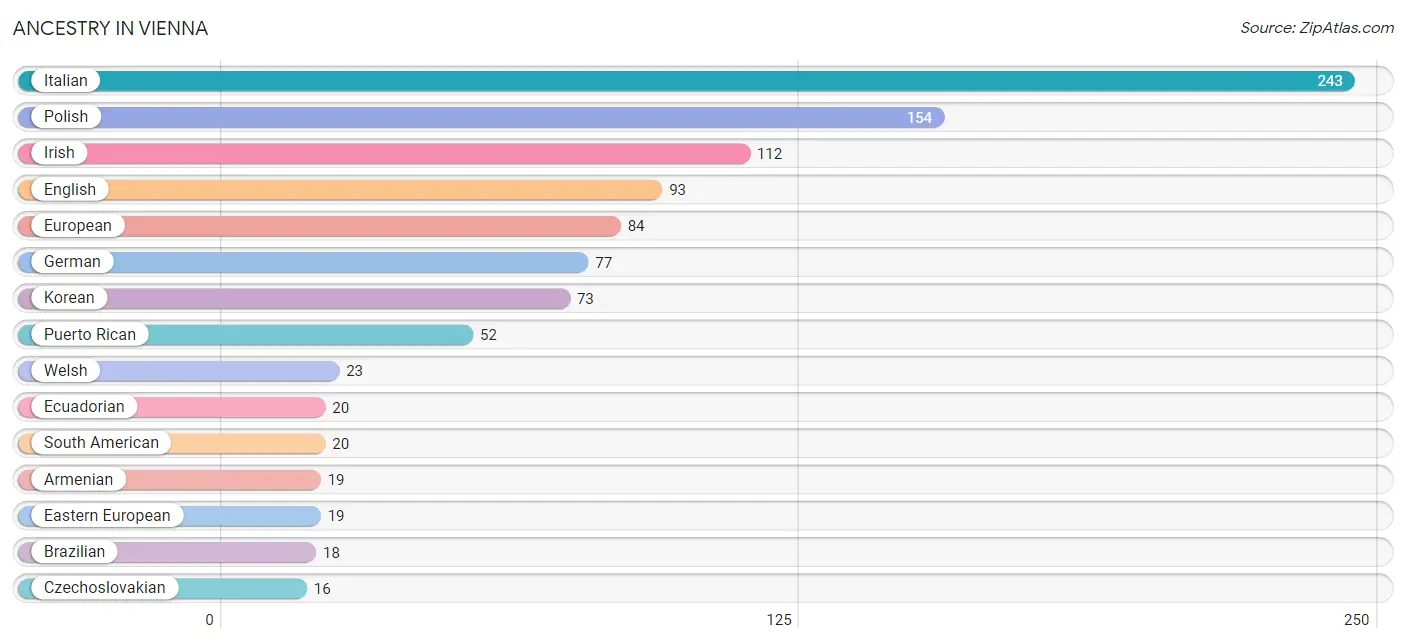
Ancestry in Vienna
The most populous ancestries reported in Vienna are Italian (243 | 31.7%), Polish (154 | 20.1%), Irish (112 | 14.6%), English (93 | 12.1%), and European (84 | 11.0%), together accounting for 89.5% of all Vienna residents.
| Ancestry | # Population | % Population |
| Armenian | 19 | 2.5% |
| Brazilian | 18 | 2.4% |
| Czechoslovakian | 16 | 2.1% |
| Eastern European | 19 | 2.5% |
| Ecuadorian | 20 | 2.6% |
| English | 93 | 12.1% |
| European | 84 | 11.0% |
| German | 77 | 10.1% |
| Irish | 112 | 14.6% |
| Italian | 243 | 31.7% |
| Korean | 73 | 9.5% |
| Polish | 154 | 20.1% |
| Puerto Rican | 52 | 6.8% |
| Scottish | 12 | 1.6% |
| South American | 20 | 2.6% |
| Swedish | 8 | 1.0% |
| Ukrainian | 14 | 1.8% |
| Welsh | 23 | 3.0% | View All 18 Rows |
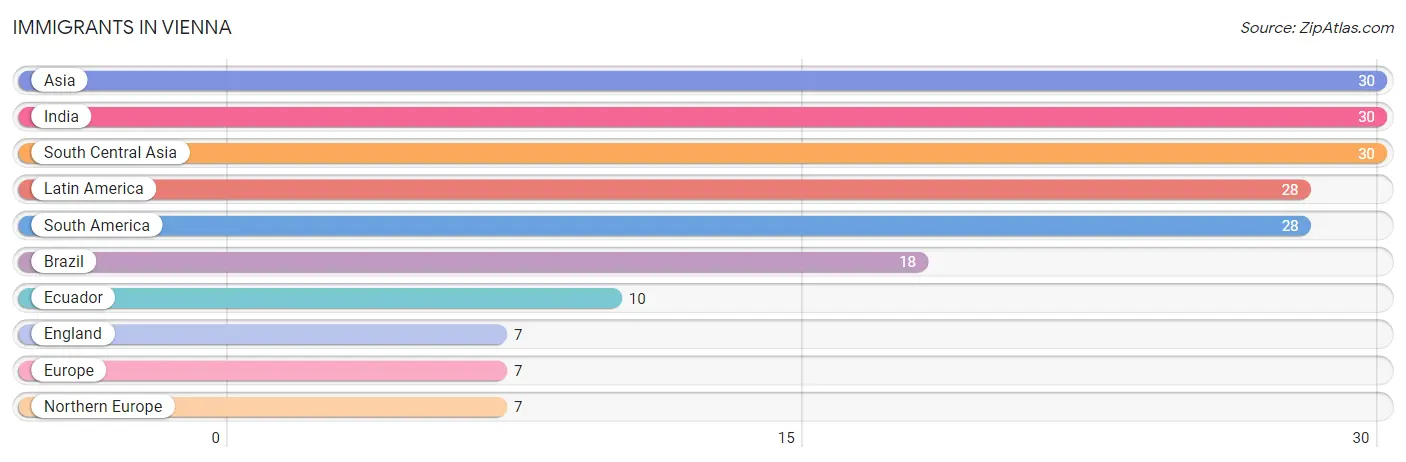
Immigrants in Vienna
The most numerous immigrant groups reported in Vienna came from Asia (30 | 3.9%), India (30 | 3.9%), South Central Asia (30 | 3.9%), Latin America (28 | 3.7%), and South America (28 | 3.7%), together accounting for 19.1% of all Vienna residents.
| Immigration Origin | # Population | % Population |
| Asia | 30 | 3.9% |
| Brazil | 18 | 2.4% |
| Ecuador | 10 | 1.3% |
| England | 7 | 0.9% |
| Europe | 7 | 0.9% |
| India | 30 | 3.9% |
| Latin America | 28 | 3.7% |
| Northern Europe | 7 | 0.9% |
| South America | 28 | 3.7% |
| South Central Asia | 30 | 3.9% | View All 10 Rows |
Sex and Age in Vienna
Sex and Age in Vienna
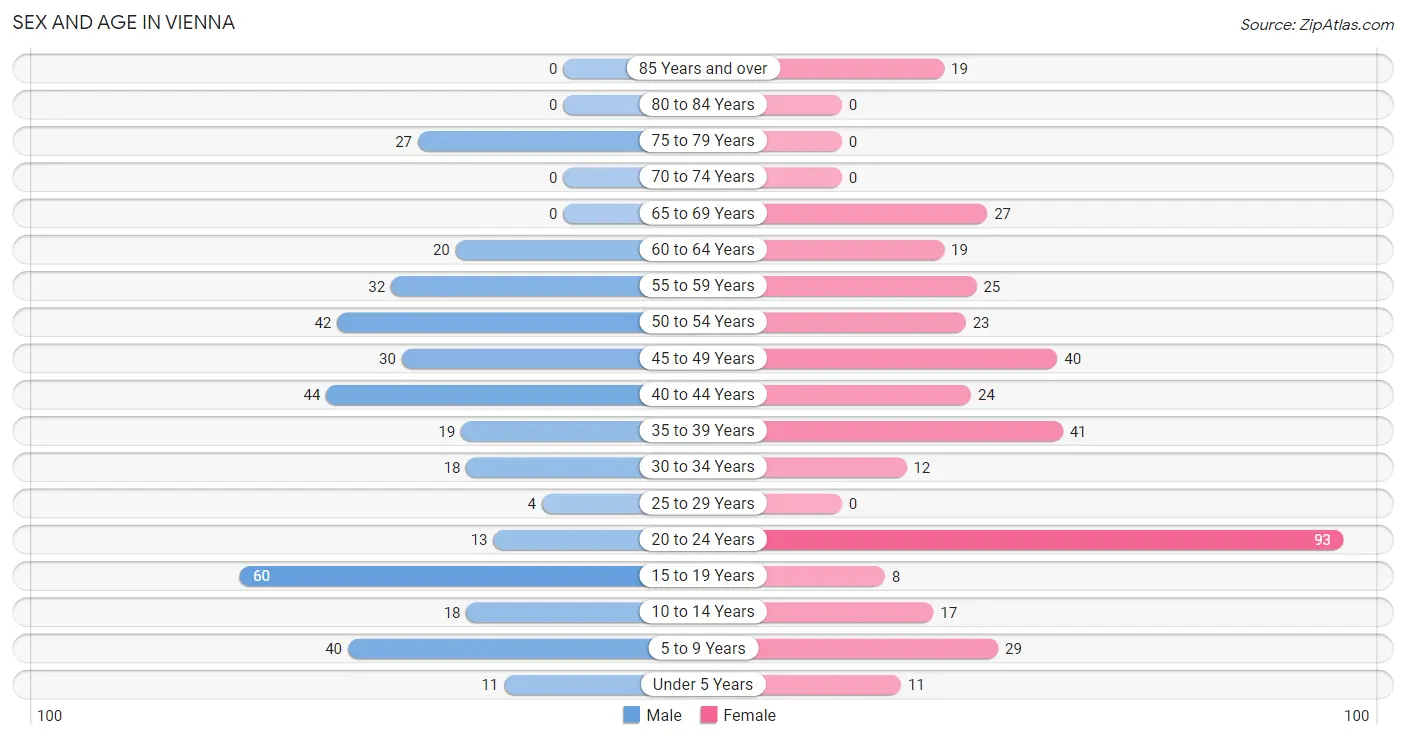
The most populous age groups in Vienna are 15 to 19 Years (60 | 15.9%) for men and 20 to 24 Years (93 | 24.0%) for women.
| Age Bracket | Male | Female |
| Under 5 Years | 11 (2.9%) | 11 (2.8%) |
| 5 to 9 Years | 40 (10.6%) | 29 (7.5%) |
| 10 to 14 Years | 18 (4.8%) | 17 (4.4%) |
| 15 to 19 Years | 60 (15.9%) | 8 (2.1%) |
| 20 to 24 Years | 13 (3.4%) | 93 (24.0%) |
| 25 to 29 Years | 4 (1.1%) | 0 (0.0%) |
| 30 to 34 Years | 18 (4.8%) | 12 (3.1%) |
| 35 to 39 Years | 19 (5.0%) | 41 (10.6%) |
| 40 to 44 Years | 44 (11.6%) | 24 (6.2%) |
| 45 to 49 Years | 30 (7.9%) | 40 (10.3%) |
| 50 to 54 Years | 42 (11.1%) | 23 (5.9%) |
| 55 to 59 Years | 32 (8.5%) | 25 (6.4%) |
| 60 to 64 Years | 20 (5.3%) | 19 (4.9%) |
| 65 to 69 Years | 0 (0.0%) | 27 (7.0%) |
| 70 to 74 Years | 0 (0.0%) | 0 (0.0%) |
| 75 to 79 Years | 27 (7.1%) | 0 (0.0%) |
| 80 to 84 Years | 0 (0.0%) | 0 (0.0%) |
| 85 Years and over | 0 (0.0%) | 19 (4.9%) |
| Total | 378 (100.0%) | 388 (100.0%) |
Families and Households in Vienna
Median Family Size in Vienna
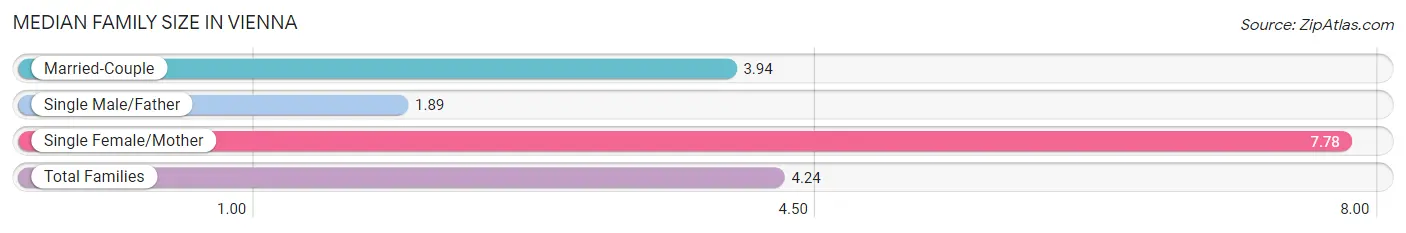
The median family size in Vienna is 4.24 persons per family, with single female/mother families (18 | 10.7%) accounting for the largest median family size of 7.78 persons per family. On the other hand, single male/father families (9 | 5.4%) represent the smallest median family size with 1.89 persons per family.
| Family Type | # Families | Family Size |
| Married-Couple | 141 (83.9%) | 3.94 |
| Single Male/Father | 9 (5.4%) | 1.89 |
| Single Female/Mother | 18 (10.7%) | 7.78 |
| Total Families | 168 (100.0%) | 4.24 |
Median Household Size in Vienna
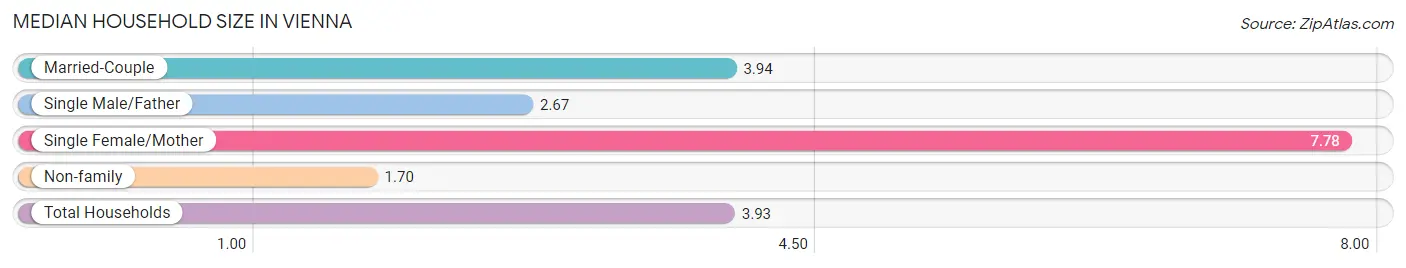
The median household size in Vienna is 3.93 persons per household, with single female/mother households (18 | 9.2%) accounting for the largest median household size of 7.78 persons per household. non-family households (27 | 13.9%) represent the smallest median household size with 1.70 persons per household.
| Household Type | # Households | Household Size |
| Married-Couple | 141 (72.3%) | 3.94 |
| Single Male/Father | 9 (4.6%) | 2.67 |
| Single Female/Mother | 18 (9.2%) | 7.78 |
| Non-family | 27 (13.9%) | 1.70 |
| Total Households | 195 (100.0%) | 3.93 |
Household Size by Marriage Status in Vienna
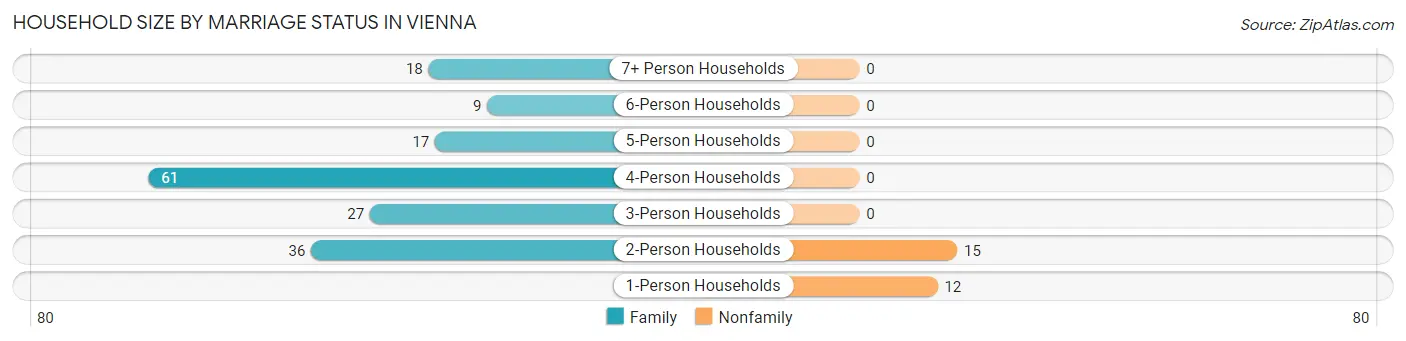
Out of a total of 195 households in Vienna, 168 (86.2%) are family households, while 27 (13.9%) are nonfamily households. The most numerous type of family households are 4-person households, comprising 61, and the most common type of nonfamily households are 2-person households, comprising 15.
| Household Size | Family Households | Nonfamily Households |
| 1-Person Households | - | 12 (6.1%) |
| 2-Person Households | 36 (18.5%) | 15 (7.7%) |
| 3-Person Households | 27 (13.9%) | 0 (0.0%) |
| 4-Person Households | 61 (31.3%) | 0 (0.0%) |
| 5-Person Households | 17 (8.7%) | 0 (0.0%) |
| 6-Person Households | 9 (4.6%) | 0 (0.0%) |
| 7+ Person Households | 18 (9.2%) | 0 (0.0%) |
| Total | 168 (86.2%) | 27 (13.9%) |
Female Fertility in Vienna
Fertility by Age in Vienna
| Age Bracket | Women with Births | Births / 1,000 Women |
| 15 to 19 years | 0 (0.0%) | 0.0 |
| 20 to 34 years | 0 (0.0%) | 0.0 |
| 35 to 50 years | 0 (0.0%) | 0.0 |
| Total | 0 (0.0%) | 0.0 |
Fertility by Age by Marriage Status in Vienna
| Age Bracket | Married | Unmarried |
| 15 to 19 years | 0 (0.0%) | 0 (0.0%) |
| 20 to 34 years | 0 (0.0%) | 0 (0.0%) |
| 35 to 50 years | 0 (0.0%) | 0 (0.0%) |
| Total | 0 (0.0%) | 0 (0.0%) |
Fertility by Education in Vienna
| Educational Attainment | Women with Births | Births / 1,000 Women |
| Less than High School | 0 (0.0%) | 0.0 |
| High School Diploma | 0 (0.0%) | 0.0 |
| College or Associate's Degree | 0 (0.0%) | 0.0 |
| Bachelor's Degree | 0 (0.0%) | 0.0 |
| Graduate Degree | 0 (0.0%) | 0.0 |
| Total | 0 (0.0%) | 0.0 |
Fertility by Education by Marriage Status in Vienna
| Educational Attainment | Married | Unmarried |
| Less than High School | 0 (0.0%) | 0 (0.0%) |
| High School Diploma | 0 (0.0%) | 0 (0.0%) |
| College or Associate's Degree | 0 (0.0%) | 0 (0.0%) |
| Bachelor's Degree | 0 (0.0%) | 0 (0.0%) |
| Graduate Degree | 0 (0.0%) | 0 (0.0%) |
| Total | 0 (0.0%) | 0 (0.0%) |
Income in Vienna
Income Overview in Vienna
Per Capita Income in Vienna is $52,244, while median incomes of families and households are $161,023 and $156,750 respectively.
| Characteristic | Number | Measure |
| Per Capita Income | 766 | $52,244 |
| Median Family Income | 168 | $161,023 |
| Mean Family Income | 168 | $208,828 |
| Median Household Income | 195 | $156,750 |
| Mean Household Income | 195 | $193,254 |
| Income Deficit | 168 | $0 |
| Wage / Income Gap (%) | 766 | 36.36% |
| Wage / Income Gap ($) | 766 | 63.64¢ per $1 |
| Gini / Inequality Index | 766 | 0.36 |
Earnings by Sex in Vienna
Average Earnings in Vienna are $48,810, $44,911 for men and $70,575 for women, a difference of 36.4%.
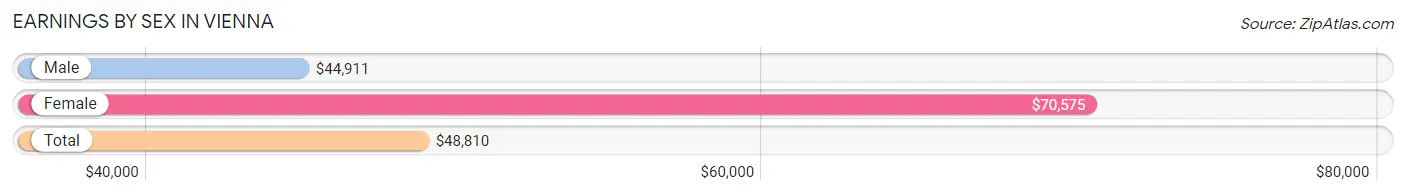
| Sex | Number | Average Earnings |
| Male | 259 (52.0%) | $44,911 |
| Female | 239 (48.0%) | $70,575 |
| Total | 498 (100.0%) | $48,810 |
Earnings by Sex by Income Bracket in Vienna
The most common earnings brackets in Vienna are $55,000 to $64,999 for men (44 | 17.0%) and $65,000 to $74,999 for women (50 | 20.9%).
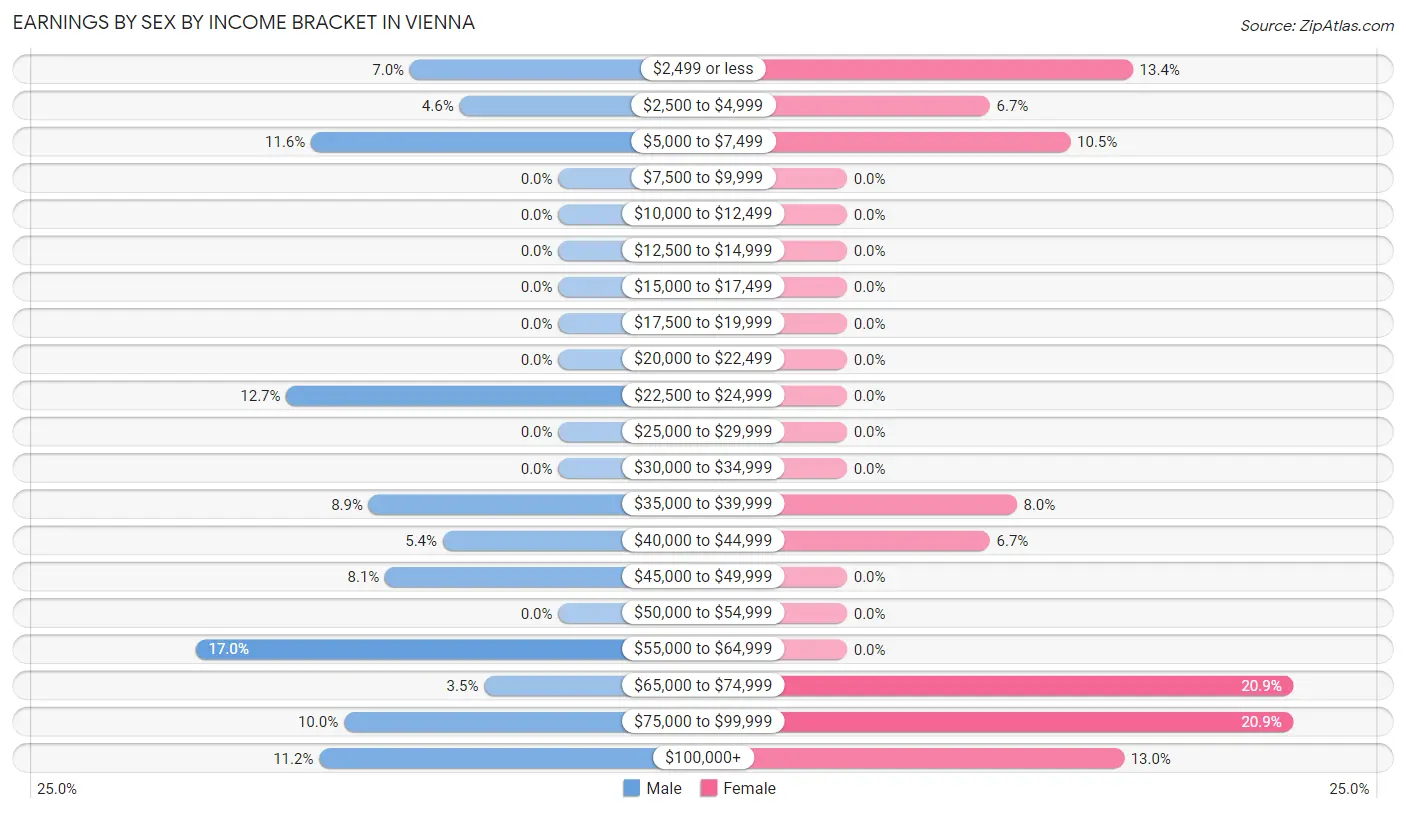
| Income | Male | Female |
| $2,499 or less | 18 (7.0%) | 32 (13.4%) |
| $2,500 to $4,999 | 12 (4.6%) | 16 (6.7%) |
| $5,000 to $7,499 | 30 (11.6%) | 25 (10.5%) |
| $7,500 to $9,999 | 0 (0.0%) | 0 (0.0%) |
| $10,000 to $12,499 | 0 (0.0%) | 0 (0.0%) |
| $12,500 to $14,999 | 0 (0.0%) | 0 (0.0%) |
| $15,000 to $17,499 | 0 (0.0%) | 0 (0.0%) |
| $17,500 to $19,999 | 0 (0.0%) | 0 (0.0%) |
| $20,000 to $22,499 | 0 (0.0%) | 0 (0.0%) |
| $22,500 to $24,999 | 33 (12.7%) | 0 (0.0%) |
| $25,000 to $29,999 | 0 (0.0%) | 0 (0.0%) |
| $30,000 to $34,999 | 0 (0.0%) | 0 (0.0%) |
| $35,000 to $39,999 | 23 (8.9%) | 19 (8.0%) |
| $40,000 to $44,999 | 14 (5.4%) | 16 (6.7%) |
| $45,000 to $49,999 | 21 (8.1%) | 0 (0.0%) |
| $50,000 to $54,999 | 0 (0.0%) | 0 (0.0%) |
| $55,000 to $64,999 | 44 (17.0%) | 0 (0.0%) |
| $65,000 to $74,999 | 9 (3.5%) | 50 (20.9%) |
| $75,000 to $99,999 | 26 (10.0%) | 50 (20.9%) |
| $100,000+ | 29 (11.2%) | 31 (13.0%) |
| Total | 259 (100.0%) | 239 (100.0%) |
Earnings by Sex by Educational Attainment in Vienna
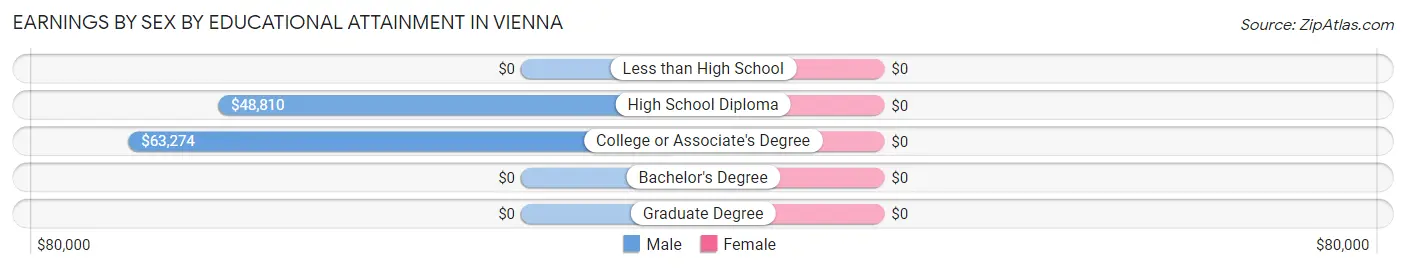
| Educational Attainment | Male Income | Female Income |
| Less than High School | - | - |
| High School Diploma | $48,810 | $0 |
| College or Associate's Degree | $63,274 | $0 |
| Bachelor's Degree | - | - |
| Graduate Degree | - | - |
| Total | $62,784 | $71,806 |
Family Income in Vienna
Family Income Brackets in Vienna
According to the Vienna family income data, there are 66 families falling into the $100,000 to $149,999 income range, which is the most common income bracket and makes up 39.3% of all families.
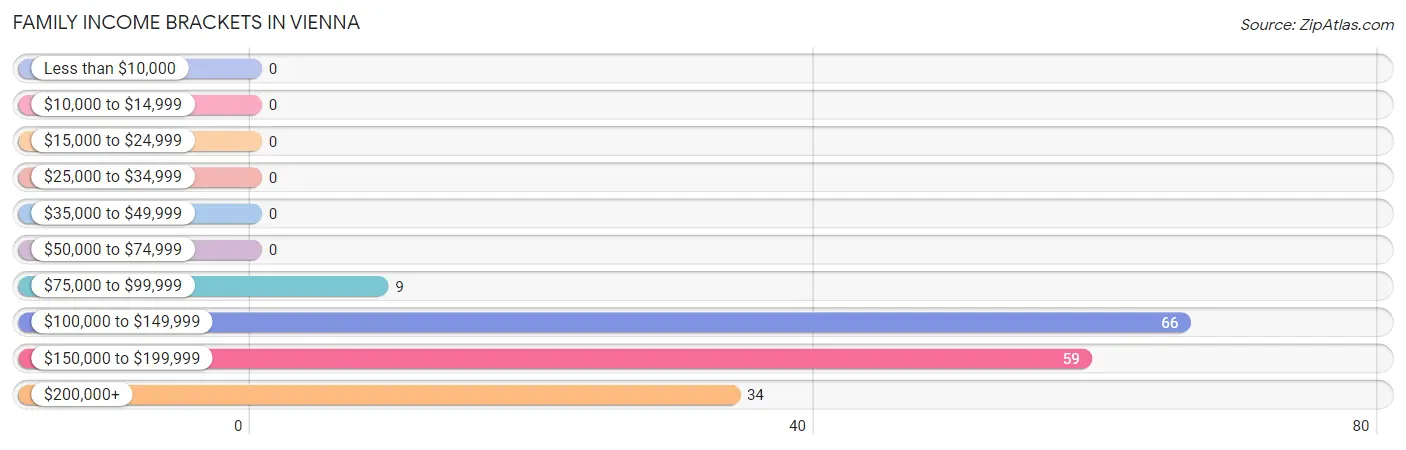
| Income Bracket | # Families | % Families |
| Less than $10,000 | 0 | 0.0% |
| $10,000 to $14,999 | 0 | 0.0% |
| $15,000 to $24,999 | 0 | 0.0% |
| $25,000 to $34,999 | 0 | 0.0% |
| $35,000 to $49,999 | 0 | 0.0% |
| $50,000 to $74,999 | 0 | 0.0% |
| $75,000 to $99,999 | 9 | 5.4% |
| $100,000 to $149,999 | 66 | 39.3% |
| $150,000 to $199,999 | 59 | 35.1% |
| $200,000+ | 34 | 20.2% |
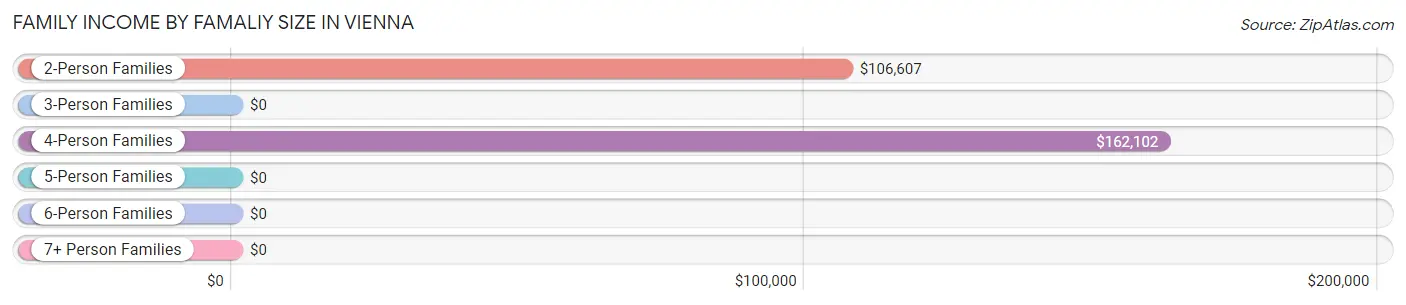
Family Income by Famaliy Size in Vienna
4-person families (61 | 36.3%) account for the highest median family income in Vienna with $162,102 per family, while 2-person families (45 | 26.8%) have the highest median income of $53,304 per family member.
| Income Bracket | # Families | Median Income |
| 2-Person Families | 45 (26.8%) | $106,607 |
| 3-Person Families | 18 (10.7%) | $0 |
| 4-Person Families | 61 (36.3%) | $162,102 |
| 5-Person Families | 17 (10.1%) | $0 |
| 6-Person Families | 9 (5.4%) | $0 |
| 7+ Person Families | 18 (10.7%) | $0 |
| Total | 168 (100.0%) | $161,023 |
Family Income by Number of Earners in Vienna
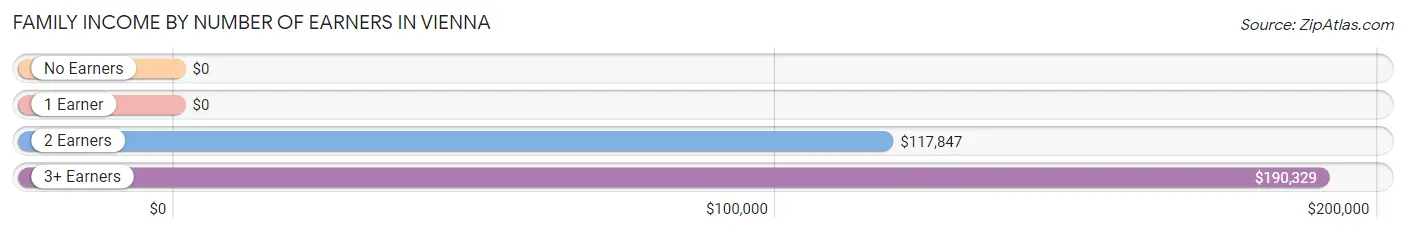
| Number of Earners | # Families | Median Income |
| No Earners | 15 (8.9%) | $0 |
| 1 Earner | 21 (12.5%) | $0 |
| 2 Earners | 47 (28.0%) | $117,847 |
| 3+ Earners | 85 (50.6%) | $190,329 |
| Total | 168 (100.0%) | $161,023 |
Household Income in Vienna
Household Income Brackets in Vienna
With 75 households falling in the category, the $100,000 to $149,999 income range is the most frequent in Vienna, accounting for 38.5% of all households.
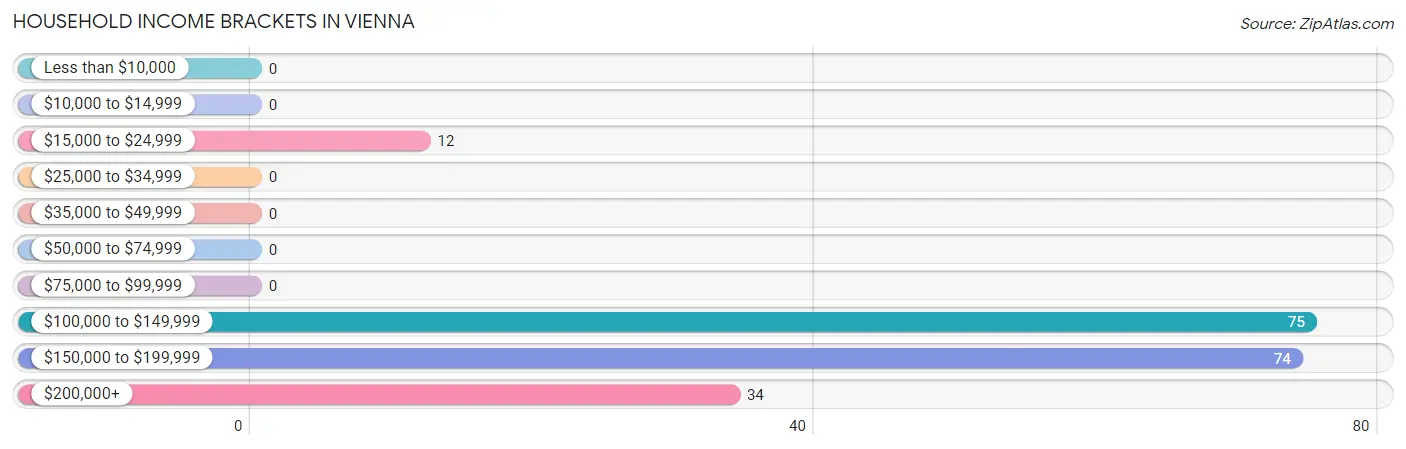
| Income Bracket | # Households | % Households |
| Less than $10,000 | 0 | 0.0% |
| $10,000 to $14,999 | 0 | 0.0% |
| $15,000 to $24,999 | 12 | 6.2% |
| $25,000 to $34,999 | 0 | 0.0% |
| $35,000 to $49,999 | 0 | 0.0% |
| $50,000 to $74,999 | 0 | 0.0% |
| $75,000 to $99,999 | 0 | 0.0% |
| $100,000 to $149,999 | 75 | 38.5% |
| $150,000 to $199,999 | 74 | 37.9% |
| $200,000+ | 34 | 17.4% |
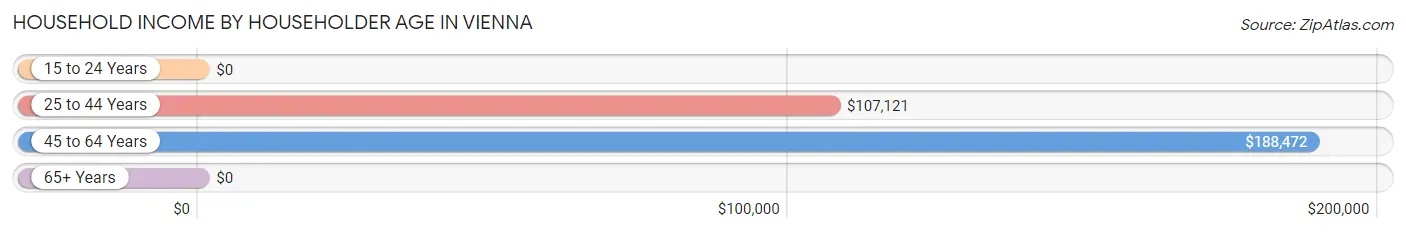
Household Income by Householder Age in Vienna
The median household income in Vienna is $156,750, with the highest median household income of $188,472 found in the 45 to 64 years age bracket for the primary householder. A total of 112 households (57.4%) fall into this category.
| Income Bracket | # Households | Median Income |
| 15 to 24 Years | 0 (0.0%) | $0 |
| 25 to 44 Years | 56 (28.7%) | $107,121 |
| 45 to 64 Years | 112 (57.4%) | $188,472 |
| 65+ Years | 27 (13.9%) | $0 |
| Total | 195 (100.0%) | $156,750 |
Poverty in Vienna
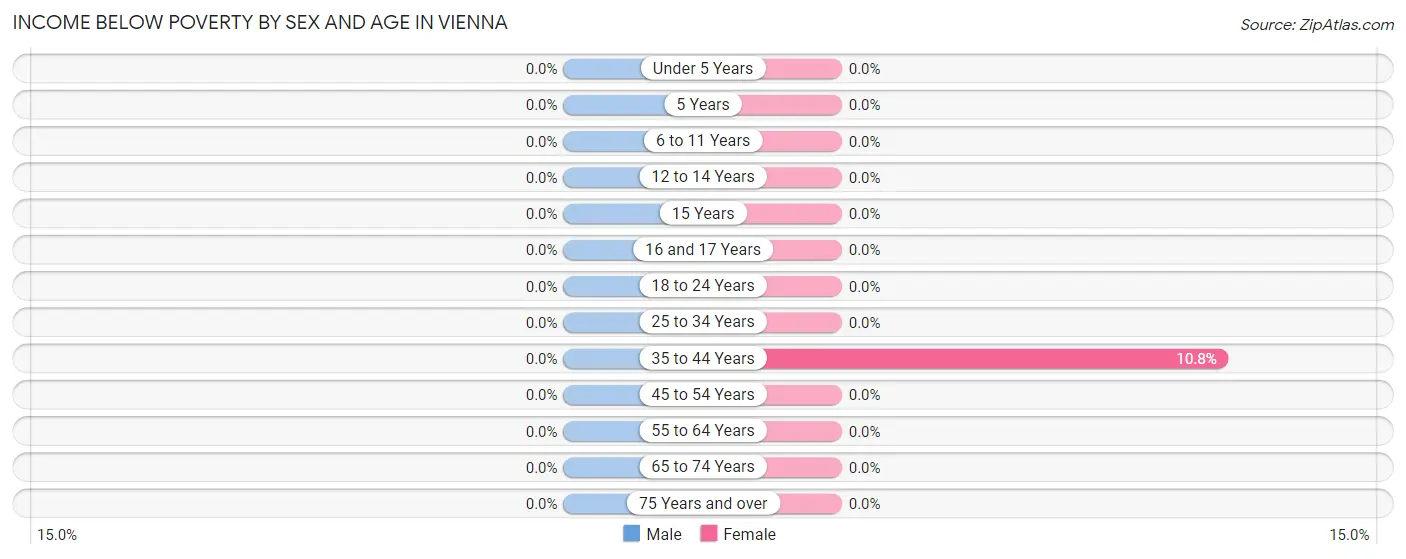
Income Below Poverty by Sex and Age in Vienna
| Age Bracket | Male | Female |
| Under 5 Years | 0 (0.0%) | 0 (0.0%) |
| 5 Years | 0 (0.0%) | 0 (0.0%) |
| 6 to 11 Years | 0 (0.0%) | 0 (0.0%) |
| 12 to 14 Years | 0 (0.0%) | 0 (0.0%) |
| 15 Years | 0 (0.0%) | 0 (0.0%) |
| 16 and 17 Years | 0 (0.0%) | 0 (0.0%) |
| 18 to 24 Years | 0 (0.0%) | 0 (0.0%) |
| 25 to 34 Years | 0 (0.0%) | 0 (0.0%) |
| 35 to 44 Years | 0 (0.0%) | 7 (10.8%) |
| 45 to 54 Years | 0 (0.0%) | 0 (0.0%) |
| 55 to 64 Years | 0 (0.0%) | 0 (0.0%) |
| 65 to 74 Years | 0 (0.0%) | 0 (0.0%) |
| 75 Years and over | 0 (0.0%) | 0 (0.0%) |
| Total | 0 (0.0%) | 7 (1.8%) |
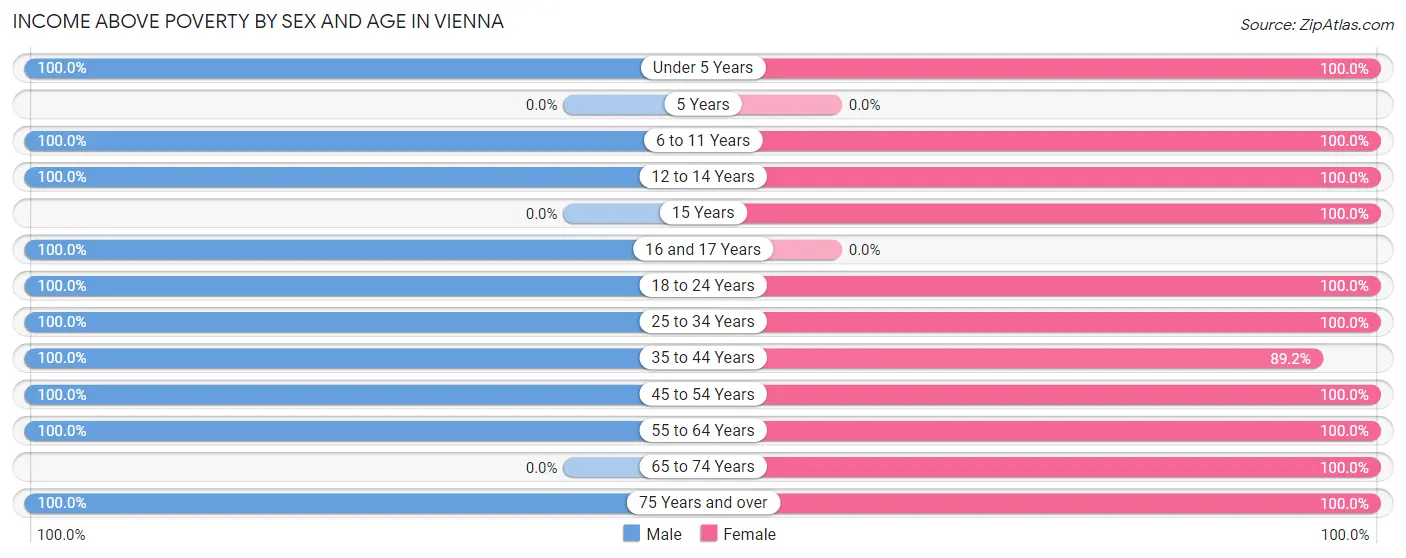
Income Above Poverty by Sex and Age in Vienna
According to the poverty statistics in Vienna, males aged under 5 years and females aged under 5 years are the age groups that are most secure financially, with 100.0% of males and 100.0% of females in these age groups living above the poverty line.
| Age Bracket | Male | Female |
| Under 5 Years | 11 (100.0%) | 11 (100.0%) |
| 5 Years | 0 (0.0%) | 0 (0.0%) |
| 6 to 11 Years | 40 (100.0%) | 29 (100.0%) |
| 12 to 14 Years | 18 (100.0%) | 17 (100.0%) |
| 15 Years | 0 (0.0%) | 8 (100.0%) |
| 16 and 17 Years | 50 (100.0%) | 0 (0.0%) |
| 18 to 24 Years | 23 (100.0%) | 93 (100.0%) |
| 25 to 34 Years | 22 (100.0%) | 12 (100.0%) |
| 35 to 44 Years | 63 (100.0%) | 58 (89.2%) |
| 45 to 54 Years | 72 (100.0%) | 63 (100.0%) |
| 55 to 64 Years | 52 (100.0%) | 44 (100.0%) |
| 65 to 74 Years | 0 (0.0%) | 27 (100.0%) |
| 75 Years and over | 27 (100.0%) | 19 (100.0%) |
| Total | 378 (100.0%) | 381 (98.2%) |
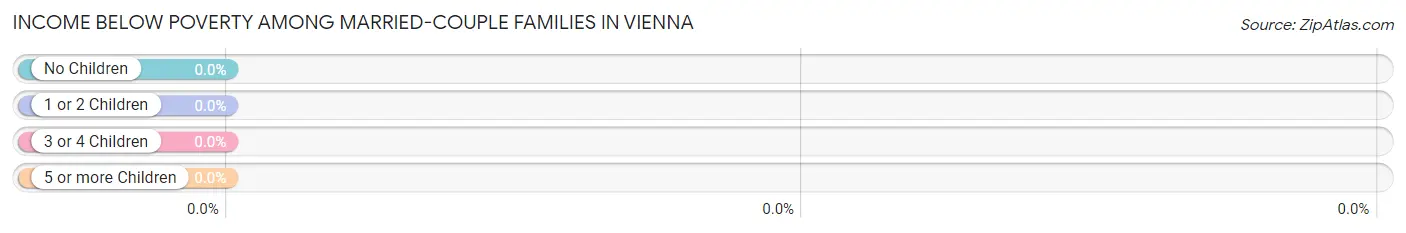
Income Below Poverty Among Married-Couple Families in Vienna
| Children | Above Poverty | Below Poverty |
| No Children | 58 (100.0%) | 0 (0.0%) |
| 1 or 2 Children | 83 (100.0%) | 0 (0.0%) |
| 3 or 4 Children | 0 (0.0%) | 0 (0.0%) |
| 5 or more Children | 0 (0.0%) | 0 (0.0%) |
| Total | 141 (100.0%) | 0 (0.0%) |
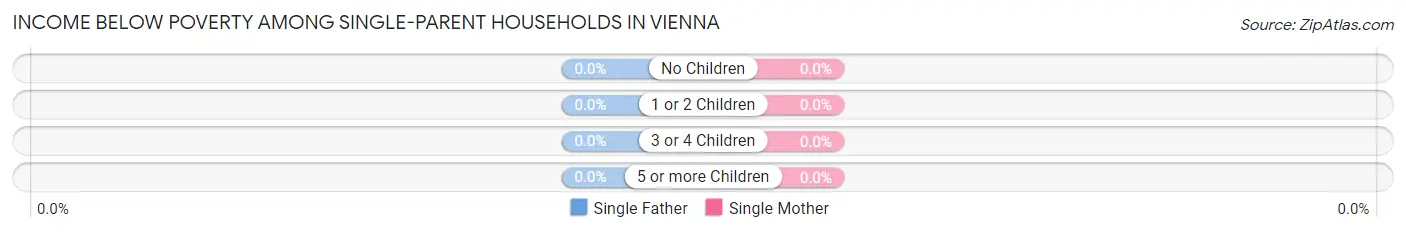
Income Below Poverty Among Single-Parent Households in Vienna
| Children | Single Father | Single Mother |
| No Children | 0 (0.0%) | 0 (0.0%) |
| 1 or 2 Children | 0 (0.0%) | 0 (0.0%) |
| 3 or 4 Children | 0 (0.0%) | 0 (0.0%) |
| 5 or more Children | 0 (0.0%) | 0 (0.0%) |
| Total | 0 (0.0%) | 0 (0.0%) |
Income Below Poverty Among Married-Couple vs Single-Parent Households in Vienna
| Children | Married-Couple Families | Single-Parent Households |
| No Children | 0 (0.0%) | 0 (0.0%) |
| 1 or 2 Children | 0 (0.0%) | 0 (0.0%) |
| 3 or 4 Children | 0 (0.0%) | 0 (0.0%) |
| 5 or more Children | 0 (0.0%) | 0 (0.0%) |
| Total | 0 (0.0%) | 0 (0.0%) |
Employment Characteristics in Vienna
Employment by Class of Employer in Vienna
Among the 488 employed individuals in Vienna, private company employees (393 | 80.5%), local government employees (52 | 10.7%), and self-employed (not incorporated) (32 | 6.6%) make up the most common classes of employment.
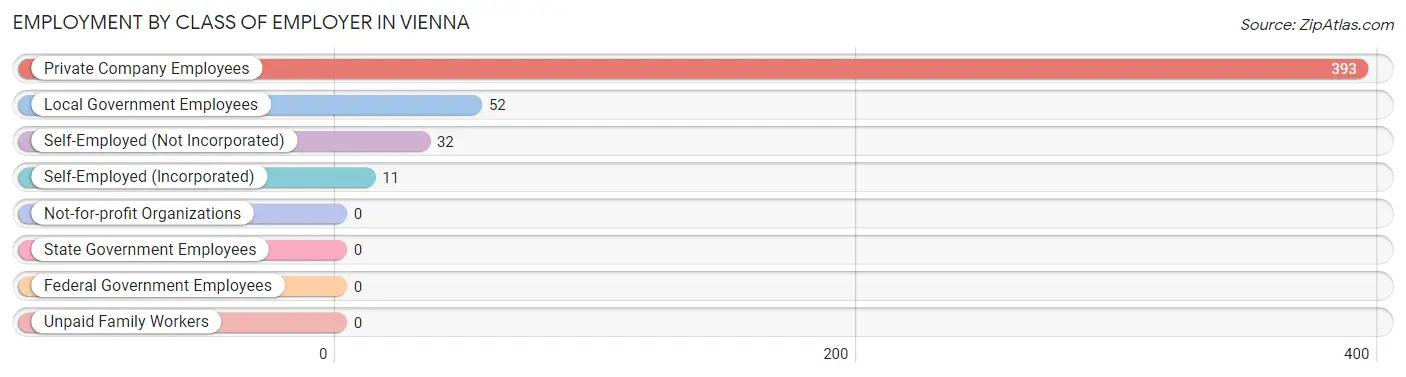
| Employer Class | # Employees | % Employees |
| Private Company Employees | 393 | 80.5% |
| Self-Employed (Incorporated) | 11 | 2.2% |
| Self-Employed (Not Incorporated) | 32 | 6.6% |
| Not-for-profit Organizations | 0 | 0.0% |
| Local Government Employees | 52 | 10.7% |
| State Government Employees | 0 | 0.0% |
| Federal Government Employees | 0 | 0.0% |
| Unpaid Family Workers | 0 | 0.0% |
| Total | 488 | 100.0% |
Employment Status by Age in Vienna
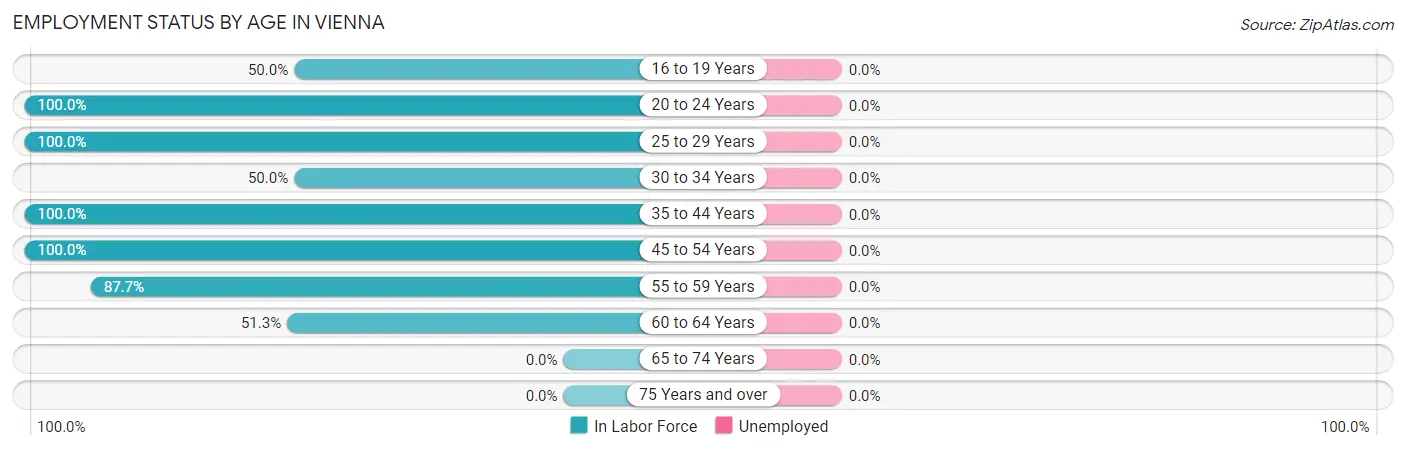
| Age Bracket | In Labor Force | Unemployed |
| 16 to 19 Years | 30 (50.0%) | 0 (0.0%) |
| 20 to 24 Years | 106 (100.0%) | 0 (0.0%) |
| 25 to 29 Years | 4 (100.0%) | 0 (0.0%) |
| 30 to 34 Years | 15 (50.0%) | 0 (0.0%) |
| 35 to 44 Years | 128 (100.0%) | 0 (0.0%) |
| 45 to 54 Years | 135 (100.0%) | 0 (0.0%) |
| 55 to 59 Years | 50 (87.7%) | 0 (0.0%) |
| 60 to 64 Years | 20 (51.3%) | 0 (0.0%) |
| 65 to 74 Years | 0 (0.0%) | 0 (0.0%) |
| 75 Years and over | 0 (0.0%) | 0 (0.0%) |
| Total | 488 (77.2%) | 0 (0.0%) |
Employment Status by Educational Attainment in Vienna
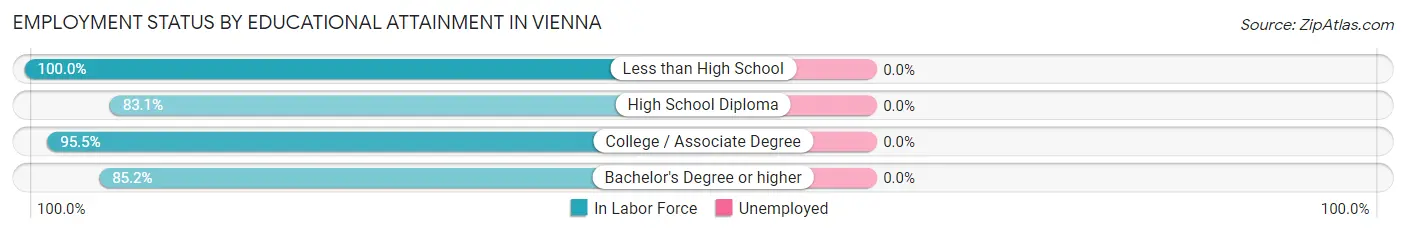
| Educational Attainment | In Labor Force | Unemployed |
| Less than High School | 20 (100.0%) | 0 (0.0%) |
| High School Diploma | 74 (83.1%) | 0 (0.0%) |
| College / Associate Degree | 149 (95.5%) | 0 (0.0%) |
| Bachelor's Degree or higher | 109 (85.2%) | 0 (0.0%) |
| Total | 352 (89.6%) | 0 (0.0%) |
Employment Occupations by Sex in Vienna
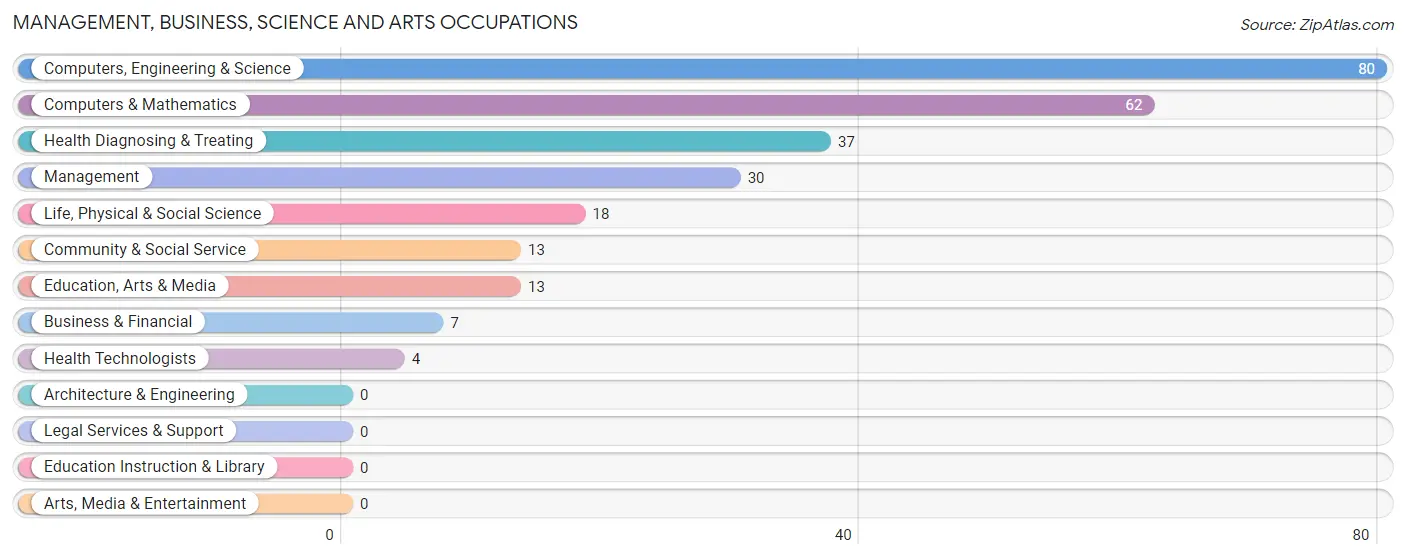
Management, Business, Science and Arts Occupations
The most common Management, Business, Science and Arts occupations in Vienna are Computers, Engineering & Science (80 | 16.4%), Computers & Mathematics (62 | 12.7%), Health Diagnosing & Treating (37 | 7.6%), Management (30 | 6.1%), and Life, Physical & Social Science (18 | 3.7%).
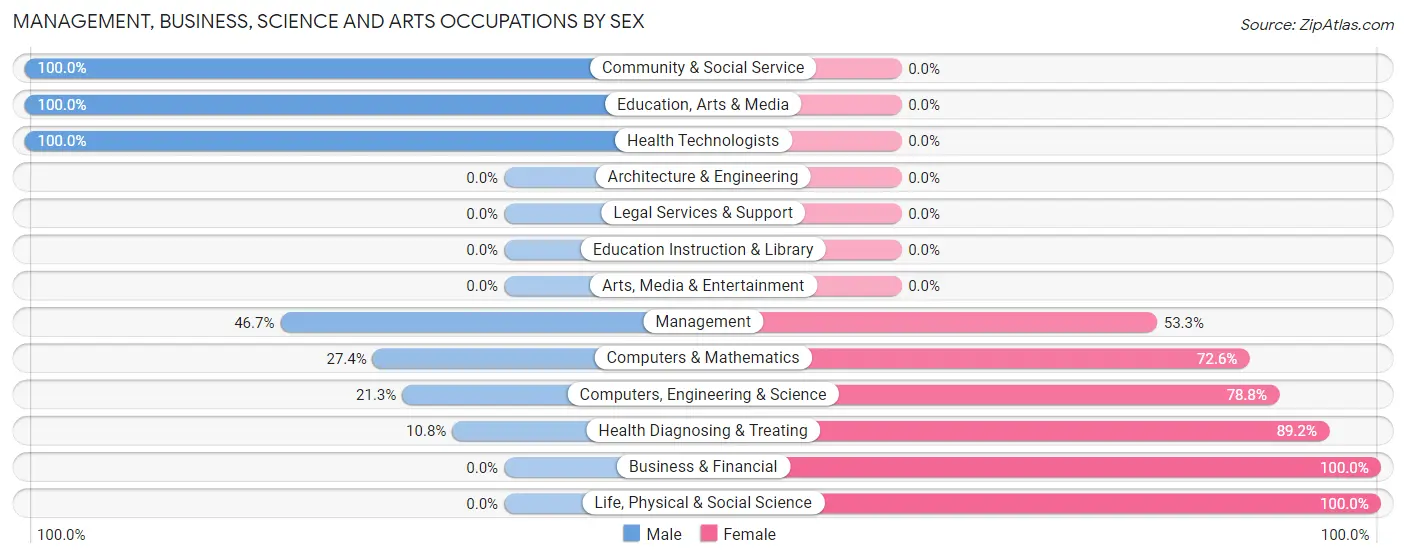
Management, Business, Science and Arts Occupations by Sex
Within the Management, Business, Science and Arts occupations in Vienna, the most male-oriented occupations are Community & Social Service (100.0%), Education, Arts & Media (100.0%), and Health Technologists (100.0%), while the most female-oriented occupations are Business & Financial (100.0%), Life, Physical & Social Science (100.0%), and Health Diagnosing & Treating (89.2%).
| Occupation | Male | Female |
| Management | 14 (46.7%) | 16 (53.3%) |
| Business & Financial | 0 (0.0%) | 7 (100.0%) |
| Computers, Engineering & Science | 17 (21.2%) | 63 (78.7%) |
| Computers & Mathematics | 17 (27.4%) | 45 (72.6%) |
| Architecture & Engineering | 0 (0.0%) | 0 (0.0%) |
| Life, Physical & Social Science | 0 (0.0%) | 18 (100.0%) |
| Community & Social Service | 13 (100.0%) | 0 (0.0%) |
| Education, Arts & Media | 13 (100.0%) | 0 (0.0%) |
| Legal Services & Support | 0 (0.0%) | 0 (0.0%) |
| Education Instruction & Library | 0 (0.0%) | 0 (0.0%) |
| Arts, Media & Entertainment | 0 (0.0%) | 0 (0.0%) |
| Health Diagnosing & Treating | 4 (10.8%) | 33 (89.2%) |
| Health Technologists | 4 (100.0%) | 0 (0.0%) |
| Total (Category) | 48 (28.7%) | 119 (71.3%) |
| Total (Overall) | 249 (51.0%) | 239 (49.0%) |
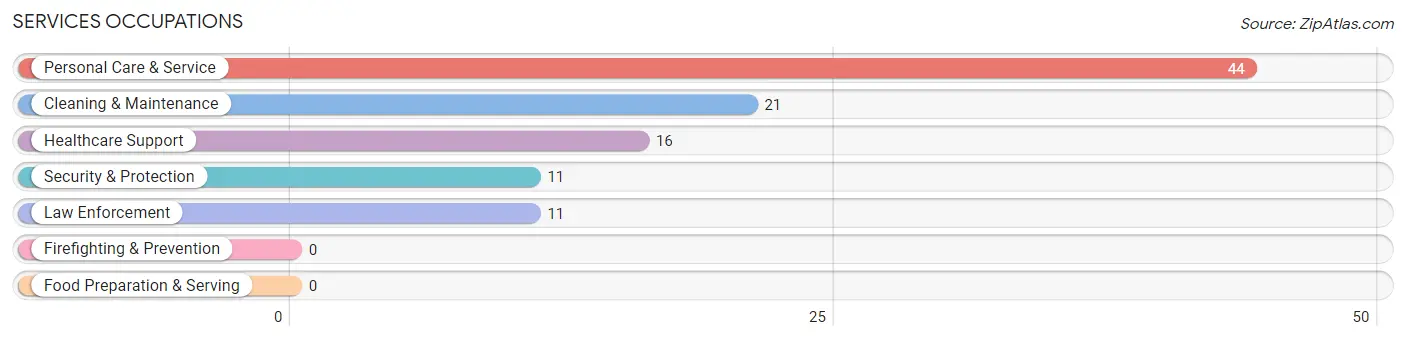
Services Occupations
The most common Services occupations in Vienna are Personal Care & Service (44 | 9.0%), Cleaning & Maintenance (21 | 4.3%), Healthcare Support (16 | 3.3%), Security & Protection (11 | 2.2%), and Law Enforcement (11 | 2.2%).
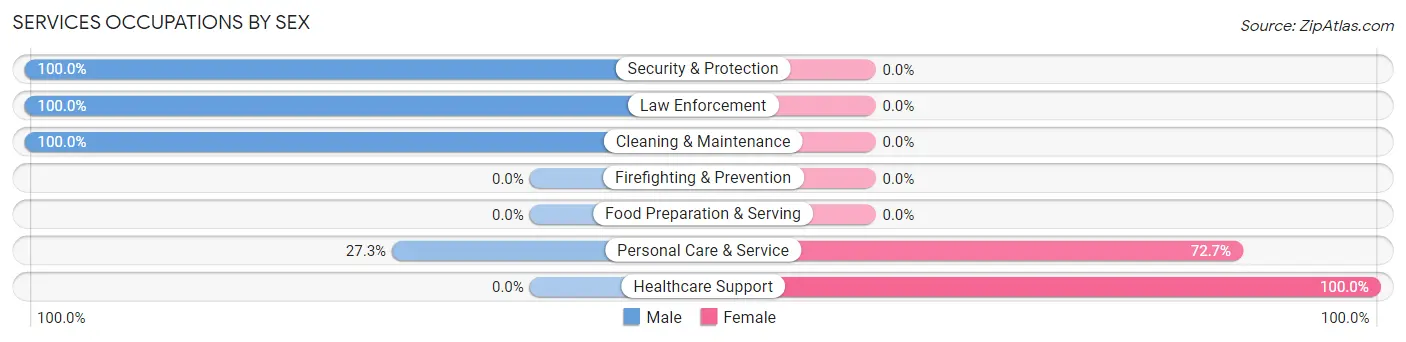
Services Occupations by Sex
Within the Services occupations in Vienna, the most male-oriented occupations are Security & Protection (100.0%), Law Enforcement (100.0%), and Cleaning & Maintenance (100.0%), while the most female-oriented occupations are Healthcare Support (100.0%), and Personal Care & Service (72.7%).
| Occupation | Male | Female |
| Healthcare Support | 0 (0.0%) | 16 (100.0%) |
| Security & Protection | 11 (100.0%) | 0 (0.0%) |
| Firefighting & Prevention | 0 (0.0%) | 0 (0.0%) |
| Law Enforcement | 11 (100.0%) | 0 (0.0%) |
| Food Preparation & Serving | 0 (0.0%) | 0 (0.0%) |
| Cleaning & Maintenance | 21 (100.0%) | 0 (0.0%) |
| Personal Care & Service | 12 (27.3%) | 32 (72.7%) |
| Total (Category) | 44 (47.8%) | 48 (52.2%) |
| Total (Overall) | 249 (51.0%) | 239 (49.0%) |
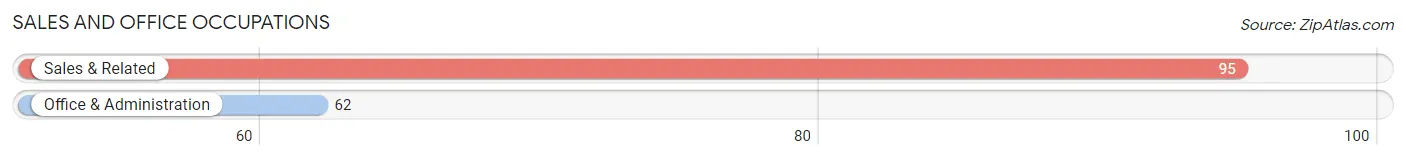
Sales and Office Occupations
The most common Sales and Office occupations in Vienna are Sales & Related (95 | 19.5%), and Office & Administration (62 | 12.7%).
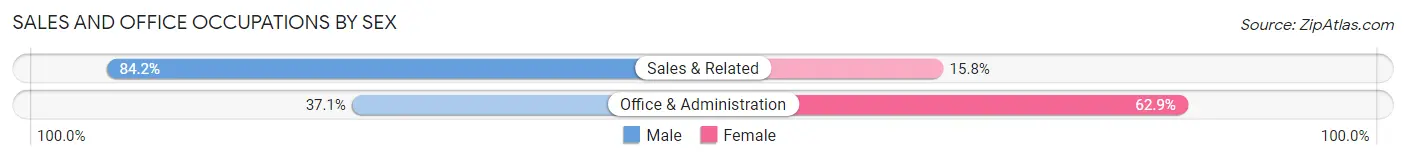
Sales and Office Occupations by Sex
| Occupation | Male | Female |
| Sales & Related | 80 (84.2%) | 15 (15.8%) |
| Office & Administration | 23 (37.1%) | 39 (62.9%) |
| Total (Category) | 103 (65.6%) | 54 (34.4%) |
| Total (Overall) | 249 (51.0%) | 239 (49.0%) |
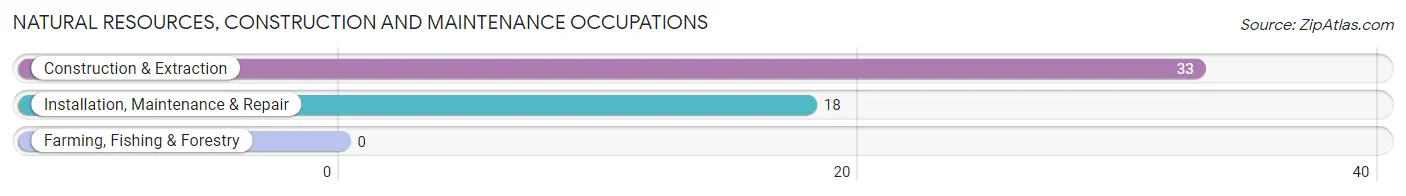
Natural Resources, Construction and Maintenance Occupations
The most common Natural Resources, Construction and Maintenance occupations in Vienna are Construction & Extraction (33 | 6.8%), and Installation, Maintenance & Repair (18 | 3.7%).
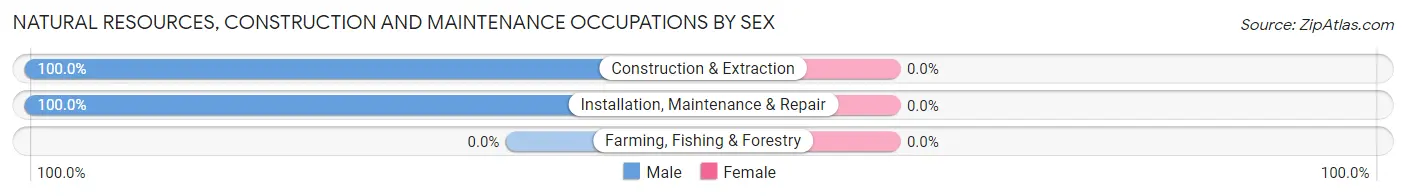
Natural Resources, Construction and Maintenance Occupations by Sex
| Occupation | Male | Female |
| Farming, Fishing & Forestry | 0 (0.0%) | 0 (0.0%) |
| Construction & Extraction | 33 (100.0%) | 0 (0.0%) |
| Installation, Maintenance & Repair | 18 (100.0%) | 0 (0.0%) |
| Total (Category) | 51 (100.0%) | 0 (0.0%) |
| Total (Overall) | 249 (51.0%) | 239 (49.0%) |
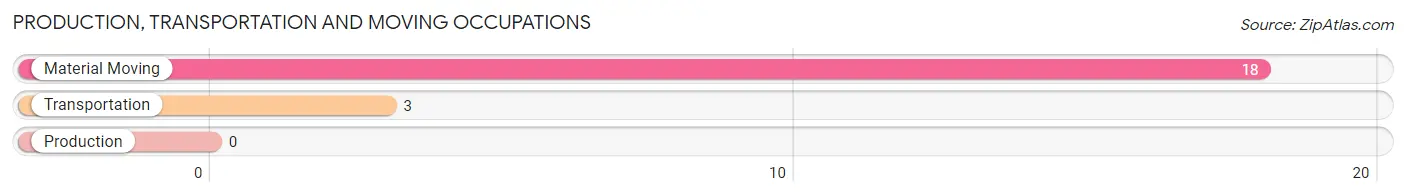
Production, Transportation and Moving Occupations
The most common Production, Transportation and Moving occupations in Vienna are Material Moving (18 | 3.7%), and Transportation (3 | 0.6%).
Production, Transportation and Moving Occupations by Sex
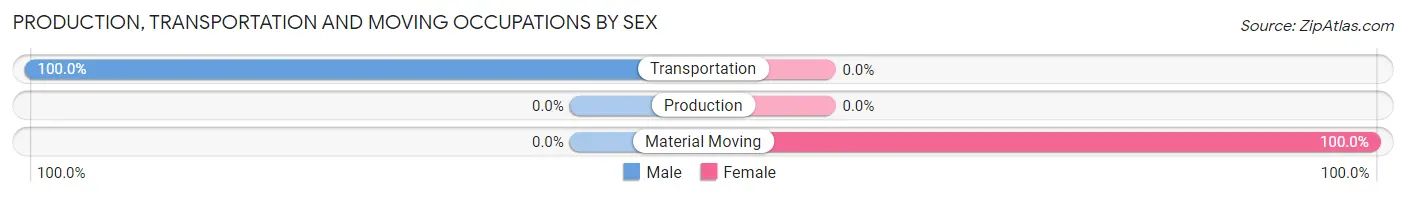
| Occupation | Male | Female |
| Production | 0 (0.0%) | 0 (0.0%) |
| Transportation | 3 (100.0%) | 0 (0.0%) |
| Material Moving | 0 (0.0%) | 18 (100.0%) |
| Total (Category) | 3 (14.3%) | 18 (85.7%) |
| Total (Overall) | 249 (51.0%) | 239 (49.0%) |
Employment Industries by Sex in Vienna
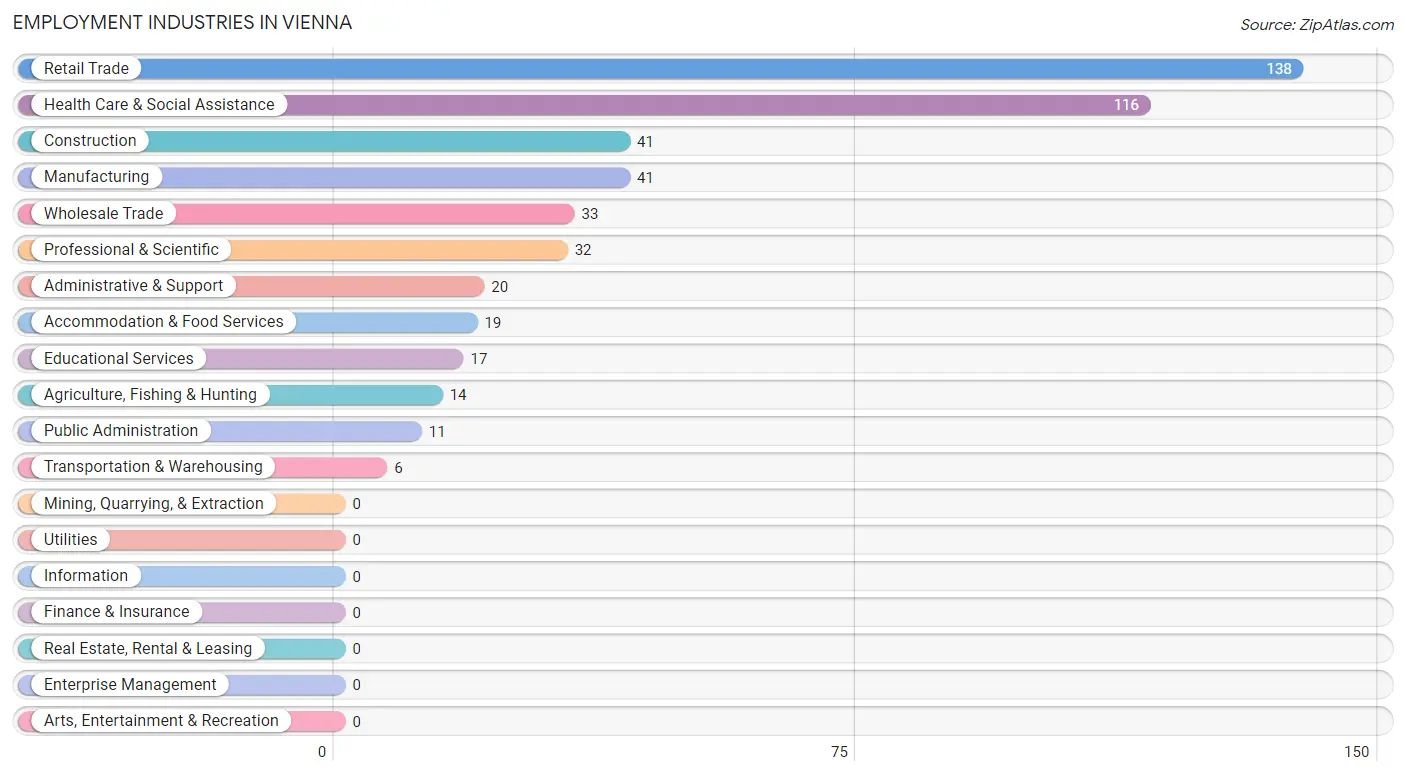
Employment Industries in Vienna
The major employment industries in Vienna include Retail Trade (138 | 28.3%), Health Care & Social Assistance (116 | 23.8%), Construction (41 | 8.4%), Manufacturing (41 | 8.4%), and Wholesale Trade (33 | 6.8%).
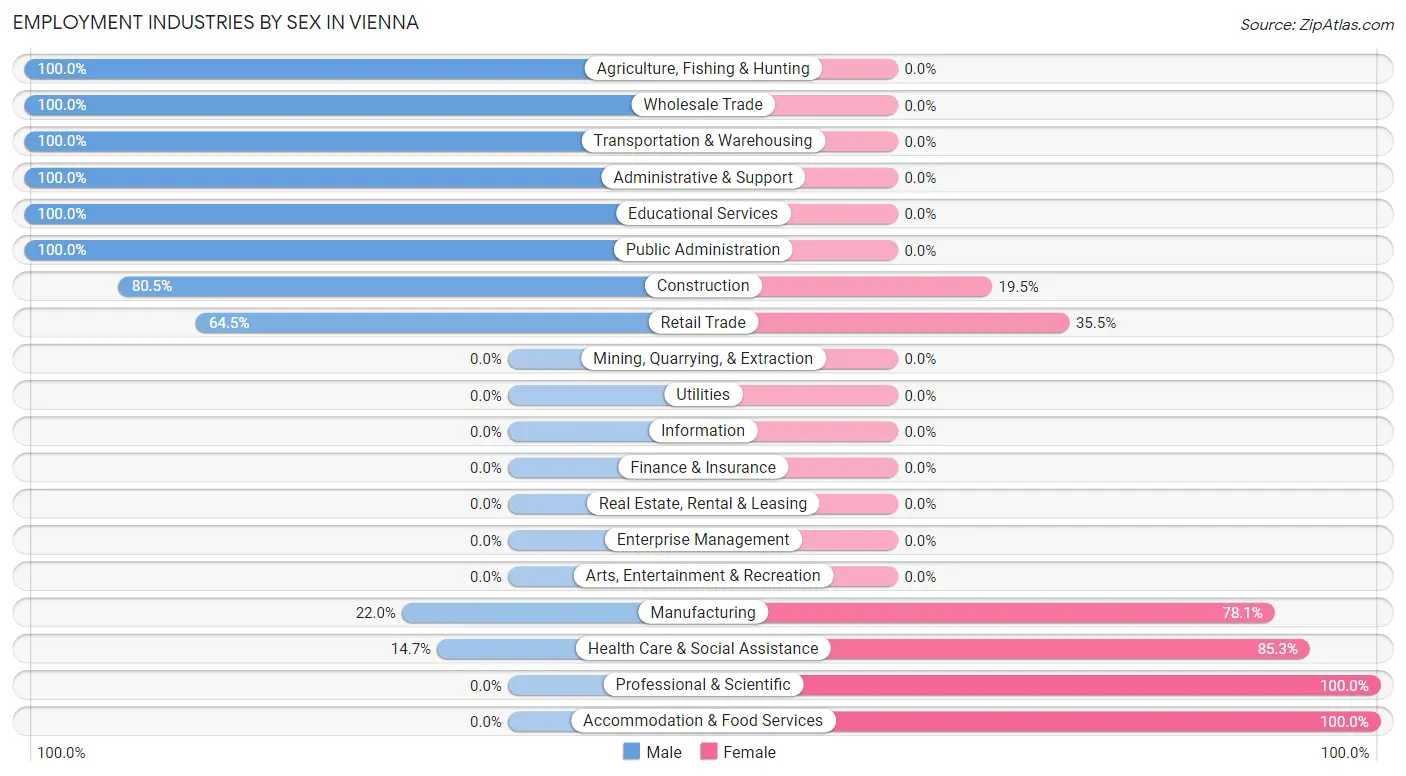
Employment Industries by Sex in Vienna
The Vienna industries that see more men than women are Agriculture, Fishing & Hunting (100.0%), Wholesale Trade (100.0%), and Transportation & Warehousing (100.0%), whereas the industries that tend to have a higher number of women are Professional & Scientific (100.0%), Accommodation & Food Services (100.0%), and Health Care & Social Assistance (85.3%).
| Industry | Male | Female |
| Agriculture, Fishing & Hunting | 14 (100.0%) | 0 (0.0%) |
| Mining, Quarrying, & Extraction | 0 (0.0%) | 0 (0.0%) |
| Construction | 33 (80.5%) | 8 (19.5%) |
| Manufacturing | 9 (22.0%) | 32 (78.0%) |
| Wholesale Trade | 33 (100.0%) | 0 (0.0%) |
| Retail Trade | 89 (64.5%) | 49 (35.5%) |
| Transportation & Warehousing | 6 (100.0%) | 0 (0.0%) |
| Utilities | 0 (0.0%) | 0 (0.0%) |
| Information | 0 (0.0%) | 0 (0.0%) |
| Finance & Insurance | 0 (0.0%) | 0 (0.0%) |
| Real Estate, Rental & Leasing | 0 (0.0%) | 0 (0.0%) |
| Professional & Scientific | 0 (0.0%) | 32 (100.0%) |
| Enterprise Management | 0 (0.0%) | 0 (0.0%) |
| Administrative & Support | 20 (100.0%) | 0 (0.0%) |
| Educational Services | 17 (100.0%) | 0 (0.0%) |
| Health Care & Social Assistance | 17 (14.7%) | 99 (85.3%) |
| Arts, Entertainment & Recreation | 0 (0.0%) | 0 (0.0%) |
| Accommodation & Food Services | 0 (0.0%) | 19 (100.0%) |
| Public Administration | 11 (100.0%) | 0 (0.0%) |
| Total | 249 (51.0%) | 239 (49.0%) |
Education in Vienna
School Enrollment in Vienna
The most common levels of schooling among the 183 students in Vienna are elementary school (69 | 37.7%), high school (68 | 37.2%), and middle school (35 | 19.1%).
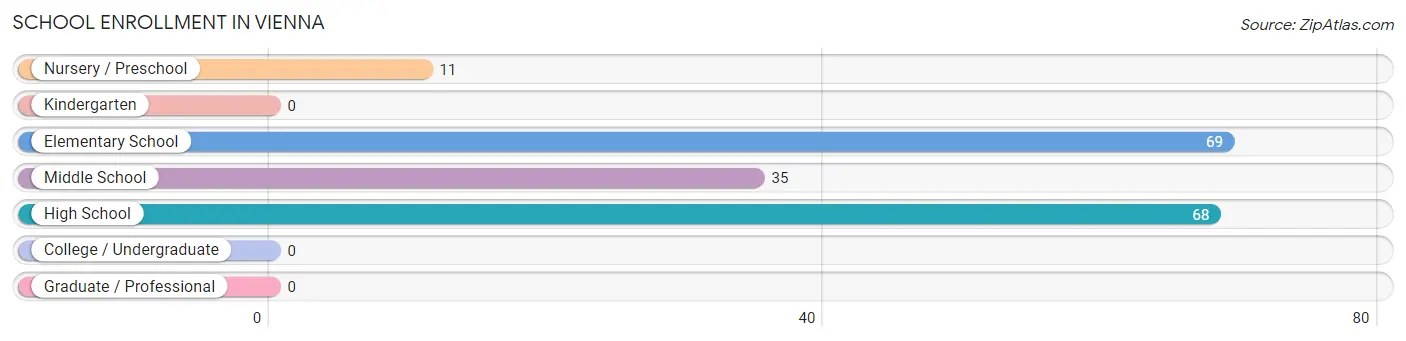
| School Level | # Students | % Students |
| Nursery / Preschool | 11 | 6.0% |
| Kindergarten | 0 | 0.0% |
| Elementary School | 69 | 37.7% |
| Middle School | 35 | 19.1% |
| High School | 68 | 37.2% |
| College / Undergraduate | 0 | 0.0% |
| Graduate / Professional | 0 | 0.0% |
| Total | 183 | 100.0% |
School Enrollment by Age by Funding Source in Vienna
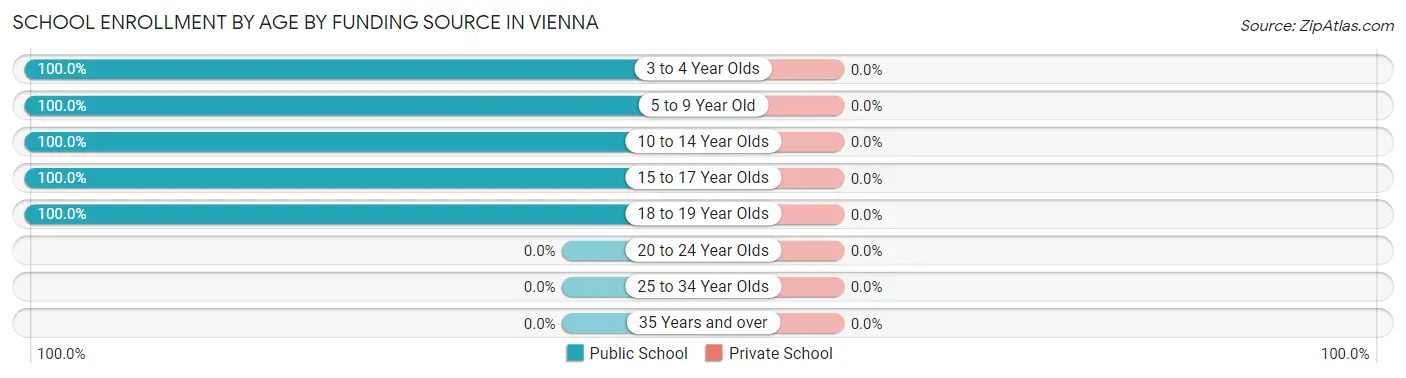
| Age Bracket | Public School | Private School |
| 3 to 4 Year Olds | 11 (100.0%) | 0 (0.0%) |
| 5 to 9 Year Old | 69 (100.0%) | 0 (0.0%) |
| 10 to 14 Year Olds | 35 (100.0%) | 0 (0.0%) |
| 15 to 17 Year Olds | 58 (100.0%) | 0 (0.0%) |
| 18 to 19 Year Olds | 10 (100.0%) | 0 (0.0%) |
| 20 to 24 Year Olds | 0 (0.0%) | 0 (0.0%) |
| 25 to 34 Year Olds | 0 (0.0%) | 0 (0.0%) |
| 35 Years and over | 0 (0.0%) | 0 (0.0%) |
| Total | 183 (100.0%) | 0 (0.0%) |
Educational Attainment by Field of Study in Vienna
Social sciences (29 | 20.3%), visual & performing arts (28 | 19.6%), business (22 | 15.4%), computers & mathematics (19 | 13.3%), and psychology (18 | 12.6%) are the most common fields of study among 143 individuals in Vienna who have obtained a bachelor's degree or higher.
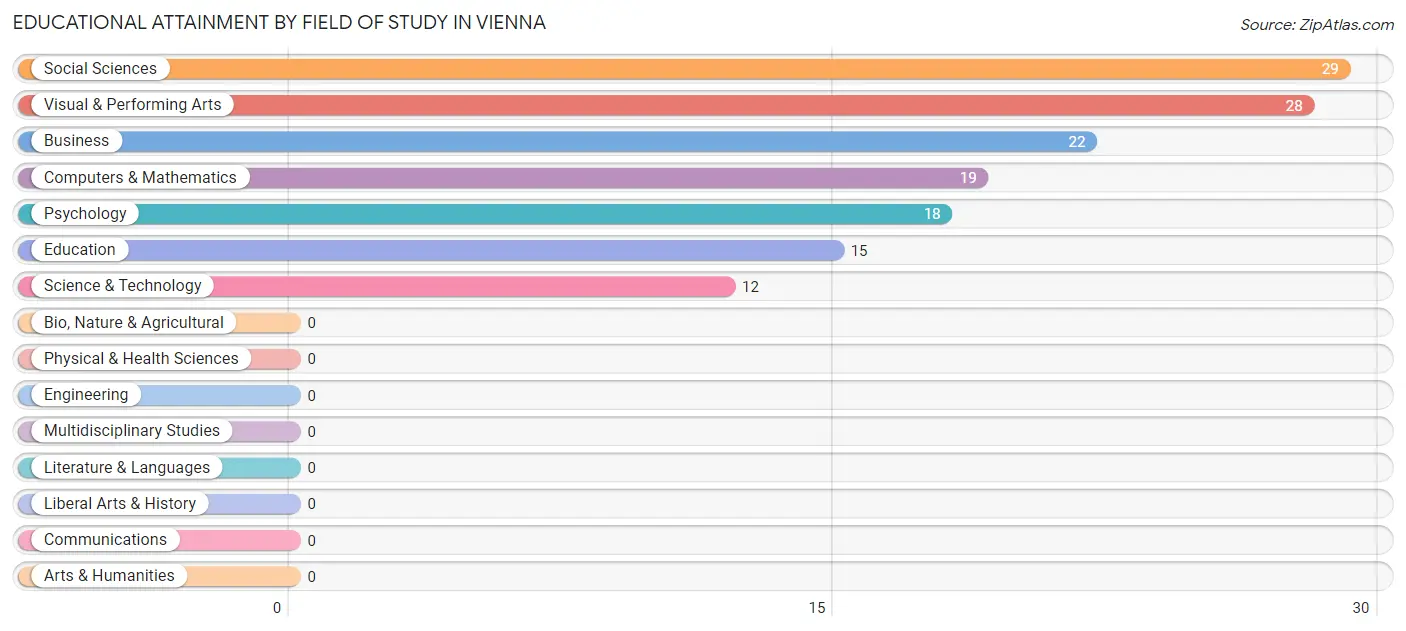
| Field of Study | # Graduates | % Graduates |
| Computers & Mathematics | 19 | 13.3% |
| Bio, Nature & Agricultural | 0 | 0.0% |
| Physical & Health Sciences | 0 | 0.0% |
| Psychology | 18 | 12.6% |
| Social Sciences | 29 | 20.3% |
| Engineering | 0 | 0.0% |
| Multidisciplinary Studies | 0 | 0.0% |
| Science & Technology | 12 | 8.4% |
| Business | 22 | 15.4% |
| Education | 15 | 10.5% |
| Literature & Languages | 0 | 0.0% |
| Liberal Arts & History | 0 | 0.0% |
| Visual & Performing Arts | 28 | 19.6% |
| Communications | 0 | 0.0% |
| Arts & Humanities | 0 | 0.0% |
| Total | 143 | 100.0% |
Transportation & Commute in Vienna
Vehicle Availability by Sex in Vienna
The most prevalent vehicle ownership categories in Vienna are males with 2 vehicles (116, accounting for 46.6%) and females with 2 vehicles (125, making up 48.5%).
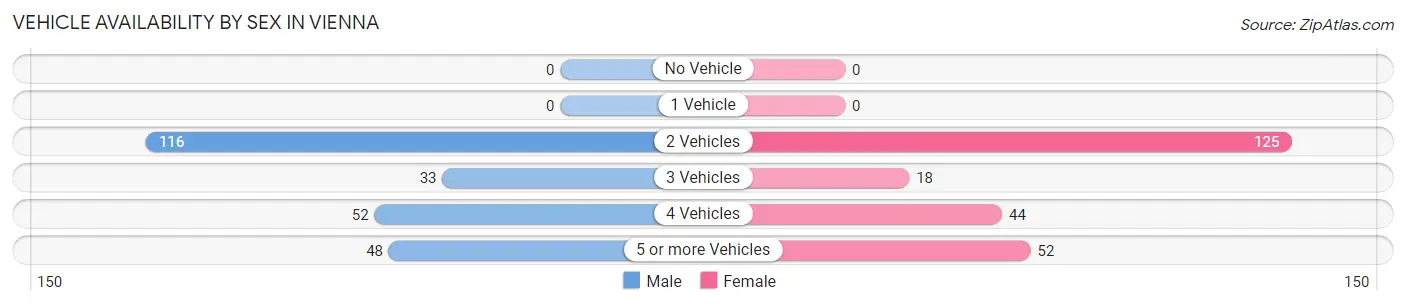
| Vehicles Available | Male | Female |
| No Vehicle | 0 (0.0%) | 0 (0.0%) |
| 1 Vehicle | 0 (0.0%) | 0 (0.0%) |
| 2 Vehicles | 116 (46.6%) | 125 (52.3%) |
| 3 Vehicles | 33 (13.3%) | 18 (7.5%) |
| 4 Vehicles | 52 (20.9%) | 44 (18.4%) |
| 5 or more Vehicles | 48 (19.3%) | 52 (21.8%) |
| Total | 249 (100.0%) | 239 (100.0%) |
Commute Time in Vienna
The most frequently occuring commute durations in Vienna are 60 to 89 minutes (103 commuters, 22.0%), 15 to 19 minutes (71 commuters, 15.2%), and 30 to 34 minutes (53 commuters, 11.3%).
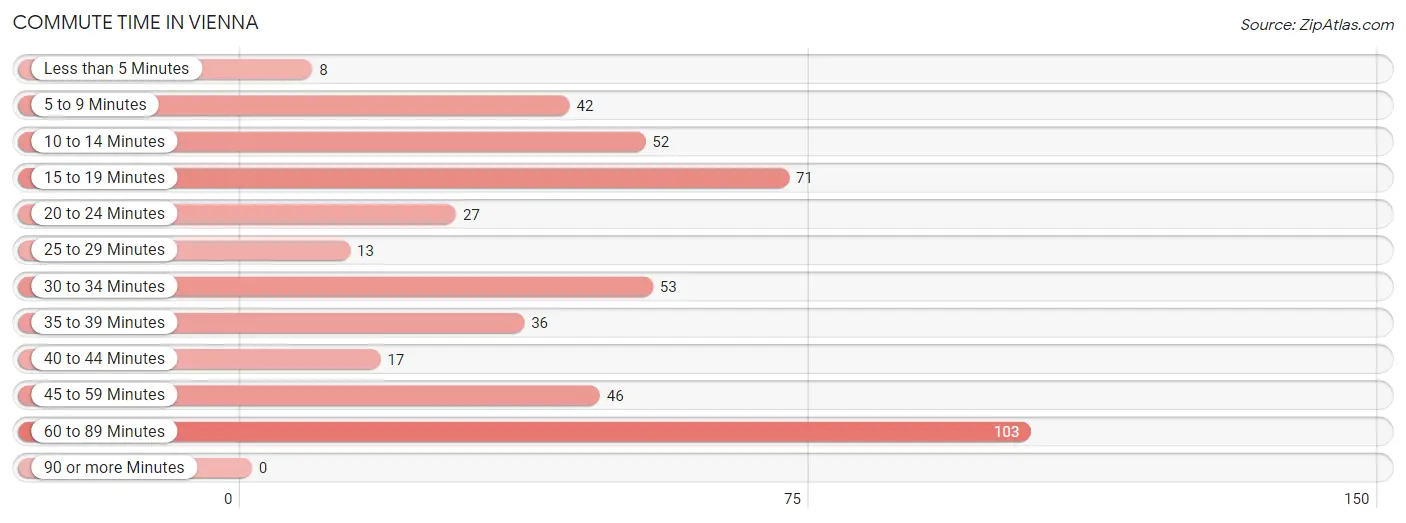
| Commute Time | # Commuters | % Commuters |
| Less than 5 Minutes | 8 | 1.7% |
| 5 to 9 Minutes | 42 | 9.0% |
| 10 to 14 Minutes | 52 | 11.1% |
| 15 to 19 Minutes | 71 | 15.2% |
| 20 to 24 Minutes | 27 | 5.8% |
| 25 to 29 Minutes | 13 | 2.8% |
| 30 to 34 Minutes | 53 | 11.3% |
| 35 to 39 Minutes | 36 | 7.7% |
| 40 to 44 Minutes | 17 | 3.6% |
| 45 to 59 Minutes | 46 | 9.8% |
| 60 to 89 Minutes | 103 | 22.0% |
| 90 or more Minutes | 0 | 0.0% |
Commute Time by Sex in Vienna
The most common commute times in Vienna are 15 to 19 minutes (49 commuters, 21.4%) for males and 60 to 89 minutes (61 commuters, 25.5%) for females.
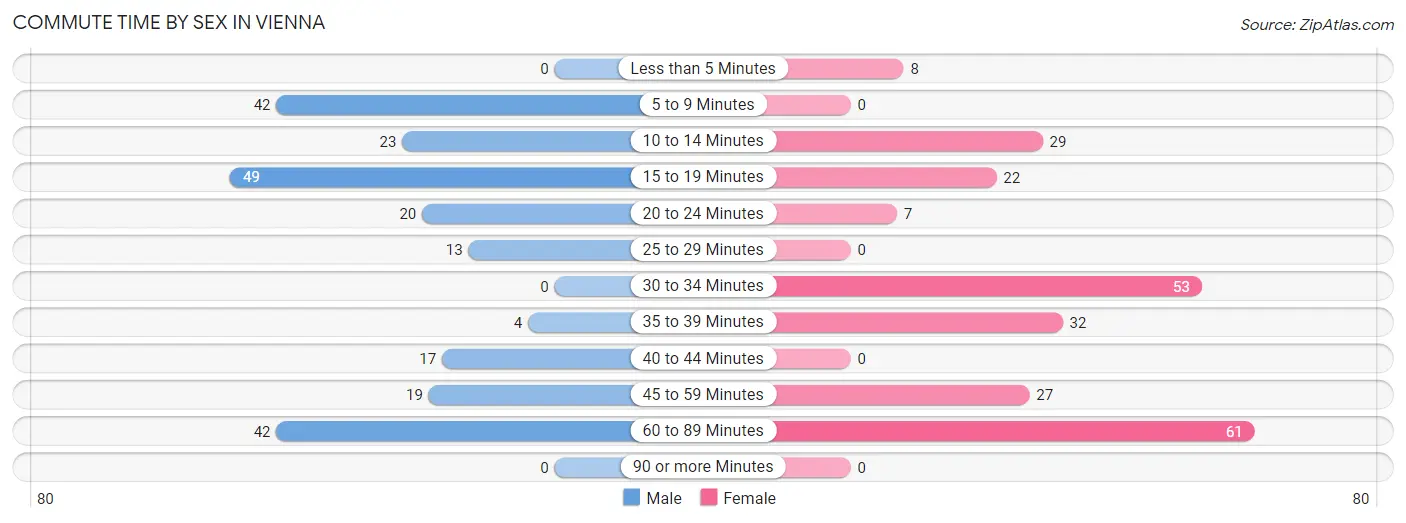
| Commute Time | Male | Female |
| Less than 5 Minutes | 0 (0.0%) | 8 (3.4%) |
| 5 to 9 Minutes | 42 (18.3%) | 0 (0.0%) |
| 10 to 14 Minutes | 23 (10.0%) | 29 (12.1%) |
| 15 to 19 Minutes | 49 (21.4%) | 22 (9.2%) |
| 20 to 24 Minutes | 20 (8.7%) | 7 (2.9%) |
| 25 to 29 Minutes | 13 (5.7%) | 0 (0.0%) |
| 30 to 34 Minutes | 0 (0.0%) | 53 (22.2%) |
| 35 to 39 Minutes | 4 (1.8%) | 32 (13.4%) |
| 40 to 44 Minutes | 17 (7.4%) | 0 (0.0%) |
| 45 to 59 Minutes | 19 (8.3%) | 27 (11.3%) |
| 60 to 89 Minutes | 42 (18.3%) | 61 (25.5%) |
| 90 or more Minutes | 0 (0.0%) | 0 (0.0%) |
Time of Departure to Work by Sex in Vienna
The most frequent times of departure to work in Vienna are 6:00 AM to 6:29 AM (49, 21.4%) for males and 8:30 AM to 8:59 AM (96, 40.2%) for females.
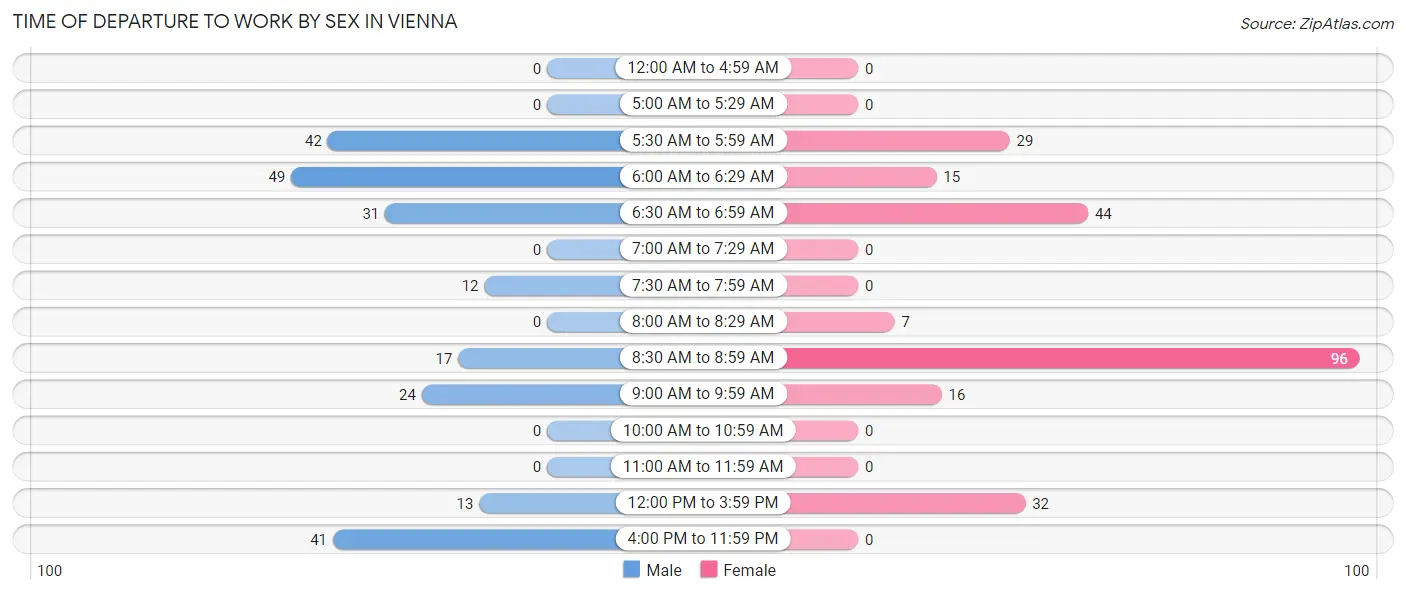
| Time of Departure | Male | Female |
| 12:00 AM to 4:59 AM | 0 (0.0%) | 0 (0.0%) |
| 5:00 AM to 5:29 AM | 0 (0.0%) | 0 (0.0%) |
| 5:30 AM to 5:59 AM | 42 (18.3%) | 29 (12.1%) |
| 6:00 AM to 6:29 AM | 49 (21.4%) | 15 (6.3%) |
| 6:30 AM to 6:59 AM | 31 (13.5%) | 44 (18.4%) |
| 7:00 AM to 7:29 AM | 0 (0.0%) | 0 (0.0%) |
| 7:30 AM to 7:59 AM | 12 (5.2%) | 0 (0.0%) |
| 8:00 AM to 8:29 AM | 0 (0.0%) | 7 (2.9%) |
| 8:30 AM to 8:59 AM | 17 (7.4%) | 96 (40.2%) |
| 9:00 AM to 9:59 AM | 24 (10.5%) | 16 (6.7%) |
| 10:00 AM to 10:59 AM | 0 (0.0%) | 0 (0.0%) |
| 11:00 AM to 11:59 AM | 0 (0.0%) | 0 (0.0%) |
| 12:00 PM to 3:59 PM | 13 (5.7%) | 32 (13.4%) |
| 4:00 PM to 11:59 PM | 41 (17.9%) | 0 (0.0%) |
| Total | 229 (100.0%) | 239 (100.0%) |
Housing Occupancy in Vienna
Occupancy by Ownership in Vienna
Of the total 195 dwellings in Vienna, owner-occupied units account for 181 (92.8%), while renter-occupied units make up 14 (7.2%).
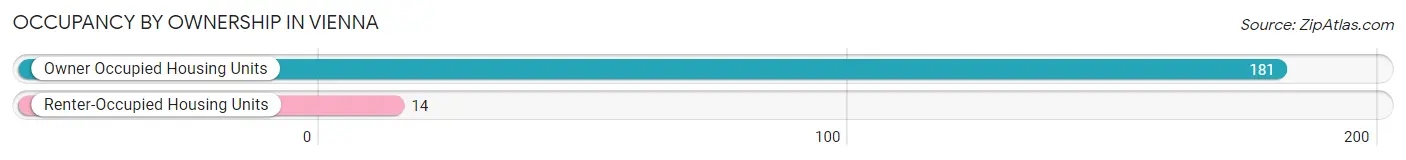
| Occupancy | # Housing Units | % Housing Units |
| Owner Occupied Housing Units | 181 | 92.8% |
| Renter-Occupied Housing Units | 14 | 7.2% |
| Total Occupied Housing Units | 195 | 100.0% |
Occupancy by Household Size in Vienna
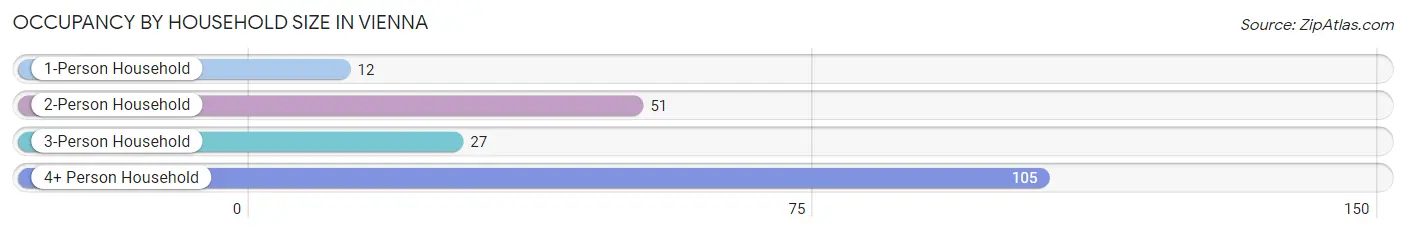
| Household Size | # Housing Units | % Housing Units |
| 1-Person Household | 12 | 6.1% |
| 2-Person Household | 51 | 26.2% |
| 3-Person Household | 27 | 13.9% |
| 4+ Person Household | 105 | 53.8% |
| Total Housing Units | 195 | 100.0% |
Occupancy by Ownership by Household Size in Vienna
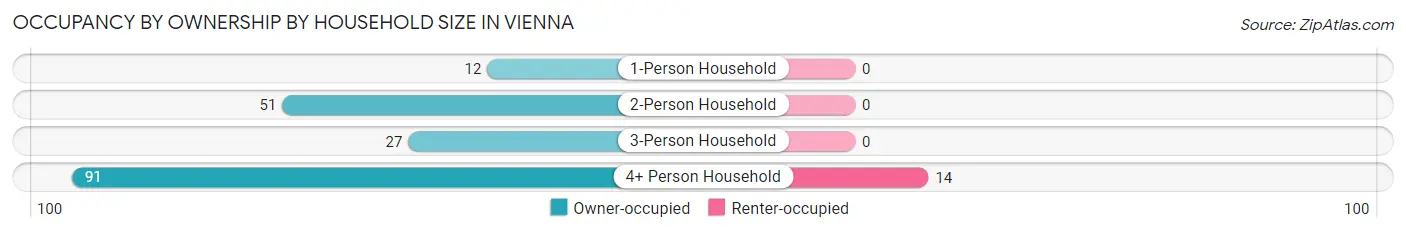
| Household Size | Owner-occupied | Renter-occupied |
| 1-Person Household | 12 (100.0%) | 0 (0.0%) |
| 2-Person Household | 51 (100.0%) | 0 (0.0%) |
| 3-Person Household | 27 (100.0%) | 0 (0.0%) |
| 4+ Person Household | 91 (86.7%) | 14 (13.3%) |
| Total Housing Units | 181 (92.8%) | 14 (7.2%) |
Occupancy by Educational Attainment in Vienna
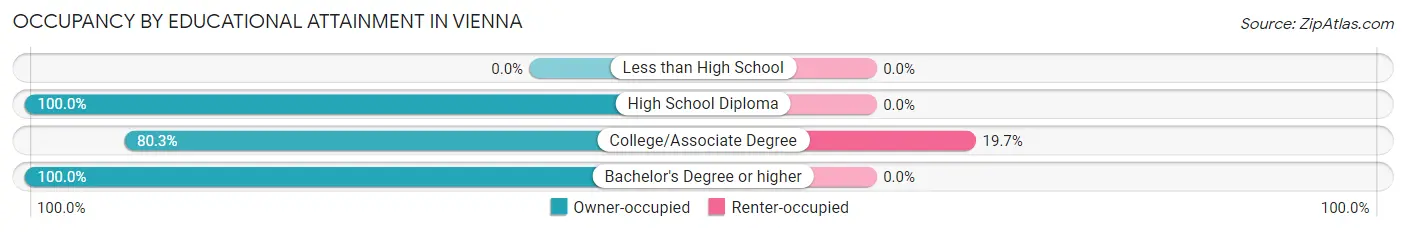
| Household Size | Owner-occupied | Renter-occupied |
| Less than High School | 0 (0.0%) | 0 (0.0%) |
| High School Diploma | 42 (100.0%) | 0 (0.0%) |
| College/Associate Degree | 57 (80.3%) | 14 (19.7%) |
| Bachelor's Degree or higher | 82 (100.0%) | 0 (0.0%) |
Occupancy by Age of Householder in Vienna
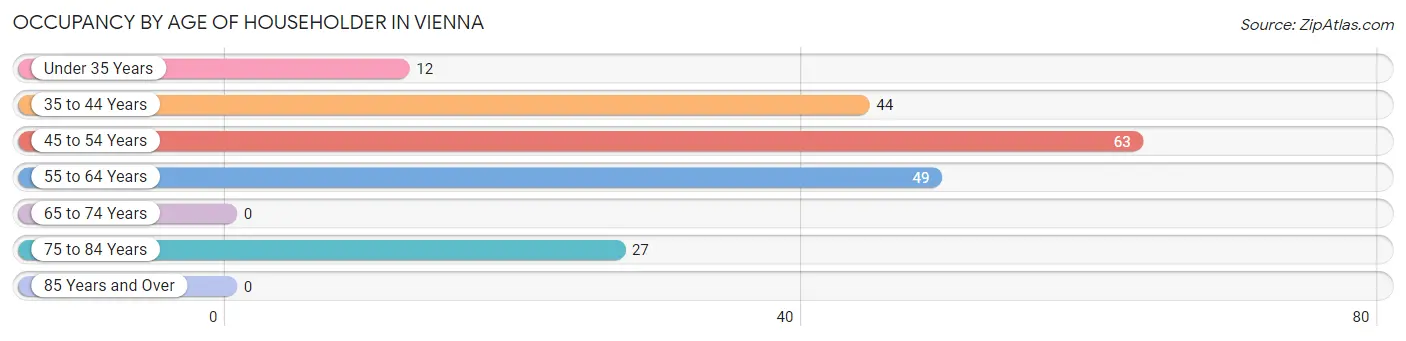
| Age Bracket | # Households | % Households |
| Under 35 Years | 12 | 6.1% |
| 35 to 44 Years | 44 | 22.6% |
| 45 to 54 Years | 63 | 32.3% |
| 55 to 64 Years | 49 | 25.1% |
| 65 to 74 Years | 0 | 0.0% |
| 75 to 84 Years | 27 | 13.9% |
| 85 Years and Over | 0 | 0.0% |
| Total | 195 | 100.0% |
Housing Finances in Vienna
Median Income by Occupancy in Vienna
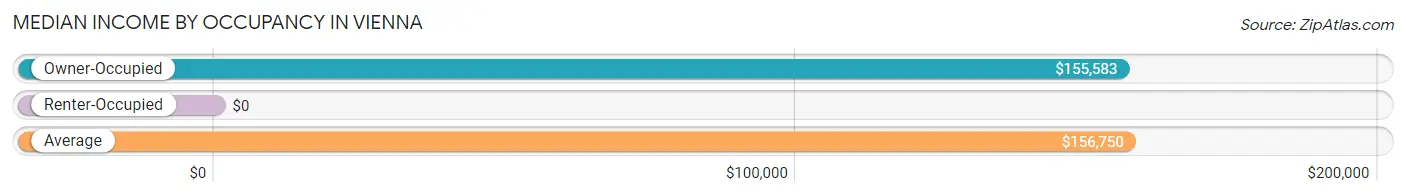
| Occupancy Type | # Households | Median Income |
| Owner-Occupied | 181 (92.8%) | $155,583 |
| Renter-Occupied | 14 (7.2%) | $0 |
| Average | 195 (100.0%) | $156,750 |
Occupancy by Householder Income Bracket in Vienna
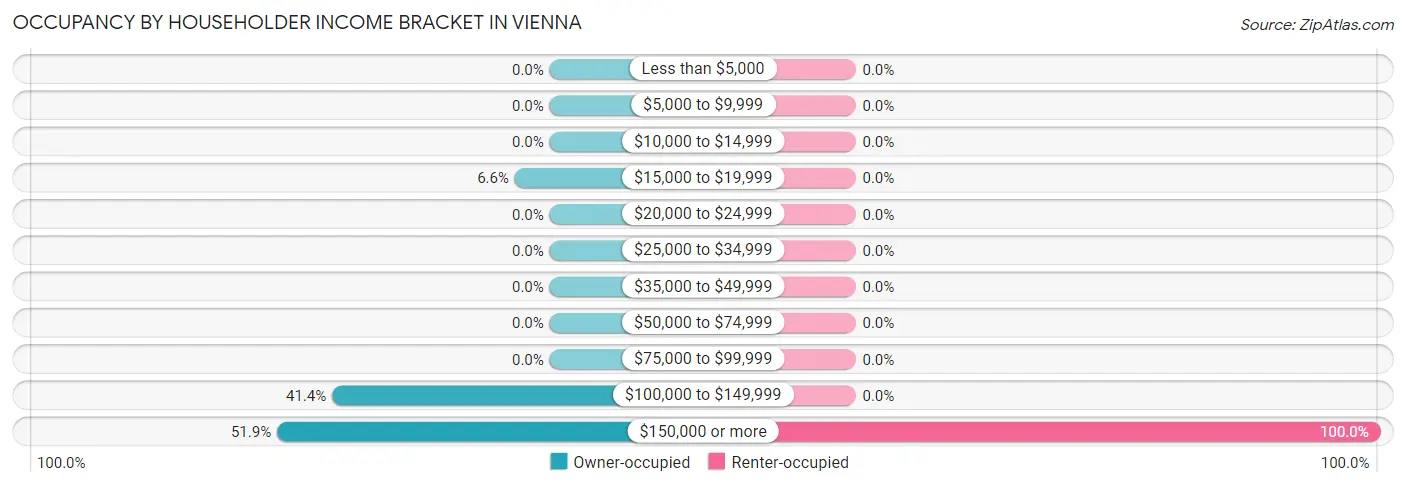
| Income Bracket | Owner-occupied | Renter-occupied |
| Less than $5,000 | 0 (0.0%) | 0 (0.0%) |
| $5,000 to $9,999 | 0 (0.0%) | 0 (0.0%) |
| $10,000 to $14,999 | 0 (0.0%) | 0 (0.0%) |
| $15,000 to $19,999 | 12 (6.6%) | 0 (0.0%) |
| $20,000 to $24,999 | 0 (0.0%) | 0 (0.0%) |
| $25,000 to $34,999 | 0 (0.0%) | 0 (0.0%) |
| $35,000 to $49,999 | 0 (0.0%) | 0 (0.0%) |
| $50,000 to $74,999 | 0 (0.0%) | 0 (0.0%) |
| $75,000 to $99,999 | 0 (0.0%) | 0 (0.0%) |
| $100,000 to $149,999 | 75 (41.4%) | 0 (0.0%) |
| $150,000 or more | 94 (51.9%) | 14 (100.0%) |
| Total | 181 (100.0%) | 14 (100.0%) |
Monthly Housing Cost Tiers in Vienna
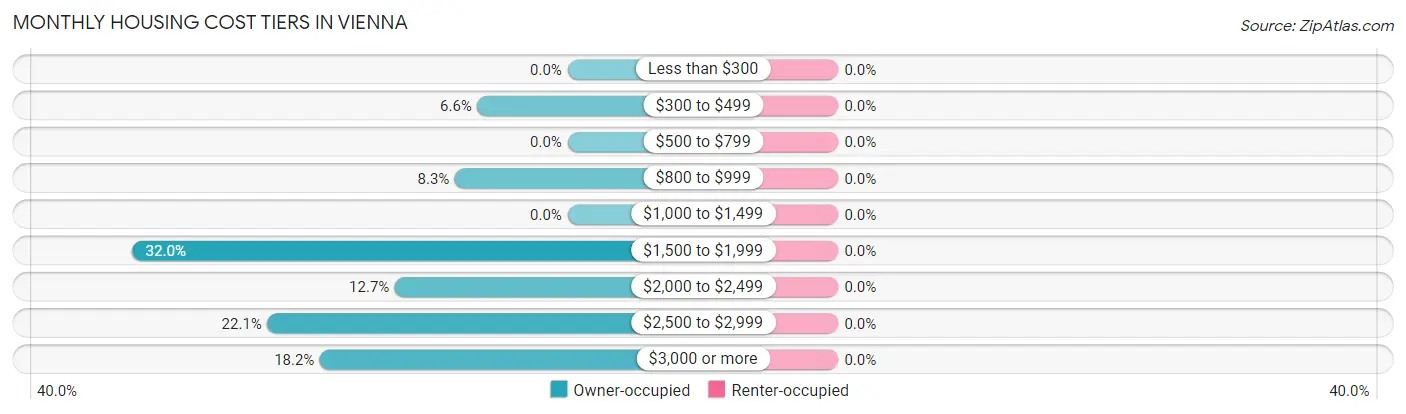
| Monthly Cost | Owner-occupied | Renter-occupied |
| Less than $300 | 0 (0.0%) | 0 (0.0%) |
| $300 to $499 | 12 (6.6%) | 0 (0.0%) |
| $500 to $799 | 0 (0.0%) | 0 (0.0%) |
| $800 to $999 | 15 (8.3%) | 0 (0.0%) |
| $1,000 to $1,499 | 0 (0.0%) | 0 (0.0%) |
| $1,500 to $1,999 | 58 (32.0%) | 0 (0.0%) |
| $2,000 to $2,499 | 23 (12.7%) | 0 (0.0%) |
| $2,500 to $2,999 | 40 (22.1%) | 0 (0.0%) |
| $3,000 or more | 33 (18.2%) | 0 (0.0%) |
| Total | 181 (100.0%) | 14 (100.0%) |
Physical Housing Characteristics in Vienna
Housing Structures in Vienna
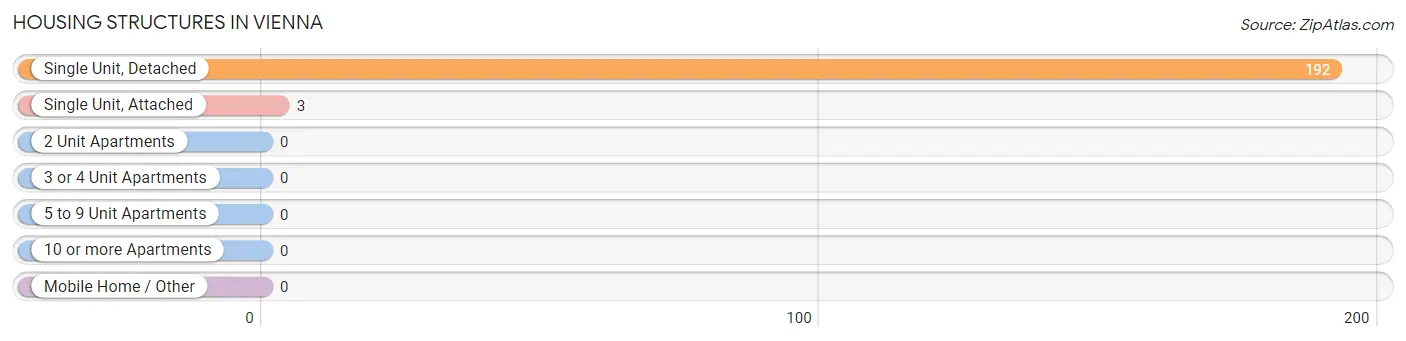
| Structure Type | # Housing Units | % Housing Units |
| Single Unit, Detached | 192 | 98.5% |
| Single Unit, Attached | 3 | 1.5% |
| 2 Unit Apartments | 0 | 0.0% |
| 3 or 4 Unit Apartments | 0 | 0.0% |
| 5 to 9 Unit Apartments | 0 | 0.0% |
| 10 or more Apartments | 0 | 0.0% |
| Mobile Home / Other | 0 | 0.0% |
| Total | 195 | 100.0% |
Housing Structures by Occupancy in Vienna
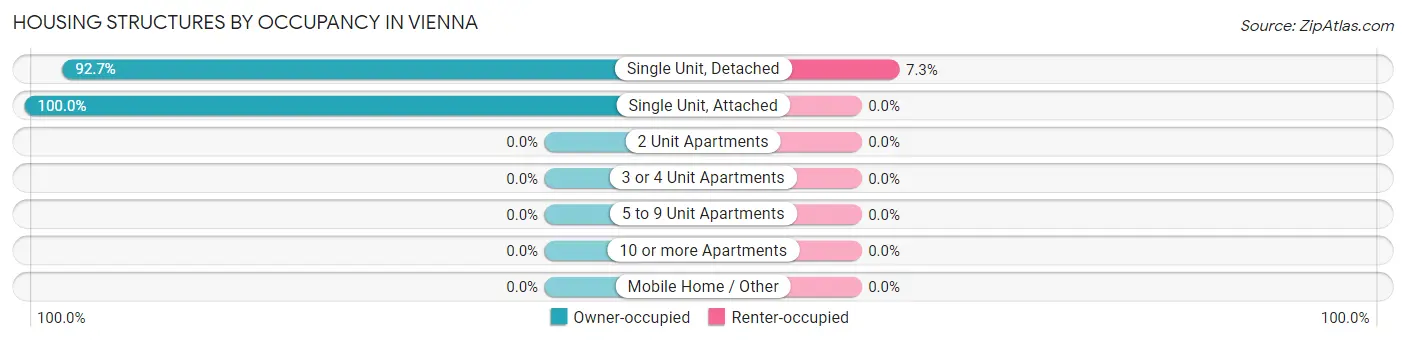
| Structure Type | Owner-occupied | Renter-occupied |
| Single Unit, Detached | 178 (92.7%) | 14 (7.3%) |
| Single Unit, Attached | 3 (100.0%) | 0 (0.0%) |
| 2 Unit Apartments | 0 (0.0%) | 0 (0.0%) |
| 3 or 4 Unit Apartments | 0 (0.0%) | 0 (0.0%) |
| 5 to 9 Unit Apartments | 0 (0.0%) | 0 (0.0%) |
| 10 or more Apartments | 0 (0.0%) | 0 (0.0%) |
| Mobile Home / Other | 0 (0.0%) | 0 (0.0%) |
| Total | 181 (92.8%) | 14 (7.2%) |
Housing Structures by Number of Rooms in Vienna
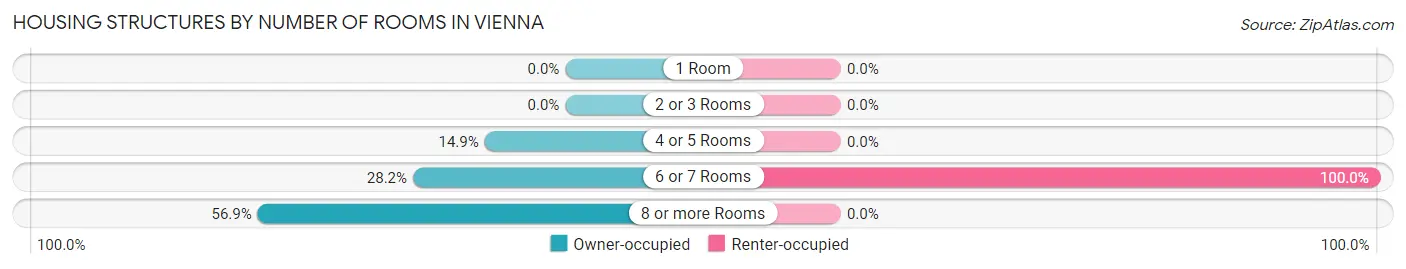
| Number of Rooms | Owner-occupied | Renter-occupied |
| 1 Room | 0 (0.0%) | 0 (0.0%) |
| 2 or 3 Rooms | 0 (0.0%) | 0 (0.0%) |
| 4 or 5 Rooms | 27 (14.9%) | 0 (0.0%) |
| 6 or 7 Rooms | 51 (28.2%) | 14 (100.0%) |
| 8 or more Rooms | 103 (56.9%) | 0 (0.0%) |
| Total | 181 (100.0%) | 14 (100.0%) |
Housing Structure by Heating Type in Vienna
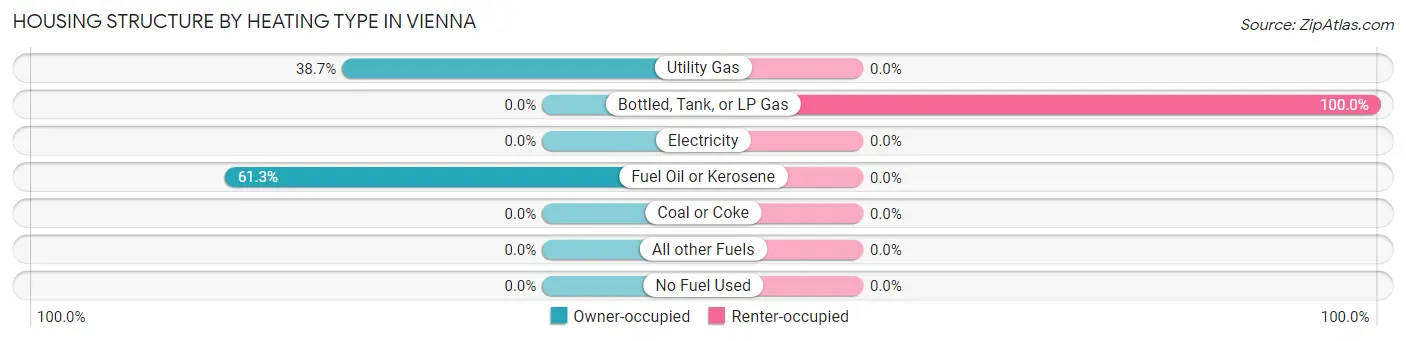
| Heating Type | Owner-occupied | Renter-occupied |
| Utility Gas | 70 (38.7%) | 0 (0.0%) |
| Bottled, Tank, or LP Gas | 0 (0.0%) | 14 (100.0%) |
| Electricity | 0 (0.0%) | 0 (0.0%) |
| Fuel Oil or Kerosene | 111 (61.3%) | 0 (0.0%) |
| Coal or Coke | 0 (0.0%) | 0 (0.0%) |
| All other Fuels | 0 (0.0%) | 0 (0.0%) |
| No Fuel Used | 0 (0.0%) | 0 (0.0%) |
| Total | 181 (100.0%) | 14 (100.0%) |
Household Vehicle Usage in Vienna
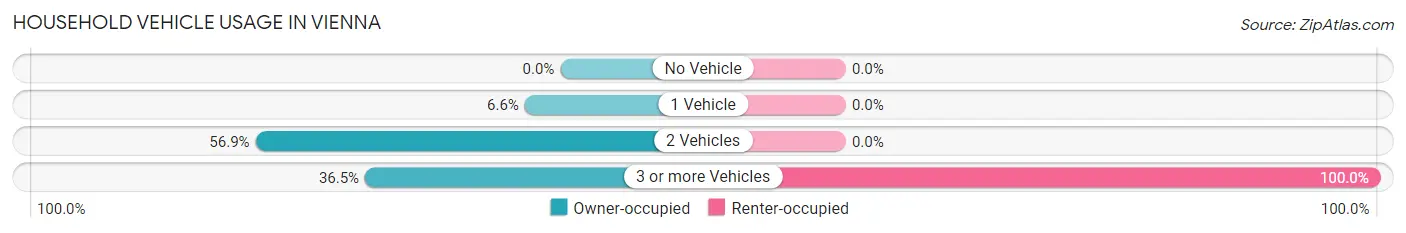
| Vehicles per Household | Owner-occupied | Renter-occupied |
| No Vehicle | 0 (0.0%) | 0 (0.0%) |
| 1 Vehicle | 12 (6.6%) | 0 (0.0%) |
| 2 Vehicles | 103 (56.9%) | 0 (0.0%) |
| 3 or more Vehicles | 66 (36.5%) | 14 (100.0%) |
| Total | 181 (100.0%) | 14 (100.0%) |
Real Estate & Mortgages in Vienna
Real Estate and Mortgage Overview in Vienna
| Characteristic | Without Mortgage | With Mortgage |
| Housing Units | 46 | 135 |
| Median Property Value | - | - |
| Median Household Income | - | - |
| Monthly Housing Costs | - | - |
| Real Estate Taxes | $6,833 | $0 |
Property Value by Mortgage Status in Vienna
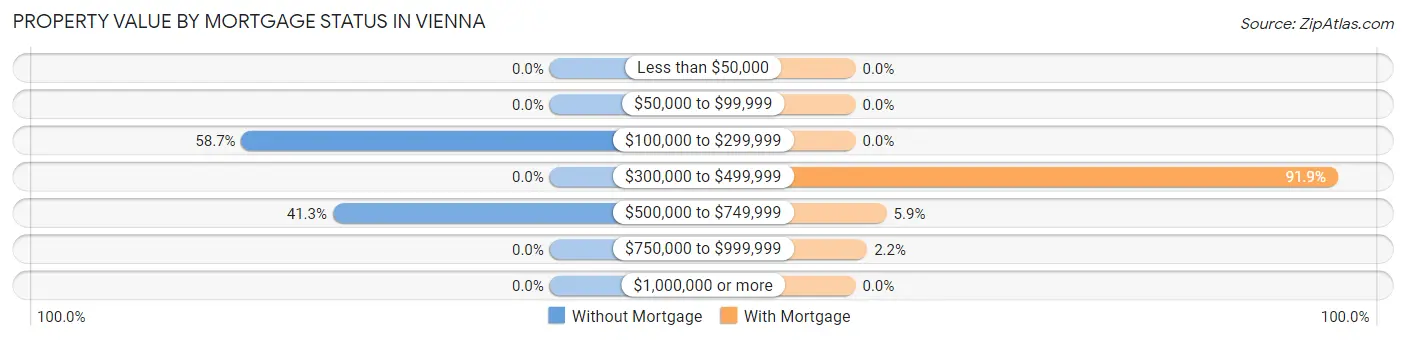
| Property Value | Without Mortgage | With Mortgage |
| Less than $50,000 | 0 (0.0%) | 0 (0.0%) |
| $50,000 to $99,999 | 0 (0.0%) | 0 (0.0%) |
| $100,000 to $299,999 | 27 (58.7%) | 0 (0.0%) |
| $300,000 to $499,999 | 0 (0.0%) | 124 (91.8%) |
| $500,000 to $749,999 | 19 (41.3%) | 8 (5.9%) |
| $750,000 to $999,999 | 0 (0.0%) | 3 (2.2%) |
| $1,000,000 or more | 0 (0.0%) | 0 (0.0%) |
| Total | 46 (100.0%) | 135 (100.0%) |
Household Income by Mortgage Status in Vienna
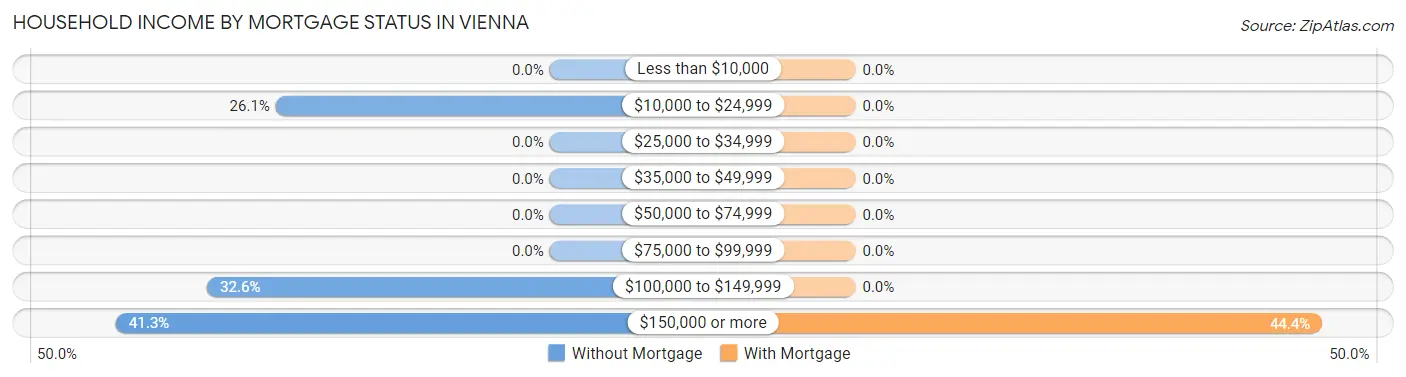
| Household Income | Without Mortgage | With Mortgage |
| Less than $10,000 | 0 (0.0%) | 0 (0.0%) |
| $10,000 to $24,999 | 12 (26.1%) | 0 (0.0%) |
| $25,000 to $34,999 | 0 (0.0%) | 0 (0.0%) |
| $35,000 to $49,999 | 0 (0.0%) | 0 (0.0%) |
| $50,000 to $74,999 | 0 (0.0%) | 0 (0.0%) |
| $75,000 to $99,999 | 0 (0.0%) | 0 (0.0%) |
| $100,000 to $149,999 | 15 (32.6%) | 0 (0.0%) |
| $150,000 or more | 19 (41.3%) | 60 (44.4%) |
| Total | 46 (100.0%) | 135 (100.0%) |
Property Value to Household Income Ratio in Vienna
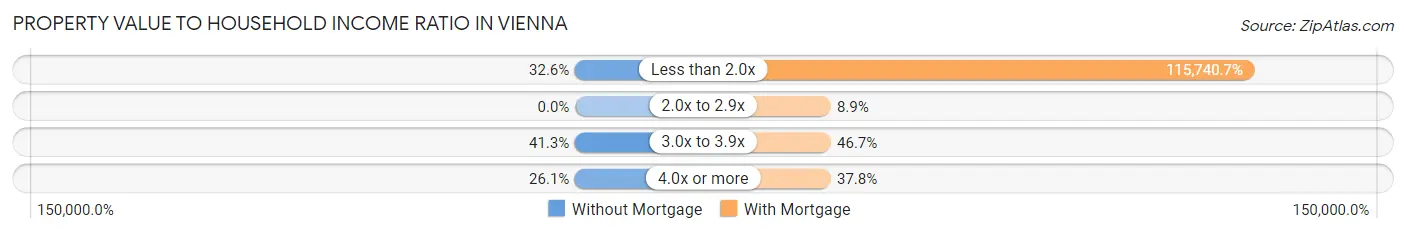
| Value-to-Income Ratio | Without Mortgage | With Mortgage |
| Less than 2.0x | 15 (32.6%) | 156,250 (115,740.7%) |
| 2.0x to 2.9x | 0 (0.0%) | 12 (8.9%) |
| 3.0x to 3.9x | 19 (41.3%) | 63 (46.7%) |
| 4.0x or more | 12 (26.1%) | 51 (37.8%) |
| Total | 46 (100.0%) | 135 (100.0%) |
Real Estate Taxes by Mortgage Status in Vienna
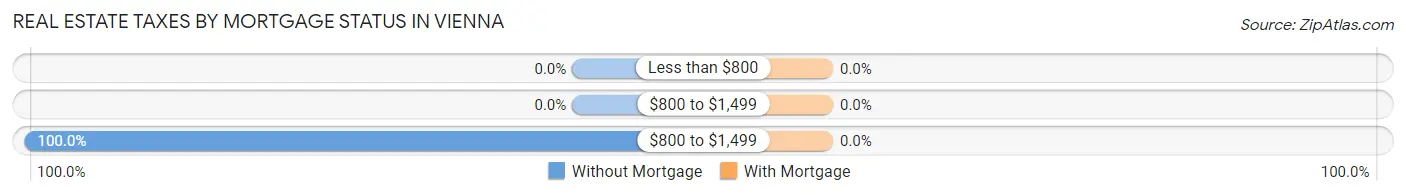
| Property Taxes | Without Mortgage | With Mortgage |
| Less than $800 | 0 (0.0%) | 0 (0.0%) |
| $800 to $1,499 | 0 (0.0%) | 0 (0.0%) |
| $800 to $1,499 | 46 (100.0%) | 0 (0.0%) |
| Total | 46 (100.0%) | 135 (100.0%) |
Health & Disability in Vienna
Health Insurance Coverage by Age in Vienna
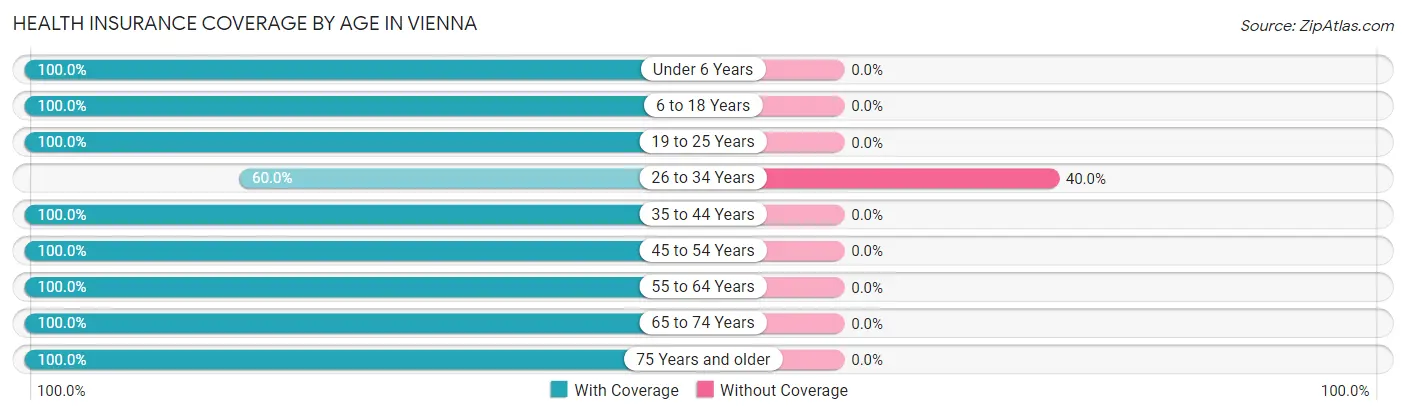
| Age Bracket | With Coverage | Without Coverage |
| Under 6 Years | 22 (100.0%) | 0 (0.0%) |
| 6 to 18 Years | 172 (100.0%) | 0 (0.0%) |
| 19 to 25 Years | 110 (100.0%) | 0 (0.0%) |
| 26 to 34 Years | 18 (60.0%) | 12 (40.0%) |
| 35 to 44 Years | 128 (100.0%) | 0 (0.0%) |
| 45 to 54 Years | 135 (100.0%) | 0 (0.0%) |
| 55 to 64 Years | 96 (100.0%) | 0 (0.0%) |
| 65 to 74 Years | 27 (100.0%) | 0 (0.0%) |
| 75 Years and older | 46 (100.0%) | 0 (0.0%) |
| Total | 754 (98.4%) | 12 (1.6%) |
Health Insurance Coverage by Citizenship Status in Vienna
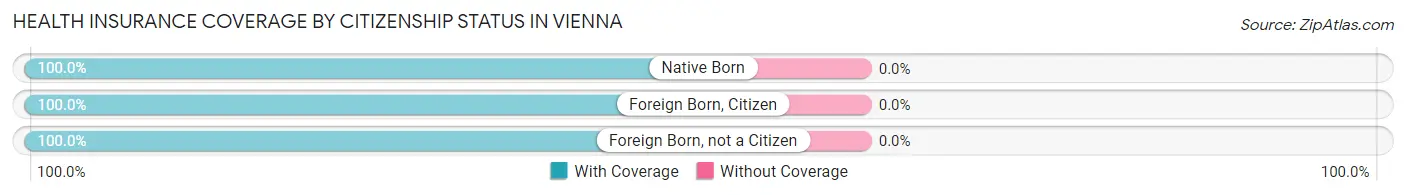
| Citizenship Status | With Coverage | Without Coverage |
| Native Born | 22 (100.0%) | 0 (0.0%) |
| Foreign Born, Citizen | 172 (100.0%) | 0 (0.0%) |
| Foreign Born, not a Citizen | 110 (100.0%) | 0 (0.0%) |
Health Insurance Coverage by Household Income in Vienna
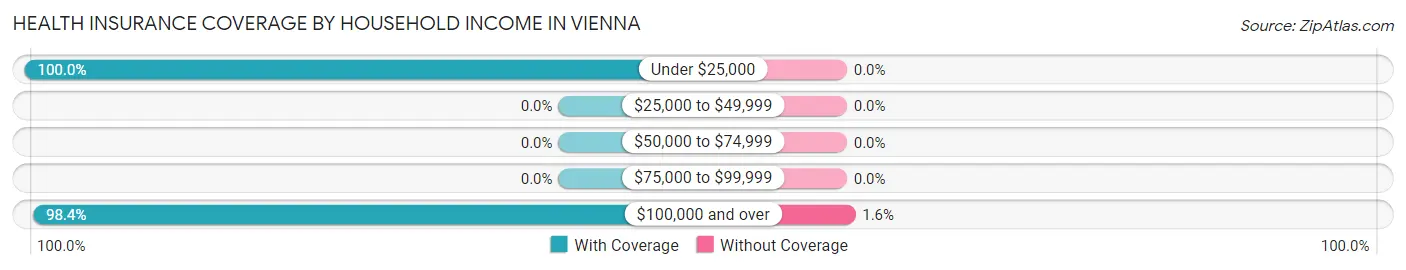
| Household Income | With Coverage | Without Coverage |
| Under $25,000 | 12 (100.0%) | 0 (0.0%) |
| $25,000 to $49,999 | 0 (0.0%) | 0 (0.0%) |
| $50,000 to $74,999 | 0 (0.0%) | 0 (0.0%) |
| $75,000 to $99,999 | 0 (0.0%) | 0 (0.0%) |
| $100,000 and over | 742 (98.4%) | 12 (1.6%) |
Public vs Private Health Insurance Coverage by Age in Vienna
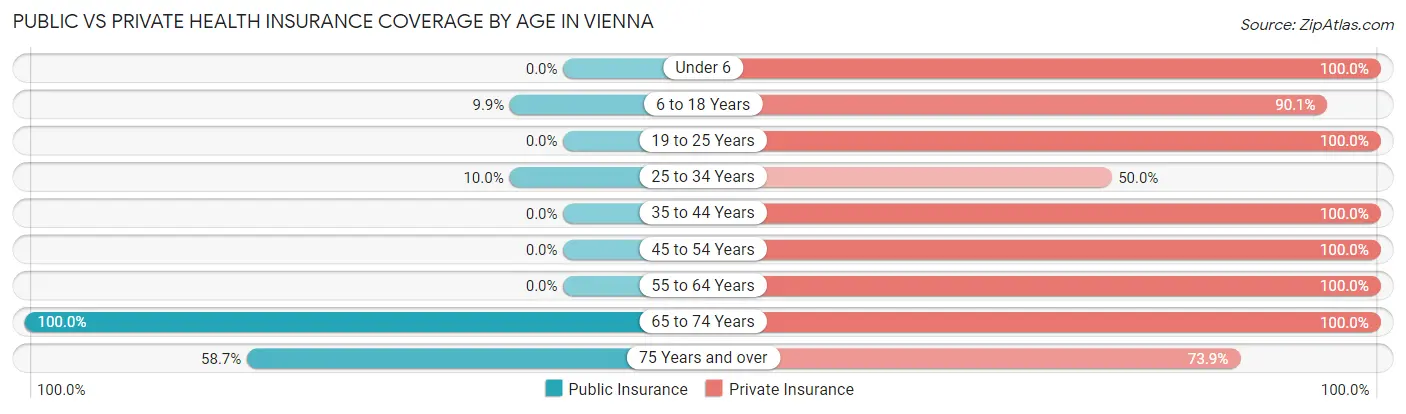
| Age Bracket | Public Insurance | Private Insurance |
| Under 6 | 0 (0.0%) | 22 (100.0%) |
| 6 to 18 Years | 17 (9.9%) | 155 (90.1%) |
| 19 to 25 Years | 0 (0.0%) | 110 (100.0%) |
| 25 to 34 Years | 3 (10.0%) | 15 (50.0%) |
| 35 to 44 Years | 0 (0.0%) | 128 (100.0%) |
| 45 to 54 Years | 0 (0.0%) | 135 (100.0%) |
| 55 to 64 Years | 0 (0.0%) | 96 (100.0%) |
| 65 to 74 Years | 27 (100.0%) | 27 (100.0%) |
| 75 Years and over | 27 (58.7%) | 34 (73.9%) |
| Total | 74 (9.7%) | 722 (94.3%) |
Disability Status by Sex by Age in Vienna
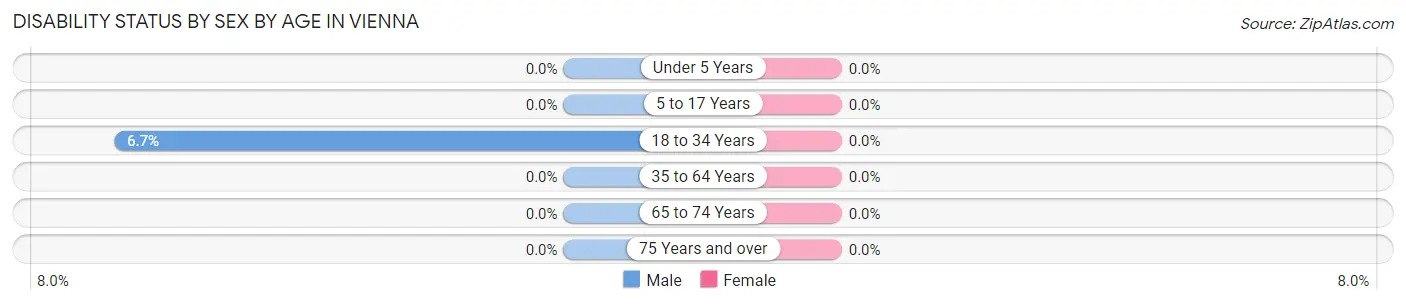
| Age Bracket | Male | Female |
| Under 5 Years | 0 (0.0%) | 0 (0.0%) |
| 5 to 17 Years | 0 (0.0%) | 0 (0.0%) |
| 18 to 34 Years | 3 (6.7%) | 0 (0.0%) |
| 35 to 64 Years | 0 (0.0%) | 0 (0.0%) |
| 65 to 74 Years | 0 (0.0%) | 0 (0.0%) |
| 75 Years and over | 0 (0.0%) | 0 (0.0%) |
Disability Class by Sex by Age in Vienna
Disability Class: Hearing Difficulty
| Age Bracket | Male | Female |
| Under 5 Years | 0 (0.0%) | 0 (0.0%) |
| 5 to 17 Years | 0 (0.0%) | 0 (0.0%) |
| 18 to 34 Years | 0 (0.0%) | 0 (0.0%) |
| 35 to 64 Years | 0 (0.0%) | 0 (0.0%) |
| 65 to 74 Years | 0 (0.0%) | 0 (0.0%) |
| 75 Years and over | 0 (0.0%) | 0 (0.0%) |
Disability Class: Vision Difficulty
| Age Bracket | Male | Female |
| Under 5 Years | 0 (0.0%) | 0 (0.0%) |
| 5 to 17 Years | 0 (0.0%) | 0 (0.0%) |
| 18 to 34 Years | 0 (0.0%) | 0 (0.0%) |
| 35 to 64 Years | 0 (0.0%) | 0 (0.0%) |
| 65 to 74 Years | 0 (0.0%) | 0 (0.0%) |
| 75 Years and over | 0 (0.0%) | 0 (0.0%) |
Disability Class: Cognitive Difficulty
| Age Bracket | Male | Female |
| 5 to 17 Years | 0 (0.0%) | 0 (0.0%) |
| 18 to 34 Years | 0 (0.0%) | 0 (0.0%) |
| 35 to 64 Years | 0 (0.0%) | 0 (0.0%) |
| 65 to 74 Years | 0 (0.0%) | 0 (0.0%) |
| 75 Years and over | 0 (0.0%) | 0 (0.0%) |
Disability Class: Ambulatory Difficulty
| Age Bracket | Male | Female |
| 5 to 17 Years | 0 (0.0%) | 0 (0.0%) |
| 18 to 34 Years | 0 (0.0%) | 0 (0.0%) |
| 35 to 64 Years | 0 (0.0%) | 0 (0.0%) |
| 65 to 74 Years | 0 (0.0%) | 0 (0.0%) |
| 75 Years and over | 0 (0.0%) | 0 (0.0%) |
Disability Class: Self-Care Difficulty

| Age Bracket | Male | Female |
| 5 to 17 Years | 0 (0.0%) | 0 (0.0%) |
| 18 to 34 Years | 0 (0.0%) | 0 (0.0%) |
| 35 to 64 Years | 0 (0.0%) | 0 (0.0%) |
| 65 to 74 Years | 0 (0.0%) | 0 (0.0%) |
| 75 Years and over | 0 (0.0%) | 0 (0.0%) |
Technology Access in Vienna
Computing Device Access in Vienna
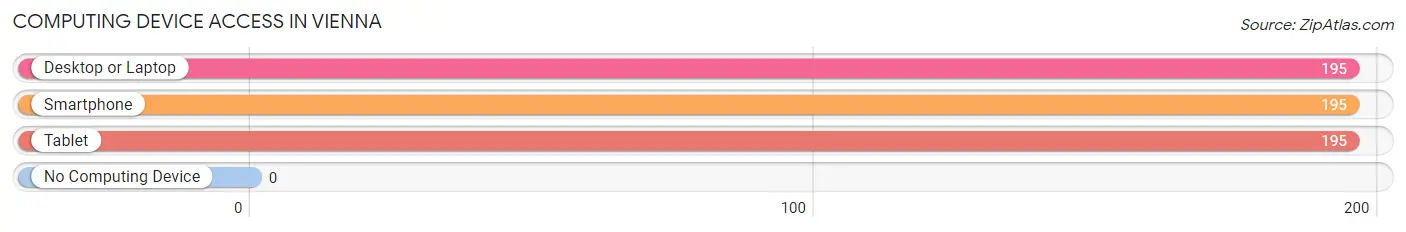
| Device Type | # Households | % Households |
| Desktop or Laptop | 195 | 100.0% |
| Smartphone | 195 | 100.0% |
| Tablet | 195 | 100.0% |
| No Computing Device | 0 | 0.0% |
| Total | 195 | 100.0% |
Internet Access in Vienna
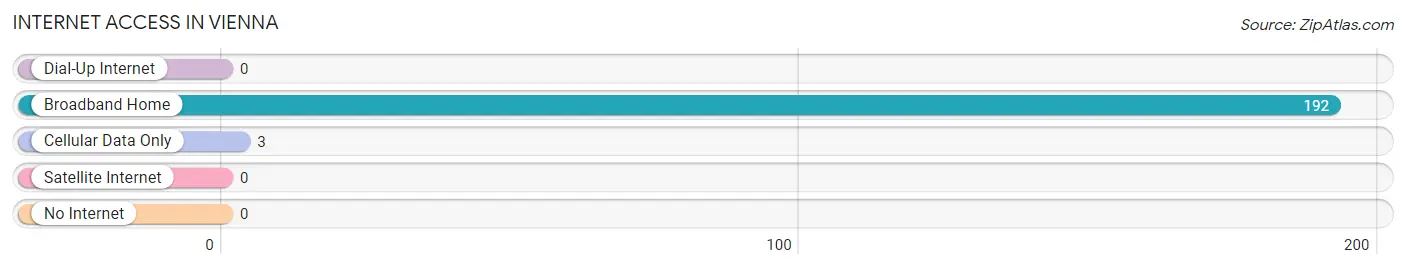
| Internet Type | # Households | % Households |
| Dial-Up Internet | 0 | 0.0% |
| Broadband Home | 192 | 98.5% |
| Cellular Data Only | 3 | 1.5% |
| Satellite Internet | 0 | 0.0% |
| No Internet | 0 | 0.0% |
| Total | 195 | 100.0% |
Vienna Summary
Vienna is a small town located in Gloucester County, New Jersey. It is situated on the banks of the Big Timber Creek, a tributary of the Delaware River. The town was founded in 1798 and was named after Vienna, Austria. Vienna is a rural community with a population of approximately 1,500 people.
Geography
Vienna is located in the southwestern corner of Gloucester County, New Jersey. It is bordered by the towns of Franklin, Harrison, and Woolwich. The town is situated on the banks of the Big Timber Creek, a tributary of the Delaware River. The town is located in the Pine Barrens, an area of New Jersey known for its sandy soil and pine forests. The town is also home to several small lakes, including Lake Vienna, which is a popular spot for fishing and swimming.
The town has a total area of 4.2 square miles, all of which is land. The town is located at an elevation of approximately 50 feet above sea level.
History
Vienna was founded in 1798 by a group of settlers from Pennsylvania. The town was named after Vienna, Austria, and was originally part of Franklin Township. In 1844, Vienna was incorporated as an independent municipality.
The town was a rural farming community for much of its history. In the late 19th century, the town began to develop as a summer resort destination. The town was home to several large hotels, including the Vienna Hotel, which was built in 1891.
Economy
Vienna is a rural community with a small economy. The town is home to several small businesses, including a few restaurants, a grocery store, and a few retail stores. The town is also home to a few small manufacturing companies.
The town is also home to several farms, which produce a variety of crops, including corn, soybeans, and hay. The town is also home to several wineries, which produce a variety of wines.
Demographics
As of the 2010 census, Vienna had a population of 1,521 people. The racial makeup of the town was 94.3% White, 2.2% African American, 0.2% Native American, 0.7% Asian, 0.1% Pacific Islander, and 2.5% from other races. Hispanic or Latino of any race were 4.2% of the population.
The median household income in Vienna was $60,938, and the median family income was $68,750. The per capita income for the town was $25,945. About 4.3% of families and 5.7% of the population were below the poverty line, including 6.3% of those under age 18 and 4.2% of those age 65 or over.
Conclusion
Vienna is a small rural town located in Gloucester County, New Jersey. It is situated on the banks of the Big Timber Creek, a tributary of the Delaware River. The town was founded in 1798 and was named after Vienna, Austria. Vienna is a rural community with a population of approximately 1,500 people. The town has a small economy, with several small businesses, farms, and wineries. The town has a diverse population, with a median household income of $60,938. Vienna is a peaceful and picturesque town, with a rich history and a bright future.
Common Questions
What is the Total Population of Vienna?
Total Population of Vienna is 766.
What is the Total Male Population of Vienna?
Total Male Population of Vienna is 378.
What is the Total Female Population of Vienna?
Total Female Population of Vienna is 388.
What is the Ratio of Males per 100 Females in Vienna?
There are 97.42 Males per 100 Females in Vienna.
What is the Ratio of Females per 100 Males in Vienna?
There are 102.65 Females per 100 Males in Vienna.
What is the Median Population Age in Vienna?
Median Population Age in Vienna is 36.7 Years.
What is the Average Family Size in Vienna
Average Family Size in Vienna is 4.2 People.
What is the Average Household Size in Vienna
Average Household Size in Vienna is 3.9 People.
What is Per Capita Income in Vienna?
Per Capita income in Vienna is $52,244.
What is the Median Family Income in Vienna?
Median Family Income in Vienna is $161,023.
What is the Median Household income in Vienna?
Median Household Income in Vienna is $156,750.
What is Income or Wage Gap in Vienna?
Income or Wage Gap in Vienna is 36.4%.
Women in Vienna earn 63.6 cents for every dollar earned by a man.
What is Inequality or Gini Index in Vienna?
Inequality or Gini Index in Vienna is 0.36.
How Large is the Labor Force in Vienna?
There are 488 People in the Labor Forcein in Vienna.
What is the Percentage of People in the Labor Force in Vienna?
77.2% of People are in the Labor Force in Vienna.