Cities with the Highest Percentage of Population with a Degree in Social Sciences in Vermont
RELATED REPORTS & OPTIONS
Social Sciences
Vermont
Compare Cities
Map of Cities with the Highest Percentage of Population with a Degree in Social Sciences in Vermont
0.0%
60.0%
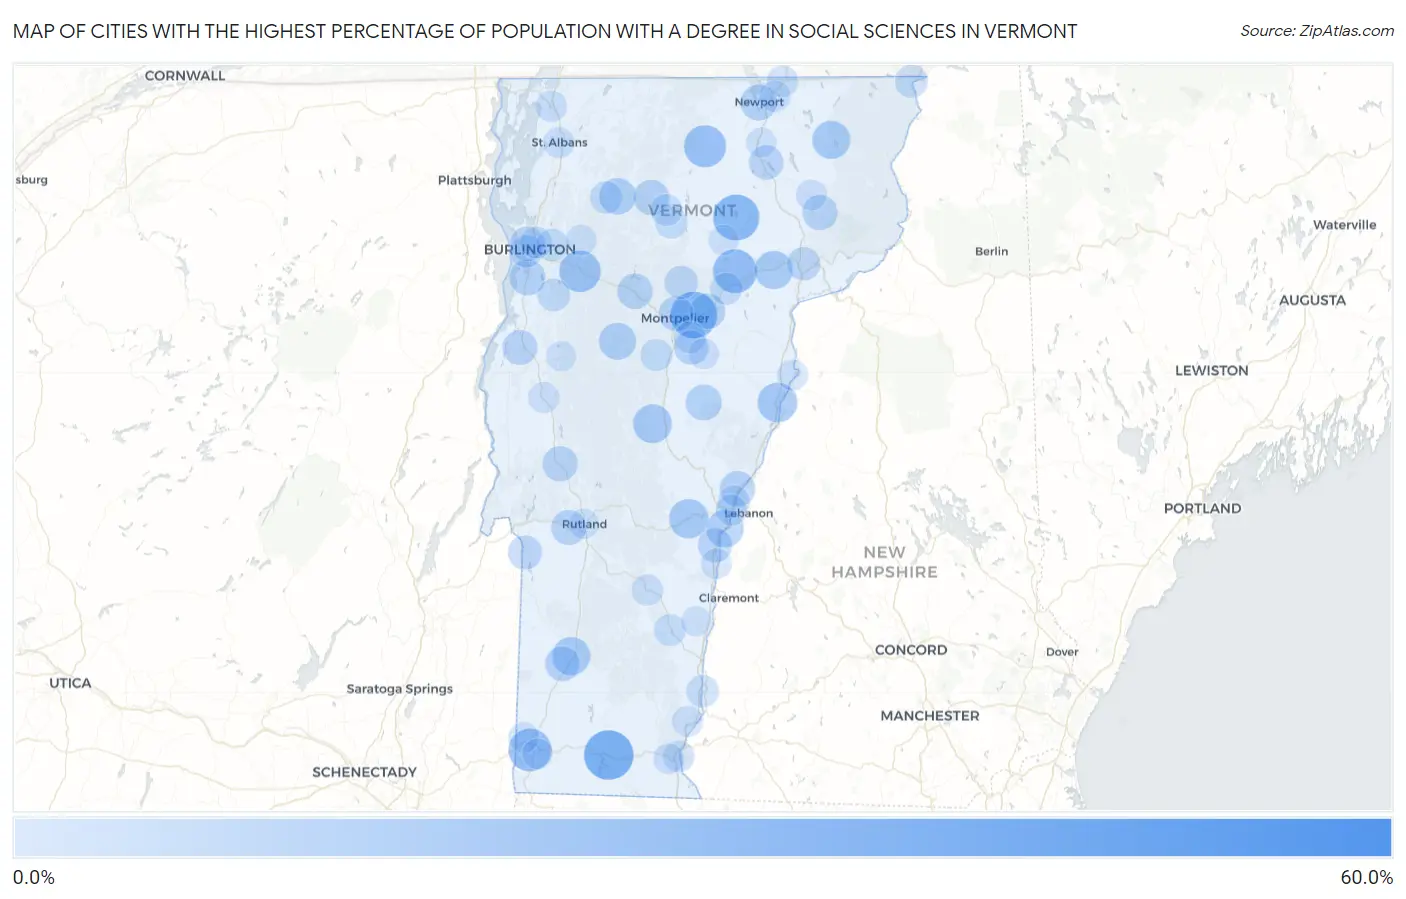
Cities with the Highest Percentage of Population with a Degree in Social Sciences in Vermont
| City | % Graduates | vs State | vs National | |
| 1. | West Dummerston | 57.1% | 10.1%(+47.0)#1 | 8.1%(+49.1)#134 |
| 2. | Whitingham | 54.5% | 10.1%(+44.4)#2 | 8.1%(+46.5)#152 |
| 3. | Algiers | 43.1% | 10.1%(+33.0)#3 | 8.1%(+35.1)#264 |
| 4. | Lyndon Center | 40.1% | 10.1%(+30.0)#4 | 8.1%(+32.1)#300 |
| 5. | Wilmington | 37.3% | 10.1%(+27.2)#5 | 8.1%(+29.3)#357 |
| 6. | East Montpelier | 32.6% | 10.1%(+22.4)#6 | 8.1%(+24.5)#465 |
| 7. | Greensboro | 31.8% | 10.1%(+21.7)#7 | 8.1%(+23.7)#479 |
| 8. | Pownal Center | 30.7% | 10.1%(+20.6)#8 | 8.1%(+22.6)#511 |
| 9. | Cabot | 27.7% | 10.1%(+17.5)#9 | 8.1%(+19.6)#652 |
| 10. | Old Bennington | 26.2% | 10.1%(+16.1)#10 | 8.1%(+18.1)#731 |
| 11. | Castleton Four Corners | 25.3% | 10.1%(+15.1)#11 | 8.1%(+17.2)#781 |
| 12. | Lowell | 25.0% | 10.1%(+14.9)#12 | 8.1%(+16.9)#813 |
| 13. | Richmond | 24.2% | 10.1%(+14.1)#13 | 8.1%(+16.1)#881 |
| 14. | Wardsboro | 23.7% | 10.1%(+13.5)#14 | 8.1%(+15.6)#915 |
| 15. | Jamaica | 23.1% | 10.1%(+12.9)#15 | 8.1%(+15.0)#960 |
| 16. | Bradford | 20.9% | 10.1%(+10.8)#16 | 8.1%(+12.8)#1,197 |
| 17. | Woodstock | 20.5% | 10.1%(+10.3)#17 | 8.1%(+12.4)#1,244 |
| 18. | West Charlotte | 20.0% | 10.1%(+9.85)#18 | 8.1%(+11.9)#1,316 |
| 19. | Sutton | 20.0% | 10.1%(+9.85)#19 | 8.1%(+11.9)#1,326 |
| 20. | Randolph | 19.3% | 10.1%(+9.18)#20 | 8.1%(+11.3)#1,426 |
| 21. | Manchester Center | 18.8% | 10.1%(+8.69)#21 | 8.1%(+10.8)#1,500 |
| 22. | Danville | 18.6% | 10.1%(+8.50)#22 | 8.1%(+10.6)#1,538 |
| 23. | Island Pond | 18.5% | 10.1%(+8.39)#23 | 8.1%(+10.5)#1,557 |
| 24. | Westford | 17.4% | 10.1%(+7.25)#24 | 8.1%(+9.32)#1,765 |
| 25. | North Hartland | 17.2% | 10.1%(+7.07)#25 | 8.1%(+9.14)#1,798 |
| 26. | Waitsfield | 16.8% | 10.1%(+6.62)#26 | 8.1%(+8.70)#1,893 |
| 27. | Jeffersonville | 16.0% | 10.1%(+5.87)#27 | 8.1%(+7.95)#2,101 |
| 28. | Newport | 15.2% | 10.1%(+5.08)#28 | 8.1%(+7.15)#2,332 |
| 29. | Shelburne | 15.0% | 10.1%(+4.84)#29 | 8.1%(+6.91)#2,414 |
| 30. | Chelsea | 14.9% | 10.1%(+4.80)#30 | 8.1%(+6.87)#2,422 |
| 31. | Johnson | 14.3% | 10.1%(+4.14)#31 | 8.1%(+6.21)#2,624 |
| 32. | Plainfield | 14.3% | 10.1%(+4.14)#32 | 8.1%(+6.21)#2,642 |
| 33. | Waterbury | 14.1% | 10.1%(+3.97)#33 | 8.1%(+6.04)#2,718 |
| 34. | Norwich | 14.1% | 10.1%(+3.94)#34 | 8.1%(+6.01)#2,732 |
| 35. | Montpelier | 13.8% | 10.1%(+3.63)#35 | 8.1%(+5.70)#2,855 |
| 36. | Brandon | 13.7% | 10.1%(+3.58)#36 | 8.1%(+5.65)#2,877 |
| 37. | East Burke | 13.7% | 10.1%(+3.55)#37 | 8.1%(+5.63)#2,886 |
| 38. | West Rutland | 13.6% | 10.1%(+3.50)#38 | 8.1%(+5.57)#2,907 |
| 39. | Townshend | 13.5% | 10.1%(+3.37)#39 | 8.1%(+5.44)#2,974 |
| 40. | Manchester | 13.4% | 10.1%(+3.21)#40 | 8.1%(+5.28)#3,044 |
| 41. | Danby | 13.3% | 10.1%(+3.19)#41 | 8.1%(+5.26)#3,071 |
| 42. | Vergennes | 13.2% | 10.1%(+3.05)#42 | 8.1%(+5.12)#3,140 |
| 43. | Burlington | 12.7% | 10.1%(+2.57)#43 | 8.1%(+4.64)#3,403 |
| 44. | Peacham | 12.7% | 10.1%(+2.53)#44 | 8.1%(+4.60)#3,419 |
| 45. | Barton | 12.4% | 10.1%(+2.24)#45 | 8.1%(+4.31)#3,613 |
| 46. | Hartland | 12.3% | 10.1%(+2.16)#46 | 8.1%(+4.24)#3,660 |
| 47. | South Barre | 12.3% | 10.1%(+2.14)#47 | 8.1%(+4.22)#3,668 |
| 48. | Weston | 11.8% | 10.1%(+1.62)#48 | 8.1%(+3.69)#3,975 |
| 49. | Poultney | 11.7% | 10.1%(+1.58)#49 | 8.1%(+3.65)#3,993 |
| 50. | Worcester | 10.8% | 10.1%(+0.665)#50 | 8.1%(+2.74)#4,697 |
| 51. | St Johnsbury | 10.8% | 10.1%(+0.622)#51 | 8.1%(+2.70)#4,732 |
| 52. | North Clarendon | 10.6% | 10.1%(+0.493)#52 | 8.1%(+2.57)#4,863 |
| 53. | Huntington Center | 10.4% | 10.1%(+0.271)#53 | 8.1%(+2.35)#5,066 |
| 54. | New Haven | 10.3% | 10.1%(+0.111)#54 | 8.1%(+2.19)#5,216 |
| 55. | Canaan | 10.0% | 10.1%(-0.146)#55 | 8.1%(+1.93)#5,463 |
| 56. | Hinesburg | 9.8% | 10.1%(-0.317)#56 | 8.1%(+1.76)#5,647 |
| 57. | South Burlington | 9.7% | 10.1%(-0.446)#57 | 8.1%(+1.63)#5,780 |
| 58. | Cambridge | 9.5% | 10.1%(-0.622)#58 | 8.1%(+1.45)#5,989 |
| 59. | Stratton Mountain | 9.5% | 10.1%(-0.622)#59 | 8.1%(+1.45)#5,992 |
| 60. | Westminster | 9.4% | 10.1%(-0.701)#60 | 8.1%(+1.37)#6,062 |
| 61. | South Lincoln | 9.4% | 10.1%(-0.712)#61 | 8.1%(+1.36)#6,087 |
| 62. | West Woodstock | 9.4% | 10.1%(-0.725)#62 | 8.1%(+1.35)#6,102 |
| 63. | Morrisville | 9.3% | 10.1%(-0.893)#63 | 8.1%(+1.18)#6,287 |
| 64. | Lincoln | 9.2% | 10.1%(-0.950)#64 | 8.1%(+1.12)#6,363 |
| 65. | Essex Junction | 9.1% | 10.1%(-1.05)#65 | 8.1%(+1.03)#6,464 |
| 66. | Underhill Center | 9.1% | 10.1%(-1.05)#66 | 8.1%(+1.02)#6,522 |
| 67. | Northfield | 8.9% | 10.1%(-1.23)#67 | 8.1%(+0.846)#6,706 |
| 68. | Marshfield | 8.8% | 10.1%(-1.30)#68 | 8.1%(+0.778)#6,774 |
| 69. | Hyde Park | 8.7% | 10.1%(-1.48)#69 | 8.1%(+0.596)#7,025 |
| 70. | Chester | 8.5% | 10.1%(-1.65)#70 | 8.1%(+0.424)#7,234 |
| 71. | Barre | 8.4% | 10.1%(-1.77)#71 | 8.1%(+0.305)#7,370 |
| 72. | Winooski | 8.2% | 10.1%(-1.96)#72 | 8.1%(+0.115)#7,657 |
| 73. | Wilder | 8.2% | 10.1%(-1.97)#73 | 8.1%(+0.104)#7,677 |
| 74. | Huntington | 7.9% | 10.1%(-2.22)#74 | 8.1%(-0.150)#8,061 |
| 75. | Derby Line | 7.9% | 10.1%(-2.28)#75 | 8.1%(-0.201)#8,147 |
| 76. | Brattleboro | 7.7% | 10.1%(-2.46)#76 | 8.1%(-0.384)#8,475 |
| 77. | Swanton | 7.6% | 10.1%(-2.52)#77 | 8.1%(-0.444)#8,557 |
| 78. | Ludlow | 7.5% | 10.1%(-2.66)#78 | 8.1%(-0.582)#8,772 |
| 79. | Derby Center | 7.4% | 10.1%(-2.74)#79 | 8.1%(-0.664)#8,886 |
| 80. | White River Junction | 7.4% | 10.1%(-2.76)#80 | 8.1%(-0.687)#8,940 |
| 81. | Lunenburg | 7.1% | 10.1%(-3.00)#81 | 8.1%(-0.928)#9,320 |
| 82. | St Albans | 7.1% | 10.1%(-3.08)#82 | 8.1%(-1.01)#9,459 |
| 83. | Stamford | 7.0% | 10.1%(-3.15)#83 | 8.1%(-1.08)#9,576 |
| 84. | Putney | 7.0% | 10.1%(-3.15)#84 | 8.1%(-1.08)#9,577 |
| 85. | Middlebury | 6.9% | 10.1%(-3.22)#85 | 8.1%(-1.15)#9,663 |
| 86. | Newbury | 6.8% | 10.1%(-3.30)#86 | 8.1%(-1.22)#9,781 |
| 87. | Windsor | 6.7% | 10.1%(-3.42)#87 | 8.1%(-1.34)#9,978 |
| 88. | West Burke | 6.7% | 10.1%(-3.48)#88 | 8.1%(-1.40)#10,101 |
| 89. | East Barre | 6.5% | 10.1%(-3.64)#89 | 8.1%(-1.57)#10,358 |
| 90. | Jericho | 6.5% | 10.1%(-3.64)#90 | 8.1%(-1.57)#10,362 |
| 91. | West Brattleboro | 6.5% | 10.1%(-3.66)#91 | 8.1%(-1.58)#10,387 |
| 92. | North Bennington | 6.2% | 10.1%(-3.91)#92 | 8.1%(-1.84)#10,842 |
| 93. | Bennington | 6.2% | 10.1%(-3.98)#93 | 8.1%(-1.90)#10,941 |
| 94. | Hardwick | 6.1% | 10.1%(-4.05)#94 | 8.1%(-1.97)#11,052 |
| 95. | Rutland | 6.0% | 10.1%(-4.14)#95 | 8.1%(-2.06)#11,214 |
| 96. | Proctor | 6.0% | 10.1%(-4.19)#96 | 8.1%(-2.12)#11,325 |
| 97. | Grafton | 5.9% | 10.1%(-4.26)#97 | 8.1%(-2.19)#11,480 |
| 98. | Springfield | 5.8% | 10.1%(-4.35)#98 | 8.1%(-2.27)#11,605 |
| 99. | Orleans | 5.7% | 10.1%(-4.45)#99 | 8.1%(-2.37)#11,780 |
| 100. | Bristol | 5.7% | 10.1%(-4.46)#100 | 8.1%(-2.38)#11,789 |
1
2Common Questions
What are the Top 10 Cities with the Highest Percentage of Population with a Degree in Social Sciences in Vermont?
Top 10 Cities with the Highest Percentage of Population with a Degree in Social Sciences in Vermont are:
#1
37.3%
#2
32.6%
#3
31.8%
#4
27.7%
#5
26.2%
#6
25.0%
#7
24.2%
#8
20.9%
#9
20.5%
#10
19.3%
What city has the Highest Percentage of Population with a Degree in Social Sciences in Vermont?
Wilmington has the Highest Percentage of Population with a Degree in Social Sciences in Vermont with 37.3%.
What is the Percentage of Population with a Degree in Social Sciences in the State of Vermont?
Percentage of Population with a Degree in Social Sciences in Vermont is 10.1%.
What is the Percentage of Population with a Degree in Social Sciences in the United States?
Percentage of Population with a Degree in Social Sciences in the United States is 8.1%.