Cities with the Highest Percentage of Population Employed in Personal Care and Service in New Jersey
RELATED REPORTS & OPTIONS
Personal Care and Service
New Jersey
Compare Cities
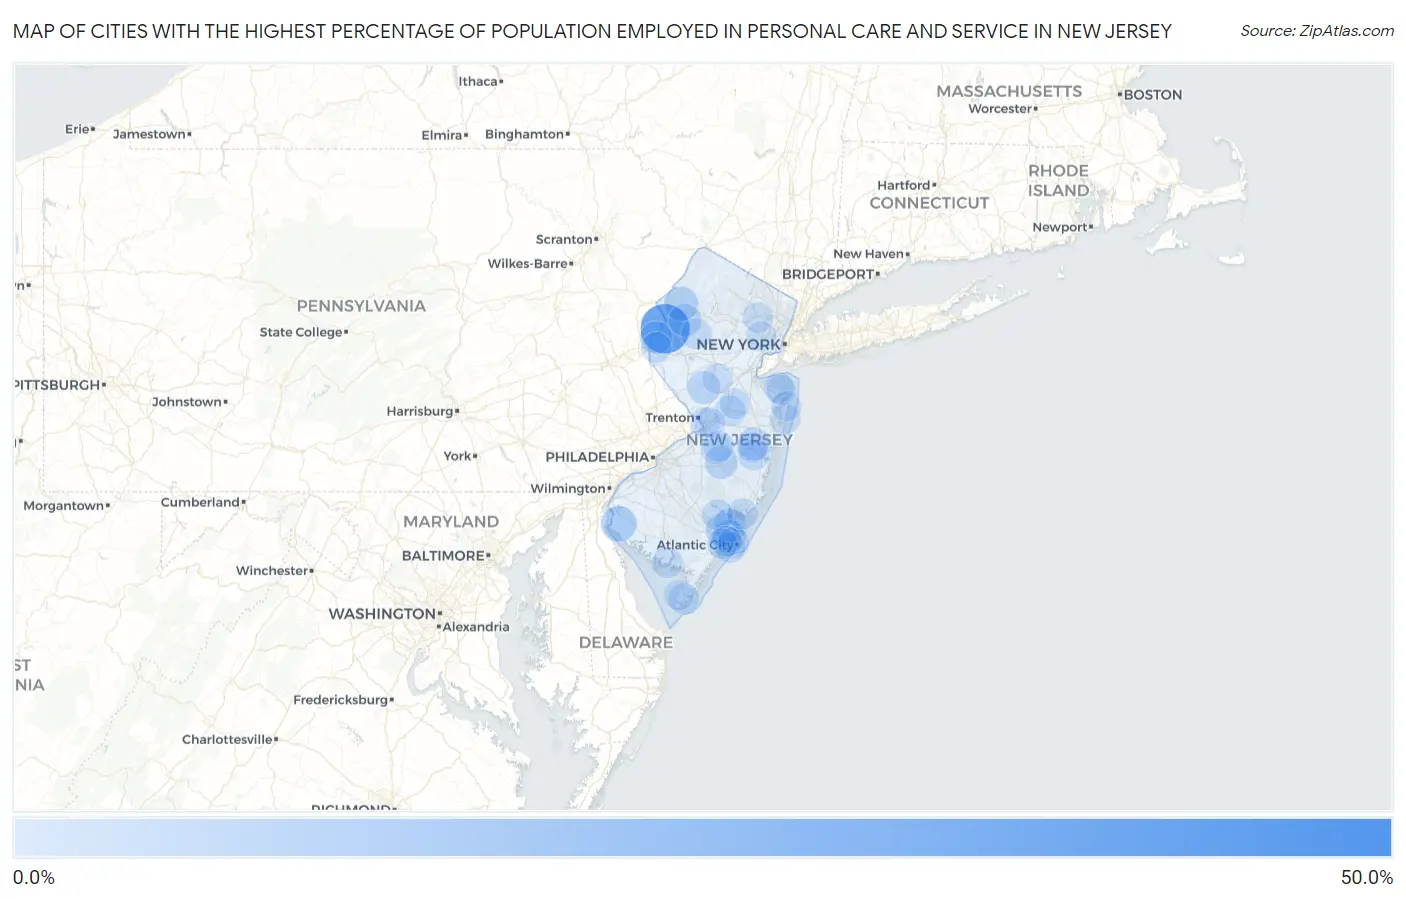
Map of Cities with the Highest Percentage of Population Employed in Personal Care and Service in New Jersey
0.0%
50.0%
Cities with the Highest Percentage of Population Employed in Personal Care and Service in New Jersey
| City | % Employed | vs State | vs National | |
| 1. | The Ponds | 49.3% | 2.7%(+46.6)#1 | 2.6%(+46.7)#42 |
| 2. | Brookfield | 40.4% | 2.7%(+37.8)#2 | 2.6%(+37.8)#61 |
| 3. | Gandys Beach | 25.0% | 2.7%(+22.3)#3 | 2.6%(+22.4)#161 |
| 4. | Dorchester | 20.0% | 2.7%(+17.3)#4 | 2.6%(+17.4)#256 |
| 5. | East Vineland | 18.2% | 2.7%(+15.6)#5 | 2.6%(+15.7)#297 |
| 6. | Pemberton Borough | 15.2% | 2.7%(+12.6)#6 | 2.6%(+12.7)#417 |
| 7. | Hancocks Bridge | 14.4% | 2.7%(+11.8)#7 | 2.6%(+11.8)#458 |
| 8. | Crosswicks | 12.2% | 2.7%(+9.56)#8 | 2.6%(+9.65)#638 |
| 9. | Marksboro | 11.8% | 2.7%(+9.11)#9 | 2.6%(+9.20)#690 |
| 10. | Mount Tabor | 11.6% | 2.7%(+8.92)#10 | 2.6%(+9.01)#708 |
| 11. | Lower Berkshire Valley | 11.4% | 2.7%(+8.76)#11 | 2.6%(+8.85)#726 |
| 12. | Titusville | 10.6% | 2.7%(+8.00)#12 | 2.6%(+8.09)#828 |
| 13. | Pomona | 10.2% | 2.7%(+7.58)#13 | 2.6%(+7.67)#891 |
| 14. | Smithville | 10.0% | 2.7%(+7.34)#14 | 2.6%(+7.43)#933 |
| 15. | Skillman | 9.9% | 2.7%(+7.29)#15 | 2.6%(+7.38)#942 |
| 16. | Keasbey | 9.9% | 2.7%(+7.21)#16 | 2.6%(+7.30)#950 |
| 17. | Point Pleasant Beach Borough | 9.7% | 2.7%(+7.01)#17 | 2.6%(+7.09)#995 |
| 18. | Absecon | 9.7% | 2.7%(+7.00)#18 | 2.6%(+7.09)#998 |
| 19. | Presidential Lakes Estates | 9.4% | 2.7%(+6.70)#19 | 2.6%(+6.79)#1,066 |
| 20. | Cream Ridge | 9.0% | 2.7%(+6.39)#20 | 2.6%(+6.48)#1,136 |
| 21. | Vienna | 9.0% | 2.7%(+6.37)#21 | 2.6%(+6.45)#1,142 |
| 22. | Cedar Glen West | 9.0% | 2.7%(+6.36)#22 | 2.6%(+6.44)#1,145 |
| 23. | Harmony | 8.7% | 2.7%(+6.05)#23 | 2.6%(+6.13)#1,230 |
| 24. | Mckee | 8.5% | 2.7%(+5.88)#24 | 2.6%(+5.97)#1,282 |
| 25. | Newfoundland | 8.5% | 2.7%(+5.87)#25 | 2.6%(+5.96)#1,284 |
| 26. | Ridgefield Borough | 8.2% | 2.7%(+5.54)#26 | 2.6%(+5.62)#1,376 |
| 27. | Leesburg | 8.0% | 2.7%(+5.40)#27 | 2.6%(+5.48)#1,417 |
| 28. | Mickleton | 7.9% | 2.7%(+5.21)#28 | 2.6%(+5.30)#1,488 |
| 29. | Jobstown | 7.5% | 2.7%(+4.81)#29 | 2.6%(+4.90)#1,646 |
| 30. | Springfield | 7.3% | 2.7%(+4.67)#30 | 2.6%(+4.76)#1,686 |
| 31. | Stockton University | 7.3% | 2.7%(+4.65)#31 | 2.6%(+4.74)#1,697 |
| 32. | Atlantic City | 7.1% | 2.7%(+4.40)#32 | 2.6%(+4.49)#1,803 |
| 33. | Haledon Borough | 7.0% | 2.7%(+4.33)#33 | 2.6%(+4.42)#1,839 |
| 34. | Califon Borough | 6.8% | 2.7%(+4.19)#34 | 2.6%(+4.28)#1,925 |
| 35. | Frenchtown Borough | 6.7% | 2.7%(+4.03)#35 | 2.6%(+4.12)#1,995 |
| 36. | Othello | 6.7% | 2.7%(+4.02)#36 | 2.6%(+4.10)#2,010 |
| 37. | Fairview Borough | 6.6% | 2.7%(+3.97)#37 | 2.6%(+4.06)#2,027 |
| 38. | Twin Rivers | 6.6% | 2.7%(+3.96)#38 | 2.6%(+4.05)#2,031 |
| 39. | Egg Harbor City | 6.5% | 2.7%(+3.90)#39 | 2.6%(+3.99)#2,074 |
| 40. | Roosevelt Borough | 6.5% | 2.7%(+3.89)#40 | 2.6%(+3.97)#2,078 |
| 41. | Jamesburg Borough | 6.5% | 2.7%(+3.84)#41 | 2.6%(+3.93)#2,107 |
| 42. | Ramapo College Of New Jersey | 6.4% | 2.7%(+3.78)#42 | 2.6%(+3.87)#2,145 |
| 43. | Erma | 6.4% | 2.7%(+3.76)#43 | 2.6%(+3.85)#2,158 |
| 44. | Montclair State University | 6.3% | 2.7%(+3.62)#44 | 2.6%(+3.71)#2,265 |
| 45. | Ocean Grove | 6.2% | 2.7%(+3.57)#45 | 2.6%(+3.66)#2,312 |
| 46. | Holiday City Berkeley | 6.2% | 2.7%(+3.52)#46 | 2.6%(+3.61)#2,351 |
| 47. | The College Of New Jersey | 6.1% | 2.7%(+3.46)#47 | 2.6%(+3.55)#2,385 |
| 48. | Manville Borough | 6.1% | 2.7%(+3.42)#48 | 2.6%(+3.51)#2,418 |
| 49. | Port Norris | 6.1% | 2.7%(+3.41)#49 | 2.6%(+3.50)#2,420 |
| 50. | Fort Dix | 6.0% | 2.7%(+3.38)#50 | 2.6%(+3.47)#2,440 |
| 51. | Ventnor City | 6.0% | 2.7%(+3.37)#51 | 2.6%(+3.46)#2,449 |
| 52. | Mystic Island | 6.0% | 2.7%(+3.31)#52 | 2.6%(+3.39)#2,497 |
| 53. | Concordia | 5.9% | 2.7%(+3.28)#53 | 2.6%(+3.37)#2,514 |
| 54. | Long Valley | 5.9% | 2.7%(+3.27)#54 | 2.6%(+3.36)#2,519 |
| 55. | Mcguire Afb | 5.9% | 2.7%(+3.26)#55 | 2.6%(+3.34)#2,534 |
| 56. | Pleasantville | 5.9% | 2.7%(+3.22)#56 | 2.6%(+3.30)#2,575 |
| 57. | Greenwich | 5.8% | 2.7%(+3.19)#57 | 2.6%(+3.28)#2,599 |
| 58. | Palisades Park Borough | 5.8% | 2.7%(+3.15)#58 | 2.6%(+3.24)#2,635 |
| 59. | Roselle Park Borough | 5.8% | 2.7%(+3.11)#59 | 2.6%(+3.20)#2,675 |
| 60. | Leonardo | 5.7% | 2.7%(+3.04)#60 | 2.6%(+3.12)#2,738 |
| 61. | National Park Borough | 5.7% | 2.7%(+3.01)#61 | 2.6%(+3.10)#2,763 |
| 62. | Flagtown | 5.6% | 2.7%(+2.99)#62 | 2.6%(+3.08)#2,786 |
| 63. | Carlstadt Borough | 5.6% | 2.7%(+2.97)#63 | 2.6%(+3.06)#2,804 |
| 64. | Hightstown Borough | 5.6% | 2.7%(+2.92)#64 | 2.6%(+3.01)#2,846 |
| 65. | Singac | 5.5% | 2.7%(+2.89)#65 | 2.6%(+2.97)#2,890 |
| 66. | Stirling | 5.5% | 2.7%(+2.85)#66 | 2.6%(+2.94)#2,923 |
| 67. | Victory Gardens Borough | 5.5% | 2.7%(+2.81)#67 | 2.6%(+2.90)#2,951 |
| 68. | Auburn | 5.5% | 2.7%(+2.80)#68 | 2.6%(+2.89)#2,959 |
| 69. | Blackwells Mills | 5.3% | 2.7%(+2.67)#69 | 2.6%(+2.76)#3,088 |
| 70. | Avon By The Sea Borough | 5.3% | 2.7%(+2.67)#70 | 2.6%(+2.75)#3,093 |
| 71. | Mount Hope | 5.2% | 2.7%(+2.57)#71 | 2.6%(+2.66)#3,190 |
| 72. | Watchung Borough | 5.2% | 2.7%(+2.52)#72 | 2.6%(+2.61)#3,236 |
| 73. | Stanhope Borough | 5.1% | 2.7%(+2.50)#73 | 2.6%(+2.58)#3,264 |
| 74. | Port Morris | 5.1% | 2.7%(+2.47)#74 | 2.6%(+2.56)#3,302 |
| 75. | Northfield | 5.1% | 2.7%(+2.47)#75 | 2.6%(+2.55)#3,309 |
| 76. | Paulsboro Borough | 5.1% | 2.7%(+2.43)#76 | 2.6%(+2.52)#3,344 |
| 77. | Yardville | 5.1% | 2.7%(+2.42)#77 | 2.6%(+2.51)#3,353 |
| 78. | Allentown Borough | 5.1% | 2.7%(+2.42)#78 | 2.6%(+2.51)#3,355 |
| 79. | Upper Greenwood Lake | 5.1% | 2.7%(+2.42)#79 | 2.6%(+2.50)#3,365 |
| 80. | West Long Branch Borough | 5.1% | 2.7%(+2.41)#80 | 2.6%(+2.50)#3,367 |
| 81. | Silver Lake | 5.1% | 2.7%(+2.41)#81 | 2.6%(+2.50)#3,374 |
| 82. | Spring Lake Heights Borough | 5.1% | 2.7%(+2.40)#82 | 2.6%(+2.49)#3,376 |
| 83. | Towaco | 5.0% | 2.7%(+2.39)#83 | 2.6%(+2.48)#3,401 |
| 84. | Leisure Knoll | 5.0% | 2.7%(+2.32)#84 | 2.6%(+2.41)#3,511 |
| 85. | White Horse | 5.0% | 2.7%(+2.31)#85 | 2.6%(+2.40)#3,523 |
| 86. | South Seaville | 4.9% | 2.7%(+2.26)#86 | 2.6%(+2.35)#3,582 |
| 87. | Stockton Borough | 4.9% | 2.7%(+2.22)#87 | 2.6%(+2.31)#3,636 |
| 88. | Long Branch | 4.9% | 2.7%(+2.21)#88 | 2.6%(+2.30)#3,651 |
| 89. | Villas | 4.8% | 2.7%(+2.19)#89 | 2.6%(+2.28)#3,674 |
| 90. | Mendham Borough | 4.8% | 2.7%(+2.11)#90 | 2.6%(+2.20)#3,782 |
| 91. | East Orange | 4.8% | 2.7%(+2.11)#91 | 2.6%(+2.19)#3,785 |
| 92. | Allendale Borough | 4.7% | 2.7%(+2.08)#92 | 2.6%(+2.17)#3,812 |
| 93. | Seaville | 4.7% | 2.7%(+2.06)#93 | 2.6%(+2.15)#3,837 |
| 94. | Great Notch | 4.7% | 2.7%(+2.03)#94 | 2.6%(+2.12)#3,876 |
| 95. | Hopelawn | 4.7% | 2.7%(+2.03)#95 | 2.6%(+2.12)#3,878 |
| 96. | Hasbrouck Heights Borough | 4.6% | 2.7%(+1.98)#96 | 2.6%(+2.07)#3,947 |
| 97. | Ledgewood | 4.6% | 2.7%(+1.92)#97 | 2.6%(+2.00)#4,046 |
| 98. | Navesink | 4.6% | 2.7%(+1.90)#98 | 2.6%(+1.99)#4,079 |
| 99. | William Paterson University Of New Jersey | 4.5% | 2.7%(+1.83)#99 | 2.6%(+1.92)#4,190 |
| 100. | West Cape May Borough | 4.5% | 2.7%(+1.83)#100 | 2.6%(+1.92)#4,194 |
Common Questions
What are the Top 10 Cities with the Highest Percentage of Population Employed in Personal Care and Service in New Jersey?
Top 10 Cities with the Highest Percentage of Population Employed in Personal Care and Service in New Jersey are:
#1
40.4%
#2
14.4%
#3
11.8%
#4
10.2%
#5
10.0%
#6
9.9%
#7
9.7%
#8
9.4%
#9
9.0%
#10
9.0%
What city has the Highest Percentage of Population Employed in Personal Care and Service in New Jersey?
Brookfield has the Highest Percentage of Population Employed in Personal Care and Service in New Jersey with 40.4%.
What is the Percentage of Population Employed in Personal Care and Service in the State of New Jersey?
Percentage of Population Employed in Personal Care and Service in New Jersey is 2.7%.
What is the Percentage of Population Employed in Personal Care and Service in the United States?
Percentage of Population Employed in Personal Care and Service in the United States is 2.6%.