Allentown borough, NJ
Allentown borough Overview
1,817
TOTAL POPULATION
864
MALE POPULATION
953
FEMALE POPULATION
90.66
MALES / 100 FEMALES
110.30
FEMALES / 100 MALES
40.5
MEDIAN AGE
3.2
AVG FAMILY SIZE
2.6
AVG HOUSEHOLD SIZE
$52,881
PER CAPITA INCOME
$135,078
AVG FAMILY INCOME
$113,438
AVG HOUSEHOLD INCOME
38.0%
WAGE / INCOME GAP [ % ]
62.0¢/ $1
WAGE / INCOME GAP [ $ ]
0.40
INEQUALITY / GINI INDEX
1,055
LABOR FORCE [ PEOPLE ]
70.4%
PERCENT IN LABOR FORCE
4.7%
UNEMPLOYMENT RATE
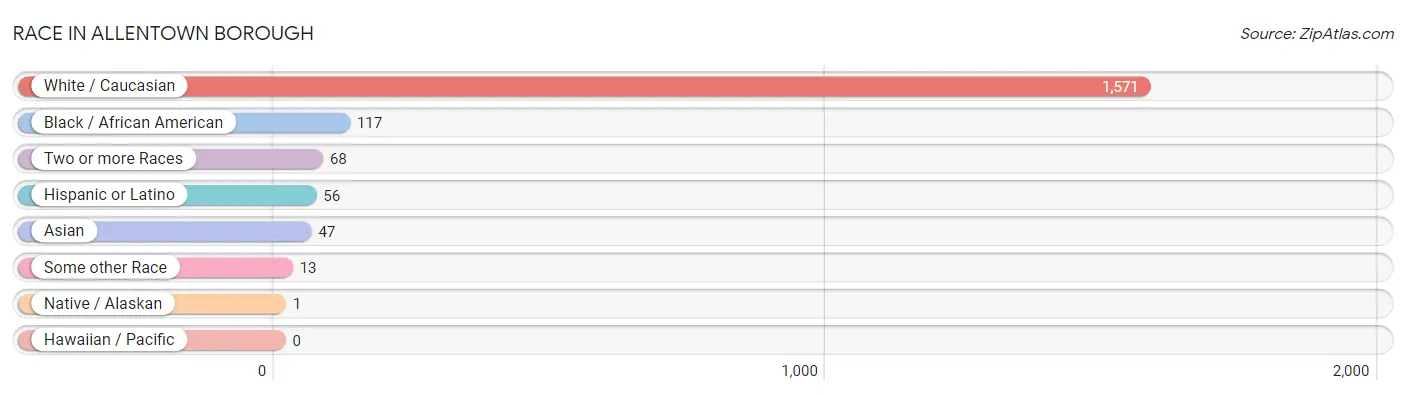
Race in Allentown borough
The most populous races in Allentown borough are White / Caucasian (1,571 | 86.5%), Black / African American (117 | 6.4%), and Two or more Races (68 | 3.7%).
| Race | # Population | % Population |
| Asian | 47 | 2.6% |
| Black / African American | 117 | 6.4% |
| Hawaiian / Pacific | 0 | 0.0% |
| Hispanic or Latino | 56 | 3.1% |
| Native / Alaskan | 1 | 0.1% |
| White / Caucasian | 1,571 | 86.5% |
| Two or more Races | 68 | 3.7% |
| Some other Race | 13 | 0.7% |
| Total | 1,817 | 100.0% |
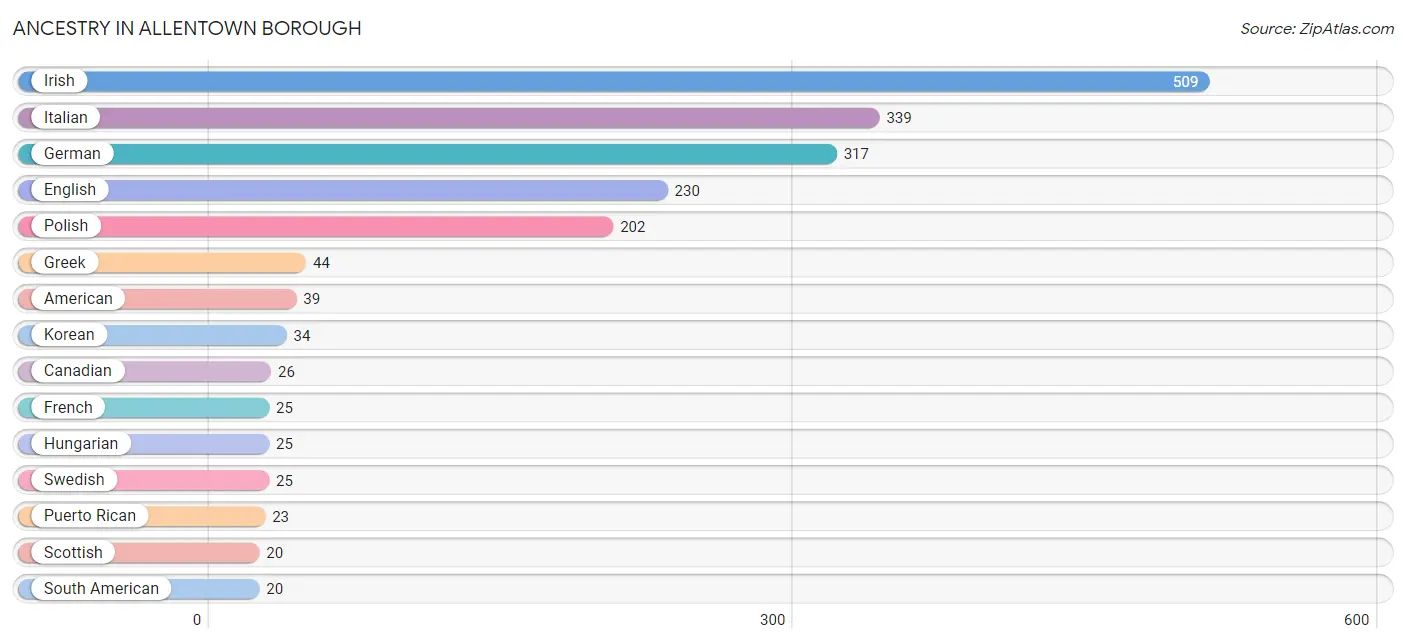
Ancestry in Allentown borough
The most populous ancestries reported in Allentown borough are Irish (509 | 28.0%), Italian (339 | 18.7%), German (317 | 17.4%), English (230 | 12.7%), and Polish (202 | 11.1%), together accounting for 87.9% of all Allentown borough residents.
| Ancestry | # Population | % Population |
| American | 39 | 2.1% |
| Arab | 12 | 0.7% |
| Austrian | 14 | 0.8% |
| Brazilian | 3 | 0.2% |
| British | 8 | 0.4% |
| Burmese | 3 | 0.2% |
| Canadian | 26 | 1.4% |
| Central American | 1 | 0.1% |
| Central American Indian | 1 | 0.1% |
| Colombian | 17 | 0.9% |
| Cuban | 7 | 0.4% |
| Danish | 3 | 0.2% |
| Dutch | 17 | 0.9% |
| Ecuadorian | 3 | 0.2% |
| English | 230 | 12.7% |
| European | 14 | 0.8% |
| Filipino | 2 | 0.1% |
| French | 25 | 1.4% |
| French Canadian | 11 | 0.6% |
| German | 317 | 17.4% |
| Greek | 44 | 2.4% |
| Honduran | 1 | 0.1% |
| Hungarian | 25 | 1.4% |
| Indian (Asian) | 8 | 0.4% |
| Irish | 509 | 28.0% |
| Italian | 339 | 18.7% |
| Jamaican | 6 | 0.3% |
| Korean | 34 | 1.9% |
| Lebanese | 1 | 0.1% |
| Mexican | 5 | 0.3% |
| Northern European | 3 | 0.2% |
| Norwegian | 12 | 0.7% |
| Polish | 202 | 11.1% |
| Portuguese | 9 | 0.5% |
| Puerto Rican | 23 | 1.3% |
| Romanian | 3 | 0.2% |
| Scandinavian | 3 | 0.2% |
| Scotch-Irish | 6 | 0.3% |
| Scottish | 20 | 1.1% |
| Sioux | 2 | 0.1% |
| Slovak | 18 | 1.0% |
| Slovene | 14 | 0.8% |
| South American | 20 | 1.1% |
| Swedish | 25 | 1.4% |
| Syrian | 11 | 0.6% |
| Ukrainian | 20 | 1.1% |
| Welsh | 20 | 1.1% | View All 47 Rows |
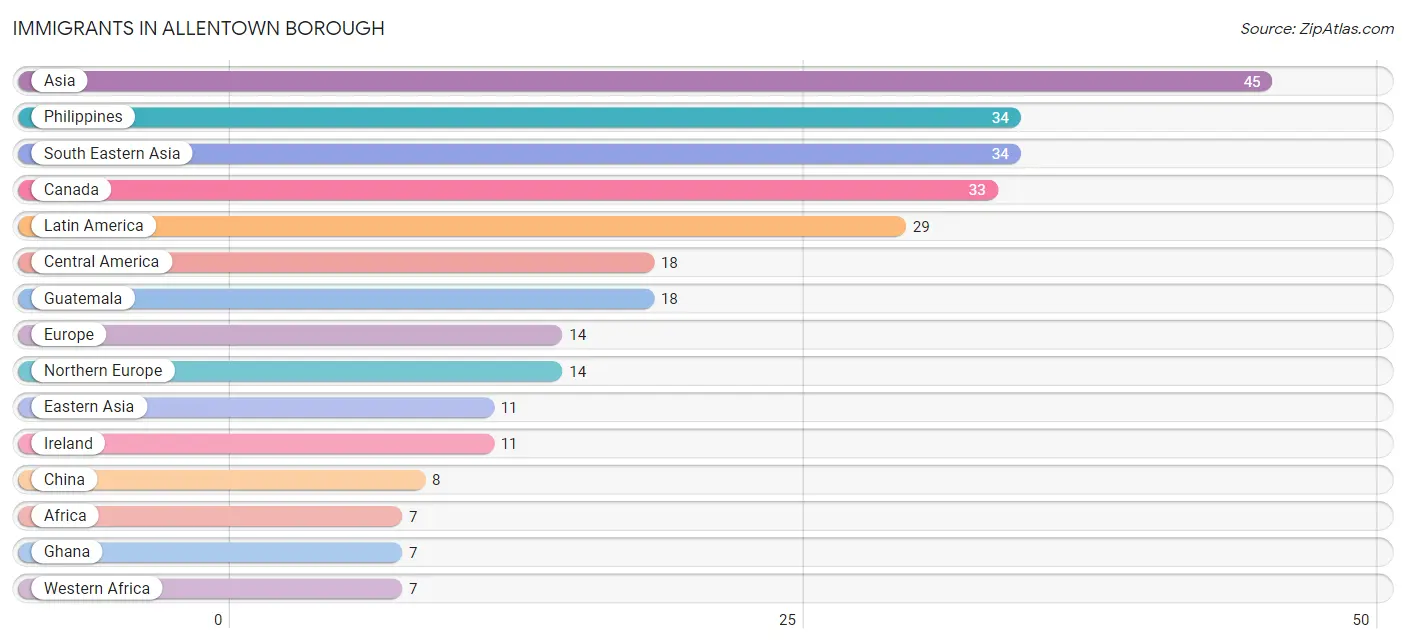
Immigrants in Allentown borough
The most numerous immigrant groups reported in Allentown borough came from Asia (45 | 2.5%), Philippines (34 | 1.9%), South Eastern Asia (34 | 1.9%), Canada (33 | 1.8%), and Latin America (29 | 1.6%), together accounting for 9.6% of all Allentown borough residents.
| Immigration Origin | # Population | % Population |
| Africa | 7 | 0.4% |
| Asia | 45 | 2.5% |
| Brazil | 3 | 0.2% |
| Canada | 33 | 1.8% |
| Caribbean | 5 | 0.3% |
| Central America | 18 | 1.0% |
| China | 8 | 0.4% |
| Cuba | 5 | 0.3% |
| Eastern Asia | 11 | 0.6% |
| Ecuador | 3 | 0.2% |
| England | 3 | 0.2% |
| Europe | 14 | 0.8% |
| Ghana | 7 | 0.4% |
| Guatemala | 18 | 1.0% |
| Hong Kong | 4 | 0.2% |
| Ireland | 11 | 0.6% |
| Korea | 3 | 0.2% |
| Latin America | 29 | 1.6% |
| Northern Europe | 14 | 0.8% |
| Philippines | 34 | 1.9% |
| South America | 6 | 0.3% |
| South Eastern Asia | 34 | 1.9% |
| Western Africa | 7 | 0.4% | View All 23 Rows |
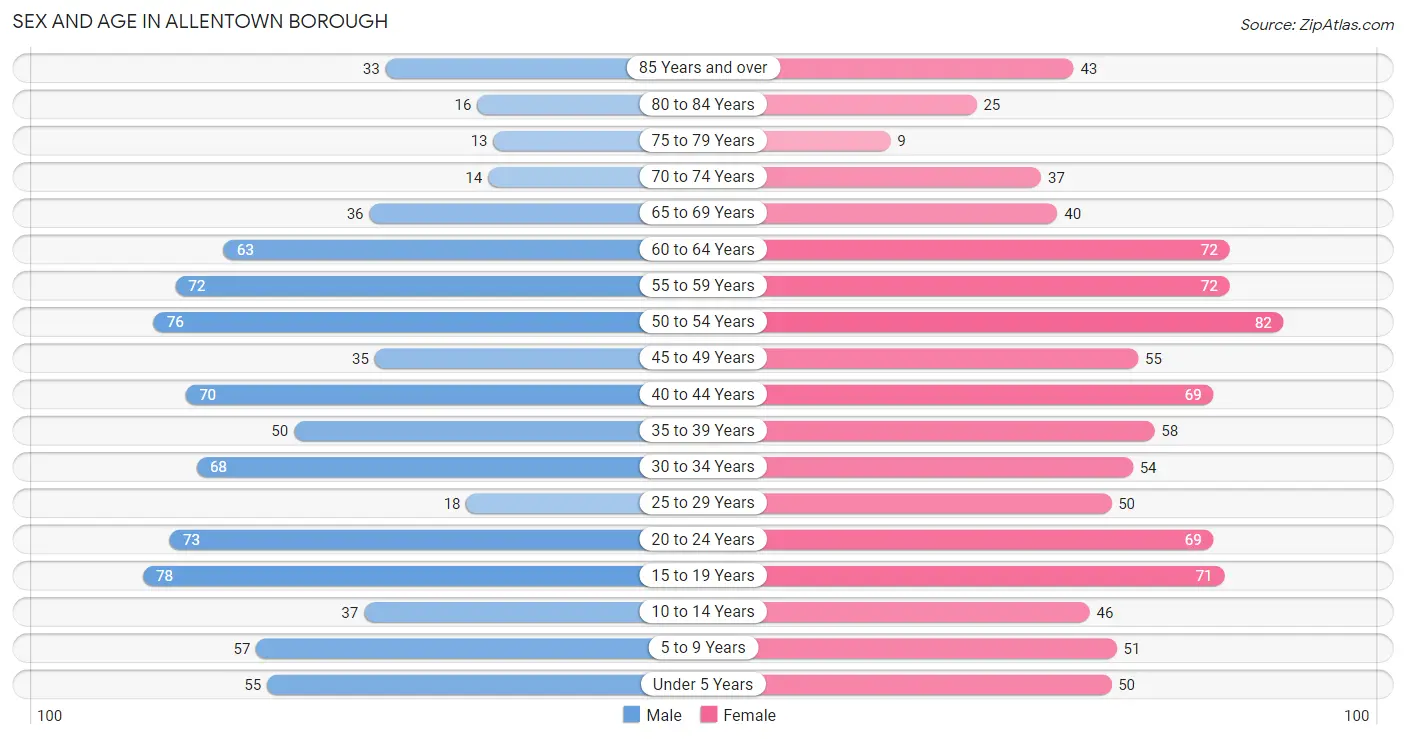
Sex and Age in Allentown borough
Sex and Age in Allentown borough
The most populous age groups in Allentown borough are 15 to 19 Years (78 | 9.0%) for men and 50 to 54 Years (82 | 8.6%) for women.
| Age Bracket | Male | Female |
| Under 5 Years | 55 (6.4%) | 50 (5.2%) |
| 5 to 9 Years | 57 (6.6%) | 51 (5.3%) |
| 10 to 14 Years | 37 (4.3%) | 46 (4.8%) |
| 15 to 19 Years | 78 (9.0%) | 71 (7.4%) |
| 20 to 24 Years | 73 (8.5%) | 69 (7.2%) |
| 25 to 29 Years | 18 (2.1%) | 50 (5.2%) |
| 30 to 34 Years | 68 (7.9%) | 54 (5.7%) |
| 35 to 39 Years | 50 (5.8%) | 58 (6.1%) |
| 40 to 44 Years | 70 (8.1%) | 69 (7.2%) |
| 45 to 49 Years | 35 (4.1%) | 55 (5.8%) |
| 50 to 54 Years | 76 (8.8%) | 82 (8.6%) |
| 55 to 59 Years | 72 (8.3%) | 72 (7.6%) |
| 60 to 64 Years | 63 (7.3%) | 72 (7.6%) |
| 65 to 69 Years | 36 (4.2%) | 40 (4.2%) |
| 70 to 74 Years | 14 (1.6%) | 37 (3.9%) |
| 75 to 79 Years | 13 (1.5%) | 9 (0.9%) |
| 80 to 84 Years | 16 (1.8%) | 25 (2.6%) |
| 85 Years and over | 33 (3.8%) | 43 (4.5%) |
| Total | 864 (100.0%) | 953 (100.0%) |
Families and Households in Allentown borough
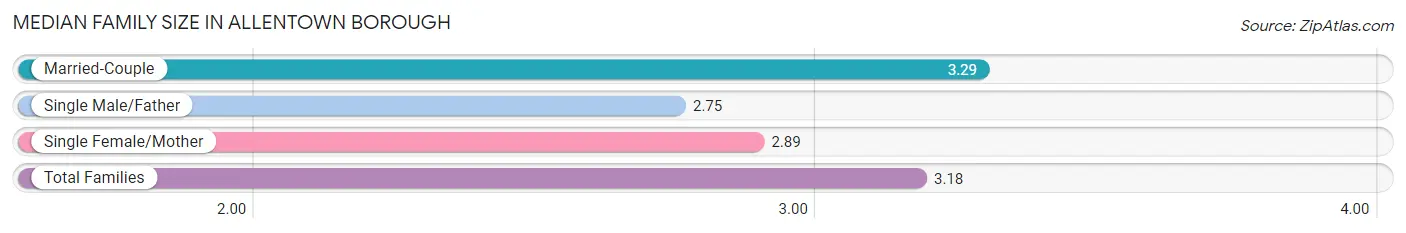
Median Family Size in Allentown borough
The median family size in Allentown borough is 3.18 persons per family, with married-couple families (373 | 75.7%) accounting for the largest median family size of 3.29 persons per family. On the other hand, single male/father families (32 | 6.5%) represent the smallest median family size with 2.75 persons per family.
| Family Type | # Families | Family Size |
| Married-Couple | 373 (75.7%) | 3.29 |
| Single Male/Father | 32 (6.5%) | 2.75 |
| Single Female/Mother | 88 (17.8%) | 2.89 |
| Total Families | 493 (100.0%) | 3.18 |
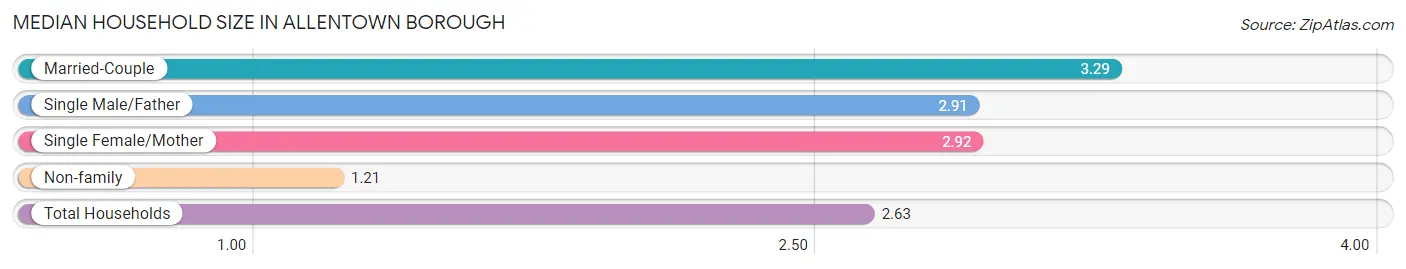
Median Household Size in Allentown borough
The median household size in Allentown borough is 2.63 persons per household, with married-couple households (373 | 54.0%) accounting for the largest median household size of 3.29 persons per household. non-family households (198 | 28.6%) represent the smallest median household size with 1.21 persons per household.
| Household Type | # Households | Household Size |
| Married-Couple | 373 (54.0%) | 3.29 |
| Single Male/Father | 32 (4.6%) | 2.91 |
| Single Female/Mother | 88 (12.7%) | 2.92 |
| Non-family | 198 (28.6%) | 1.21 |
| Total Households | 691 (100.0%) | 2.63 |
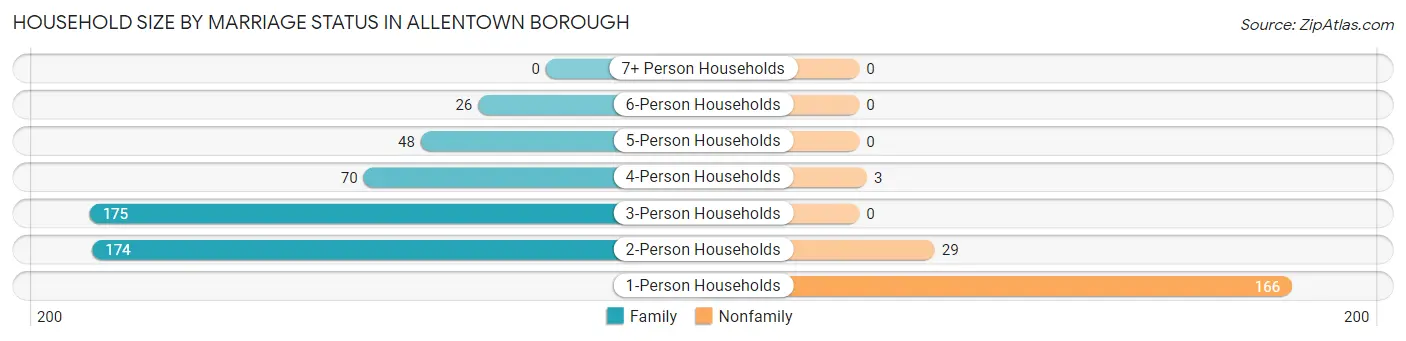
Household Size by Marriage Status in Allentown borough
Out of a total of 691 households in Allentown borough, 493 (71.4%) are family households, while 198 (28.6%) are nonfamily households. The most numerous type of family households are 3-person households, comprising 175, and the most common type of nonfamily households are 1-person households, comprising 166.
| Household Size | Family Households | Nonfamily Households |
| 1-Person Households | - | 166 (24.0%) |
| 2-Person Households | 174 (25.2%) | 29 (4.2%) |
| 3-Person Households | 175 (25.3%) | 0 (0.0%) |
| 4-Person Households | 70 (10.1%) | 3 (0.4%) |
| 5-Person Households | 48 (7.0%) | 0 (0.0%) |
| 6-Person Households | 26 (3.8%) | 0 (0.0%) |
| 7+ Person Households | 0 (0.0%) | 0 (0.0%) |
| Total | 493 (71.4%) | 198 (28.6%) |
Female Fertility in Allentown borough
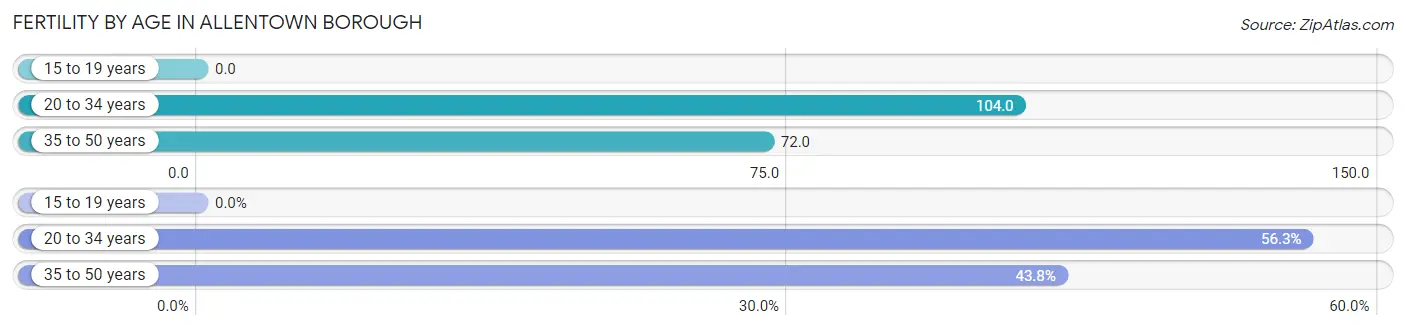
Fertility by Age in Allentown borough
Average fertility rate in Allentown borough is 73.0 births per 1,000 women. Women in the age bracket of 20 to 34 years have the highest fertility rate with 104.0 births per 1,000 women. Women in the age bracket of 20 to 34 years acount for 56.2% of all women with births.
| Age Bracket | Women with Births | Births / 1,000 Women |
| 15 to 19 years | 0 (0.0%) | 0.0 |
| 20 to 34 years | 18 (56.2%) | 104.0 |
| 35 to 50 years | 14 (43.8%) | 72.0 |
| Total | 32 (100.0%) | 73.0 |
Fertility by Age by Marriage Status in Allentown borough
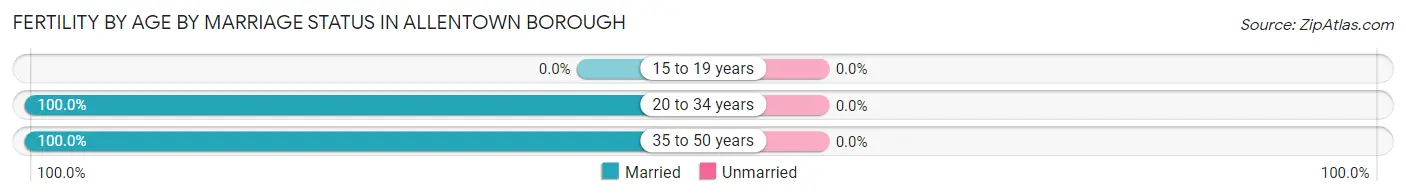
| Age Bracket | Married | Unmarried |
| 15 to 19 years | 0 (0.0%) | 0 (0.0%) |
| 20 to 34 years | 18 (100.0%) | 0 (0.0%) |
| 35 to 50 years | 14 (100.0%) | 0 (0.0%) |
| Total | 32 (100.0%) | 0 (0.0%) |
Fertility by Education in Allentown borough
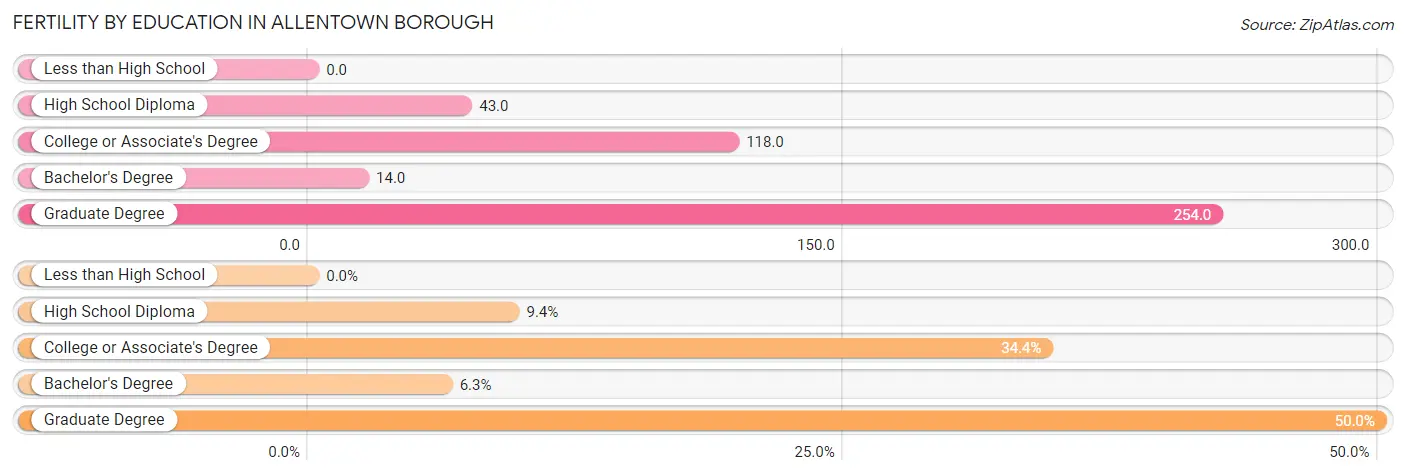
| Educational Attainment | Women with Births | Births / 1,000 Women |
| Less than High School | 0 (0.0%) | 0.0 |
| High School Diploma | 3 (9.4%) | 43.0 |
| College or Associate's Degree | 11 (34.4%) | 118.0 |
| Bachelor's Degree | 2 (6.2%) | 14.0 |
| Graduate Degree | 16 (50.0%) | 254.0 |
| Total | 32 (100.0%) | 73.0 |
Fertility by Education by Marriage Status in Allentown borough
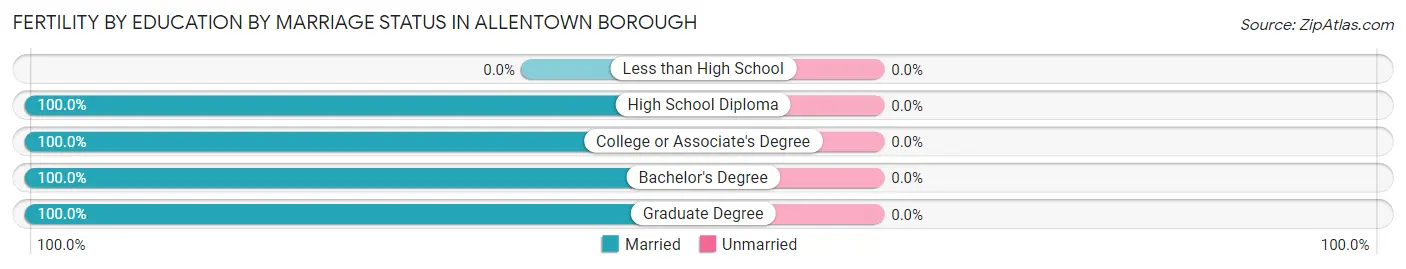
| Educational Attainment | Married | Unmarried |
| Less than High School | 0 (0.0%) | 0 (0.0%) |
| High School Diploma | 3 (100.0%) | 0 (0.0%) |
| College or Associate's Degree | 11 (100.0%) | 0 (0.0%) |
| Bachelor's Degree | 2 (100.0%) | 0 (0.0%) |
| Graduate Degree | 16 (100.0%) | 0 (0.0%) |
| Total | 32 (100.0%) | 0 (0.0%) |
Income in Allentown borough
Income Overview in Allentown borough
Per Capita Income in Allentown borough is $52,881, while median incomes of families and households are $135,078 and $113,438 respectively.
| Characteristic | Number | Measure |
| Per Capita Income | 1,817 | $52,881 |
| Median Family Income | 493 | $135,078 |
| Mean Family Income | 493 | $150,874 |
| Median Household Income | 691 | $113,438 |
| Mean Household Income | 691 | $137,311 |
| Income Deficit | 493 | $0 |
| Wage / Income Gap (%) | 1,817 | 38.03% |
| Wage / Income Gap ($) | 1,817 | 61.97¢ per $1 |
| Gini / Inequality Index | 1,817 | 0.40 |
Earnings by Sex in Allentown borough
Average Earnings in Allentown borough are $58,636, $75,865 for men and $47,014 for women, a difference of 38.0%.
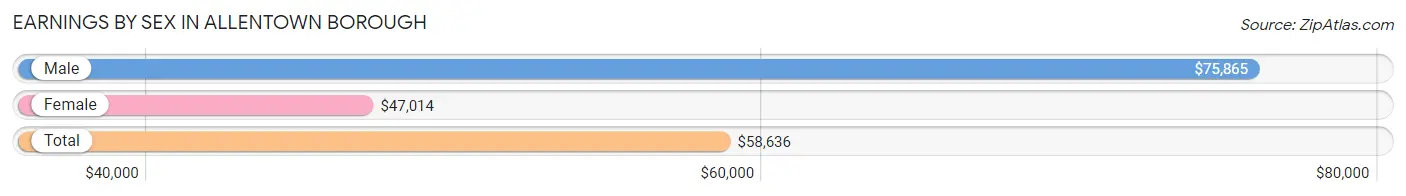
| Sex | Number | Average Earnings |
| Male | 539 (50.7%) | $75,865 |
| Female | 523 (49.2%) | $47,014 |
| Total | 1,062 (100.0%) | $58,636 |
Earnings by Sex by Income Bracket in Allentown borough
The most common earnings brackets in Allentown borough are $100,000+ for men (189 | 35.1%) and $100,000+ for women (82 | 15.7%).
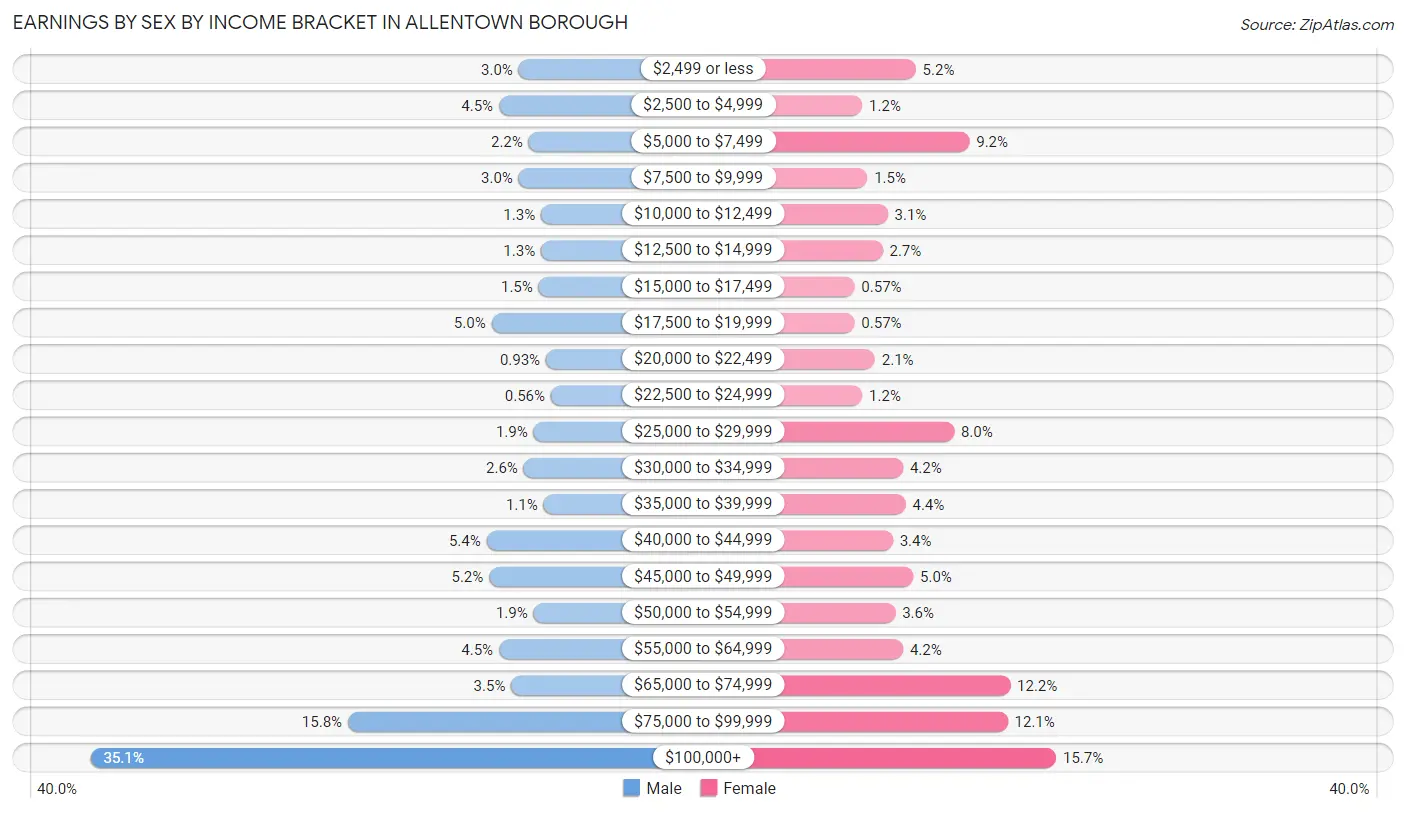
| Income | Male | Female |
| $2,499 or less | 16 (3.0%) | 27 (5.2%) |
| $2,500 to $4,999 | 24 (4.4%) | 6 (1.1%) |
| $5,000 to $7,499 | 12 (2.2%) | 48 (9.2%) |
| $7,500 to $9,999 | 16 (3.0%) | 8 (1.5%) |
| $10,000 to $12,499 | 7 (1.3%) | 16 (3.1%) |
| $12,500 to $14,999 | 7 (1.3%) | 14 (2.7%) |
| $15,000 to $17,499 | 8 (1.5%) | 3 (0.6%) |
| $17,500 to $19,999 | 27 (5.0%) | 3 (0.6%) |
| $20,000 to $22,499 | 5 (0.9%) | 11 (2.1%) |
| $22,500 to $24,999 | 3 (0.6%) | 6 (1.1%) |
| $25,000 to $29,999 | 10 (1.9%) | 42 (8.0%) |
| $30,000 to $34,999 | 14 (2.6%) | 22 (4.2%) |
| $35,000 to $39,999 | 6 (1.1%) | 23 (4.4%) |
| $40,000 to $44,999 | 29 (5.4%) | 18 (3.4%) |
| $45,000 to $49,999 | 28 (5.2%) | 26 (5.0%) |
| $50,000 to $54,999 | 10 (1.9%) | 19 (3.6%) |
| $55,000 to $64,999 | 24 (4.4%) | 22 (4.2%) |
| $65,000 to $74,999 | 19 (3.5%) | 64 (12.2%) |
| $75,000 to $99,999 | 85 (15.8%) | 63 (12.0%) |
| $100,000+ | 189 (35.1%) | 82 (15.7%) |
| Total | 539 (100.0%) | 523 (100.0%) |
Earnings by Sex by Educational Attainment in Allentown borough
Average earnings in Allentown borough are $84,792 for men and $56,250 for women, a difference of 33.7%. Men with an educational attainment of bachelor's degree enjoy the highest average annual earnings of $105,000, while those with high school diploma education earn the least with $44,615. Women with an educational attainment of graduate degree earn the most with the average annual earnings of $69,028, while those with high school diploma education have the smallest earnings of $39,000.
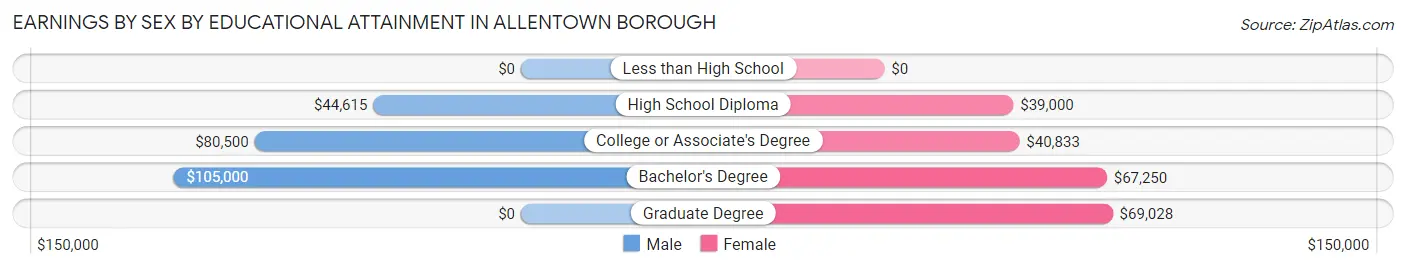
| Educational Attainment | Male Income | Female Income |
| Less than High School | - | - |
| High School Diploma | $44,615 | $39,000 |
| College or Associate's Degree | $80,500 | $40,833 |
| Bachelor's Degree | $105,000 | $67,250 |
| Graduate Degree | - | - |
| Total | $84,792 | $56,250 |
Family Income in Allentown borough
Family Income Brackets in Allentown borough
According to the Allentown borough family income data, there are 121 families falling into the $100,000 to $149,999 income range, which is the most common income bracket and makes up 24.5% of all families.
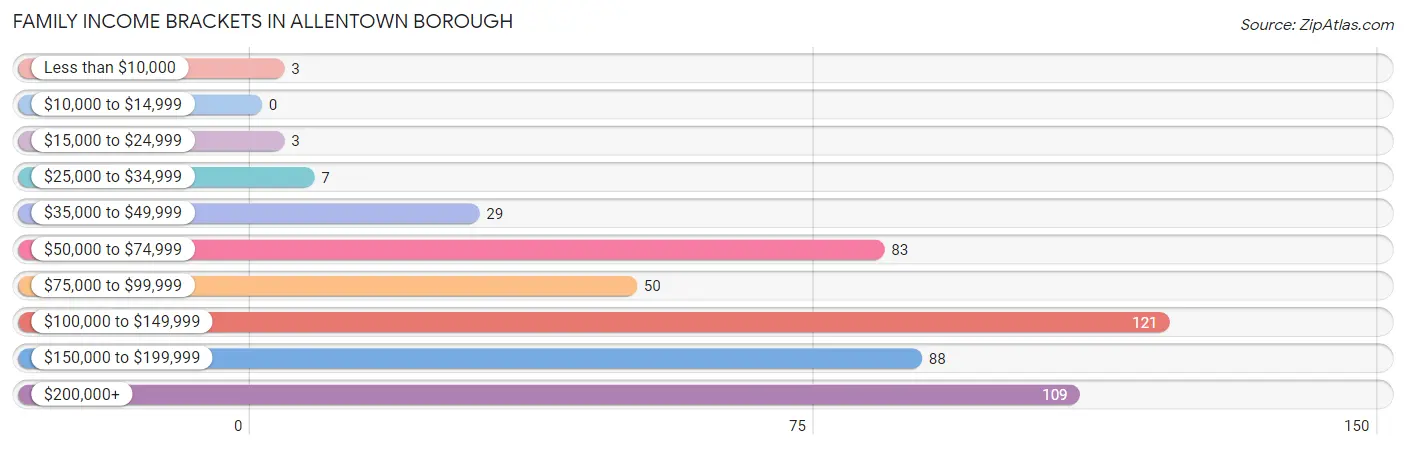
| Income Bracket | # Families | % Families |
| Less than $10,000 | 3 | 0.6% |
| $10,000 to $14,999 | 0 | 0.0% |
| $15,000 to $24,999 | 3 | 0.6% |
| $25,000 to $34,999 | 7 | 1.4% |
| $35,000 to $49,999 | 29 | 5.9% |
| $50,000 to $74,999 | 83 | 16.8% |
| $75,000 to $99,999 | 50 | 10.1% |
| $100,000 to $149,999 | 121 | 24.5% |
| $150,000 to $199,999 | 88 | 17.8% |
| $200,000+ | 109 | 22.1% |
Family Income by Famaliy Size in Allentown borough
4-person families (67 | 13.6%) account for the highest median family income in Allentown borough with $195,625 per family, while 2-person families (180 | 36.5%) have the highest median income of $54,306 per family member.
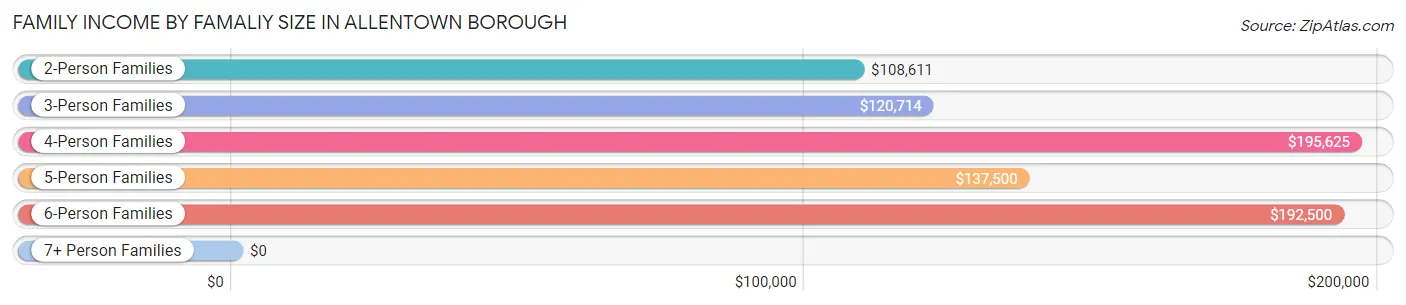
| Income Bracket | # Families | Median Income |
| 2-Person Families | 180 (36.5%) | $108,611 |
| 3-Person Families | 172 (34.9%) | $120,714 |
| 4-Person Families | 67 (13.6%) | $195,625 |
| 5-Person Families | 48 (9.7%) | $137,500 |
| 6-Person Families | 26 (5.3%) | $192,500 |
| 7+ Person Families | 0 (0.0%) | $0 |
| Total | 493 (100.0%) | $135,078 |
Family Income by Number of Earners in Allentown borough
The median family income in Allentown borough is $135,078, with families comprising 3+ earners (71) having the highest median family income of $223,750, while families with no earners (35) have the lowest median family income of $82,917, accounting for 14.4% and 7.1% of families, respectively.
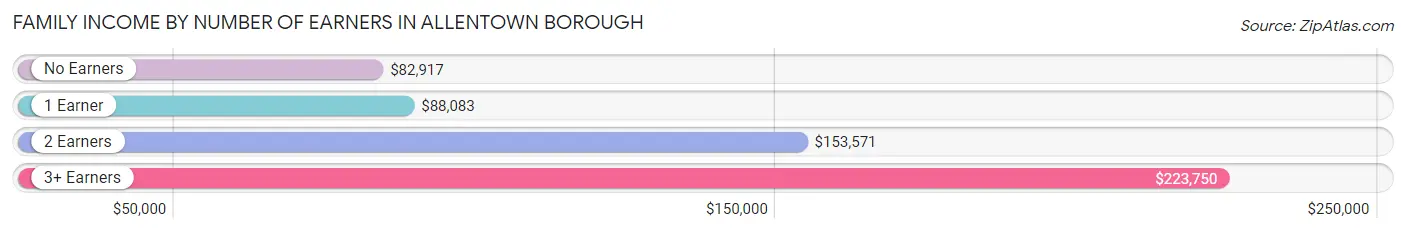
| Number of Earners | # Families | Median Income |
| No Earners | 35 (7.1%) | $82,917 |
| 1 Earner | 149 (30.2%) | $88,083 |
| 2 Earners | 238 (48.3%) | $153,571 |
| 3+ Earners | 71 (14.4%) | $223,750 |
| Total | 493 (100.0%) | $135,078 |
Household Income in Allentown borough
Household Income Brackets in Allentown borough
With 150 households falling in the category, the $100,000 to $149,999 income range is the most frequent in Allentown borough, accounting for 21.7% of all households. In contrast, only 8 households (1.2%) fall into the $10,000 to $14,999 income bracket, making it the least populous group.
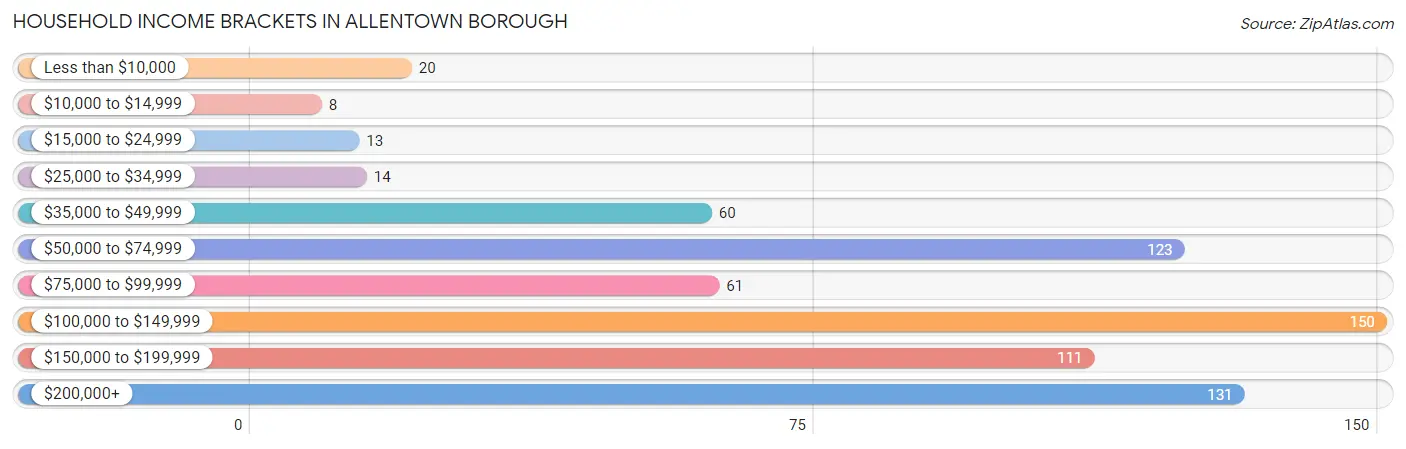
| Income Bracket | # Households | % Households |
| Less than $10,000 | 20 | 2.9% |
| $10,000 to $14,999 | 8 | 1.2% |
| $15,000 to $24,999 | 13 | 1.9% |
| $25,000 to $34,999 | 14 | 2.0% |
| $35,000 to $49,999 | 60 | 8.7% |
| $50,000 to $74,999 | 123 | 17.8% |
| $75,000 to $99,999 | 61 | 8.8% |
| $100,000 to $149,999 | 150 | 21.7% |
| $150,000 to $199,999 | 111 | 16.1% |
| $200,000+ | 131 | 19.0% |
Household Income by Householder Age in Allentown borough
The median household income in Allentown borough is $113,438, with the highest median household income of $156,875 found in the 25 to 44 years age bracket for the primary householder. A total of 194 households (28.1%) fall into this category.
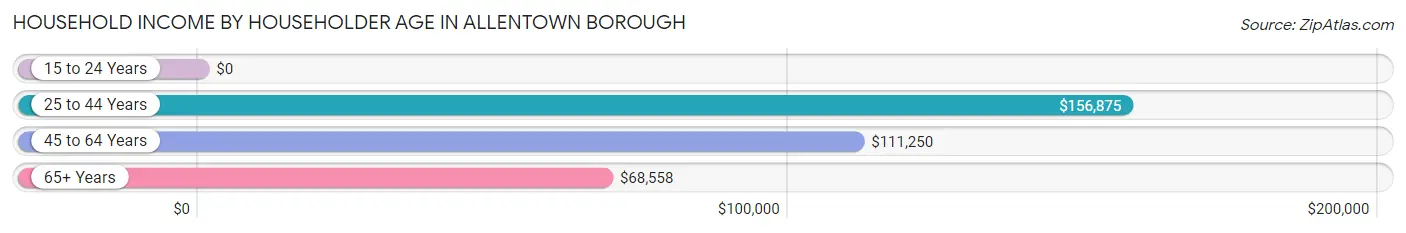
| Income Bracket | # Households | Median Income |
| 15 to 24 Years | 0 (0.0%) | $0 |
| 25 to 44 Years | 194 (28.1%) | $156,875 |
| 45 to 64 Years | 353 (51.1%) | $111,250 |
| 65+ Years | 144 (20.8%) | $68,558 |
| Total | 691 (100.0%) | $113,438 |
Poverty in Allentown borough
Income Below Poverty by Sex and Age in Allentown borough
With 2.2% poverty level for males and 4.7% for females among the residents of Allentown borough, 18 to 24 year old males and 45 to 54 year old females are the most vulnerable to poverty, with 7 males (8.3%) and 26 females (19.0%) in their respective age groups living below the poverty level.
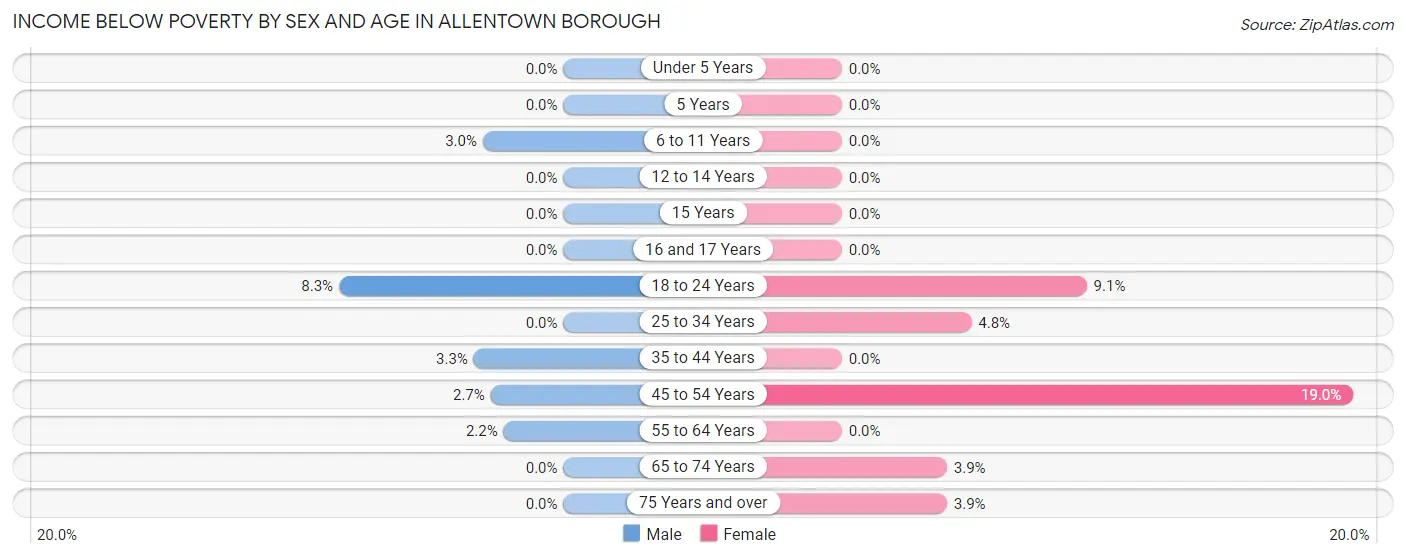
| Age Bracket | Male | Female |
| Under 5 Years | 0 (0.0%) | 0 (0.0%) |
| 5 Years | 0 (0.0%) | 0 (0.0%) |
| 6 to 11 Years | 2 (3.0%) | 0 (0.0%) |
| 12 to 14 Years | 0 (0.0%) | 0 (0.0%) |
| 15 Years | 0 (0.0%) | 0 (0.0%) |
| 16 and 17 Years | 0 (0.0%) | 0 (0.0%) |
| 18 to 24 Years | 7 (8.3%) | 8 (9.1%) |
| 25 to 34 Years | 0 (0.0%) | 5 (4.8%) |
| 35 to 44 Years | 4 (3.3%) | 0 (0.0%) |
| 45 to 54 Years | 3 (2.7%) | 26 (19.0%) |
| 55 to 64 Years | 3 (2.2%) | 0 (0.0%) |
| 65 to 74 Years | 0 (0.0%) | 3 (3.9%) |
| 75 Years and over | 0 (0.0%) | 3 (3.9%) |
| Total | 19 (2.2%) | 45 (4.7%) |
Income Above Poverty by Sex and Age in Allentown borough
According to the poverty statistics in Allentown borough, males aged under 5 years and females aged under 5 years are the age groups that are most secure financially, with 100.0% of males and 100.0% of females in these age groups living above the poverty line.
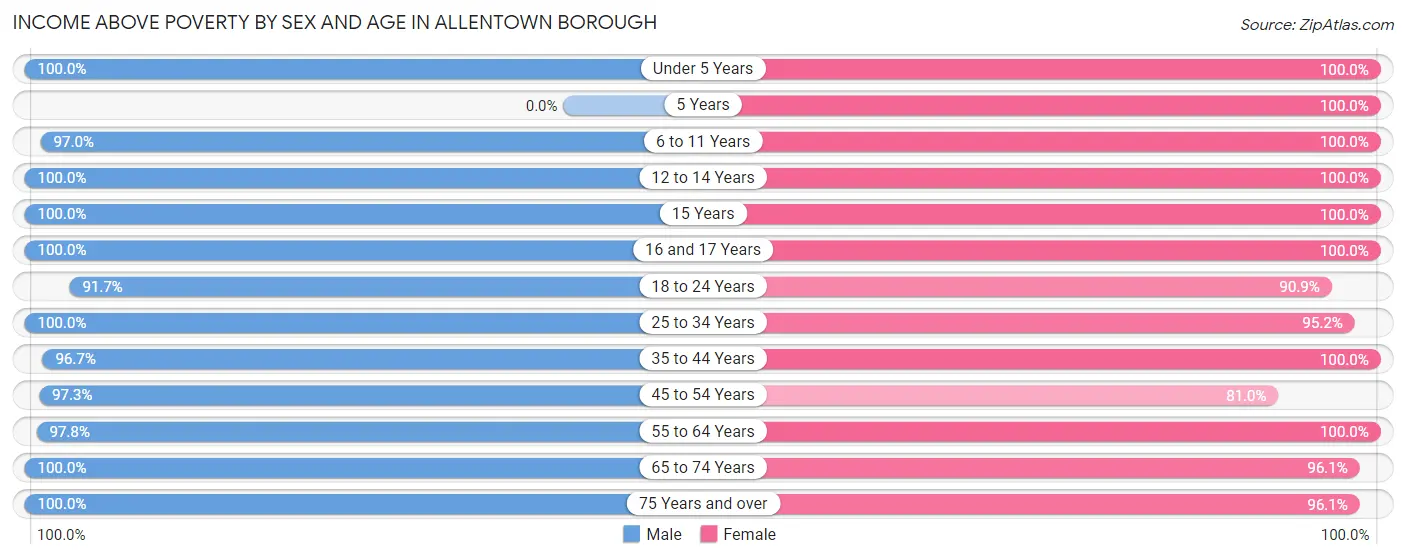
| Age Bracket | Male | Female |
| Under 5 Years | 55 (100.0%) | 50 (100.0%) |
| 5 Years | 0 (0.0%) | 14 (100.0%) |
| 6 to 11 Years | 65 (97.0%) | 58 (100.0%) |
| 12 to 14 Years | 27 (100.0%) | 25 (100.0%) |
| 15 Years | 14 (100.0%) | 8 (100.0%) |
| 16 and 17 Years | 53 (100.0%) | 44 (100.0%) |
| 18 to 24 Years | 77 (91.7%) | 80 (90.9%) |
| 25 to 34 Years | 86 (100.0%) | 99 (95.2%) |
| 35 to 44 Years | 116 (96.7%) | 127 (100.0%) |
| 45 to 54 Years | 108 (97.3%) | 111 (81.0%) |
| 55 to 64 Years | 132 (97.8%) | 144 (100.0%) |
| 65 to 74 Years | 50 (100.0%) | 74 (96.1%) |
| 75 Years and over | 62 (100.0%) | 74 (96.1%) |
| Total | 845 (97.8%) | 908 (95.3%) |
Income Below Poverty Among Married-Couple Families in Allentown borough
The poverty statistics for married-couple families in Allentown borough show that 0.8% or 3 of the total 373 families live below the poverty line. Families with 1 or 2 children have the highest poverty rate of 3.4%, comprising of 3 families. On the other hand, families with no children have the lowest poverty rate of 0.0%, which includes 0 families.
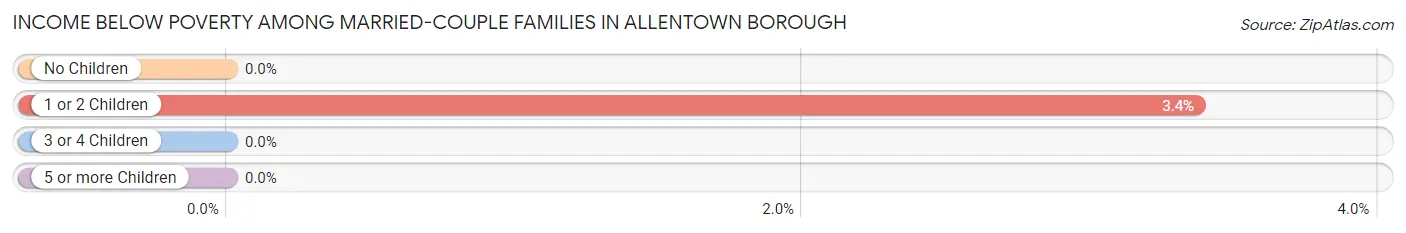
| Children | Above Poverty | Below Poverty |
| No Children | 218 (100.0%) | 0 (0.0%) |
| 1 or 2 Children | 86 (96.6%) | 3 (3.4%) |
| 3 or 4 Children | 66 (100.0%) | 0 (0.0%) |
| 5 or more Children | 0 (0.0%) | 0 (0.0%) |
| Total | 370 (99.2%) | 3 (0.8%) |
Income Below Poverty Among Single-Parent Households in Allentown borough
According to the poverty data in Allentown borough, 9.4% or 3 single-father households and 3.4% or 3 single-mother households are living below the poverty line. Among single-father households, those with no children have the highest poverty rate, with 3 households (23.1%) experiencing poverty. Likewise, among single-mother households, those with no children have the highest poverty rate, with 3 households (7.5%) falling below the poverty line.
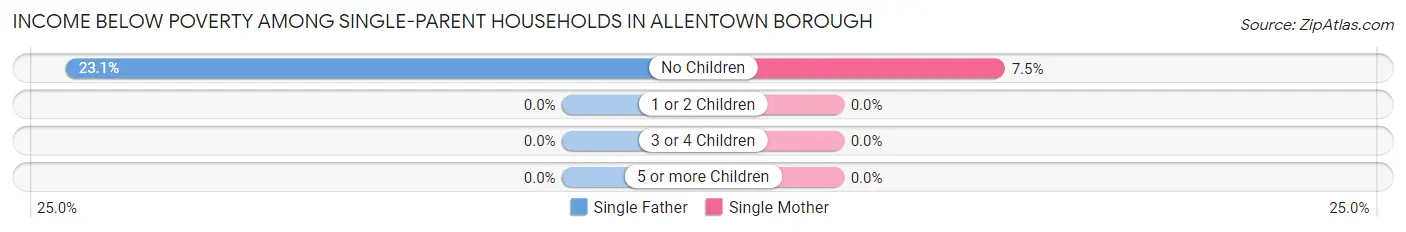
| Children | Single Father | Single Mother |
| No Children | 3 (23.1%) | 3 (7.5%) |
| 1 or 2 Children | 0 (0.0%) | 0 (0.0%) |
| 3 or 4 Children | 0 (0.0%) | 0 (0.0%) |
| 5 or more Children | 0 (0.0%) | 0 (0.0%) |
| Total | 3 (9.4%) | 3 (3.4%) |
Income Below Poverty Among Married-Couple vs Single-Parent Households in Allentown borough
The poverty data for Allentown borough shows that 3 of the married-couple family households (0.8%) and 6 of the single-parent households (5.0%) are living below the poverty level. Within the married-couple family households, those with 1 or 2 children have the highest poverty rate, with 3 households (3.4%) falling below the poverty line. Among the single-parent households, those with no children have the highest poverty rate, with 6 household (11.3%) living below poverty.
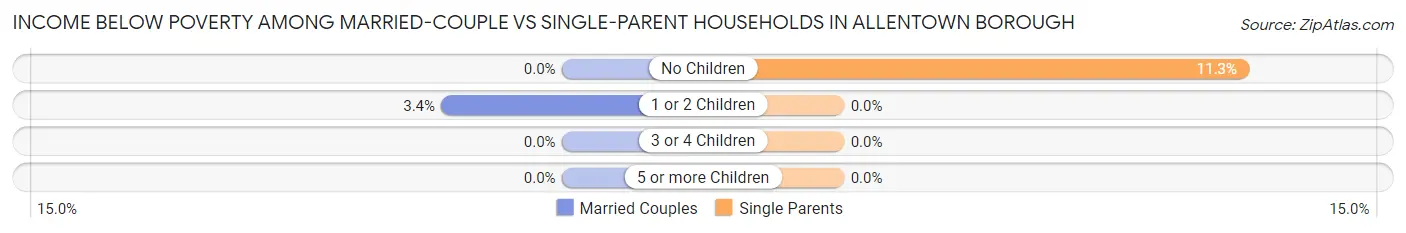
| Children | Married-Couple Families | Single-Parent Households |
| No Children | 0 (0.0%) | 6 (11.3%) |
| 1 or 2 Children | 3 (3.4%) | 0 (0.0%) |
| 3 or 4 Children | 0 (0.0%) | 0 (0.0%) |
| 5 or more Children | 0 (0.0%) | 0 (0.0%) |
| Total | 3 (0.8%) | 6 (5.0%) |
Employment Characteristics in Allentown borough
Employment by Class of Employer in Allentown borough
Among the 975 employed individuals in Allentown borough, private company employees (642 | 65.8%), local government employees (107 | 11.0%), and state government employees (79 | 8.1%) make up the most common classes of employment.
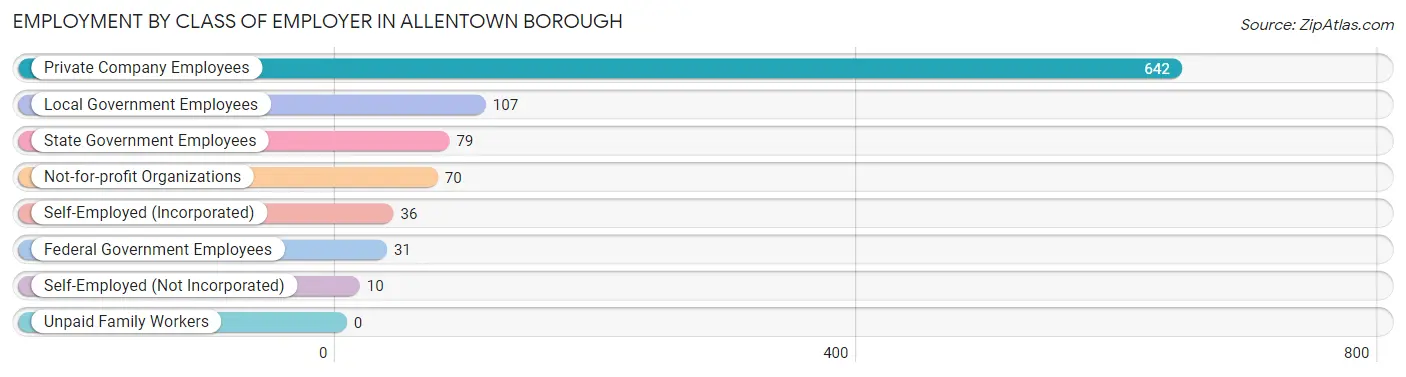
| Employer Class | # Employees | % Employees |
| Private Company Employees | 642 | 65.8% |
| Self-Employed (Incorporated) | 36 | 3.7% |
| Self-Employed (Not Incorporated) | 10 | 1.0% |
| Not-for-profit Organizations | 70 | 7.2% |
| Local Government Employees | 107 | 11.0% |
| State Government Employees | 79 | 8.1% |
| Federal Government Employees | 31 | 3.2% |
| Unpaid Family Workers | 0 | 0.0% |
| Total | 975 | 100.0% |
Employment Status by Age in Allentown borough
According to the labor force statistics for Allentown borough, out of the total population over 16 years of age (1,499), 70.4% or 1,055 individuals are in the labor force, with 4.7% or 50 of them unemployed. The age group with the highest labor force participation rate is 25 to 29 years, with 100.0% or 68 individuals in the labor force. Within the labor force, the 16 to 19 years age range has the highest percentage of unemployed individuals, with 16.7% or 7 of them being unemployed.
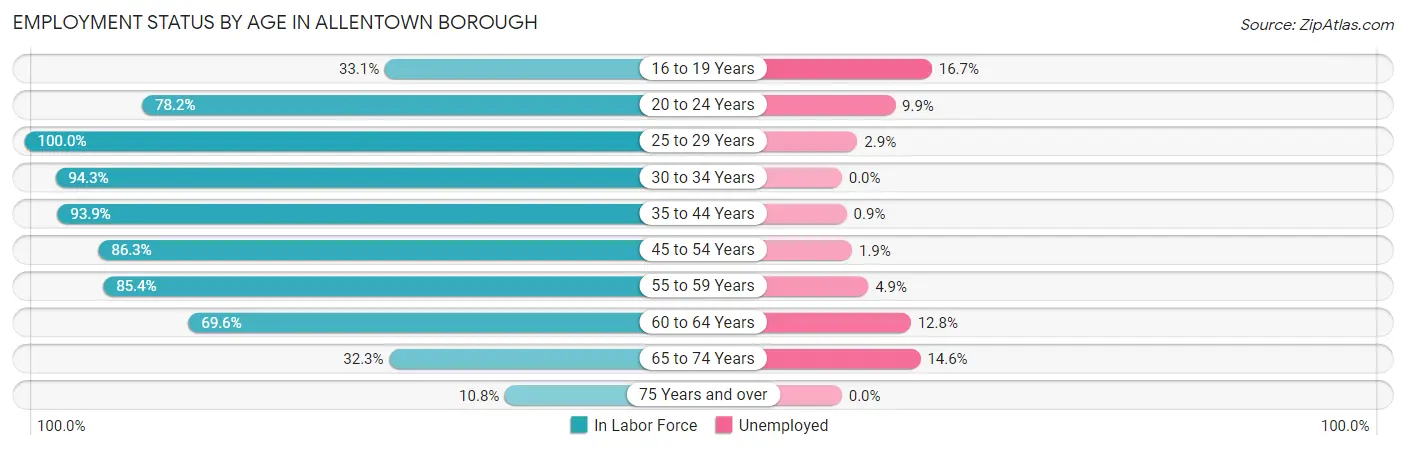
| Age Bracket | In Labor Force | Unemployed |
| 16 to 19 Years | 42 (33.1%) | 7 (16.7%) |
| 20 to 24 Years | 111 (78.2%) | 11 (9.9%) |
| 25 to 29 Years | 68 (100.0%) | 2 (2.9%) |
| 30 to 34 Years | 115 (94.3%) | 0 (0.0%) |
| 35 to 44 Years | 232 (93.9%) | 2 (0.9%) |
| 45 to 54 Years | 214 (86.3%) | 4 (1.9%) |
| 55 to 59 Years | 123 (85.4%) | 6 (4.9%) |
| 60 to 64 Years | 94 (69.6%) | 12 (12.8%) |
| 65 to 74 Years | 41 (32.3%) | 6 (14.6%) |
| 75 Years and over | 15 (10.8%) | 0 (0.0%) |
| Total | 1,055 (70.4%) | 50 (4.7%) |
Employment Status by Educational Attainment in Allentown borough
According to labor force statistics for Allentown borough, 87.8% of individuals (846) out of the total population between 25 and 64 years of age (964) are in the labor force, with 3.1% or 26 of them being unemployed. The group with the highest labor force participation rate are those with the educational attainment of bachelor's degree or higher, with 90.3% or 482 individuals in the labor force. Within the labor force, individuals with bachelor's degree or higher education have the highest percentage of unemployment, with 5.0% or 24 of them being unemployed.
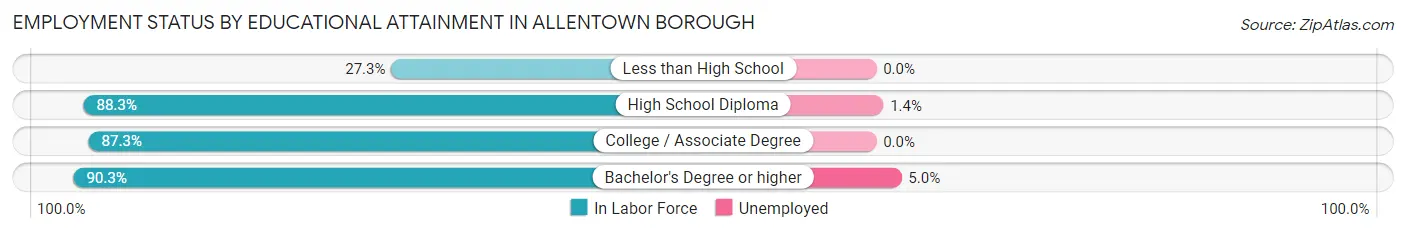
| Educational Attainment | In Labor Force | Unemployed |
| Less than High School | 6 (27.3%) | 0 (0.0%) |
| High School Diploma | 144 (88.3%) | 2 (1.4%) |
| College / Associate Degree | 214 (87.3%) | 0 (0.0%) |
| Bachelor's Degree or higher | 482 (90.3%) | 27 (5.0%) |
| Total | 846 (87.8%) | 30 (3.1%) |
Employment Occupations by Sex in Allentown borough
Management, Business, Science and Arts Occupations
The most common Management, Business, Science and Arts occupations in Allentown borough are Community & Social Service (183 | 18.2%), Education Instruction & Library (119 | 11.8%), Management (87 | 8.7%), Health Diagnosing & Treating (87 | 8.7%), and Business & Financial (62 | 6.2%).
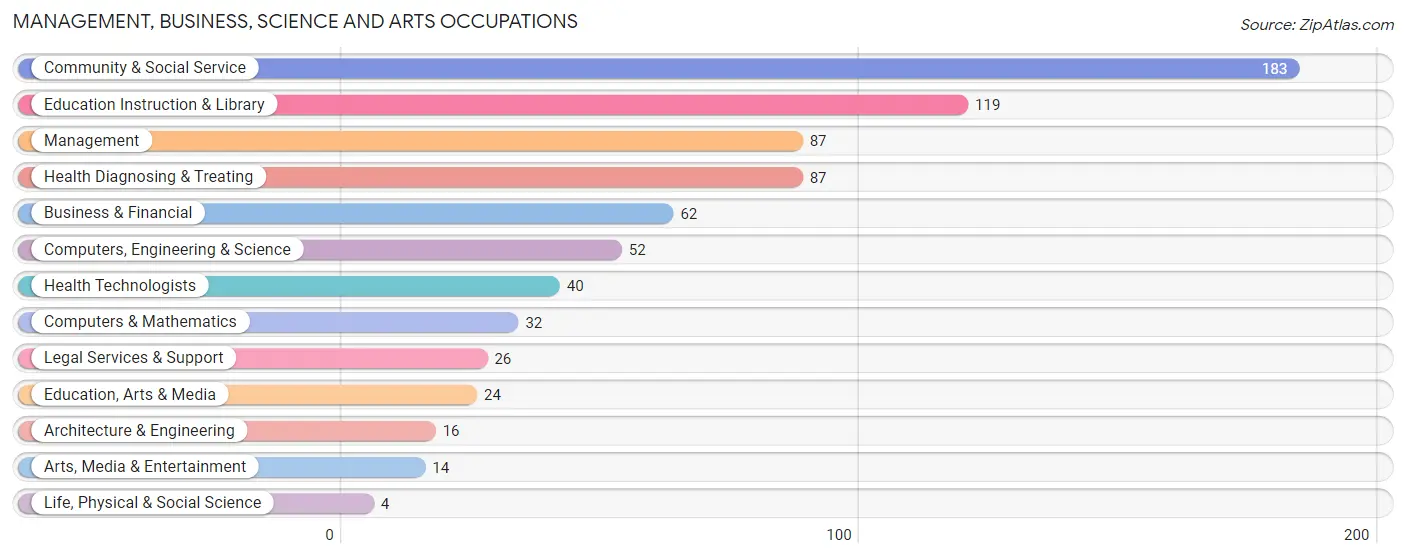
Management, Business, Science and Arts Occupations by Sex
Within the Management, Business, Science and Arts occupations in Allentown borough, the most male-oriented occupations are Computers & Mathematics (93.8%), Computers, Engineering & Science (82.7%), and Architecture & Engineering (81.2%), while the most female-oriented occupations are Life, Physical & Social Science (100.0%), Education, Arts & Media (91.7%), and Legal Services & Support (80.8%).
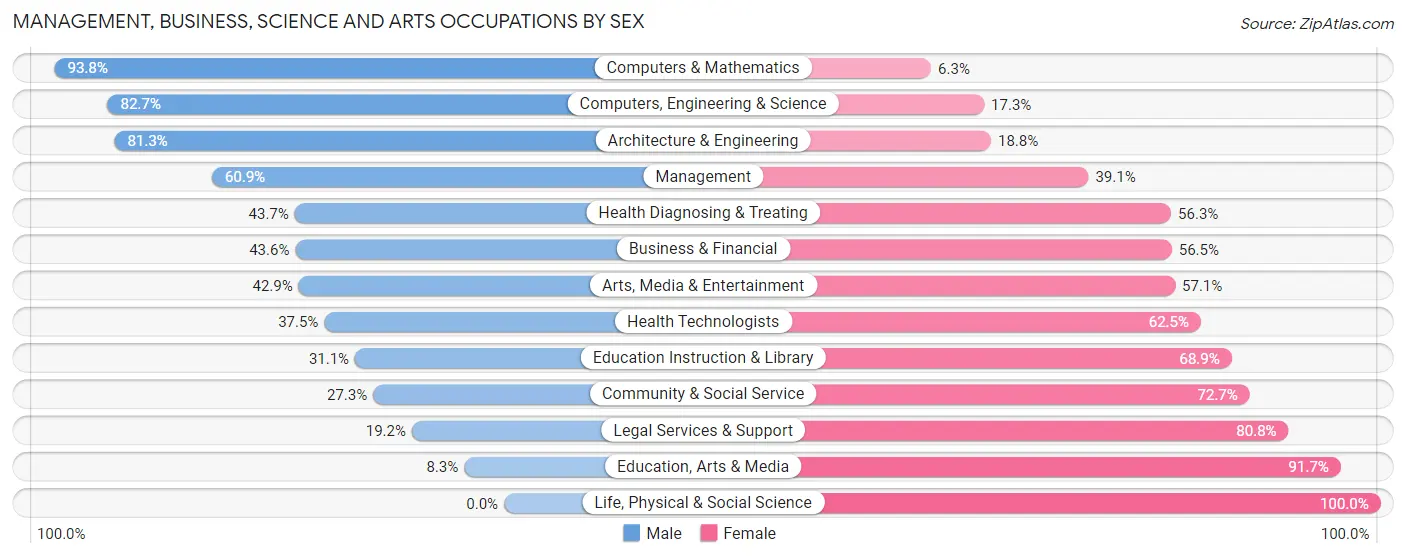
| Occupation | Male | Female |
| Management | 53 (60.9%) | 34 (39.1%) |
| Business & Financial | 27 (43.5%) | 35 (56.5%) |
| Computers, Engineering & Science | 43 (82.7%) | 9 (17.3%) |
| Computers & Mathematics | 30 (93.8%) | 2 (6.2%) |
| Architecture & Engineering | 13 (81.2%) | 3 (18.8%) |
| Life, Physical & Social Science | 0 (0.0%) | 4 (100.0%) |
| Community & Social Service | 50 (27.3%) | 133 (72.7%) |
| Education, Arts & Media | 2 (8.3%) | 22 (91.7%) |
| Legal Services & Support | 5 (19.2%) | 21 (80.8%) |
| Education Instruction & Library | 37 (31.1%) | 82 (68.9%) |
| Arts, Media & Entertainment | 6 (42.9%) | 8 (57.1%) |
| Health Diagnosing & Treating | 38 (43.7%) | 49 (56.3%) |
| Health Technologists | 15 (37.5%) | 25 (62.5%) |
| Total (Category) | 211 (44.8%) | 260 (55.2%) |
| Total (Overall) | 515 (51.2%) | 490 (48.8%) |
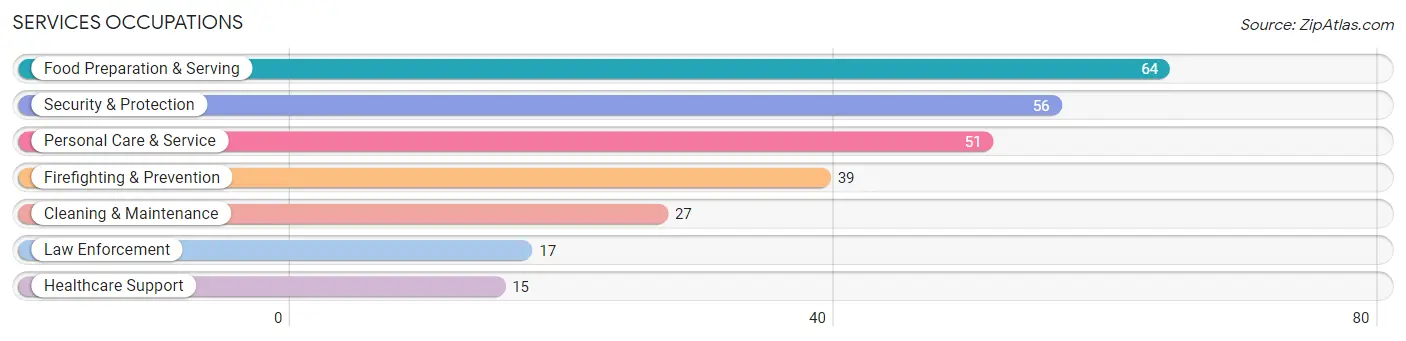
Services Occupations
The most common Services occupations in Allentown borough are Food Preparation & Serving (64 | 6.4%), Security & Protection (56 | 5.6%), Personal Care & Service (51 | 5.1%), Firefighting & Prevention (39 | 3.9%), and Cleaning & Maintenance (27 | 2.7%).
Services Occupations by Sex
Within the Services occupations in Allentown borough, the most male-oriented occupations are Law Enforcement (100.0%), Security & Protection (89.3%), and Firefighting & Prevention (84.6%), while the most female-oriented occupations are Food Preparation & Serving (73.4%), Healthcare Support (73.3%), and Personal Care & Service (45.1%).
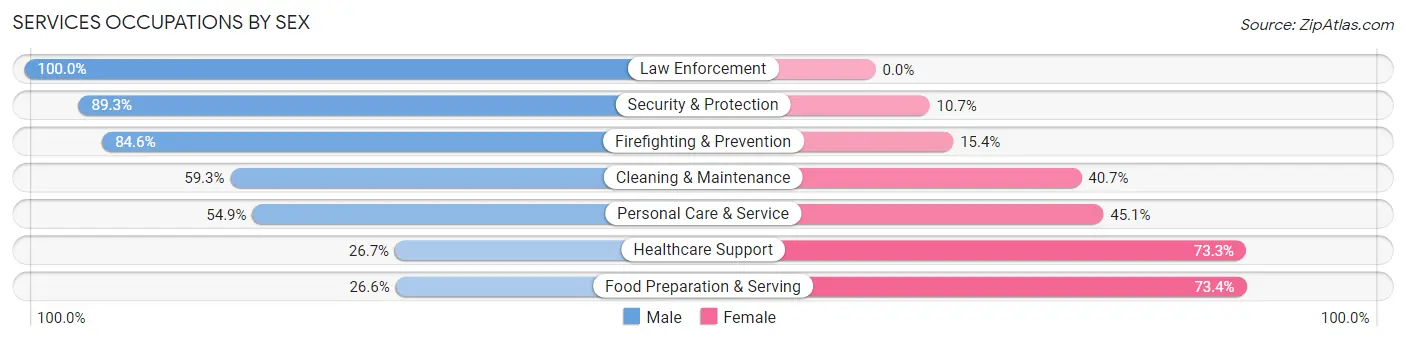
| Occupation | Male | Female |
| Healthcare Support | 4 (26.7%) | 11 (73.3%) |
| Security & Protection | 50 (89.3%) | 6 (10.7%) |
| Firefighting & Prevention | 33 (84.6%) | 6 (15.4%) |
| Law Enforcement | 17 (100.0%) | 0 (0.0%) |
| Food Preparation & Serving | 17 (26.6%) | 47 (73.4%) |
| Cleaning & Maintenance | 16 (59.3%) | 11 (40.7%) |
| Personal Care & Service | 28 (54.9%) | 23 (45.1%) |
| Total (Category) | 115 (54.0%) | 98 (46.0%) |
| Total (Overall) | 515 (51.2%) | 490 (48.8%) |
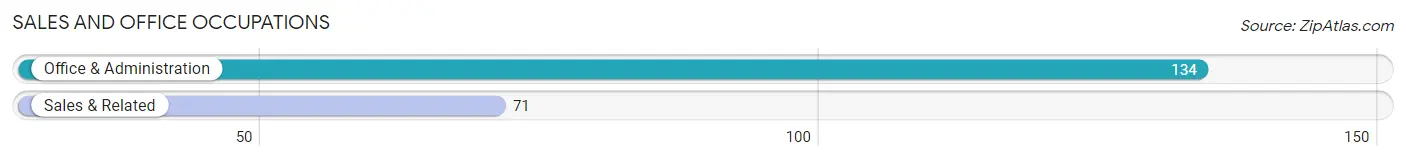
Sales and Office Occupations
The most common Sales and Office occupations in Allentown borough are Office & Administration (134 | 13.3%), and Sales & Related (71 | 7.1%).
Sales and Office Occupations by Sex
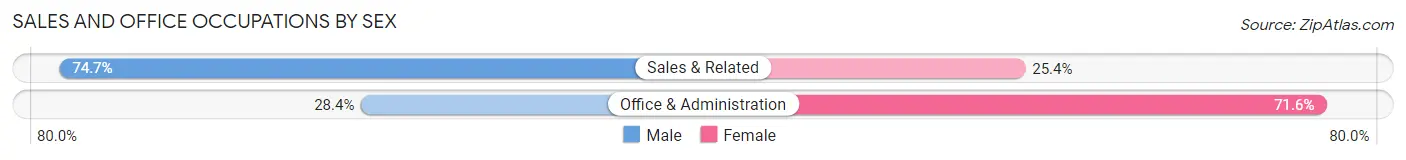
| Occupation | Male | Female |
| Sales & Related | 53 (74.7%) | 18 (25.4%) |
| Office & Administration | 38 (28.4%) | 96 (71.6%) |
| Total (Category) | 91 (44.4%) | 114 (55.6%) |
| Total (Overall) | 515 (51.2%) | 490 (48.8%) |
Natural Resources, Construction and Maintenance Occupations
The most common Natural Resources, Construction and Maintenance occupations in Allentown borough are Construction & Extraction (30 | 3.0%), Installation, Maintenance & Repair (26 | 2.6%), and Farming, Fishing & Forestry (3 | 0.3%).
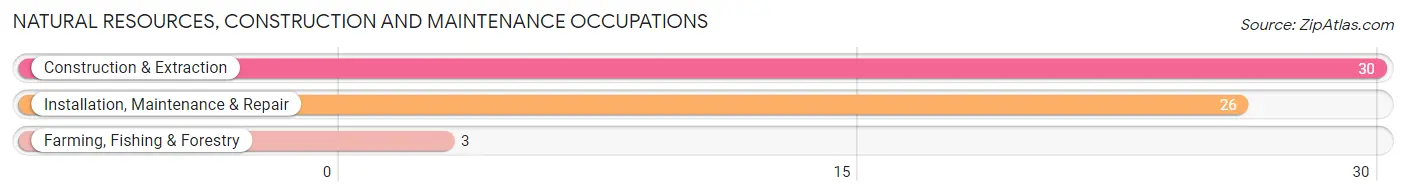
Natural Resources, Construction and Maintenance Occupations by Sex

| Occupation | Male | Female |
| Farming, Fishing & Forestry | 0 (0.0%) | 3 (100.0%) |
| Construction & Extraction | 30 (100.0%) | 0 (0.0%) |
| Installation, Maintenance & Repair | 26 (100.0%) | 0 (0.0%) |
| Total (Category) | 56 (94.9%) | 3 (5.1%) |
| Total (Overall) | 515 (51.2%) | 490 (48.8%) |
Production, Transportation and Moving Occupations
The most common Production, Transportation and Moving occupations in Allentown borough are Transportation (28 | 2.8%), Material Moving (21 | 2.1%), and Production (8 | 0.8%).
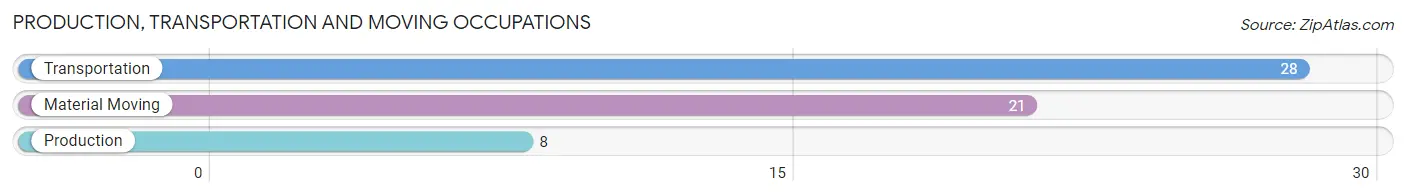
Production, Transportation and Moving Occupations by Sex
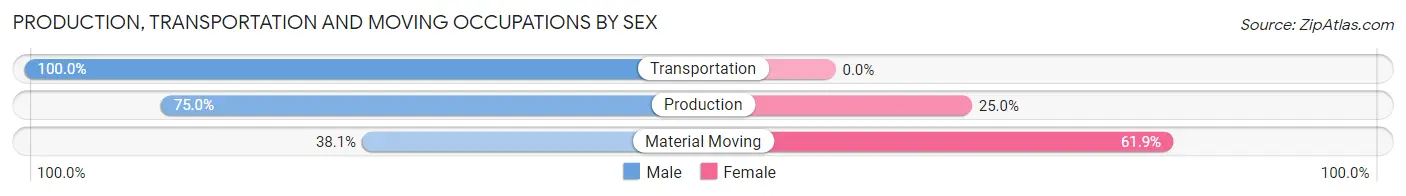
| Occupation | Male | Female |
| Production | 6 (75.0%) | 2 (25.0%) |
| Transportation | 28 (100.0%) | 0 (0.0%) |
| Material Moving | 8 (38.1%) | 13 (61.9%) |
| Total (Category) | 42 (73.7%) | 15 (26.3%) |
| Total (Overall) | 515 (51.2%) | 490 (48.8%) |
Employment Industries by Sex in Allentown borough
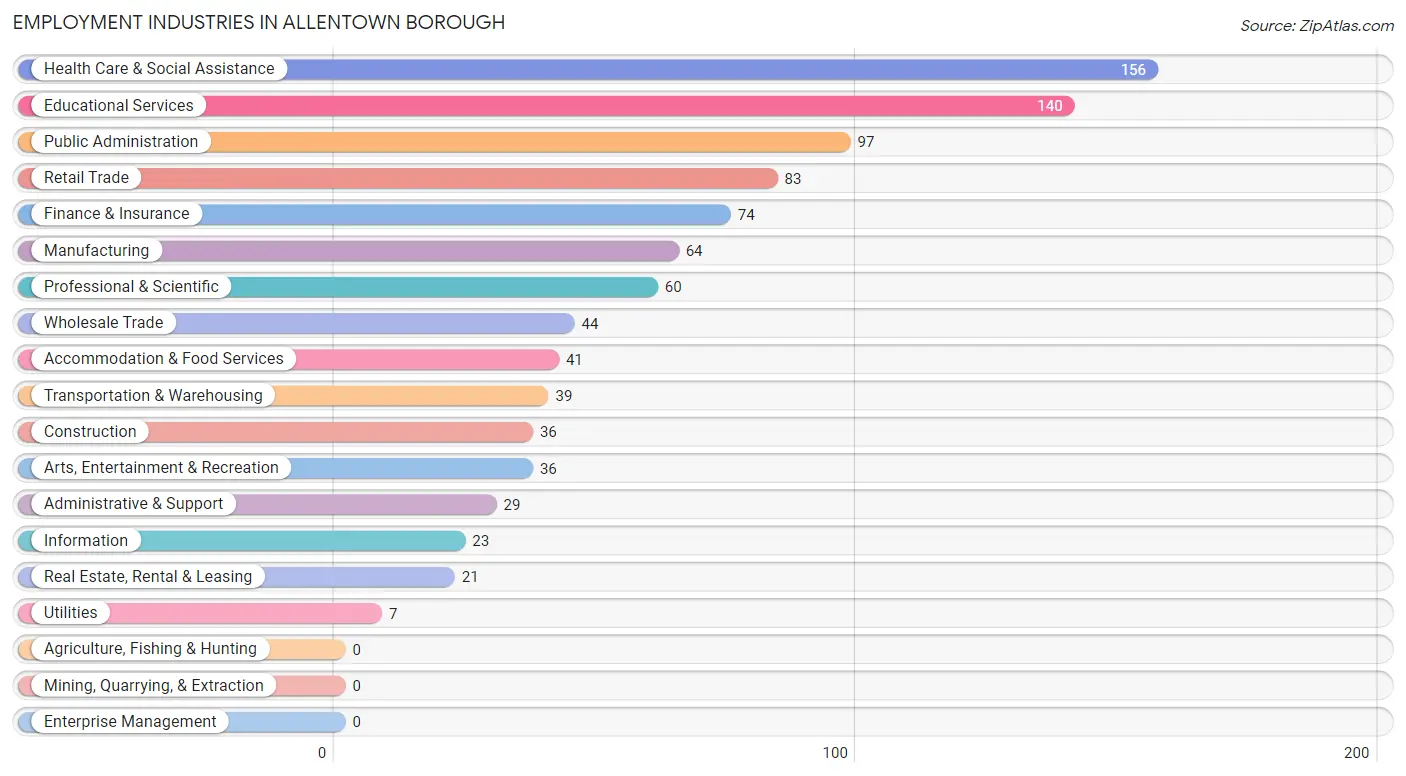
Employment Industries in Allentown borough
The major employment industries in Allentown borough include Health Care & Social Assistance (156 | 15.5%), Educational Services (140 | 13.9%), Public Administration (97 | 9.7%), Retail Trade (83 | 8.3%), and Finance & Insurance (74 | 7.4%).
Employment Industries by Sex in Allentown borough
The Allentown borough industries that see more men than women are Utilities (100.0%), Construction (88.9%), and Real Estate, Rental & Leasing (85.7%), whereas the industries that tend to have a higher number of women are Professional & Scientific (76.7%), Educational Services (71.4%), and Accommodation & Food Services (65.8%).
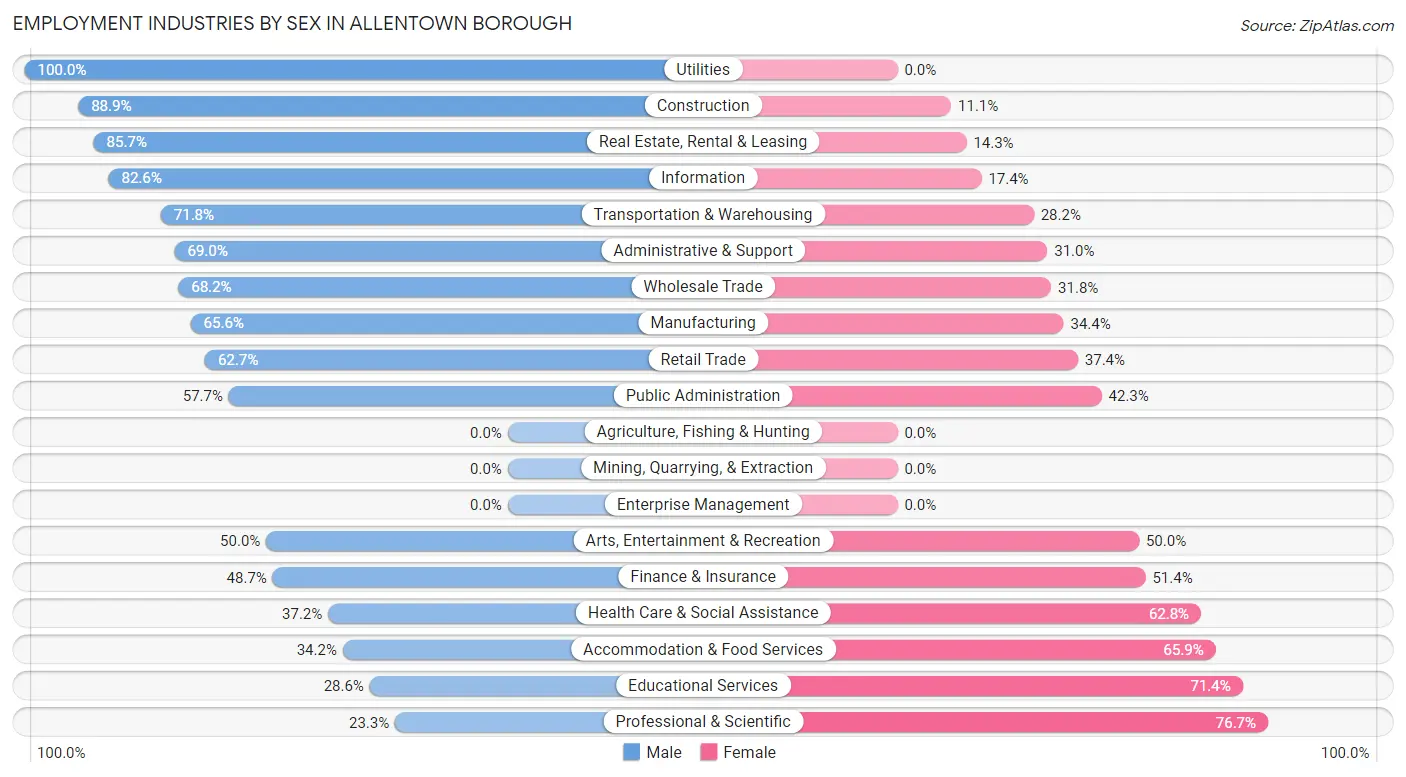
| Industry | Male | Female |
| Agriculture, Fishing & Hunting | 0 (0.0%) | 0 (0.0%) |
| Mining, Quarrying, & Extraction | 0 (0.0%) | 0 (0.0%) |
| Construction | 32 (88.9%) | 4 (11.1%) |
| Manufacturing | 42 (65.6%) | 22 (34.4%) |
| Wholesale Trade | 30 (68.2%) | 14 (31.8%) |
| Retail Trade | 52 (62.6%) | 31 (37.3%) |
| Transportation & Warehousing | 28 (71.8%) | 11 (28.2%) |
| Utilities | 7 (100.0%) | 0 (0.0%) |
| Information | 19 (82.6%) | 4 (17.4%) |
| Finance & Insurance | 36 (48.6%) | 38 (51.3%) |
| Real Estate, Rental & Leasing | 18 (85.7%) | 3 (14.3%) |
| Professional & Scientific | 14 (23.3%) | 46 (76.7%) |
| Enterprise Management | 0 (0.0%) | 0 (0.0%) |
| Administrative & Support | 20 (69.0%) | 9 (31.0%) |
| Educational Services | 40 (28.6%) | 100 (71.4%) |
| Health Care & Social Assistance | 58 (37.2%) | 98 (62.8%) |
| Arts, Entertainment & Recreation | 18 (50.0%) | 18 (50.0%) |
| Accommodation & Food Services | 14 (34.2%) | 27 (65.8%) |
| Public Administration | 56 (57.7%) | 41 (42.3%) |
| Total | 515 (51.2%) | 490 (48.8%) |
Education in Allentown borough
School Enrollment in Allentown borough
The most common levels of schooling among the 446 students in Allentown borough are high school (132 | 29.6%), middle school (81 | 18.2%), and college / undergraduate (81 | 18.2%).
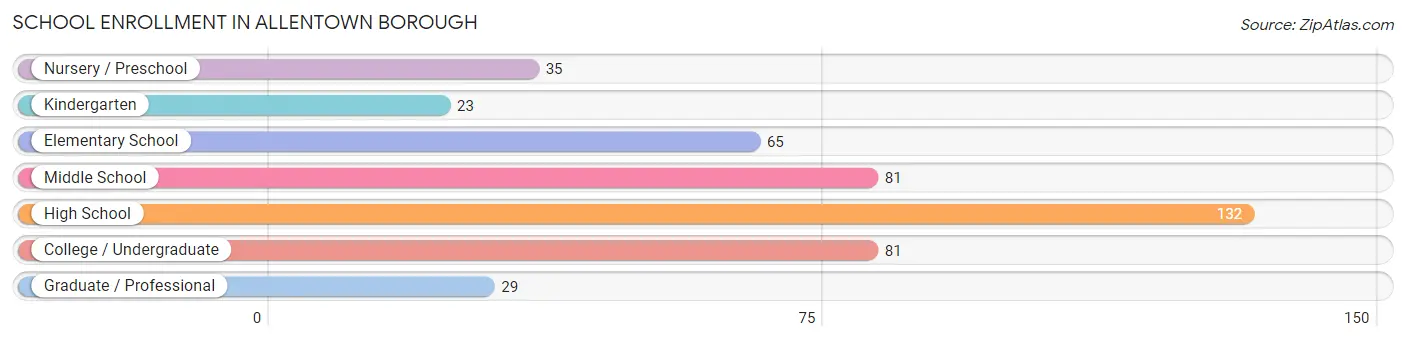
| School Level | # Students | % Students |
| Nursery / Preschool | 35 | 7.9% |
| Kindergarten | 23 | 5.2% |
| Elementary School | 65 | 14.6% |
| Middle School | 81 | 18.2% |
| High School | 132 | 29.6% |
| College / Undergraduate | 81 | 18.2% |
| Graduate / Professional | 29 | 6.5% |
| Total | 446 | 100.0% |
School Enrollment by Age by Funding Source in Allentown borough
Out of a total of 446 students who are enrolled in schools in Allentown borough, 76 (17.0%) attend a private institution, while the remaining 370 (83.0%) are enrolled in public schools. The age group of 20 to 24 year olds has the highest likelihood of being enrolled in private schools, with 28 (50.0% in the age bracket) enrolled. Conversely, the age group of 15 to 17 year olds has the lowest likelihood of being enrolled in a private school, with 116 (97.5% in the age bracket) attending a public institution.
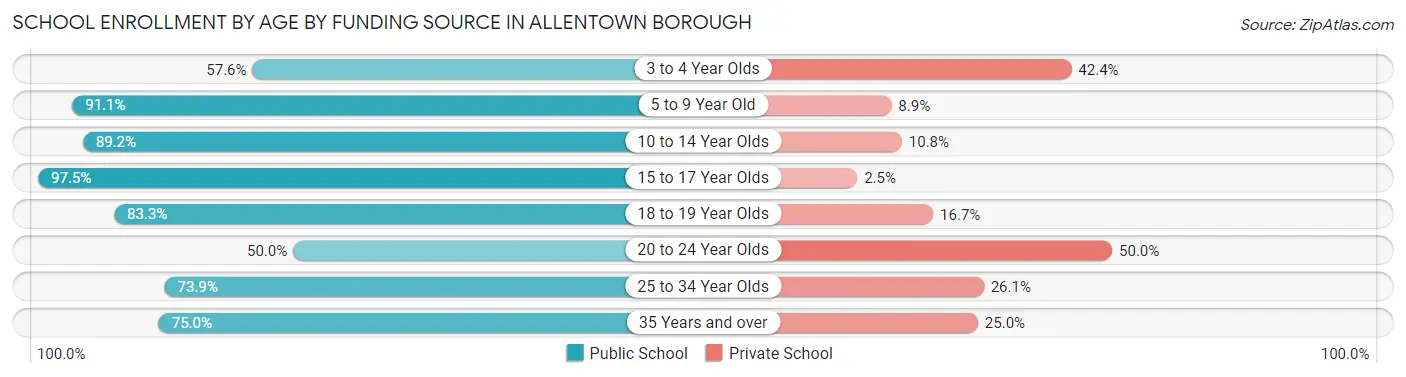
| Age Bracket | Public School | Private School |
| 3 to 4 Year Olds | 19 (57.6%) | 14 (42.4%) |
| 5 to 9 Year Old | 82 (91.1%) | 8 (8.9%) |
| 10 to 14 Year Olds | 74 (89.2%) | 9 (10.8%) |
| 15 to 17 Year Olds | 116 (97.5%) | 3 (2.5%) |
| 18 to 19 Year Olds | 25 (83.3%) | 5 (16.7%) |
| 20 to 24 Year Olds | 28 (50.0%) | 28 (50.0%) |
| 25 to 34 Year Olds | 17 (73.9%) | 6 (26.1%) |
| 35 Years and over | 9 (75.0%) | 3 (25.0%) |
| Total | 370 (83.0%) | 76 (17.0%) |
Educational Attainment by Field of Study in Allentown borough
Business (142 | 20.1%), education (97 | 13.7%), social sciences (86 | 12.2%), communications (63 | 8.9%), and psychology (48 | 6.8%) are the most common fields of study among 707 individuals in Allentown borough who have obtained a bachelor's degree or higher.

| Field of Study | # Graduates | % Graduates |
| Computers & Mathematics | 22 | 3.1% |
| Bio, Nature & Agricultural | 32 | 4.5% |
| Physical & Health Sciences | 23 | 3.3% |
| Psychology | 48 | 6.8% |
| Social Sciences | 86 | 12.2% |
| Engineering | 22 | 3.1% |
| Multidisciplinary Studies | 0 | 0.0% |
| Science & Technology | 33 | 4.7% |
| Business | 142 | 20.1% |
| Education | 97 | 13.7% |
| Literature & Languages | 38 | 5.4% |
| Liberal Arts & History | 39 | 5.5% |
| Visual & Performing Arts | 14 | 2.0% |
| Communications | 63 | 8.9% |
| Arts & Humanities | 48 | 6.8% |
| Total | 707 | 100.0% |
Transportation & Commute in Allentown borough
Vehicle Availability by Sex in Allentown borough
The most prevalent vehicle ownership categories in Allentown borough are males with 2 vehicles (236, accounting for 47.2%) and females with 2 vehicles (200, making up 49.7%).
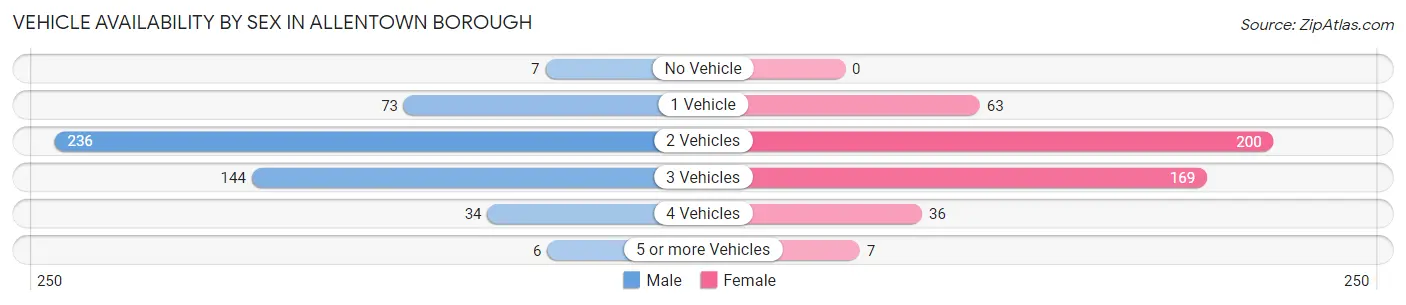
| Vehicles Available | Male | Female |
| No Vehicle | 7 (1.4%) | 0 (0.0%) |
| 1 Vehicle | 73 (14.6%) | 63 (13.3%) |
| 2 Vehicles | 236 (47.2%) | 200 (42.1%) |
| 3 Vehicles | 144 (28.8%) | 169 (35.6%) |
| 4 Vehicles | 34 (6.8%) | 36 (7.6%) |
| 5 or more Vehicles | 6 (1.2%) | 7 (1.5%) |
| Total | 500 (100.0%) | 475 (100.0%) |
Commute Time in Allentown borough
The most frequently occuring commute durations in Allentown borough are 30 to 34 minutes (184 commuters, 21.8%), 20 to 24 minutes (126 commuters, 14.9%), and 45 to 59 minutes (102 commuters, 12.1%).
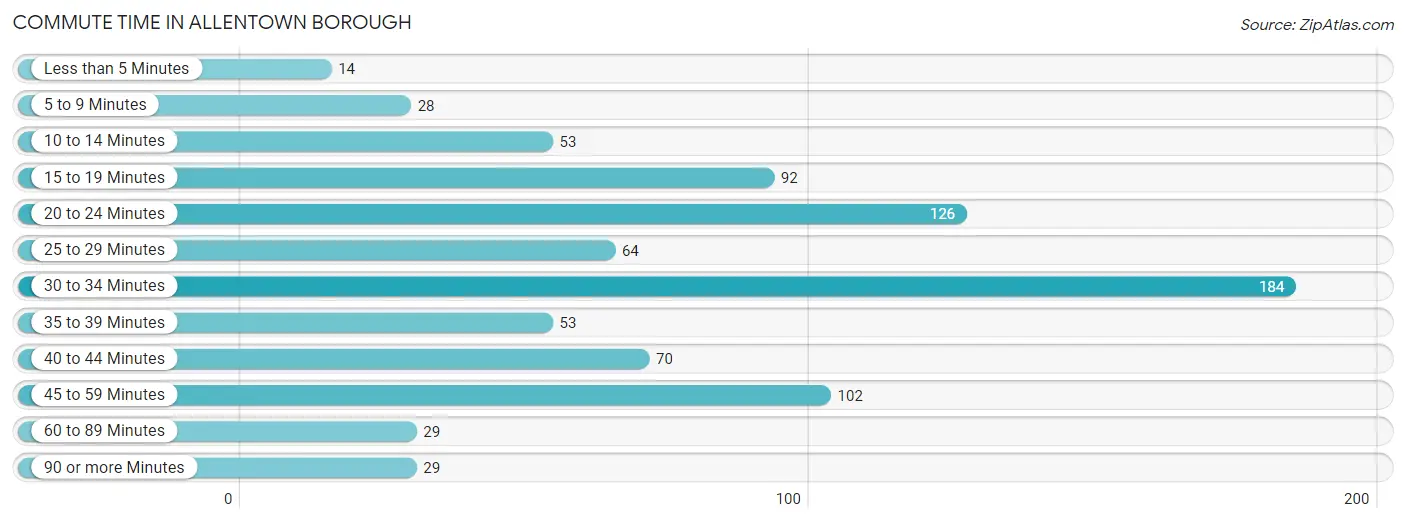
| Commute Time | # Commuters | % Commuters |
| Less than 5 Minutes | 14 | 1.7% |
| 5 to 9 Minutes | 28 | 3.3% |
| 10 to 14 Minutes | 53 | 6.3% |
| 15 to 19 Minutes | 92 | 10.9% |
| 20 to 24 Minutes | 126 | 14.9% |
| 25 to 29 Minutes | 64 | 7.6% |
| 30 to 34 Minutes | 184 | 21.8% |
| 35 to 39 Minutes | 53 | 6.3% |
| 40 to 44 Minutes | 70 | 8.3% |
| 45 to 59 Minutes | 102 | 12.1% |
| 60 to 89 Minutes | 29 | 3.4% |
| 90 or more Minutes | 29 | 3.4% |
Commute Time by Sex in Allentown borough
The most common commute times in Allentown borough are 30 to 34 minutes (95 commuters, 21.6%) for males and 30 to 34 minutes (89 commuters, 22.0%) for females.
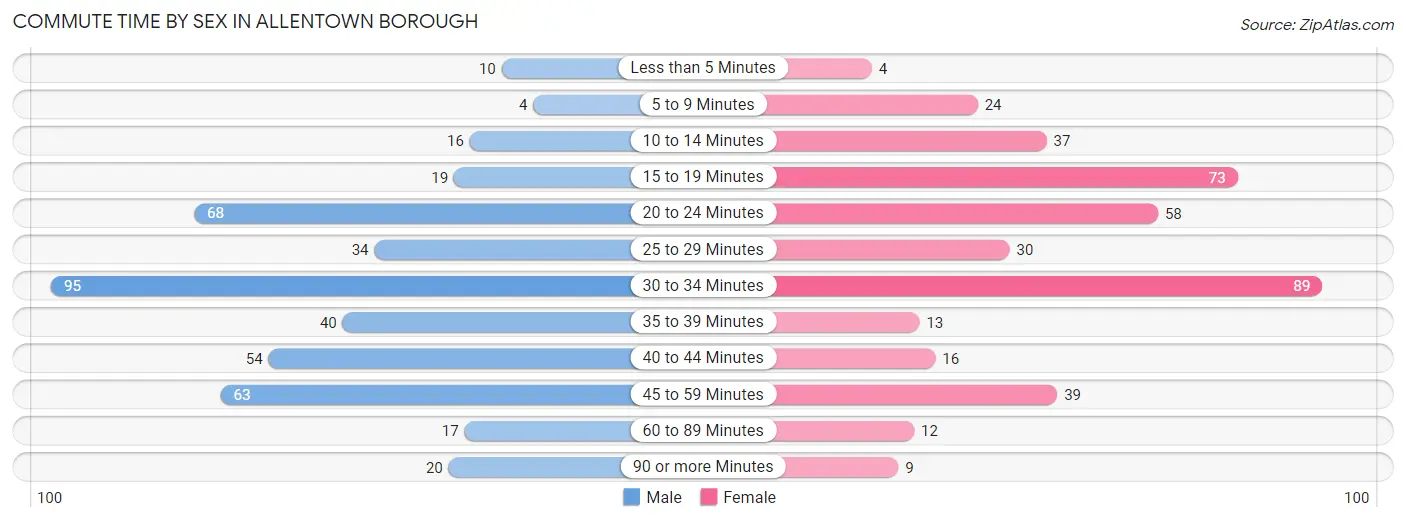
| Commute Time | Male | Female |
| Less than 5 Minutes | 10 (2.3%) | 4 (1.0%) |
| 5 to 9 Minutes | 4 (0.9%) | 24 (5.9%) |
| 10 to 14 Minutes | 16 (3.6%) | 37 (9.2%) |
| 15 to 19 Minutes | 19 (4.3%) | 73 (18.1%) |
| 20 to 24 Minutes | 68 (15.4%) | 58 (14.4%) |
| 25 to 29 Minutes | 34 (7.7%) | 30 (7.4%) |
| 30 to 34 Minutes | 95 (21.6%) | 89 (22.0%) |
| 35 to 39 Minutes | 40 (9.1%) | 13 (3.2%) |
| 40 to 44 Minutes | 54 (12.3%) | 16 (4.0%) |
| 45 to 59 Minutes | 63 (14.3%) | 39 (9.7%) |
| 60 to 89 Minutes | 17 (3.9%) | 12 (3.0%) |
| 90 or more Minutes | 20 (4.5%) | 9 (2.2%) |
Time of Departure to Work by Sex in Allentown borough
The most frequent times of departure to work in Allentown borough are 6:30 AM to 6:59 AM (60, 13.6%) for males and 8:00 AM to 8:29 AM (86, 21.3%) for females.
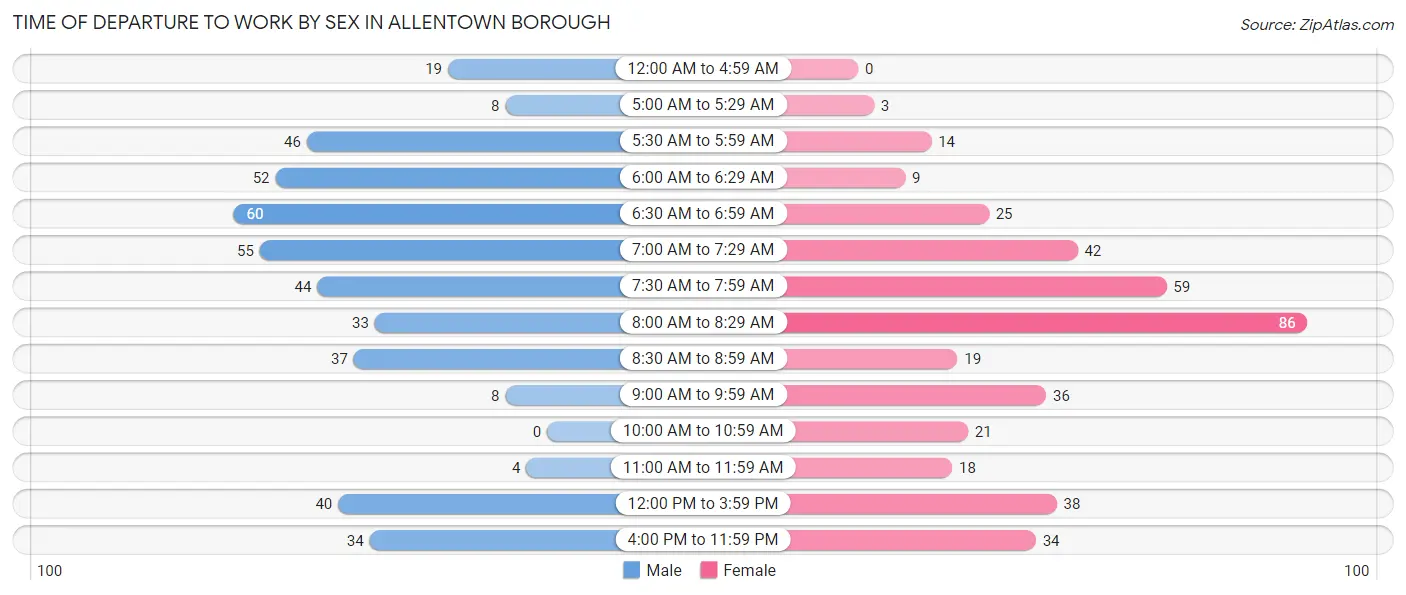
| Time of Departure | Male | Female |
| 12:00 AM to 4:59 AM | 19 (4.3%) | 0 (0.0%) |
| 5:00 AM to 5:29 AM | 8 (1.8%) | 3 (0.7%) |
| 5:30 AM to 5:59 AM | 46 (10.4%) | 14 (3.5%) |
| 6:00 AM to 6:29 AM | 52 (11.8%) | 9 (2.2%) |
| 6:30 AM to 6:59 AM | 60 (13.6%) | 25 (6.2%) |
| 7:00 AM to 7:29 AM | 55 (12.5%) | 42 (10.4%) |
| 7:30 AM to 7:59 AM | 44 (10.0%) | 59 (14.6%) |
| 8:00 AM to 8:29 AM | 33 (7.5%) | 86 (21.3%) |
| 8:30 AM to 8:59 AM | 37 (8.4%) | 19 (4.7%) |
| 9:00 AM to 9:59 AM | 8 (1.8%) | 36 (8.9%) |
| 10:00 AM to 10:59 AM | 0 (0.0%) | 21 (5.2%) |
| 11:00 AM to 11:59 AM | 4 (0.9%) | 18 (4.5%) |
| 12:00 PM to 3:59 PM | 40 (9.1%) | 38 (9.4%) |
| 4:00 PM to 11:59 PM | 34 (7.7%) | 34 (8.4%) |
| Total | 440 (100.0%) | 404 (100.0%) |
Housing Occupancy in Allentown borough
Occupancy by Ownership in Allentown borough
Of the total 691 dwellings in Allentown borough, owner-occupied units account for 519 (75.1%), while renter-occupied units make up 172 (24.9%).
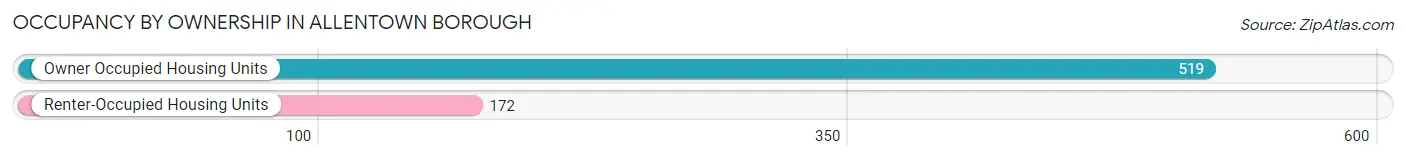
| Occupancy | # Housing Units | % Housing Units |
| Owner Occupied Housing Units | 519 | 75.1% |
| Renter-Occupied Housing Units | 172 | 24.9% |
| Total Occupied Housing Units | 691 | 100.0% |
Occupancy by Household Size in Allentown borough
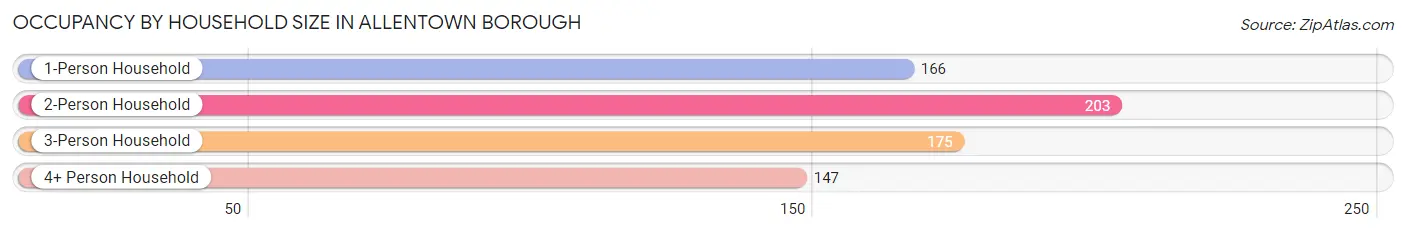
| Household Size | # Housing Units | % Housing Units |
| 1-Person Household | 166 | 24.0% |
| 2-Person Household | 203 | 29.4% |
| 3-Person Household | 175 | 25.3% |
| 4+ Person Household | 147 | 21.3% |
| Total Housing Units | 691 | 100.0% |
Occupancy by Ownership by Household Size in Allentown borough
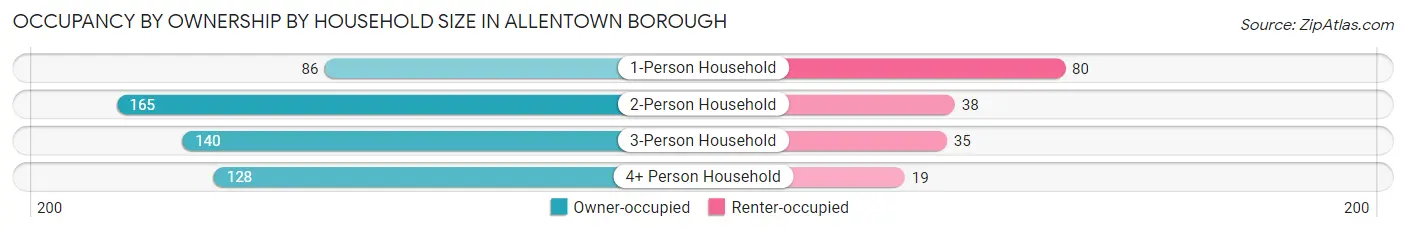
| Household Size | Owner-occupied | Renter-occupied |
| 1-Person Household | 86 (51.8%) | 80 (48.2%) |
| 2-Person Household | 165 (81.3%) | 38 (18.7%) |
| 3-Person Household | 140 (80.0%) | 35 (20.0%) |
| 4+ Person Household | 128 (87.1%) | 19 (12.9%) |
| Total Housing Units | 519 (75.1%) | 172 (24.9%) |
Occupancy by Educational Attainment in Allentown borough
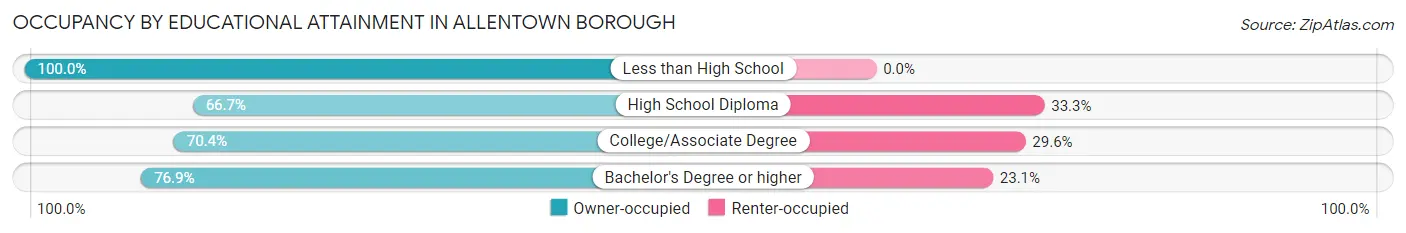
| Household Size | Owner-occupied | Renter-occupied |
| Less than High School | 29 (100.0%) | 0 (0.0%) |
| High School Diploma | 52 (66.7%) | 26 (33.3%) |
| College/Associate Degree | 119 (70.4%) | 50 (29.6%) |
| Bachelor's Degree or higher | 319 (76.9%) | 96 (23.1%) |
Occupancy by Age of Householder in Allentown borough
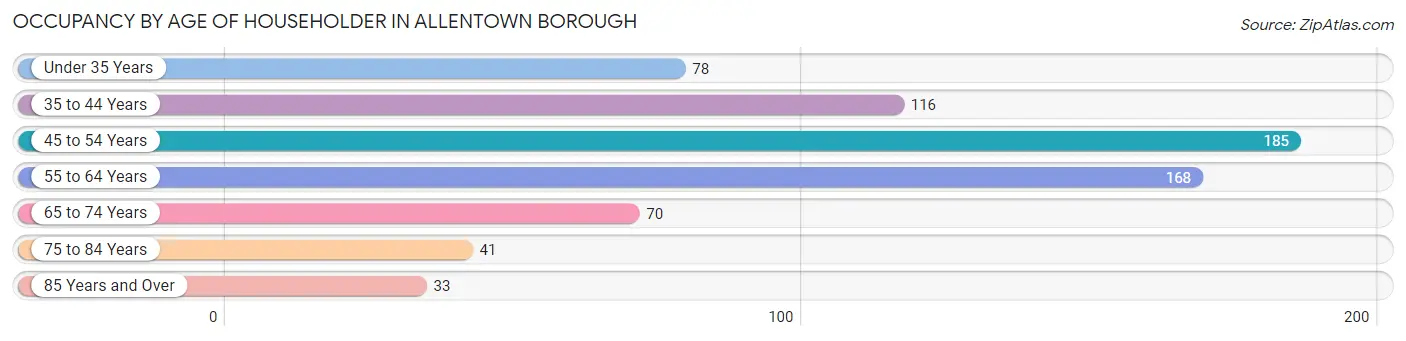
| Age Bracket | # Households | % Households |
| Under 35 Years | 78 | 11.3% |
| 35 to 44 Years | 116 | 16.8% |
| 45 to 54 Years | 185 | 26.8% |
| 55 to 64 Years | 168 | 24.3% |
| 65 to 74 Years | 70 | 10.1% |
| 75 to 84 Years | 41 | 5.9% |
| 85 Years and Over | 33 | 4.8% |
| Total | 691 | 100.0% |
Housing Finances in Allentown borough
Median Income by Occupancy in Allentown borough
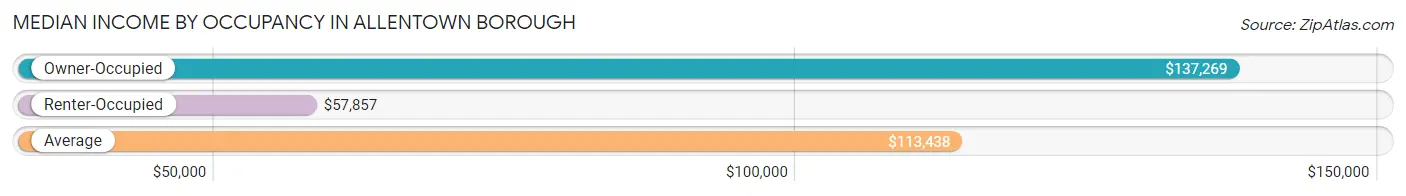
| Occupancy Type | # Households | Median Income |
| Owner-Occupied | 519 (75.1%) | $137,269 |
| Renter-Occupied | 172 (24.9%) | $57,857 |
| Average | 691 (100.0%) | $113,438 |
Occupancy by Householder Income Bracket in Allentown borough
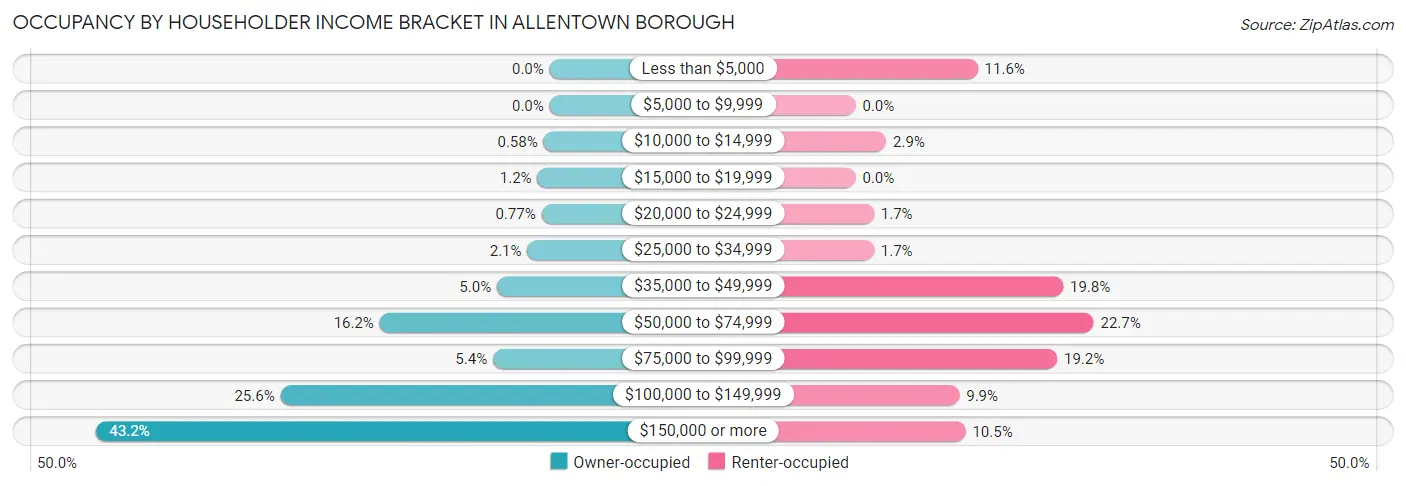
| Income Bracket | Owner-occupied | Renter-occupied |
| Less than $5,000 | 0 (0.0%) | 20 (11.6%) |
| $5,000 to $9,999 | 0 (0.0%) | 0 (0.0%) |
| $10,000 to $14,999 | 3 (0.6%) | 5 (2.9%) |
| $15,000 to $19,999 | 6 (1.2%) | 0 (0.0%) |
| $20,000 to $24,999 | 4 (0.8%) | 3 (1.7%) |
| $25,000 to $34,999 | 11 (2.1%) | 3 (1.7%) |
| $35,000 to $49,999 | 26 (5.0%) | 34 (19.8%) |
| $50,000 to $74,999 | 84 (16.2%) | 39 (22.7%) |
| $75,000 to $99,999 | 28 (5.4%) | 33 (19.2%) |
| $100,000 to $149,999 | 133 (25.6%) | 17 (9.9%) |
| $150,000 or more | 224 (43.2%) | 18 (10.5%) |
| Total | 519 (100.0%) | 172 (100.0%) |
Monthly Housing Cost Tiers in Allentown borough
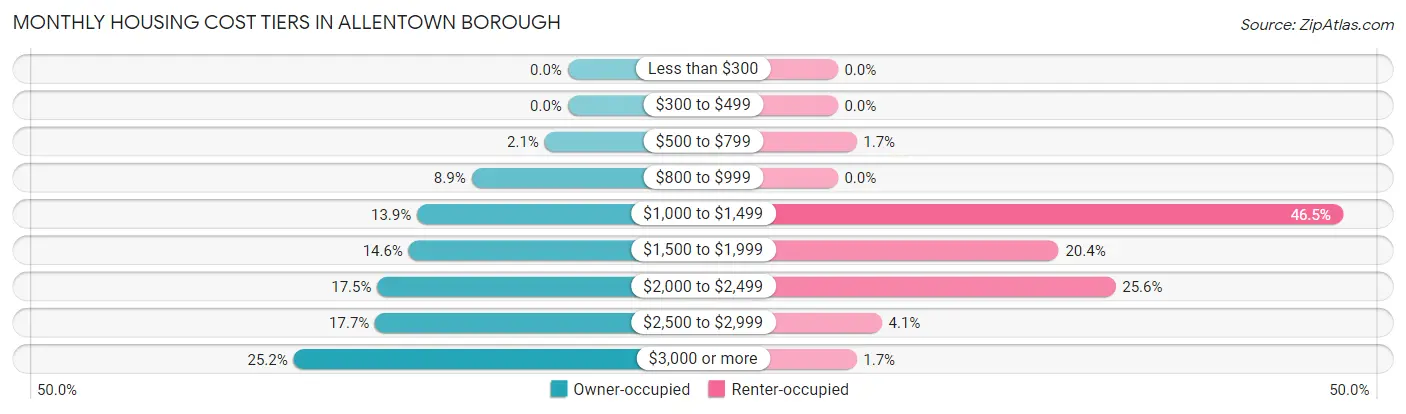
| Monthly Cost | Owner-occupied | Renter-occupied |
| Less than $300 | 0 (0.0%) | 0 (0.0%) |
| $300 to $499 | 0 (0.0%) | 0 (0.0%) |
| $500 to $799 | 11 (2.1%) | 3 (1.7%) |
| $800 to $999 | 46 (8.9%) | 0 (0.0%) |
| $1,000 to $1,499 | 72 (13.9%) | 80 (46.5%) |
| $1,500 to $1,999 | 76 (14.6%) | 35 (20.3%) |
| $2,000 to $2,499 | 91 (17.5%) | 44 (25.6%) |
| $2,500 to $2,999 | 92 (17.7%) | 7 (4.1%) |
| $3,000 or more | 131 (25.2%) | 3 (1.7%) |
| Total | 519 (100.0%) | 172 (100.0%) |
Physical Housing Characteristics in Allentown borough
Housing Structures in Allentown borough
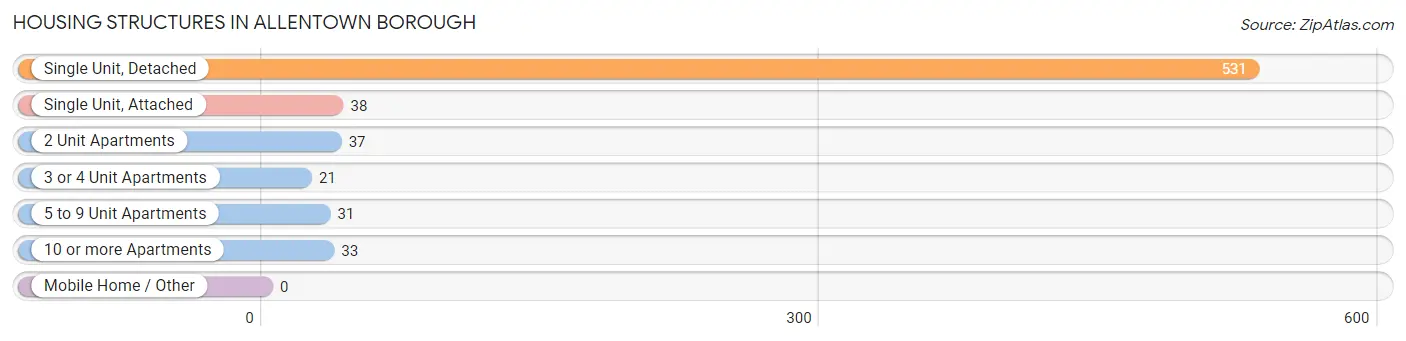
| Structure Type | # Housing Units | % Housing Units |
| Single Unit, Detached | 531 | 76.8% |
| Single Unit, Attached | 38 | 5.5% |
| 2 Unit Apartments | 37 | 5.3% |
| 3 or 4 Unit Apartments | 21 | 3.0% |
| 5 to 9 Unit Apartments | 31 | 4.5% |
| 10 or more Apartments | 33 | 4.8% |
| Mobile Home / Other | 0 | 0.0% |
| Total | 691 | 100.0% |
Housing Structures by Occupancy in Allentown borough
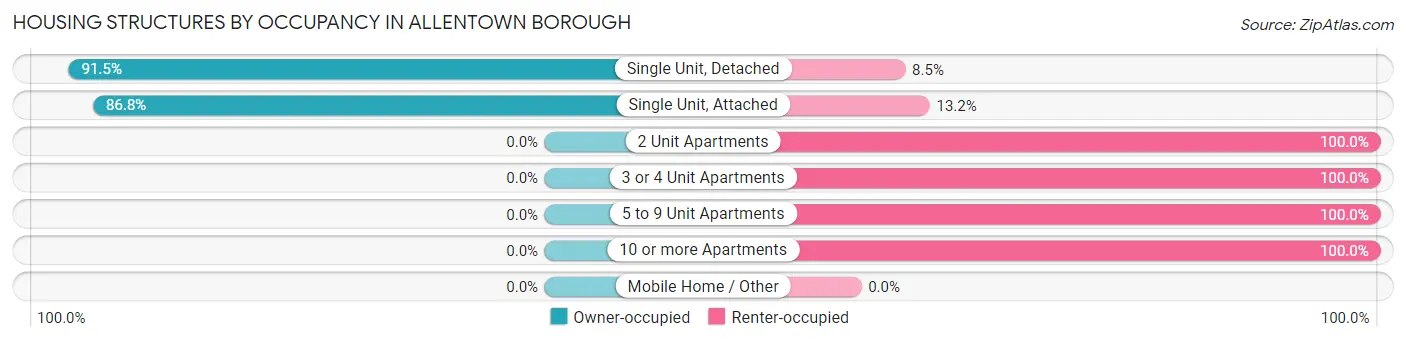
| Structure Type | Owner-occupied | Renter-occupied |
| Single Unit, Detached | 486 (91.5%) | 45 (8.5%) |
| Single Unit, Attached | 33 (86.8%) | 5 (13.2%) |
| 2 Unit Apartments | 0 (0.0%) | 37 (100.0%) |
| 3 or 4 Unit Apartments | 0 (0.0%) | 21 (100.0%) |
| 5 to 9 Unit Apartments | 0 (0.0%) | 31 (100.0%) |
| 10 or more Apartments | 0 (0.0%) | 33 (100.0%) |
| Mobile Home / Other | 0 (0.0%) | 0 (0.0%) |
| Total | 519 (75.1%) | 172 (24.9%) |
Housing Structures by Number of Rooms in Allentown borough
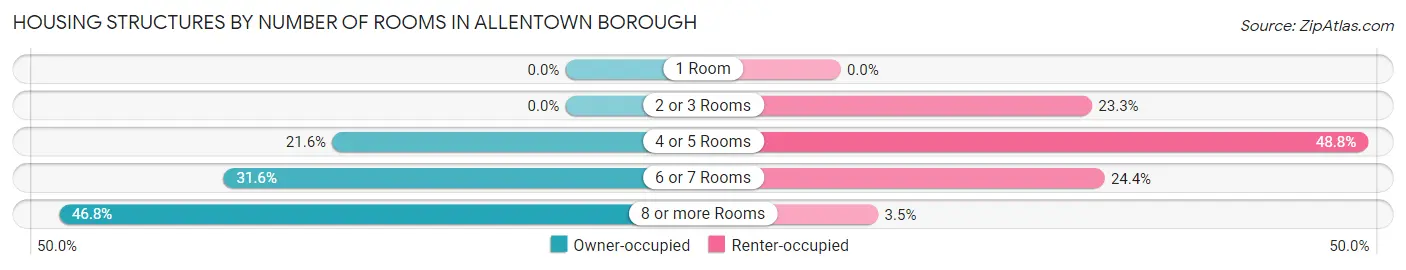
| Number of Rooms | Owner-occupied | Renter-occupied |
| 1 Room | 0 (0.0%) | 0 (0.0%) |
| 2 or 3 Rooms | 0 (0.0%) | 40 (23.3%) |
| 4 or 5 Rooms | 112 (21.6%) | 84 (48.8%) |
| 6 or 7 Rooms | 164 (31.6%) | 42 (24.4%) |
| 8 or more Rooms | 243 (46.8%) | 6 (3.5%) |
| Total | 519 (100.0%) | 172 (100.0%) |
Housing Structure by Heating Type in Allentown borough
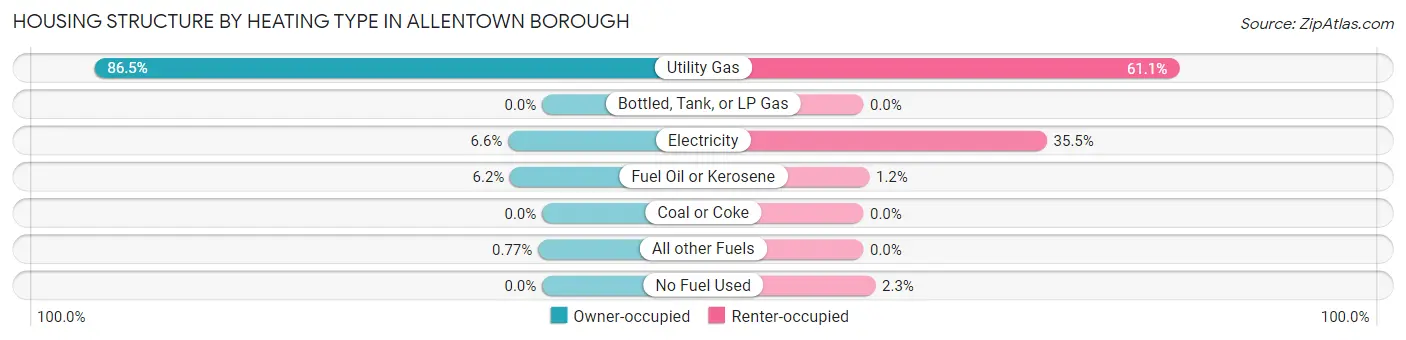
| Heating Type | Owner-occupied | Renter-occupied |
| Utility Gas | 449 (86.5%) | 105 (61.1%) |
| Bottled, Tank, or LP Gas | 0 (0.0%) | 0 (0.0%) |
| Electricity | 34 (6.6%) | 61 (35.5%) |
| Fuel Oil or Kerosene | 32 (6.2%) | 2 (1.2%) |
| Coal or Coke | 0 (0.0%) | 0 (0.0%) |
| All other Fuels | 4 (0.8%) | 0 (0.0%) |
| No Fuel Used | 0 (0.0%) | 4 (2.3%) |
| Total | 519 (100.0%) | 172 (100.0%) |
Household Vehicle Usage in Allentown borough
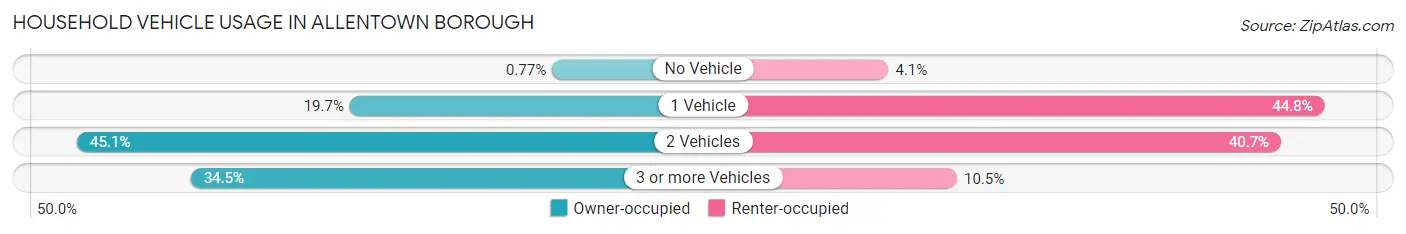
| Vehicles per Household | Owner-occupied | Renter-occupied |
| No Vehicle | 4 (0.8%) | 7 (4.1%) |
| 1 Vehicle | 102 (19.7%) | 77 (44.8%) |
| 2 Vehicles | 234 (45.1%) | 70 (40.7%) |
| 3 or more Vehicles | 179 (34.5%) | 18 (10.5%) |
| Total | 519 (100.0%) | 172 (100.0%) |
Real Estate & Mortgages in Allentown borough
Real Estate and Mortgage Overview in Allentown borough
| Characteristic | Without Mortgage | With Mortgage |
| Housing Units | 166 | 353 |
| Median Property Value | $356,900 | $371,100 |
| Median Household Income | $69,904 | $179 |
| Monthly Housing Costs | $1,200 | $131 |
| Real Estate Taxes | $9,452 | $0 |
Property Value by Mortgage Status in Allentown borough
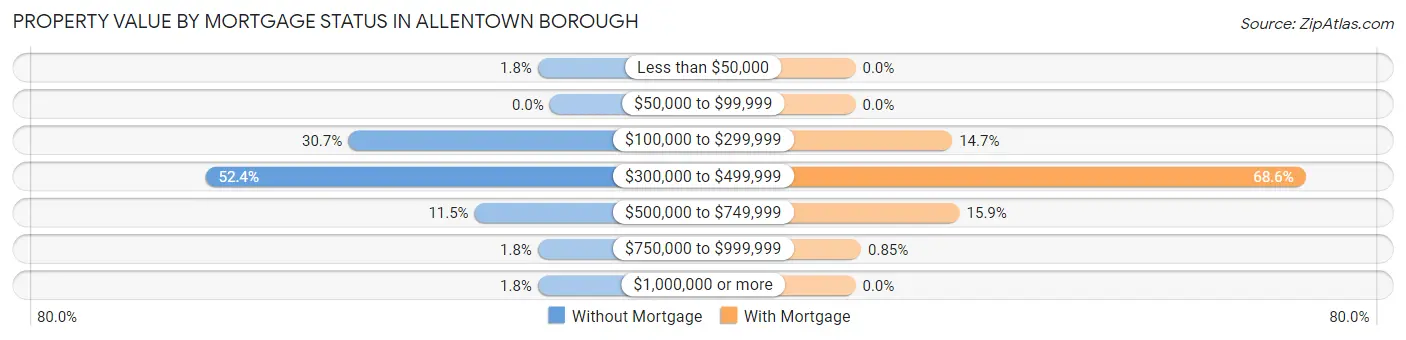
| Property Value | Without Mortgage | With Mortgage |
| Less than $50,000 | 3 (1.8%) | 0 (0.0%) |
| $50,000 to $99,999 | 0 (0.0%) | 0 (0.0%) |
| $100,000 to $299,999 | 51 (30.7%) | 52 (14.7%) |
| $300,000 to $499,999 | 87 (52.4%) | 242 (68.6%) |
| $500,000 to $749,999 | 19 (11.5%) | 56 (15.9%) |
| $750,000 to $999,999 | 3 (1.8%) | 3 (0.9%) |
| $1,000,000 or more | 3 (1.8%) | 0 (0.0%) |
| Total | 166 (100.0%) | 353 (100.0%) |
Household Income by Mortgage Status in Allentown borough
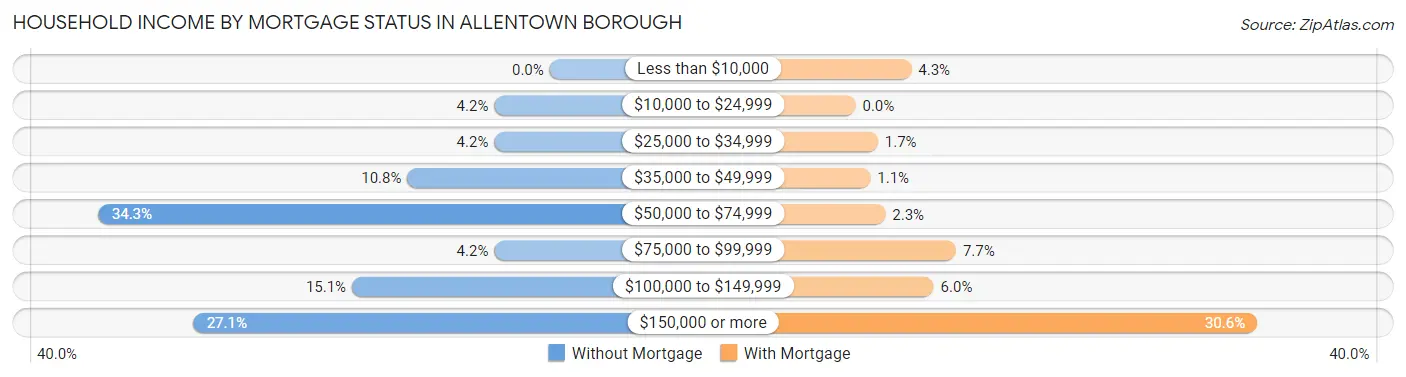
| Household Income | Without Mortgage | With Mortgage |
| Less than $10,000 | 0 (0.0%) | 15 (4.3%) |
| $10,000 to $24,999 | 7 (4.2%) | 0 (0.0%) |
| $25,000 to $34,999 | 7 (4.2%) | 6 (1.7%) |
| $35,000 to $49,999 | 18 (10.8%) | 4 (1.1%) |
| $50,000 to $74,999 | 57 (34.3%) | 8 (2.3%) |
| $75,000 to $99,999 | 7 (4.2%) | 27 (7.6%) |
| $100,000 to $149,999 | 25 (15.1%) | 21 (5.9%) |
| $150,000 or more | 45 (27.1%) | 108 (30.6%) |
| Total | 166 (100.0%) | 353 (100.0%) |
Property Value to Household Income Ratio in Allentown borough
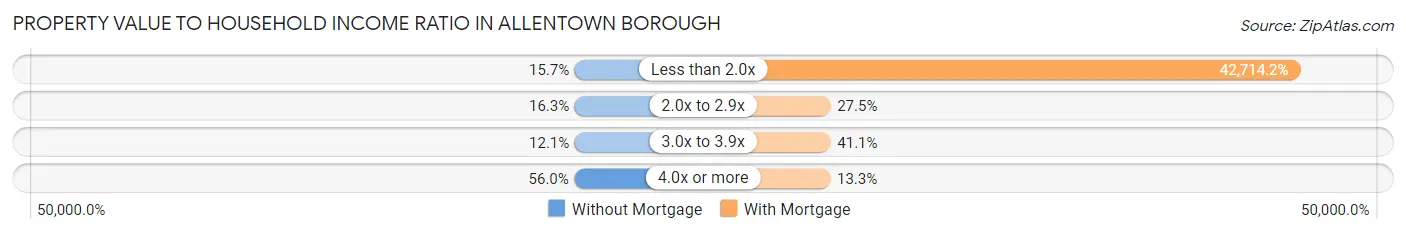
| Value-to-Income Ratio | Without Mortgage | With Mortgage |
| Less than 2.0x | 26 (15.7%) | 150,781 (42,714.2%) |
| 2.0x to 2.9x | 27 (16.3%) | 97 (27.5%) |
| 3.0x to 3.9x | 20 (12.0%) | 145 (41.1%) |
| 4.0x or more | 93 (56.0%) | 47 (13.3%) |
| Total | 166 (100.0%) | 353 (100.0%) |
Real Estate Taxes by Mortgage Status in Allentown borough
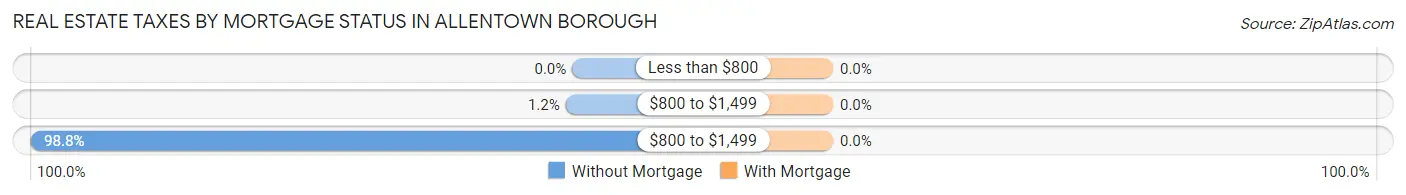
| Property Taxes | Without Mortgage | With Mortgage |
| Less than $800 | 0 (0.0%) | 0 (0.0%) |
| $800 to $1,499 | 2 (1.2%) | 0 (0.0%) |
| $800 to $1,499 | 164 (98.8%) | 0 (0.0%) |
| Total | 166 (100.0%) | 353 (100.0%) |
Health & Disability in Allentown borough
Health Insurance Coverage by Age in Allentown borough
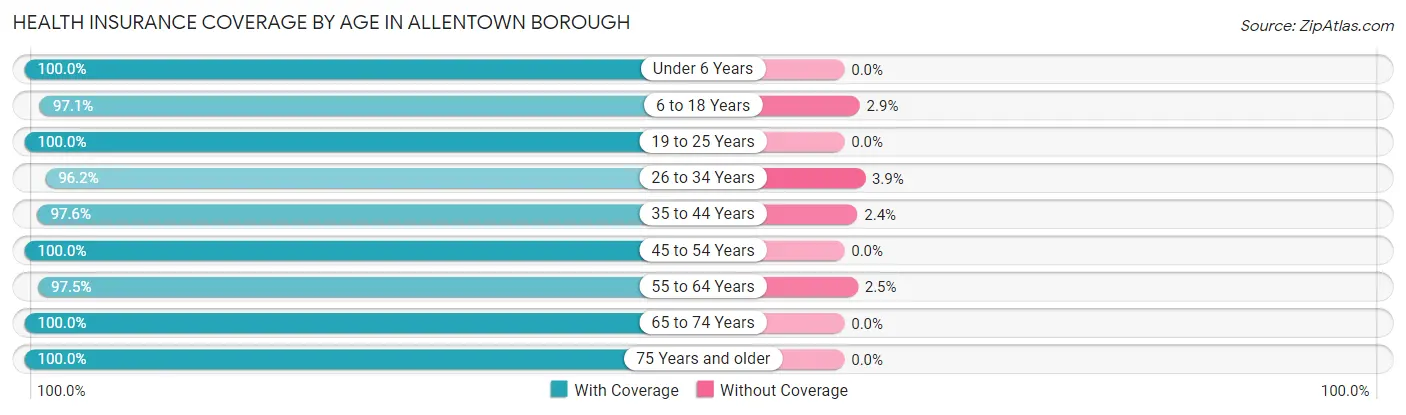
| Age Bracket | With Coverage | Without Coverage |
| Under 6 Years | 119 (100.0%) | 0 (0.0%) |
| 6 to 18 Years | 306 (97.1%) | 9 (2.9%) |
| 19 to 25 Years | 161 (100.0%) | 0 (0.0%) |
| 26 to 34 Years | 175 (96.2%) | 7 (3.8%) |
| 35 to 44 Years | 241 (97.6%) | 6 (2.4%) |
| 45 to 54 Years | 248 (100.0%) | 0 (0.0%) |
| 55 to 64 Years | 272 (97.5%) | 7 (2.5%) |
| 65 to 74 Years | 127 (100.0%) | 0 (0.0%) |
| 75 Years and older | 139 (100.0%) | 0 (0.0%) |
| Total | 1,788 (98.4%) | 29 (1.6%) |
Health Insurance Coverage by Citizenship Status in Allentown borough
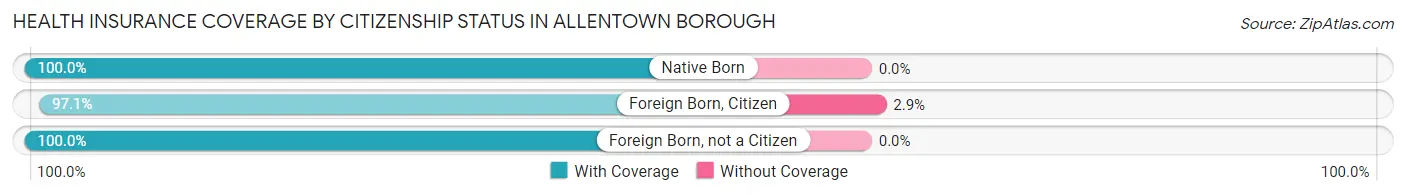
| Citizenship Status | With Coverage | Without Coverage |
| Native Born | 119 (100.0%) | 0 (0.0%) |
| Foreign Born, Citizen | 306 (97.1%) | 9 (2.9%) |
| Foreign Born, not a Citizen | 161 (100.0%) | 0 (0.0%) |
Health Insurance Coverage by Household Income in Allentown borough
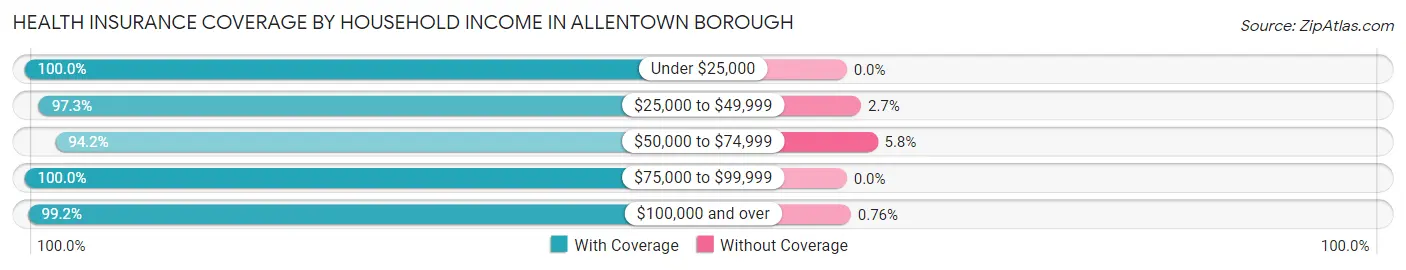
| Household Income | With Coverage | Without Coverage |
| Under $25,000 | 46 (100.0%) | 0 (0.0%) |
| $25,000 to $49,999 | 146 (97.3%) | 4 (2.7%) |
| $50,000 to $74,999 | 262 (94.2%) | 16 (5.8%) |
| $75,000 to $99,999 | 153 (100.0%) | 0 (0.0%) |
| $100,000 and over | 1,181 (99.2%) | 9 (0.8%) |
Public vs Private Health Insurance Coverage by Age in Allentown borough
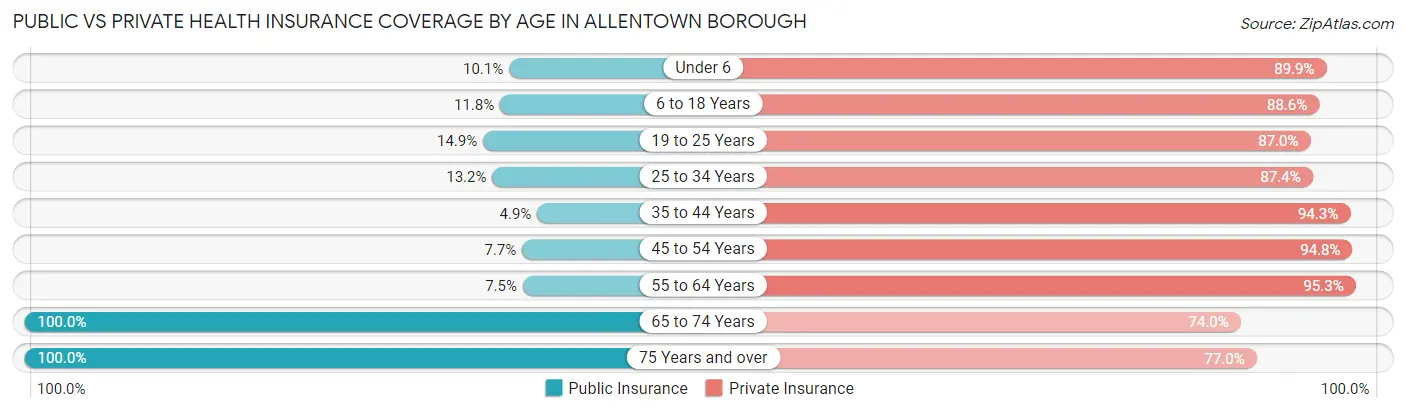
| Age Bracket | Public Insurance | Private Insurance |
| Under 6 | 12 (10.1%) | 107 (89.9%) |
| 6 to 18 Years | 37 (11.7%) | 279 (88.6%) |
| 19 to 25 Years | 24 (14.9%) | 140 (87.0%) |
| 25 to 34 Years | 24 (13.2%) | 159 (87.4%) |
| 35 to 44 Years | 12 (4.9%) | 233 (94.3%) |
| 45 to 54 Years | 19 (7.7%) | 235 (94.8%) |
| 55 to 64 Years | 21 (7.5%) | 266 (95.3%) |
| 65 to 74 Years | 127 (100.0%) | 94 (74.0%) |
| 75 Years and over | 139 (100.0%) | 107 (77.0%) |
| Total | 415 (22.8%) | 1,620 (89.2%) |
Disability Status by Sex by Age in Allentown borough
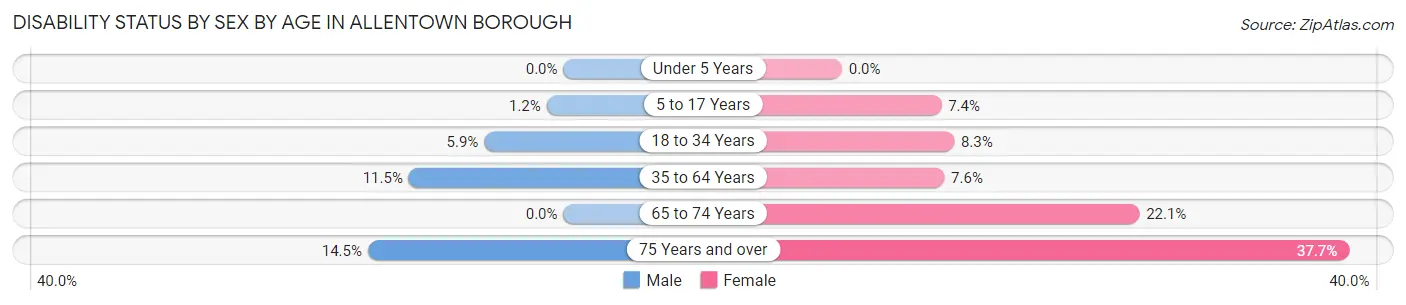
| Age Bracket | Male | Female |
| Under 5 Years | 0 (0.0%) | 0 (0.0%) |
| 5 to 17 Years | 2 (1.2%) | 11 (7.4%) |
| 18 to 34 Years | 10 (5.9%) | 16 (8.3%) |
| 35 to 64 Years | 42 (11.5%) | 31 (7.6%) |
| 65 to 74 Years | 0 (0.0%) | 17 (22.1%) |
| 75 Years and over | 9 (14.5%) | 29 (37.7%) |
Disability Class by Sex by Age in Allentown borough
Disability Class: Hearing Difficulty
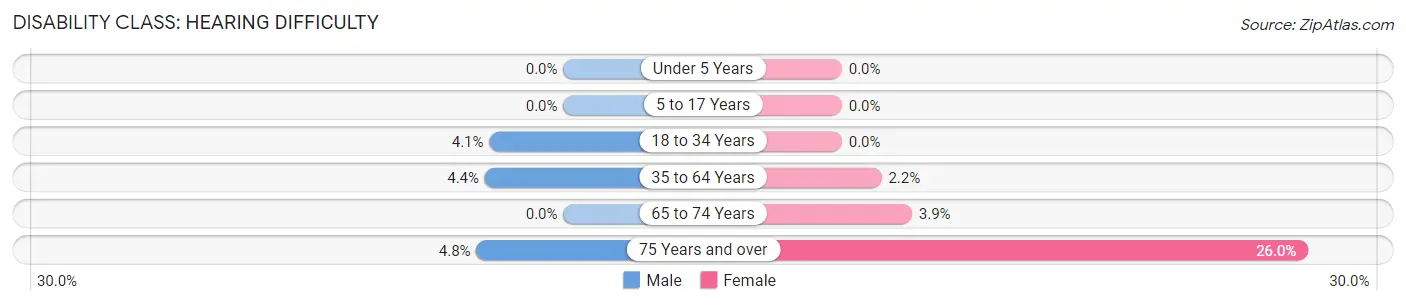
| Age Bracket | Male | Female |
| Under 5 Years | 0 (0.0%) | 0 (0.0%) |
| 5 to 17 Years | 0 (0.0%) | 0 (0.0%) |
| 18 to 34 Years | 7 (4.1%) | 0 (0.0%) |
| 35 to 64 Years | 16 (4.4%) | 9 (2.2%) |
| 65 to 74 Years | 0 (0.0%) | 3 (3.9%) |
| 75 Years and over | 3 (4.8%) | 20 (26.0%) |
Disability Class: Vision Difficulty
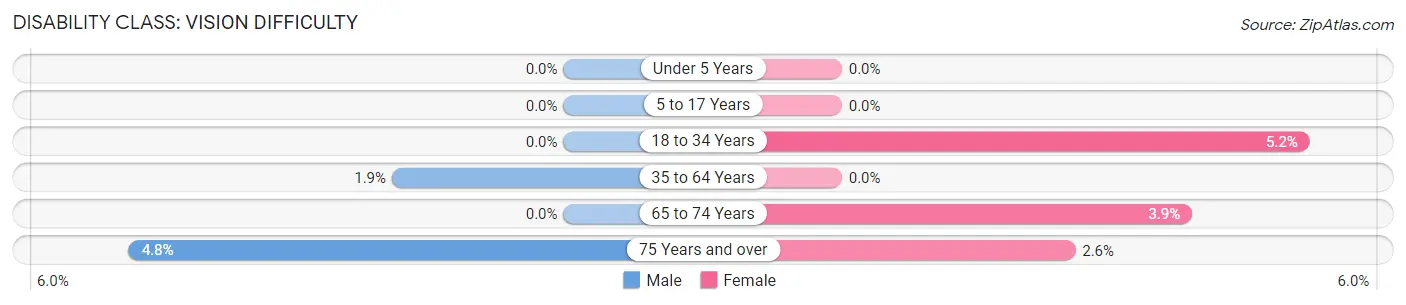
| Age Bracket | Male | Female |
| Under 5 Years | 0 (0.0%) | 0 (0.0%) |
| 5 to 17 Years | 0 (0.0%) | 0 (0.0%) |
| 18 to 34 Years | 0 (0.0%) | 10 (5.2%) |
| 35 to 64 Years | 7 (1.9%) | 0 (0.0%) |
| 65 to 74 Years | 0 (0.0%) | 3 (3.9%) |
| 75 Years and over | 3 (4.8%) | 2 (2.6%) |
Disability Class: Cognitive Difficulty
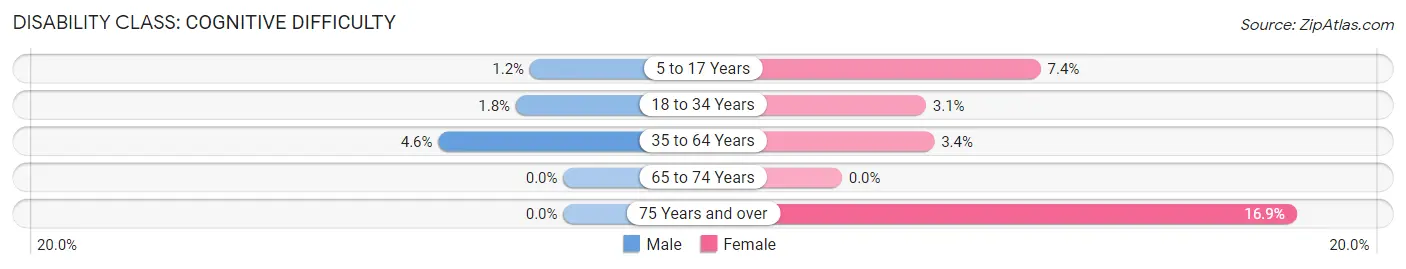
| Age Bracket | Male | Female |
| 5 to 17 Years | 2 (1.2%) | 11 (7.4%) |
| 18 to 34 Years | 3 (1.8%) | 6 (3.1%) |
| 35 to 64 Years | 17 (4.6%) | 14 (3.4%) |
| 65 to 74 Years | 0 (0.0%) | 0 (0.0%) |
| 75 Years and over | 0 (0.0%) | 13 (16.9%) |
Disability Class: Ambulatory Difficulty
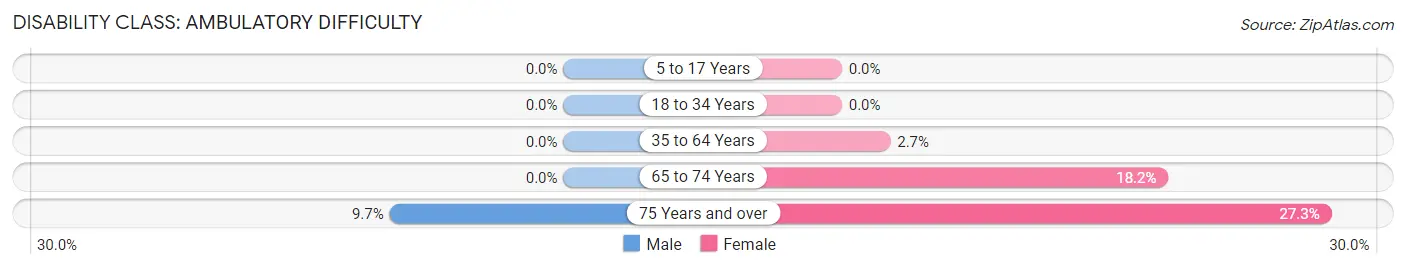
| Age Bracket | Male | Female |
| 5 to 17 Years | 0 (0.0%) | 0 (0.0%) |
| 18 to 34 Years | 0 (0.0%) | 0 (0.0%) |
| 35 to 64 Years | 0 (0.0%) | 11 (2.7%) |
| 65 to 74 Years | 0 (0.0%) | 14 (18.2%) |
| 75 Years and over | 6 (9.7%) | 21 (27.3%) |
Disability Class: Self-Care Difficulty
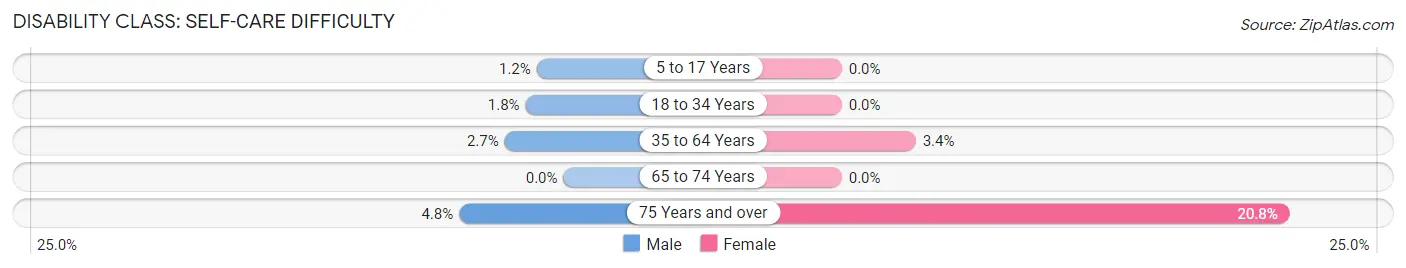
| Age Bracket | Male | Female |
| 5 to 17 Years | 2 (1.2%) | 0 (0.0%) |
| 18 to 34 Years | 3 (1.8%) | 0 (0.0%) |
| 35 to 64 Years | 10 (2.7%) | 14 (3.4%) |
| 65 to 74 Years | 0 (0.0%) | 0 (0.0%) |
| 75 Years and over | 3 (4.8%) | 16 (20.8%) |
Technology Access in Allentown borough
Computing Device Access in Allentown borough
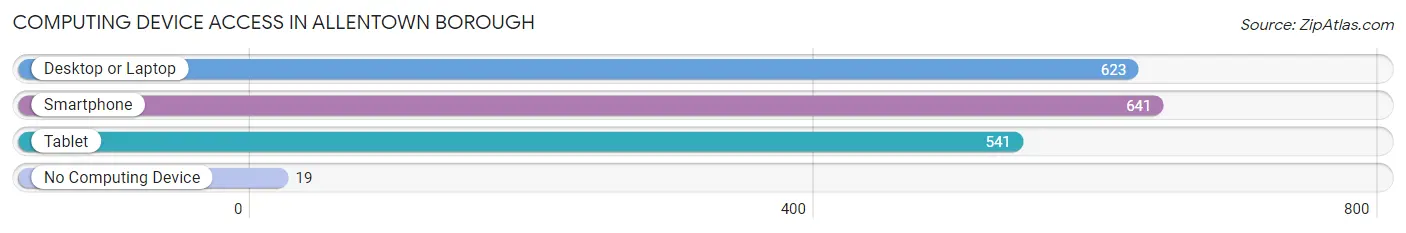
| Device Type | # Households | % Households |
| Desktop or Laptop | 623 | 90.2% |
| Smartphone | 641 | 92.8% |
| Tablet | 541 | 78.3% |
| No Computing Device | 19 | 2.8% |
| Total | 691 | 100.0% |
Internet Access in Allentown borough
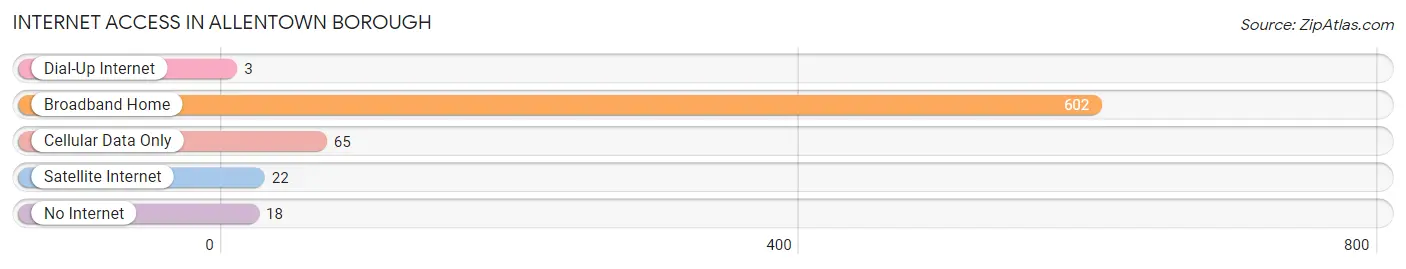
| Internet Type | # Households | % Households |
| Dial-Up Internet | 3 | 0.4% |
| Broadband Home | 602 | 87.1% |
| Cellular Data Only | 65 | 9.4% |
| Satellite Internet | 22 | 3.2% |
| No Internet | 18 | 2.6% |
| Total | 691 | 100.0% |
Allentown borough Summary
Allentown Borough is a small borough located in Monmouth County, New Jersey. It is situated on the banks of the Manasquan River and is part of the Bayshore region of the state. The borough has a population of approximately 2,500 people and covers an area of 1.2 square miles. Allentown is a small, rural community with a rich history and a vibrant economy.
History
Allentown was first settled in 1693 by English settlers from Long Island. The town was originally known as “Upper Freehold” and was part of Monmouth County. In 1714, the town was renamed “Allentown” after the Allens, a prominent family in the area. The Allens were Quakers and were instrumental in the development of the town.
In the late 1700s, Allentown was a thriving agricultural community. The town was known for its production of wheat, corn, and other grains. In the early 1800s, the town began to industrialize and saw the development of several mills and factories. The town was also home to several shipyards and was a major port for the shipping of goods.
In the late 1800s, Allentown began to experience a population boom. The town was home to several large businesses, including a glass factory, a paper mill, and a brickyard. The town also had a thriving fishing industry and was home to several oyster beds.
Geography
Allentown is located in Monmouth County, New Jersey. It is situated on the banks of the Manasquan River and is part of the Bayshore region of the state. The borough has a total area of 1.2 square miles and is bordered by the towns of Manasquan, Howell, and Freehold.
The borough is located in a coastal plain and is characterized by flat terrain. The borough is home to several small creeks and streams, as well as the Manasquan River. The borough is also home to several parks and recreational areas, including Allentown Park and the Allentown Nature Preserve.
Economy
Allentown is a small, rural community with a vibrant economy. The town is home to several small businesses, including restaurants, retail stores, and professional services. The town is also home to several manufacturing and industrial businesses, including a glass factory, a paper mill, and a brickyard.
The town is also home to several farms and agricultural businesses. The town is known for its production of wheat, corn, and other grains. The town is also home to several oyster beds and is a major port for the shipping of goods.
Demographics
As of the 2010 census, Allentown had a population of 2,500 people. The racial makeup of the borough was 94.2% White, 2.2% African American, 0.4% Native American, 0.8% Asian, and 2.4% from other races. Hispanic or Latino of any race were 4.4% of the population.
The median household income in Allentown was $62,500, and the median family income was $76,250. The per capita income for the borough was $30,000. About 5.2% of families and 7.2% of the population were below the poverty line.
Allentown is a small, rural community with a rich history and a vibrant economy. The town is home to several small businesses, farms, and manufacturing and industrial businesses. The town is also home to several parks and recreational areas, making it a great place to live and work.
Common Questions
What is the Total Population of Allentown borough?
Total Population of Allentown borough is 1,817.
What is the Total Male Population of Allentown borough?
Total Male Population of Allentown borough is 864.
What is the Total Female Population of Allentown borough?
Total Female Population of Allentown borough is 953.
What is the Ratio of Males per 100 Females in Allentown borough?
There are 90.66 Males per 100 Females in Allentown borough.
What is the Ratio of Females per 100 Males in Allentown borough?
There are 110.30 Females per 100 Males in Allentown borough.
What is the Median Population Age in Allentown borough?
Median Population Age in Allentown borough is 40.5 Years.
What is the Average Family Size in Allentown borough
Average Family Size in Allentown borough is 3.2 People.
What is the Average Household Size in Allentown borough
Average Household Size in Allentown borough is 2.6 People.
What is Per Capita Income in Allentown borough?
Per Capita income in Allentown borough is $52,881.
What is the Median Family Income in Allentown borough?
Median Family Income in Allentown borough is $135,078.
What is the Median Household income in Allentown borough?
Median Household Income in Allentown borough is $113,438.
What is Income or Wage Gap in Allentown borough?
Income or Wage Gap in Allentown borough is 38.0%.
Women in Allentown borough earn 62.0 cents for every dollar earned by a man.
What is Inequality or Gini Index in Allentown borough?
Inequality or Gini Index in Allentown borough is 0.40.
How Large is the Labor Force in Allentown borough?
There are 1,055 People in the Labor Forcein in Allentown borough.
What is the Percentage of People in the Labor Force in Allentown borough?
70.4% of People are in the Labor Force in Allentown borough.
What is the Unemployment Rate in Allentown borough?
Unemployment Rate in Allentown borough is 4.7%.