West Cape May borough, NJ
West Cape May borough Overview
927
TOTAL POPULATION
461
MALE POPULATION
466
FEMALE POPULATION
98.93
MALES / 100 FEMALES
101.08
FEMALES / 100 MALES
60.3
MEDIAN AGE
2.8
AVG FAMILY SIZE
2.2
AVG HOUSEHOLD SIZE
$51,818
PER CAPITA INCOME
$106,250
AVG FAMILY INCOME
$87,212
AVG HOUSEHOLD INCOME
0.42
INEQUALITY / GINI INDEX
435
LABOR FORCE [ PEOPLE ]
54.2%
PERCENT IN LABOR FORCE
2.5%
UNEMPLOYMENT RATE
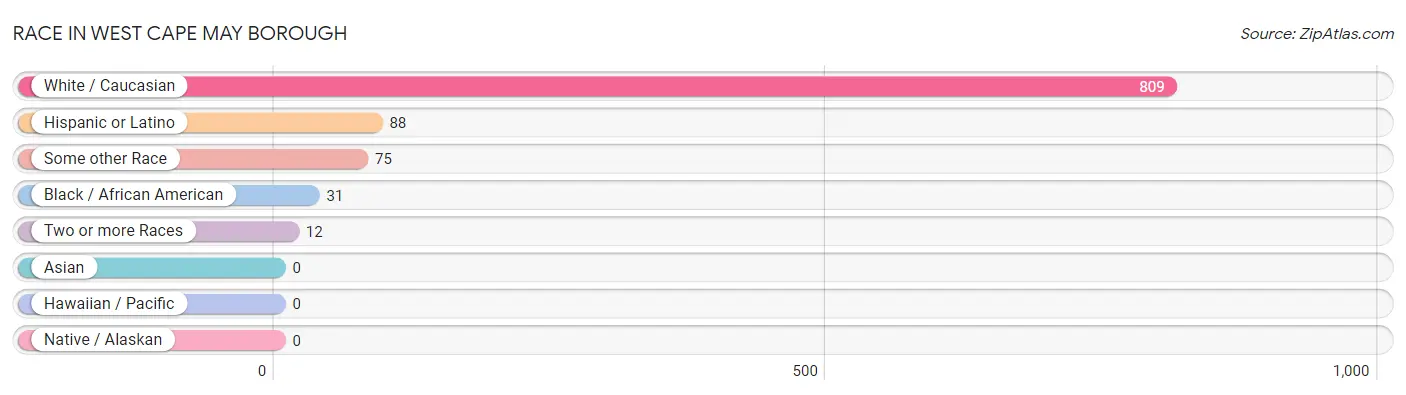
Race in West Cape May borough
The most populous races in West Cape May borough are White / Caucasian (809 | 87.3%), Hispanic or Latino (88 | 9.5%), and Some other Race (75 | 8.1%).
| Race | # Population | % Population |
| Asian | 0 | 0.0% |
| Black / African American | 31 | 3.3% |
| Hawaiian / Pacific | 0 | 0.0% |
| Hispanic or Latino | 88 | 9.5% |
| Native / Alaskan | 0 | 0.0% |
| White / Caucasian | 809 | 87.3% |
| Two or more Races | 12 | 1.3% |
| Some other Race | 75 | 8.1% |
| Total | 927 | 100.0% |
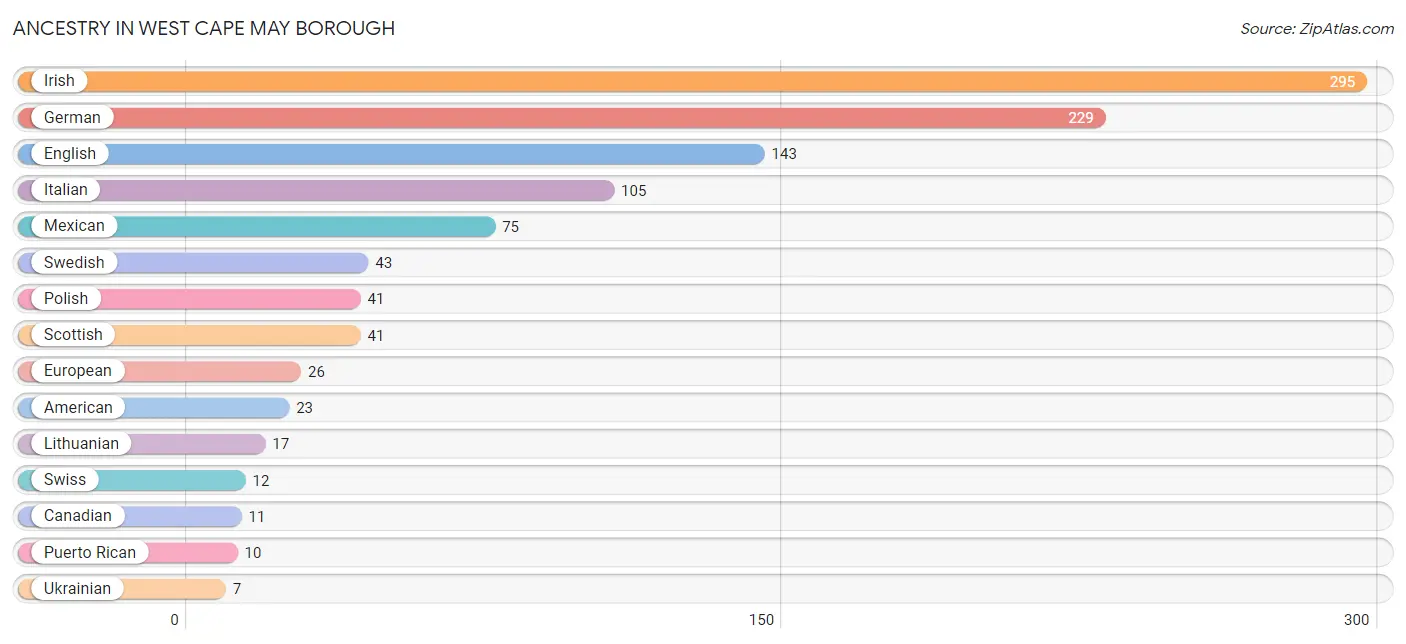
Ancestry in West Cape May borough
The most populous ancestries reported in West Cape May borough are Irish (295 | 31.8%), German (229 | 24.7%), English (143 | 15.4%), Italian (105 | 11.3%), and Mexican (75 | 8.1%), together accounting for 91.4% of all West Cape May borough residents.
| Ancestry | # Population | % Population |
| African | 2 | 0.2% |
| American | 23 | 2.5% |
| Belgian | 3 | 0.3% |
| British | 5 | 0.5% |
| Canadian | 11 | 1.2% |
| Colombian | 3 | 0.3% |
| Croatian | 3 | 0.3% |
| Dutch | 4 | 0.4% |
| English | 143 | 15.4% |
| European | 26 | 2.8% |
| French Canadian | 1 | 0.1% |
| German | 229 | 24.7% |
| Greek | 3 | 0.3% |
| Irish | 295 | 31.8% |
| Italian | 105 | 11.3% |
| Lithuanian | 17 | 1.8% |
| Mexican | 75 | 8.1% |
| Northern European | 6 | 0.6% |
| Polish | 41 | 4.4% |
| Puerto Rican | 10 | 1.1% |
| Russian | 6 | 0.6% |
| Scotch-Irish | 4 | 0.4% |
| Scottish | 41 | 4.4% |
| Slovak | 4 | 0.4% |
| South American | 3 | 0.3% |
| Subsaharan African | 2 | 0.2% |
| Swedish | 43 | 4.6% |
| Swiss | 12 | 1.3% |
| Ukrainian | 7 | 0.8% |
| Welsh | 3 | 0.3% | View All 30 Rows |
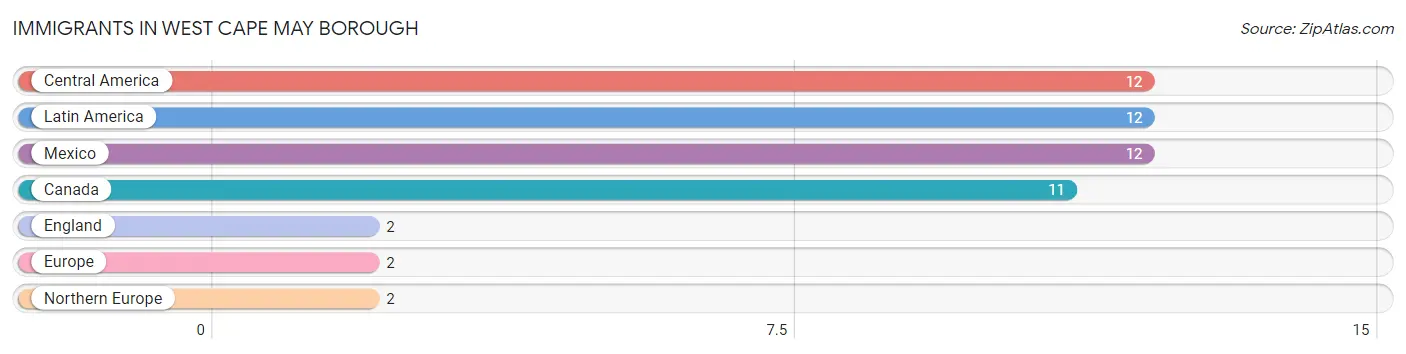
Immigrants in West Cape May borough
The most numerous immigrant groups reported in West Cape May borough came from Central America (12 | 1.3%), Latin America (12 | 1.3%), Mexico (12 | 1.3%), Canada (11 | 1.2%), and England (2 | 0.2%), together accounting for 5.3% of all West Cape May borough residents.
| Immigration Origin | # Population | % Population |
| Canada | 11 | 1.2% |
| Central America | 12 | 1.3% |
| England | 2 | 0.2% |
| Europe | 2 | 0.2% |
| Latin America | 12 | 1.3% |
| Mexico | 12 | 1.3% |
| Northern Europe | 2 | 0.2% | View All 7 Rows |
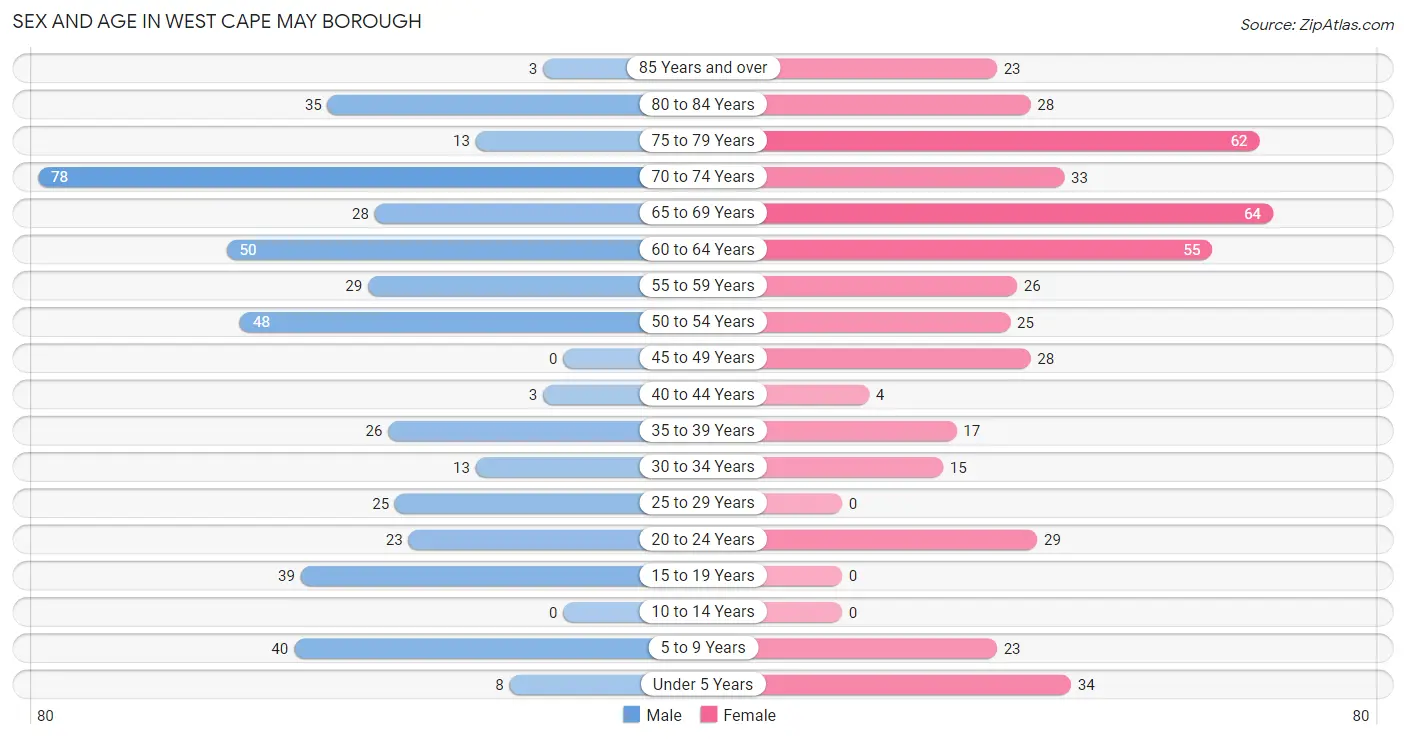
Sex and Age in West Cape May borough
Sex and Age in West Cape May borough
The most populous age groups in West Cape May borough are 70 to 74 Years (78 | 16.9%) for men and 65 to 69 Years (64 | 13.7%) for women.
| Age Bracket | Male | Female |
| Under 5 Years | 8 (1.7%) | 34 (7.3%) |
| 5 to 9 Years | 40 (8.7%) | 23 (4.9%) |
| 10 to 14 Years | 0 (0.0%) | 0 (0.0%) |
| 15 to 19 Years | 39 (8.5%) | 0 (0.0%) |
| 20 to 24 Years | 23 (5.0%) | 29 (6.2%) |
| 25 to 29 Years | 25 (5.4%) | 0 (0.0%) |
| 30 to 34 Years | 13 (2.8%) | 15 (3.2%) |
| 35 to 39 Years | 26 (5.6%) | 17 (3.6%) |
| 40 to 44 Years | 3 (0.6%) | 4 (0.9%) |
| 45 to 49 Years | 0 (0.0%) | 28 (6.0%) |
| 50 to 54 Years | 48 (10.4%) | 25 (5.4%) |
| 55 to 59 Years | 29 (6.3%) | 26 (5.6%) |
| 60 to 64 Years | 50 (10.8%) | 55 (11.8%) |
| 65 to 69 Years | 28 (6.1%) | 64 (13.7%) |
| 70 to 74 Years | 78 (16.9%) | 33 (7.1%) |
| 75 to 79 Years | 13 (2.8%) | 62 (13.3%) |
| 80 to 84 Years | 35 (7.6%) | 28 (6.0%) |
| 85 Years and over | 3 (0.6%) | 23 (4.9%) |
| Total | 461 (100.0%) | 466 (100.0%) |
Families and Households in West Cape May borough
Median Family Size in West Cape May borough
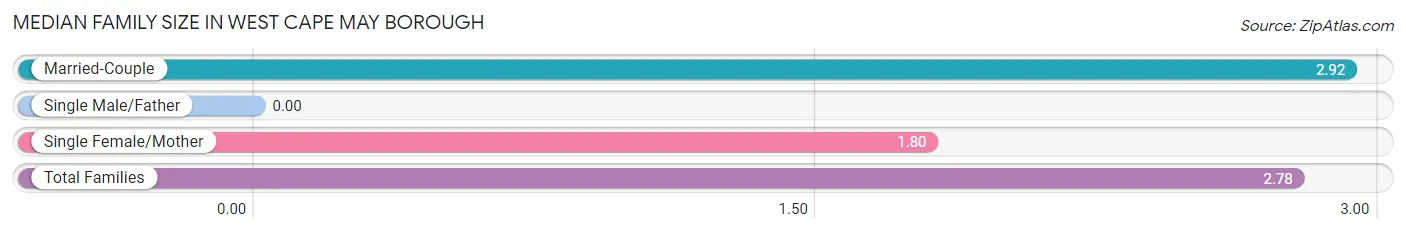
| Family Type | # Families | Family Size |
| Married-Couple | 244 (87.5%) | 2.92 |
| Single Male/Father | 0 (0.0%) | - |
| Single Female/Mother | 35 (12.5%) | 1.80 |
| Total Families | 279 (100.0%) | 2.78 |
Median Household Size in West Cape May borough
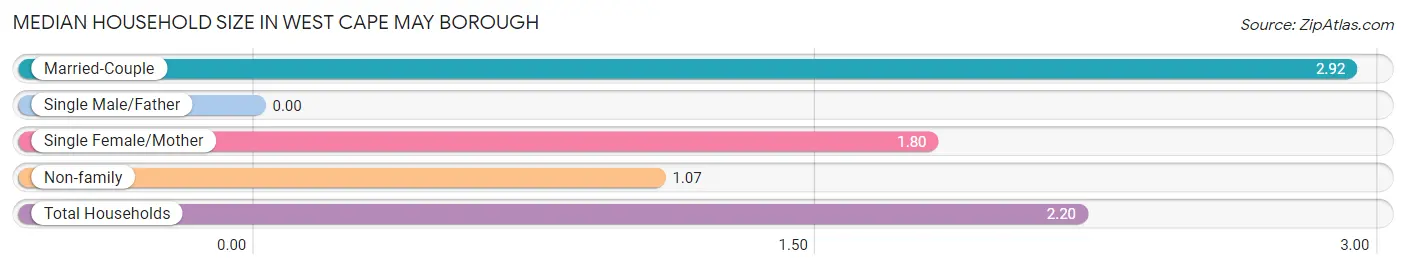
| Household Type | # Households | Household Size |
| Married-Couple | 244 (58.0%) | 2.92 |
| Single Male/Father | 0 (0.0%) | - |
| Single Female/Mother | 35 (8.3%) | 1.80 |
| Non-family | 142 (33.7%) | 1.07 |
| Total Households | 421 (100.0%) | 2.20 |
Household Size by Marriage Status in West Cape May borough
Out of a total of 421 households in West Cape May borough, 279 (66.3%) are family households, while 142 (33.7%) are nonfamily households. The most numerous type of family households are 2-person households, comprising 197, and the most common type of nonfamily households are 1-person households, comprising 121.
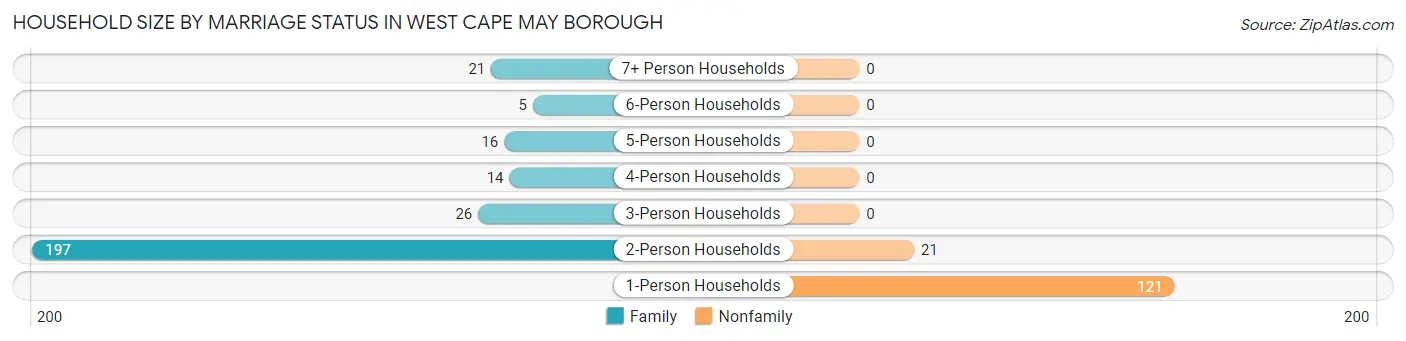
| Household Size | Family Households | Nonfamily Households |
| 1-Person Households | - | 121 (28.7%) |
| 2-Person Households | 197 (46.8%) | 21 (5.0%) |
| 3-Person Households | 26 (6.2%) | 0 (0.0%) |
| 4-Person Households | 14 (3.3%) | 0 (0.0%) |
| 5-Person Households | 16 (3.8%) | 0 (0.0%) |
| 6-Person Households | 5 (1.2%) | 0 (0.0%) |
| 7+ Person Households | 21 (5.0%) | 0 (0.0%) |
| Total | 279 (66.3%) | 142 (33.7%) |
Female Fertility in West Cape May borough
Fertility by Age in West Cape May borough
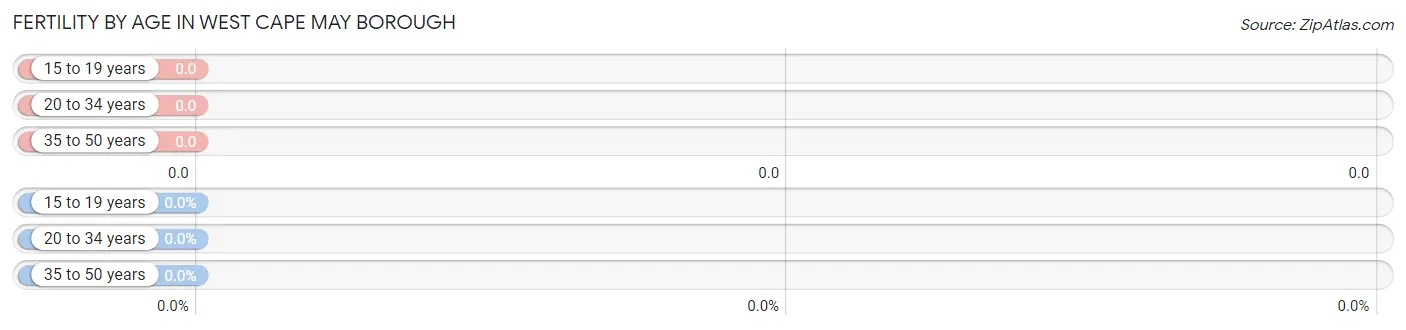
| Age Bracket | Women with Births | Births / 1,000 Women |
| 15 to 19 years | 0 (0.0%) | 0.0 |
| 20 to 34 years | 0 (0.0%) | 0.0 |
| 35 to 50 years | 0 (0.0%) | 0.0 |
| Total | 0 (0.0%) | 0.0 |
Fertility by Age by Marriage Status in West Cape May borough
| Age Bracket | Married | Unmarried |
| 15 to 19 years | 0 (0.0%) | 0 (0.0%) |
| 20 to 34 years | 0 (0.0%) | 0 (0.0%) |
| 35 to 50 years | 0 (0.0%) | 0 (0.0%) |
| Total | 0 (0.0%) | 0 (0.0%) |
Fertility by Education in West Cape May borough
| Educational Attainment | Women with Births | Births / 1,000 Women |
| Less than High School | 0 (0.0%) | 0.0 |
| High School Diploma | 0 (0.0%) | 0.0 |
| College or Associate's Degree | 0 (0.0%) | 0.0 |
| Bachelor's Degree | 0 (0.0%) | 0.0 |
| Graduate Degree | 0 (0.0%) | 0.0 |
| Total | 0 (0.0%) | 0.0 |
Fertility by Education by Marriage Status in West Cape May borough
| Educational Attainment | Married | Unmarried |
| Less than High School | 0 (0.0%) | 0 (0.0%) |
| High School Diploma | 0 (0.0%) | 0 (0.0%) |
| College or Associate's Degree | 0 (0.0%) | 0 (0.0%) |
| Bachelor's Degree | 0 (0.0%) | 0 (0.0%) |
| Graduate Degree | 0 (0.0%) | 0 (0.0%) |
| Total | 0 (0.0%) | 0 (0.0%) |
Income in West Cape May borough
Income Overview in West Cape May borough
Per Capita Income in West Cape May borough is $51,818, while median incomes of families and households are $106,250 and $87,212 respectively.
| Characteristic | Number | Measure |
| Per Capita Income | 927 | $51,818 |
| Median Family Income | 279 | $106,250 |
| Mean Family Income | 279 | $136,676 |
| Median Household Income | 421 | $87,212 |
| Mean Household Income | 421 | $114,762 |
| Income Deficit | 279 | $0 |
| Wage / Income Gap (%) | 927 | 0.00% |
| Wage / Income Gap ($) | 927 | 100.00¢ per $1 |
| Gini / Inequality Index | 927 | 0.42 |
Earnings by Sex in West Cape May borough
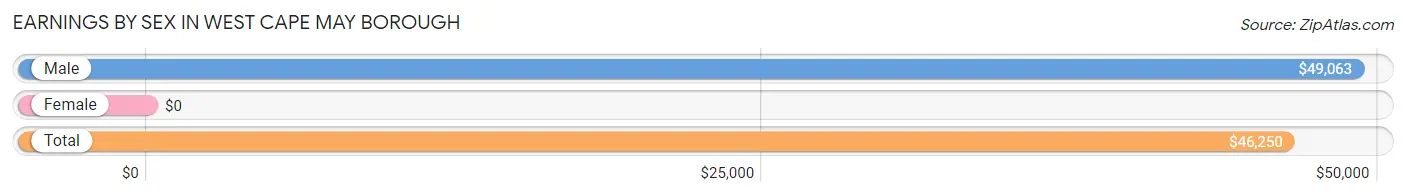
| Sex | Number | Average Earnings |
| Male | 267 (57.5%) | $49,063 |
| Female | 197 (42.5%) | $0 |
| Total | 464 (100.0%) | $46,250 |
Earnings by Sex by Income Bracket in West Cape May borough
The most common earnings brackets in West Cape May borough are $100,000+ for men (53 | 19.9%) and $75,000 to $99,999 for women (61 | 31.0%).
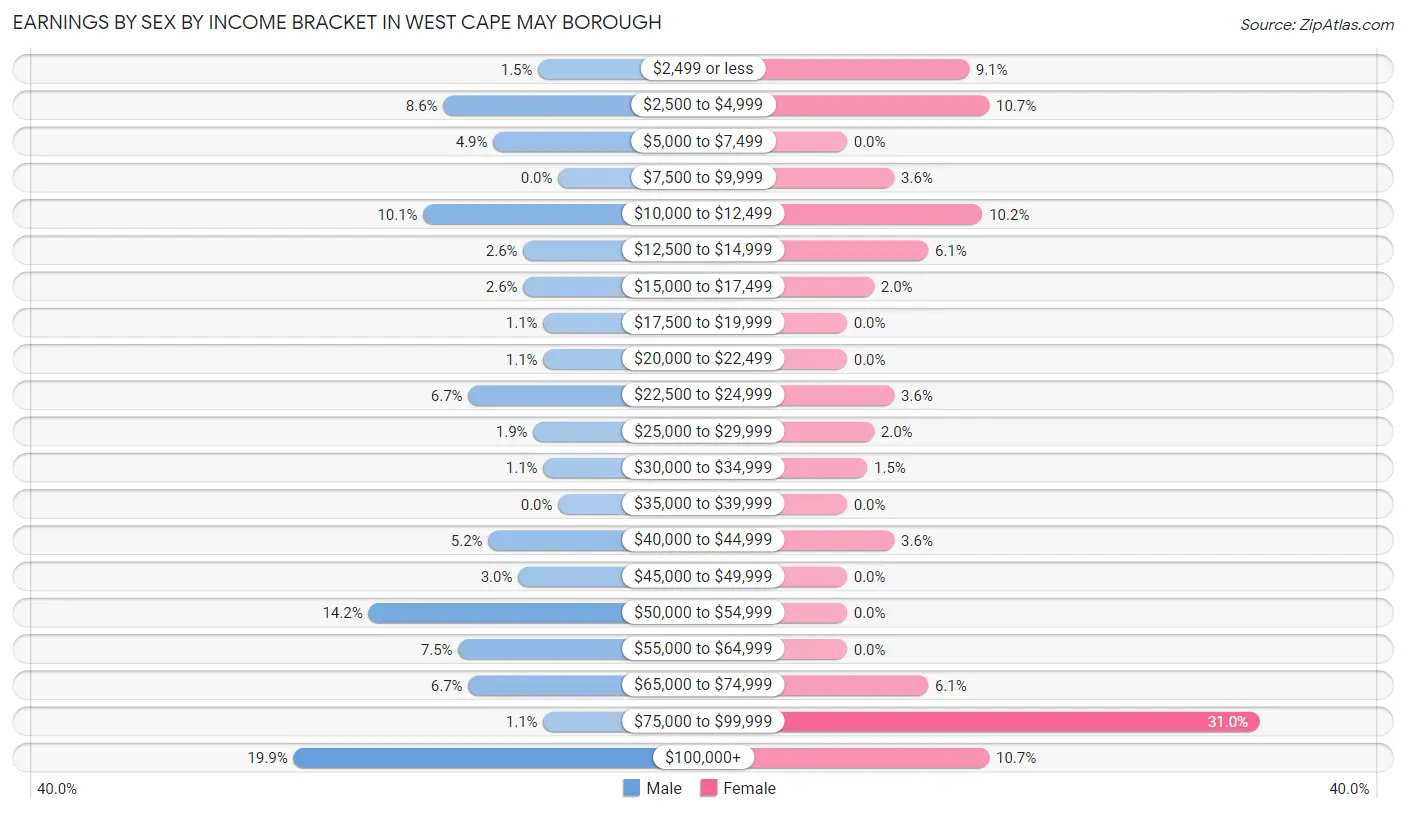
| Income | Male | Female |
| $2,499 or less | 4 (1.5%) | 18 (9.1%) |
| $2,500 to $4,999 | 23 (8.6%) | 21 (10.7%) |
| $5,000 to $7,499 | 13 (4.9%) | 0 (0.0%) |
| $7,500 to $9,999 | 0 (0.0%) | 7 (3.5%) |
| $10,000 to $12,499 | 27 (10.1%) | 20 (10.2%) |
| $12,500 to $14,999 | 7 (2.6%) | 12 (6.1%) |
| $15,000 to $17,499 | 7 (2.6%) | 4 (2.0%) |
| $17,500 to $19,999 | 3 (1.1%) | 0 (0.0%) |
| $20,000 to $22,499 | 3 (1.1%) | 0 (0.0%) |
| $22,500 to $24,999 | 18 (6.7%) | 7 (3.5%) |
| $25,000 to $29,999 | 5 (1.9%) | 4 (2.0%) |
| $30,000 to $34,999 | 3 (1.1%) | 3 (1.5%) |
| $35,000 to $39,999 | 0 (0.0%) | 0 (0.0%) |
| $40,000 to $44,999 | 14 (5.2%) | 7 (3.5%) |
| $45,000 to $49,999 | 8 (3.0%) | 0 (0.0%) |
| $50,000 to $54,999 | 38 (14.2%) | 0 (0.0%) |
| $55,000 to $64,999 | 20 (7.5%) | 0 (0.0%) |
| $65,000 to $74,999 | 18 (6.7%) | 12 (6.1%) |
| $75,000 to $99,999 | 3 (1.1%) | 61 (31.0%) |
| $100,000+ | 53 (19.9%) | 21 (10.7%) |
| Total | 267 (100.0%) | 197 (100.0%) |
Earnings by Sex by Educational Attainment in West Cape May borough
Average earnings in West Cape May borough are $51,389 for men and $69,688 for women, a difference of 26.3%. Men with an educational attainment of graduate degree enjoy the highest average annual earnings of $108,750, while those with high school diploma education earn the least with $50,556. Women with an educational attainment of graduate degree earn the most with the average annual earnings of $79,000, while those with college or associate's degree education have the smallest earnings of $10,781.
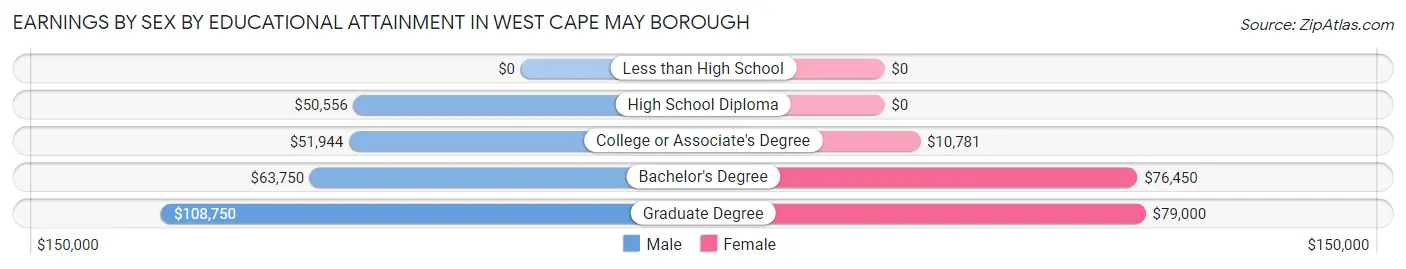
| Educational Attainment | Male Income | Female Income |
| Less than High School | - | - |
| High School Diploma | $50,556 | $0 |
| College or Associate's Degree | $51,944 | $10,781 |
| Bachelor's Degree | $63,750 | $76,450 |
| Graduate Degree | $108,750 | $79,000 |
| Total | $51,389 | $69,688 |
Family Income in West Cape May borough
Family Income Brackets in West Cape May borough
According to the West Cape May borough family income data, there are 63 families falling into the $50,000 to $74,999 income range, which is the most common income bracket and makes up 22.6% of all families.
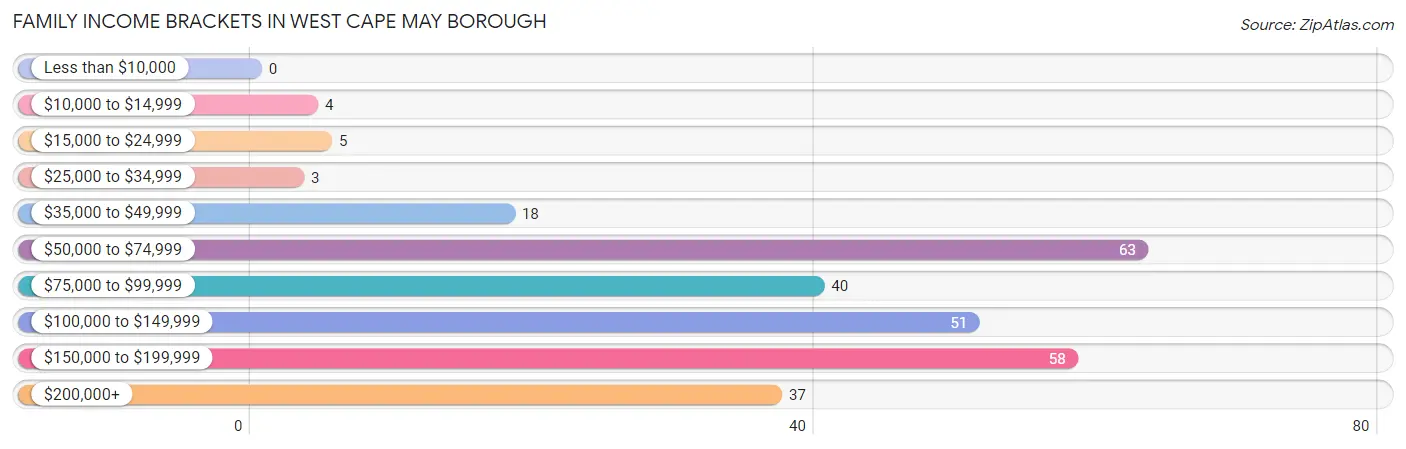
| Income Bracket | # Families | % Families |
| Less than $10,000 | 0 | 0.0% |
| $10,000 to $14,999 | 4 | 1.4% |
| $15,000 to $24,999 | 5 | 1.8% |
| $25,000 to $34,999 | 3 | 1.1% |
| $35,000 to $49,999 | 18 | 6.5% |
| $50,000 to $74,999 | 63 | 22.6% |
| $75,000 to $99,999 | 40 | 14.3% |
| $100,000 to $149,999 | 51 | 18.3% |
| $150,000 to $199,999 | 58 | 20.8% |
| $200,000+ | 37 | 13.3% |
Family Income by Famaliy Size in West Cape May borough
3-person families (26 | 9.3%) account for the highest median family income in West Cape May borough with $146,818 per family, while 3-person families (26 | 9.3%) have the highest median income of $48,939 per family member.
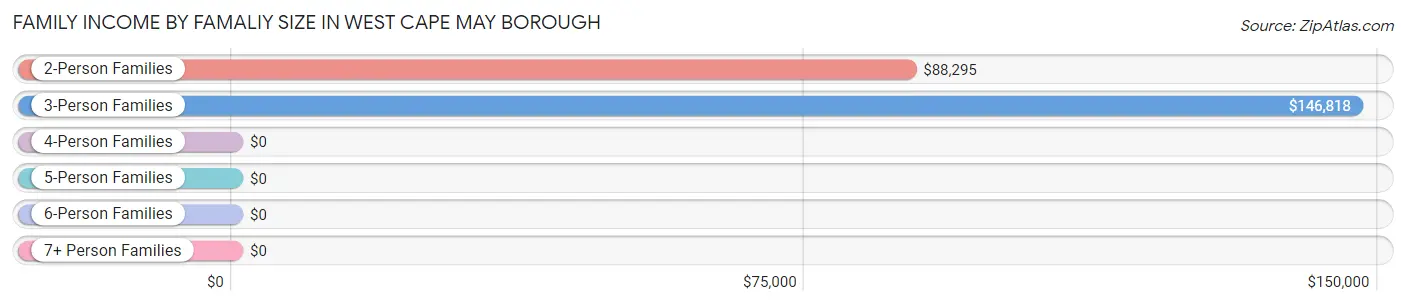
| Income Bracket | # Families | Median Income |
| 2-Person Families | 197 (70.6%) | $88,295 |
| 3-Person Families | 26 (9.3%) | $146,818 |
| 4-Person Families | 14 (5.0%) | $0 |
| 5-Person Families | 16 (5.7%) | $0 |
| 6-Person Families | 5 (1.8%) | $0 |
| 7+ Person Families | 21 (7.5%) | $0 |
| Total | 279 (100.0%) | $106,250 |
Family Income by Number of Earners in West Cape May borough
The median family income in West Cape May borough is $106,250, with families comprising 3+ earners (41) having the highest median family income of $168,036, while families with no earners (78) have the lowest median family income of $58,333, accounting for 14.7% and 28.0% of families, respectively.
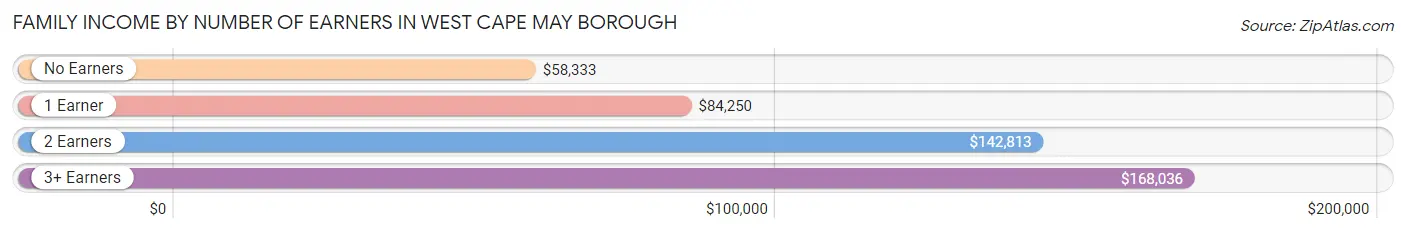
| Number of Earners | # Families | Median Income |
| No Earners | 78 (28.0%) | $58,333 |
| 1 Earner | 69 (24.7%) | $84,250 |
| 2 Earners | 91 (32.6%) | $142,813 |
| 3+ Earners | 41 (14.7%) | $168,036 |
| Total | 279 (100.0%) | $106,250 |
Household Income in West Cape May borough
Household Income Brackets in West Cape May borough
With 85 households falling in the category, the $50,000 to $74,999 income range is the most frequent in West Cape May borough, accounting for 20.2% of all households. In contrast, only 3 households (0.7%) fall into the less than $10,000 income bracket, making it the least populous group.
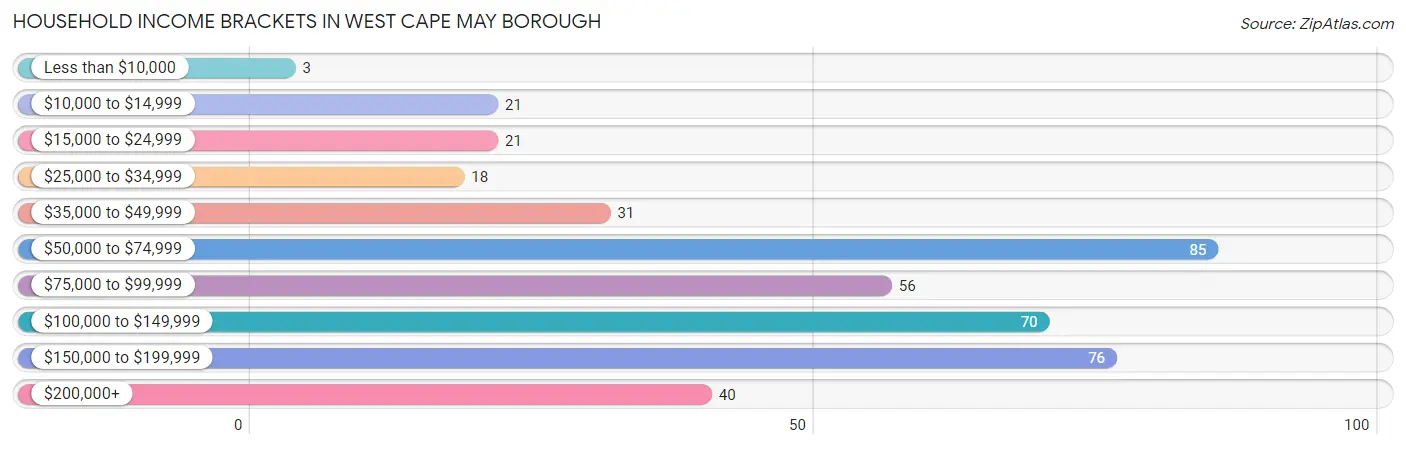
| Income Bracket | # Households | % Households |
| Less than $10,000 | 3 | 0.7% |
| $10,000 to $14,999 | 21 | 5.0% |
| $15,000 to $24,999 | 21 | 5.0% |
| $25,000 to $34,999 | 18 | 4.3% |
| $35,000 to $49,999 | 31 | 7.4% |
| $50,000 to $74,999 | 85 | 20.2% |
| $75,000 to $99,999 | 56 | 13.3% |
| $100,000 to $149,999 | 70 | 16.6% |
| $150,000 to $199,999 | 76 | 18.1% |
| $200,000+ | 40 | 9.5% |
Household Income by Householder Age in West Cape May borough
The median household income in West Cape May borough is $87,212, with the highest median household income of $147,386 found in the 45 to 64 years age bracket for the primary householder. A total of 137 households (32.5%) fall into this category. Meanwhile, the 15 to 24 years age bracket for the primary householder has the lowest median household income of $0, with 10 households (2.4%) in this group.
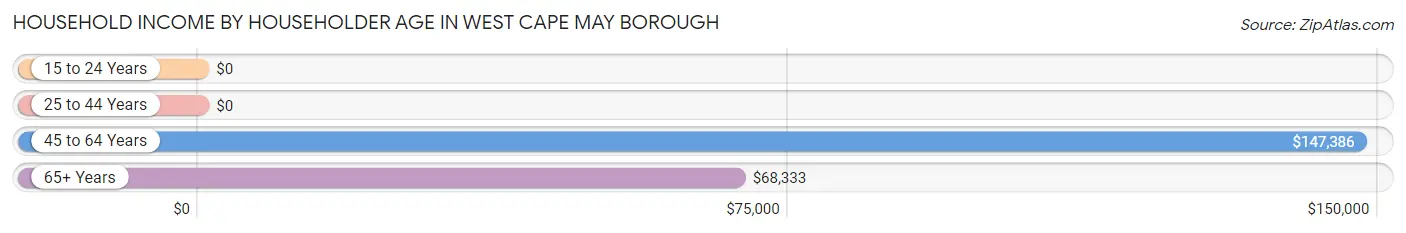
| Income Bracket | # Households | Median Income |
| 15 to 24 Years | 10 (2.4%) | $0 |
| 25 to 44 Years | 40 (9.5%) | $0 |
| 45 to 64 Years | 137 (32.5%) | $147,386 |
| 65+ Years | 234 (55.6%) | $68,333 |
| Total | 421 (100.0%) | $87,212 |
Poverty in West Cape May borough
Income Below Poverty by Sex and Age in West Cape May borough
With 3.7% poverty level for males and 2.1% for females among the residents of West Cape May borough, 45 to 54 year old males and 65 to 74 year old females are the most vulnerable to poverty, with 10 males (20.8%) and 4 females (4.1%) in their respective age groups living below the poverty level.
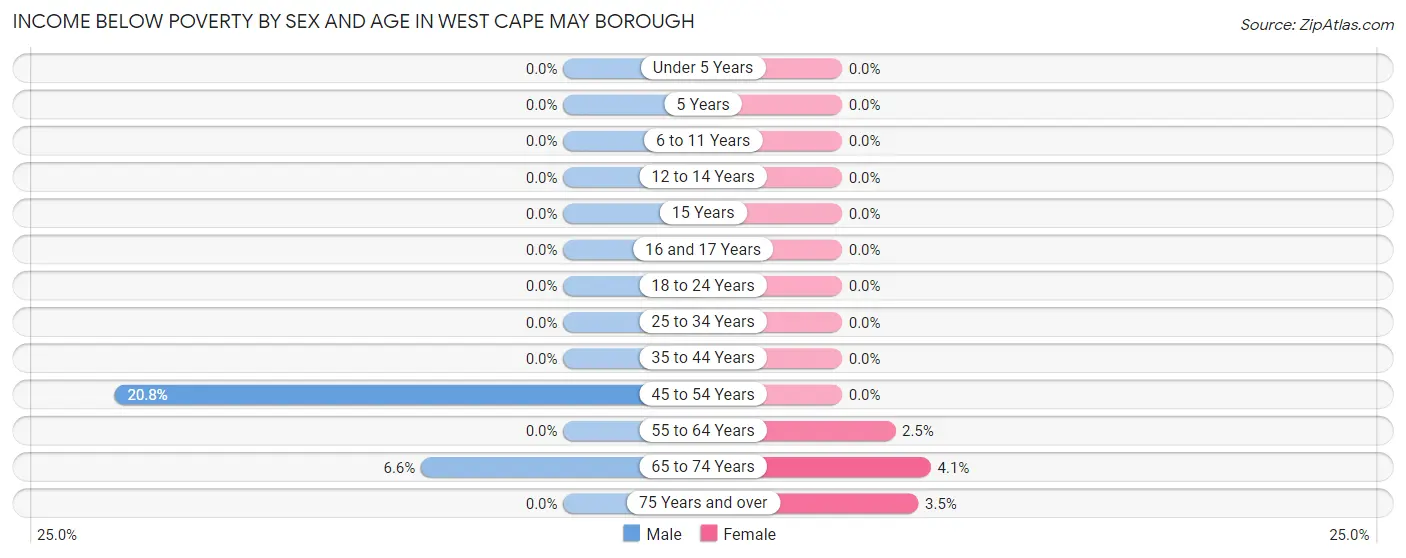
| Age Bracket | Male | Female |
| Under 5 Years | 0 (0.0%) | 0 (0.0%) |
| 5 Years | 0 (0.0%) | 0 (0.0%) |
| 6 to 11 Years | 0 (0.0%) | 0 (0.0%) |
| 12 to 14 Years | 0 (0.0%) | 0 (0.0%) |
| 15 Years | 0 (0.0%) | 0 (0.0%) |
| 16 and 17 Years | 0 (0.0%) | 0 (0.0%) |
| 18 to 24 Years | 0 (0.0%) | 0 (0.0%) |
| 25 to 34 Years | 0 (0.0%) | 0 (0.0%) |
| 35 to 44 Years | 0 (0.0%) | 0 (0.0%) |
| 45 to 54 Years | 10 (20.8%) | 0 (0.0%) |
| 55 to 64 Years | 0 (0.0%) | 2 (2.5%) |
| 65 to 74 Years | 7 (6.6%) | 4 (4.1%) |
| 75 Years and over | 0 (0.0%) | 4 (3.5%) |
| Total | 17 (3.7%) | 10 (2.1%) |
Income Above Poverty by Sex and Age in West Cape May borough
According to the poverty statistics in West Cape May borough, males aged under 5 years and females aged under 5 years are the age groups that are most secure financially, with 100.0% of males and 100.0% of females in these age groups living above the poverty line.
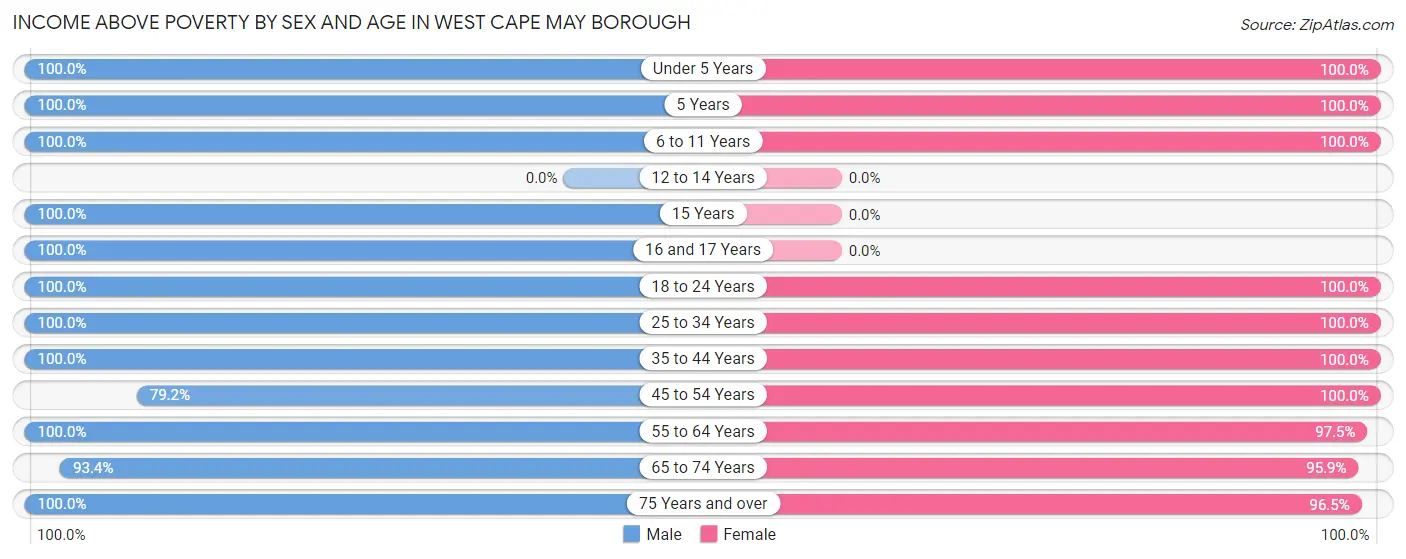
| Age Bracket | Male | Female |
| Under 5 Years | 8 (100.0%) | 34 (100.0%) |
| 5 Years | 9 (100.0%) | 11 (100.0%) |
| 6 to 11 Years | 31 (100.0%) | 12 (100.0%) |
| 12 to 14 Years | 0 (0.0%) | 0 (0.0%) |
| 15 Years | 19 (100.0%) | 0 (0.0%) |
| 16 and 17 Years | 20 (100.0%) | 0 (0.0%) |
| 18 to 24 Years | 23 (100.0%) | 29 (100.0%) |
| 25 to 34 Years | 38 (100.0%) | 15 (100.0%) |
| 35 to 44 Years | 29 (100.0%) | 21 (100.0%) |
| 45 to 54 Years | 38 (79.2%) | 53 (100.0%) |
| 55 to 64 Years | 79 (100.0%) | 79 (97.5%) |
| 65 to 74 Years | 99 (93.4%) | 93 (95.9%) |
| 75 Years and over | 51 (100.0%) | 109 (96.5%) |
| Total | 444 (96.3%) | 456 (97.9%) |
Income Below Poverty Among Married-Couple Families in West Cape May borough
The poverty statistics for married-couple families in West Cape May borough show that 1.6% or 4 of the total 244 families live below the poverty line. Families with no children have the highest poverty rate of 2.1%, comprising of 4 families. On the other hand, families with 1 or 2 children have the lowest poverty rate of 0.0%, which includes 0 families.
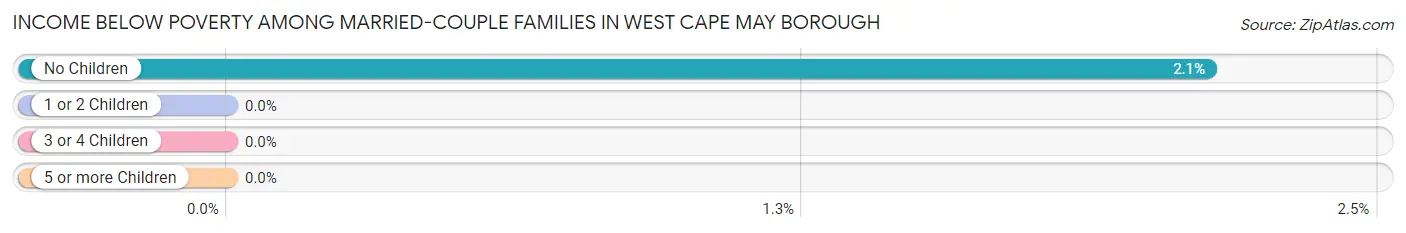
| Children | Above Poverty | Below Poverty |
| No Children | 184 (97.9%) | 4 (2.1%) |
| 1 or 2 Children | 31 (100.0%) | 0 (0.0%) |
| 3 or 4 Children | 25 (100.0%) | 0 (0.0%) |
| 5 or more Children | 0 (0.0%) | 0 (0.0%) |
| Total | 240 (98.4%) | 4 (1.6%) |
Income Below Poverty Among Single-Parent Households in West Cape May borough
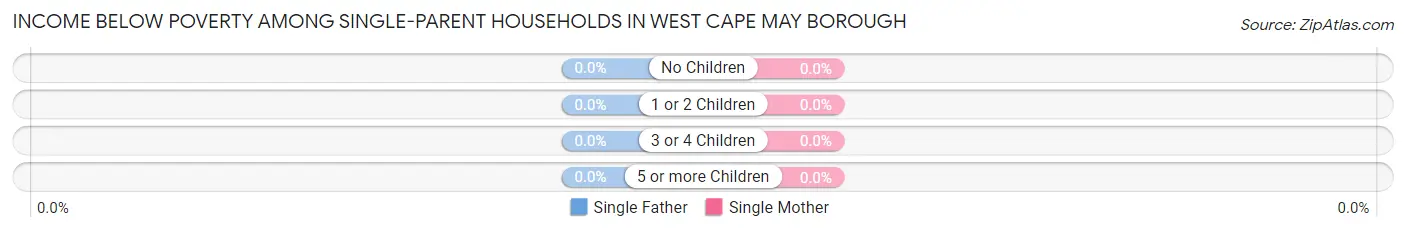
| Children | Single Father | Single Mother |
| No Children | 0 (0.0%) | 0 (0.0%) |
| 1 or 2 Children | 0 (0.0%) | 0 (0.0%) |
| 3 or 4 Children | 0 (0.0%) | 0 (0.0%) |
| 5 or more Children | 0 (0.0%) | 0 (0.0%) |
| Total | 0 (0.0%) | 0 (0.0%) |
Income Below Poverty Among Married-Couple vs Single-Parent Households in West Cape May borough
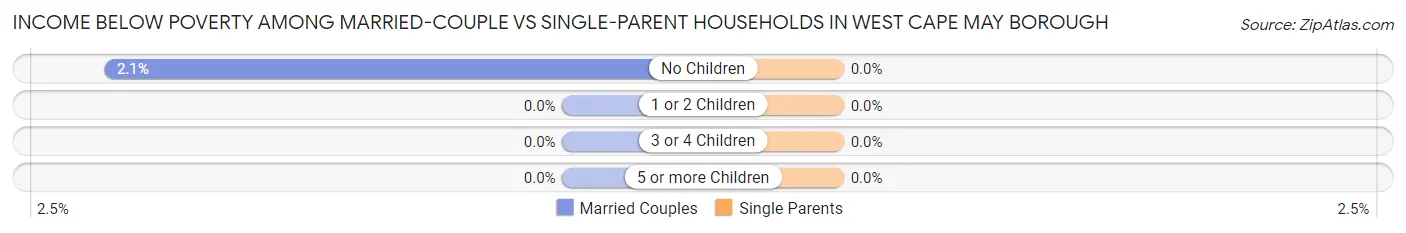
| Children | Married-Couple Families | Single-Parent Households |
| No Children | 4 (2.1%) | 0 (0.0%) |
| 1 or 2 Children | 0 (0.0%) | 0 (0.0%) |
| 3 or 4 Children | 0 (0.0%) | 0 (0.0%) |
| 5 or more Children | 0 (0.0%) | 0 (0.0%) |
| Total | 4 (1.6%) | 0 (0.0%) |
Employment Characteristics in West Cape May borough
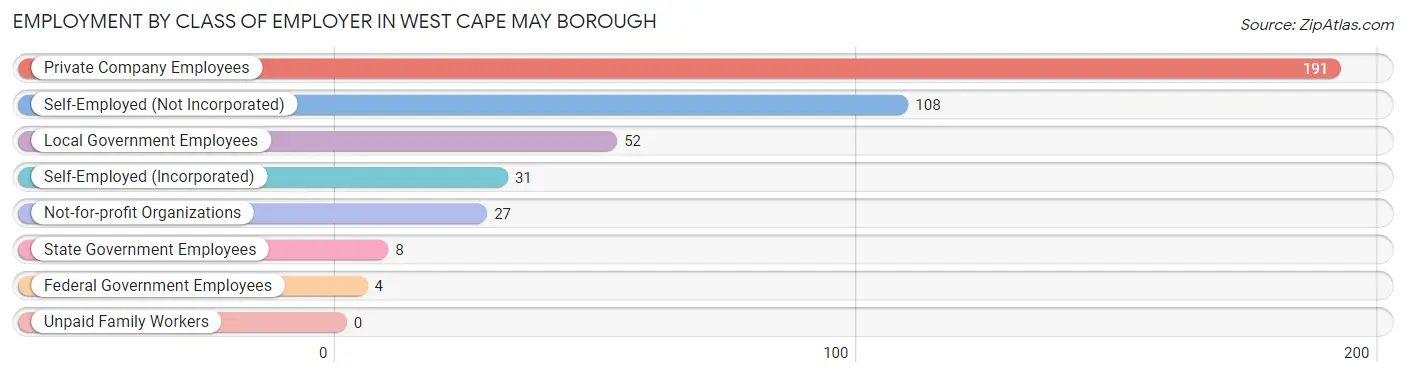
Employment by Class of Employer in West Cape May borough
Among the 421 employed individuals in West Cape May borough, private company employees (191 | 45.4%), self-employed (not incorporated) (108 | 25.7%), and local government employees (52 | 12.3%) make up the most common classes of employment.
| Employer Class | # Employees | % Employees |
| Private Company Employees | 191 | 45.4% |
| Self-Employed (Incorporated) | 31 | 7.4% |
| Self-Employed (Not Incorporated) | 108 | 25.7% |
| Not-for-profit Organizations | 27 | 6.4% |
| Local Government Employees | 52 | 12.3% |
| State Government Employees | 8 | 1.9% |
| Federal Government Employees | 4 | 0.9% |
| Unpaid Family Workers | 0 | 0.0% |
| Total | 421 | 100.0% |
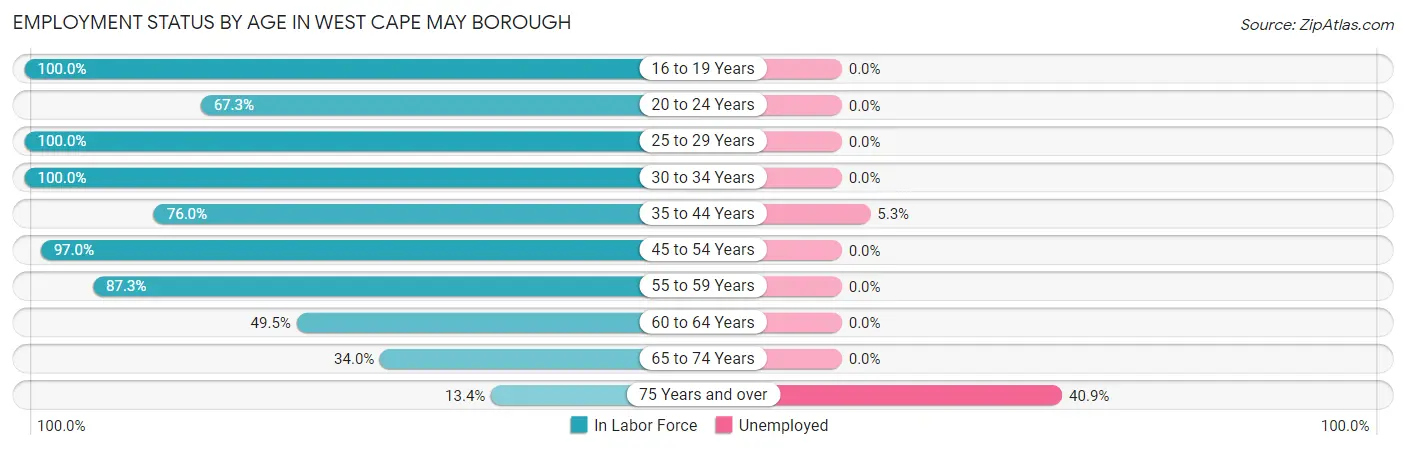
Employment Status by Age in West Cape May borough
According to the labor force statistics for West Cape May borough, out of the total population over 16 years of age (803), 54.2% or 435 individuals are in the labor force, with 2.5% or 11 of them unemployed. The age group with the highest labor force participation rate is 16 to 19 years, with 100.0% or 20 individuals in the labor force. Within the labor force, the 75 years and over age range has the highest percentage of unemployed individuals, with 40.9% or 9 of them being unemployed.
| Age Bracket | In Labor Force | Unemployed |
| 16 to 19 Years | 20 (100.0%) | 0 (0.0%) |
| 20 to 24 Years | 35 (67.3%) | 0 (0.0%) |
| 25 to 29 Years | 25 (100.0%) | 0 (0.0%) |
| 30 to 34 Years | 28 (100.0%) | 0 (0.0%) |
| 35 to 44 Years | 38 (76.0%) | 2 (5.3%) |
| 45 to 54 Years | 98 (97.0%) | 0 (0.0%) |
| 55 to 59 Years | 48 (87.3%) | 0 (0.0%) |
| 60 to 64 Years | 52 (49.5%) | 0 (0.0%) |
| 65 to 74 Years | 69 (34.0%) | 0 (0.0%) |
| 75 Years and over | 22 (13.4%) | 9 (40.9%) |
| Total | 435 (54.2%) | 11 (2.5%) |
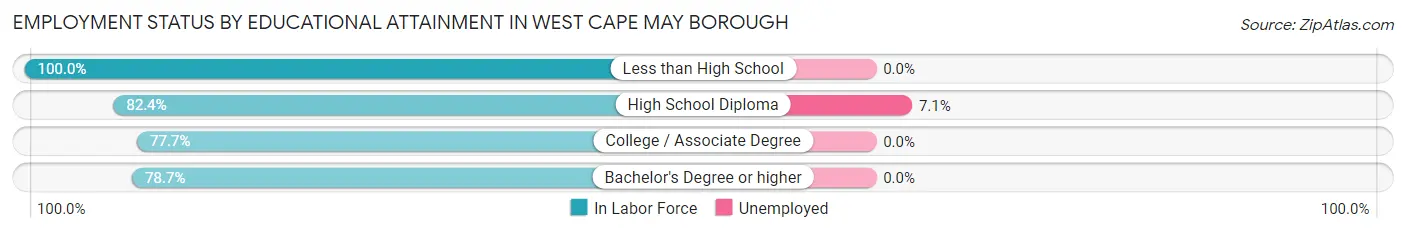
Employment Status by Educational Attainment in West Cape May borough
According to labor force statistics for West Cape May borough, 79.4% of individuals (289) out of the total population between 25 and 64 years of age (364) are in the labor force, with 0.7% or 2 of them being unemployed. The group with the highest labor force participation rate are those with the educational attainment of less than high school, with 100.0% or 12 individuals in the labor force. Within the labor force, individuals with high school diploma education have the highest percentage of unemployment, with 7.1% or 2 of them being unemployed.
| Educational Attainment | In Labor Force | Unemployed |
| Less than High School | 12 (100.0%) | 0 (0.0%) |
| High School Diploma | 28 (82.4%) | 2 (7.1%) |
| College / Associate Degree | 101 (77.7%) | 0 (0.0%) |
| Bachelor's Degree or higher | 148 (78.7%) | 0 (0.0%) |
| Total | 289 (79.4%) | 3 (0.7%) |
Employment Occupations by Sex in West Cape May borough
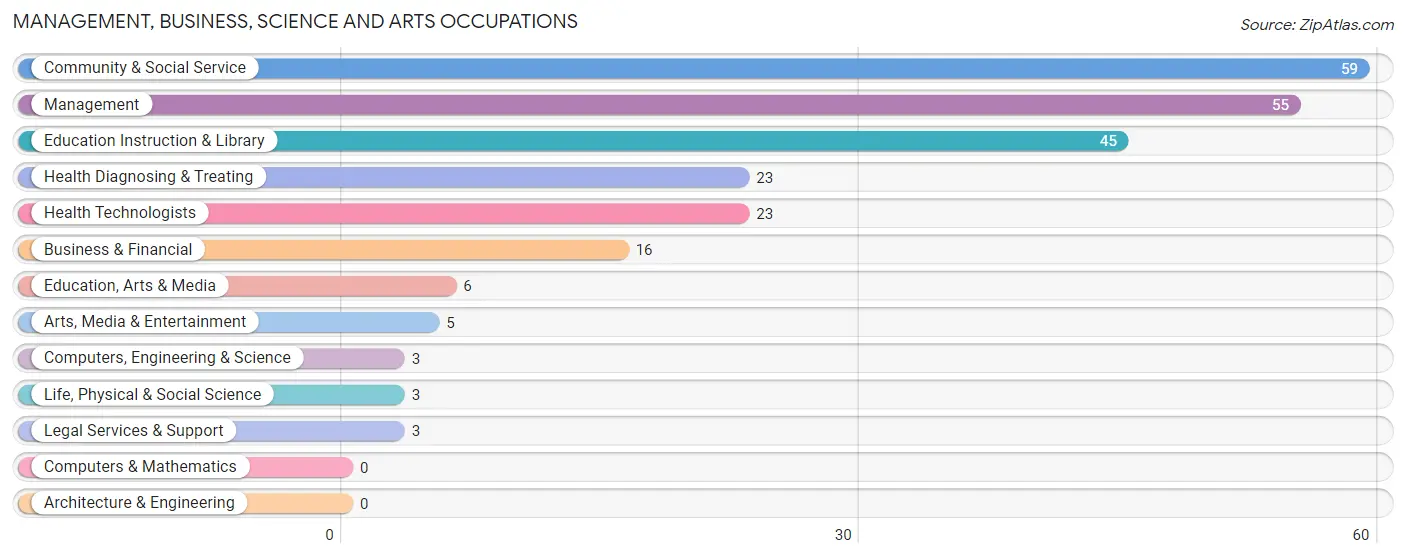
Management, Business, Science and Arts Occupations
The most common Management, Business, Science and Arts occupations in West Cape May borough are Community & Social Service (59 | 13.9%), Management (55 | 13.0%), Education Instruction & Library (45 | 10.6%), Health Diagnosing & Treating (23 | 5.4%), and Health Technologists (23 | 5.4%).
Management, Business, Science and Arts Occupations by Sex
Within the Management, Business, Science and Arts occupations in West Cape May borough, the most male-oriented occupations are Education, Arts & Media (100.0%), Legal Services & Support (100.0%), and Business & Financial (75.0%), while the most female-oriented occupations are Computers, Engineering & Science (100.0%), Life, Physical & Social Science (100.0%), and Arts, Media & Entertainment (100.0%).
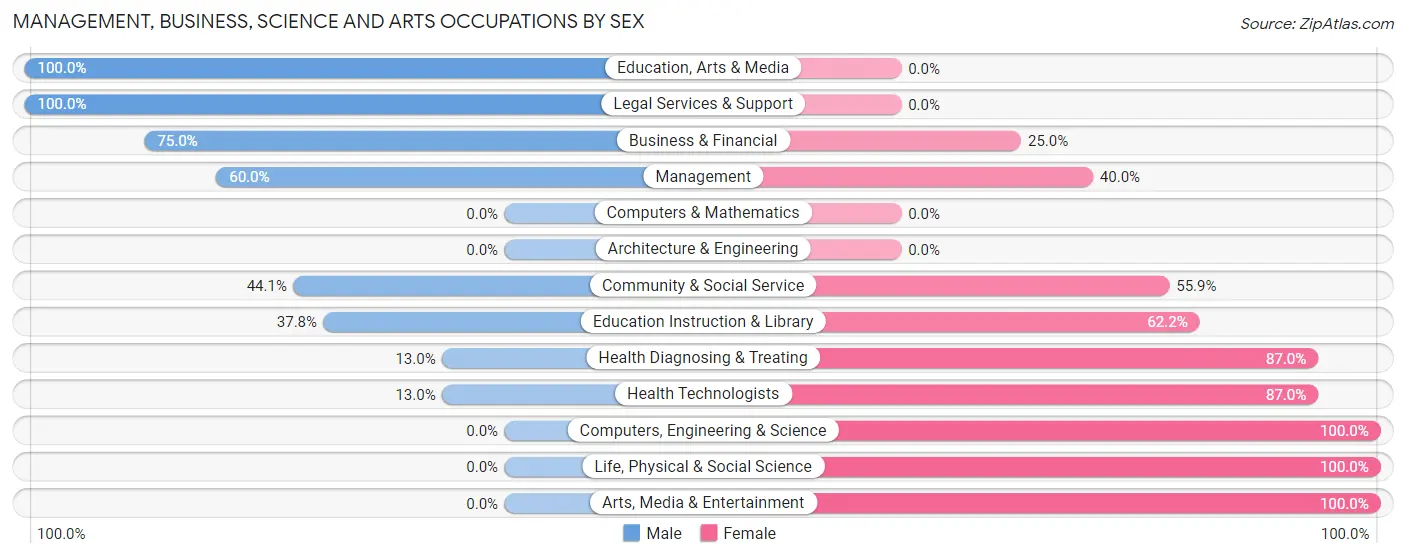
| Occupation | Male | Female |
| Management | 33 (60.0%) | 22 (40.0%) |
| Business & Financial | 12 (75.0%) | 4 (25.0%) |
| Computers, Engineering & Science | 0 (0.0%) | 3 (100.0%) |
| Computers & Mathematics | 0 (0.0%) | 0 (0.0%) |
| Architecture & Engineering | 0 (0.0%) | 0 (0.0%) |
| Life, Physical & Social Science | 0 (0.0%) | 3 (100.0%) |
| Community & Social Service | 26 (44.1%) | 33 (55.9%) |
| Education, Arts & Media | 6 (100.0%) | 0 (0.0%) |
| Legal Services & Support | 3 (100.0%) | 0 (0.0%) |
| Education Instruction & Library | 17 (37.8%) | 28 (62.2%) |
| Arts, Media & Entertainment | 0 (0.0%) | 5 (100.0%) |
| Health Diagnosing & Treating | 3 (13.0%) | 20 (87.0%) |
| Health Technologists | 3 (13.0%) | 20 (87.0%) |
| Total (Category) | 74 (47.4%) | 82 (52.6%) |
| Total (Overall) | 257 (60.6%) | 167 (39.4%) |
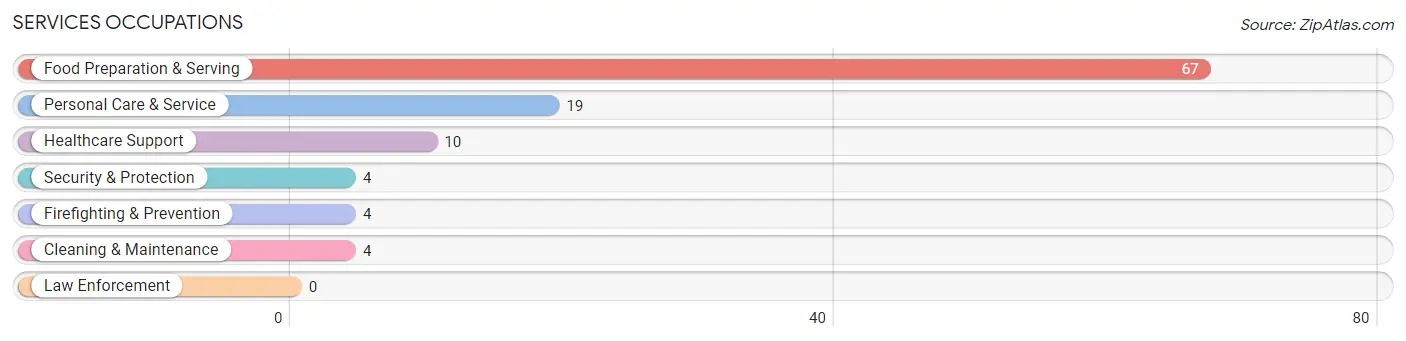
Services Occupations
The most common Services occupations in West Cape May borough are Food Preparation & Serving (67 | 15.8%), Personal Care & Service (19 | 4.5%), Healthcare Support (10 | 2.4%), Security & Protection (4 | 0.9%), and Firefighting & Prevention (4 | 0.9%).
Services Occupations by Sex
Within the Services occupations in West Cape May borough, the most male-oriented occupations are Security & Protection (100.0%), Firefighting & Prevention (100.0%), and Cleaning & Maintenance (100.0%), while the most female-oriented occupations are Healthcare Support (100.0%), Personal Care & Service (63.2%), and Food Preparation & Serving (31.3%).
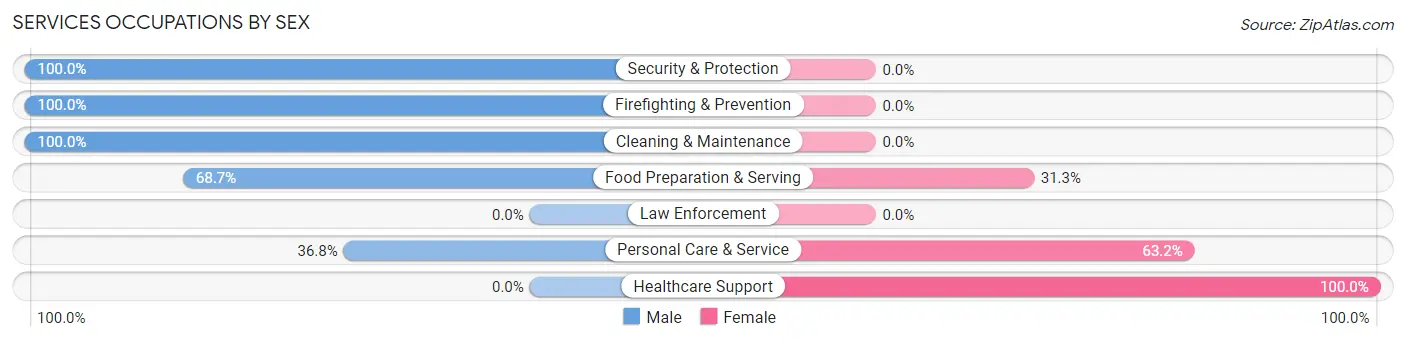
| Occupation | Male | Female |
| Healthcare Support | 0 (0.0%) | 10 (100.0%) |
| Security & Protection | 4 (100.0%) | 0 (0.0%) |
| Firefighting & Prevention | 4 (100.0%) | 0 (0.0%) |
| Law Enforcement | 0 (0.0%) | 0 (0.0%) |
| Food Preparation & Serving | 46 (68.7%) | 21 (31.3%) |
| Cleaning & Maintenance | 4 (100.0%) | 0 (0.0%) |
| Personal Care & Service | 7 (36.8%) | 12 (63.2%) |
| Total (Category) | 61 (58.7%) | 43 (41.3%) |
| Total (Overall) | 257 (60.6%) | 167 (39.4%) |
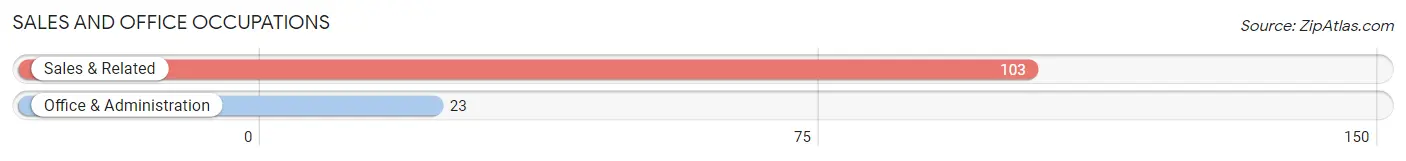
Sales and Office Occupations
The most common Sales and Office occupations in West Cape May borough are Sales & Related (103 | 24.3%), and Office & Administration (23 | 5.4%).
Sales and Office Occupations by Sex
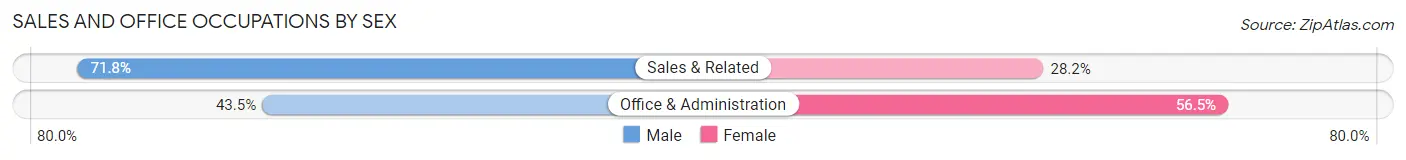
| Occupation | Male | Female |
| Sales & Related | 74 (71.8%) | 29 (28.2%) |
| Office & Administration | 10 (43.5%) | 13 (56.5%) |
| Total (Category) | 84 (66.7%) | 42 (33.3%) |
| Total (Overall) | 257 (60.6%) | 167 (39.4%) |
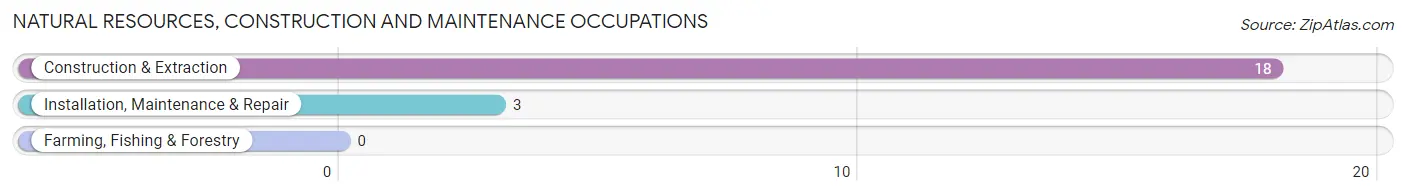
Natural Resources, Construction and Maintenance Occupations
The most common Natural Resources, Construction and Maintenance occupations in West Cape May borough are Construction & Extraction (18 | 4.3%), and Installation, Maintenance & Repair (3 | 0.7%).
Natural Resources, Construction and Maintenance Occupations by Sex
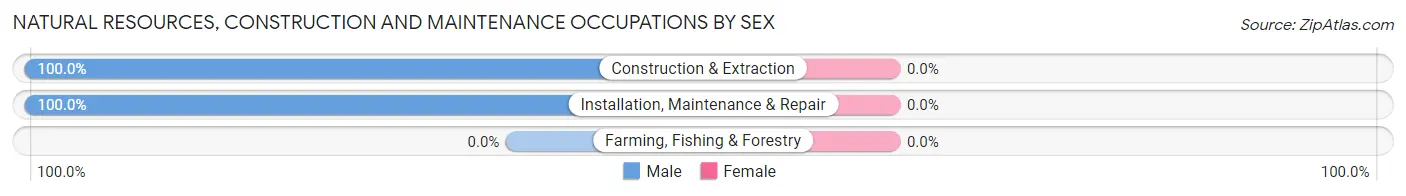
| Occupation | Male | Female |
| Farming, Fishing & Forestry | 0 (0.0%) | 0 (0.0%) |
| Construction & Extraction | 18 (100.0%) | 0 (0.0%) |
| Installation, Maintenance & Repair | 3 (100.0%) | 0 (0.0%) |
| Total (Category) | 21 (100.0%) | 0 (0.0%) |
| Total (Overall) | 257 (60.6%) | 167 (39.4%) |
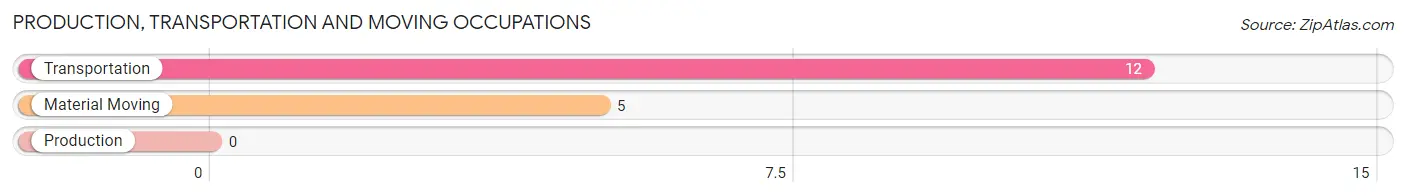
Production, Transportation and Moving Occupations
The most common Production, Transportation and Moving occupations in West Cape May borough are Transportation (12 | 2.8%), and Material Moving (5 | 1.2%).
Production, Transportation and Moving Occupations by Sex
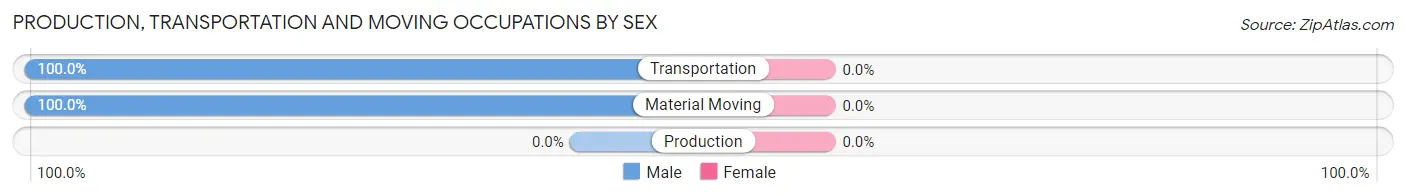
| Occupation | Male | Female |
| Production | 0 (0.0%) | 0 (0.0%) |
| Transportation | 12 (100.0%) | 0 (0.0%) |
| Material Moving | 5 (100.0%) | 0 (0.0%) |
| Total (Category) | 17 (100.0%) | 0 (0.0%) |
| Total (Overall) | 257 (60.6%) | 167 (39.4%) |
Employment Industries by Sex in West Cape May borough
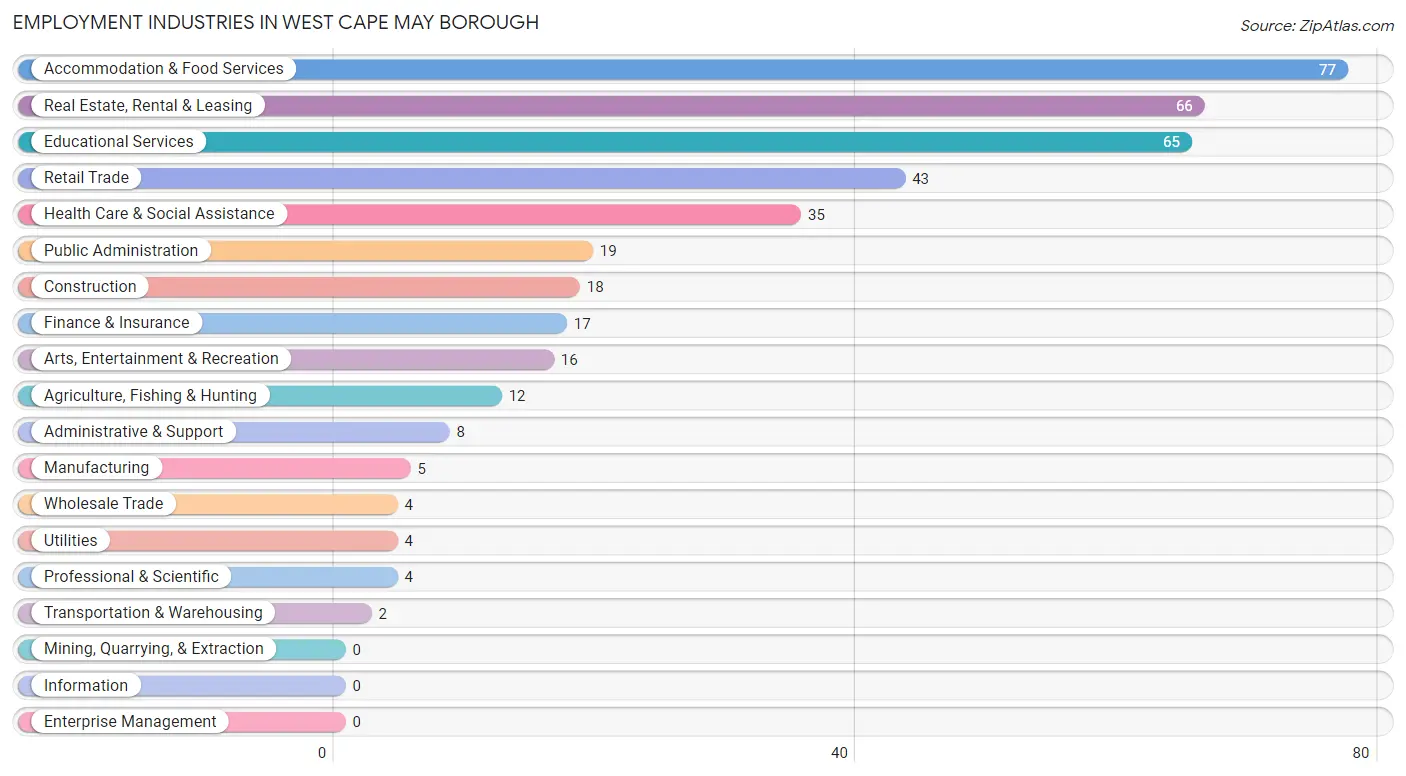
Employment Industries in West Cape May borough
The major employment industries in West Cape May borough include Accommodation & Food Services (77 | 18.2%), Real Estate, Rental & Leasing (66 | 15.6%), Educational Services (65 | 15.3%), Retail Trade (43 | 10.1%), and Health Care & Social Assistance (35 | 8.3%).
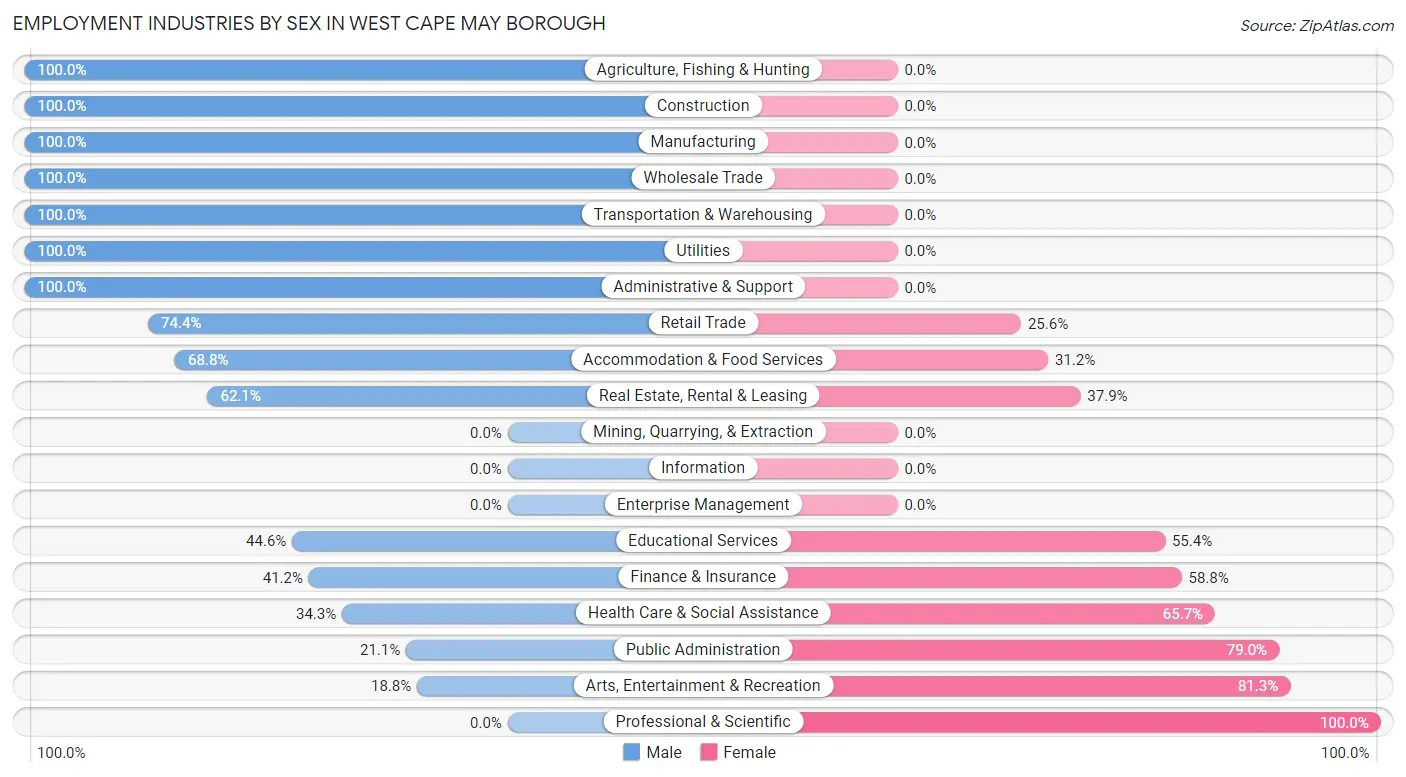
Employment Industries by Sex in West Cape May borough
The West Cape May borough industries that see more men than women are Agriculture, Fishing & Hunting (100.0%), Construction (100.0%), and Manufacturing (100.0%), whereas the industries that tend to have a higher number of women are Professional & Scientific (100.0%), Arts, Entertainment & Recreation (81.2%), and Public Administration (78.9%).
| Industry | Male | Female |
| Agriculture, Fishing & Hunting | 12 (100.0%) | 0 (0.0%) |
| Mining, Quarrying, & Extraction | 0 (0.0%) | 0 (0.0%) |
| Construction | 18 (100.0%) | 0 (0.0%) |
| Manufacturing | 5 (100.0%) | 0 (0.0%) |
| Wholesale Trade | 4 (100.0%) | 0 (0.0%) |
| Retail Trade | 32 (74.4%) | 11 (25.6%) |
| Transportation & Warehousing | 2 (100.0%) | 0 (0.0%) |
| Utilities | 4 (100.0%) | 0 (0.0%) |
| Information | 0 (0.0%) | 0 (0.0%) |
| Finance & Insurance | 7 (41.2%) | 10 (58.8%) |
| Real Estate, Rental & Leasing | 41 (62.1%) | 25 (37.9%) |
| Professional & Scientific | 0 (0.0%) | 4 (100.0%) |
| Enterprise Management | 0 (0.0%) | 0 (0.0%) |
| Administrative & Support | 8 (100.0%) | 0 (0.0%) |
| Educational Services | 29 (44.6%) | 36 (55.4%) |
| Health Care & Social Assistance | 12 (34.3%) | 23 (65.7%) |
| Arts, Entertainment & Recreation | 3 (18.8%) | 13 (81.2%) |
| Accommodation & Food Services | 53 (68.8%) | 24 (31.2%) |
| Public Administration | 4 (21.0%) | 15 (78.9%) |
| Total | 257 (60.6%) | 167 (39.4%) |
Education in West Cape May borough
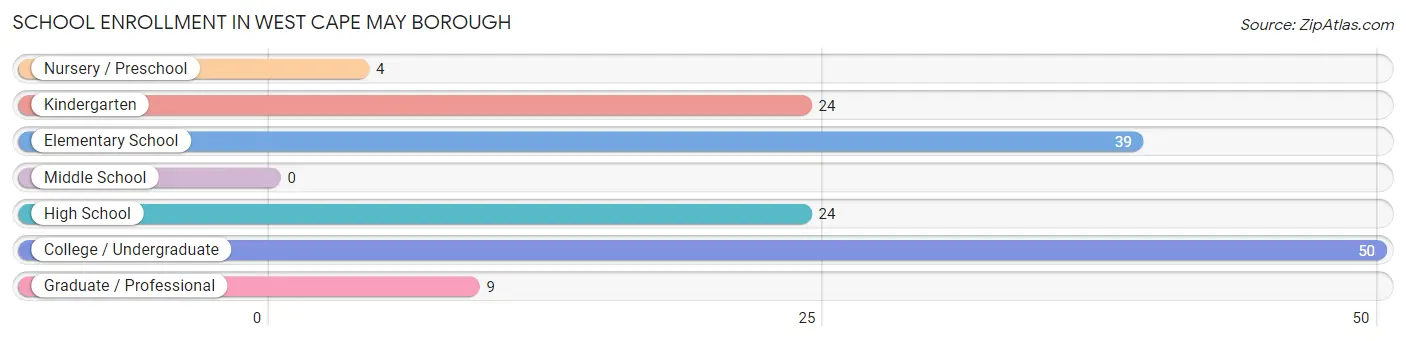
School Enrollment in West Cape May borough
The most common levels of schooling among the 150 students in West Cape May borough are college / undergraduate (50 | 33.3%), elementary school (39 | 26.0%), and kindergarten (24 | 16.0%).
| School Level | # Students | % Students |
| Nursery / Preschool | 4 | 2.7% |
| Kindergarten | 24 | 16.0% |
| Elementary School | 39 | 26.0% |
| Middle School | 0 | 0.0% |
| High School | 24 | 16.0% |
| College / Undergraduate | 50 | 33.3% |
| Graduate / Professional | 9 | 6.0% |
| Total | 150 | 100.0% |
School Enrollment by Age by Funding Source in West Cape May borough
Out of a total of 150 students who are enrolled in schools in West Cape May borough, 71 (47.3%) attend a private institution, while the remaining 79 (52.7%) are enrolled in public schools. The age group of 15 to 17 year olds has the highest likelihood of being enrolled in private schools, with 39 (100.0% in the age bracket) enrolled. Conversely, the age group of 3 to 4 year olds has the lowest likelihood of being enrolled in a private school, with 4 (100.0% in the age bracket) attending a public institution.
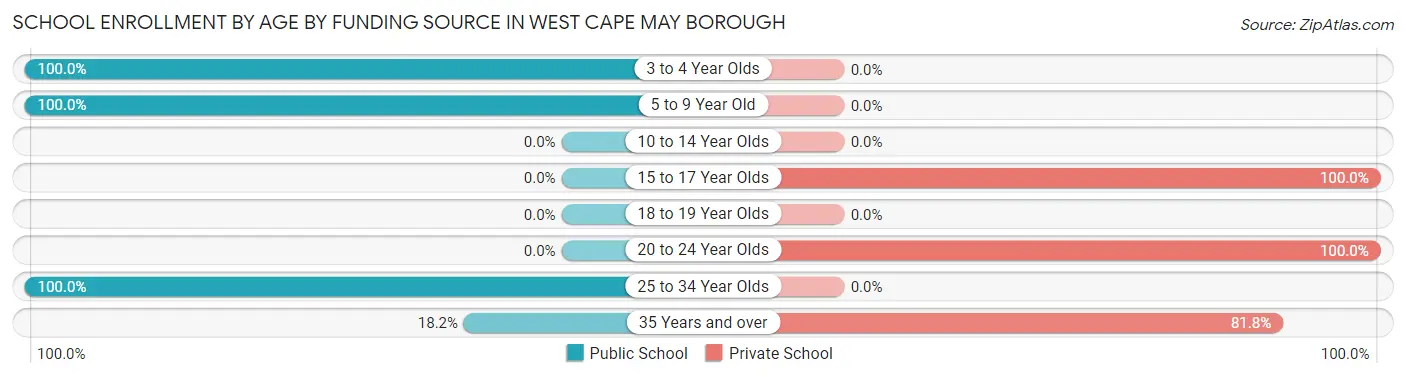
| Age Bracket | Public School | Private School |
| 3 to 4 Year Olds | 4 (100.0%) | 0 (0.0%) |
| 5 to 9 Year Old | 63 (100.0%) | 0 (0.0%) |
| 10 to 14 Year Olds | 0 (0.0%) | 0 (0.0%) |
| 15 to 17 Year Olds | 0 (0.0%) | 39 (100.0%) |
| 18 to 19 Year Olds | 0 (0.0%) | 0 (0.0%) |
| 20 to 24 Year Olds | 0 (0.0%) | 23 (100.0%) |
| 25 to 34 Year Olds | 10 (100.0%) | 0 (0.0%) |
| 35 Years and over | 2 (18.2%) | 9 (81.8%) |
| Total | 79 (52.7%) | 71 (47.3%) |
Educational Attainment by Field of Study in West Cape May borough
Business (86 | 23.8%), education (78 | 21.5%), arts & humanities (27 | 7.5%), psychology (25 | 6.9%), and social sciences (22 | 6.1%) are the most common fields of study among 362 individuals in West Cape May borough who have obtained a bachelor's degree or higher.
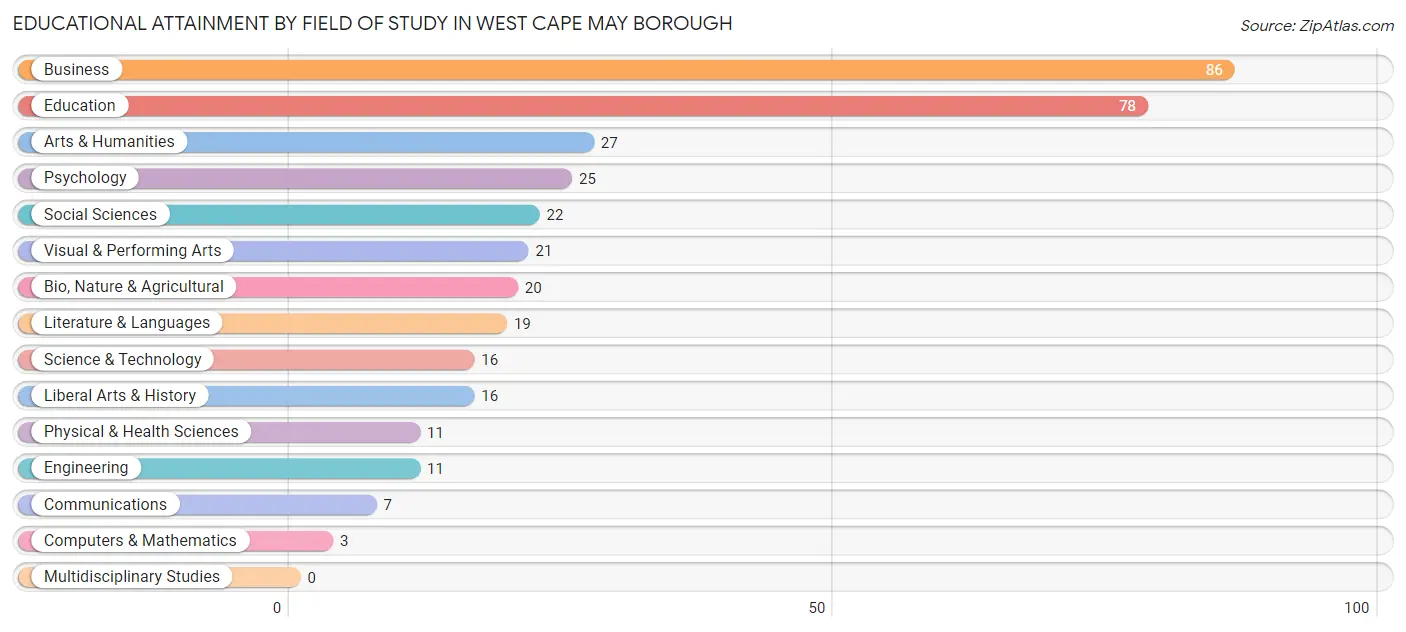
| Field of Study | # Graduates | % Graduates |
| Computers & Mathematics | 3 | 0.8% |
| Bio, Nature & Agricultural | 20 | 5.5% |
| Physical & Health Sciences | 11 | 3.0% |
| Psychology | 25 | 6.9% |
| Social Sciences | 22 | 6.1% |
| Engineering | 11 | 3.0% |
| Multidisciplinary Studies | 0 | 0.0% |
| Science & Technology | 16 | 4.4% |
| Business | 86 | 23.8% |
| Education | 78 | 21.5% |
| Literature & Languages | 19 | 5.2% |
| Liberal Arts & History | 16 | 4.4% |
| Visual & Performing Arts | 21 | 5.8% |
| Communications | 7 | 1.9% |
| Arts & Humanities | 27 | 7.5% |
| Total | 362 | 100.0% |
Transportation & Commute in West Cape May borough
Vehicle Availability by Sex in West Cape May borough
The most prevalent vehicle ownership categories in West Cape May borough are males with 2 vehicles (79, accounting for 31.1%) and females with 2 vehicles (60, making up 47.3%).
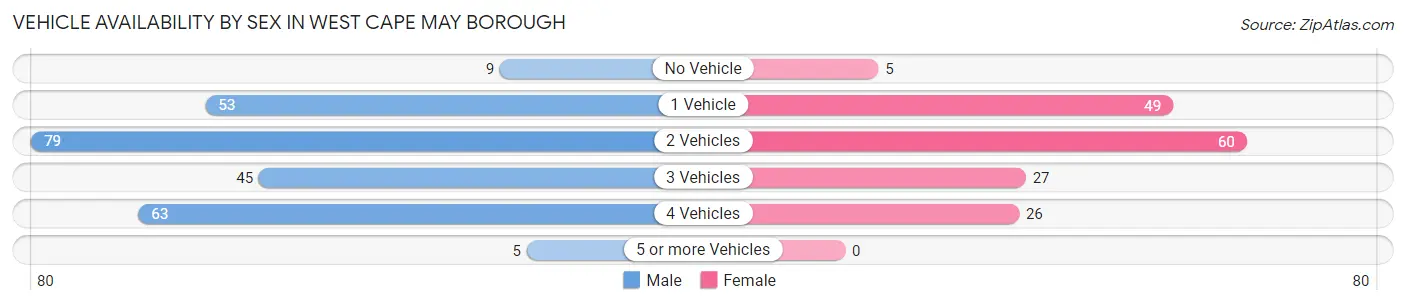
| Vehicles Available | Male | Female |
| No Vehicle | 9 (3.5%) | 5 (3.0%) |
| 1 Vehicle | 53 (20.9%) | 49 (29.3%) |
| 2 Vehicles | 79 (31.1%) | 60 (35.9%) |
| 3 Vehicles | 45 (17.7%) | 27 (16.2%) |
| 4 Vehicles | 63 (24.8%) | 26 (15.6%) |
| 5 or more Vehicles | 5 (2.0%) | 0 (0.0%) |
| Total | 254 (100.0%) | 167 (100.0%) |
Commute Time in West Cape May borough
The most frequently occuring commute durations in West Cape May borough are 5 to 9 minutes (142 commuters, 38.3%), 10 to 14 minutes (55 commuters, 14.8%), and 15 to 19 minutes (47 commuters, 12.7%).
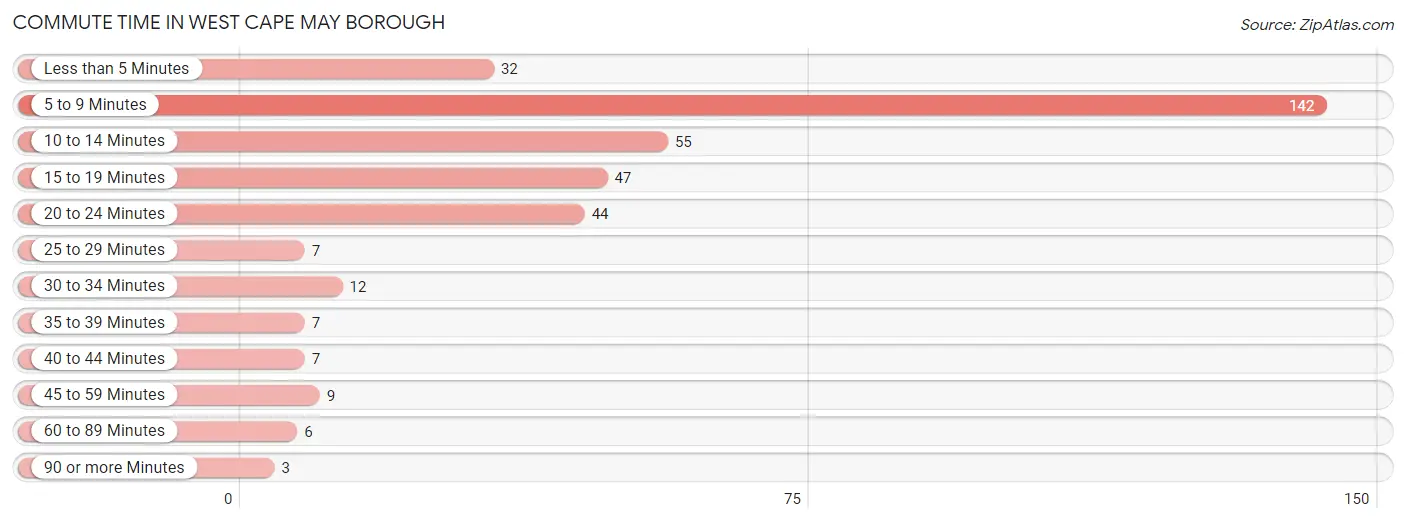
| Commute Time | # Commuters | % Commuters |
| Less than 5 Minutes | 32 | 8.6% |
| 5 to 9 Minutes | 142 | 38.3% |
| 10 to 14 Minutes | 55 | 14.8% |
| 15 to 19 Minutes | 47 | 12.7% |
| 20 to 24 Minutes | 44 | 11.9% |
| 25 to 29 Minutes | 7 | 1.9% |
| 30 to 34 Minutes | 12 | 3.2% |
| 35 to 39 Minutes | 7 | 1.9% |
| 40 to 44 Minutes | 7 | 1.9% |
| 45 to 59 Minutes | 9 | 2.4% |
| 60 to 89 Minutes | 6 | 1.6% |
| 90 or more Minutes | 3 | 0.8% |
Commute Time by Sex in West Cape May borough
The most common commute times in West Cape May borough are 5 to 9 minutes (72 commuters, 31.0%) for males and 5 to 9 minutes (70 commuters, 50.4%) for females.
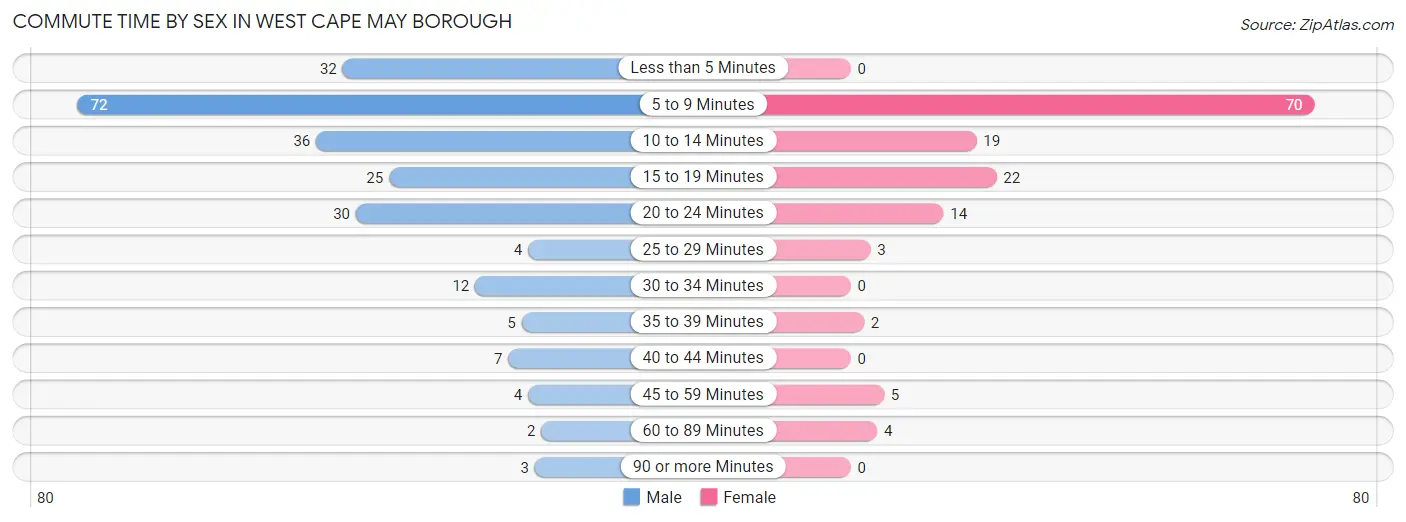
| Commute Time | Male | Female |
| Less than 5 Minutes | 32 (13.8%) | 0 (0.0%) |
| 5 to 9 Minutes | 72 (31.0%) | 70 (50.4%) |
| 10 to 14 Minutes | 36 (15.5%) | 19 (13.7%) |
| 15 to 19 Minutes | 25 (10.8%) | 22 (15.8%) |
| 20 to 24 Minutes | 30 (12.9%) | 14 (10.1%) |
| 25 to 29 Minutes | 4 (1.7%) | 3 (2.2%) |
| 30 to 34 Minutes | 12 (5.2%) | 0 (0.0%) |
| 35 to 39 Minutes | 5 (2.2%) | 2 (1.4%) |
| 40 to 44 Minutes | 7 (3.0%) | 0 (0.0%) |
| 45 to 59 Minutes | 4 (1.7%) | 5 (3.6%) |
| 60 to 89 Minutes | 2 (0.9%) | 4 (2.9%) |
| 90 or more Minutes | 3 (1.3%) | 0 (0.0%) |
Time of Departure to Work by Sex in West Cape May borough
The most frequent times of departure to work in West Cape May borough are 7:30 AM to 7:59 AM (45, 19.4%) for males and 8:30 AM to 8:59 AM (71, 51.1%) for females.
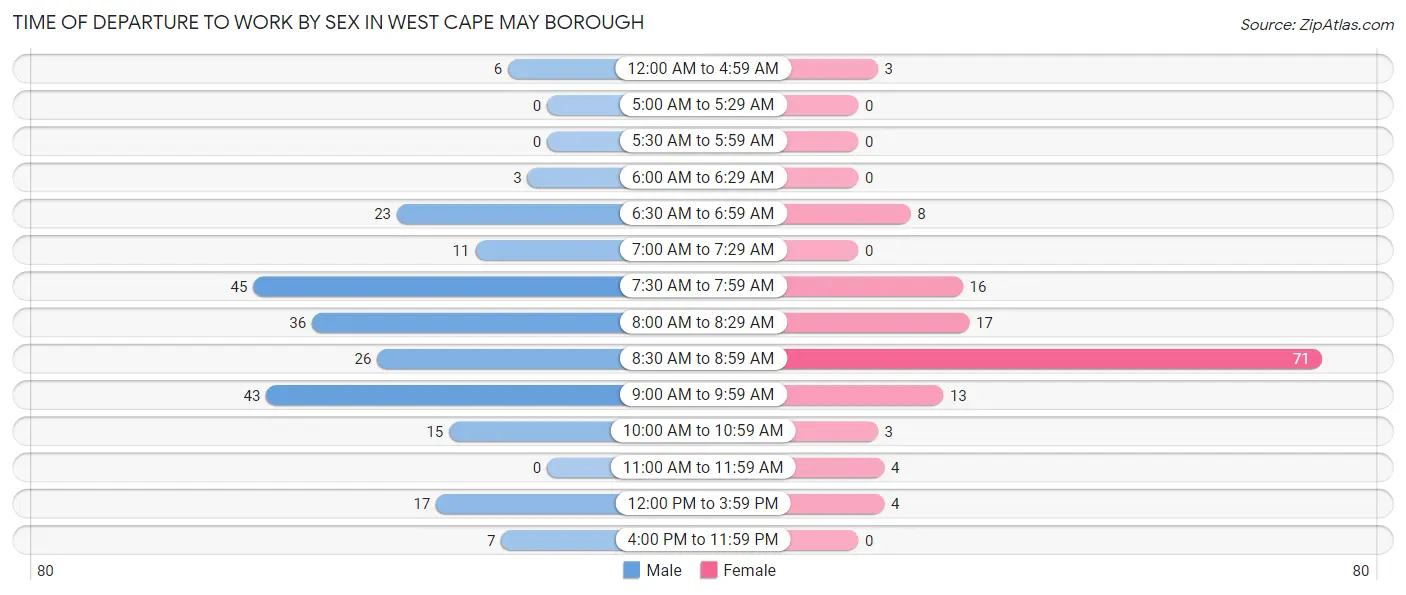
| Time of Departure | Male | Female |
| 12:00 AM to 4:59 AM | 6 (2.6%) | 3 (2.2%) |
| 5:00 AM to 5:29 AM | 0 (0.0%) | 0 (0.0%) |
| 5:30 AM to 5:59 AM | 0 (0.0%) | 0 (0.0%) |
| 6:00 AM to 6:29 AM | 3 (1.3%) | 0 (0.0%) |
| 6:30 AM to 6:59 AM | 23 (9.9%) | 8 (5.8%) |
| 7:00 AM to 7:29 AM | 11 (4.7%) | 0 (0.0%) |
| 7:30 AM to 7:59 AM | 45 (19.4%) | 16 (11.5%) |
| 8:00 AM to 8:29 AM | 36 (15.5%) | 17 (12.2%) |
| 8:30 AM to 8:59 AM | 26 (11.2%) | 71 (51.1%) |
| 9:00 AM to 9:59 AM | 43 (18.5%) | 13 (9.3%) |
| 10:00 AM to 10:59 AM | 15 (6.5%) | 3 (2.2%) |
| 11:00 AM to 11:59 AM | 0 (0.0%) | 4 (2.9%) |
| 12:00 PM to 3:59 PM | 17 (7.3%) | 4 (2.9%) |
| 4:00 PM to 11:59 PM | 7 (3.0%) | 0 (0.0%) |
| Total | 232 (100.0%) | 139 (100.0%) |
Housing Occupancy in West Cape May borough
Occupancy by Ownership in West Cape May borough
Of the total 421 dwellings in West Cape May borough, owner-occupied units account for 372 (88.4%), while renter-occupied units make up 49 (11.6%).
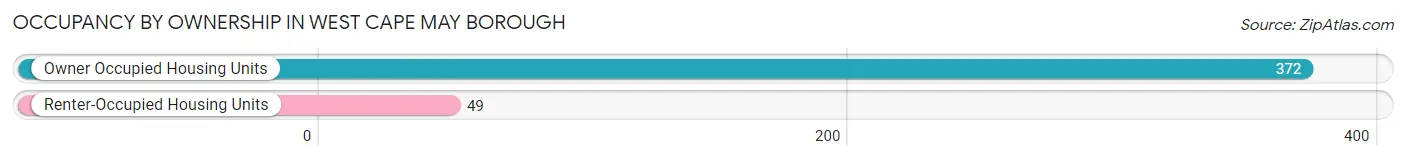
| Occupancy | # Housing Units | % Housing Units |
| Owner Occupied Housing Units | 372 | 88.4% |
| Renter-Occupied Housing Units | 49 | 11.6% |
| Total Occupied Housing Units | 421 | 100.0% |
Occupancy by Household Size in West Cape May borough
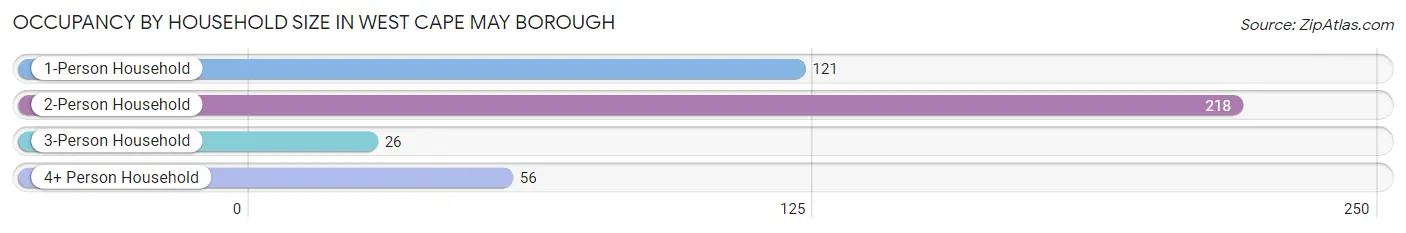
| Household Size | # Housing Units | % Housing Units |
| 1-Person Household | 121 | 28.7% |
| 2-Person Household | 218 | 51.8% |
| 3-Person Household | 26 | 6.2% |
| 4+ Person Household | 56 | 13.3% |
| Total Housing Units | 421 | 100.0% |
Occupancy by Ownership by Household Size in West Cape May borough
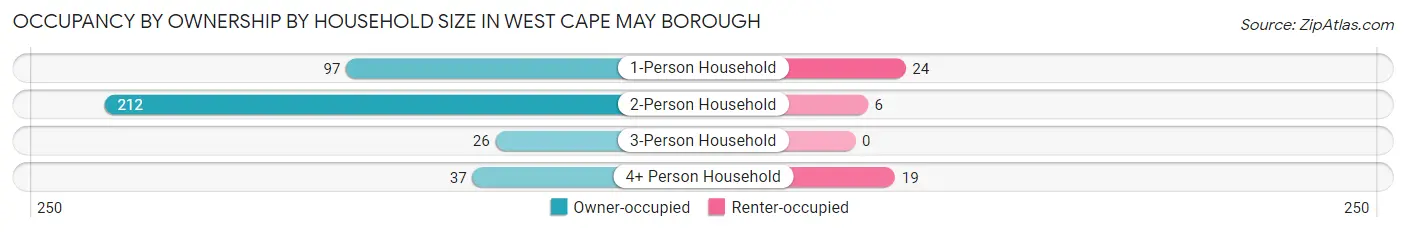
| Household Size | Owner-occupied | Renter-occupied |
| 1-Person Household | 97 (80.2%) | 24 (19.8%) |
| 2-Person Household | 212 (97.3%) | 6 (2.8%) |
| 3-Person Household | 26 (100.0%) | 0 (0.0%) |
| 4+ Person Household | 37 (66.1%) | 19 (33.9%) |
| Total Housing Units | 372 (88.4%) | 49 (11.6%) |
Occupancy by Educational Attainment in West Cape May borough
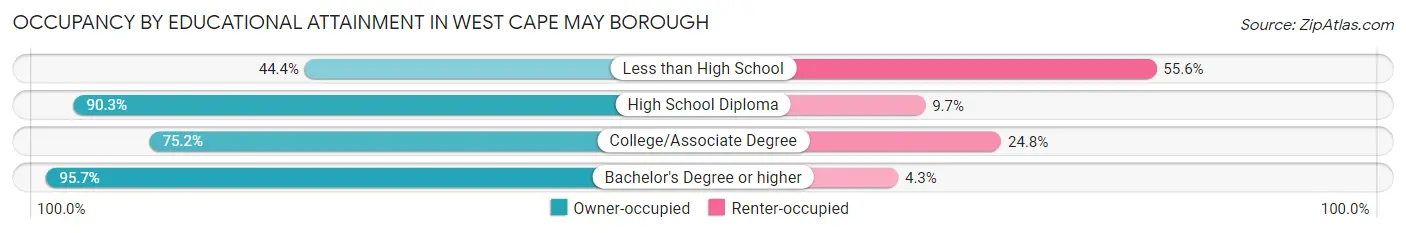
| Household Size | Owner-occupied | Renter-occupied |
| Less than High School | 4 (44.4%) | 5 (55.6%) |
| High School Diploma | 65 (90.3%) | 7 (9.7%) |
| College/Associate Degree | 82 (75.2%) | 27 (24.8%) |
| Bachelor's Degree or higher | 221 (95.7%) | 10 (4.3%) |
Occupancy by Age of Householder in West Cape May borough
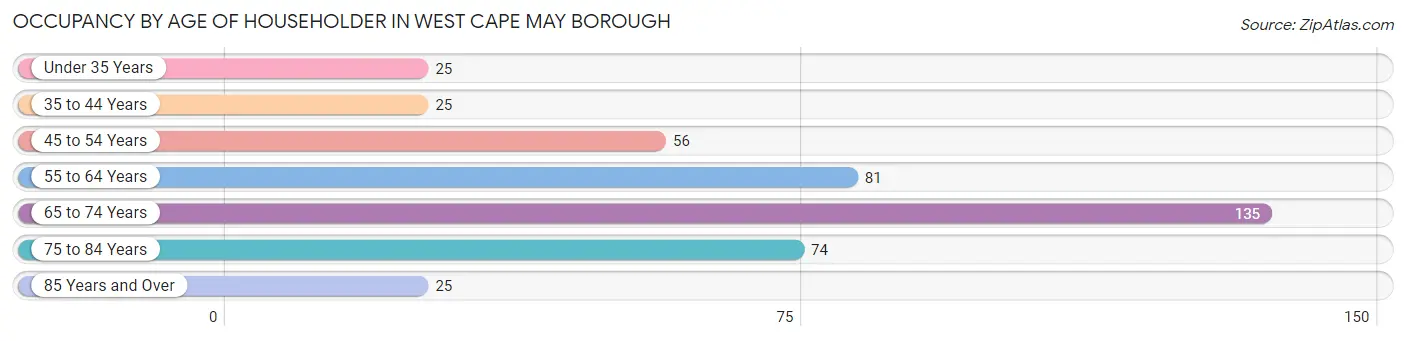
| Age Bracket | # Households | % Households |
| Under 35 Years | 25 | 5.9% |
| 35 to 44 Years | 25 | 5.9% |
| 45 to 54 Years | 56 | 13.3% |
| 55 to 64 Years | 81 | 19.2% |
| 65 to 74 Years | 135 | 32.1% |
| 75 to 84 Years | 74 | 17.6% |
| 85 Years and Over | 25 | 5.9% |
| Total | 421 | 100.0% |
Housing Finances in West Cape May borough
Median Income by Occupancy in West Cape May borough
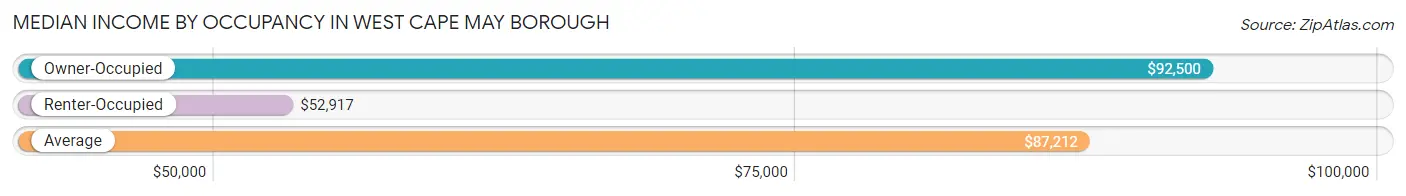
| Occupancy Type | # Households | Median Income |
| Owner-Occupied | 372 (88.4%) | $92,500 |
| Renter-Occupied | 49 (11.6%) | $52,917 |
| Average | 421 (100.0%) | $87,212 |
Occupancy by Householder Income Bracket in West Cape May borough
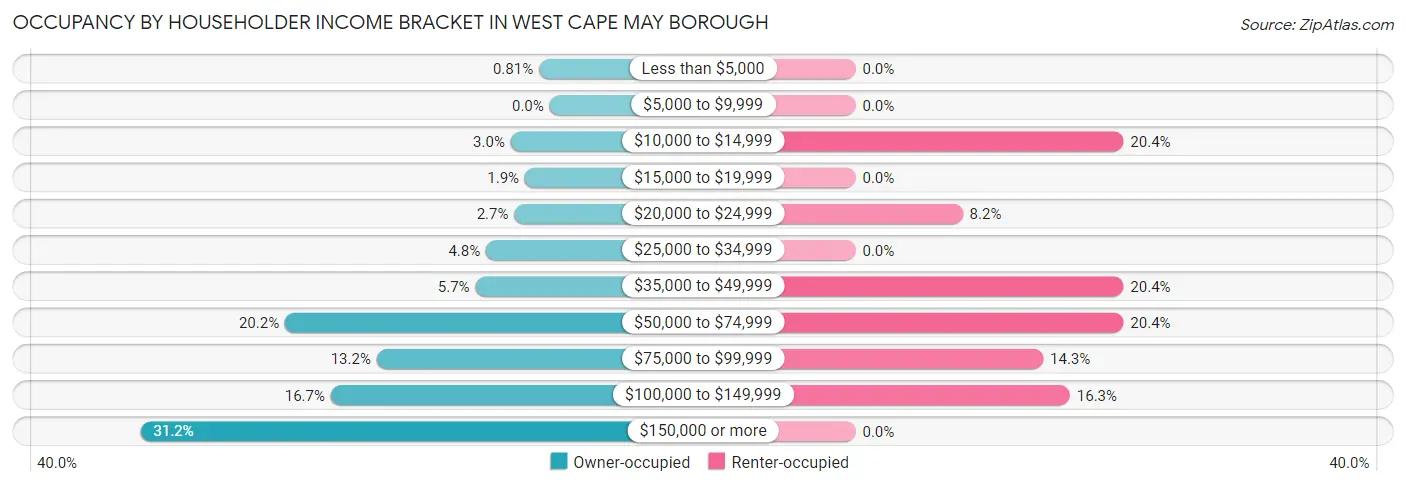
| Income Bracket | Owner-occupied | Renter-occupied |
| Less than $5,000 | 3 (0.8%) | 0 (0.0%) |
| $5,000 to $9,999 | 0 (0.0%) | 0 (0.0%) |
| $10,000 to $14,999 | 11 (3.0%) | 10 (20.4%) |
| $15,000 to $19,999 | 7 (1.9%) | 0 (0.0%) |
| $20,000 to $24,999 | 10 (2.7%) | 4 (8.2%) |
| $25,000 to $34,999 | 18 (4.8%) | 0 (0.0%) |
| $35,000 to $49,999 | 21 (5.7%) | 10 (20.4%) |
| $50,000 to $74,999 | 75 (20.2%) | 10 (20.4%) |
| $75,000 to $99,999 | 49 (13.2%) | 7 (14.3%) |
| $100,000 to $149,999 | 62 (16.7%) | 8 (16.3%) |
| $150,000 or more | 116 (31.2%) | 0 (0.0%) |
| Total | 372 (100.0%) | 49 (100.0%) |
Monthly Housing Cost Tiers in West Cape May borough
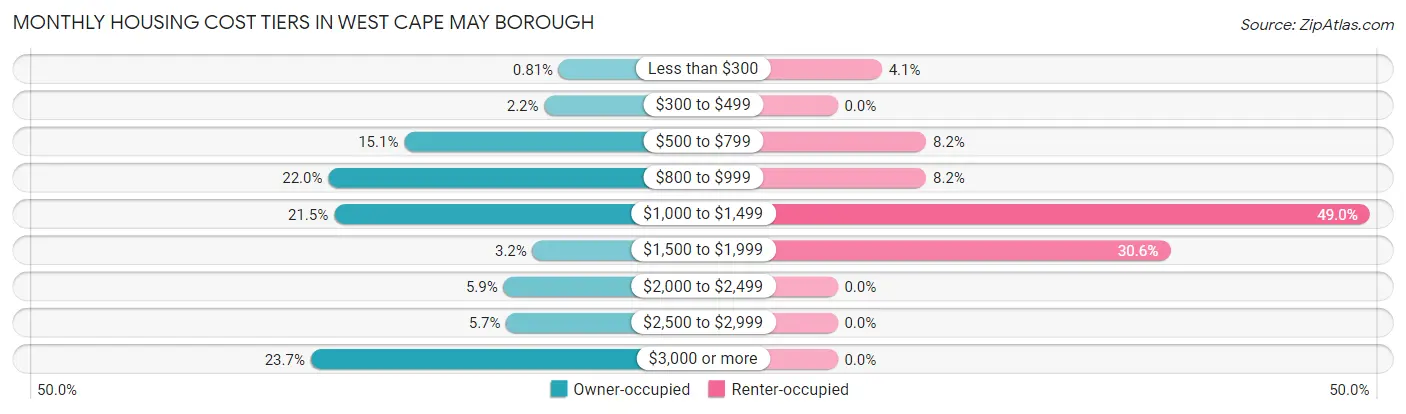
| Monthly Cost | Owner-occupied | Renter-occupied |
| Less than $300 | 3 (0.8%) | 2 (4.1%) |
| $300 to $499 | 8 (2.1%) | 0 (0.0%) |
| $500 to $799 | 56 (15.0%) | 4 (8.2%) |
| $800 to $999 | 82 (22.0%) | 4 (8.2%) |
| $1,000 to $1,499 | 80 (21.5%) | 24 (49.0%) |
| $1,500 to $1,999 | 12 (3.2%) | 15 (30.6%) |
| $2,000 to $2,499 | 22 (5.9%) | 0 (0.0%) |
| $2,500 to $2,999 | 21 (5.7%) | 0 (0.0%) |
| $3,000 or more | 88 (23.7%) | 0 (0.0%) |
| Total | 372 (100.0%) | 49 (100.0%) |
Physical Housing Characteristics in West Cape May borough
Housing Structures in West Cape May borough
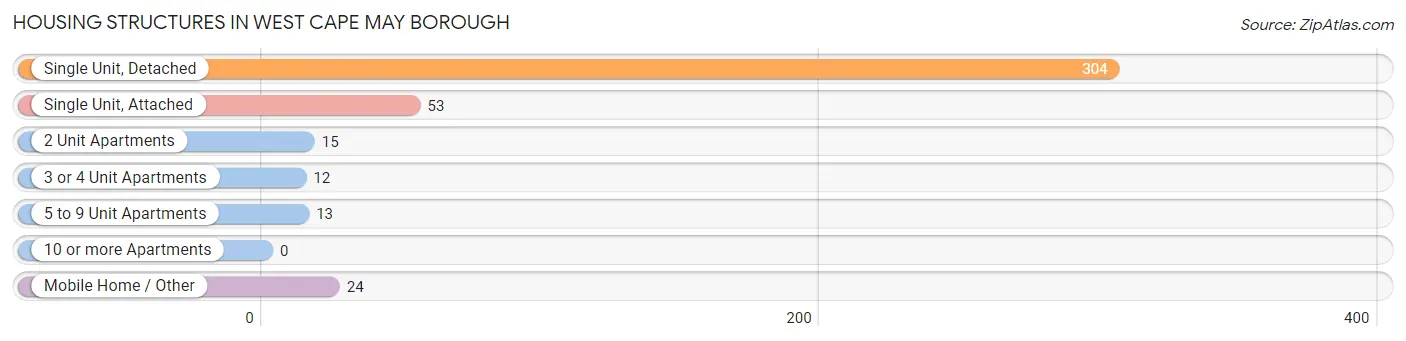
| Structure Type | # Housing Units | % Housing Units |
| Single Unit, Detached | 304 | 72.2% |
| Single Unit, Attached | 53 | 12.6% |
| 2 Unit Apartments | 15 | 3.6% |
| 3 or 4 Unit Apartments | 12 | 2.9% |
| 5 to 9 Unit Apartments | 13 | 3.1% |
| 10 or more Apartments | 0 | 0.0% |
| Mobile Home / Other | 24 | 5.7% |
| Total | 421 | 100.0% |
Housing Structures by Occupancy in West Cape May borough
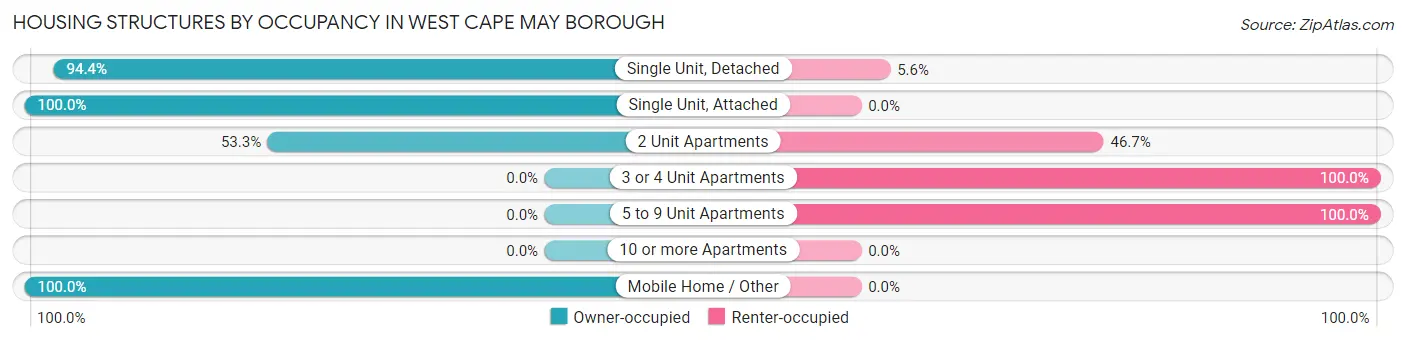
| Structure Type | Owner-occupied | Renter-occupied |
| Single Unit, Detached | 287 (94.4%) | 17 (5.6%) |
| Single Unit, Attached | 53 (100.0%) | 0 (0.0%) |
| 2 Unit Apartments | 8 (53.3%) | 7 (46.7%) |
| 3 or 4 Unit Apartments | 0 (0.0%) | 12 (100.0%) |
| 5 to 9 Unit Apartments | 0 (0.0%) | 13 (100.0%) |
| 10 or more Apartments | 0 (0.0%) | 0 (0.0%) |
| Mobile Home / Other | 24 (100.0%) | 0 (0.0%) |
| Total | 372 (88.4%) | 49 (11.6%) |
Housing Structures by Number of Rooms in West Cape May borough
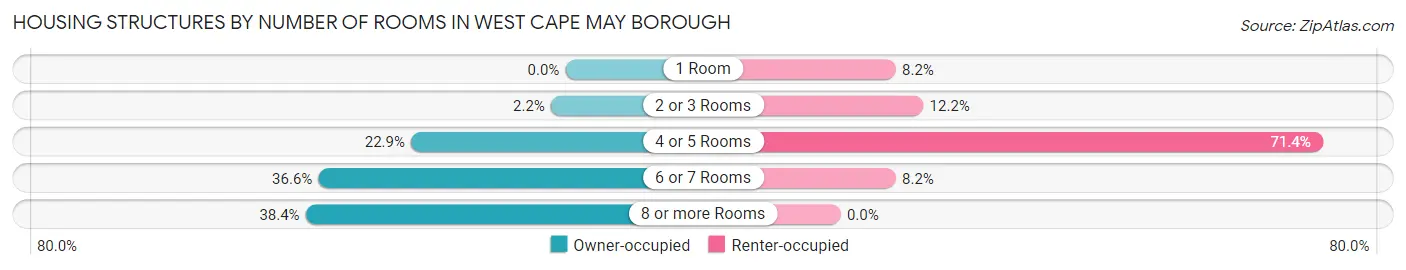
| Number of Rooms | Owner-occupied | Renter-occupied |
| 1 Room | 0 (0.0%) | 4 (8.2%) |
| 2 or 3 Rooms | 8 (2.1%) | 6 (12.2%) |
| 4 or 5 Rooms | 85 (22.9%) | 35 (71.4%) |
| 6 or 7 Rooms | 136 (36.6%) | 4 (8.2%) |
| 8 or more Rooms | 143 (38.4%) | 0 (0.0%) |
| Total | 372 (100.0%) | 49 (100.0%) |
Housing Structure by Heating Type in West Cape May borough
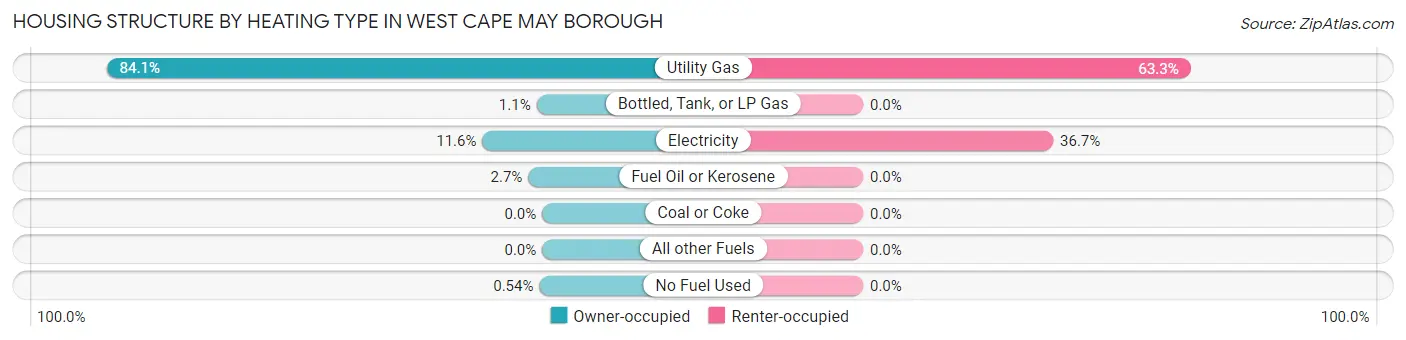
| Heating Type | Owner-occupied | Renter-occupied |
| Utility Gas | 313 (84.1%) | 31 (63.3%) |
| Bottled, Tank, or LP Gas | 4 (1.1%) | 0 (0.0%) |
| Electricity | 43 (11.6%) | 18 (36.7%) |
| Fuel Oil or Kerosene | 10 (2.7%) | 0 (0.0%) |
| Coal or Coke | 0 (0.0%) | 0 (0.0%) |
| All other Fuels | 0 (0.0%) | 0 (0.0%) |
| No Fuel Used | 2 (0.5%) | 0 (0.0%) |
| Total | 372 (100.0%) | 49 (100.0%) |
Household Vehicle Usage in West Cape May borough
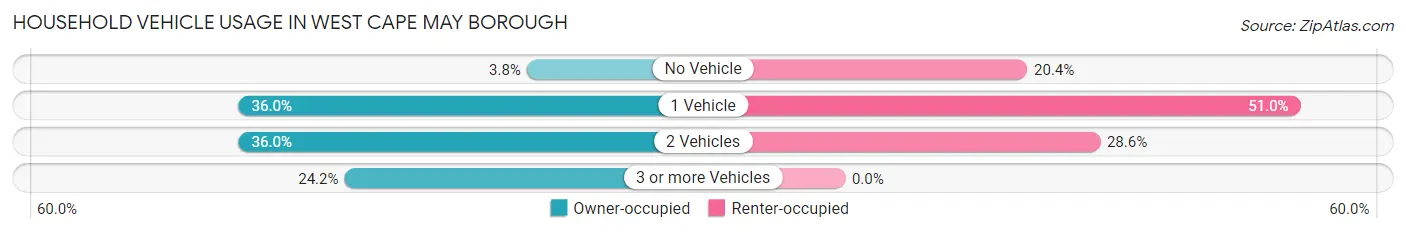
| Vehicles per Household | Owner-occupied | Renter-occupied |
| No Vehicle | 14 (3.8%) | 10 (20.4%) |
| 1 Vehicle | 134 (36.0%) | 25 (51.0%) |
| 2 Vehicles | 134 (36.0%) | 14 (28.6%) |
| 3 or more Vehicles | 90 (24.2%) | 0 (0.0%) |
| Total | 372 (100.0%) | 49 (100.0%) |
Real Estate & Mortgages in West Cape May borough
Real Estate and Mortgage Overview in West Cape May borough
| Characteristic | Without Mortgage | With Mortgage |
| Housing Units | 199 | 173 |
| Median Property Value | $578,900 | $651,000 |
| Median Household Income | $61,563 | $89 |
| Monthly Housing Costs | $899 | $88 |
| Real Estate Taxes | $5,595 | $0 |
Property Value by Mortgage Status in West Cape May borough
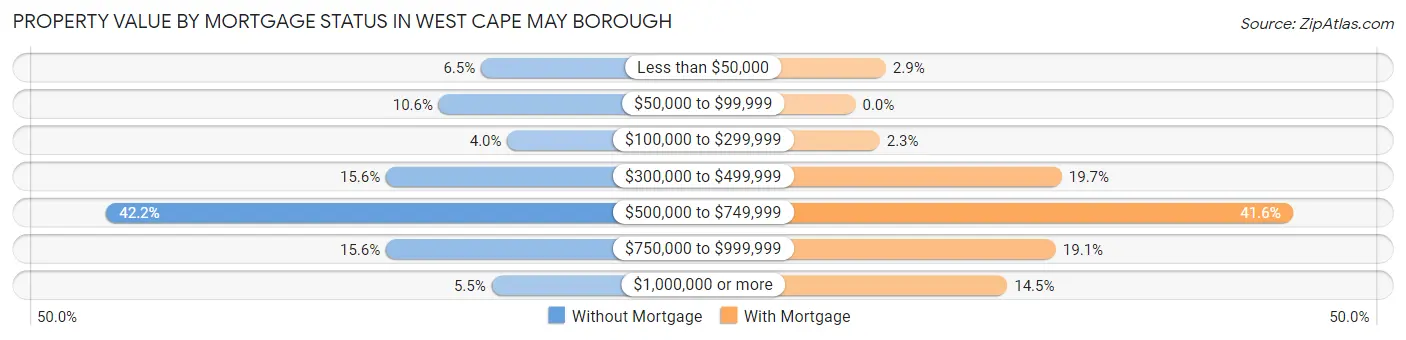
| Property Value | Without Mortgage | With Mortgage |
| Less than $50,000 | 13 (6.5%) | 5 (2.9%) |
| $50,000 to $99,999 | 21 (10.5%) | 0 (0.0%) |
| $100,000 to $299,999 | 8 (4.0%) | 4 (2.3%) |
| $300,000 to $499,999 | 31 (15.6%) | 34 (19.7%) |
| $500,000 to $749,999 | 84 (42.2%) | 72 (41.6%) |
| $750,000 to $999,999 | 31 (15.6%) | 33 (19.1%) |
| $1,000,000 or more | 11 (5.5%) | 25 (14.4%) |
| Total | 199 (100.0%) | 173 (100.0%) |
Household Income by Mortgage Status in West Cape May borough
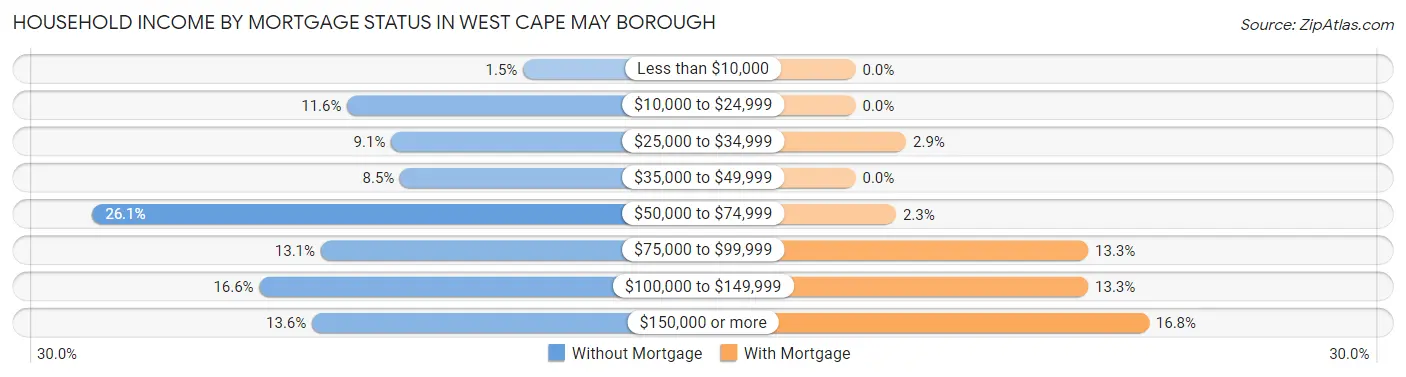
| Household Income | Without Mortgage | With Mortgage |
| Less than $10,000 | 3 (1.5%) | 0 (0.0%) |
| $10,000 to $24,999 | 23 (11.6%) | 0 (0.0%) |
| $25,000 to $34,999 | 18 (9.0%) | 5 (2.9%) |
| $35,000 to $49,999 | 17 (8.5%) | 0 (0.0%) |
| $50,000 to $74,999 | 52 (26.1%) | 4 (2.3%) |
| $75,000 to $99,999 | 26 (13.1%) | 23 (13.3%) |
| $100,000 to $149,999 | 33 (16.6%) | 23 (13.3%) |
| $150,000 or more | 27 (13.6%) | 29 (16.8%) |
| Total | 199 (100.0%) | 173 (100.0%) |
Property Value to Household Income Ratio in West Cape May borough
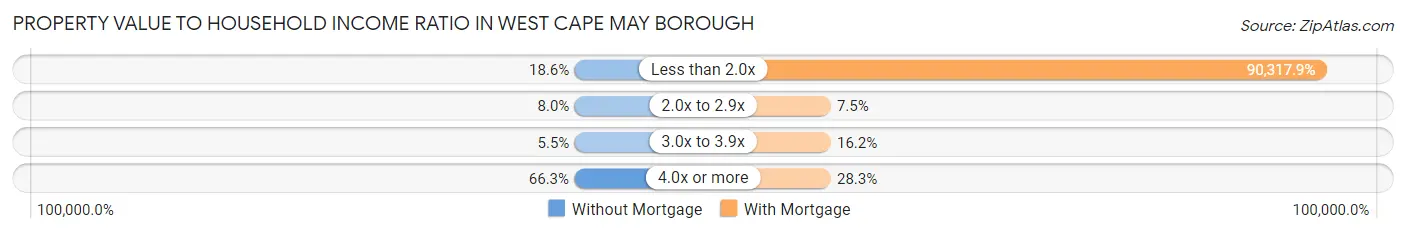
| Value-to-Income Ratio | Without Mortgage | With Mortgage |
| Less than 2.0x | 37 (18.6%) | 156,250 (90,317.9%) |
| 2.0x to 2.9x | 16 (8.0%) | 13 (7.5%) |
| 3.0x to 3.9x | 11 (5.5%) | 28 (16.2%) |
| 4.0x or more | 132 (66.3%) | 49 (28.3%) |
| Total | 199 (100.0%) | 173 (100.0%) |
Real Estate Taxes by Mortgage Status in West Cape May borough
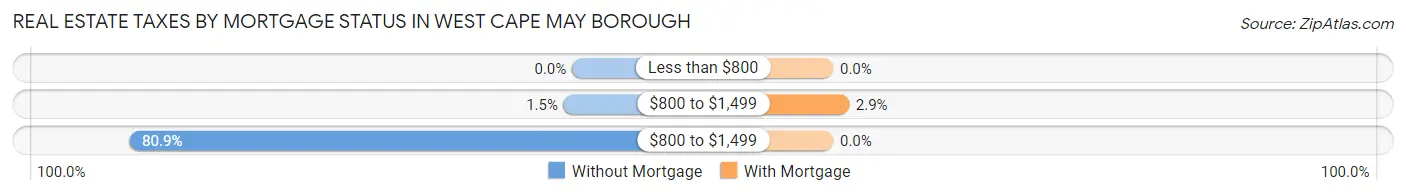
| Property Taxes | Without Mortgage | With Mortgage |
| Less than $800 | 0 (0.0%) | 0 (0.0%) |
| $800 to $1,499 | 3 (1.5%) | 5 (2.9%) |
| $800 to $1,499 | 161 (80.9%) | 0 (0.0%) |
| Total | 199 (100.0%) | 173 (100.0%) |
Health & Disability in West Cape May borough
Health Insurance Coverage by Age in West Cape May borough
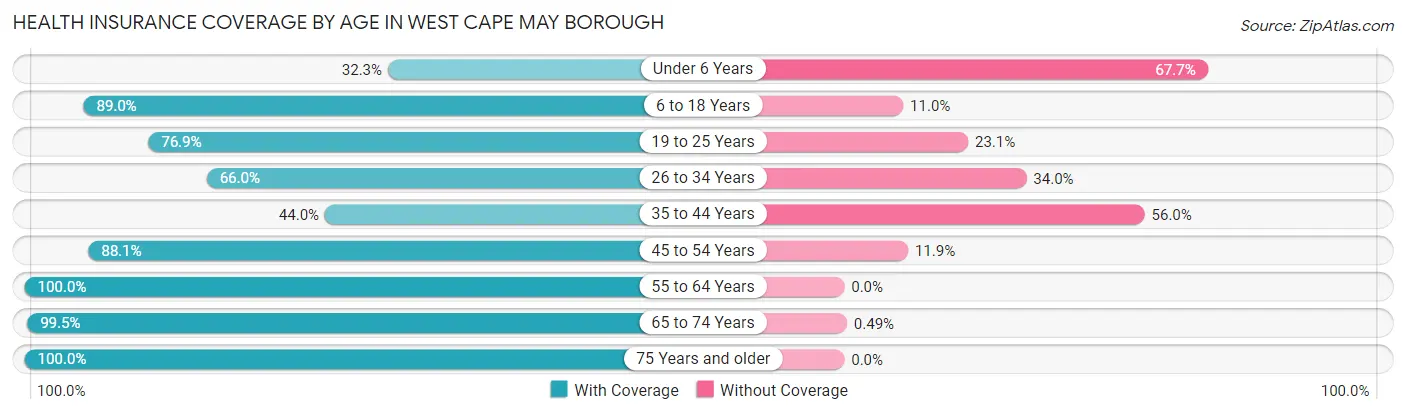
| Age Bracket | With Coverage | Without Coverage |
| Under 6 Years | 20 (32.3%) | 42 (67.7%) |
| 6 to 18 Years | 73 (89.0%) | 9 (11.0%) |
| 19 to 25 Years | 40 (76.9%) | 12 (23.1%) |
| 26 to 34 Years | 35 (66.0%) | 18 (34.0%) |
| 35 to 44 Years | 22 (44.0%) | 28 (56.0%) |
| 45 to 54 Years | 89 (88.1%) | 12 (11.9%) |
| 55 to 64 Years | 160 (100.0%) | 0 (0.0%) |
| 65 to 74 Years | 202 (99.5%) | 1 (0.5%) |
| 75 Years and older | 164 (100.0%) | 0 (0.0%) |
| Total | 805 (86.8%) | 122 (13.2%) |
Health Insurance Coverage by Citizenship Status in West Cape May borough
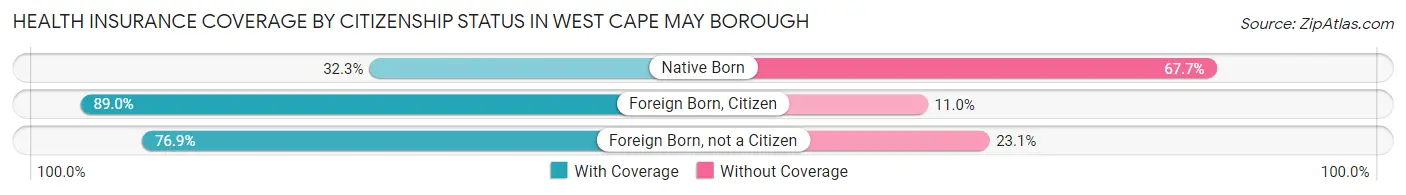
| Citizenship Status | With Coverage | Without Coverage |
| Native Born | 20 (32.3%) | 42 (67.7%) |
| Foreign Born, Citizen | 73 (89.0%) | 9 (11.0%) |
| Foreign Born, not a Citizen | 40 (76.9%) | 12 (23.1%) |
Health Insurance Coverage by Household Income in West Cape May borough
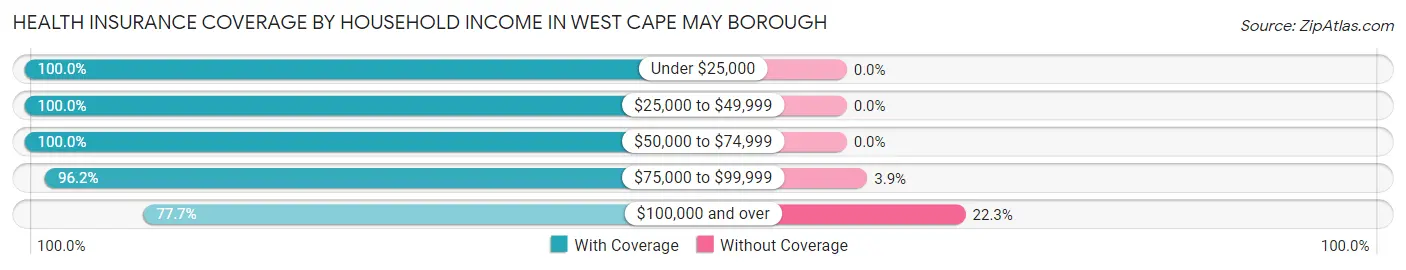
| Household Income | With Coverage | Without Coverage |
| Under $25,000 | 58 (100.0%) | 0 (0.0%) |
| $25,000 to $49,999 | 89 (100.0%) | 0 (0.0%) |
| $50,000 to $74,999 | 146 (100.0%) | 0 (0.0%) |
| $75,000 to $99,999 | 100 (96.2%) | 4 (3.8%) |
| $100,000 and over | 412 (77.7%) | 118 (22.3%) |
Public vs Private Health Insurance Coverage by Age in West Cape May borough
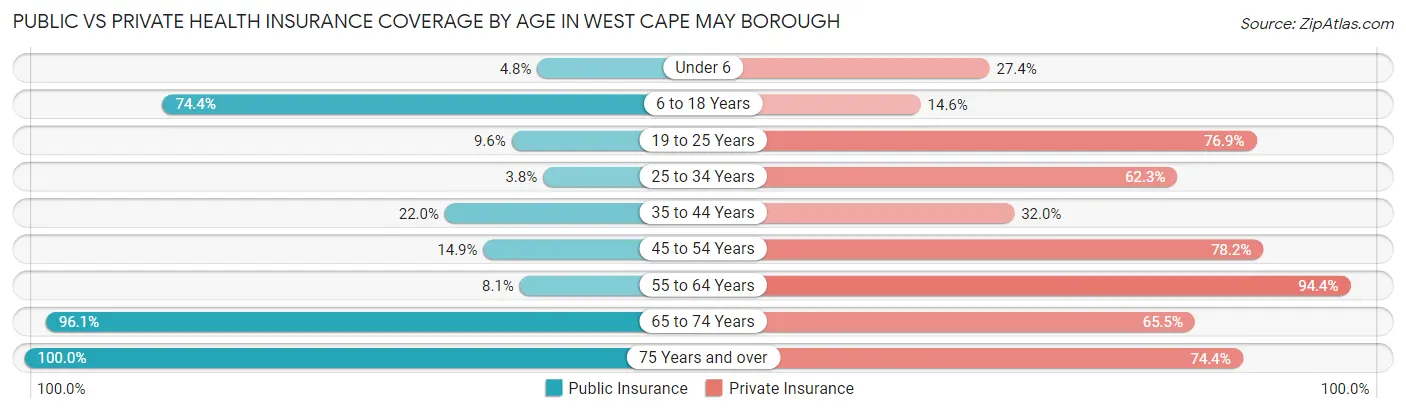
| Age Bracket | Public Insurance | Private Insurance |
| Under 6 | 3 (4.8%) | 17 (27.4%) |
| 6 to 18 Years | 61 (74.4%) | 12 (14.6%) |
| 19 to 25 Years | 5 (9.6%) | 40 (76.9%) |
| 25 to 34 Years | 2 (3.8%) | 33 (62.3%) |
| 35 to 44 Years | 11 (22.0%) | 16 (32.0%) |
| 45 to 54 Years | 15 (14.8%) | 79 (78.2%) |
| 55 to 64 Years | 13 (8.1%) | 151 (94.4%) |
| 65 to 74 Years | 195 (96.1%) | 133 (65.5%) |
| 75 Years and over | 164 (100.0%) | 122 (74.4%) |
| Total | 469 (50.6%) | 603 (65.0%) |
Disability Status by Sex by Age in West Cape May borough
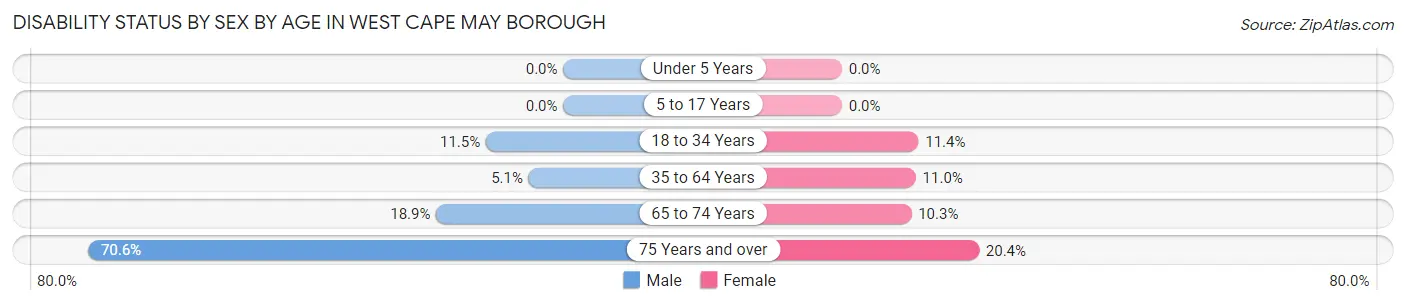
| Age Bracket | Male | Female |
| Under 5 Years | 0 (0.0%) | 0 (0.0%) |
| 5 to 17 Years | 0 (0.0%) | 0 (0.0%) |
| 18 to 34 Years | 7 (11.5%) | 5 (11.4%) |
| 35 to 64 Years | 8 (5.1%) | 17 (11.0%) |
| 65 to 74 Years | 20 (18.9%) | 10 (10.3%) |
| 75 Years and over | 36 (70.6%) | 23 (20.3%) |
Disability Class by Sex by Age in West Cape May borough
Disability Class: Hearing Difficulty
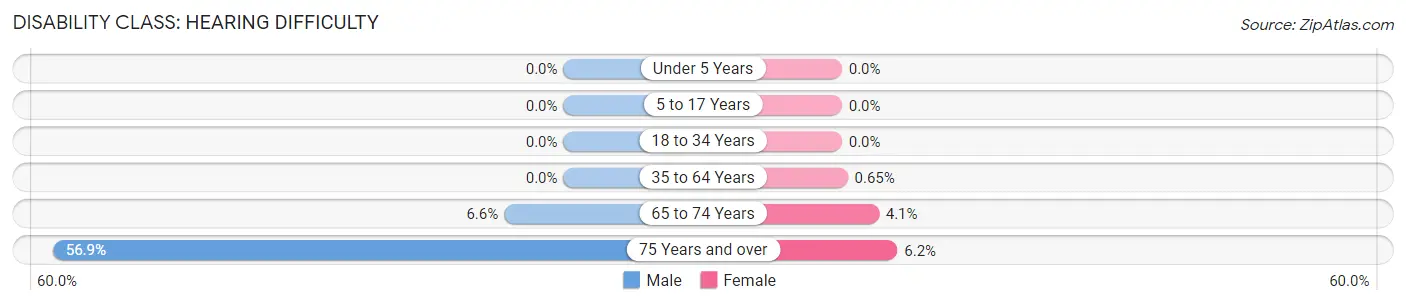
| Age Bracket | Male | Female |
| Under 5 Years | 0 (0.0%) | 0 (0.0%) |
| 5 to 17 Years | 0 (0.0%) | 0 (0.0%) |
| 18 to 34 Years | 0 (0.0%) | 0 (0.0%) |
| 35 to 64 Years | 0 (0.0%) | 1 (0.6%) |
| 65 to 74 Years | 7 (6.6%) | 4 (4.1%) |
| 75 Years and over | 29 (56.9%) | 7 (6.2%) |
Disability Class: Vision Difficulty
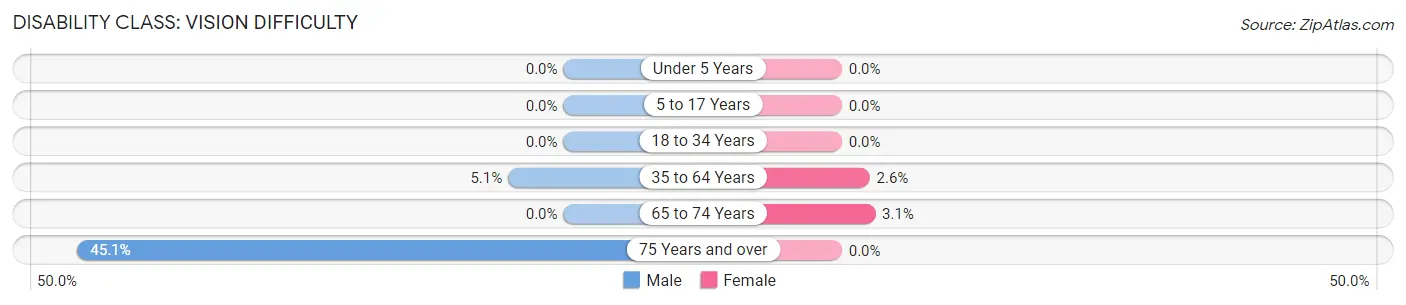
| Age Bracket | Male | Female |
| Under 5 Years | 0 (0.0%) | 0 (0.0%) |
| 5 to 17 Years | 0 (0.0%) | 0 (0.0%) |
| 18 to 34 Years | 0 (0.0%) | 0 (0.0%) |
| 35 to 64 Years | 8 (5.1%) | 4 (2.6%) |
| 65 to 74 Years | 0 (0.0%) | 3 (3.1%) |
| 75 Years and over | 23 (45.1%) | 0 (0.0%) |
Disability Class: Cognitive Difficulty
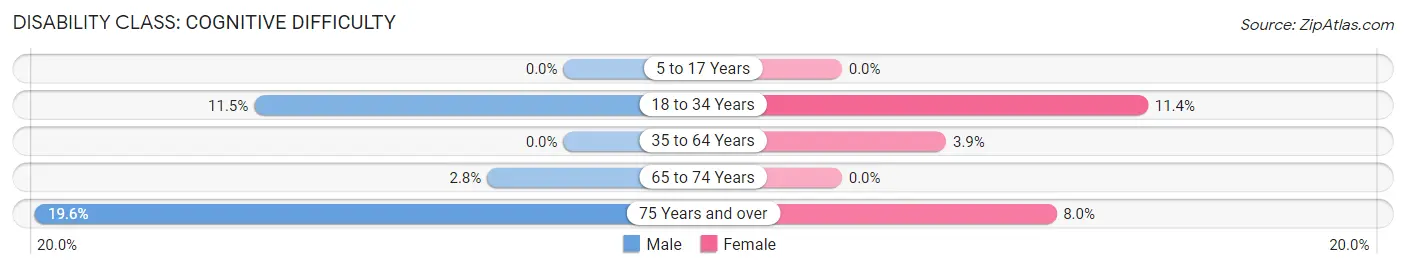
| Age Bracket | Male | Female |
| 5 to 17 Years | 0 (0.0%) | 0 (0.0%) |
| 18 to 34 Years | 7 (11.5%) | 5 (11.4%) |
| 35 to 64 Years | 0 (0.0%) | 6 (3.9%) |
| 65 to 74 Years | 3 (2.8%) | 0 (0.0%) |
| 75 Years and over | 10 (19.6%) | 9 (8.0%) |
Disability Class: Ambulatory Difficulty
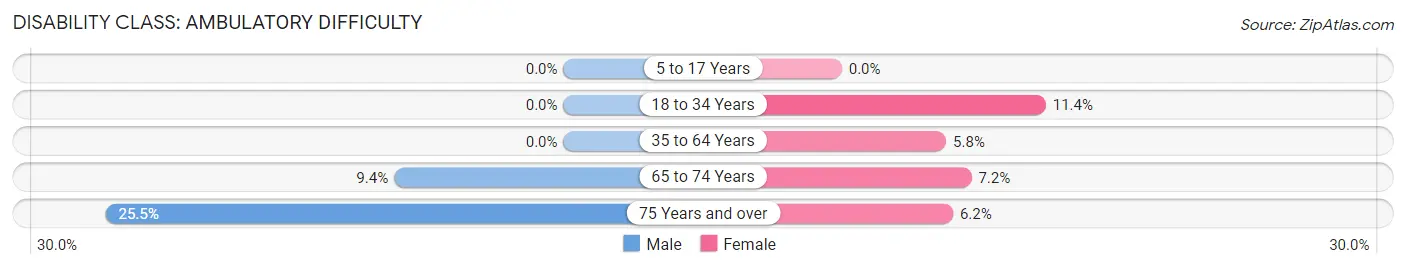
| Age Bracket | Male | Female |
| 5 to 17 Years | 0 (0.0%) | 0 (0.0%) |
| 18 to 34 Years | 0 (0.0%) | 5 (11.4%) |
| 35 to 64 Years | 0 (0.0%) | 9 (5.8%) |
| 65 to 74 Years | 10 (9.4%) | 7 (7.2%) |
| 75 Years and over | 13 (25.5%) | 7 (6.2%) |
Disability Class: Self-Care Difficulty
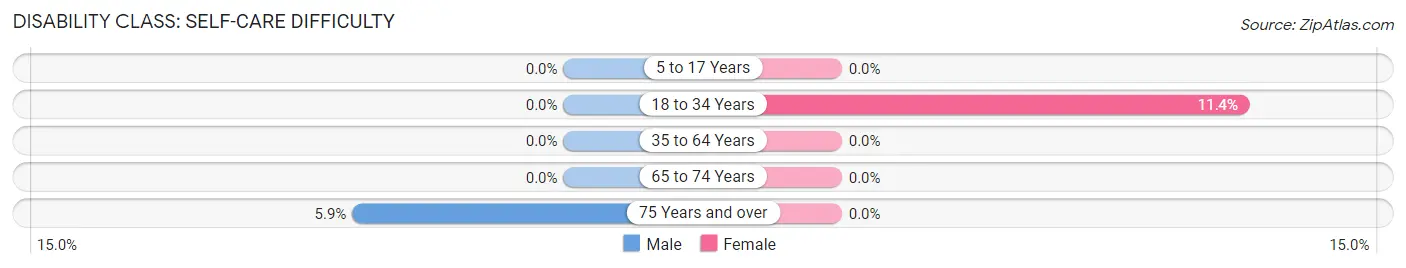
| Age Bracket | Male | Female |
| 5 to 17 Years | 0 (0.0%) | 0 (0.0%) |
| 18 to 34 Years | 0 (0.0%) | 5 (11.4%) |
| 35 to 64 Years | 0 (0.0%) | 0 (0.0%) |
| 65 to 74 Years | 0 (0.0%) | 0 (0.0%) |
| 75 Years and over | 3 (5.9%) | 0 (0.0%) |
Technology Access in West Cape May borough
Computing Device Access in West Cape May borough
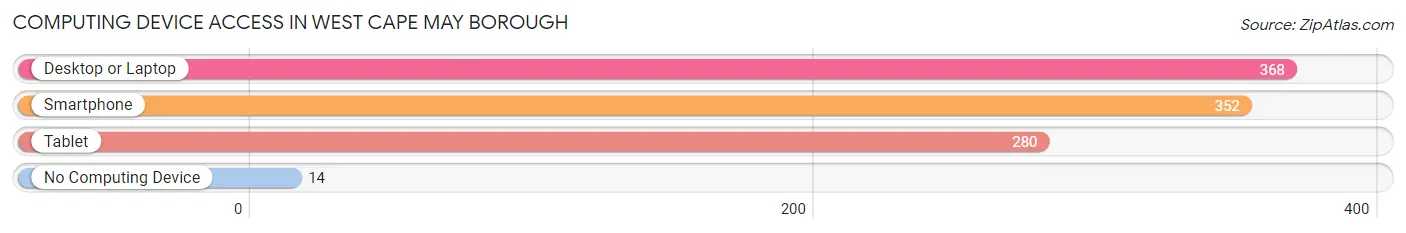
| Device Type | # Households | % Households |
| Desktop or Laptop | 368 | 87.4% |
| Smartphone | 352 | 83.6% |
| Tablet | 280 | 66.5% |
| No Computing Device | 14 | 3.3% |
| Total | 421 | 100.0% |
Internet Access in West Cape May borough
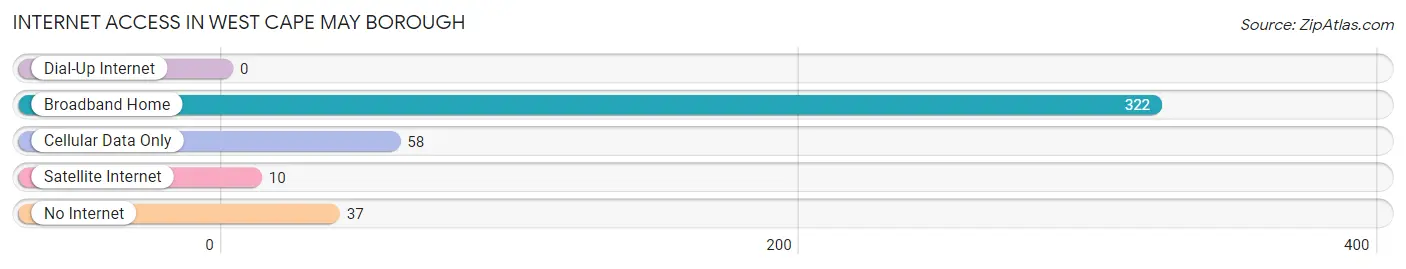
| Internet Type | # Households | % Households |
| Dial-Up Internet | 0 | 0.0% |
| Broadband Home | 322 | 76.5% |
| Cellular Data Only | 58 | 13.8% |
| Satellite Internet | 10 | 2.4% |
| No Internet | 37 | 8.8% |
| Total | 421 | 100.0% |
West Cape May borough Summary
West Cape May Borough is a small borough located in Cape May County, New Jersey. It is situated on the southern tip of the state, just south of the city of Cape May. The borough is bordered by the Atlantic Ocean to the east, the Delaware Bay to the west, and the towns of Lower Township and Cape May City to the north. The population of West Cape May Borough was 1,845 as of the 2010 census.
History
West Cape May Borough was originally part of Lower Township, which was established in 1723. In 1884, the area that is now West Cape May Borough was incorporated as a separate borough. The borough was named after the nearby city of Cape May, which was named after Dutch explorer Cornelius Jacobsen Mey.
The borough was originally a farming community, but it began to develop into a resort town in the late 19th century. The first hotel in the area was built in 1876, and by the early 20th century, the borough had become a popular destination for vacationers.
Geography
West Cape May Borough is located at the southern tip of New Jersey, just south of the city of Cape May. The borough is bordered by the Atlantic Ocean to the east, the Delaware Bay to the west, and the towns of Lower Township and Cape May City to the north.
The borough has a total area of 1.2 square miles, all of which is land. The borough is located on a peninsula, with the Atlantic Ocean to the east and the Delaware Bay to the west.
Economy
The economy of West Cape May Borough is largely based on tourism. The borough is a popular destination for vacationers, and it is home to several hotels, restaurants, and other tourist attractions. The borough also has a thriving fishing industry, and it is home to several marinas and boatyards.
Demographics
As of the 2010 census, the population of West Cape May Borough was 1,845. The racial makeup of the borough was 94.3% White, 2.2% African American, 0.3% Native American, 0.9% Asian, 0.1% Pacific Islander, 0.7% from other races, and 1.5% from two or more races. Hispanic or Latino of any race were 3.2% of the population.
The median household income in West Cape May Borough was $50,917, and the median family income was $60,000. The per capita income for the borough was $27,945. About 8.3% of families and 10.3% of the population were below the poverty line, including 15.2% of those under age 18 and 5.2% of those age 65 or over.
Common Questions
What is the Total Population of West Cape May borough?
Total Population of West Cape May borough is 927.
What is the Total Male Population of West Cape May borough?
Total Male Population of West Cape May borough is 461.
What is the Total Female Population of West Cape May borough?
Total Female Population of West Cape May borough is 466.
What is the Ratio of Males per 100 Females in West Cape May borough?
There are 98.93 Males per 100 Females in West Cape May borough.
What is the Ratio of Females per 100 Males in West Cape May borough?
There are 101.08 Females per 100 Males in West Cape May borough.
What is the Median Population Age in West Cape May borough?
Median Population Age in West Cape May borough is 60.3 Years.
What is the Average Family Size in West Cape May borough
Average Family Size in West Cape May borough is 2.8 People.
What is the Average Household Size in West Cape May borough
Average Household Size in West Cape May borough is 2.2 People.
What is Per Capita Income in West Cape May borough?
Per Capita income in West Cape May borough is $51,818.
What is the Median Family Income in West Cape May borough?
Median Family Income in West Cape May borough is $106,250.
What is the Median Household income in West Cape May borough?
Median Household Income in West Cape May borough is $87,212.
What is Inequality or Gini Index in West Cape May borough?
Inequality or Gini Index in West Cape May borough is 0.42.
How Large is the Labor Force in West Cape May borough?
There are 435 People in the Labor Forcein in West Cape May borough.
What is the Percentage of People in the Labor Force in West Cape May borough?
54.2% of People are in the Labor Force in West Cape May borough.
What is the Unemployment Rate in West Cape May borough?
Unemployment Rate in West Cape May borough is 2.5%.