Hutchinson, NJ
Hutchinson Map
Hutchinson Overview
115
TOTAL POPULATION
52
MALE POPULATION
63
FEMALE POPULATION
82.54
MALES / 100 FEMALES
121.15
FEMALES / 100 MALES
53.9
MEDIAN AGE
3.5
AVG FAMILY SIZE
2.9
AVG HOUSEHOLD SIZE
$53,575
PER CAPITA INCOME
$167,500
AVG FAMILY INCOME
$143,750
AVG HOUSEHOLD INCOME
25.5%
WAGE / INCOME GAP [ % ]
74.5¢/ $1
WAGE / INCOME GAP [ $ ]
0.27
INEQUALITY / GINI INDEX
80
LABOR FORCE [ PEOPLE ]
74.8%
PERCENT IN LABOR FORCE
8.8%
UNEMPLOYMENT RATE
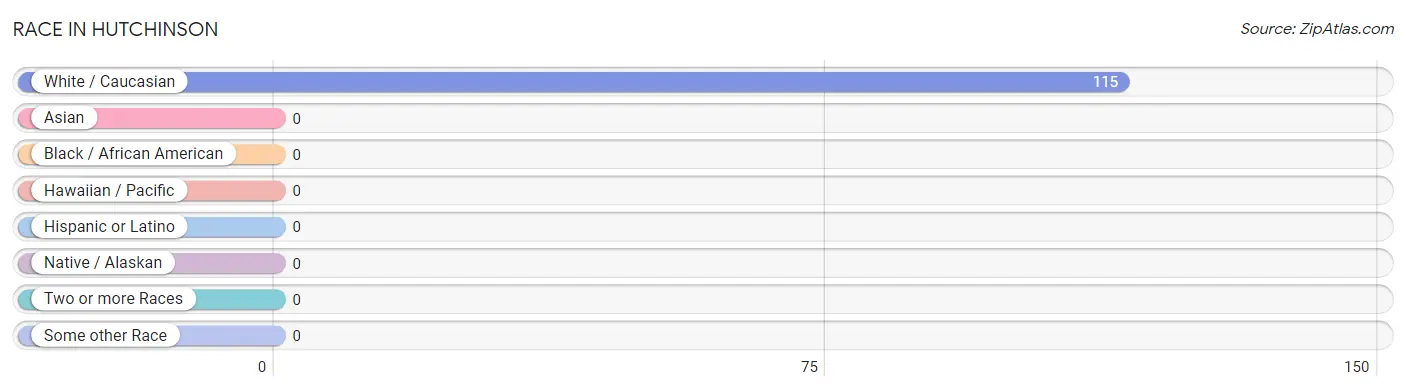
Race in Hutchinson
The most populous races in Hutchinson are , and White / Caucasian (115 | 100.0%).
| Race | # Population | % Population |
| Asian | 0 | 0.0% |
| Black / African American | 0 | 0.0% |
| Hawaiian / Pacific | 0 | 0.0% |
| Hispanic or Latino | 0 | 0.0% |
| Native / Alaskan | 0 | 0.0% |
| White / Caucasian | 115 | 100.0% |
| Two or more Races | 0 | 0.0% |
| Some other Race | 0 | 0.0% |
| Total | 115 | 100.0% |
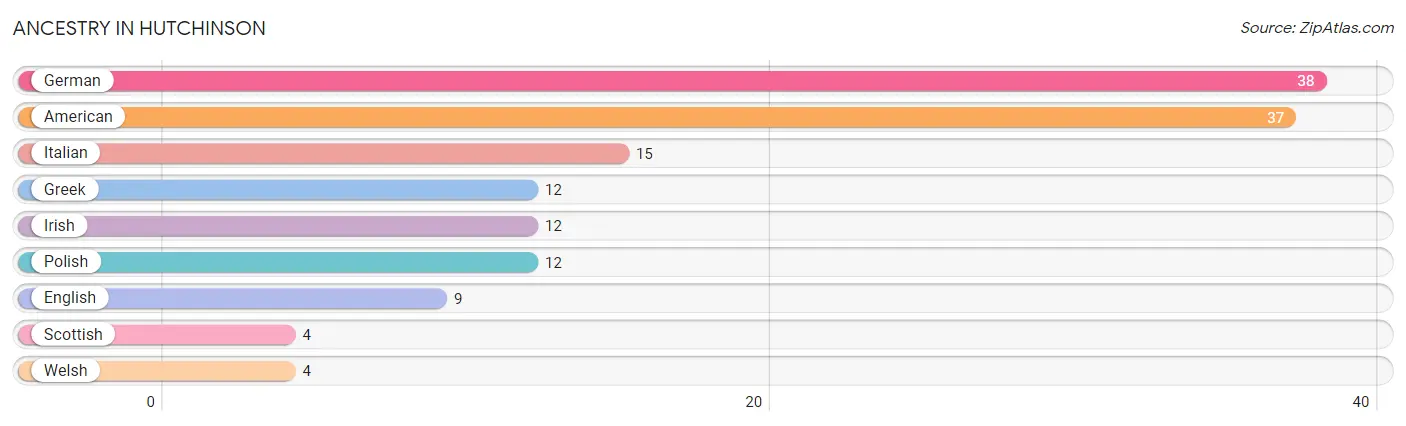
Ancestry in Hutchinson
The most populous ancestries reported in Hutchinson are German (38 | 33.0%), American (37 | 32.2%), Italian (15 | 13.0%), Greek (12 | 10.4%), and Irish (12 | 10.4%), together accounting for 99.1% of all Hutchinson residents.
| Ancestry | # Population | % Population |
| American | 37 | 32.2% |
| English | 9 | 7.8% |
| German | 38 | 33.0% |
| Greek | 12 | 10.4% |
| Irish | 12 | 10.4% |
| Italian | 15 | 13.0% |
| Polish | 12 | 10.4% |
| Scottish | 4 | 3.5% |
| Welsh | 4 | 3.5% | View All 9 Rows |
Immigrants in Hutchinson

| Immigration Origin | # Population | % Population | View All 0 Rows |
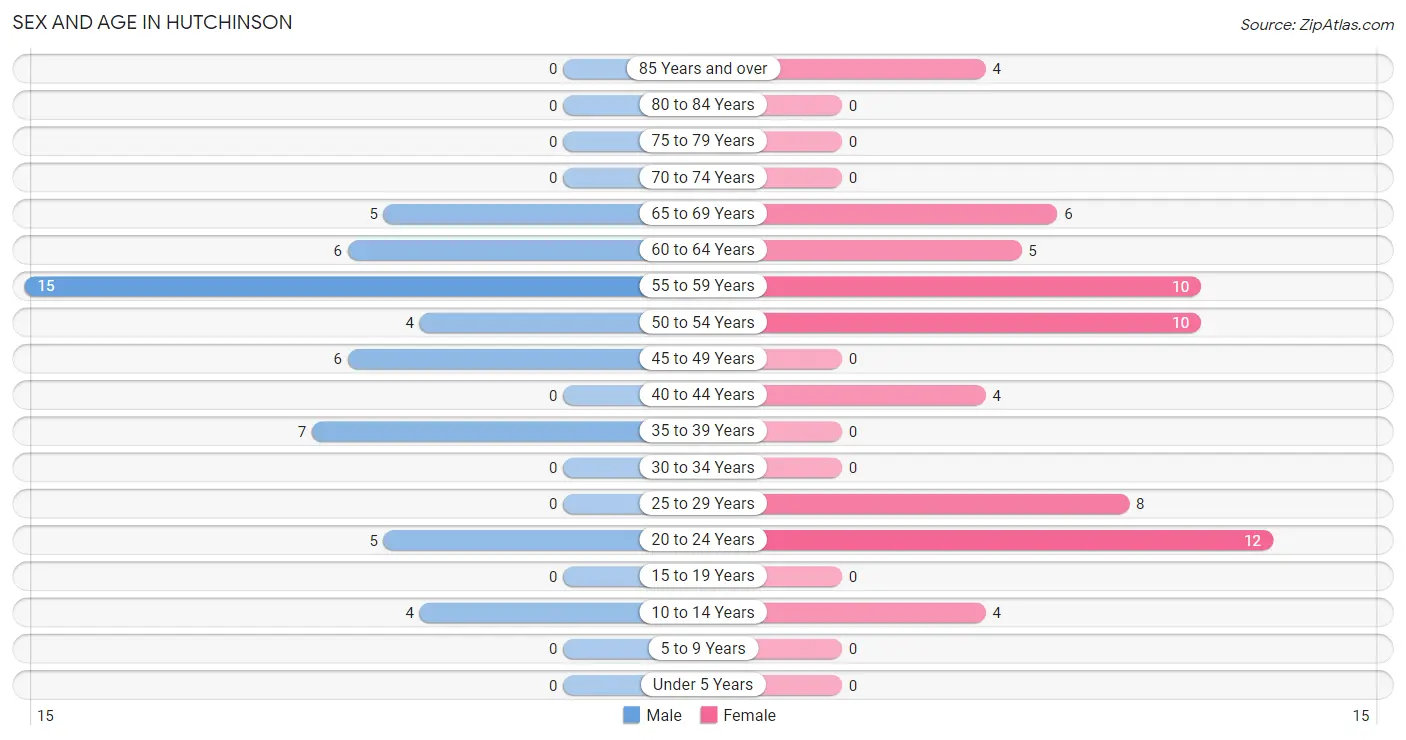
Sex and Age in Hutchinson
Sex and Age in Hutchinson
The most populous age groups in Hutchinson are 55 to 59 Years (15 | 28.8%) for men and 20 to 24 Years (12 | 19.1%) for women.
| Age Bracket | Male | Female |
| Under 5 Years | 0 (0.0%) | 0 (0.0%) |
| 5 to 9 Years | 0 (0.0%) | 0 (0.0%) |
| 10 to 14 Years | 4 (7.7%) | 4 (6.4%) |
| 15 to 19 Years | 0 (0.0%) | 0 (0.0%) |
| 20 to 24 Years | 5 (9.6%) | 12 (19.1%) |
| 25 to 29 Years | 0 (0.0%) | 8 (12.7%) |
| 30 to 34 Years | 0 (0.0%) | 0 (0.0%) |
| 35 to 39 Years | 7 (13.5%) | 0 (0.0%) |
| 40 to 44 Years | 0 (0.0%) | 4 (6.4%) |
| 45 to 49 Years | 6 (11.5%) | 0 (0.0%) |
| 50 to 54 Years | 4 (7.7%) | 10 (15.9%) |
| 55 to 59 Years | 15 (28.8%) | 10 (15.9%) |
| 60 to 64 Years | 6 (11.5%) | 5 (7.9%) |
| 65 to 69 Years | 5 (9.6%) | 6 (9.5%) |
| 70 to 74 Years | 0 (0.0%) | 0 (0.0%) |
| 75 to 79 Years | 0 (0.0%) | 0 (0.0%) |
| 80 to 84 Years | 0 (0.0%) | 0 (0.0%) |
| 85 Years and over | 0 (0.0%) | 4 (6.4%) |
| Total | 52 (100.0%) | 63 (100.0%) |
Families and Households in Hutchinson
Median Family Size in Hutchinson
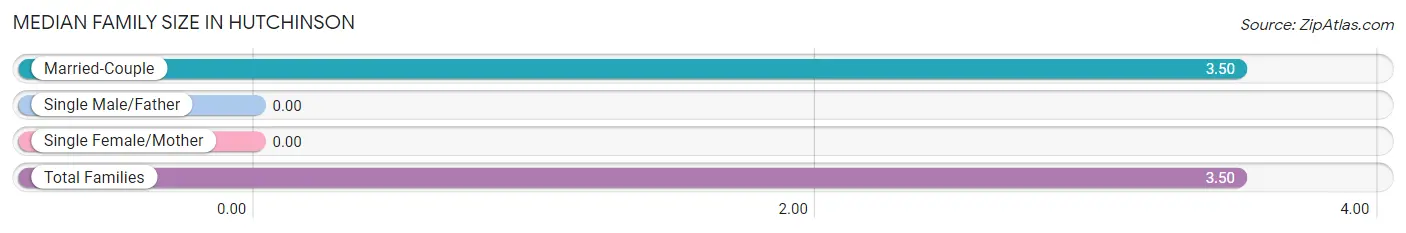
| Family Type | # Families | Family Size |
| Married-Couple | 30 (100.0%) | 3.50 |
| Single Male/Father | 0 (0.0%) | - |
| Single Female/Mother | 0 (0.0%) | - |
| Total Families | 30 (100.0%) | 3.50 |
Median Household Size in Hutchinson
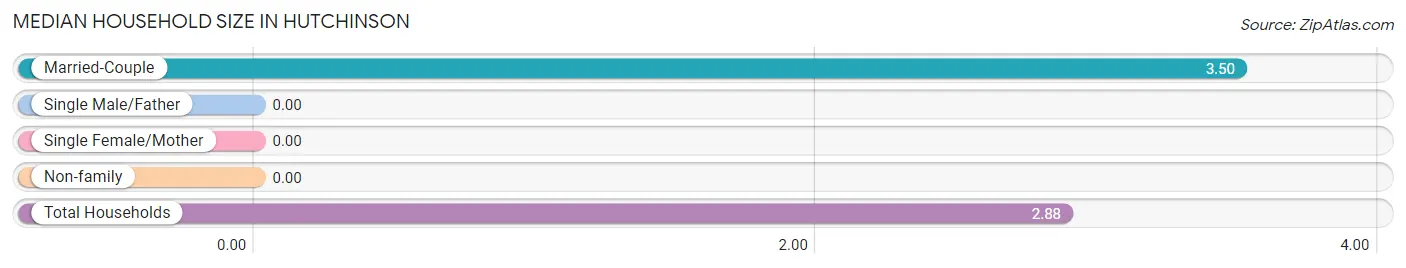
| Household Type | # Households | Household Size |
| Married-Couple | 30 (75.0%) | 3.50 |
| Single Male/Father | 0 (0.0%) | - |
| Single Female/Mother | 0 (0.0%) | - |
| Non-family | 10 (25.0%) | - |
| Total Households | 40 (100.0%) | 2.88 |
Household Size by Marriage Status in Hutchinson
Out of a total of 40 households in Hutchinson, 30 (75.0%) are family households, while 10 (25.0%) are nonfamily households. The most numerous type of family households are 3-person households, comprising 11, and the most common type of nonfamily households are 1-person households, comprising 10.
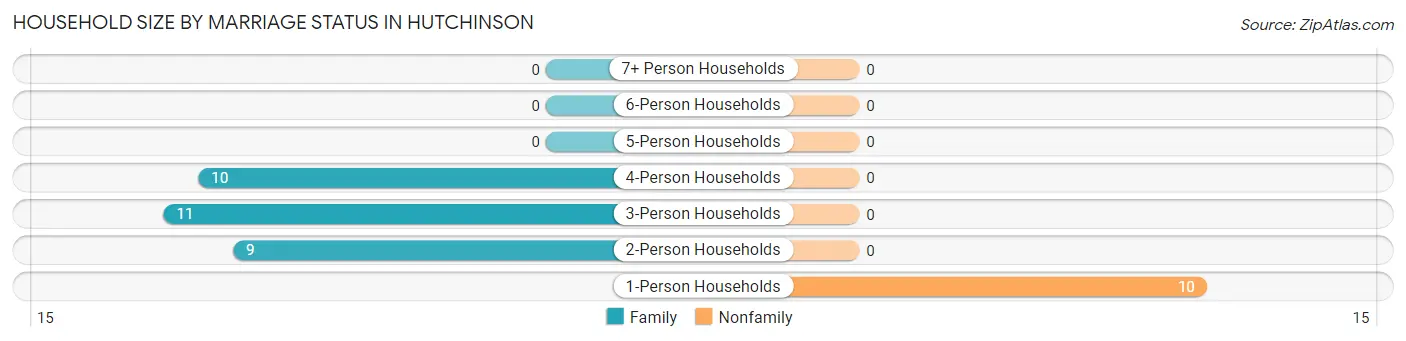
| Household Size | Family Households | Nonfamily Households |
| 1-Person Households | - | 10 (25.0%) |
| 2-Person Households | 9 (22.5%) | 0 (0.0%) |
| 3-Person Households | 11 (27.5%) | 0 (0.0%) |
| 4-Person Households | 10 (25.0%) | 0 (0.0%) |
| 5-Person Households | 0 (0.0%) | 0 (0.0%) |
| 6-Person Households | 0 (0.0%) | 0 (0.0%) |
| 7+ Person Households | 0 (0.0%) | 0 (0.0%) |
| Total | 30 (75.0%) | 10 (25.0%) |
Female Fertility in Hutchinson
Fertility by Age in Hutchinson
| Age Bracket | Women with Births | Births / 1,000 Women |
| 15 to 19 years | 0 (0.0%) | 0.0 |
| 20 to 34 years | 0 (0.0%) | 0.0 |
| 35 to 50 years | 0 (0.0%) | 0.0 |
| Total | 0 (0.0%) | 0.0 |
Fertility by Age by Marriage Status in Hutchinson
| Age Bracket | Married | Unmarried |
| 15 to 19 years | 0 (0.0%) | 0 (0.0%) |
| 20 to 34 years | 0 (0.0%) | 0 (0.0%) |
| 35 to 50 years | 0 (0.0%) | 0 (0.0%) |
| Total | 0 (0.0%) | 0 (0.0%) |
Fertility by Education in Hutchinson
| Educational Attainment | Women with Births | Births / 1,000 Women |
| Less than High School | 0 (0.0%) | 0.0 |
| High School Diploma | 0 (0.0%) | 0.0 |
| College or Associate's Degree | 0 (0.0%) | 0.0 |
| Bachelor's Degree | 0 (0.0%) | 0.0 |
| Graduate Degree | 0 (0.0%) | 0.0 |
| Total | 0 (0.0%) | 0.0 |
Fertility by Education by Marriage Status in Hutchinson
| Educational Attainment | Married | Unmarried |
| Less than High School | 0 (0.0%) | 0 (0.0%) |
| High School Diploma | 0 (0.0%) | 0 (0.0%) |
| College or Associate's Degree | 0 (0.0%) | 0 (0.0%) |
| Bachelor's Degree | 0 (0.0%) | 0 (0.0%) |
| Graduate Degree | 0 (0.0%) | 0 (0.0%) |
| Total | 0 (0.0%) | 0 (0.0%) |
Income in Hutchinson
Income Overview in Hutchinson
Per Capita Income in Hutchinson is $53,575, while median incomes of families and households are $167,500 and $143,750 respectively.
| Characteristic | Number | Measure |
| Per Capita Income | 115 | $53,575 |
| Median Family Income | 30 | $167,500 |
| Mean Family Income | 30 | $172,480 |
| Median Household Income | 40 | $143,750 |
| Mean Household Income | 40 | $142,498 |
| Income Deficit | 30 | $0 |
| Wage / Income Gap (%) | 115 | 25.55% |
| Wage / Income Gap ($) | 115 | 74.45¢ per $1 |
| Gini / Inequality Index | 115 | 0.27 |
Earnings by Sex in Hutchinson
Average Earnings in Hutchinson are $70,972, $75,833 for men and $56,458 for women, a difference of 25.6%.
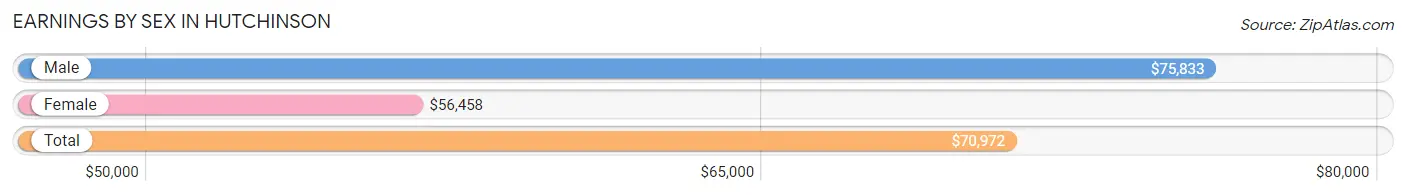
| Sex | Number | Average Earnings |
| Male | 30 (41.1%) | $75,833 |
| Female | 43 (58.9%) | $56,458 |
| Total | 73 (100.0%) | $70,972 |
Earnings by Sex by Income Bracket in Hutchinson
The most common earnings brackets in Hutchinson are $75,000 to $99,999 for men (12 | 40.0%) and $75,000 to $99,999 for women (10 | 23.3%).

| Income | Male | Female |
| $2,499 or less | 0 (0.0%) | 0 (0.0%) |
| $2,500 to $4,999 | 0 (0.0%) | 0 (0.0%) |
| $5,000 to $7,499 | 0 (0.0%) | 0 (0.0%) |
| $7,500 to $9,999 | 0 (0.0%) | 0 (0.0%) |
| $10,000 to $12,499 | 0 (0.0%) | 0 (0.0%) |
| $12,500 to $14,999 | 0 (0.0%) | 0 (0.0%) |
| $15,000 to $17,499 | 0 (0.0%) | 4 (9.3%) |
| $17,500 to $19,999 | 0 (0.0%) | 0 (0.0%) |
| $20,000 to $22,499 | 0 (0.0%) | 8 (18.6%) |
| $22,500 to $24,999 | 0 (0.0%) | 0 (0.0%) |
| $25,000 to $29,999 | 5 (16.7%) | 0 (0.0%) |
| $30,000 to $34,999 | 0 (0.0%) | 0 (0.0%) |
| $35,000 to $39,999 | 0 (0.0%) | 0 (0.0%) |
| $40,000 to $44,999 | 4 (13.3%) | 0 (0.0%) |
| $45,000 to $49,999 | 0 (0.0%) | 0 (0.0%) |
| $50,000 to $54,999 | 0 (0.0%) | 6 (14.0%) |
| $55,000 to $64,999 | 0 (0.0%) | 6 (14.0%) |
| $65,000 to $74,999 | 4 (13.3%) | 5 (11.6%) |
| $75,000 to $99,999 | 12 (40.0%) | 10 (23.3%) |
| $100,000+ | 5 (16.7%) | 4 (9.3%) |
| Total | 30 (100.0%) | 43 (100.0%) |
Earnings by Sex by Educational Attainment in Hutchinson
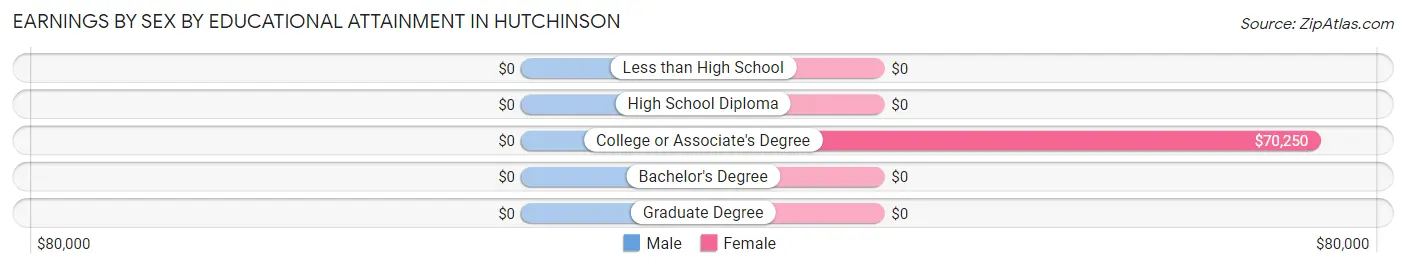
| Educational Attainment | Male Income | Female Income |
| Less than High School | - | - |
| High School Diploma | - | - |
| College or Associate's Degree | - | - |
| Bachelor's Degree | - | - |
| Graduate Degree | - | - |
| Total | $76,875 | $56,458 |
Family Income in Hutchinson
Family Income Brackets in Hutchinson
According to the Hutchinson family income data, there are 16 families falling into the $150,000 to $199,999 income range, which is the most common income bracket and makes up 53.3% of all families.
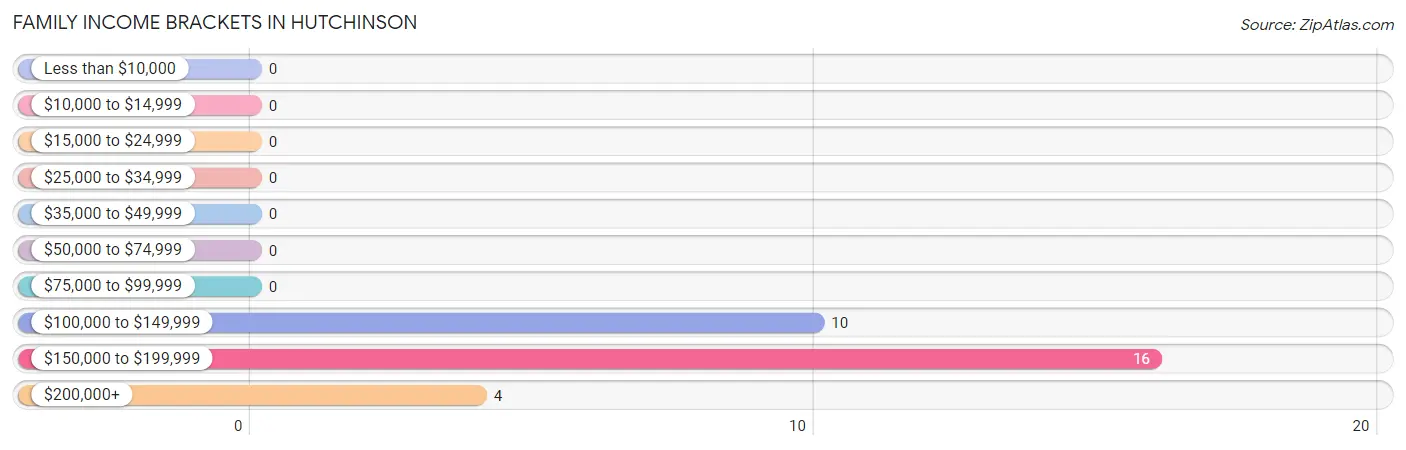
| Income Bracket | # Families | % Families |
| Less than $10,000 | 0 | 0.0% |
| $10,000 to $14,999 | 0 | 0.0% |
| $15,000 to $24,999 | 0 | 0.0% |
| $25,000 to $34,999 | 0 | 0.0% |
| $35,000 to $49,999 | 0 | 0.0% |
| $50,000 to $74,999 | 0 | 0.0% |
| $75,000 to $99,999 | 0 | 0.0% |
| $100,000 to $149,999 | 10 | 33.3% |
| $150,000 to $199,999 | 16 | 53.3% |
| $200,000+ | 4 | 13.3% |
Family Income by Famaliy Size in Hutchinson
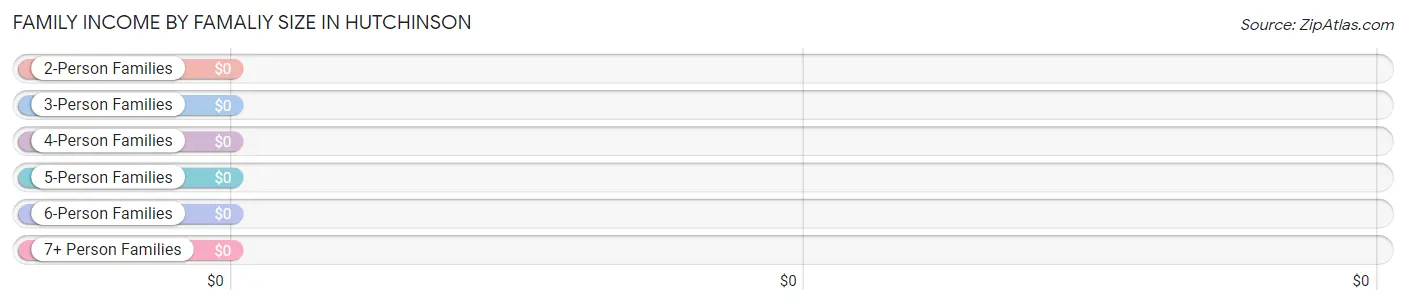
| Income Bracket | # Families | Median Income |
| 2-Person Families | 9 (30.0%) | $0 |
| 3-Person Families | 11 (36.7%) | $0 |
| 4-Person Families | 10 (33.3%) | $0 |
| 5-Person Families | 0 (0.0%) | $0 |
| 6-Person Families | 0 (0.0%) | $0 |
| 7+ Person Families | 0 (0.0%) | $0 |
| Total | 30 (100.0%) | $167,500 |
Family Income by Number of Earners in Hutchinson
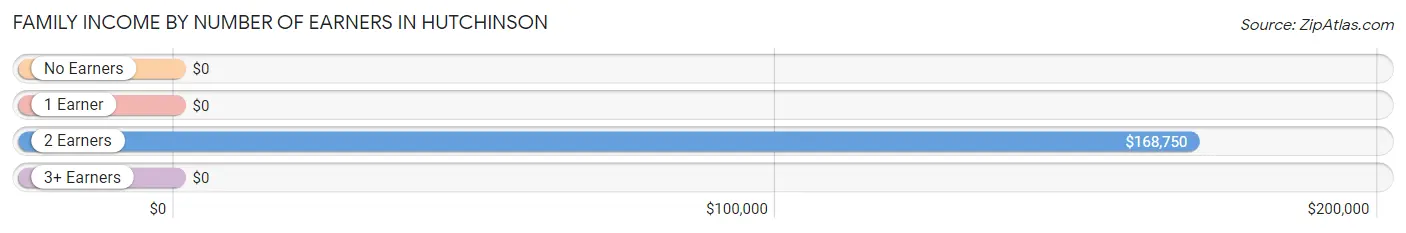
| Number of Earners | # Families | Median Income |
| No Earners | 0 (0.0%) | $0 |
| 1 Earner | 0 (0.0%) | $0 |
| 2 Earners | 24 (80.0%) | $168,750 |
| 3+ Earners | 6 (20.0%) | $0 |
| Total | 30 (100.0%) | $167,500 |
Household Income in Hutchinson
Household Income Brackets in Hutchinson
With 16 households falling in the category, the $150,000 to $199,999 income range is the most frequent in Hutchinson, accounting for 40.0% of all households.
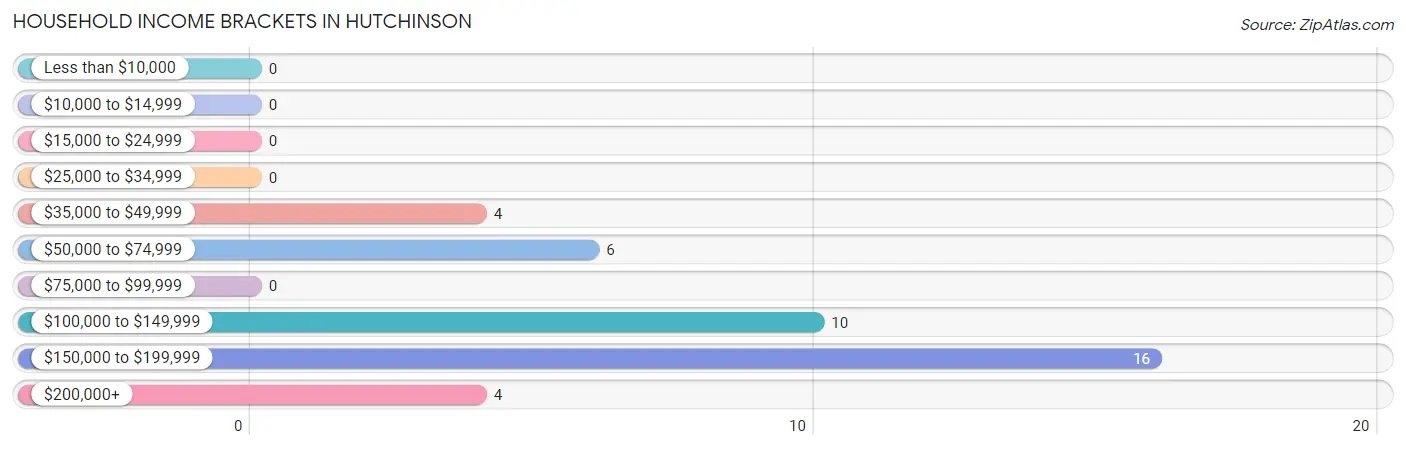
| Income Bracket | # Households | % Households |
| Less than $10,000 | 0 | 0.0% |
| $10,000 to $14,999 | 0 | 0.0% |
| $15,000 to $24,999 | 0 | 0.0% |
| $25,000 to $34,999 | 0 | 0.0% |
| $35,000 to $49,999 | 4 | 10.0% |
| $50,000 to $74,999 | 6 | 15.0% |
| $75,000 to $99,999 | 0 | 0.0% |
| $100,000 to $149,999 | 10 | 25.0% |
| $150,000 to $199,999 | 16 | 40.0% |
| $200,000+ | 4 | 10.0% |
Household Income by Householder Age in Hutchinson
The median household income in Hutchinson is $143,750, with the highest median household income of $120,938 found in the 45 to 64 years age bracket for the primary householder. A total of 27 households (67.5%) fall into this category.
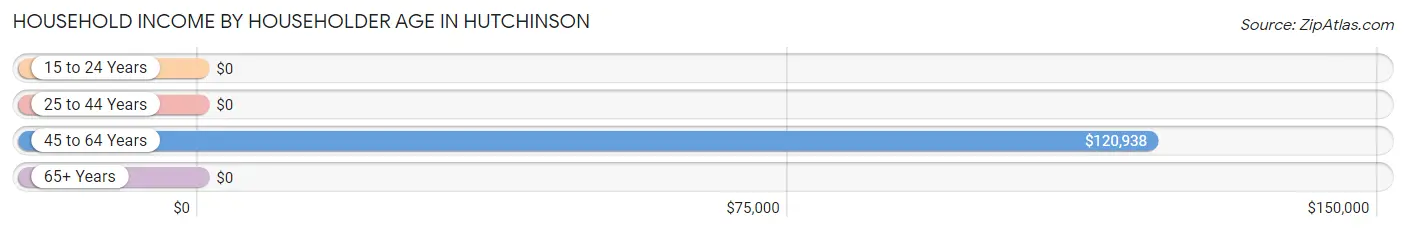
| Income Bracket | # Households | Median Income |
| 15 to 24 Years | 0 (0.0%) | $0 |
| 25 to 44 Years | 4 (10.0%) | $0 |
| 45 to 64 Years | 27 (67.5%) | $120,938 |
| 65+ Years | 9 (22.5%) | $0 |
| Total | 40 (100.0%) | $143,750 |
Poverty in Hutchinson
Income Below Poverty by Sex and Age in Hutchinson
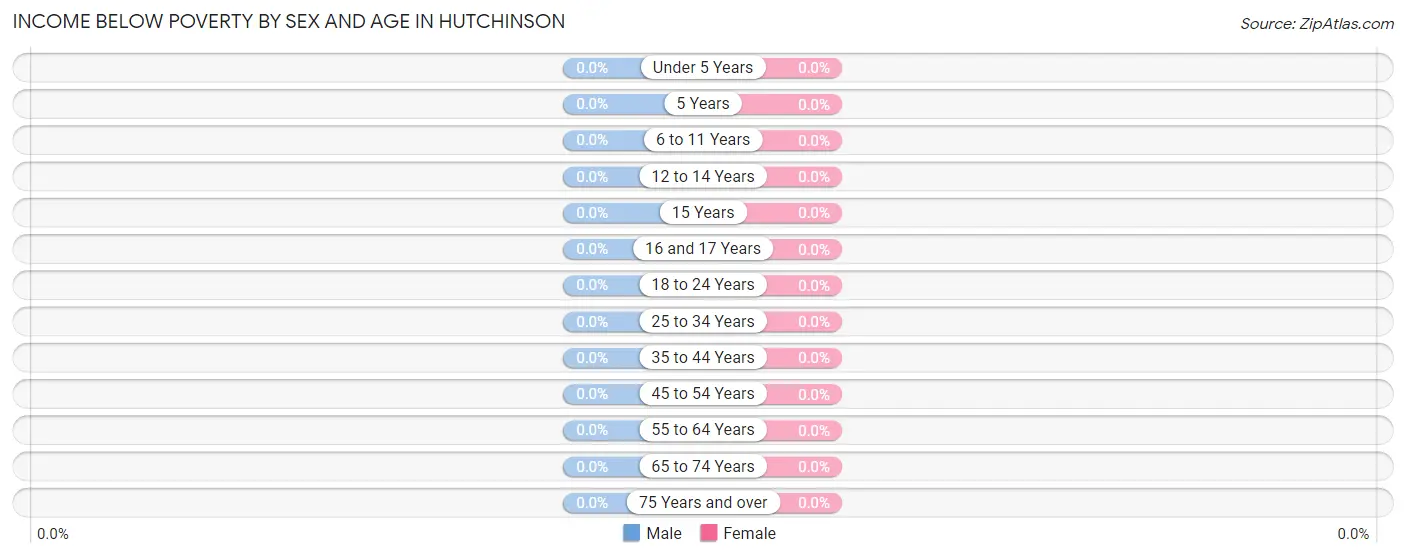
| Age Bracket | Male | Female |
| Under 5 Years | 0 (0.0%) | 0 (0.0%) |
| 5 Years | 0 (0.0%) | 0 (0.0%) |
| 6 to 11 Years | 0 (0.0%) | 0 (0.0%) |
| 12 to 14 Years | 0 (0.0%) | 0 (0.0%) |
| 15 Years | 0 (0.0%) | 0 (0.0%) |
| 16 and 17 Years | 0 (0.0%) | 0 (0.0%) |
| 18 to 24 Years | 0 (0.0%) | 0 (0.0%) |
| 25 to 34 Years | 0 (0.0%) | 0 (0.0%) |
| 35 to 44 Years | 0 (0.0%) | 0 (0.0%) |
| 45 to 54 Years | 0 (0.0%) | 0 (0.0%) |
| 55 to 64 Years | 0 (0.0%) | 0 (0.0%) |
| 65 to 74 Years | 0 (0.0%) | 0 (0.0%) |
| 75 Years and over | 0 (0.0%) | 0 (0.0%) |
| Total | 0 (0.0%) | 0 (0.0%) |
Income Above Poverty by Sex and Age in Hutchinson
According to the poverty statistics in Hutchinson, males aged 12 to 14 years and females aged 12 to 14 years are the age groups that are most secure financially, with 100.0% of males and 100.0% of females in these age groups living above the poverty line.
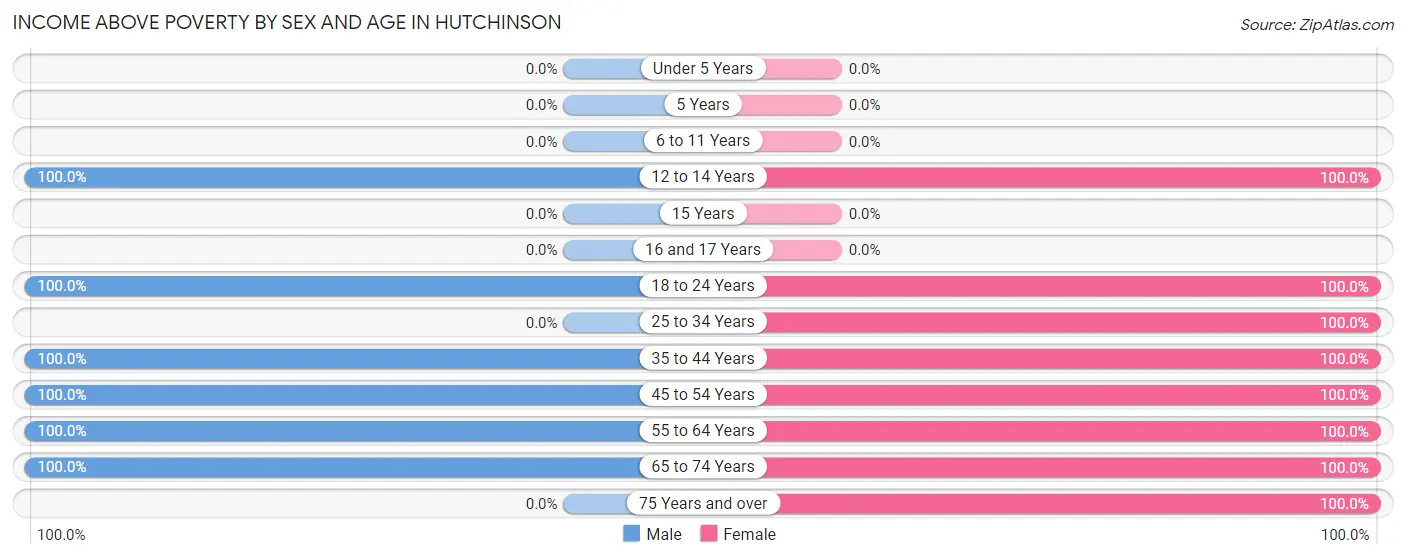
| Age Bracket | Male | Female |
| Under 5 Years | 0 (0.0%) | 0 (0.0%) |
| 5 Years | 0 (0.0%) | 0 (0.0%) |
| 6 to 11 Years | 0 (0.0%) | 0 (0.0%) |
| 12 to 14 Years | 4 (100.0%) | 4 (100.0%) |
| 15 Years | 0 (0.0%) | 0 (0.0%) |
| 16 and 17 Years | 0 (0.0%) | 0 (0.0%) |
| 18 to 24 Years | 5 (100.0%) | 12 (100.0%) |
| 25 to 34 Years | 0 (0.0%) | 8 (100.0%) |
| 35 to 44 Years | 7 (100.0%) | 4 (100.0%) |
| 45 to 54 Years | 10 (100.0%) | 10 (100.0%) |
| 55 to 64 Years | 21 (100.0%) | 15 (100.0%) |
| 65 to 74 Years | 5 (100.0%) | 6 (100.0%) |
| 75 Years and over | 0 (0.0%) | 4 (100.0%) |
| Total | 52 (100.0%) | 63 (100.0%) |
Income Below Poverty Among Married-Couple Families in Hutchinson
| Children | Above Poverty | Below Poverty |
| No Children | 26 (100.0%) | 0 (0.0%) |
| 1 or 2 Children | 4 (100.0%) | 0 (0.0%) |
| 3 or 4 Children | 0 (0.0%) | 0 (0.0%) |
| 5 or more Children | 0 (0.0%) | 0 (0.0%) |
| Total | 30 (100.0%) | 0 (0.0%) |
Income Below Poverty Among Single-Parent Households in Hutchinson
| Children | Single Father | Single Mother |
| No Children | 0 (0.0%) | 0 (0.0%) |
| 1 or 2 Children | 0 (0.0%) | 0 (0.0%) |
| 3 or 4 Children | 0 (0.0%) | 0 (0.0%) |
| 5 or more Children | 0 (0.0%) | 0 (0.0%) |
| Total | 0 (0.0%) | 0 (0.0%) |
Income Below Poverty Among Married-Couple vs Single-Parent Households in Hutchinson
| Children | Married-Couple Families | Single-Parent Households |
| No Children | 0 (0.0%) | 0 (0.0%) |
| 1 or 2 Children | 0 (0.0%) | 0 (0.0%) |
| 3 or 4 Children | 0 (0.0%) | 0 (0.0%) |
| 5 or more Children | 0 (0.0%) | 0 (0.0%) |
| Total | 0 (0.0%) | 0 (0.0%) |
Employment Characteristics in Hutchinson
Employment by Class of Employer in Hutchinson
Among the 69 employed individuals in Hutchinson, private company employees (45 | 65.2%), local government employees (12 | 17.4%), and self-employed (not incorporated) (4 | 5.8%) make up the most common classes of employment.
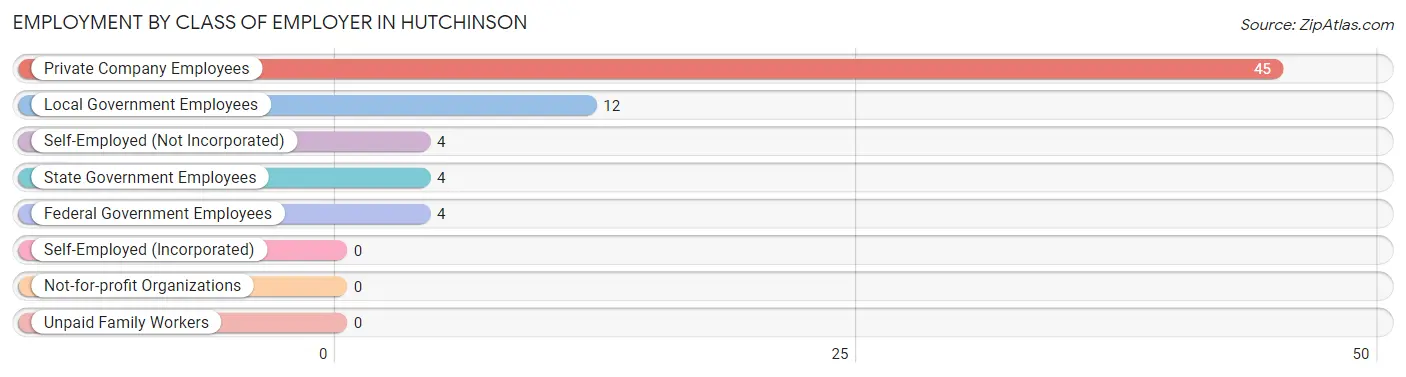
| Employer Class | # Employees | % Employees |
| Private Company Employees | 45 | 65.2% |
| Self-Employed (Incorporated) | 0 | 0.0% |
| Self-Employed (Not Incorporated) | 4 | 5.8% |
| Not-for-profit Organizations | 0 | 0.0% |
| Local Government Employees | 12 | 17.4% |
| State Government Employees | 4 | 5.8% |
| Federal Government Employees | 4 | 5.8% |
| Unpaid Family Workers | 0 | 0.0% |
| Total | 69 | 100.0% |
Employment Status by Age in Hutchinson
According to the labor force statistics for Hutchinson, out of the total population over 16 years of age (107), 74.8% or 80 individuals are in the labor force, with 8.8% or 7 of them unemployed. The age group with the highest labor force participation rate is 25 to 29 years, with 100.0% or 8 individuals in the labor force. Within the labor force, the 35 to 44 years age range has the highest percentage of unemployed individuals, with 63.6% or 7 of them being unemployed.
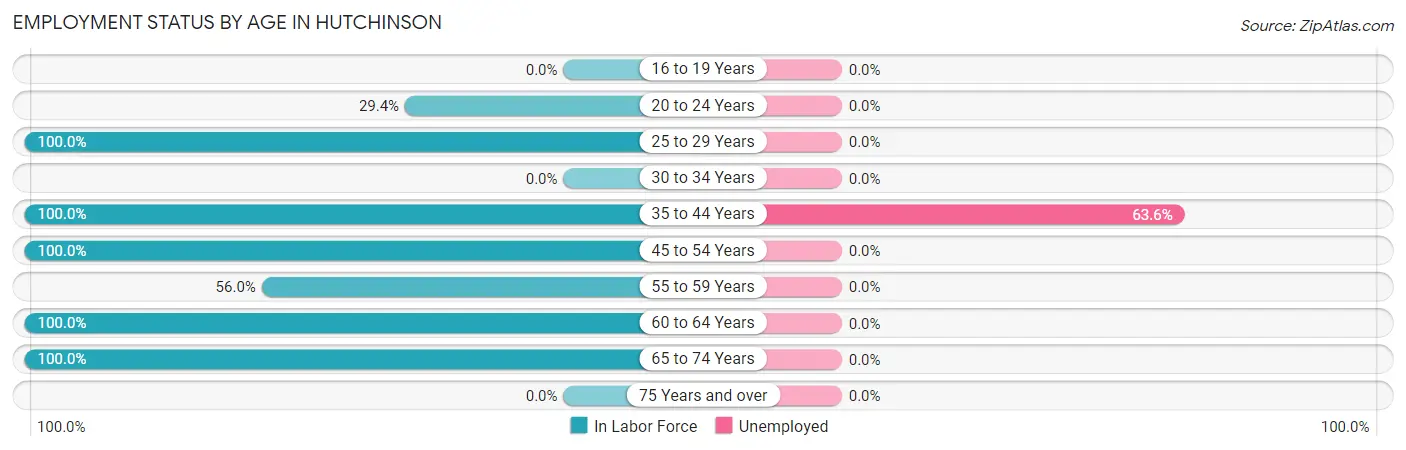
| Age Bracket | In Labor Force | Unemployed |
| 16 to 19 Years | 0 (0.0%) | 0 (0.0%) |
| 20 to 24 Years | 5 (29.4%) | 0 (0.0%) |
| 25 to 29 Years | 8 (100.0%) | 0 (0.0%) |
| 30 to 34 Years | 0 (0.0%) | 0 (0.0%) |
| 35 to 44 Years | 11 (100.0%) | 7 (63.6%) |
| 45 to 54 Years | 20 (100.0%) | 0 (0.0%) |
| 55 to 59 Years | 14 (56.0%) | 0 (0.0%) |
| 60 to 64 Years | 11 (100.0%) | 0 (0.0%) |
| 65 to 74 Years | 11 (100.0%) | 0 (0.0%) |
| 75 Years and over | 0 (0.0%) | 0 (0.0%) |
| Total | 80 (74.8%) | 7 (8.8%) |
Employment Status by Educational Attainment in Hutchinson
According to labor force statistics for Hutchinson, 85.3% of individuals (64) out of the total population between 25 and 64 years of age (75) are in the labor force, with 10.9% or 7 of them being unemployed. The group with the highest labor force participation rate are those with the educational attainment of college / associate degree, with 100.0% or 27 individuals in the labor force. Within the labor force, individuals with bachelor's degree or higher education have the highest percentage of unemployment, with 36.8% or 7 of them being unemployed.
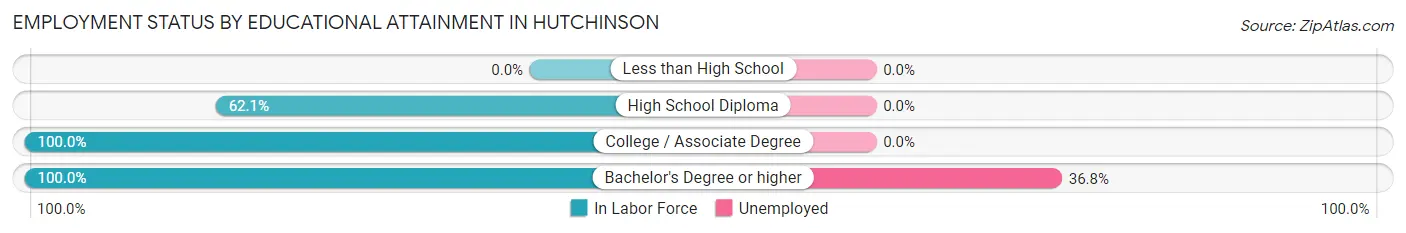
| Educational Attainment | In Labor Force | Unemployed |
| Less than High School | 0 (0.0%) | 0 (0.0%) |
| High School Diploma | 18 (62.1%) | 0 (0.0%) |
| College / Associate Degree | 27 (100.0%) | 0 (0.0%) |
| Bachelor's Degree or higher | 19 (100.0%) | 7 (36.8%) |
| Total | 64 (85.3%) | 8 (10.9%) |
Employment Occupations by Sex in Hutchinson
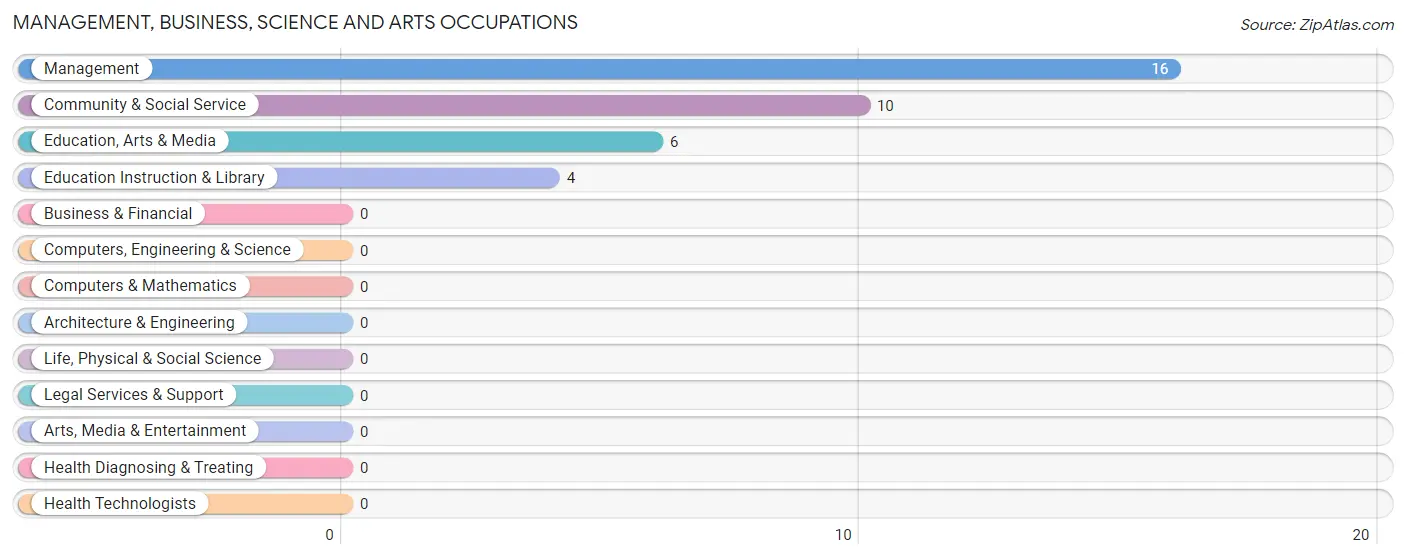
Management, Business, Science and Arts Occupations
The most common Management, Business, Science and Arts occupations in Hutchinson are Management (16 | 21.9%), Community & Social Service (10 | 13.7%), Education, Arts & Media (6 | 8.2%), and Education Instruction & Library (4 | 5.5%).
Management, Business, Science and Arts Occupations by Sex
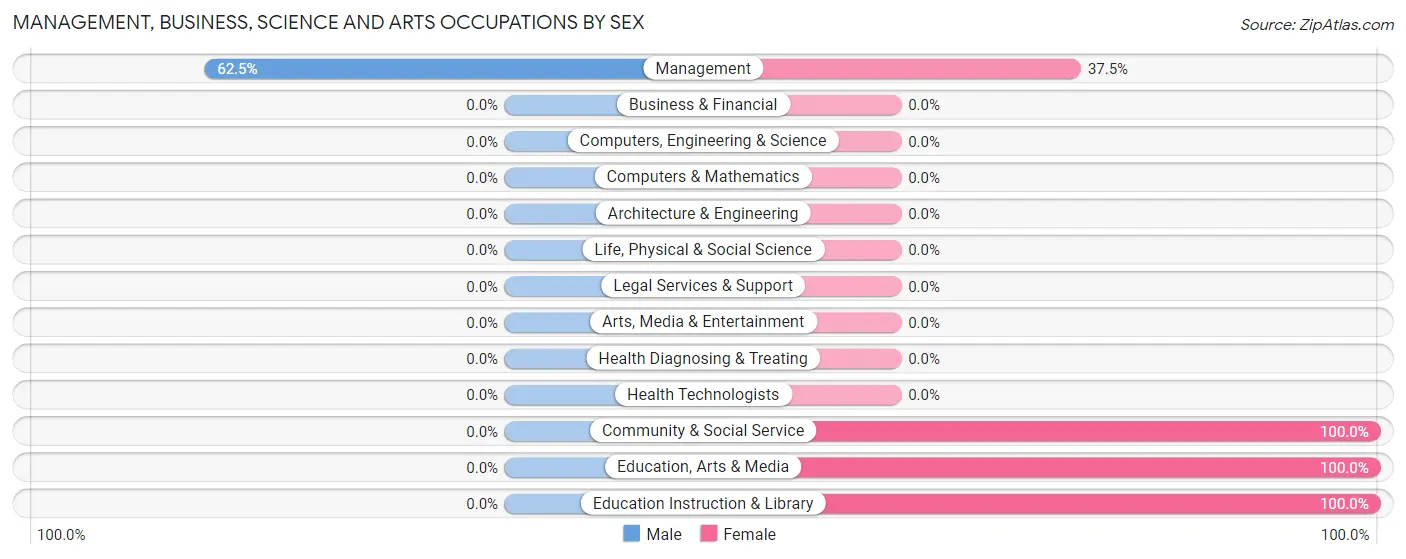
| Occupation | Male | Female |
| Management | 10 (62.5%) | 6 (37.5%) |
| Business & Financial | 0 (0.0%) | 0 (0.0%) |
| Computers, Engineering & Science | 0 (0.0%) | 0 (0.0%) |
| Computers & Mathematics | 0 (0.0%) | 0 (0.0%) |
| Architecture & Engineering | 0 (0.0%) | 0 (0.0%) |
| Life, Physical & Social Science | 0 (0.0%) | 0 (0.0%) |
| Community & Social Service | 0 (0.0%) | 10 (100.0%) |
| Education, Arts & Media | 0 (0.0%) | 6 (100.0%) |
| Legal Services & Support | 0 (0.0%) | 0 (0.0%) |
| Education Instruction & Library | 0 (0.0%) | 4 (100.0%) |
| Arts, Media & Entertainment | 0 (0.0%) | 0 (0.0%) |
| Health Diagnosing & Treating | 0 (0.0%) | 0 (0.0%) |
| Health Technologists | 0 (0.0%) | 0 (0.0%) |
| Total (Category) | 10 (38.5%) | 16 (61.5%) |
| Total (Overall) | 30 (41.1%) | 43 (58.9%) |
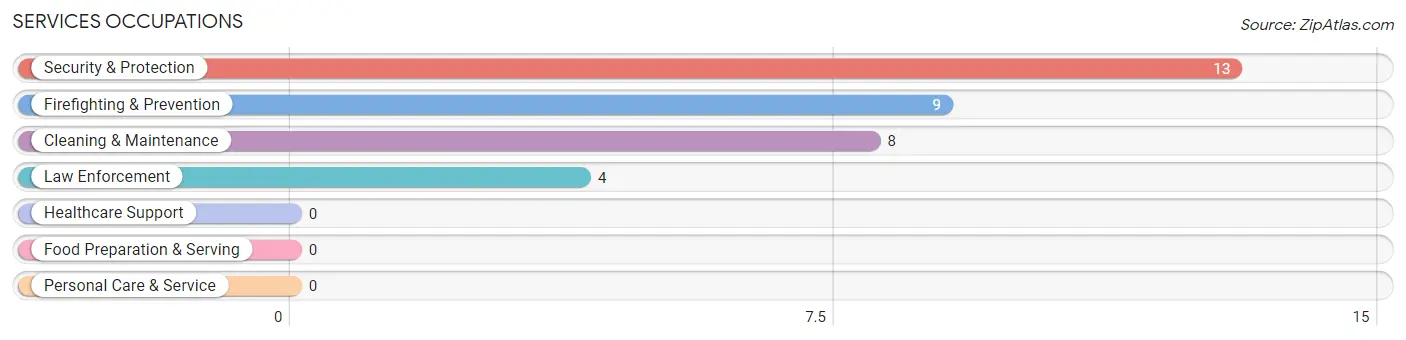
Services Occupations
The most common Services occupations in Hutchinson are Security & Protection (13 | 17.8%), Firefighting & Prevention (9 | 12.3%), Cleaning & Maintenance (8 | 11.0%), and Law Enforcement (4 | 5.5%).
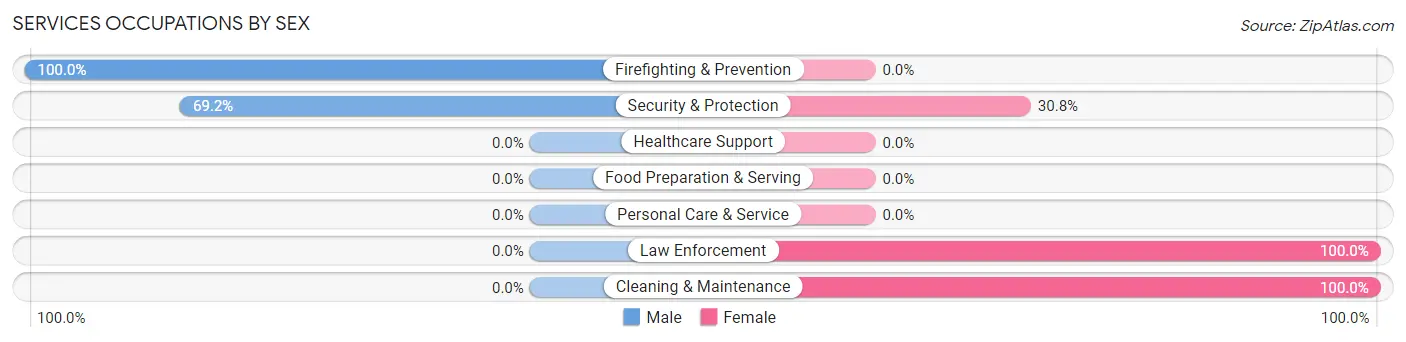
Services Occupations by Sex
Within the Services occupations in Hutchinson, the most male-oriented occupations are Firefighting & Prevention (100.0%), and Security & Protection (69.2%), while the most female-oriented occupations are Law Enforcement (100.0%), Cleaning & Maintenance (100.0%), and Security & Protection (30.8%).
| Occupation | Male | Female |
| Healthcare Support | 0 (0.0%) | 0 (0.0%) |
| Security & Protection | 9 (69.2%) | 4 (30.8%) |
| Firefighting & Prevention | 9 (100.0%) | 0 (0.0%) |
| Law Enforcement | 0 (0.0%) | 4 (100.0%) |
| Food Preparation & Serving | 0 (0.0%) | 0 (0.0%) |
| Cleaning & Maintenance | 0 (0.0%) | 8 (100.0%) |
| Personal Care & Service | 0 (0.0%) | 0 (0.0%) |
| Total (Category) | 9 (42.9%) | 12 (57.1%) |
| Total (Overall) | 30 (41.1%) | 43 (58.9%) |
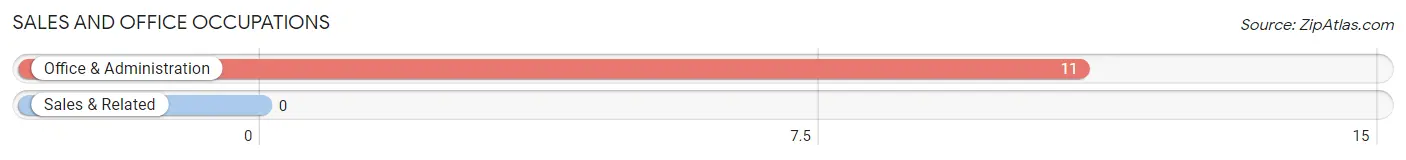
Sales and Office Occupations
The most common Sales and Office occupations in Hutchinson are , and Office & Administration (11 | 15.1%).
Sales and Office Occupations by Sex
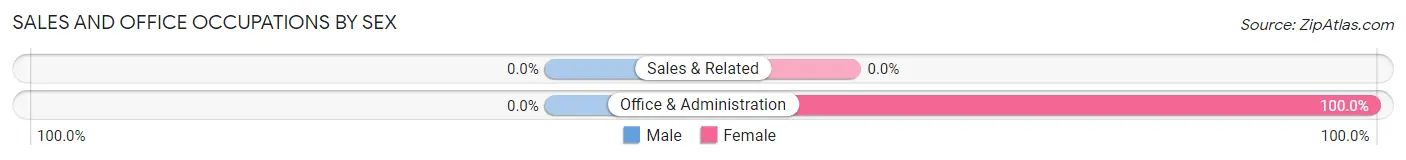
| Occupation | Male | Female |
| Sales & Related | 0 (0.0%) | 0 (0.0%) |
| Office & Administration | 0 (0.0%) | 11 (100.0%) |
| Total (Category) | 0 (0.0%) | 11 (100.0%) |
| Total (Overall) | 30 (41.1%) | 43 (58.9%) |
Natural Resources, Construction and Maintenance Occupations
The most common Natural Resources, Construction and Maintenance occupations in Hutchinson are , and Installation, Maintenance & Repair (6 | 8.2%).
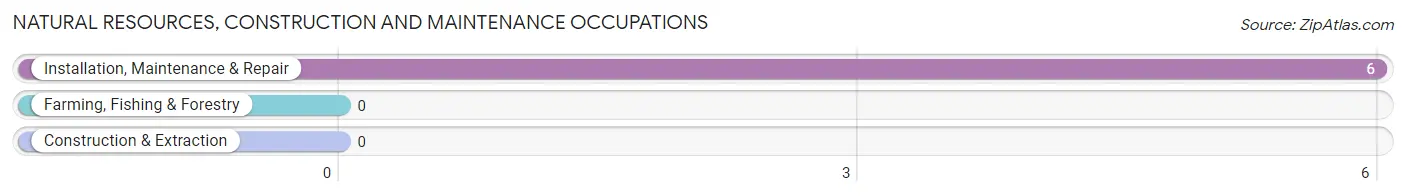
Natural Resources, Construction and Maintenance Occupations by Sex
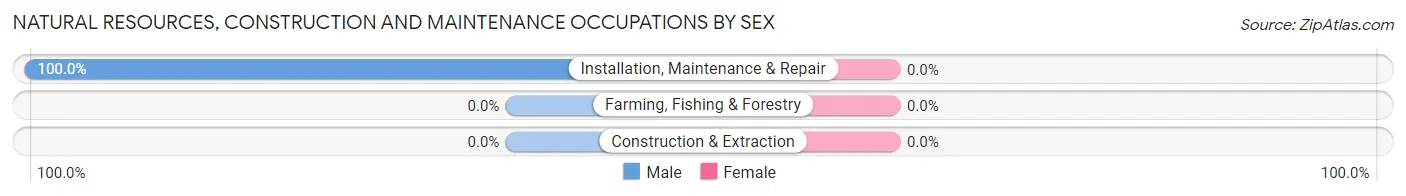
| Occupation | Male | Female |
| Farming, Fishing & Forestry | 0 (0.0%) | 0 (0.0%) |
| Construction & Extraction | 0 (0.0%) | 0 (0.0%) |
| Installation, Maintenance & Repair | 6 (100.0%) | 0 (0.0%) |
| Total (Category) | 6 (100.0%) | 0 (0.0%) |
| Total (Overall) | 30 (41.1%) | 43 (58.9%) |
Production, Transportation and Moving Occupations
The most common Production, Transportation and Moving occupations in Hutchinson are , and Material Moving (9 | 12.3%).
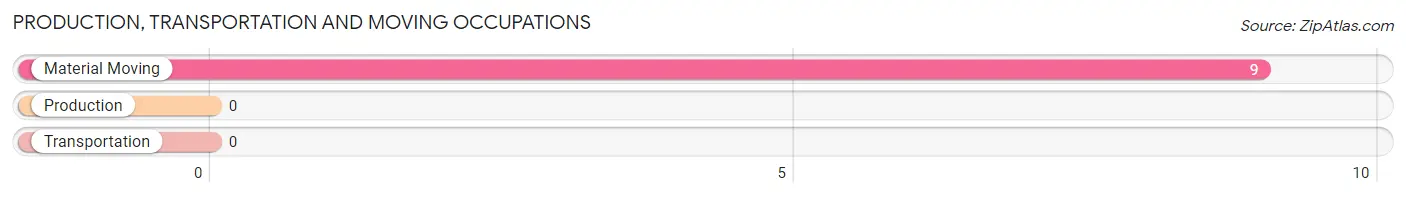
Production, Transportation and Moving Occupations by Sex
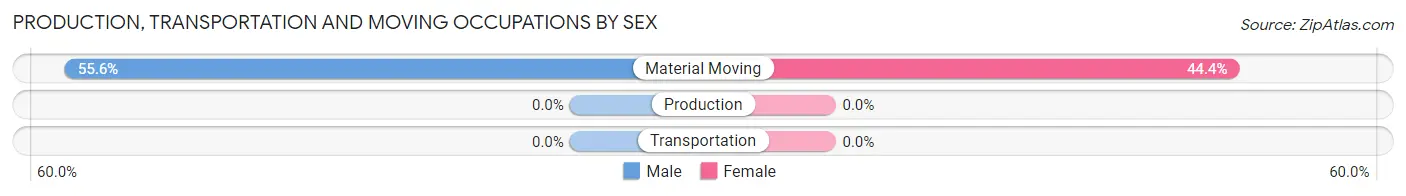
| Occupation | Male | Female |
| Production | 0 (0.0%) | 0 (0.0%) |
| Transportation | 0 (0.0%) | 0 (0.0%) |
| Material Moving | 5 (55.6%) | 4 (44.4%) |
| Total (Category) | 5 (55.6%) | 4 (44.4%) |
| Total (Overall) | 30 (41.1%) | 43 (58.9%) |
Employment Industries by Sex in Hutchinson
Employment Industries in Hutchinson
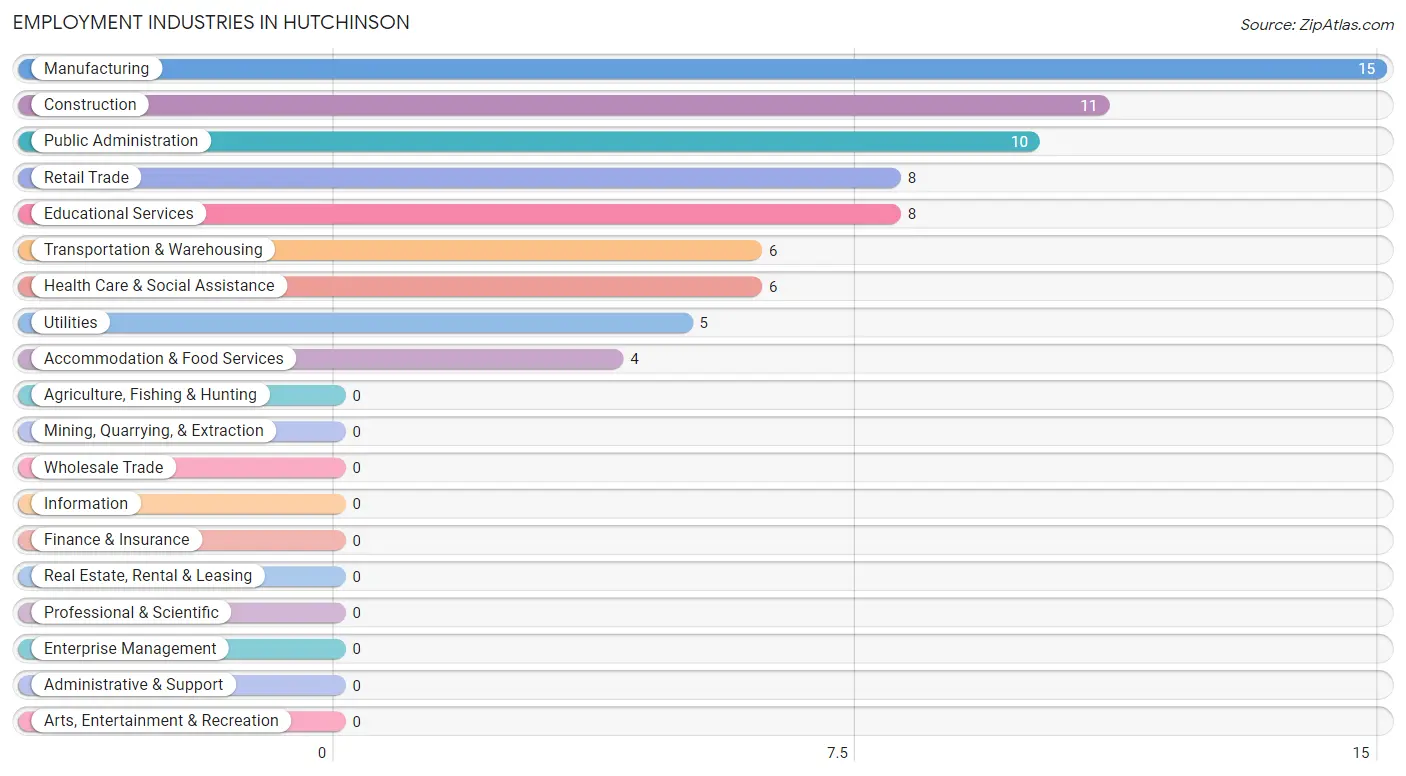
The major employment industries in Hutchinson include Manufacturing (15 | 20.5%), Construction (11 | 15.1%), Public Administration (10 | 13.7%), Retail Trade (8 | 11.0%), and Educational Services (8 | 11.0%).
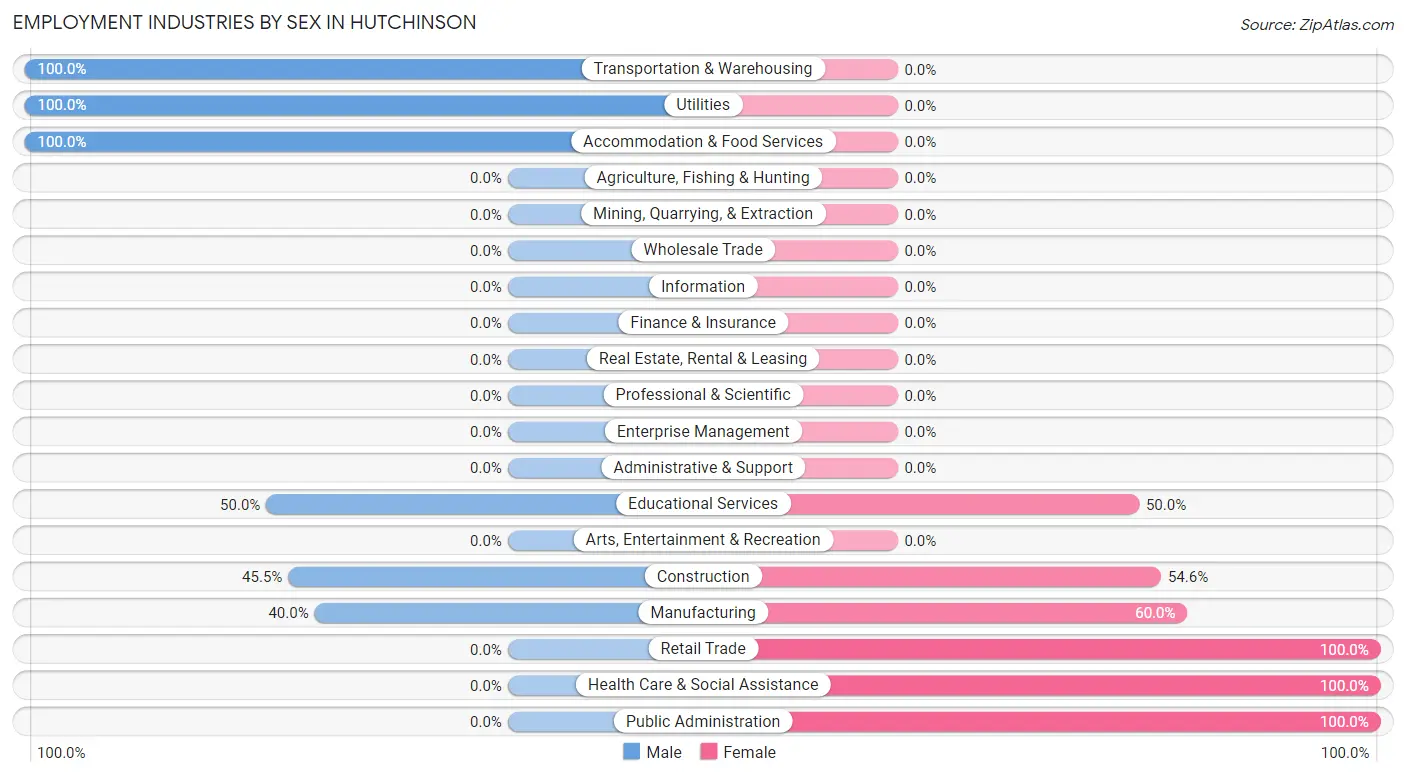
Employment Industries by Sex in Hutchinson
The Hutchinson industries that see more men than women are Transportation & Warehousing (100.0%), Utilities (100.0%), and Accommodation & Food Services (100.0%), whereas the industries that tend to have a higher number of women are Retail Trade (100.0%), Health Care & Social Assistance (100.0%), and Public Administration (100.0%).
| Industry | Male | Female |
| Agriculture, Fishing & Hunting | 0 (0.0%) | 0 (0.0%) |
| Mining, Quarrying, & Extraction | 0 (0.0%) | 0 (0.0%) |
| Construction | 5 (45.5%) | 6 (54.5%) |
| Manufacturing | 6 (40.0%) | 9 (60.0%) |
| Wholesale Trade | 0 (0.0%) | 0 (0.0%) |
| Retail Trade | 0 (0.0%) | 8 (100.0%) |
| Transportation & Warehousing | 6 (100.0%) | 0 (0.0%) |
| Utilities | 5 (100.0%) | 0 (0.0%) |
| Information | 0 (0.0%) | 0 (0.0%) |
| Finance & Insurance | 0 (0.0%) | 0 (0.0%) |
| Real Estate, Rental & Leasing | 0 (0.0%) | 0 (0.0%) |
| Professional & Scientific | 0 (0.0%) | 0 (0.0%) |
| Enterprise Management | 0 (0.0%) | 0 (0.0%) |
| Administrative & Support | 0 (0.0%) | 0 (0.0%) |
| Educational Services | 4 (50.0%) | 4 (50.0%) |
| Health Care & Social Assistance | 0 (0.0%) | 6 (100.0%) |
| Arts, Entertainment & Recreation | 0 (0.0%) | 0 (0.0%) |
| Accommodation & Food Services | 4 (100.0%) | 0 (0.0%) |
| Public Administration | 0 (0.0%) | 10 (100.0%) |
| Total | 30 (41.1%) | 43 (58.9%) |
Education in Hutchinson
School Enrollment in Hutchinson
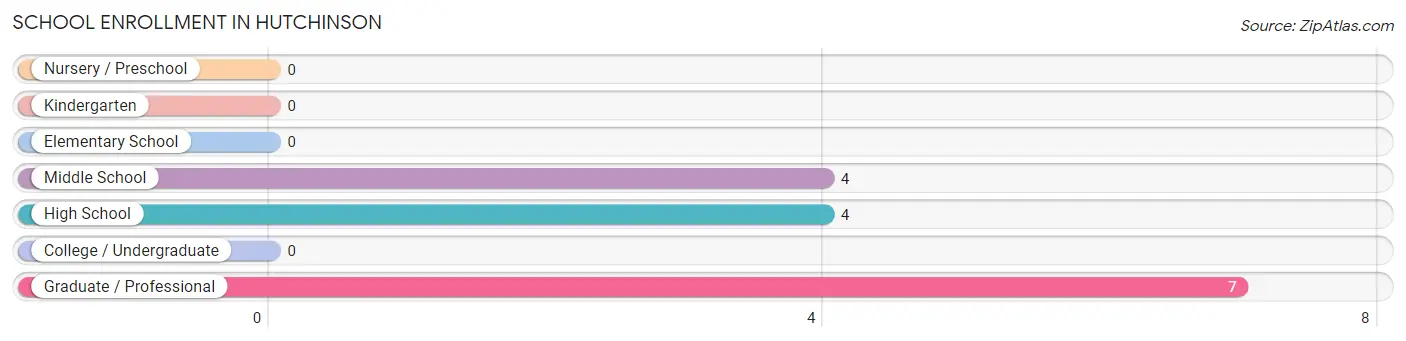
The most common levels of schooling among the 15 students in Hutchinson are graduate / professional (7 | 46.7%), middle school (4 | 26.7%), and high school (4 | 26.7%).
| School Level | # Students | % Students |
| Nursery / Preschool | 0 | 0.0% |
| Kindergarten | 0 | 0.0% |
| Elementary School | 0 | 0.0% |
| Middle School | 4 | 26.7% |
| High School | 4 | 26.7% |
| College / Undergraduate | 0 | 0.0% |
| Graduate / Professional | 7 | 46.7% |
| Total | 15 | 100.0% |
School Enrollment by Age by Funding Source in Hutchinson
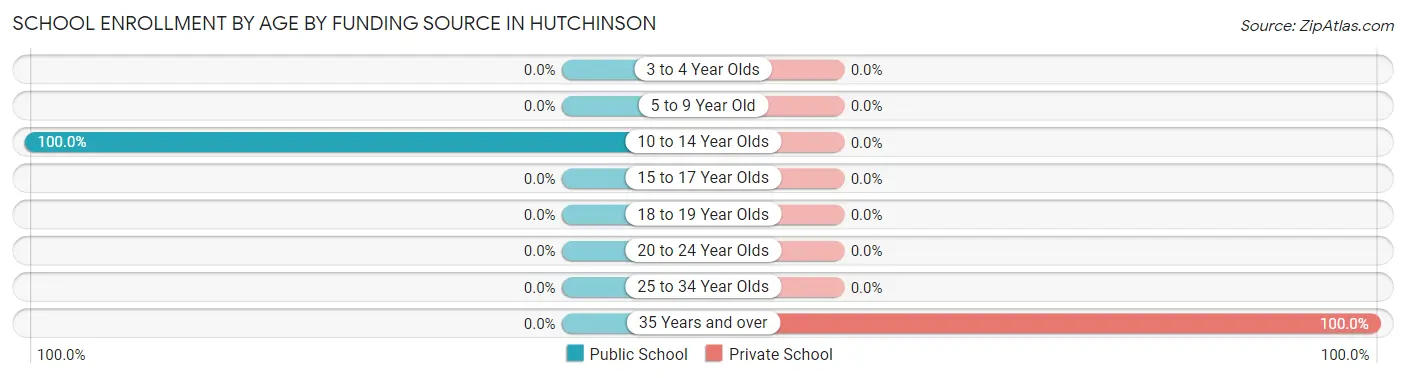
Out of a total of 15 students who are enrolled in schools in Hutchinson, 7 (46.7%) attend a private institution, while the remaining 8 (53.3%) are enrolled in public schools. The age group of 35 years and over has the highest likelihood of being enrolled in private schools, with 7 (100.0% in the age bracket) enrolled. Conversely, the age group of 10 to 14 year olds has the lowest likelihood of being enrolled in a private school, with 8 (100.0% in the age bracket) attending a public institution.
| Age Bracket | Public School | Private School |
| 3 to 4 Year Olds | 0 (0.0%) | 0 (0.0%) |
| 5 to 9 Year Old | 0 (0.0%) | 0 (0.0%) |
| 10 to 14 Year Olds | 8 (100.0%) | 0 (0.0%) |
| 15 to 17 Year Olds | 0 (0.0%) | 0 (0.0%) |
| 18 to 19 Year Olds | 0 (0.0%) | 0 (0.0%) |
| 20 to 24 Year Olds | 0 (0.0%) | 0 (0.0%) |
| 25 to 34 Year Olds | 0 (0.0%) | 0 (0.0%) |
| 35 Years and over | 0 (0.0%) | 7 (100.0%) |
| Total | 8 (53.3%) | 7 (46.7%) |
Educational Attainment by Field of Study in Hutchinson
Computers & mathematics (7 | 36.8%), bio, nature & agricultural (4 | 21.0%), business (4 | 21.0%), and education (4 | 21.0%) are the most common fields of study among 19 individuals in Hutchinson who have obtained a bachelor's degree or higher.
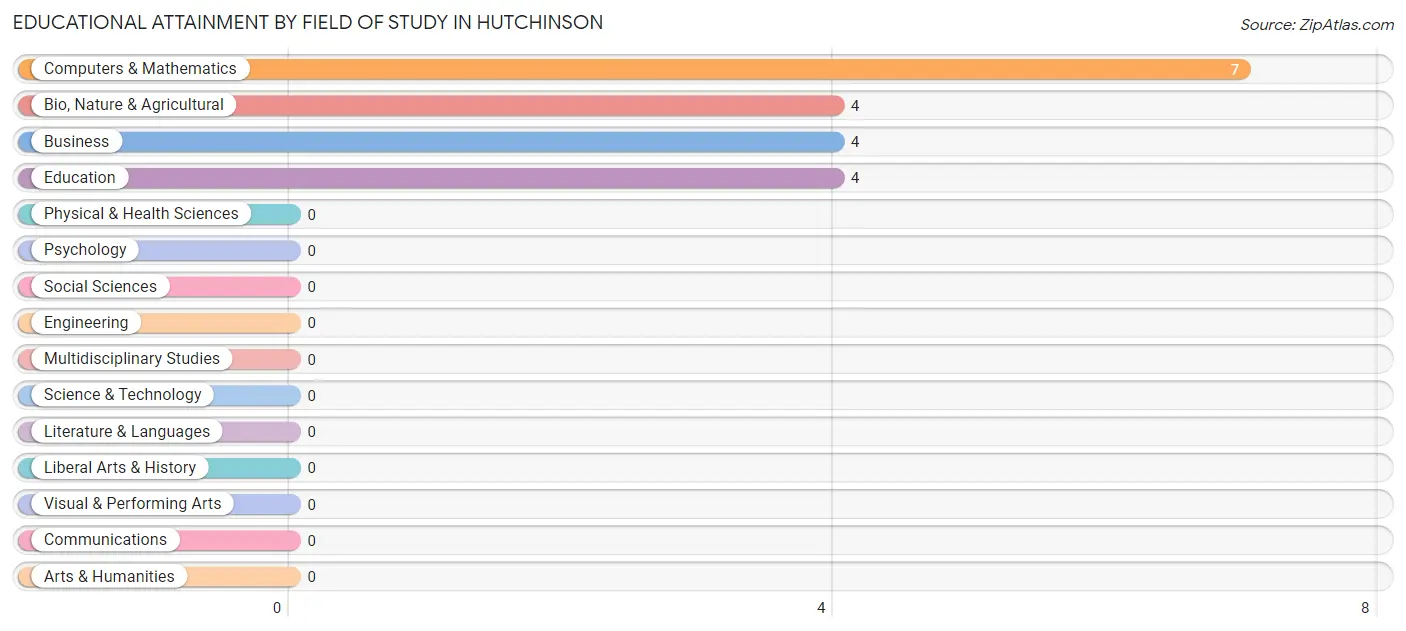
| Field of Study | # Graduates | % Graduates |
| Computers & Mathematics | 7 | 36.8% |
| Bio, Nature & Agricultural | 4 | 21.0% |
| Physical & Health Sciences | 0 | 0.0% |
| Psychology | 0 | 0.0% |
| Social Sciences | 0 | 0.0% |
| Engineering | 0 | 0.0% |
| Multidisciplinary Studies | 0 | 0.0% |
| Science & Technology | 0 | 0.0% |
| Business | 4 | 21.0% |
| Education | 4 | 21.0% |
| Literature & Languages | 0 | 0.0% |
| Liberal Arts & History | 0 | 0.0% |
| Visual & Performing Arts | 0 | 0.0% |
| Communications | 0 | 0.0% |
| Arts & Humanities | 0 | 0.0% |
| Total | 19 | 100.0% |
Transportation & Commute in Hutchinson
Vehicle Availability by Sex in Hutchinson
The most prevalent vehicle ownership categories in Hutchinson are males with 3 vehicles (11, accounting for 36.7%) and females with 3 vehicles (31, making up 28.2%).
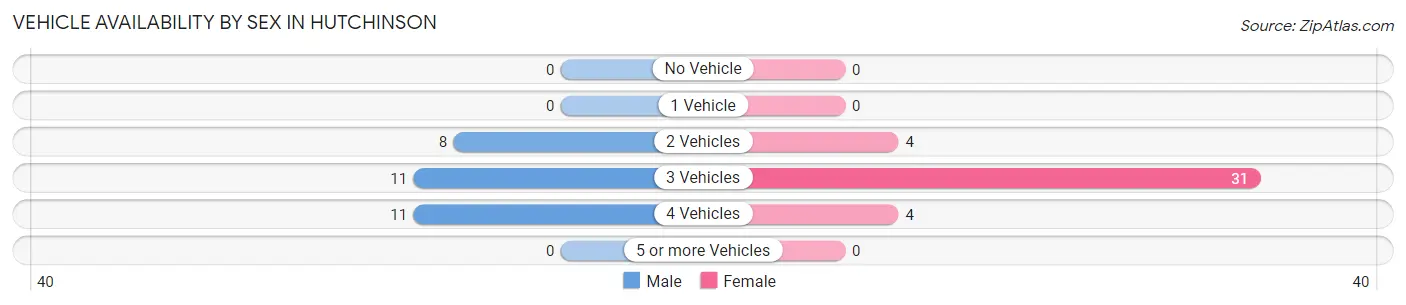
| Vehicles Available | Male | Female |
| No Vehicle | 0 (0.0%) | 0 (0.0%) |
| 1 Vehicle | 0 (0.0%) | 0 (0.0%) |
| 2 Vehicles | 8 (26.7%) | 4 (10.3%) |
| 3 Vehicles | 11 (36.7%) | 31 (79.5%) |
| 4 Vehicles | 11 (36.7%) | 4 (10.3%) |
| 5 or more Vehicles | 0 (0.0%) | 0 (0.0%) |
| Total | 30 (100.0%) | 39 (100.0%) |
Commute Time in Hutchinson
The most frequently occuring commute durations in Hutchinson are 15 to 19 minutes (19 commuters, 27.5%), 25 to 29 minutes (19 commuters, 27.5%), and 5 to 9 minutes (10 commuters, 14.5%).
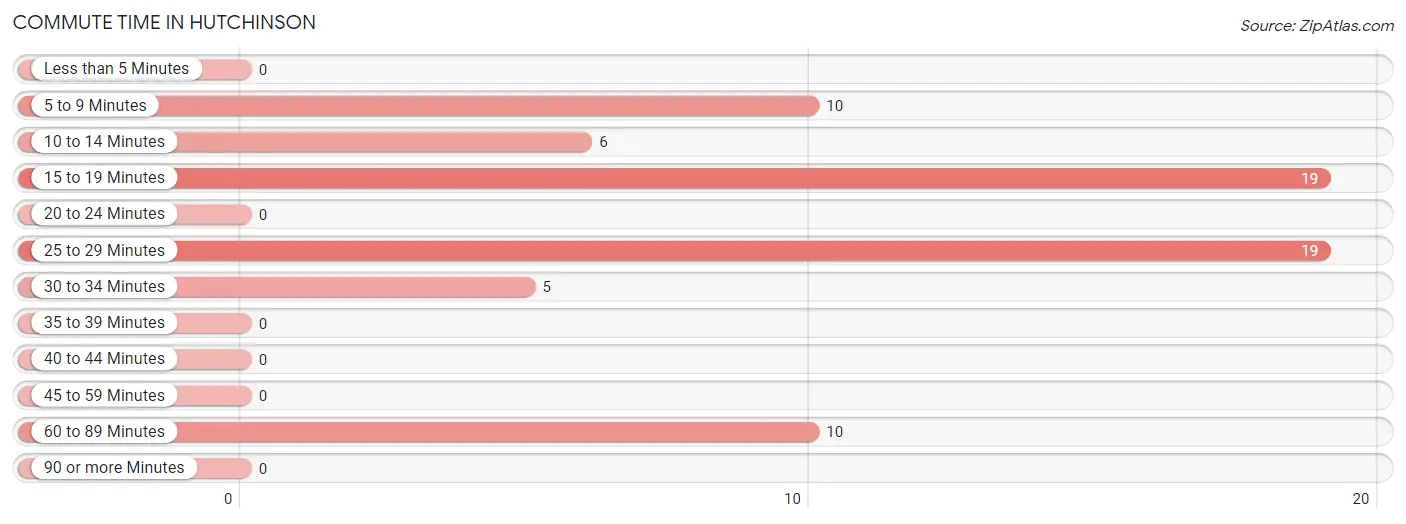
| Commute Time | # Commuters | % Commuters |
| Less than 5 Minutes | 0 | 0.0% |
| 5 to 9 Minutes | 10 | 14.5% |
| 10 to 14 Minutes | 6 | 8.7% |
| 15 to 19 Minutes | 19 | 27.5% |
| 20 to 24 Minutes | 0 | 0.0% |
| 25 to 29 Minutes | 19 | 27.5% |
| 30 to 34 Minutes | 5 | 7.2% |
| 35 to 39 Minutes | 0 | 0.0% |
| 40 to 44 Minutes | 0 | 0.0% |
| 45 to 59 Minutes | 0 | 0.0% |
| 60 to 89 Minutes | 10 | 14.5% |
| 90 or more Minutes | 0 | 0.0% |
Commute Time by Sex in Hutchinson
The most common commute times in Hutchinson are 25 to 29 minutes (15 commuters, 50.0%) for males and 15 to 19 minutes (14 commuters, 35.9%) for females.
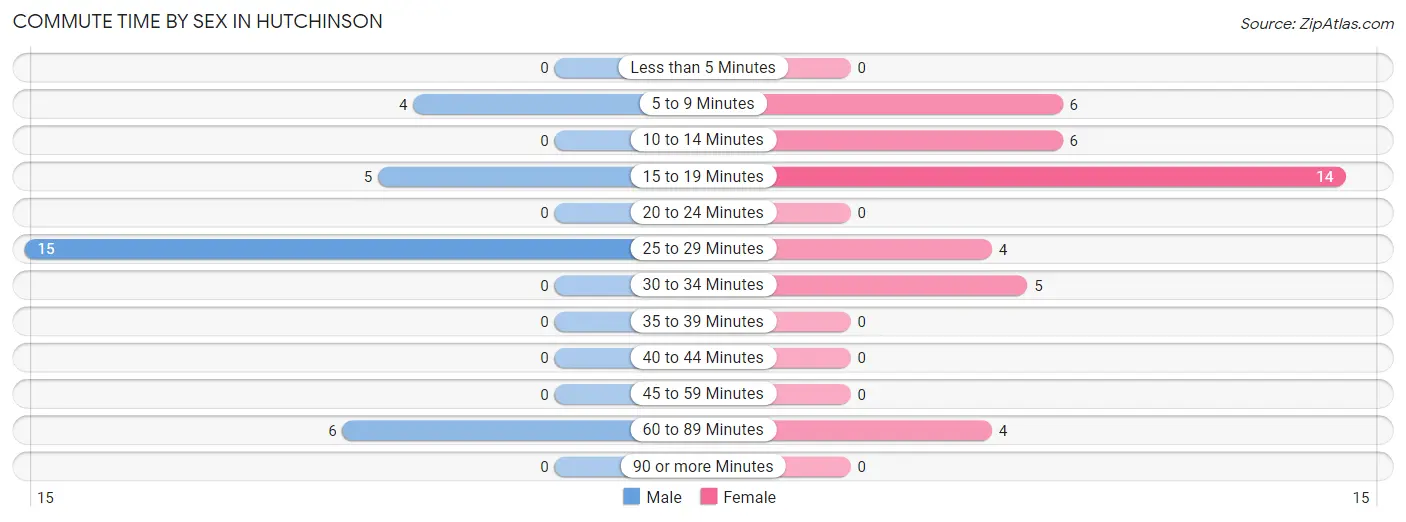
| Commute Time | Male | Female |
| Less than 5 Minutes | 0 (0.0%) | 0 (0.0%) |
| 5 to 9 Minutes | 4 (13.3%) | 6 (15.4%) |
| 10 to 14 Minutes | 0 (0.0%) | 6 (15.4%) |
| 15 to 19 Minutes | 5 (16.7%) | 14 (35.9%) |
| 20 to 24 Minutes | 0 (0.0%) | 0 (0.0%) |
| 25 to 29 Minutes | 15 (50.0%) | 4 (10.3%) |
| 30 to 34 Minutes | 0 (0.0%) | 5 (12.8%) |
| 35 to 39 Minutes | 0 (0.0%) | 0 (0.0%) |
| 40 to 44 Minutes | 0 (0.0%) | 0 (0.0%) |
| 45 to 59 Minutes | 0 (0.0%) | 0 (0.0%) |
| 60 to 89 Minutes | 6 (20.0%) | 4 (10.3%) |
| 90 or more Minutes | 0 (0.0%) | 0 (0.0%) |
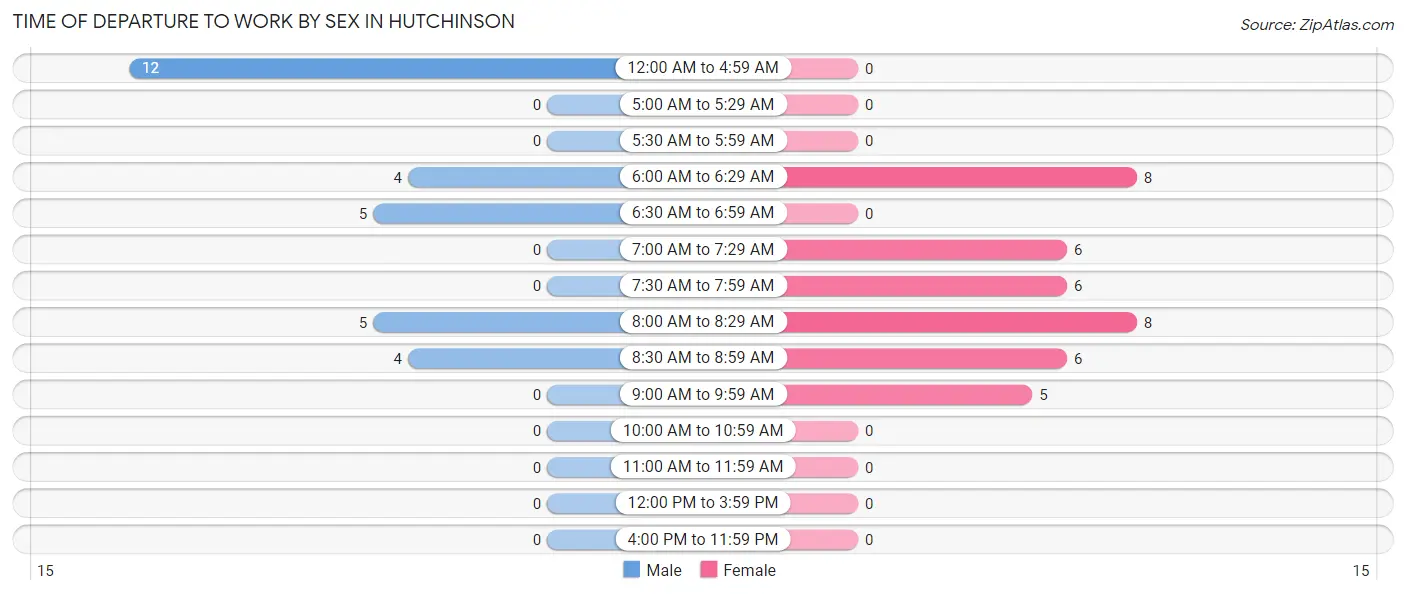
Time of Departure to Work by Sex in Hutchinson
The most frequent times of departure to work in Hutchinson are 12:00 AM to 4:59 AM (12, 40.0%) for males and 6:00 AM to 6:29 AM (8, 20.5%) for females.
| Time of Departure | Male | Female |
| 12:00 AM to 4:59 AM | 12 (40.0%) | 0 (0.0%) |
| 5:00 AM to 5:29 AM | 0 (0.0%) | 0 (0.0%) |
| 5:30 AM to 5:59 AM | 0 (0.0%) | 0 (0.0%) |
| 6:00 AM to 6:29 AM | 4 (13.3%) | 8 (20.5%) |
| 6:30 AM to 6:59 AM | 5 (16.7%) | 0 (0.0%) |
| 7:00 AM to 7:29 AM | 0 (0.0%) | 6 (15.4%) |
| 7:30 AM to 7:59 AM | 0 (0.0%) | 6 (15.4%) |
| 8:00 AM to 8:29 AM | 5 (16.7%) | 8 (20.5%) |
| 8:30 AM to 8:59 AM | 4 (13.3%) | 6 (15.4%) |
| 9:00 AM to 9:59 AM | 0 (0.0%) | 5 (12.8%) |
| 10:00 AM to 10:59 AM | 0 (0.0%) | 0 (0.0%) |
| 11:00 AM to 11:59 AM | 0 (0.0%) | 0 (0.0%) |
| 12:00 PM to 3:59 PM | 0 (0.0%) | 0 (0.0%) |
| 4:00 PM to 11:59 PM | 0 (0.0%) | 0 (0.0%) |
| Total | 30 (100.0%) | 39 (100.0%) |
Housing Occupancy in Hutchinson
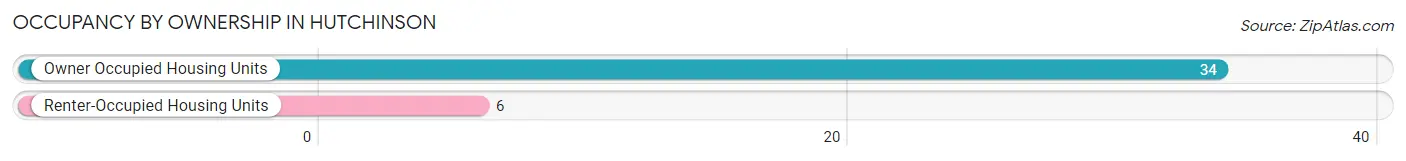
Occupancy by Ownership in Hutchinson
Of the total 40 dwellings in Hutchinson, owner-occupied units account for 34 (85.0%), while renter-occupied units make up 6 (15.0%).
| Occupancy | # Housing Units | % Housing Units |
| Owner Occupied Housing Units | 34 | 85.0% |
| Renter-Occupied Housing Units | 6 | 15.0% |
| Total Occupied Housing Units | 40 | 100.0% |
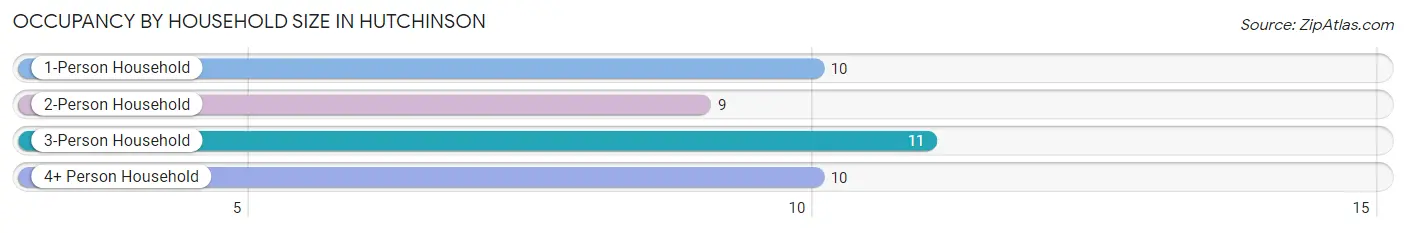
Occupancy by Household Size in Hutchinson
| Household Size | # Housing Units | % Housing Units |
| 1-Person Household | 10 | 25.0% |
| 2-Person Household | 9 | 22.5% |
| 3-Person Household | 11 | 27.5% |
| 4+ Person Household | 10 | 25.0% |
| Total Housing Units | 40 | 100.0% |
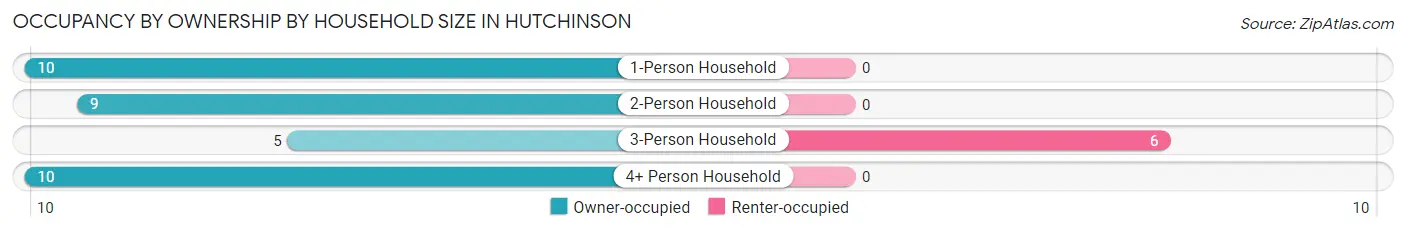
Occupancy by Ownership by Household Size in Hutchinson
| Household Size | Owner-occupied | Renter-occupied |
| 1-Person Household | 10 (100.0%) | 0 (0.0%) |
| 2-Person Household | 9 (100.0%) | 0 (0.0%) |
| 3-Person Household | 5 (45.5%) | 6 (54.5%) |
| 4+ Person Household | 10 (100.0%) | 0 (0.0%) |
| Total Housing Units | 34 (85.0%) | 6 (15.0%) |
Occupancy by Educational Attainment in Hutchinson
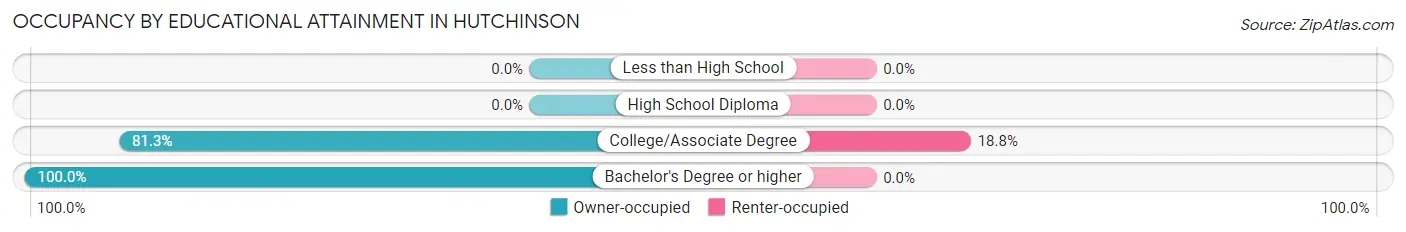
| Household Size | Owner-occupied | Renter-occupied |
| Less than High School | 0 (0.0%) | 0 (0.0%) |
| High School Diploma | 0 (0.0%) | 0 (0.0%) |
| College/Associate Degree | 26 (81.2%) | 6 (18.8%) |
| Bachelor's Degree or higher | 8 (100.0%) | 0 (0.0%) |
Occupancy by Age of Householder in Hutchinson
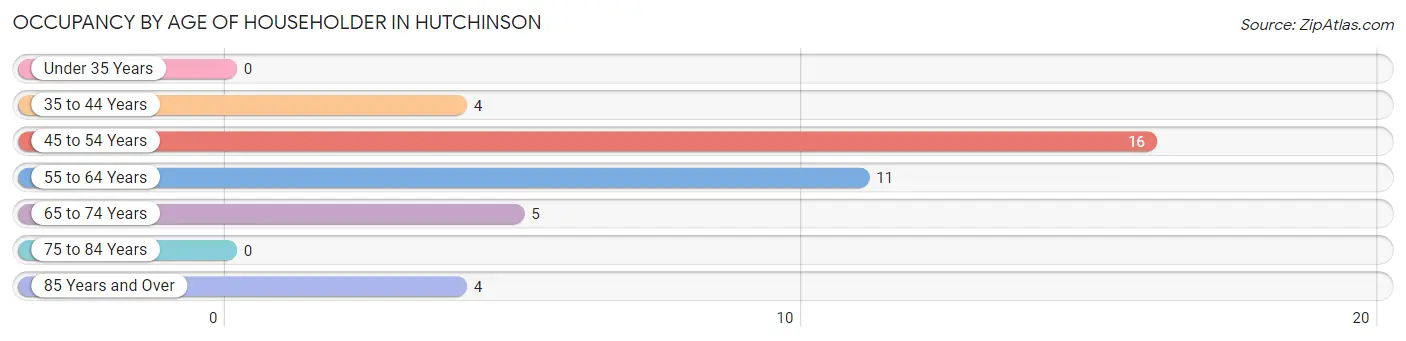
| Age Bracket | # Households | % Households |
| Under 35 Years | 0 | 0.0% |
| 35 to 44 Years | 4 | 10.0% |
| 45 to 54 Years | 16 | 40.0% |
| 55 to 64 Years | 11 | 27.5% |
| 65 to 74 Years | 5 | 12.5% |
| 75 to 84 Years | 0 | 0.0% |
| 85 Years and Over | 4 | 10.0% |
| Total | 40 | 100.0% |
Housing Finances in Hutchinson
Median Income by Occupancy in Hutchinson
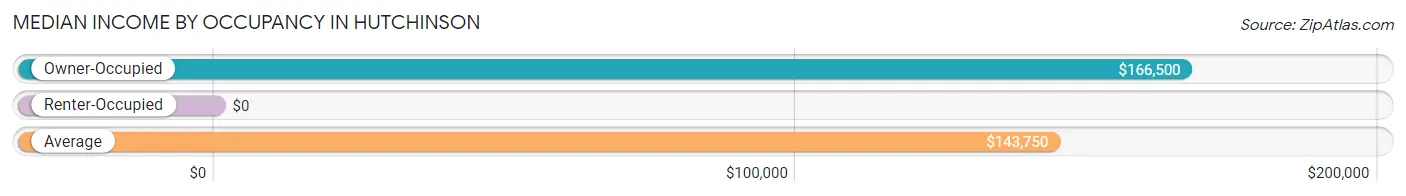
| Occupancy Type | # Households | Median Income |
| Owner-Occupied | 34 (85.0%) | $166,500 |
| Renter-Occupied | 6 (15.0%) | $0 |
| Average | 40 (100.0%) | $143,750 |
Occupancy by Householder Income Bracket in Hutchinson
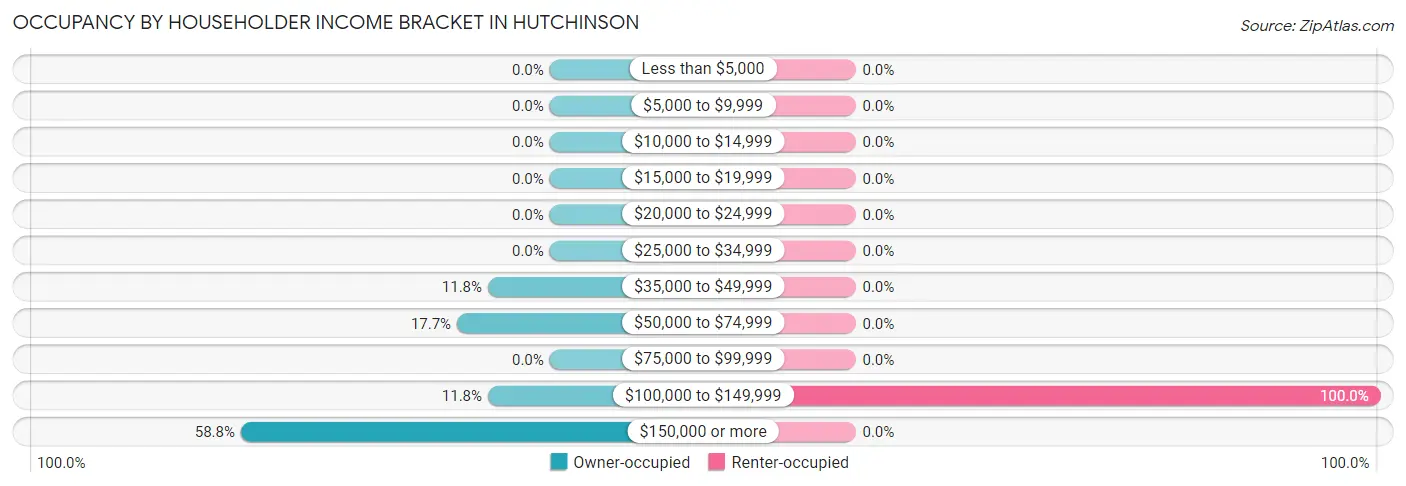
| Income Bracket | Owner-occupied | Renter-occupied |
| Less than $5,000 | 0 (0.0%) | 0 (0.0%) |
| $5,000 to $9,999 | 0 (0.0%) | 0 (0.0%) |
| $10,000 to $14,999 | 0 (0.0%) | 0 (0.0%) |
| $15,000 to $19,999 | 0 (0.0%) | 0 (0.0%) |
| $20,000 to $24,999 | 0 (0.0%) | 0 (0.0%) |
| $25,000 to $34,999 | 0 (0.0%) | 0 (0.0%) |
| $35,000 to $49,999 | 4 (11.8%) | 0 (0.0%) |
| $50,000 to $74,999 | 6 (17.6%) | 0 (0.0%) |
| $75,000 to $99,999 | 0 (0.0%) | 0 (0.0%) |
| $100,000 to $149,999 | 4 (11.8%) | 6 (100.0%) |
| $150,000 or more | 20 (58.8%) | 0 (0.0%) |
| Total | 34 (100.0%) | 6 (100.0%) |
Monthly Housing Cost Tiers in Hutchinson
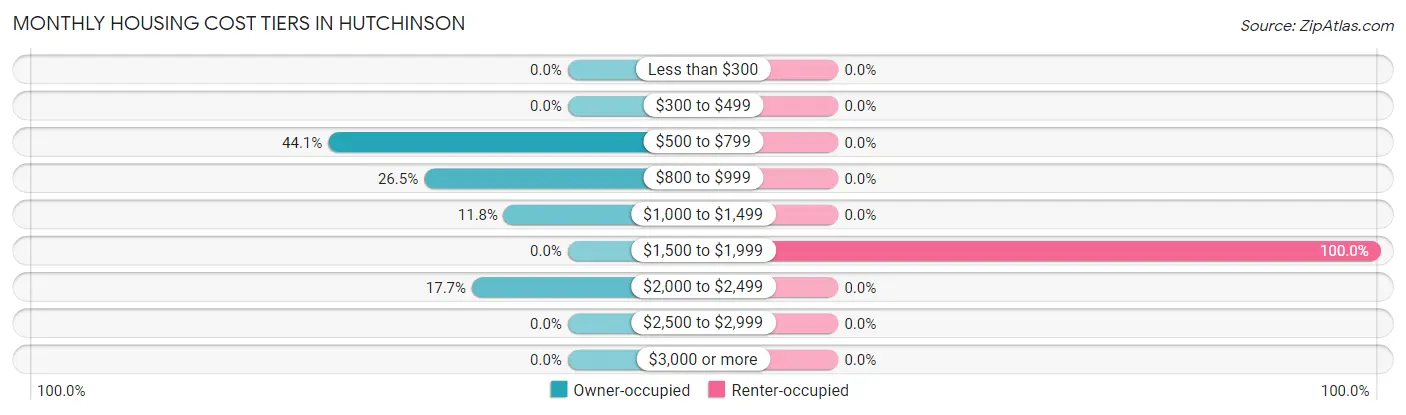
| Monthly Cost | Owner-occupied | Renter-occupied |
| Less than $300 | 0 (0.0%) | 0 (0.0%) |
| $300 to $499 | 0 (0.0%) | 0 (0.0%) |
| $500 to $799 | 15 (44.1%) | 0 (0.0%) |
| $800 to $999 | 9 (26.5%) | 0 (0.0%) |
| $1,000 to $1,499 | 4 (11.8%) | 0 (0.0%) |
| $1,500 to $1,999 | 0 (0.0%) | 6 (100.0%) |
| $2,000 to $2,499 | 6 (17.6%) | 0 (0.0%) |
| $2,500 to $2,999 | 0 (0.0%) | 0 (0.0%) |
| $3,000 or more | 0 (0.0%) | 0 (0.0%) |
| Total | 34 (100.0%) | 6 (100.0%) |
Physical Housing Characteristics in Hutchinson
Housing Structures in Hutchinson
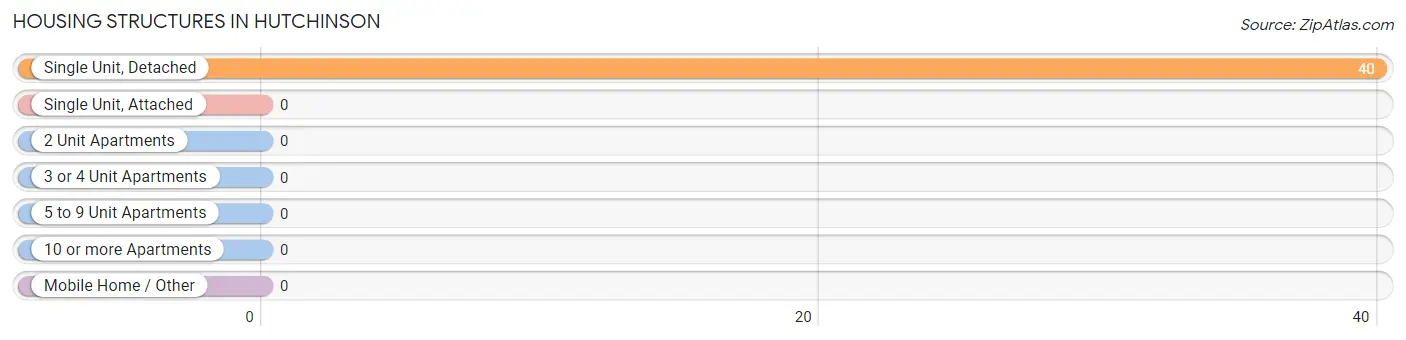
| Structure Type | # Housing Units | % Housing Units |
| Single Unit, Detached | 40 | 100.0% |
| Single Unit, Attached | 0 | 0.0% |
| 2 Unit Apartments | 0 | 0.0% |
| 3 or 4 Unit Apartments | 0 | 0.0% |
| 5 to 9 Unit Apartments | 0 | 0.0% |
| 10 or more Apartments | 0 | 0.0% |
| Mobile Home / Other | 0 | 0.0% |
| Total | 40 | 100.0% |
Housing Structures by Occupancy in Hutchinson
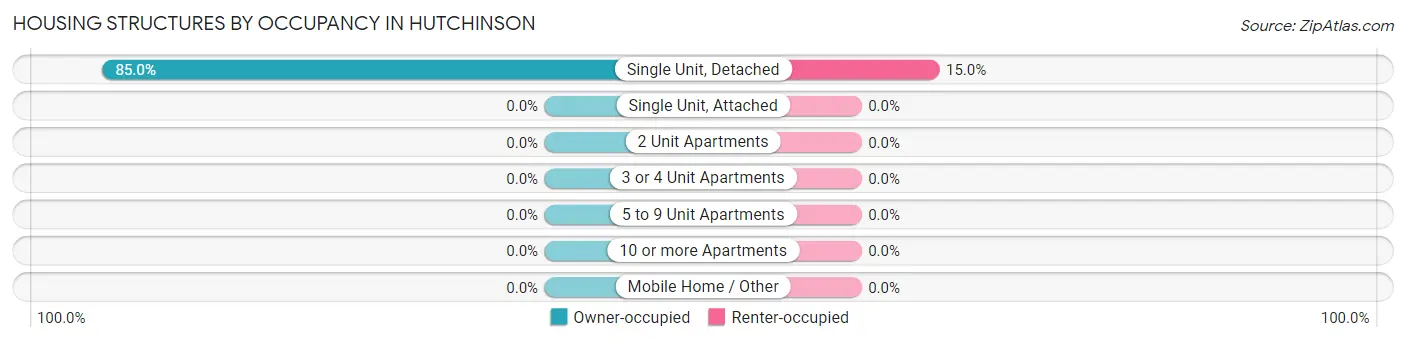
| Structure Type | Owner-occupied | Renter-occupied |
| Single Unit, Detached | 34 (85.0%) | 6 (15.0%) |
| Single Unit, Attached | 0 (0.0%) | 0 (0.0%) |
| 2 Unit Apartments | 0 (0.0%) | 0 (0.0%) |
| 3 or 4 Unit Apartments | 0 (0.0%) | 0 (0.0%) |
| 5 to 9 Unit Apartments | 0 (0.0%) | 0 (0.0%) |
| 10 or more Apartments | 0 (0.0%) | 0 (0.0%) |
| Mobile Home / Other | 0 (0.0%) | 0 (0.0%) |
| Total | 34 (85.0%) | 6 (15.0%) |
Housing Structures by Number of Rooms in Hutchinson
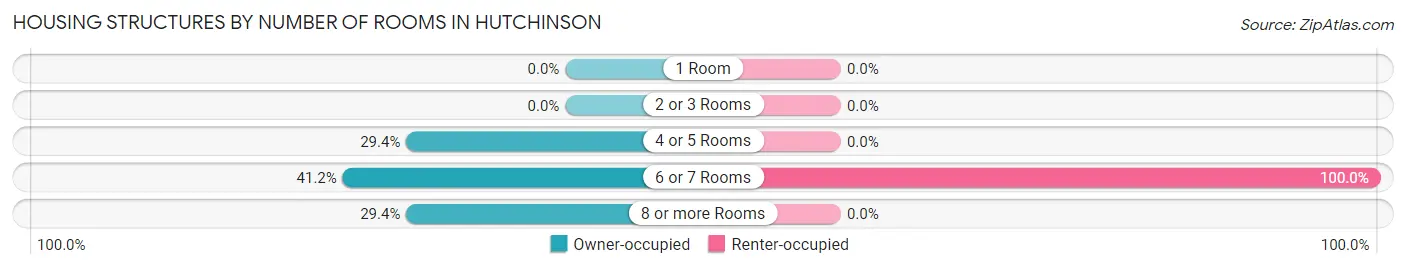
| Number of Rooms | Owner-occupied | Renter-occupied |
| 1 Room | 0 (0.0%) | 0 (0.0%) |
| 2 or 3 Rooms | 0 (0.0%) | 0 (0.0%) |
| 4 or 5 Rooms | 10 (29.4%) | 0 (0.0%) |
| 6 or 7 Rooms | 14 (41.2%) | 6 (100.0%) |
| 8 or more Rooms | 10 (29.4%) | 0 (0.0%) |
| Total | 34 (100.0%) | 6 (100.0%) |
Housing Structure by Heating Type in Hutchinson
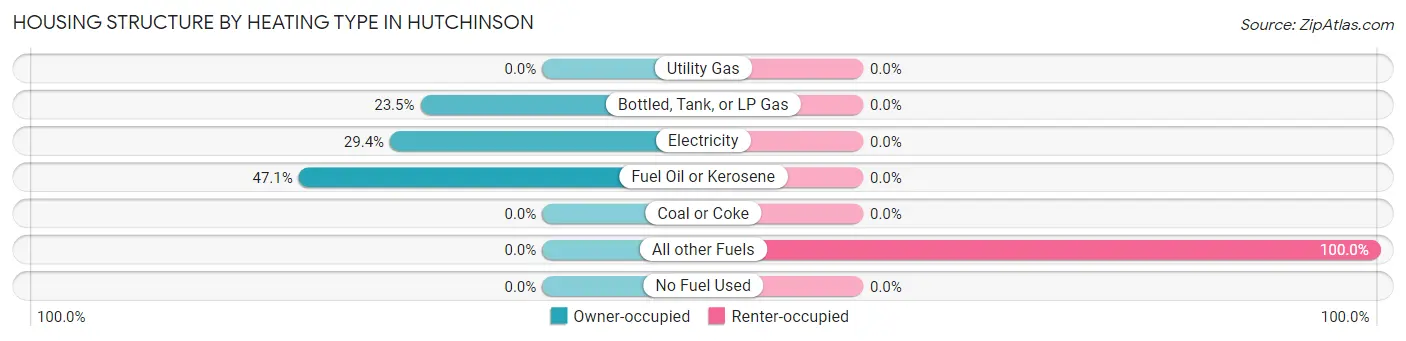
| Heating Type | Owner-occupied | Renter-occupied |
| Utility Gas | 0 (0.0%) | 0 (0.0%) |
| Bottled, Tank, or LP Gas | 8 (23.5%) | 0 (0.0%) |
| Electricity | 10 (29.4%) | 0 (0.0%) |
| Fuel Oil or Kerosene | 16 (47.1%) | 0 (0.0%) |
| Coal or Coke | 0 (0.0%) | 0 (0.0%) |
| All other Fuels | 0 (0.0%) | 6 (100.0%) |
| No Fuel Used | 0 (0.0%) | 0 (0.0%) |
| Total | 34 (100.0%) | 6 (100.0%) |
Household Vehicle Usage in Hutchinson
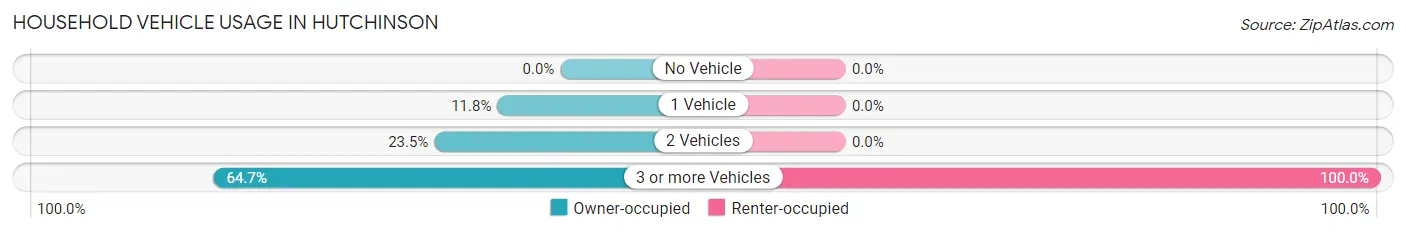
| Vehicles per Household | Owner-occupied | Renter-occupied |
| No Vehicle | 0 (0.0%) | 0 (0.0%) |
| 1 Vehicle | 4 (11.8%) | 0 (0.0%) |
| 2 Vehicles | 8 (23.5%) | 0 (0.0%) |
| 3 or more Vehicles | 22 (64.7%) | 6 (100.0%) |
| Total | 34 (100.0%) | 6 (100.0%) |
Real Estate & Mortgages in Hutchinson
Real Estate and Mortgage Overview in Hutchinson
| Characteristic | Without Mortgage | With Mortgage |
| Housing Units | 28 | 6 |
| Median Property Value | $323,100 | $0 |
| Median Household Income | $143,750 | $6 |
| Monthly Housing Costs | $793 | $0 |
| Real Estate Taxes | $5,556 | $0 |
Property Value by Mortgage Status in Hutchinson
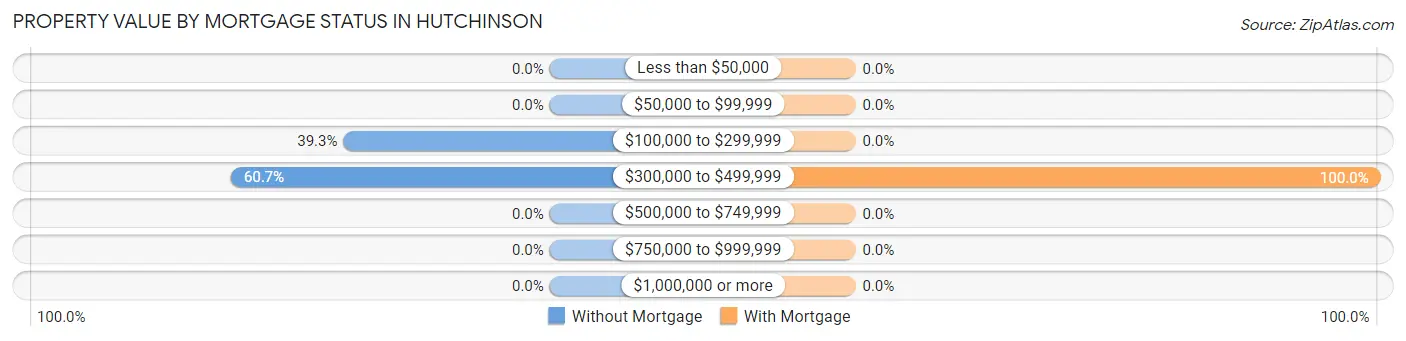
| Property Value | Without Mortgage | With Mortgage |
| Less than $50,000 | 0 (0.0%) | 0 (0.0%) |
| $50,000 to $99,999 | 0 (0.0%) | 0 (0.0%) |
| $100,000 to $299,999 | 11 (39.3%) | 0 (0.0%) |
| $300,000 to $499,999 | 17 (60.7%) | 6 (100.0%) |
| $500,000 to $749,999 | 0 (0.0%) | 0 (0.0%) |
| $750,000 to $999,999 | 0 (0.0%) | 0 (0.0%) |
| $1,000,000 or more | 0 (0.0%) | 0 (0.0%) |
| Total | 28 (100.0%) | 6 (100.0%) |
Household Income by Mortgage Status in Hutchinson
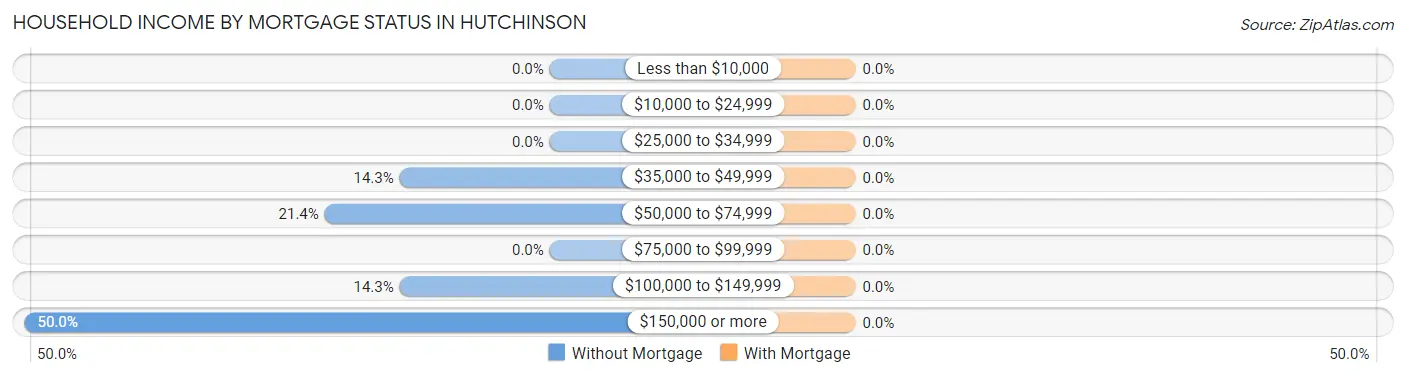
| Household Income | Without Mortgage | With Mortgage |
| Less than $10,000 | 0 (0.0%) | 0 (0.0%) |
| $10,000 to $24,999 | 0 (0.0%) | 0 (0.0%) |
| $25,000 to $34,999 | 0 (0.0%) | 0 (0.0%) |
| $35,000 to $49,999 | 4 (14.3%) | 0 (0.0%) |
| $50,000 to $74,999 | 6 (21.4%) | 0 (0.0%) |
| $75,000 to $99,999 | 0 (0.0%) | 0 (0.0%) |
| $100,000 to $149,999 | 4 (14.3%) | 0 (0.0%) |
| $150,000 or more | 14 (50.0%) | 0 (0.0%) |
| Total | 28 (100.0%) | 6 (100.0%) |
Property Value to Household Income Ratio in Hutchinson
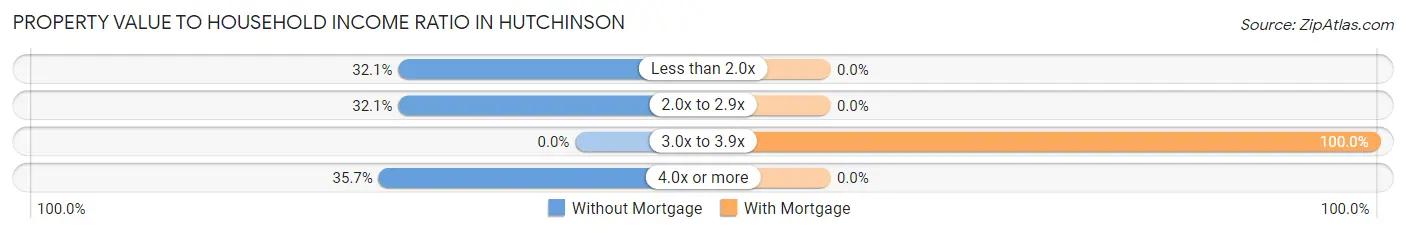
| Value-to-Income Ratio | Without Mortgage | With Mortgage |
| Less than 2.0x | 9 (32.1%) | 0 (0.0%) |
| 2.0x to 2.9x | 9 (32.1%) | 0 (0.0%) |
| 3.0x to 3.9x | 0 (0.0%) | 6 (100.0%) |
| 4.0x or more | 10 (35.7%) | 0 (0.0%) |
| Total | 28 (100.0%) | 6 (100.0%) |
Real Estate Taxes by Mortgage Status in Hutchinson
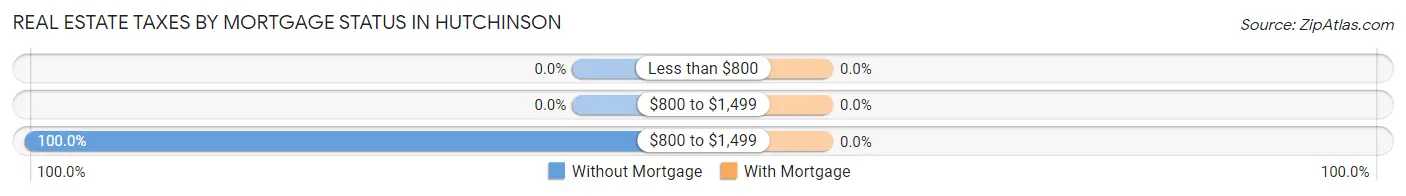
| Property Taxes | Without Mortgage | With Mortgage |
| Less than $800 | 0 (0.0%) | 0 (0.0%) |
| $800 to $1,499 | 0 (0.0%) | 0 (0.0%) |
| $800 to $1,499 | 28 (100.0%) | 0 (0.0%) |
| Total | 28 (100.0%) | 6 (100.0%) |
Health & Disability in Hutchinson
Health Insurance Coverage by Age in Hutchinson
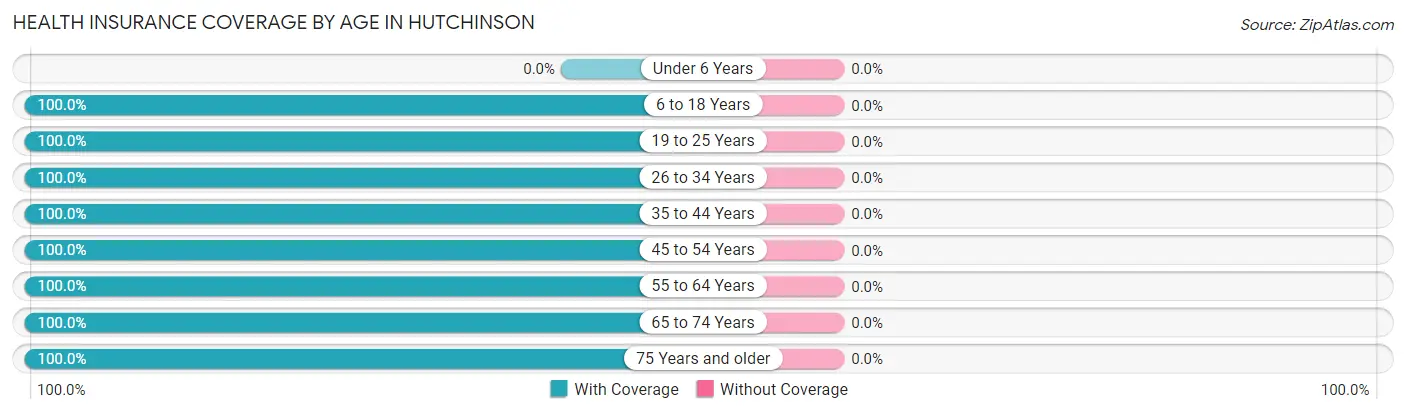
| Age Bracket | With Coverage | Without Coverage |
| Under 6 Years | 0 (0.0%) | 0 (0.0%) |
| 6 to 18 Years | 8 (100.0%) | 0 (0.0%) |
| 19 to 25 Years | 17 (100.0%) | 0 (0.0%) |
| 26 to 34 Years | 8 (100.0%) | 0 (0.0%) |
| 35 to 44 Years | 11 (100.0%) | 0 (0.0%) |
| 45 to 54 Years | 20 (100.0%) | 0 (0.0%) |
| 55 to 64 Years | 36 (100.0%) | 0 (0.0%) |
| 65 to 74 Years | 11 (100.0%) | 0 (0.0%) |
| 75 Years and older | 4 (100.0%) | 0 (0.0%) |
| Total | 115 (100.0%) | 0 (0.0%) |
Health Insurance Coverage by Citizenship Status in Hutchinson
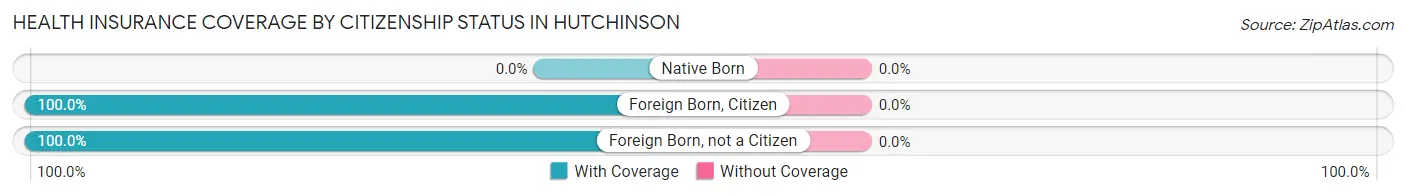
| Citizenship Status | With Coverage | Without Coverage |
| Native Born | 0 (0.0%) | 0 (0.0%) |
| Foreign Born, Citizen | 8 (100.0%) | 0 (0.0%) |
| Foreign Born, not a Citizen | 17 (100.0%) | 0 (0.0%) |
Health Insurance Coverage by Household Income in Hutchinson
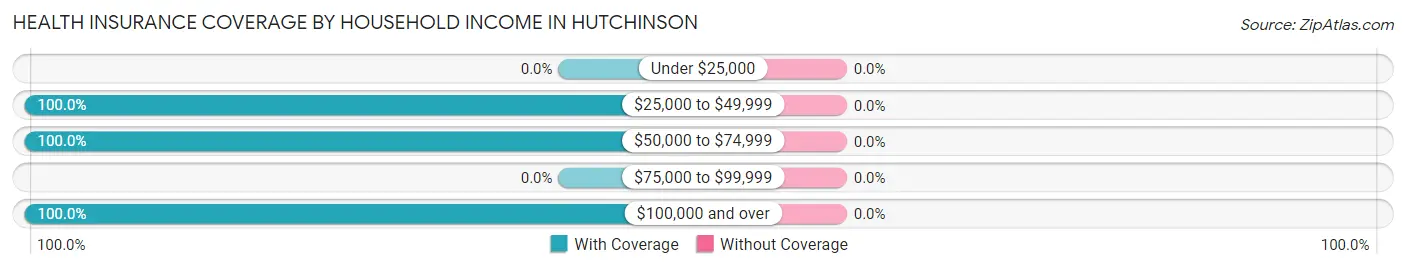
| Household Income | With Coverage | Without Coverage |
| Under $25,000 | 0 (0.0%) | 0 (0.0%) |
| $25,000 to $49,999 | 4 (100.0%) | 0 (0.0%) |
| $50,000 to $74,999 | 6 (100.0%) | 0 (0.0%) |
| $75,000 to $99,999 | 0 (0.0%) | 0 (0.0%) |
| $100,000 and over | 105 (100.0%) | 0 (0.0%) |
Public vs Private Health Insurance Coverage by Age in Hutchinson
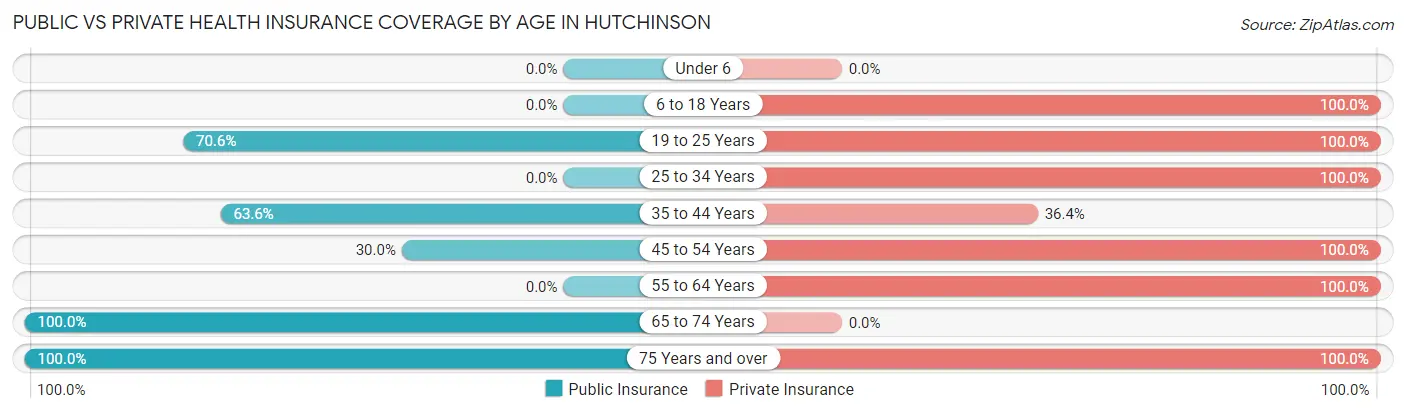
| Age Bracket | Public Insurance | Private Insurance |
| Under 6 | 0 (0.0%) | 0 (0.0%) |
| 6 to 18 Years | 0 (0.0%) | 8 (100.0%) |
| 19 to 25 Years | 12 (70.6%) | 17 (100.0%) |
| 25 to 34 Years | 0 (0.0%) | 8 (100.0%) |
| 35 to 44 Years | 7 (63.6%) | 4 (36.4%) |
| 45 to 54 Years | 6 (30.0%) | 20 (100.0%) |
| 55 to 64 Years | 0 (0.0%) | 36 (100.0%) |
| 65 to 74 Years | 11 (100.0%) | 0 (0.0%) |
| 75 Years and over | 4 (100.0%) | 4 (100.0%) |
| Total | 40 (34.8%) | 97 (84.4%) |
Disability Status by Sex by Age in Hutchinson
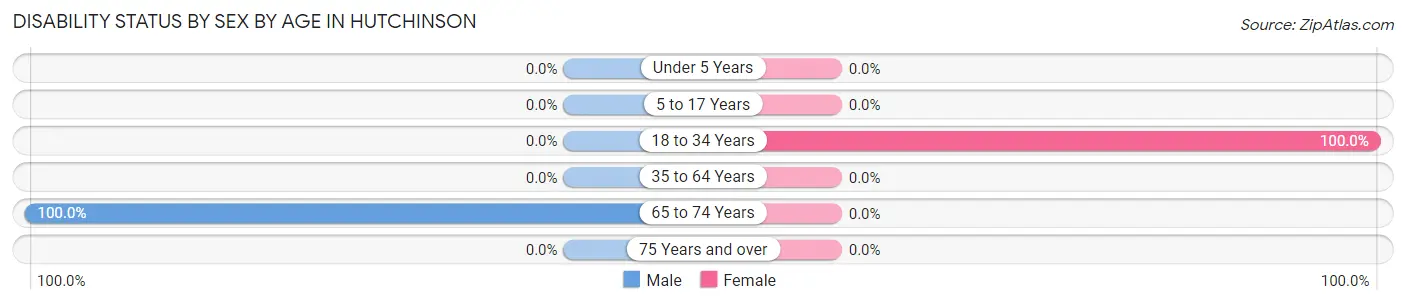
| Age Bracket | Male | Female |
| Under 5 Years | 0 (0.0%) | 0 (0.0%) |
| 5 to 17 Years | 0 (0.0%) | 0 (0.0%) |
| 18 to 34 Years | 0 (0.0%) | 20 (100.0%) |
| 35 to 64 Years | 0 (0.0%) | 0 (0.0%) |
| 65 to 74 Years | 5 (100.0%) | 0 (0.0%) |
| 75 Years and over | 0 (0.0%) | 0 (0.0%) |
Disability Class by Sex by Age in Hutchinson
Disability Class: Hearing Difficulty
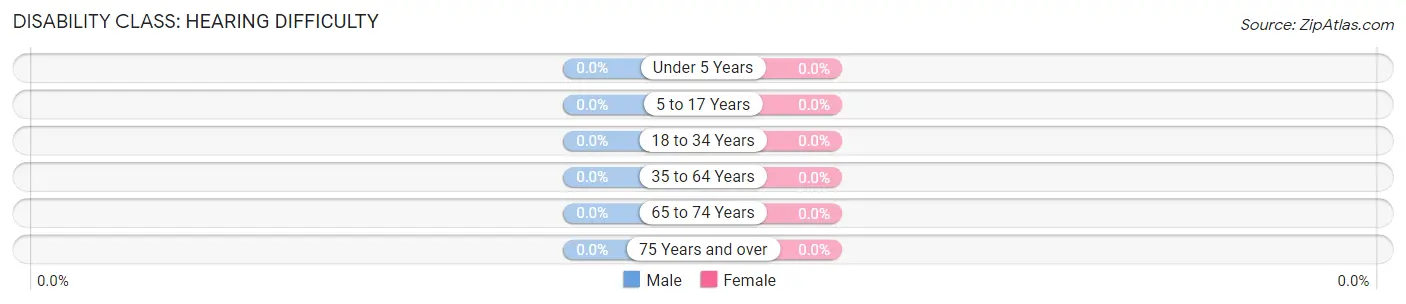
| Age Bracket | Male | Female |
| Under 5 Years | 0 (0.0%) | 0 (0.0%) |
| 5 to 17 Years | 0 (0.0%) | 0 (0.0%) |
| 18 to 34 Years | 0 (0.0%) | 0 (0.0%) |
| 35 to 64 Years | 0 (0.0%) | 0 (0.0%) |
| 65 to 74 Years | 0 (0.0%) | 0 (0.0%) |
| 75 Years and over | 0 (0.0%) | 0 (0.0%) |
Disability Class: Vision Difficulty
| Age Bracket | Male | Female |
| Under 5 Years | 0 (0.0%) | 0 (0.0%) |
| 5 to 17 Years | 0 (0.0%) | 0 (0.0%) |
| 18 to 34 Years | 0 (0.0%) | 0 (0.0%) |
| 35 to 64 Years | 0 (0.0%) | 0 (0.0%) |
| 65 to 74 Years | 0 (0.0%) | 0 (0.0%) |
| 75 Years and over | 0 (0.0%) | 0 (0.0%) |
Disability Class: Cognitive Difficulty
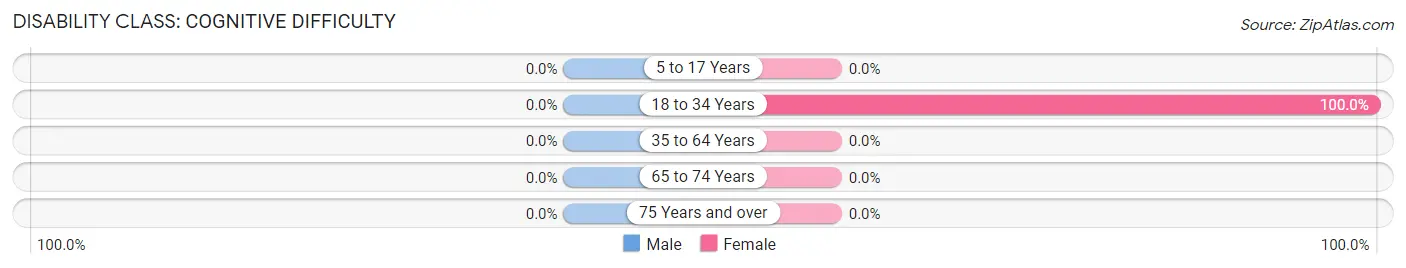
| Age Bracket | Male | Female |
| 5 to 17 Years | 0 (0.0%) | 0 (0.0%) |
| 18 to 34 Years | 0 (0.0%) | 20 (100.0%) |
| 35 to 64 Years | 0 (0.0%) | 0 (0.0%) |
| 65 to 74 Years | 0 (0.0%) | 0 (0.0%) |
| 75 Years and over | 0 (0.0%) | 0 (0.0%) |
Disability Class: Ambulatory Difficulty
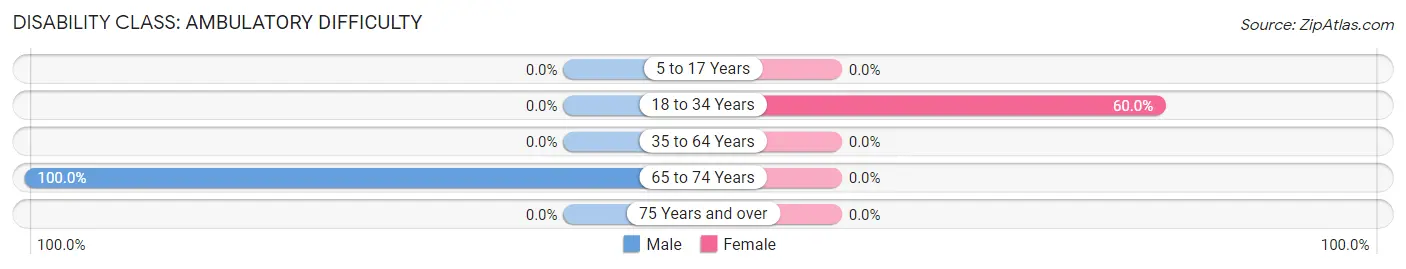
| Age Bracket | Male | Female |
| 5 to 17 Years | 0 (0.0%) | 0 (0.0%) |
| 18 to 34 Years | 0 (0.0%) | 12 (60.0%) |
| 35 to 64 Years | 0 (0.0%) | 0 (0.0%) |
| 65 to 74 Years | 5 (100.0%) | 0 (0.0%) |
| 75 Years and over | 0 (0.0%) | 0 (0.0%) |
Disability Class: Self-Care Difficulty
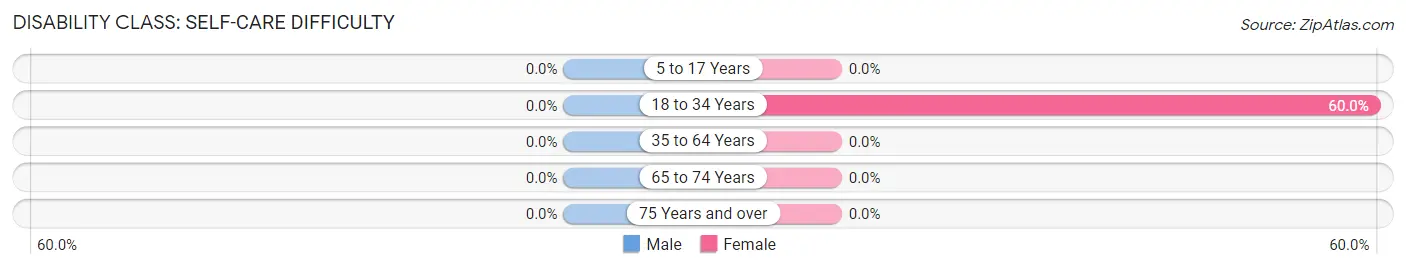
| Age Bracket | Male | Female |
| 5 to 17 Years | 0 (0.0%) | 0 (0.0%) |
| 18 to 34 Years | 0 (0.0%) | 12 (60.0%) |
| 35 to 64 Years | 0 (0.0%) | 0 (0.0%) |
| 65 to 74 Years | 0 (0.0%) | 0 (0.0%) |
| 75 Years and over | 0 (0.0%) | 0 (0.0%) |
Technology Access in Hutchinson
Computing Device Access in Hutchinson
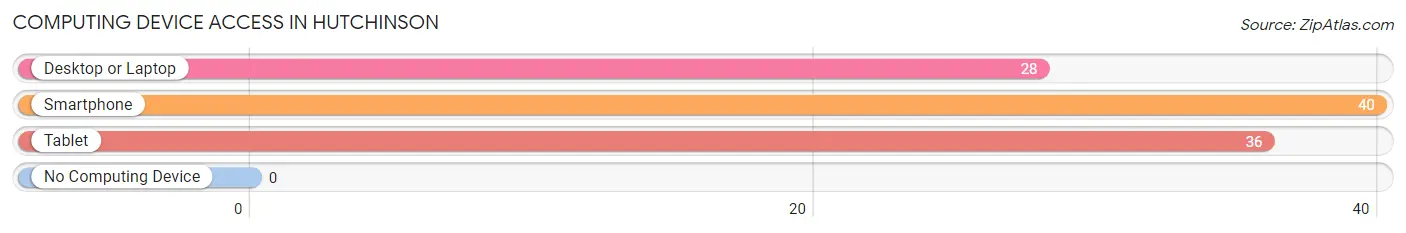
| Device Type | # Households | % Households |
| Desktop or Laptop | 28 | 70.0% |
| Smartphone | 40 | 100.0% |
| Tablet | 36 | 90.0% |
| No Computing Device | 0 | 0.0% |
| Total | 40 | 100.0% |
Internet Access in Hutchinson
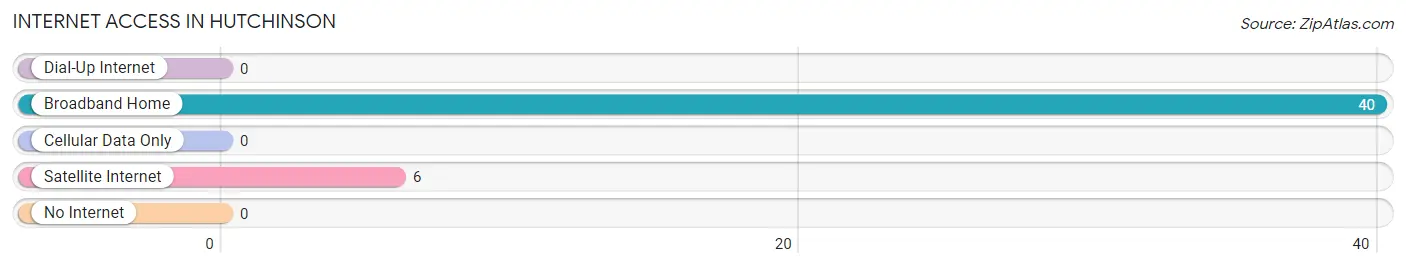
| Internet Type | # Households | % Households |
| Dial-Up Internet | 0 | 0.0% |
| Broadband Home | 40 | 100.0% |
| Cellular Data Only | 0 | 0.0% |
| Satellite Internet | 6 | 15.0% |
| No Internet | 0 | 0.0% |
| Total | 40 | 100.0% |
Hutchinson Summary
Hutchinson is a small town located in the state of New Jersey. It is situated in the northern part of the state, near the border with New York. The town has a population of approximately 1,500 people and is part of the larger Sussex County.
History
Hutchinson was first settled in the late 1700s by a group of Dutch settlers. The town was originally known as “Hutchenson” and was named after the family of the first settler, John Hutchenson. The town was officially incorporated in 1845 and was named after the family of the first settler.
The town was primarily an agricultural community for many years, with the main crops being potatoes, corn, and hay. In the late 1800s, the town began to develop into a small industrial center, with several factories being built in the area. The most notable of these factories was the Hutchinson Manufacturing Company, which produced a variety of products, including furniture, tools, and machinery.
Geography
Hutchinson is located in the northern part of Sussex County, near the border with New York. The town is situated in a rural area, with rolling hills and forests. The town is located near the Kittatinny Mountains, which provide a scenic backdrop. The town is also located near several lakes, including Lake Hopatcong and Lake Mohawk.
The climate in Hutchinson is typical of the northeastern United States, with cold winters and warm summers. The average temperature in the winter is around 25 degrees Fahrenheit, while the average temperature in the summer is around 75 degrees Fahrenheit.
Economy
Hutchinson’s economy is primarily based on agriculture and tourism. The town is home to several farms, which produce a variety of crops, including potatoes, corn, and hay. The town is also home to several small businesses, including restaurants, shops, and other services.
The town is also a popular tourist destination, with many visitors coming to the area to enjoy the scenic views and outdoor activities. The town is home to several parks, including the Kittatinny Mountains State Park and the High Point State Park.
Demographics
As of the 2010 census, the population of Hutchinson was 1,500 people. The racial makeup of the town was 95.3% White, 1.7% African American, 0.7% Native American, 0.3% Asian, and 2.0% from other races. The median household income in the town was $50,000, and the median age was 43.
Hutchinson is a small town with a rich history and a vibrant economy. The town is home to a diverse population and offers a variety of activities and attractions for visitors. The town is a great place to live, work, and visit.
Common Questions
What is the Total Population of Hutchinson?
Total Population of Hutchinson is 115.
What is the Total Male Population of Hutchinson?
Total Male Population of Hutchinson is 52.
What is the Total Female Population of Hutchinson?
Total Female Population of Hutchinson is 63.
What is the Ratio of Males per 100 Females in Hutchinson?
There are 82.54 Males per 100 Females in Hutchinson.
What is the Ratio of Females per 100 Males in Hutchinson?
There are 121.15 Females per 100 Males in Hutchinson.
What is the Median Population Age in Hutchinson?
Median Population Age in Hutchinson is 53.9 Years.
What is the Average Family Size in Hutchinson
Average Family Size in Hutchinson is 3.5 People.
What is the Average Household Size in Hutchinson
Average Household Size in Hutchinson is 2.9 People.
What is Per Capita Income in Hutchinson?
Per Capita income in Hutchinson is $53,575.
What is the Median Family Income in Hutchinson?
Median Family Income in Hutchinson is $167,500.
What is the Median Household income in Hutchinson?
Median Household Income in Hutchinson is $143,750.
What is Income or Wage Gap in Hutchinson?
Income or Wage Gap in Hutchinson is 25.5%.
Women in Hutchinson earn 74.5 cents for every dollar earned by a man.
What is Inequality or Gini Index in Hutchinson?
Inequality or Gini Index in Hutchinson is 0.27.
How Large is the Labor Force in Hutchinson?
There are 80 People in the Labor Forcein in Hutchinson.
What is the Percentage of People in the Labor Force in Hutchinson?
74.8% of People are in the Labor Force in Hutchinson.
What is the Unemployment Rate in Hutchinson?
Unemployment Rate in Hutchinson is 8.8%.