Beckett, NJ
Beckett Map
Beckett Overview
5,496
TOTAL POPULATION
2,782
MALE POPULATION
2,714
FEMALE POPULATION
102.51
MALES / 100 FEMALES
97.56
FEMALES / 100 MALES
42.0
MEDIAN AGE
3.1
AVG FAMILY SIZE
2.8
AVG HOUSEHOLD SIZE
$47,073
PER CAPITA INCOME
$142,784
AVG FAMILY INCOME
$114,046
AVG HOUSEHOLD INCOME
33.6%
WAGE / INCOME GAP [ % ]
66.4¢/ $1
WAGE / INCOME GAP [ $ ]
0.40
INEQUALITY / GINI INDEX
3,225
LABOR FORCE [ PEOPLE ]
74.3%
PERCENT IN LABOR FORCE
4.4%
UNEMPLOYMENT RATE
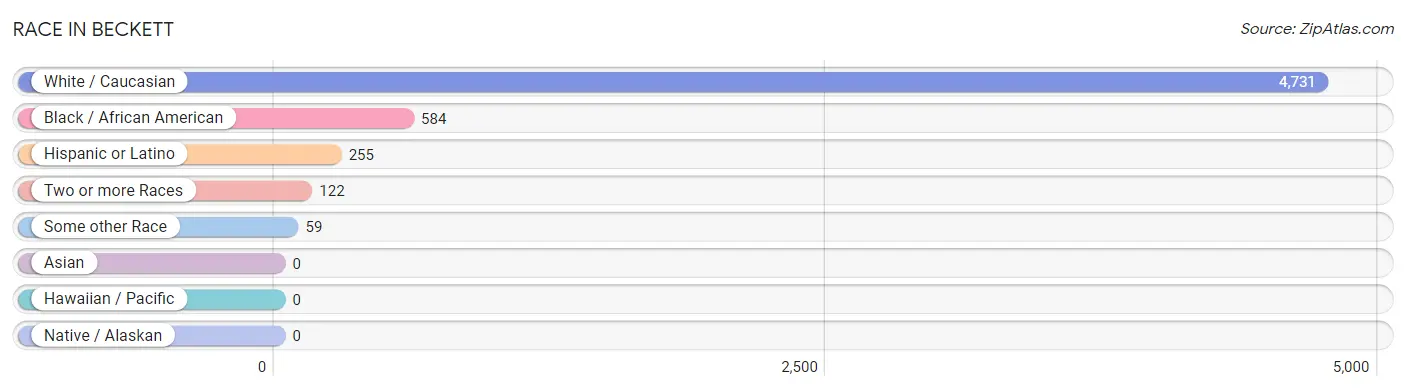
Race in Beckett
The most populous races in Beckett are White / Caucasian (4,731 | 86.1%), Black / African American (584 | 10.6%), and Hispanic or Latino (255 | 4.6%).
| Race | # Population | % Population |
| Asian | 0 | 0.0% |
| Black / African American | 584 | 10.6% |
| Hawaiian / Pacific | 0 | 0.0% |
| Hispanic or Latino | 255 | 4.6% |
| Native / Alaskan | 0 | 0.0% |
| White / Caucasian | 4,731 | 86.1% |
| Two or more Races | 122 | 2.2% |
| Some other Race | 59 | 1.1% |
| Total | 5,496 | 100.0% |
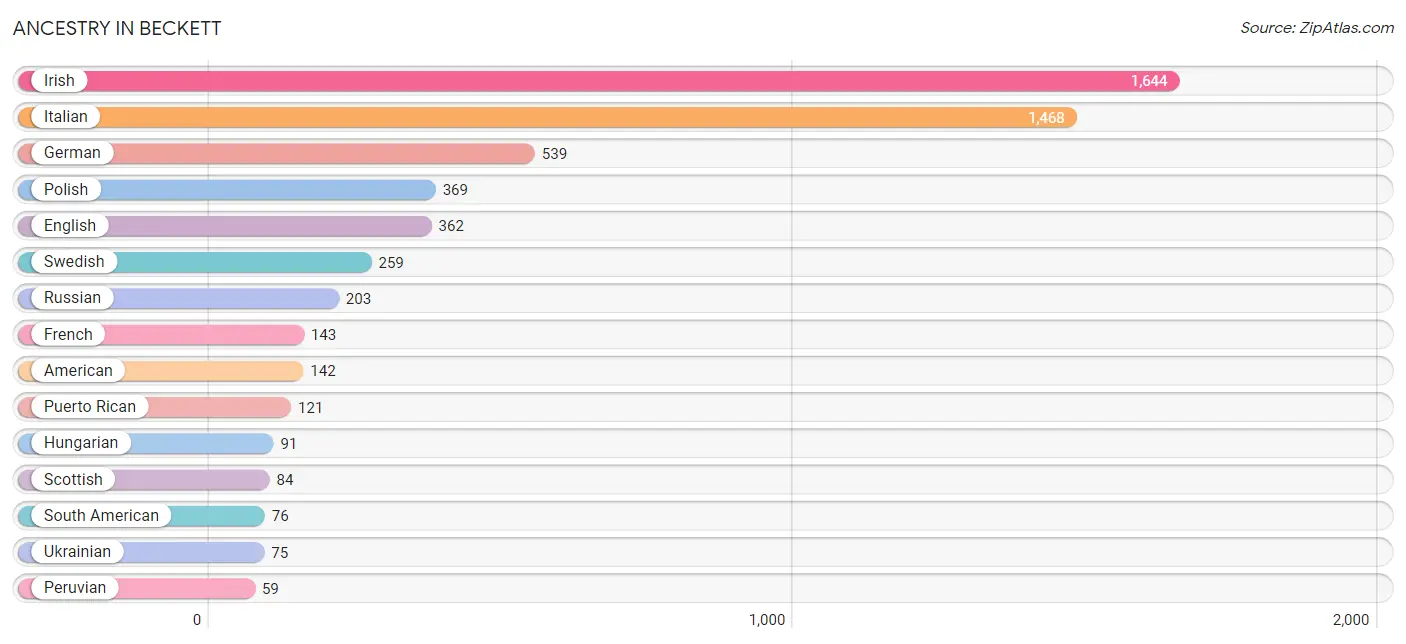
Ancestry in Beckett
The most populous ancestries reported in Beckett are Irish (1,644 | 29.9%), Italian (1,468 | 26.7%), German (539 | 9.8%), Polish (369 | 6.7%), and English (362 | 6.6%), together accounting for 79.7% of all Beckett residents.
| Ancestry | # Population | % Population |
| American | 142 | 2.6% |
| Arab | 11 | 0.2% |
| British | 19 | 0.4% |
| Canadian | 14 | 0.3% |
| Central American | 12 | 0.2% |
| Croatian | 24 | 0.4% |
| Dutch | 49 | 0.9% |
| Eastern European | 28 | 0.5% |
| English | 362 | 6.6% |
| French | 143 | 2.6% |
| French Canadian | 7 | 0.1% |
| German | 539 | 9.8% |
| Hungarian | 91 | 1.7% |
| Irish | 1,644 | 29.9% |
| Italian | 1,468 | 26.7% |
| Lithuanian | 56 | 1.0% |
| Mexican | 46 | 0.8% |
| Norwegian | 14 | 0.3% |
| Panamanian | 12 | 0.2% |
| Peruvian | 59 | 1.1% |
| Polish | 369 | 6.7% |
| Portuguese | 18 | 0.3% |
| Puerto Rican | 121 | 2.2% |
| Russian | 203 | 3.7% |
| Scottish | 84 | 1.5% |
| South American | 76 | 1.4% |
| Swedish | 259 | 4.7% |
| Ukrainian | 75 | 1.4% |
| Uruguayan | 17 | 0.3% |
| Welsh | 8 | 0.2% | View All 30 Rows |
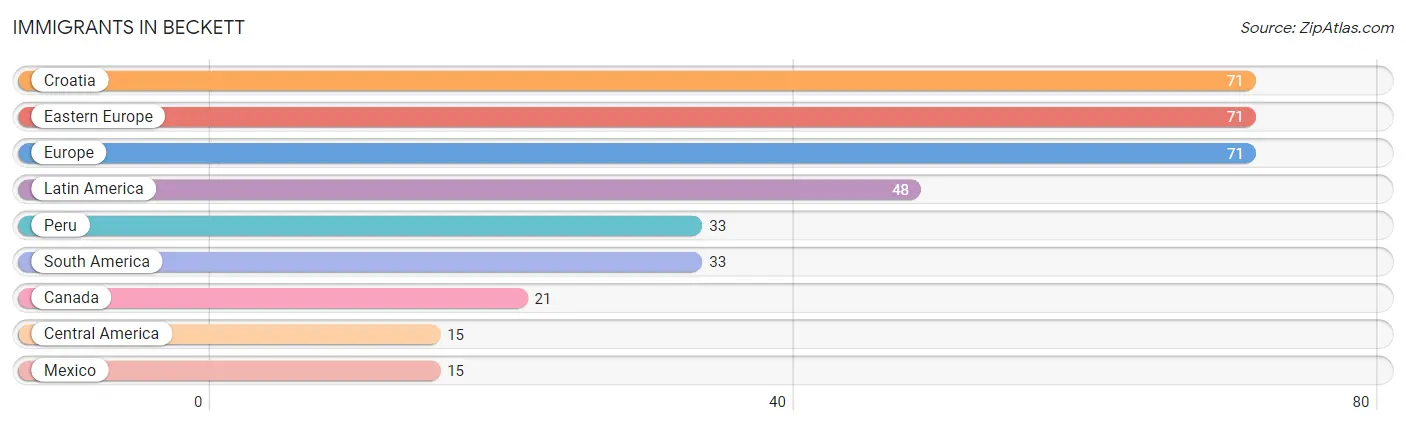
Immigrants in Beckett
The most numerous immigrant groups reported in Beckett came from Croatia (71 | 1.3%), Eastern Europe (71 | 1.3%), Europe (71 | 1.3%), Latin America (48 | 0.9%), and Peru (33 | 0.6%), together accounting for 5.3% of all Beckett residents.
| Immigration Origin | # Population | % Population |
| Canada | 21 | 0.4% |
| Central America | 15 | 0.3% |
| Croatia | 71 | 1.3% |
| Eastern Europe | 71 | 1.3% |
| Europe | 71 | 1.3% |
| Latin America | 48 | 0.9% |
| Mexico | 15 | 0.3% |
| Peru | 33 | 0.6% |
| South America | 33 | 0.6% | View All 9 Rows |
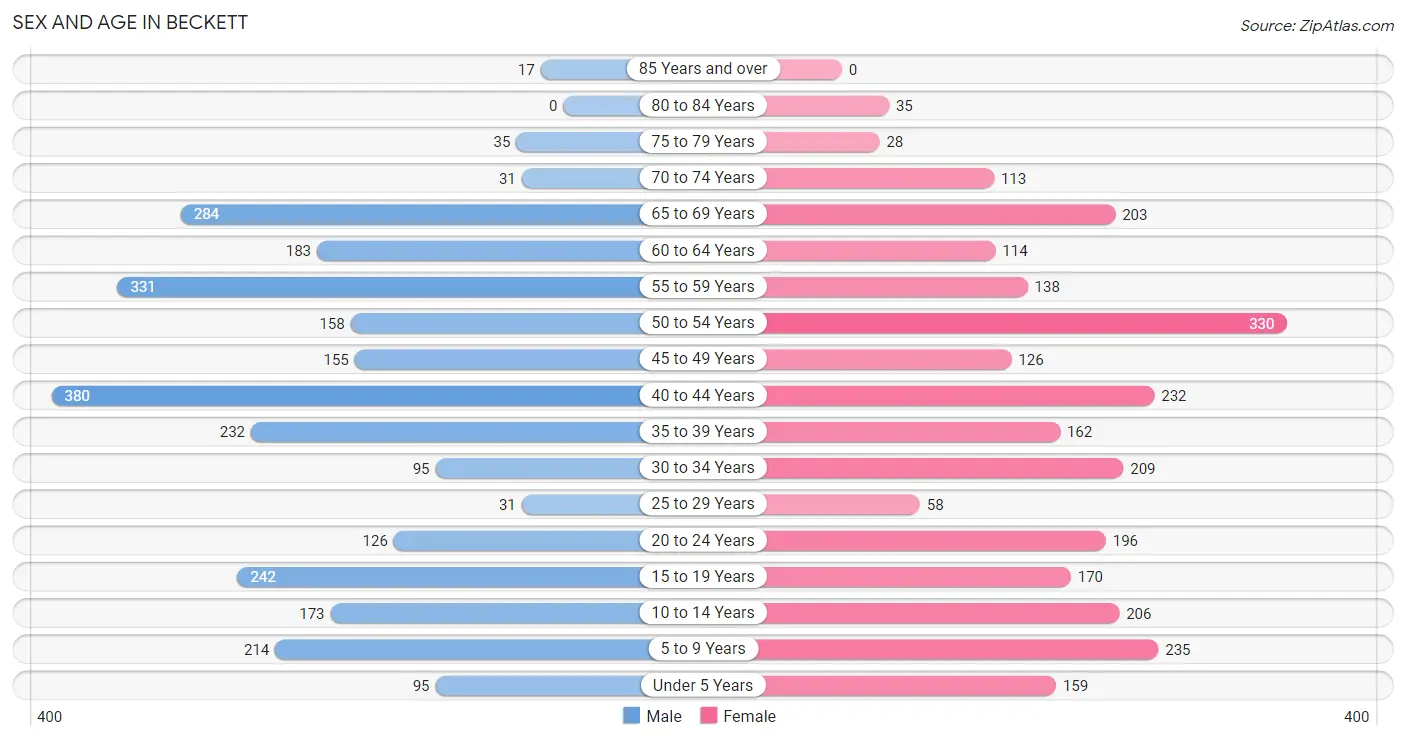
Sex and Age in Beckett
Sex and Age in Beckett
The most populous age groups in Beckett are 40 to 44 Years (380 | 13.7%) for men and 50 to 54 Years (330 | 12.2%) for women.
| Age Bracket | Male | Female |
| Under 5 Years | 95 (3.4%) | 159 (5.9%) |
| 5 to 9 Years | 214 (7.7%) | 235 (8.7%) |
| 10 to 14 Years | 173 (6.2%) | 206 (7.6%) |
| 15 to 19 Years | 242 (8.7%) | 170 (6.3%) |
| 20 to 24 Years | 126 (4.5%) | 196 (7.2%) |
| 25 to 29 Years | 31 (1.1%) | 58 (2.1%) |
| 30 to 34 Years | 95 (3.4%) | 209 (7.7%) |
| 35 to 39 Years | 232 (8.3%) | 162 (6.0%) |
| 40 to 44 Years | 380 (13.7%) | 232 (8.6%) |
| 45 to 49 Years | 155 (5.6%) | 126 (4.6%) |
| 50 to 54 Years | 158 (5.7%) | 330 (12.2%) |
| 55 to 59 Years | 331 (11.9%) | 138 (5.1%) |
| 60 to 64 Years | 183 (6.6%) | 114 (4.2%) |
| 65 to 69 Years | 284 (10.2%) | 203 (7.5%) |
| 70 to 74 Years | 31 (1.1%) | 113 (4.2%) |
| 75 to 79 Years | 35 (1.3%) | 28 (1.0%) |
| 80 to 84 Years | 0 (0.0%) | 35 (1.3%) |
| 85 Years and over | 17 (0.6%) | 0 (0.0%) |
| Total | 2,782 (100.0%) | 2,714 (100.0%) |
Families and Households in Beckett
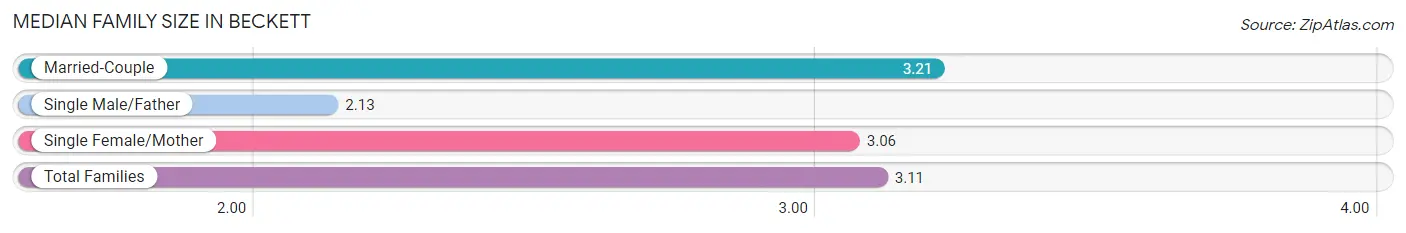
Median Family Size in Beckett
The median family size in Beckett is 3.11 persons per family, with married-couple families (1,183 | 81.5%) accounting for the largest median family size of 3.21 persons per family. On the other hand, single male/father families (112 | 7.7%) represent the smallest median family size with 2.13 persons per family.
| Family Type | # Families | Family Size |
| Married-Couple | 1,183 (81.5%) | 3.21 |
| Single Male/Father | 112 (7.7%) | 2.13 |
| Single Female/Mother | 156 (10.7%) | 3.06 |
| Total Families | 1,451 (100.0%) | 3.11 |
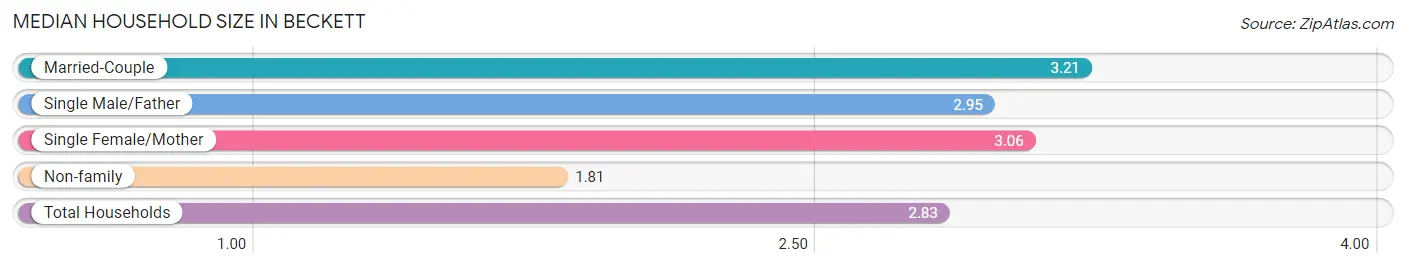
Median Household Size in Beckett
The median household size in Beckett is 2.83 persons per household, with married-couple households (1,183 | 60.8%) accounting for the largest median household size of 3.21 persons per household. non-family households (494 | 25.4%) represent the smallest median household size with 1.81 persons per household.
| Household Type | # Households | Household Size |
| Married-Couple | 1,183 (60.8%) | 3.21 |
| Single Male/Father | 112 (5.8%) | 2.95 |
| Single Female/Mother | 156 (8.0%) | 3.06 |
| Non-family | 494 (25.4%) | 1.81 |
| Total Households | 1,945 (100.0%) | 2.83 |
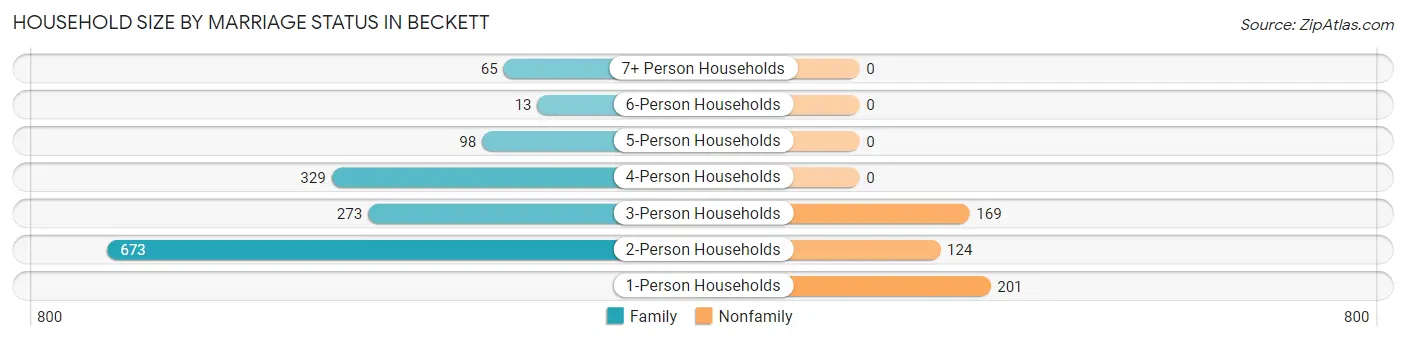
Household Size by Marriage Status in Beckett
Out of a total of 1,945 households in Beckett, 1,451 (74.6%) are family households, while 494 (25.4%) are nonfamily households. The most numerous type of family households are 2-person households, comprising 673, and the most common type of nonfamily households are 1-person households, comprising 201.
| Household Size | Family Households | Nonfamily Households |
| 1-Person Households | - | 201 (10.3%) |
| 2-Person Households | 673 (34.6%) | 124 (6.4%) |
| 3-Person Households | 273 (14.0%) | 169 (8.7%) |
| 4-Person Households | 329 (16.9%) | 0 (0.0%) |
| 5-Person Households | 98 (5.0%) | 0 (0.0%) |
| 6-Person Households | 13 (0.7%) | 0 (0.0%) |
| 7+ Person Households | 65 (3.3%) | 0 (0.0%) |
| Total | 1,451 (74.6%) | 494 (25.4%) |
Female Fertility in Beckett
Fertility by Age in Beckett
Average fertility rate in Beckett is 27.0 births per 1,000 women. Women in the age bracket of 35 to 50 years have the highest fertility rate with 52.0 births per 1,000 women. Women in the age bracket of 35 to 50 years acount for 100.0% of all women with births.
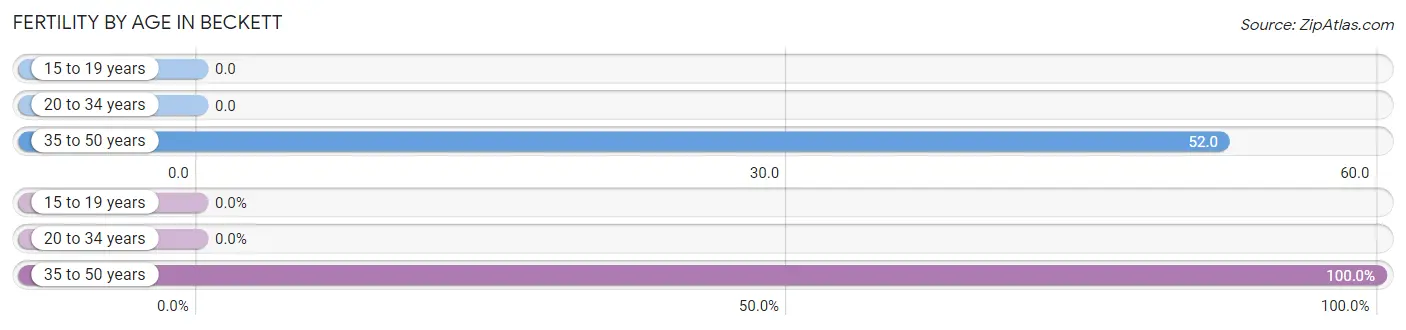
| Age Bracket | Women with Births | Births / 1,000 Women |
| 15 to 19 years | 0 (0.0%) | 0.0 |
| 20 to 34 years | 0 (0.0%) | 0.0 |
| 35 to 50 years | 35 (100.0%) | 52.0 |
| Total | 35 (100.0%) | 27.0 |
Fertility by Age by Marriage Status in Beckett
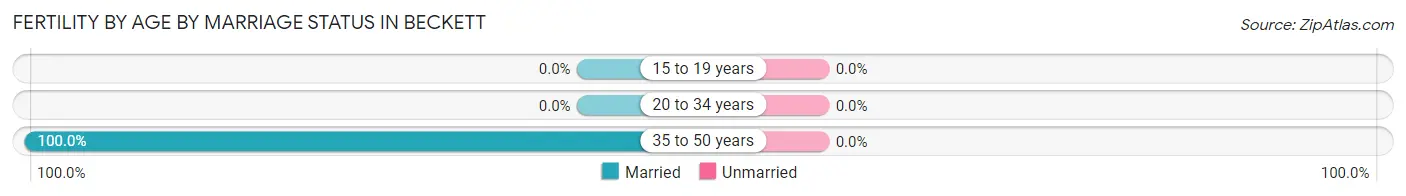
| Age Bracket | Married | Unmarried |
| 15 to 19 years | 0 (0.0%) | 0 (0.0%) |
| 20 to 34 years | 0 (0.0%) | 0 (0.0%) |
| 35 to 50 years | 35 (100.0%) | 0 (0.0%) |
| Total | 35 (100.0%) | 0 (0.0%) |
Fertility by Education in Beckett
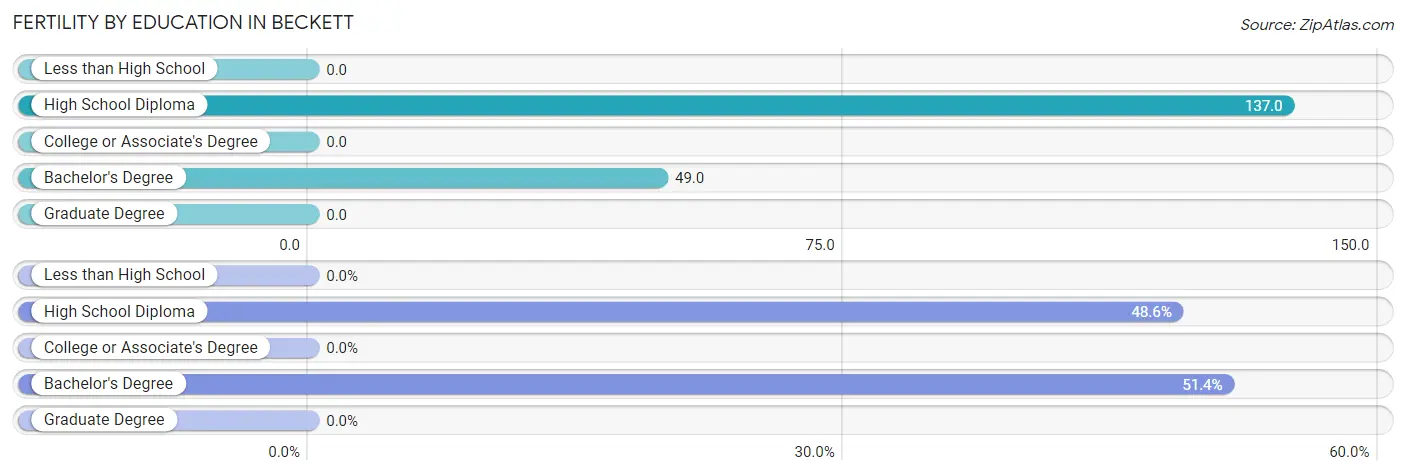
| Educational Attainment | Women with Births | Births / 1,000 Women |
| Less than High School | 0 (0.0%) | 0.0 |
| High School Diploma | 17 (48.6%) | 137.0 |
| College or Associate's Degree | 0 (0.0%) | 0.0 |
| Bachelor's Degree | 18 (51.4%) | 49.0 |
| Graduate Degree | 0 (0.0%) | 0.0 |
| Total | 35 (100.0%) | 27.0 |
Fertility by Education by Marriage Status in Beckett
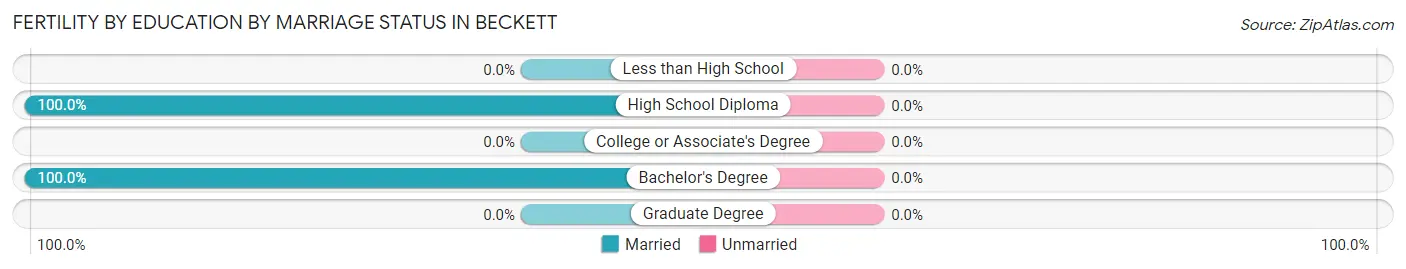
| Educational Attainment | Married | Unmarried |
| Less than High School | 0 (0.0%) | 0 (0.0%) |
| High School Diploma | 17 (100.0%) | 0 (0.0%) |
| College or Associate's Degree | 0 (0.0%) | 0 (0.0%) |
| Bachelor's Degree | 18 (100.0%) | 0 (0.0%) |
| Graduate Degree | 0 (0.0%) | 0 (0.0%) |
| Total | 35 (100.0%) | 0 (0.0%) |
Income in Beckett
Income Overview in Beckett
Per Capita Income in Beckett is $47,073, while median incomes of families and households are $142,784 and $114,046 respectively.
| Characteristic | Number | Measure |
| Per Capita Income | 5,496 | $47,073 |
| Median Family Income | 1,451 | $142,784 |
| Mean Family Income | 1,451 | $152,908 |
| Median Household Income | 1,945 | $114,046 |
| Mean Household Income | 1,945 | $131,243 |
| Income Deficit | 1,451 | $0 |
| Wage / Income Gap (%) | 5,496 | 33.55% |
| Wage / Income Gap ($) | 5,496 | 66.45¢ per $1 |
| Gini / Inequality Index | 5,496 | 0.40 |
Earnings by Sex in Beckett
Average Earnings in Beckett are $50,842, $67,721 for men and $45,000 for women, a difference of 33.6%.
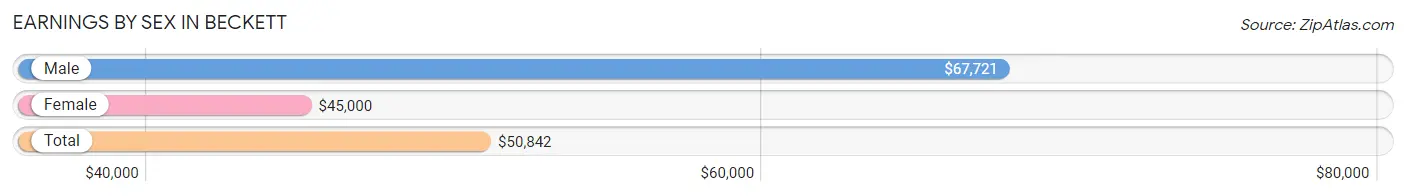
| Sex | Number | Average Earnings |
| Male | 1,787 (54.1%) | $67,721 |
| Female | 1,518 (45.9%) | $45,000 |
| Total | 3,305 (100.0%) | $50,842 |
Earnings by Sex by Income Bracket in Beckett
The most common earnings brackets in Beckett are $100,000+ for men (573 | 32.1%) and $75,000 to $99,999 for women (265 | 17.5%).
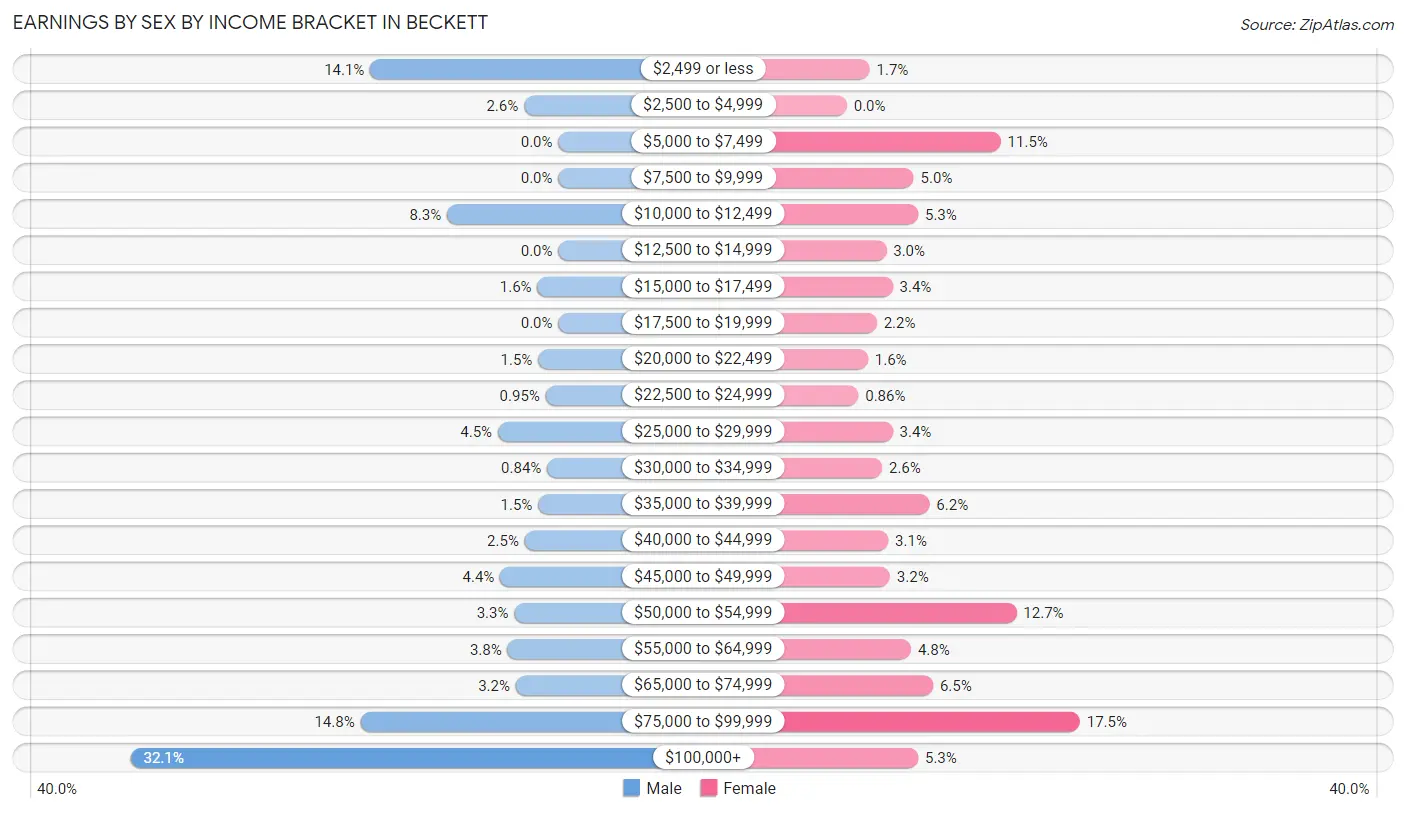
| Income | Male | Female |
| $2,499 or less | 252 (14.1%) | 26 (1.7%) |
| $2,500 to $4,999 | 46 (2.6%) | 0 (0.0%) |
| $5,000 to $7,499 | 0 (0.0%) | 175 (11.5%) |
| $7,500 to $9,999 | 0 (0.0%) | 76 (5.0%) |
| $10,000 to $12,499 | 149 (8.3%) | 81 (5.3%) |
| $12,500 to $14,999 | 0 (0.0%) | 45 (3.0%) |
| $15,000 to $17,499 | 28 (1.6%) | 52 (3.4%) |
| $17,500 to $19,999 | 0 (0.0%) | 34 (2.2%) |
| $20,000 to $22,499 | 27 (1.5%) | 24 (1.6%) |
| $22,500 to $24,999 | 17 (0.9%) | 13 (0.9%) |
| $25,000 to $29,999 | 81 (4.5%) | 52 (3.4%) |
| $30,000 to $34,999 | 15 (0.8%) | 40 (2.6%) |
| $35,000 to $39,999 | 27 (1.5%) | 94 (6.2%) |
| $40,000 to $44,999 | 45 (2.5%) | 47 (3.1%) |
| $45,000 to $49,999 | 78 (4.4%) | 49 (3.2%) |
| $50,000 to $54,999 | 59 (3.3%) | 193 (12.7%) |
| $55,000 to $64,999 | 68 (3.8%) | 73 (4.8%) |
| $65,000 to $74,999 | 57 (3.2%) | 98 (6.5%) |
| $75,000 to $99,999 | 265 (14.8%) | 265 (17.5%) |
| $100,000+ | 573 (32.1%) | 81 (5.3%) |
| Total | 1,787 (100.0%) | 1,518 (100.0%) |
Earnings by Sex by Educational Attainment in Beckett
Average earnings in Beckett are $79,250 for men and $50,480 for women, a difference of 36.3%. Men with an educational attainment of graduate degree enjoy the highest average annual earnings of $130,781, while those with college or associate's degree education earn the least with $98,333. Women with an educational attainment of college or associate's degree earn the most with the average annual earnings of $58,088, while those with high school diploma education have the smallest earnings of $35,417.
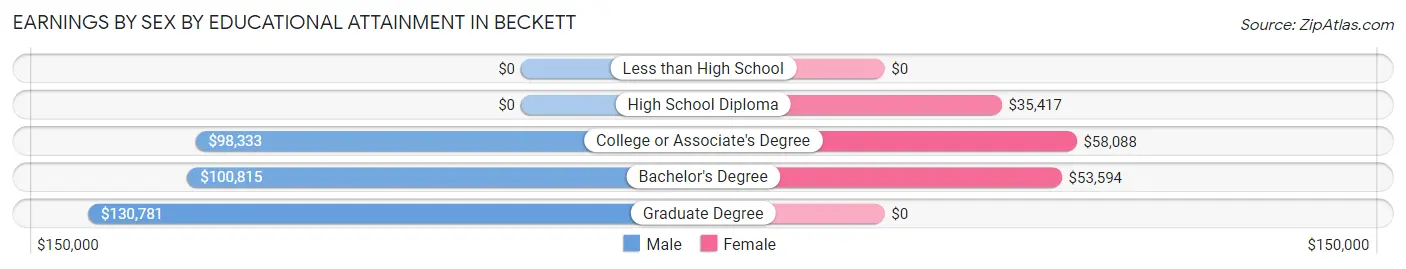
| Educational Attainment | Male Income | Female Income |
| Less than High School | - | - |
| High School Diploma | - | - |
| College or Associate's Degree | $98,333 | $58,088 |
| Bachelor's Degree | $100,815 | $53,594 |
| Graduate Degree | $130,781 | $0 |
| Total | $79,250 | $50,480 |
Family Income in Beckett
Family Income Brackets in Beckett
According to the Beckett family income data, there are 366 families falling into the $100,000 to $149,999 income range, which is the most common income bracket and makes up 25.2% of all families.
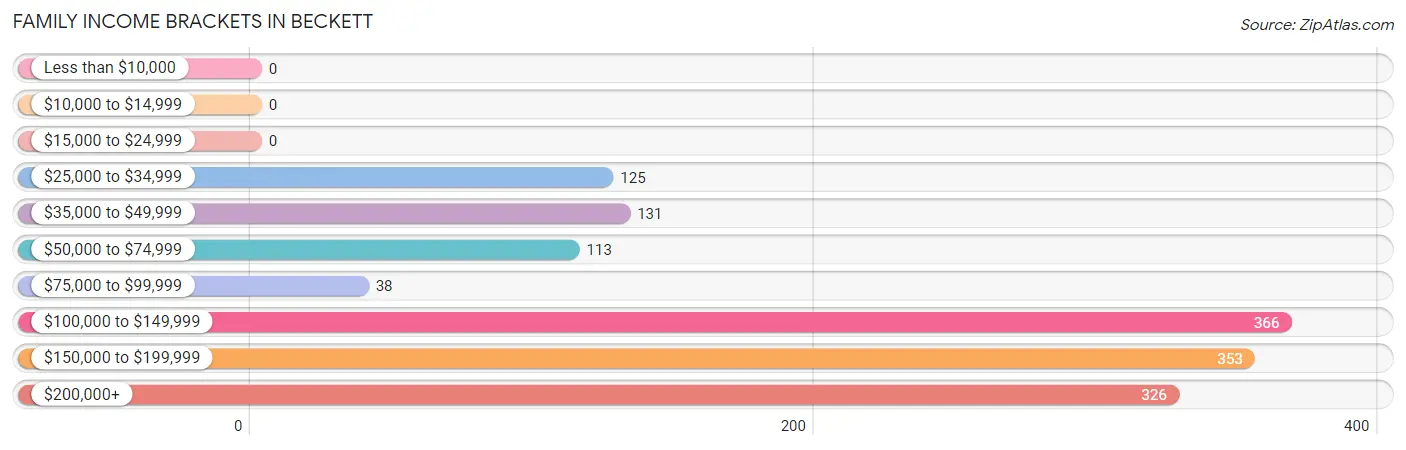
| Income Bracket | # Families | % Families |
| Less than $10,000 | 0 | 0.0% |
| $10,000 to $14,999 | 0 | 0.0% |
| $15,000 to $24,999 | 0 | 0.0% |
| $25,000 to $34,999 | 125 | 8.6% |
| $35,000 to $49,999 | 131 | 9.0% |
| $50,000 to $74,999 | 113 | 7.8% |
| $75,000 to $99,999 | 38 | 2.6% |
| $100,000 to $149,999 | 366 | 25.2% |
| $150,000 to $199,999 | 353 | 24.3% |
| $200,000+ | 326 | 22.5% |
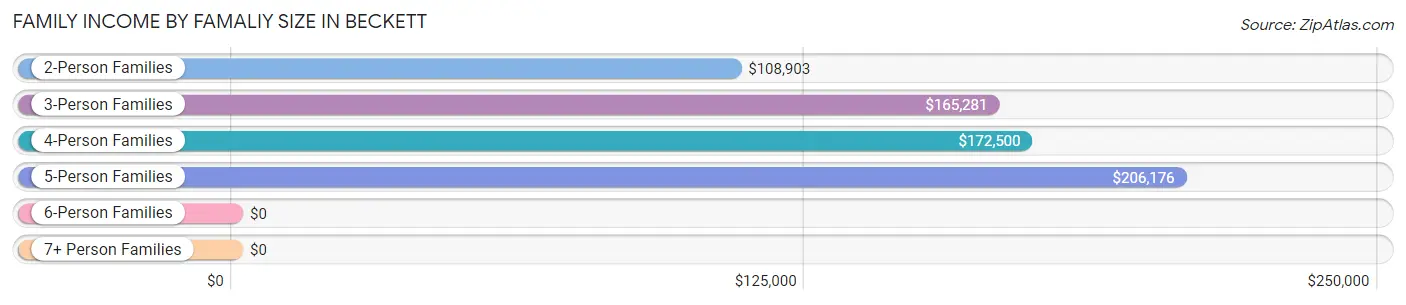
Family Income by Famaliy Size in Beckett
5-person families (98 | 6.8%) account for the highest median family income in Beckett with $206,176 per family, while 3-person families (254 | 17.5%) have the highest median income of $55,094 per family member.
| Income Bracket | # Families | Median Income |
| 2-Person Families | 729 (50.2%) | $108,903 |
| 3-Person Families | 254 (17.5%) | $165,281 |
| 4-Person Families | 292 (20.1%) | $172,500 |
| 5-Person Families | 98 (6.8%) | $206,176 |
| 6-Person Families | 13 (0.9%) | $0 |
| 7+ Person Families | 65 (4.5%) | $0 |
| Total | 1,451 (100.0%) | $142,784 |
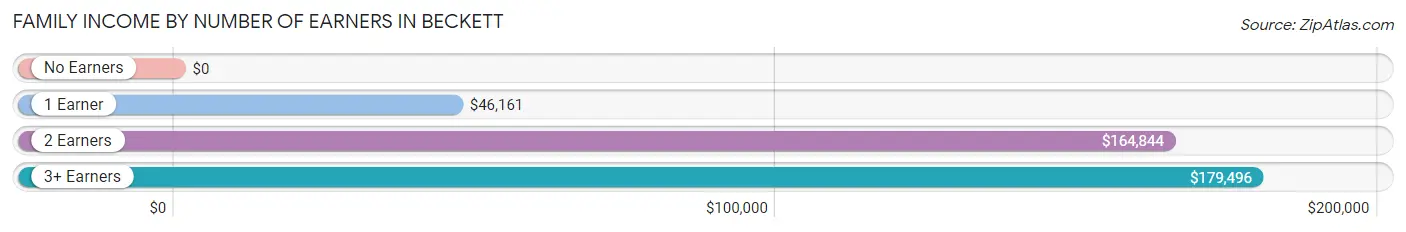
Family Income by Number of Earners in Beckett
| Number of Earners | # Families | Median Income |
| No Earners | 198 (13.7%) | $0 |
| 1 Earner | 263 (18.1%) | $46,161 |
| 2 Earners | 833 (57.4%) | $164,844 |
| 3+ Earners | 157 (10.8%) | $179,496 |
| Total | 1,451 (100.0%) | $142,784 |
Household Income in Beckett
Household Income Brackets in Beckett
With 486 households falling in the category, the $100,000 to $149,999 income range is the most frequent in Beckett, accounting for 25.0% of all households.
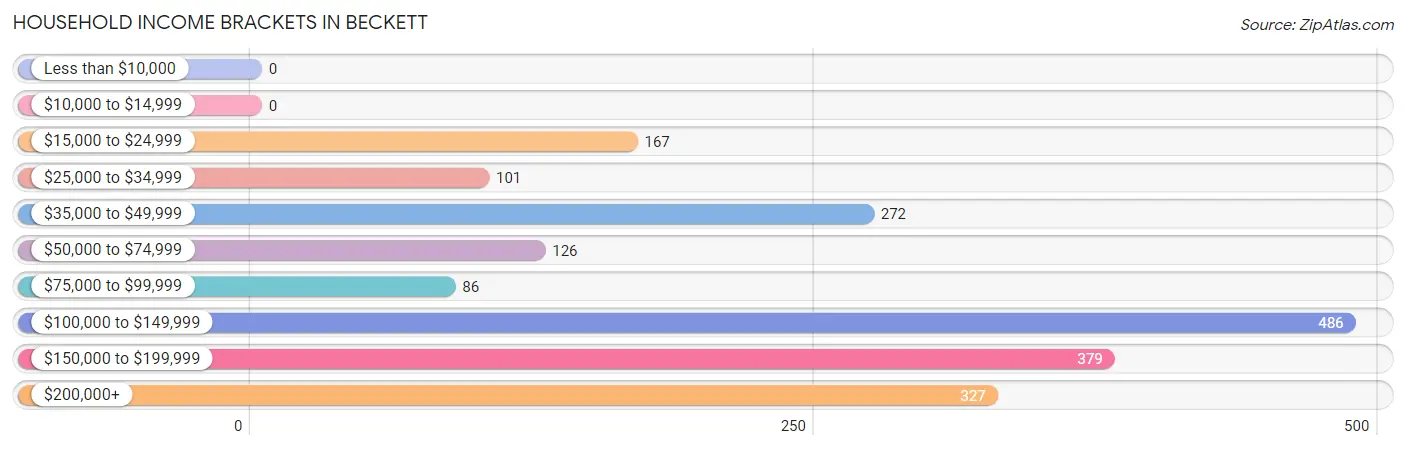
| Income Bracket | # Households | % Households |
| Less than $10,000 | 0 | 0.0% |
| $10,000 to $14,999 | 0 | 0.0% |
| $15,000 to $24,999 | 167 | 8.6% |
| $25,000 to $34,999 | 101 | 5.2% |
| $35,000 to $49,999 | 272 | 14.0% |
| $50,000 to $74,999 | 126 | 6.5% |
| $75,000 to $99,999 | 86 | 4.4% |
| $100,000 to $149,999 | 486 | 25.0% |
| $150,000 to $199,999 | 379 | 19.5% |
| $200,000+ | 327 | 16.8% |
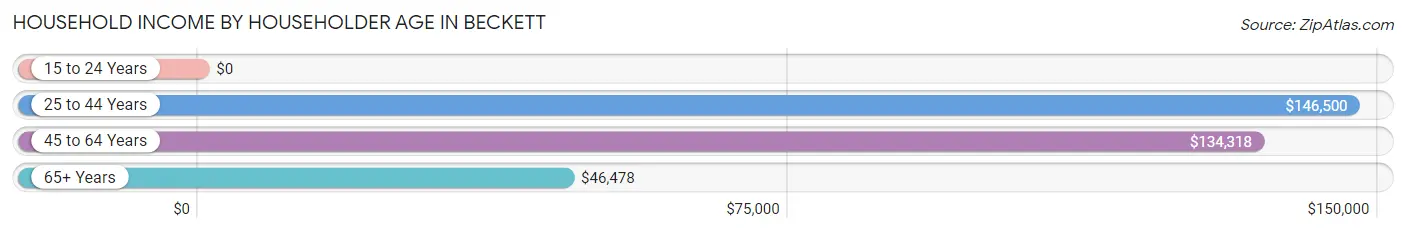
Household Income by Householder Age in Beckett
The median household income in Beckett is $114,046, with the highest median household income of $146,500 found in the 25 to 44 years age bracket for the primary householder. A total of 586 households (30.1%) fall into this category.
| Income Bracket | # Households | Median Income |
| 15 to 24 Years | 0 (0.0%) | $0 |
| 25 to 44 Years | 586 (30.1%) | $146,500 |
| 45 to 64 Years | 852 (43.8%) | $134,318 |
| 65+ Years | 507 (26.1%) | $46,478 |
| Total | 1,945 (100.0%) | $114,046 |
Poverty in Beckett
Income Below Poverty by Sex and Age in Beckett
With 10.1% poverty level for males and 2.2% for females among the residents of Beckett, 35 to 44 year old males and 25 to 34 year old females are the most vulnerable to poverty, with 211 males (34.5%) and 37 females (13.9%) in their respective age groups living below the poverty level.
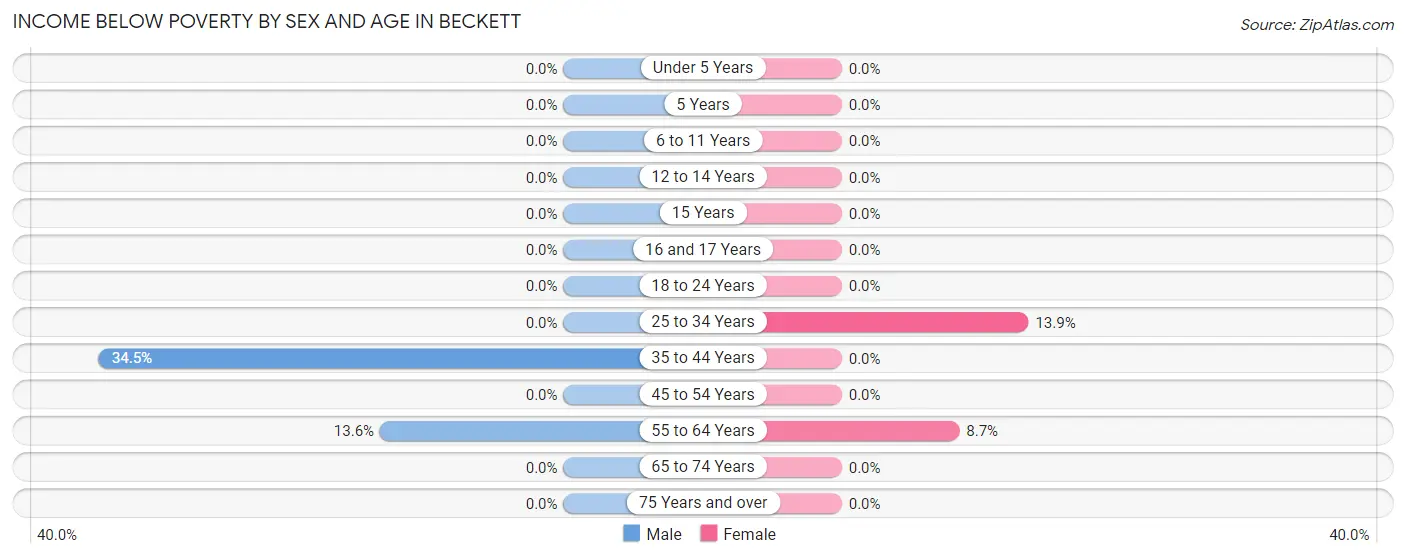
| Age Bracket | Male | Female |
| Under 5 Years | 0 (0.0%) | 0 (0.0%) |
| 5 Years | 0 (0.0%) | 0 (0.0%) |
| 6 to 11 Years | 0 (0.0%) | 0 (0.0%) |
| 12 to 14 Years | 0 (0.0%) | 0 (0.0%) |
| 15 Years | 0 (0.0%) | 0 (0.0%) |
| 16 and 17 Years | 0 (0.0%) | 0 (0.0%) |
| 18 to 24 Years | 0 (0.0%) | 0 (0.0%) |
| 25 to 34 Years | 0 (0.0%) | 37 (13.9%) |
| 35 to 44 Years | 211 (34.5%) | 0 (0.0%) |
| 45 to 54 Years | 0 (0.0%) | 0 (0.0%) |
| 55 to 64 Years | 70 (13.6%) | 22 (8.7%) |
| 65 to 74 Years | 0 (0.0%) | 0 (0.0%) |
| 75 Years and over | 0 (0.0%) | 0 (0.0%) |
| Total | 281 (10.1%) | 59 (2.2%) |
Income Above Poverty by Sex and Age in Beckett
According to the poverty statistics in Beckett, males aged under 5 years and females aged under 5 years are the age groups that are most secure financially, with 100.0% of males and 100.0% of females in these age groups living above the poverty line.
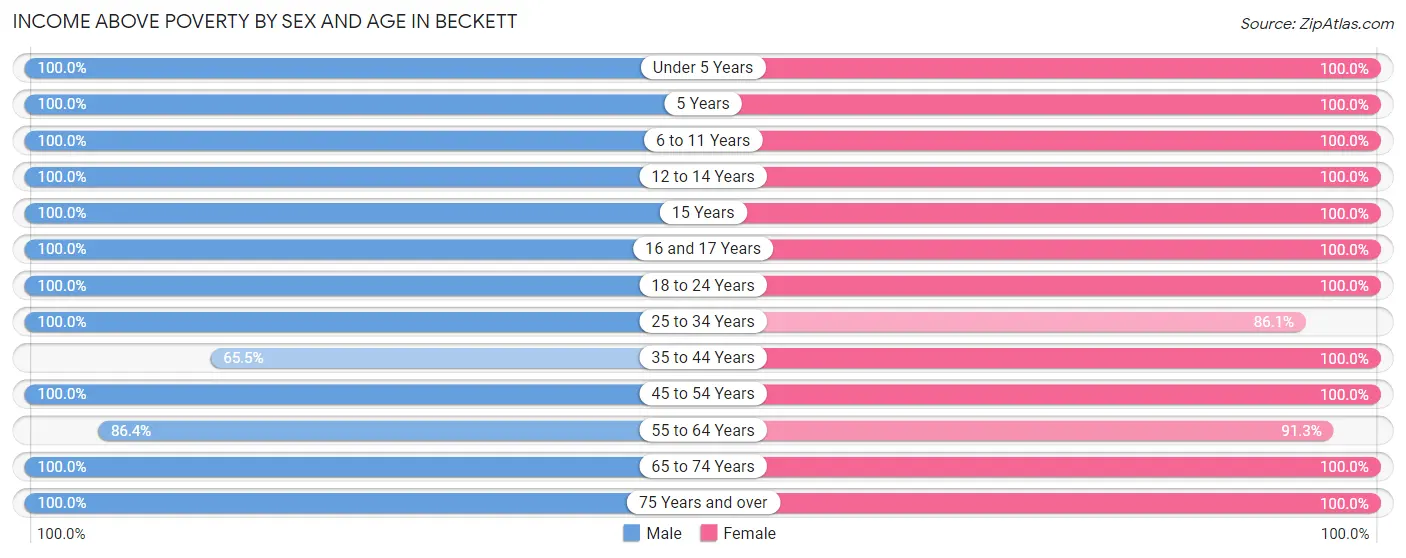
| Age Bracket | Male | Female |
| Under 5 Years | 95 (100.0%) | 159 (100.0%) |
| 5 Years | 123 (100.0%) | 14 (100.0%) |
| 6 to 11 Years | 150 (100.0%) | 199 (100.0%) |
| 12 to 14 Years | 114 (100.0%) | 186 (100.0%) |
| 15 Years | 22 (100.0%) | 51 (100.0%) |
| 16 and 17 Years | 165 (100.0%) | 101 (100.0%) |
| 18 to 24 Years | 181 (100.0%) | 214 (100.0%) |
| 25 to 34 Years | 126 (100.0%) | 230 (86.1%) |
| 35 to 44 Years | 401 (65.5%) | 394 (100.0%) |
| 45 to 54 Years | 313 (100.0%) | 456 (100.0%) |
| 55 to 64 Years | 444 (86.4%) | 230 (91.3%) |
| 65 to 74 Years | 315 (100.0%) | 316 (100.0%) |
| 75 Years and over | 52 (100.0%) | 63 (100.0%) |
| Total | 2,501 (89.9%) | 2,613 (97.8%) |
Income Below Poverty Among Married-Couple Families in Beckett
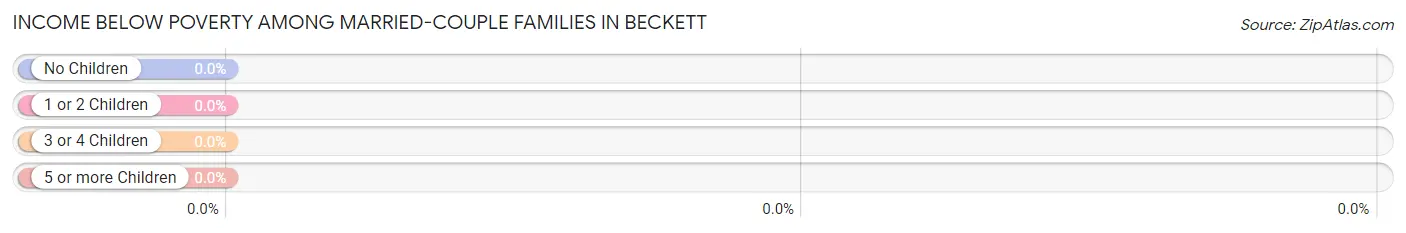
| Children | Above Poverty | Below Poverty |
| No Children | 606 (100.0%) | 0 (0.0%) |
| 1 or 2 Children | 456 (100.0%) | 0 (0.0%) |
| 3 or 4 Children | 56 (100.0%) | 0 (0.0%) |
| 5 or more Children | 65 (100.0%) | 0 (0.0%) |
| Total | 1,183 (100.0%) | 0 (0.0%) |
Income Below Poverty Among Single-Parent Households in Beckett
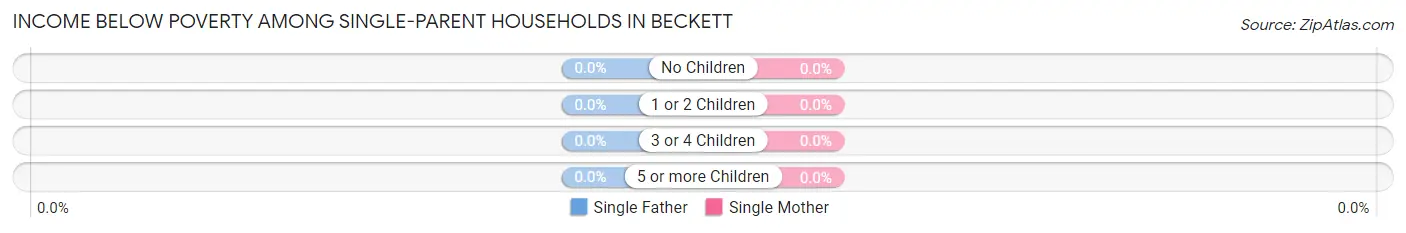
| Children | Single Father | Single Mother |
| No Children | 0 (0.0%) | 0 (0.0%) |
| 1 or 2 Children | 0 (0.0%) | 0 (0.0%) |
| 3 or 4 Children | 0 (0.0%) | 0 (0.0%) |
| 5 or more Children | 0 (0.0%) | 0 (0.0%) |
| Total | 0 (0.0%) | 0 (0.0%) |
Income Below Poverty Among Married-Couple vs Single-Parent Households in Beckett
| Children | Married-Couple Families | Single-Parent Households |
| No Children | 0 (0.0%) | 0 (0.0%) |
| 1 or 2 Children | 0 (0.0%) | 0 (0.0%) |
| 3 or 4 Children | 0 (0.0%) | 0 (0.0%) |
| 5 or more Children | 0 (0.0%) | 0 (0.0%) |
| Total | 0 (0.0%) | 0 (0.0%) |
Employment Characteristics in Beckett
Employment by Class of Employer in Beckett
Among the 2,986 employed individuals in Beckett, private company employees (2,167 | 72.6%), local government employees (408 | 13.7%), and not-for-profit organizations (246 | 8.2%) make up the most common classes of employment.
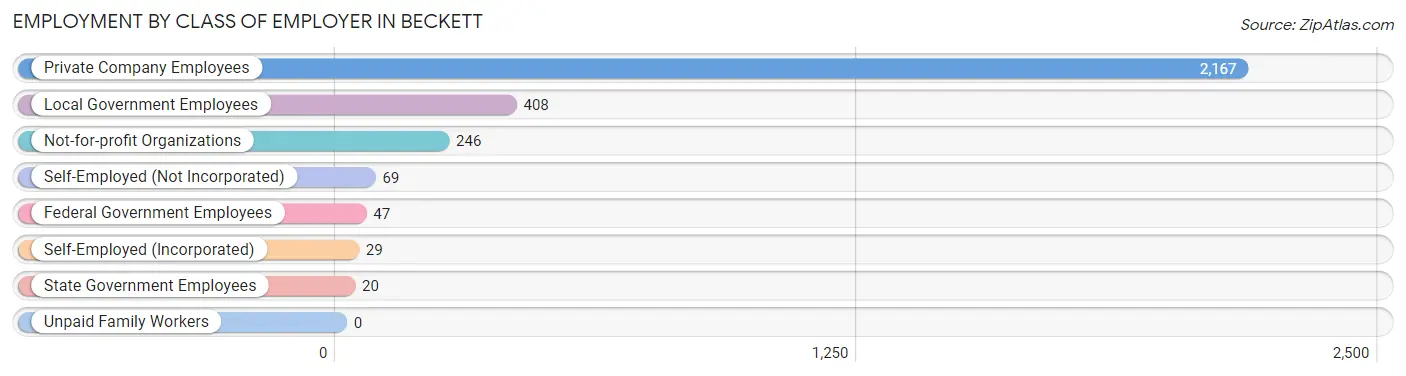
| Employer Class | # Employees | % Employees |
| Private Company Employees | 2,167 | 72.6% |
| Self-Employed (Incorporated) | 29 | 1.0% |
| Self-Employed (Not Incorporated) | 69 | 2.3% |
| Not-for-profit Organizations | 246 | 8.2% |
| Local Government Employees | 408 | 13.7% |
| State Government Employees | 20 | 0.7% |
| Federal Government Employees | 47 | 1.6% |
| Unpaid Family Workers | 0 | 0.0% |
| Total | 2,986 | 100.0% |
Employment Status by Age in Beckett
According to the labor force statistics for Beckett, out of the total population over 16 years of age (4,341), 74.3% or 3,225 individuals are in the labor force, with 4.4% or 142 of them unemployed. The age group with the highest labor force participation rate is 25 to 29 years, with 100.0% or 89 individuals in the labor force. Within the labor force, the 75 years and over age range has the highest percentage of unemployed individuals, with 100.0% or 19 of them being unemployed.
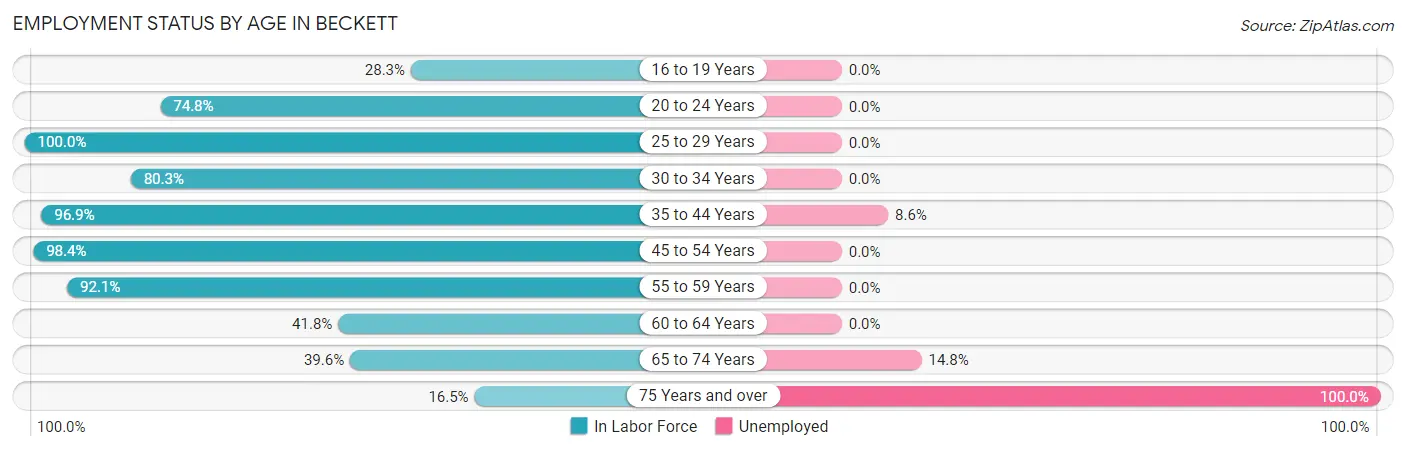
| Age Bracket | In Labor Force | Unemployed |
| 16 to 19 Years | 96 (28.3%) | 0 (0.0%) |
| 20 to 24 Years | 241 (74.8%) | 0 (0.0%) |
| 25 to 29 Years | 89 (100.0%) | 0 (0.0%) |
| 30 to 34 Years | 244 (80.3%) | 0 (0.0%) |
| 35 to 44 Years | 975 (96.9%) | 84 (8.6%) |
| 45 to 54 Years | 757 (98.4%) | 0 (0.0%) |
| 55 to 59 Years | 432 (92.1%) | 0 (0.0%) |
| 60 to 64 Years | 124 (41.8%) | 0 (0.0%) |
| 65 to 74 Years | 250 (39.6%) | 37 (14.8%) |
| 75 Years and over | 19 (16.5%) | 19 (100.0%) |
| Total | 3,225 (74.3%) | 142 (4.4%) |
Employment Status by Educational Attainment in Beckett
According to labor force statistics for Beckett, 89.3% of individuals (2,620) out of the total population between 25 and 64 years of age (2,934) are in the labor force, with 3.2% or 84 of them being unemployed. The group with the highest labor force participation rate are those with the educational attainment of bachelor's degree or higher, with 91.0% or 1,116 individuals in the labor force. Within the labor force, individuals with high school diploma education have the highest percentage of unemployment, with 11.8% or 86 of them being unemployed.
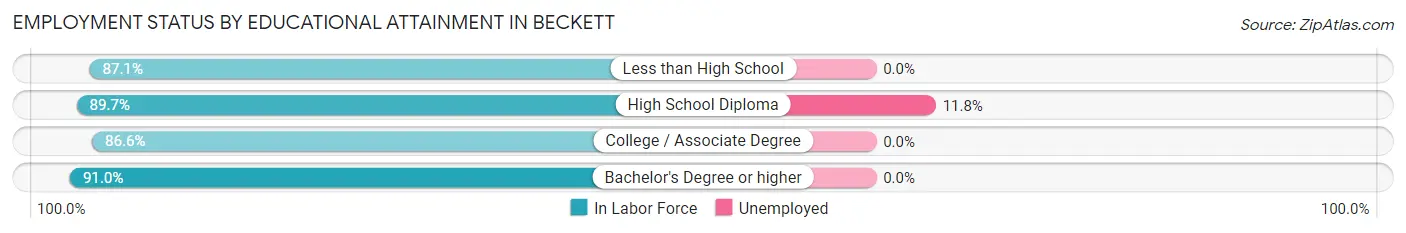
| Educational Attainment | In Labor Force | Unemployed |
| Less than High School | 81 (87.1%) | 0 (0.0%) |
| High School Diploma | 725 (89.7%) | 95 (11.8%) |
| College / Associate Degree | 699 (86.6%) | 0 (0.0%) |
| Bachelor's Degree or higher | 1,116 (91.0%) | 0 (0.0%) |
| Total | 2,620 (89.3%) | 94 (3.2%) |
Employment Occupations by Sex in Beckett
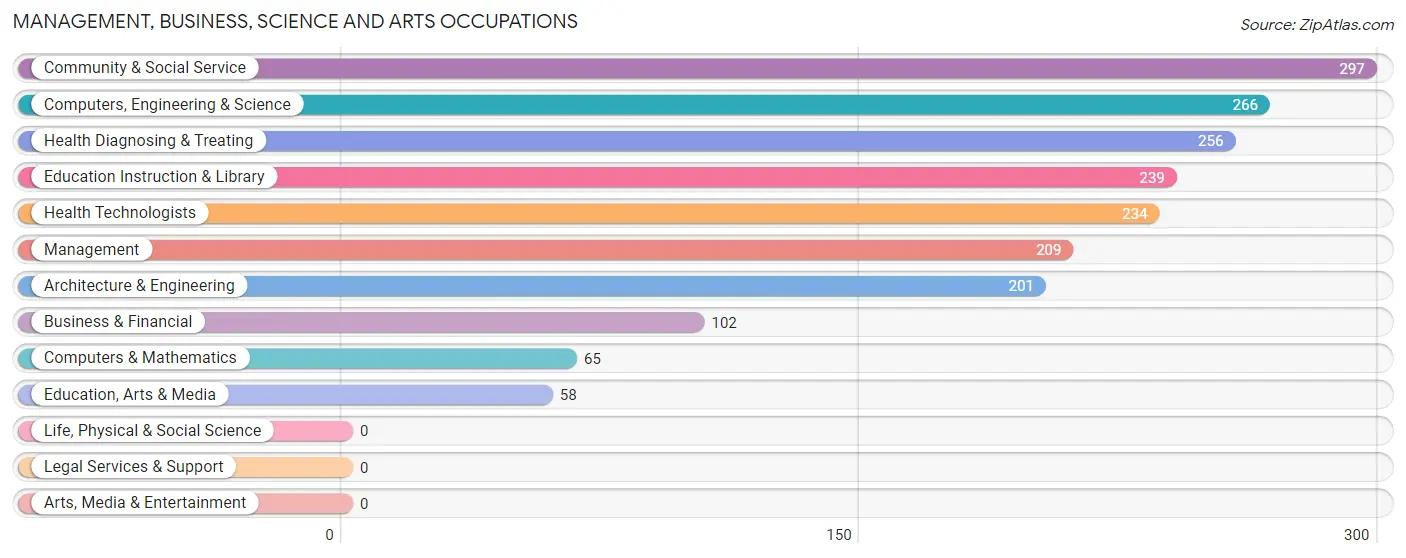
Management, Business, Science and Arts Occupations
The most common Management, Business, Science and Arts occupations in Beckett are Community & Social Service (297 | 9.7%), Computers, Engineering & Science (266 | 8.7%), Health Diagnosing & Treating (256 | 8.3%), Education Instruction & Library (239 | 7.8%), and Health Technologists (234 | 7.6%).
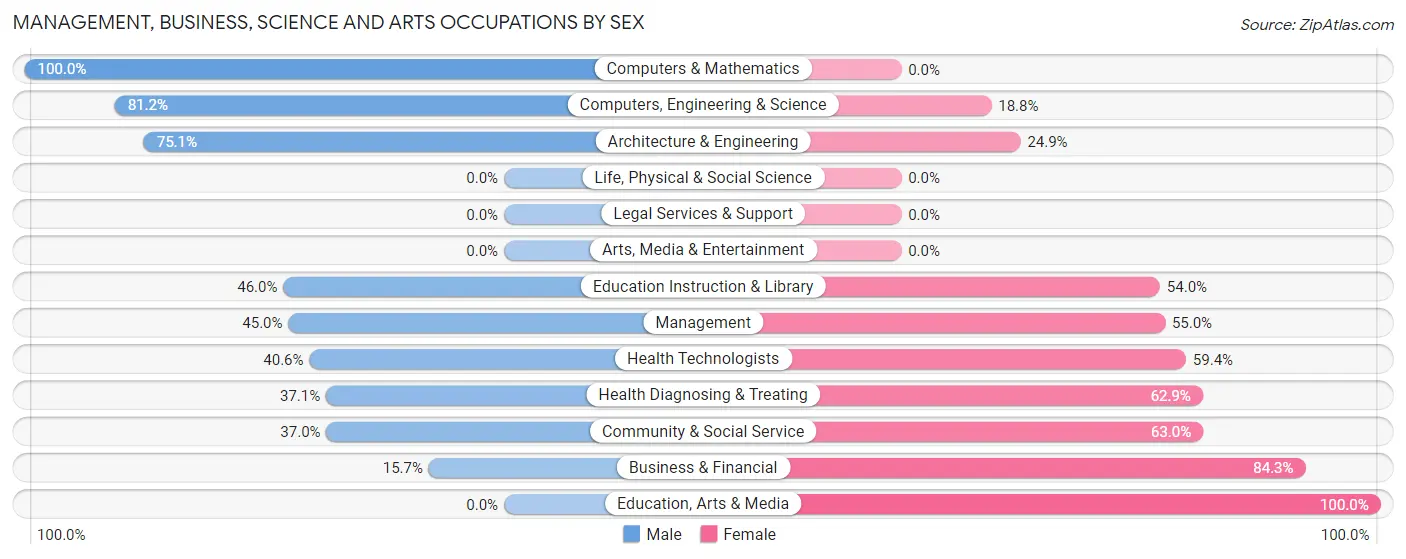
Management, Business, Science and Arts Occupations by Sex
Within the Management, Business, Science and Arts occupations in Beckett, the most male-oriented occupations are Computers & Mathematics (100.0%), Computers, Engineering & Science (81.2%), and Architecture & Engineering (75.1%), while the most female-oriented occupations are Education, Arts & Media (100.0%), Business & Financial (84.3%), and Community & Social Service (63.0%).
| Occupation | Male | Female |
| Management | 94 (45.0%) | 115 (55.0%) |
| Business & Financial | 16 (15.7%) | 86 (84.3%) |
| Computers, Engineering & Science | 216 (81.2%) | 50 (18.8%) |
| Computers & Mathematics | 65 (100.0%) | 0 (0.0%) |
| Architecture & Engineering | 151 (75.1%) | 50 (24.9%) |
| Life, Physical & Social Science | 0 (0.0%) | 0 (0.0%) |
| Community & Social Service | 110 (37.0%) | 187 (63.0%) |
| Education, Arts & Media | 0 (0.0%) | 58 (100.0%) |
| Legal Services & Support | 0 (0.0%) | 0 (0.0%) |
| Education Instruction & Library | 110 (46.0%) | 129 (54.0%) |
| Arts, Media & Entertainment | 0 (0.0%) | 0 (0.0%) |
| Health Diagnosing & Treating | 95 (37.1%) | 161 (62.9%) |
| Health Technologists | 95 (40.6%) | 139 (59.4%) |
| Total (Category) | 531 (47.0%) | 599 (53.0%) |
| Total (Overall) | 1,626 (52.9%) | 1,446 (47.1%) |
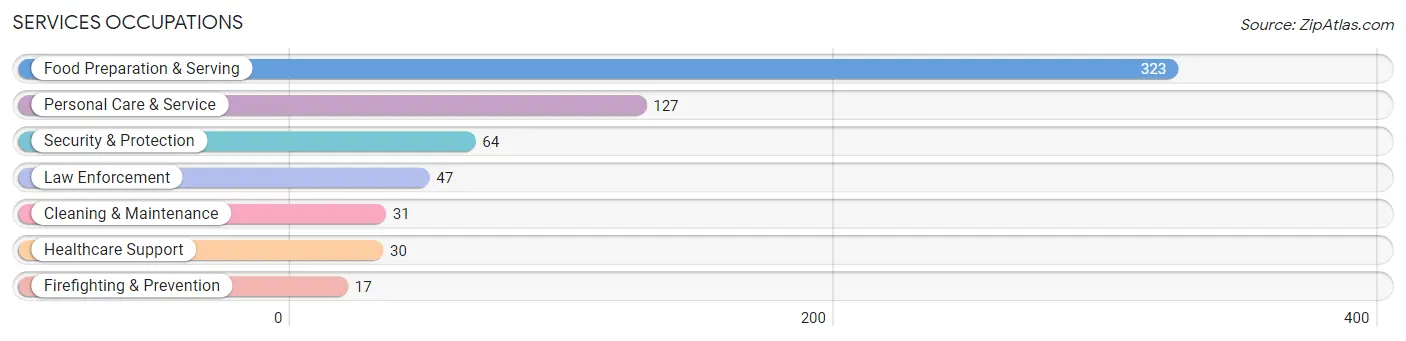
Services Occupations
The most common Services occupations in Beckett are Food Preparation & Serving (323 | 10.5%), Personal Care & Service (127 | 4.1%), Security & Protection (64 | 2.1%), Law Enforcement (47 | 1.5%), and Cleaning & Maintenance (31 | 1.0%).
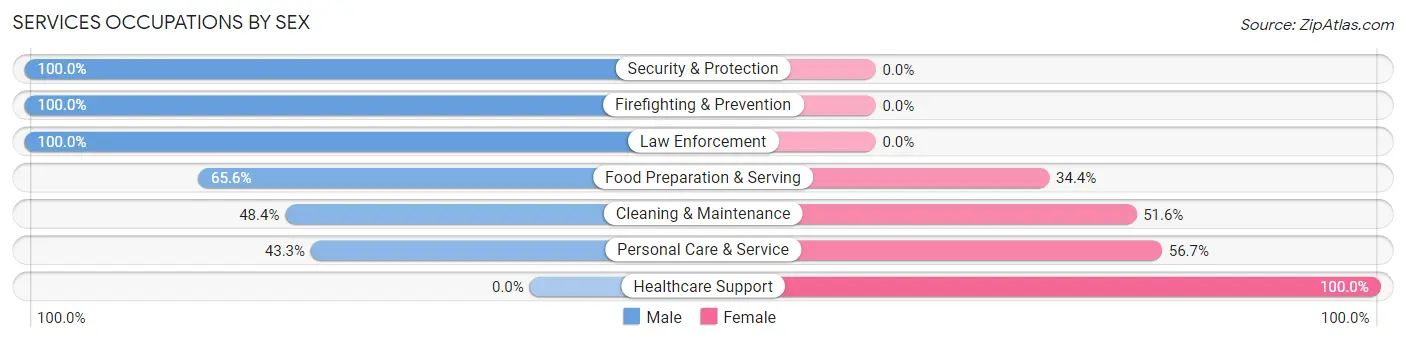
Services Occupations by Sex
Within the Services occupations in Beckett, the most male-oriented occupations are Security & Protection (100.0%), Firefighting & Prevention (100.0%), and Law Enforcement (100.0%), while the most female-oriented occupations are Healthcare Support (100.0%), Personal Care & Service (56.7%), and Cleaning & Maintenance (51.6%).
| Occupation | Male | Female |
| Healthcare Support | 0 (0.0%) | 30 (100.0%) |
| Security & Protection | 64 (100.0%) | 0 (0.0%) |
| Firefighting & Prevention | 17 (100.0%) | 0 (0.0%) |
| Law Enforcement | 47 (100.0%) | 0 (0.0%) |
| Food Preparation & Serving | 212 (65.6%) | 111 (34.4%) |
| Cleaning & Maintenance | 15 (48.4%) | 16 (51.6%) |
| Personal Care & Service | 55 (43.3%) | 72 (56.7%) |
| Total (Category) | 346 (60.2%) | 229 (39.8%) |
| Total (Overall) | 1,626 (52.9%) | 1,446 (47.1%) |
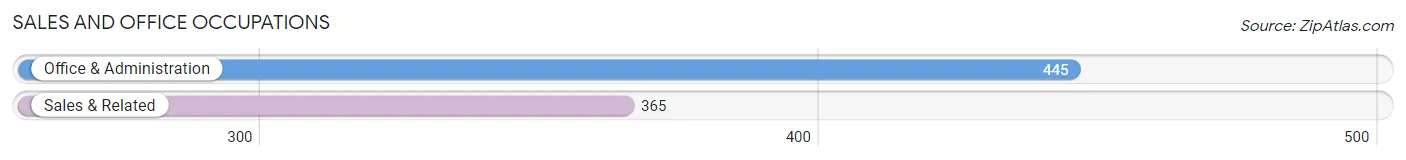
Sales and Office Occupations
The most common Sales and Office occupations in Beckett are Office & Administration (445 | 14.5%), and Sales & Related (365 | 11.9%).
Sales and Office Occupations by Sex
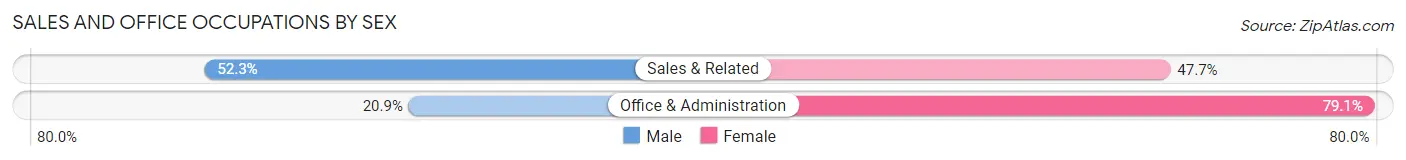
| Occupation | Male | Female |
| Sales & Related | 191 (52.3%) | 174 (47.7%) |
| Office & Administration | 93 (20.9%) | 352 (79.1%) |
| Total (Category) | 284 (35.1%) | 526 (64.9%) |
| Total (Overall) | 1,626 (52.9%) | 1,446 (47.1%) |
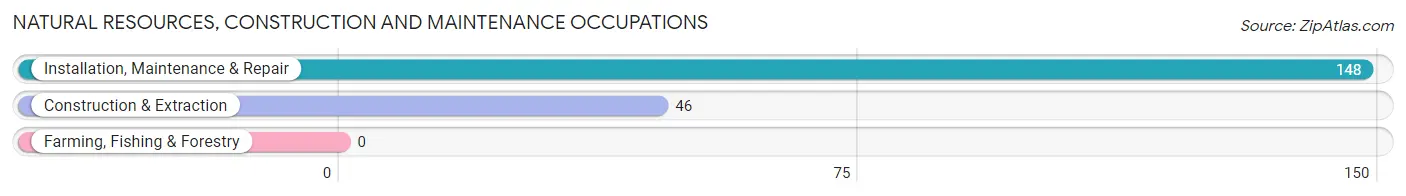
Natural Resources, Construction and Maintenance Occupations
The most common Natural Resources, Construction and Maintenance occupations in Beckett are Installation, Maintenance & Repair (148 | 4.8%), and Construction & Extraction (46 | 1.5%).
Natural Resources, Construction and Maintenance Occupations by Sex
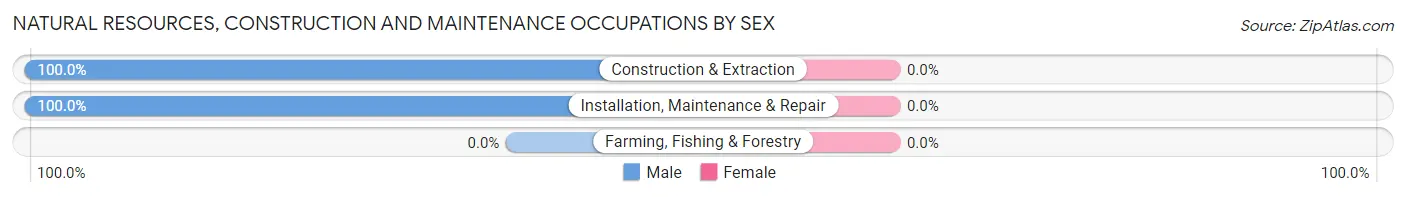
| Occupation | Male | Female |
| Farming, Fishing & Forestry | 0 (0.0%) | 0 (0.0%) |
| Construction & Extraction | 46 (100.0%) | 0 (0.0%) |
| Installation, Maintenance & Repair | 148 (100.0%) | 0 (0.0%) |
| Total (Category) | 194 (100.0%) | 0 (0.0%) |
| Total (Overall) | 1,626 (52.9%) | 1,446 (47.1%) |
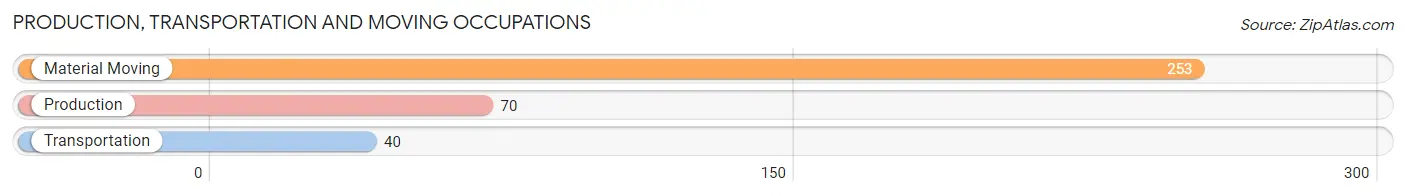
Production, Transportation and Moving Occupations
The most common Production, Transportation and Moving occupations in Beckett are Material Moving (253 | 8.2%), Production (70 | 2.3%), and Transportation (40 | 1.3%).
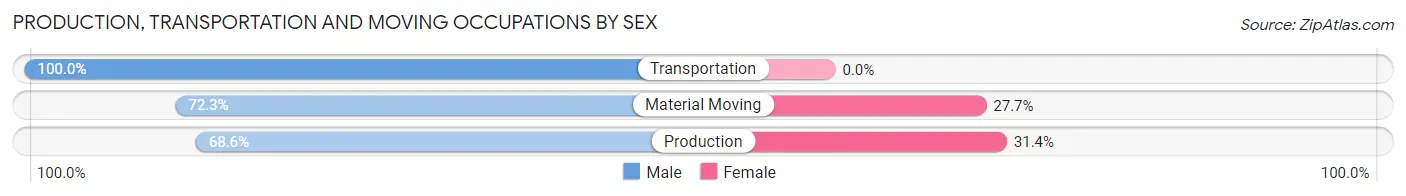
Production, Transportation and Moving Occupations by Sex
| Occupation | Male | Female |
| Production | 48 (68.6%) | 22 (31.4%) |
| Transportation | 40 (100.0%) | 0 (0.0%) |
| Material Moving | 183 (72.3%) | 70 (27.7%) |
| Total (Category) | 271 (74.7%) | 92 (25.3%) |
| Total (Overall) | 1,626 (52.9%) | 1,446 (47.1%) |
Employment Industries by Sex in Beckett
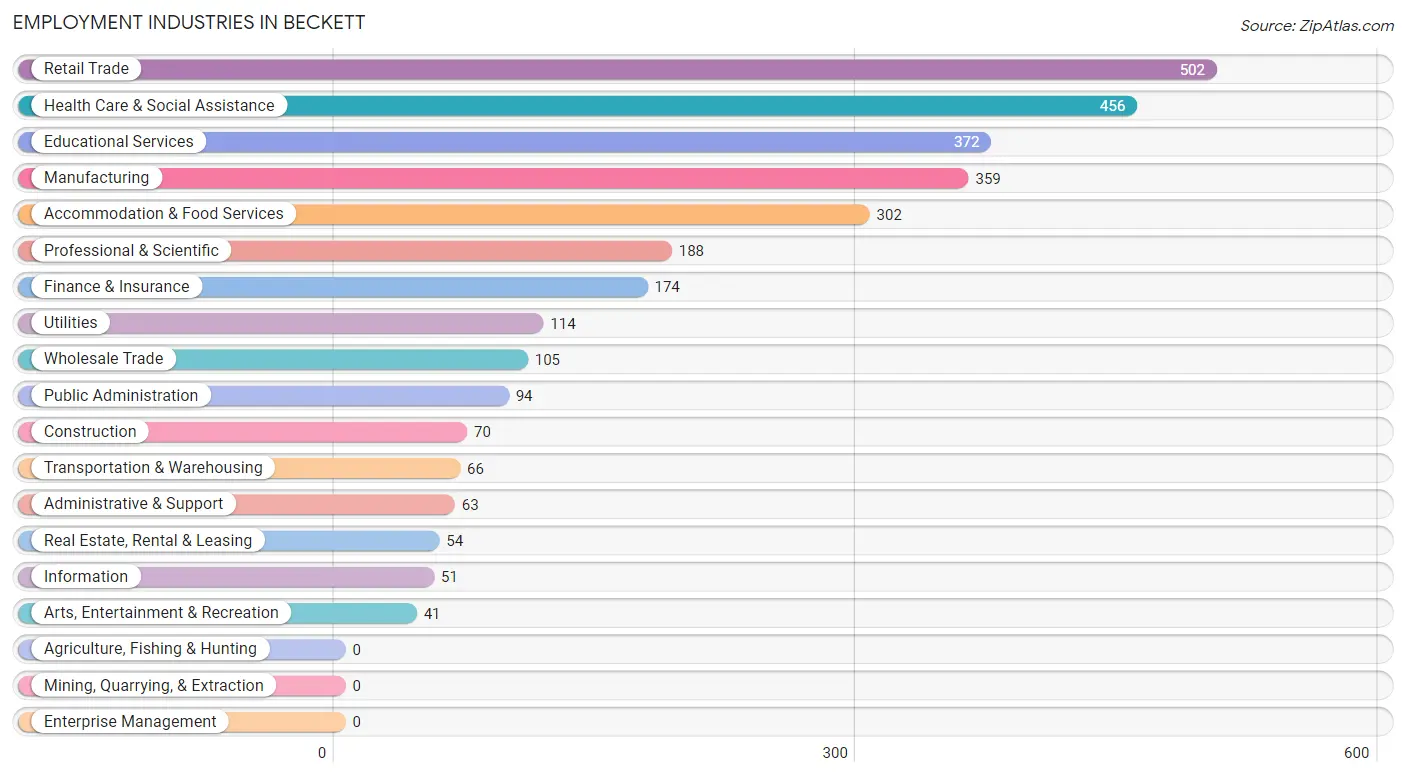
Employment Industries in Beckett
The major employment industries in Beckett include Retail Trade (502 | 16.3%), Health Care & Social Assistance (456 | 14.8%), Educational Services (372 | 12.1%), Manufacturing (359 | 11.7%), and Accommodation & Food Services (302 | 9.8%).
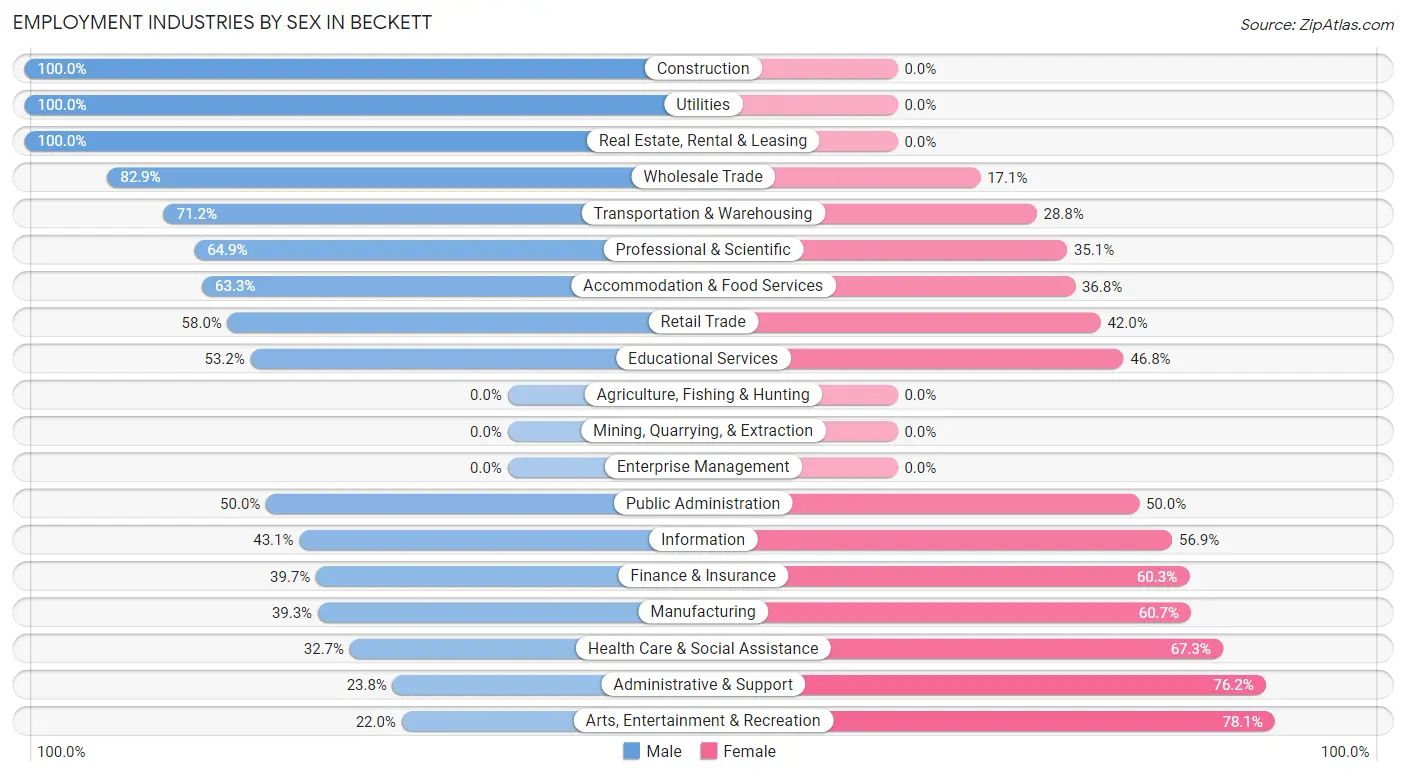
Employment Industries by Sex in Beckett
The Beckett industries that see more men than women are Construction (100.0%), Utilities (100.0%), and Real Estate, Rental & Leasing (100.0%), whereas the industries that tend to have a higher number of women are Arts, Entertainment & Recreation (78.0%), Administrative & Support (76.2%), and Health Care & Social Assistance (67.3%).
| Industry | Male | Female |
| Agriculture, Fishing & Hunting | 0 (0.0%) | 0 (0.0%) |
| Mining, Quarrying, & Extraction | 0 (0.0%) | 0 (0.0%) |
| Construction | 70 (100.0%) | 0 (0.0%) |
| Manufacturing | 141 (39.3%) | 218 (60.7%) |
| Wholesale Trade | 87 (82.9%) | 18 (17.1%) |
| Retail Trade | 291 (58.0%) | 211 (42.0%) |
| Transportation & Warehousing | 47 (71.2%) | 19 (28.8%) |
| Utilities | 114 (100.0%) | 0 (0.0%) |
| Information | 22 (43.1%) | 29 (56.9%) |
| Finance & Insurance | 69 (39.7%) | 105 (60.3%) |
| Real Estate, Rental & Leasing | 54 (100.0%) | 0 (0.0%) |
| Professional & Scientific | 122 (64.9%) | 66 (35.1%) |
| Enterprise Management | 0 (0.0%) | 0 (0.0%) |
| Administrative & Support | 15 (23.8%) | 48 (76.2%) |
| Educational Services | 198 (53.2%) | 174 (46.8%) |
| Health Care & Social Assistance | 149 (32.7%) | 307 (67.3%) |
| Arts, Entertainment & Recreation | 9 (22.0%) | 32 (78.0%) |
| Accommodation & Food Services | 191 (63.2%) | 111 (36.7%) |
| Public Administration | 47 (50.0%) | 47 (50.0%) |
| Total | 1,626 (52.9%) | 1,446 (47.1%) |
Education in Beckett
School Enrollment in Beckett
The most common levels of schooling among the 1,541 students in Beckett are high school (387 | 25.1%), elementary school (322 | 20.9%), and middle school (272 | 17.6%).
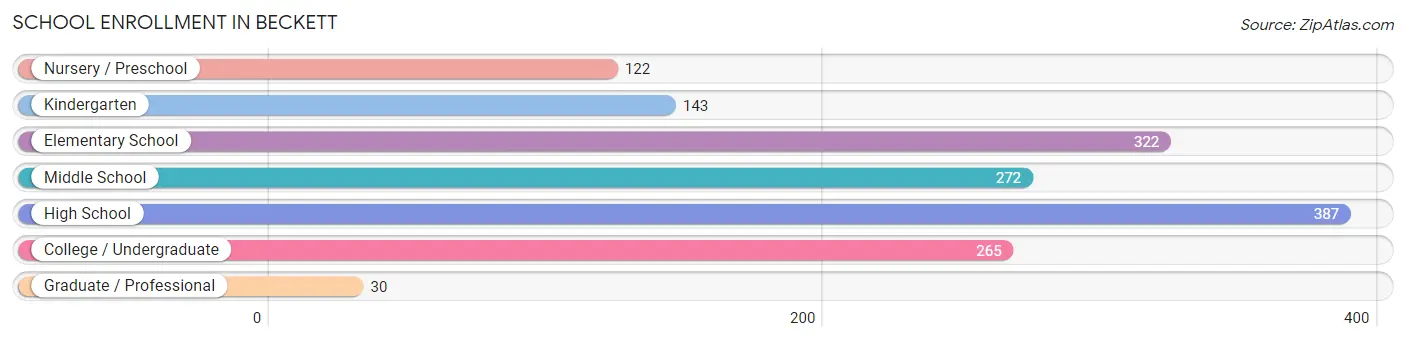
| School Level | # Students | % Students |
| Nursery / Preschool | 122 | 7.9% |
| Kindergarten | 143 | 9.3% |
| Elementary School | 322 | 20.9% |
| Middle School | 272 | 17.6% |
| High School | 387 | 25.1% |
| College / Undergraduate | 265 | 17.2% |
| Graduate / Professional | 30 | 1.9% |
| Total | 1,541 | 100.0% |
School Enrollment by Age by Funding Source in Beckett
Out of a total of 1,541 students who are enrolled in schools in Beckett, 280 (18.2%) attend a private institution, while the remaining 1,261 (81.8%) are enrolled in public schools. The age group of 18 to 19 year olds has the highest likelihood of being enrolled in private schools, with 46 (83.6% in the age bracket) enrolled. Conversely, the age group of 3 to 4 year olds has the lowest likelihood of being enrolled in a private school, with 79 (100.0% in the age bracket) attending a public institution.
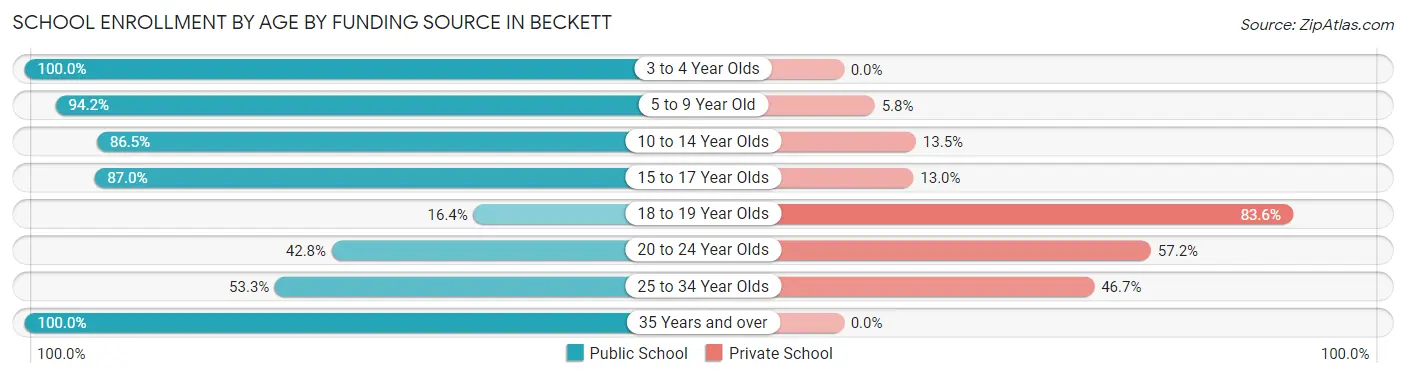
| Age Bracket | Public School | Private School |
| 3 to 4 Year Olds | 79 (100.0%) | 0 (0.0%) |
| 5 to 9 Year Old | 423 (94.2%) | 26 (5.8%) |
| 10 to 14 Year Olds | 328 (86.5%) | 51 (13.5%) |
| 15 to 17 Year Olds | 295 (87.0%) | 44 (13.0%) |
| 18 to 19 Year Olds | 9 (16.4%) | 46 (83.6%) |
| 20 to 24 Year Olds | 74 (42.8%) | 99 (57.2%) |
| 25 to 34 Year Olds | 16 (53.3%) | 14 (46.7%) |
| 35 Years and over | 37 (100.0%) | 0 (0.0%) |
| Total | 1,261 (81.8%) | 280 (18.2%) |
Educational Attainment by Field of Study in Beckett
Business (369 | 24.1%), education (243 | 15.9%), liberal arts & history (185 | 12.1%), science & technology (179 | 11.7%), and communications (146 | 9.6%) are the most common fields of study among 1,529 individuals in Beckett who have obtained a bachelor's degree or higher.
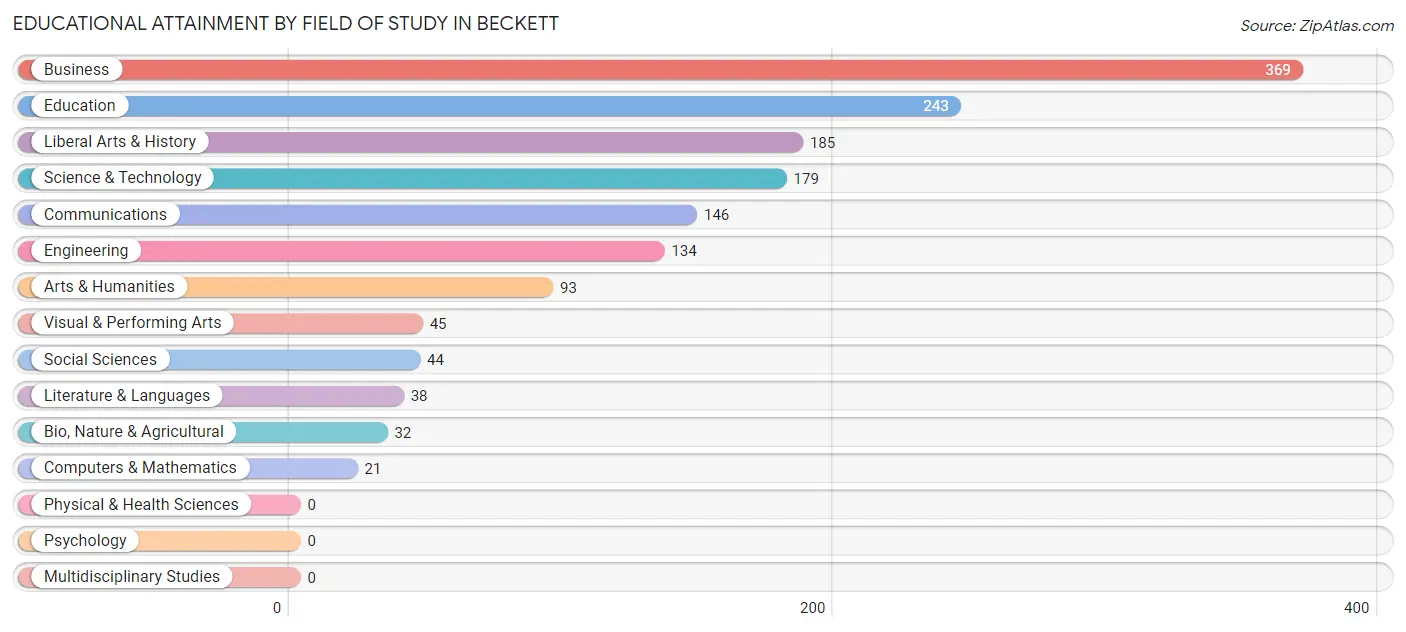
| Field of Study | # Graduates | % Graduates |
| Computers & Mathematics | 21 | 1.4% |
| Bio, Nature & Agricultural | 32 | 2.1% |
| Physical & Health Sciences | 0 | 0.0% |
| Psychology | 0 | 0.0% |
| Social Sciences | 44 | 2.9% |
| Engineering | 134 | 8.8% |
| Multidisciplinary Studies | 0 | 0.0% |
| Science & Technology | 179 | 11.7% |
| Business | 369 | 24.1% |
| Education | 243 | 15.9% |
| Literature & Languages | 38 | 2.5% |
| Liberal Arts & History | 185 | 12.1% |
| Visual & Performing Arts | 45 | 2.9% |
| Communications | 146 | 9.6% |
| Arts & Humanities | 93 | 6.1% |
| Total | 1,529 | 100.0% |
Transportation & Commute in Beckett
Vehicle Availability by Sex in Beckett
The most prevalent vehicle ownership categories in Beckett are males with 2 vehicles (969, accounting for 59.9%) and females with 2 vehicles (785, making up 70.8%).
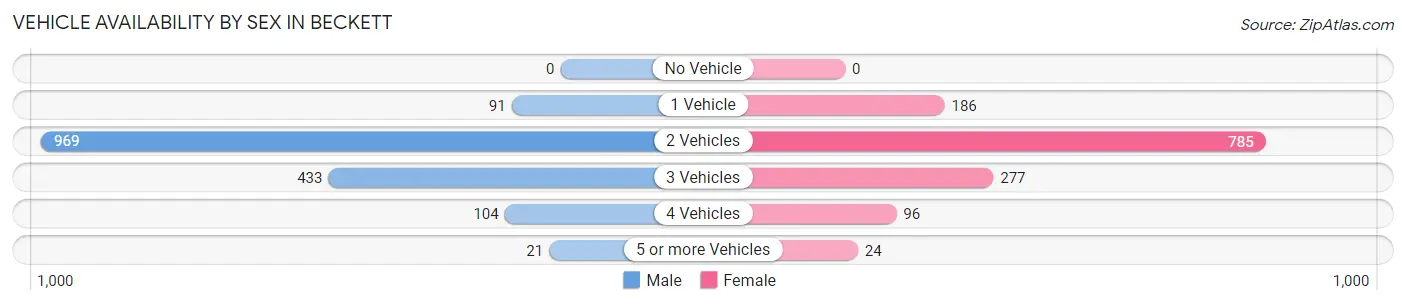
| Vehicles Available | Male | Female |
| No Vehicle | 0 (0.0%) | 0 (0.0%) |
| 1 Vehicle | 91 (5.6%) | 186 (13.6%) |
| 2 Vehicles | 969 (59.9%) | 785 (57.4%) |
| 3 Vehicles | 433 (26.8%) | 277 (20.3%) |
| 4 Vehicles | 104 (6.4%) | 96 (7.0%) |
| 5 or more Vehicles | 21 (1.3%) | 24 (1.8%) |
| Total | 1,618 (100.0%) | 1,368 (100.0%) |
Commute Time in Beckett
The most frequently occuring commute durations in Beckett are 30 to 34 minutes (477 commuters, 17.8%), 10 to 14 minutes (402 commuters, 15.0%), and 20 to 24 minutes (297 commuters, 11.1%).
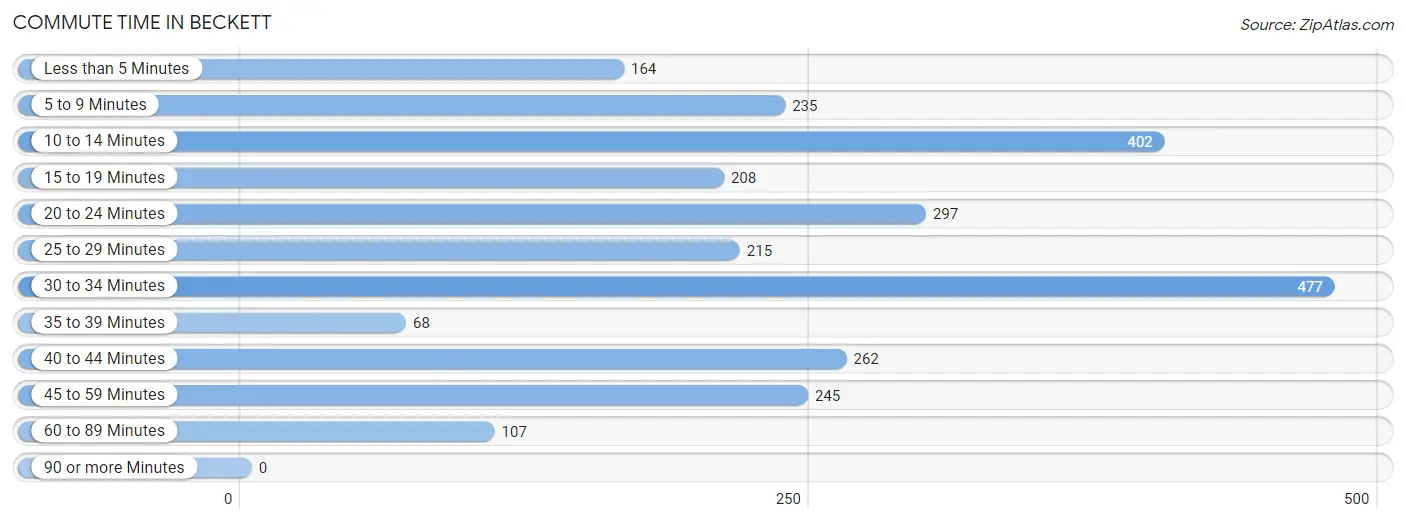
| Commute Time | # Commuters | % Commuters |
| Less than 5 Minutes | 164 | 6.1% |
| 5 to 9 Minutes | 235 | 8.8% |
| 10 to 14 Minutes | 402 | 15.0% |
| 15 to 19 Minutes | 208 | 7.8% |
| 20 to 24 Minutes | 297 | 11.1% |
| 25 to 29 Minutes | 215 | 8.0% |
| 30 to 34 Minutes | 477 | 17.8% |
| 35 to 39 Minutes | 68 | 2.5% |
| 40 to 44 Minutes | 262 | 9.8% |
| 45 to 59 Minutes | 245 | 9.1% |
| 60 to 89 Minutes | 107 | 4.0% |
| 90 or more Minutes | 0 | 0.0% |
Commute Time by Sex in Beckett
The most common commute times in Beckett are 40 to 44 minutes (262 commuters, 18.3%) for males and 30 to 34 minutes (257 commuters, 20.6%) for females.
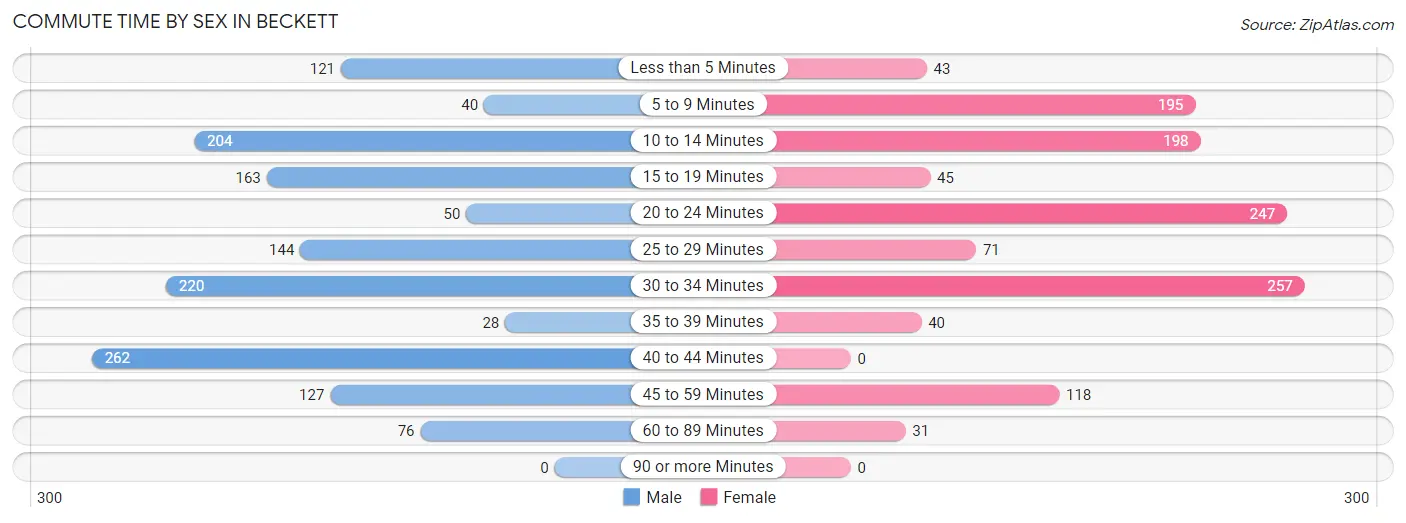
| Commute Time | Male | Female |
| Less than 5 Minutes | 121 (8.4%) | 43 (3.5%) |
| 5 to 9 Minutes | 40 (2.8%) | 195 (15.7%) |
| 10 to 14 Minutes | 204 (14.2%) | 198 (15.9%) |
| 15 to 19 Minutes | 163 (11.4%) | 45 (3.6%) |
| 20 to 24 Minutes | 50 (3.5%) | 247 (19.8%) |
| 25 to 29 Minutes | 144 (10.0%) | 71 (5.7%) |
| 30 to 34 Minutes | 220 (15.3%) | 257 (20.6%) |
| 35 to 39 Minutes | 28 (1.9%) | 40 (3.2%) |
| 40 to 44 Minutes | 262 (18.3%) | 0 (0.0%) |
| 45 to 59 Minutes | 127 (8.8%) | 118 (9.5%) |
| 60 to 89 Minutes | 76 (5.3%) | 31 (2.5%) |
| 90 or more Minutes | 0 (0.0%) | 0 (0.0%) |
Time of Departure to Work by Sex in Beckett
The most frequent times of departure to work in Beckett are 4:00 PM to 11:59 PM (254, 17.7%) for males and 7:30 AM to 7:59 AM (223, 17.9%) for females.
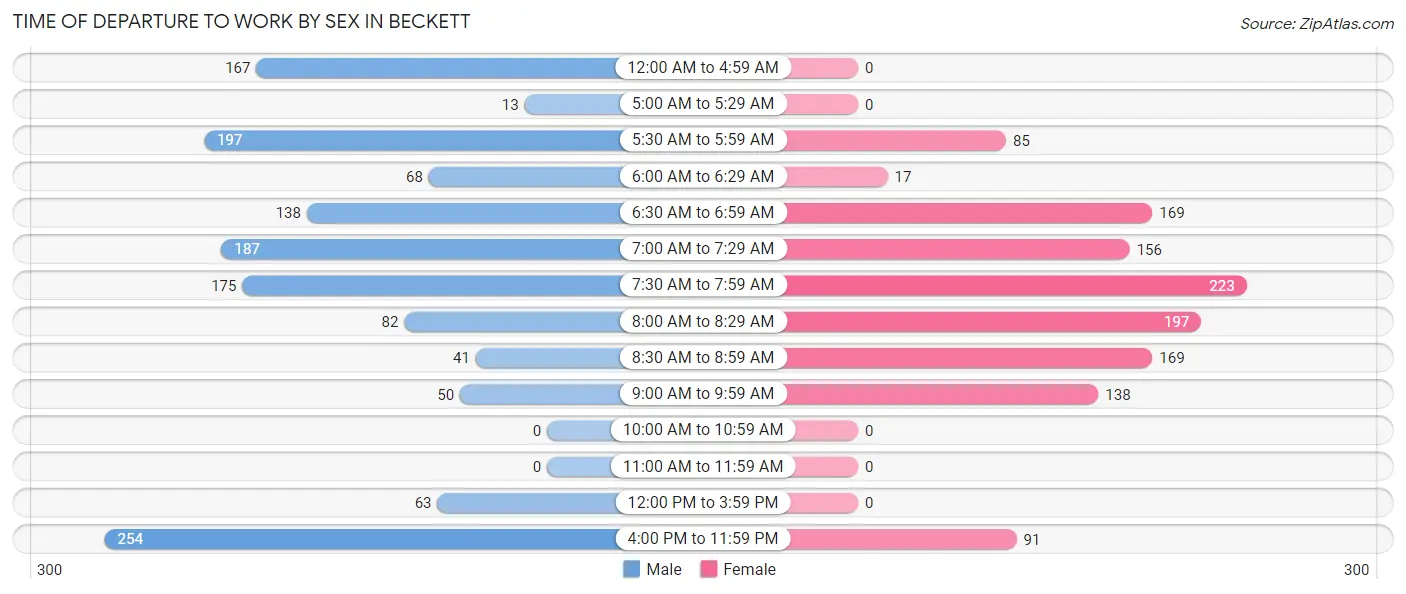
| Time of Departure | Male | Female |
| 12:00 AM to 4:59 AM | 167 (11.6%) | 0 (0.0%) |
| 5:00 AM to 5:29 AM | 13 (0.9%) | 0 (0.0%) |
| 5:30 AM to 5:59 AM | 197 (13.7%) | 85 (6.8%) |
| 6:00 AM to 6:29 AM | 68 (4.7%) | 17 (1.4%) |
| 6:30 AM to 6:59 AM | 138 (9.6%) | 169 (13.6%) |
| 7:00 AM to 7:29 AM | 187 (13.0%) | 156 (12.5%) |
| 7:30 AM to 7:59 AM | 175 (12.2%) | 223 (17.9%) |
| 8:00 AM to 8:29 AM | 82 (5.7%) | 197 (15.8%) |
| 8:30 AM to 8:59 AM | 41 (2.9%) | 169 (13.6%) |
| 9:00 AM to 9:59 AM | 50 (3.5%) | 138 (11.1%) |
| 10:00 AM to 10:59 AM | 0 (0.0%) | 0 (0.0%) |
| 11:00 AM to 11:59 AM | 0 (0.0%) | 0 (0.0%) |
| 12:00 PM to 3:59 PM | 63 (4.4%) | 0 (0.0%) |
| 4:00 PM to 11:59 PM | 254 (17.7%) | 91 (7.3%) |
| Total | 1,435 (100.0%) | 1,245 (100.0%) |
Housing Occupancy in Beckett
Occupancy by Ownership in Beckett
Of the total 1,945 dwellings in Beckett, owner-occupied units account for 1,905 (97.9%), while renter-occupied units make up 40 (2.1%).
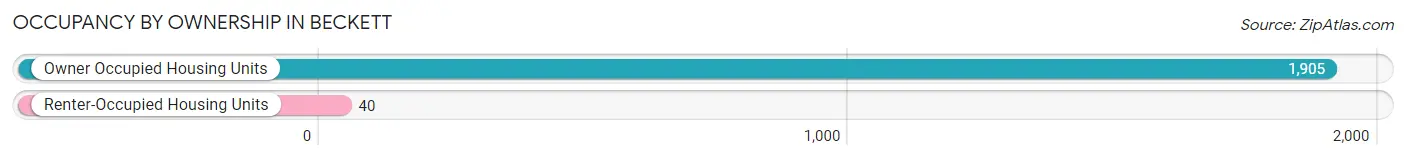
| Occupancy | # Housing Units | % Housing Units |
| Owner Occupied Housing Units | 1,905 | 97.9% |
| Renter-Occupied Housing Units | 40 | 2.1% |
| Total Occupied Housing Units | 1,945 | 100.0% |
Occupancy by Household Size in Beckett
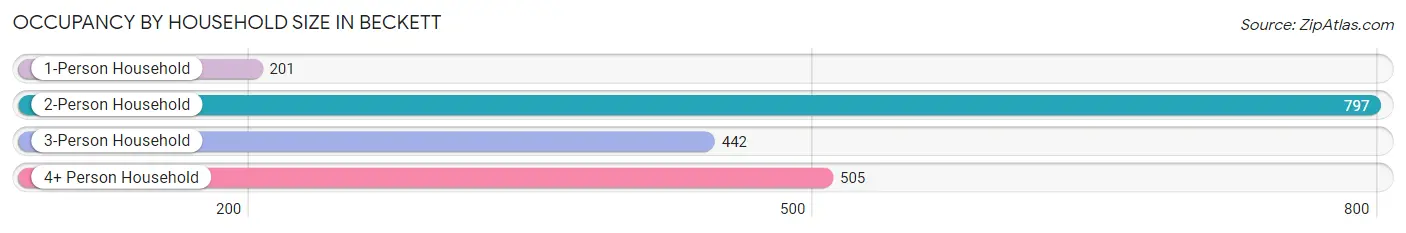
| Household Size | # Housing Units | % Housing Units |
| 1-Person Household | 201 | 10.3% |
| 2-Person Household | 797 | 41.0% |
| 3-Person Household | 442 | 22.7% |
| 4+ Person Household | 505 | 26.0% |
| Total Housing Units | 1,945 | 100.0% |
Occupancy by Ownership by Household Size in Beckett
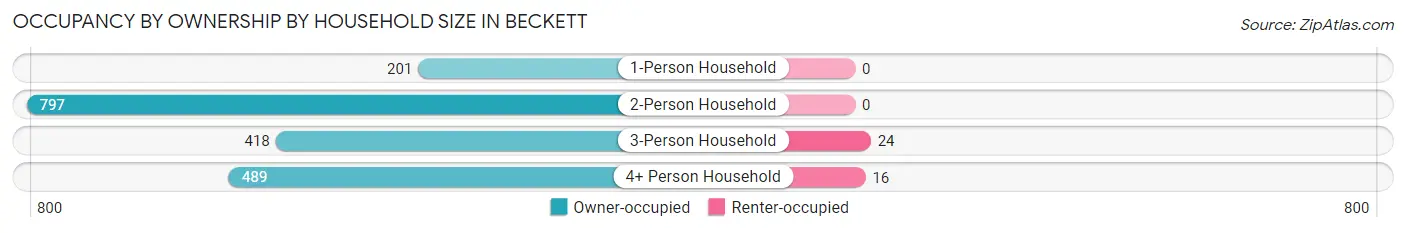
| Household Size | Owner-occupied | Renter-occupied |
| 1-Person Household | 201 (100.0%) | 0 (0.0%) |
| 2-Person Household | 797 (100.0%) | 0 (0.0%) |
| 3-Person Household | 418 (94.6%) | 24 (5.4%) |
| 4+ Person Household | 489 (96.8%) | 16 (3.2%) |
| Total Housing Units | 1,905 (97.9%) | 40 (2.1%) |
Occupancy by Educational Attainment in Beckett
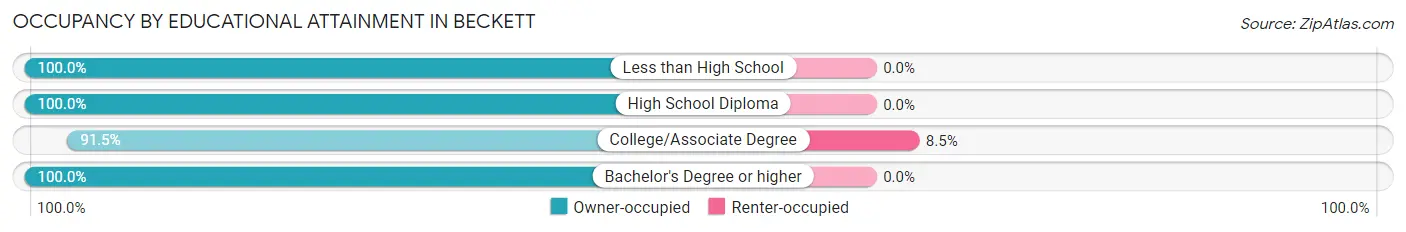
| Household Size | Owner-occupied | Renter-occupied |
| Less than High School | 51 (100.0%) | 0 (0.0%) |
| High School Diploma | 510 (100.0%) | 0 (0.0%) |
| College/Associate Degree | 432 (91.5%) | 40 (8.5%) |
| Bachelor's Degree or higher | 912 (100.0%) | 0 (0.0%) |
Occupancy by Age of Householder in Beckett
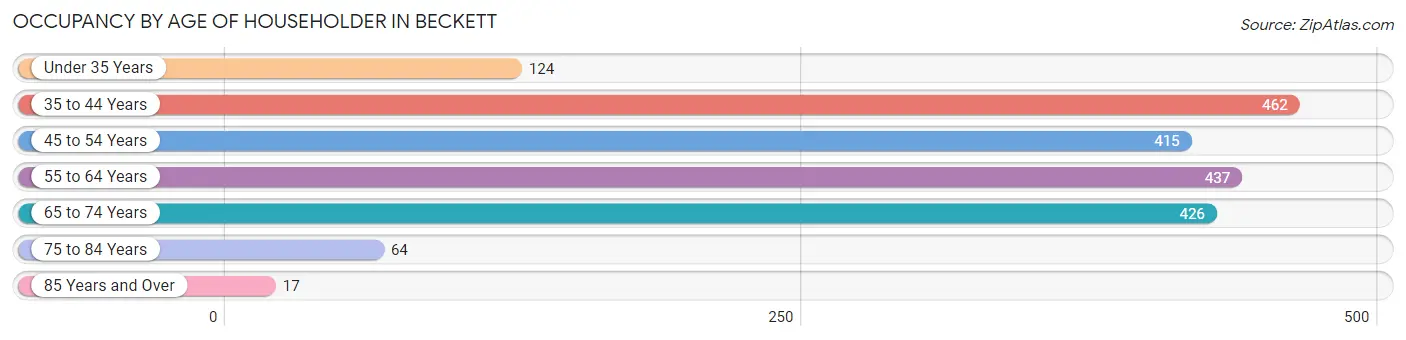
| Age Bracket | # Households | % Households |
| Under 35 Years | 124 | 6.4% |
| 35 to 44 Years | 462 | 23.7% |
| 45 to 54 Years | 415 | 21.3% |
| 55 to 64 Years | 437 | 22.5% |
| 65 to 74 Years | 426 | 21.9% |
| 75 to 84 Years | 64 | 3.3% |
| 85 Years and Over | 17 | 0.9% |
| Total | 1,945 | 100.0% |
Housing Finances in Beckett
Median Income by Occupancy in Beckett
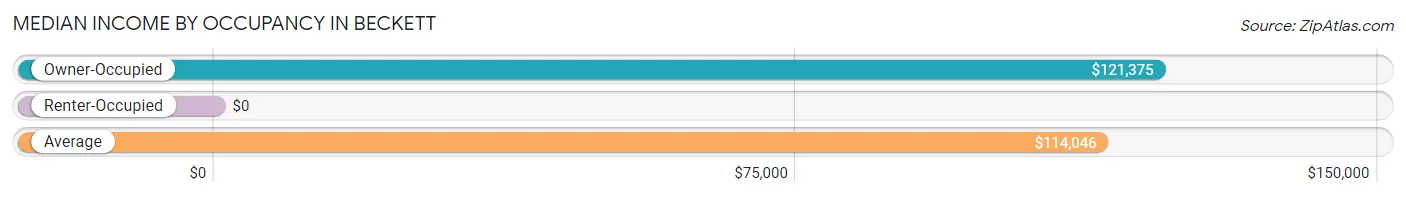
| Occupancy Type | # Households | Median Income |
| Owner-Occupied | 1,905 (97.9%) | $121,375 |
| Renter-Occupied | 40 (2.1%) | $0 |
| Average | 1,945 (100.0%) | $114,046 |
Occupancy by Householder Income Bracket in Beckett
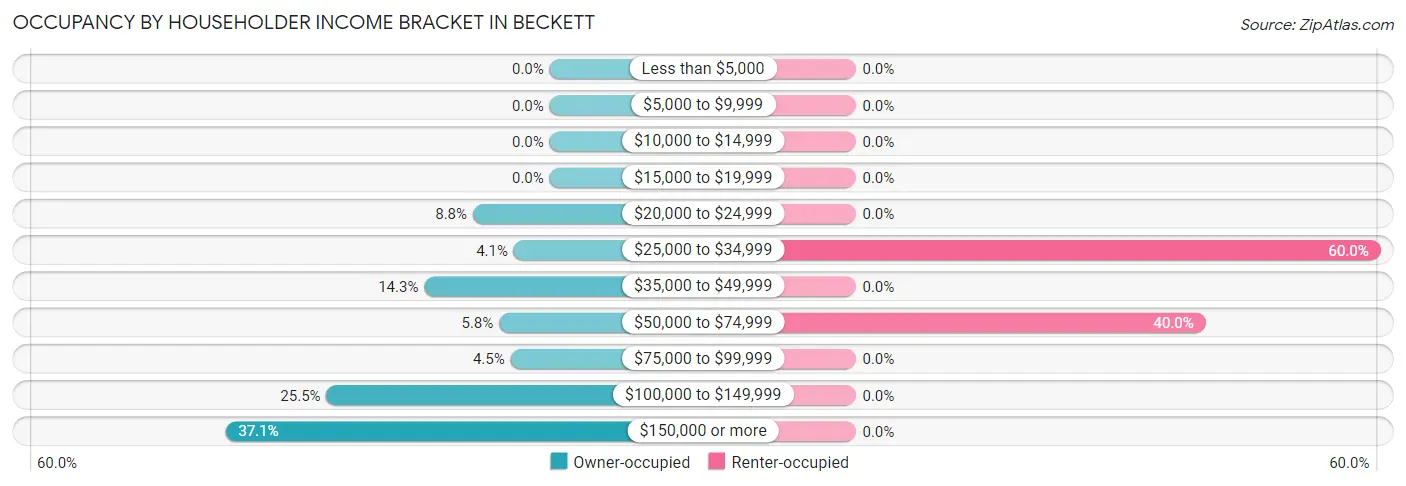
| Income Bracket | Owner-occupied | Renter-occupied |
| Less than $5,000 | 0 (0.0%) | 0 (0.0%) |
| $5,000 to $9,999 | 0 (0.0%) | 0 (0.0%) |
| $10,000 to $14,999 | 0 (0.0%) | 0 (0.0%) |
| $15,000 to $19,999 | 0 (0.0%) | 0 (0.0%) |
| $20,000 to $24,999 | 167 (8.8%) | 0 (0.0%) |
| $25,000 to $34,999 | 78 (4.1%) | 24 (60.0%) |
| $35,000 to $49,999 | 273 (14.3%) | 0 (0.0%) |
| $50,000 to $74,999 | 110 (5.8%) | 16 (40.0%) |
| $75,000 to $99,999 | 85 (4.5%) | 0 (0.0%) |
| $100,000 to $149,999 | 486 (25.5%) | 0 (0.0%) |
| $150,000 or more | 706 (37.1%) | 0 (0.0%) |
| Total | 1,905 (100.0%) | 40 (100.0%) |
Monthly Housing Cost Tiers in Beckett
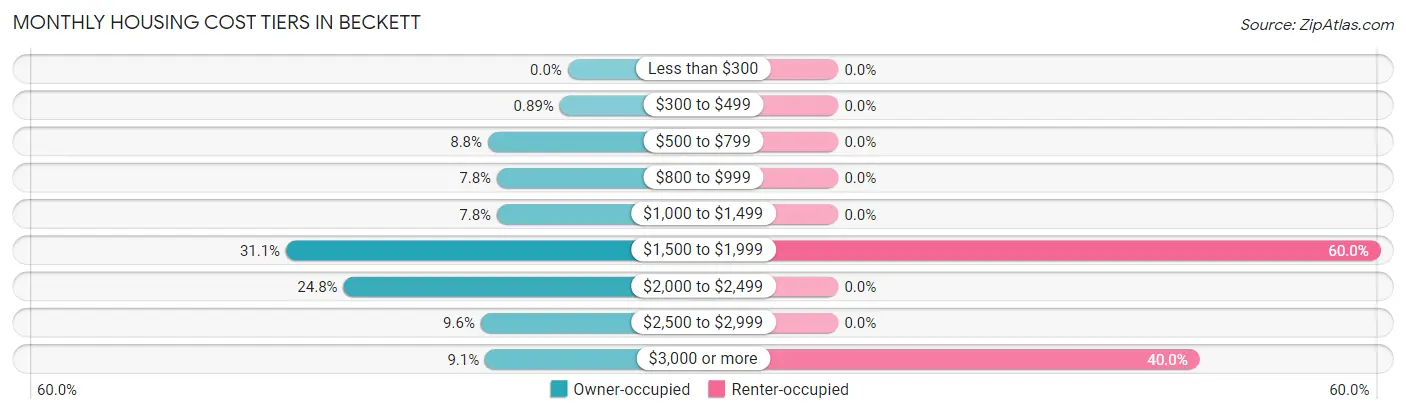
| Monthly Cost | Owner-occupied | Renter-occupied |
| Less than $300 | 0 (0.0%) | 0 (0.0%) |
| $300 to $499 | 17 (0.9%) | 0 (0.0%) |
| $500 to $799 | 168 (8.8%) | 0 (0.0%) |
| $800 to $999 | 149 (7.8%) | 0 (0.0%) |
| $1,000 to $1,499 | 149 (7.8%) | 0 (0.0%) |
| $1,500 to $1,999 | 593 (31.1%) | 24 (60.0%) |
| $2,000 to $2,499 | 472 (24.8%) | 0 (0.0%) |
| $2,500 to $2,999 | 183 (9.6%) | 0 (0.0%) |
| $3,000 or more | 174 (9.1%) | 16 (40.0%) |
| Total | 1,905 (100.0%) | 40 (100.0%) |
Physical Housing Characteristics in Beckett
Housing Structures in Beckett
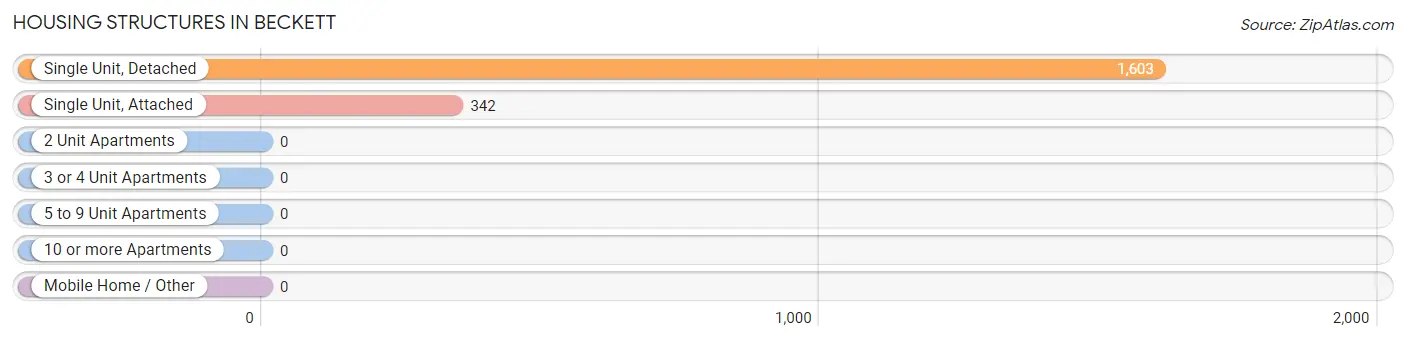
| Structure Type | # Housing Units | % Housing Units |
| Single Unit, Detached | 1,603 | 82.4% |
| Single Unit, Attached | 342 | 17.6% |
| 2 Unit Apartments | 0 | 0.0% |
| 3 or 4 Unit Apartments | 0 | 0.0% |
| 5 to 9 Unit Apartments | 0 | 0.0% |
| 10 or more Apartments | 0 | 0.0% |
| Mobile Home / Other | 0 | 0.0% |
| Total | 1,945 | 100.0% |
Housing Structures by Occupancy in Beckett
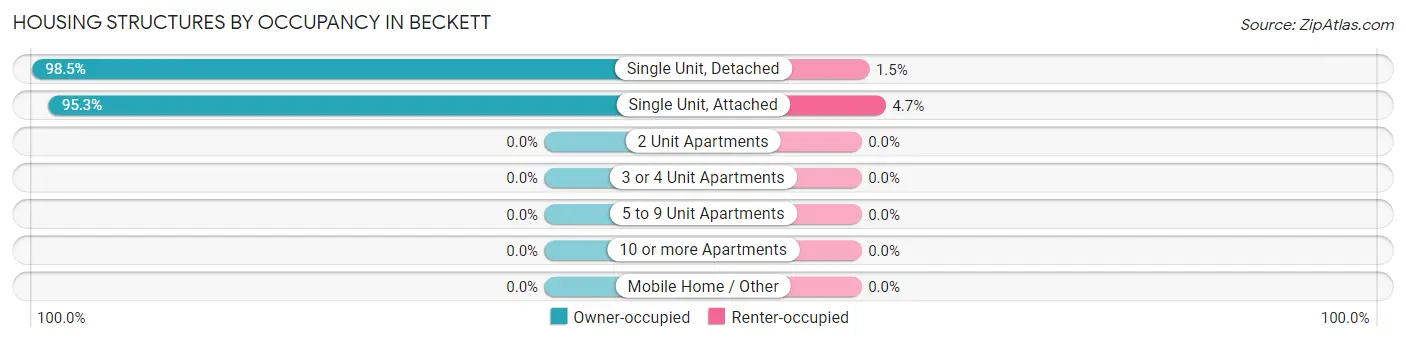
| Structure Type | Owner-occupied | Renter-occupied |
| Single Unit, Detached | 1,579 (98.5%) | 24 (1.5%) |
| Single Unit, Attached | 326 (95.3%) | 16 (4.7%) |
| 2 Unit Apartments | 0 (0.0%) | 0 (0.0%) |
| 3 or 4 Unit Apartments | 0 (0.0%) | 0 (0.0%) |
| 5 to 9 Unit Apartments | 0 (0.0%) | 0 (0.0%) |
| 10 or more Apartments | 0 (0.0%) | 0 (0.0%) |
| Mobile Home / Other | 0 (0.0%) | 0 (0.0%) |
| Total | 1,905 (97.9%) | 40 (2.1%) |
Housing Structures by Number of Rooms in Beckett
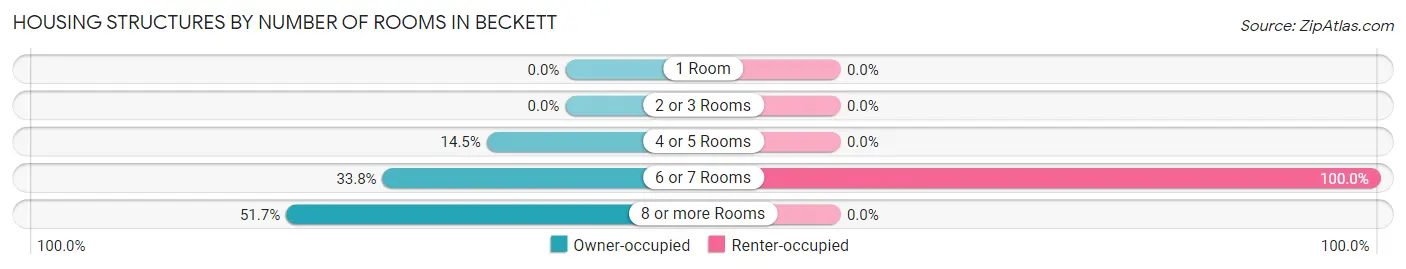
| Number of Rooms | Owner-occupied | Renter-occupied |
| 1 Room | 0 (0.0%) | 0 (0.0%) |
| 2 or 3 Rooms | 0 (0.0%) | 0 (0.0%) |
| 4 or 5 Rooms | 277 (14.5%) | 0 (0.0%) |
| 6 or 7 Rooms | 644 (33.8%) | 40 (100.0%) |
| 8 or more Rooms | 984 (51.6%) | 0 (0.0%) |
| Total | 1,905 (100.0%) | 40 (100.0%) |
Housing Structure by Heating Type in Beckett
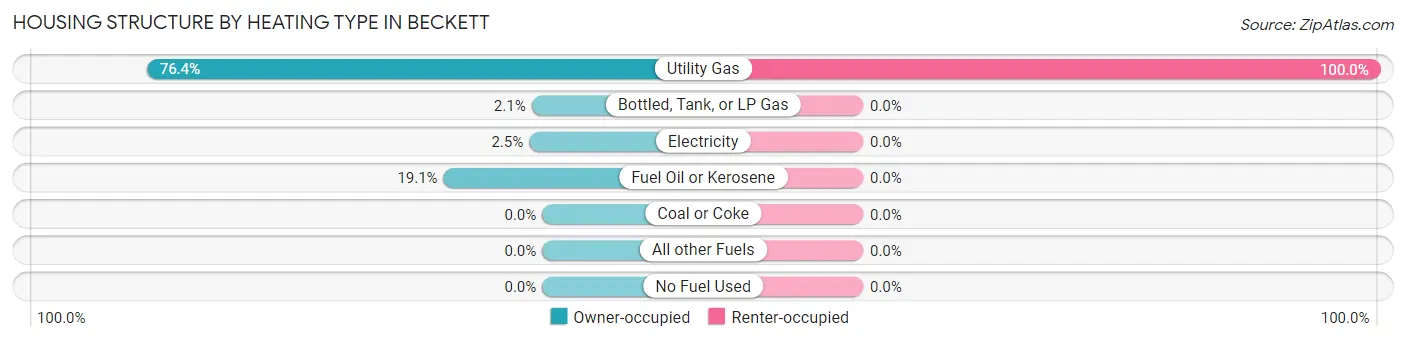
| Heating Type | Owner-occupied | Renter-occupied |
| Utility Gas | 1,455 (76.4%) | 40 (100.0%) |
| Bottled, Tank, or LP Gas | 39 (2.1%) | 0 (0.0%) |
| Electricity | 48 (2.5%) | 0 (0.0%) |
| Fuel Oil or Kerosene | 363 (19.1%) | 0 (0.0%) |
| Coal or Coke | 0 (0.0%) | 0 (0.0%) |
| All other Fuels | 0 (0.0%) | 0 (0.0%) |
| No Fuel Used | 0 (0.0%) | 0 (0.0%) |
| Total | 1,905 (100.0%) | 40 (100.0%) |
Household Vehicle Usage in Beckett
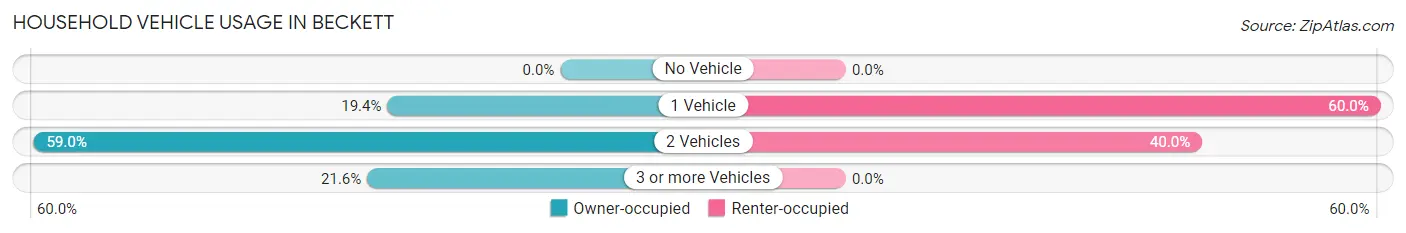
| Vehicles per Household | Owner-occupied | Renter-occupied |
| No Vehicle | 0 (0.0%) | 0 (0.0%) |
| 1 Vehicle | 369 (19.4%) | 24 (60.0%) |
| 2 Vehicles | 1,124 (59.0%) | 16 (40.0%) |
| 3 or more Vehicles | 412 (21.6%) | 0 (0.0%) |
| Total | 1,905 (100.0%) | 40 (100.0%) |
Real Estate & Mortgages in Beckett
Real Estate and Mortgage Overview in Beckett
| Characteristic | Without Mortgage | With Mortgage |
| Housing Units | 484 | 1,421 |
| Median Property Value | $297,900 | $263,800 |
| Median Household Income | - | - |
| Monthly Housing Costs | $888 | $174 |
| Real Estate Taxes | $5,167 | $0 |
Property Value by Mortgage Status in Beckett
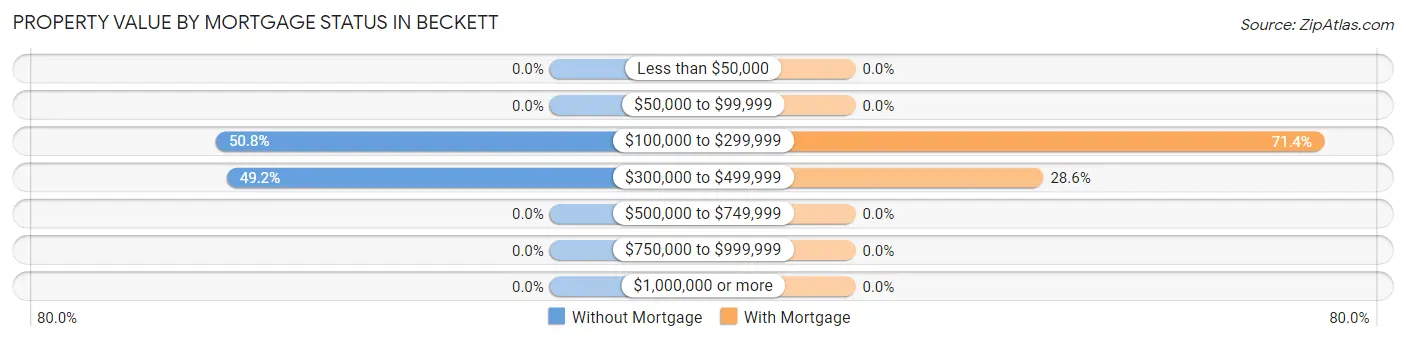
| Property Value | Without Mortgage | With Mortgage |
| Less than $50,000 | 0 (0.0%) | 0 (0.0%) |
| $50,000 to $99,999 | 0 (0.0%) | 0 (0.0%) |
| $100,000 to $299,999 | 246 (50.8%) | 1,014 (71.4%) |
| $300,000 to $499,999 | 238 (49.2%) | 407 (28.6%) |
| $500,000 to $749,999 | 0 (0.0%) | 0 (0.0%) |
| $750,000 to $999,999 | 0 (0.0%) | 0 (0.0%) |
| $1,000,000 or more | 0 (0.0%) | 0 (0.0%) |
| Total | 484 (100.0%) | 1,421 (100.0%) |
Household Income by Mortgage Status in Beckett
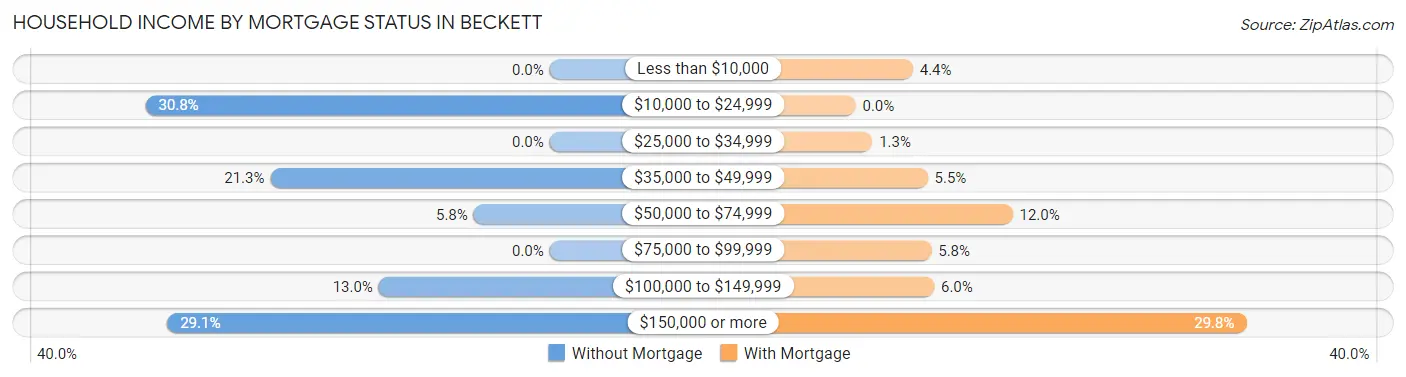
| Household Income | Without Mortgage | With Mortgage |
| Less than $10,000 | 0 (0.0%) | 62 (4.4%) |
| $10,000 to $24,999 | 149 (30.8%) | 0 (0.0%) |
| $25,000 to $34,999 | 0 (0.0%) | 18 (1.3%) |
| $35,000 to $49,999 | 103 (21.3%) | 78 (5.5%) |
| $50,000 to $74,999 | 28 (5.8%) | 170 (12.0%) |
| $75,000 to $99,999 | 0 (0.0%) | 82 (5.8%) |
| $100,000 to $149,999 | 63 (13.0%) | 85 (6.0%) |
| $150,000 or more | 141 (29.1%) | 423 (29.8%) |
| Total | 484 (100.0%) | 1,421 (100.0%) |
Property Value to Household Income Ratio in Beckett
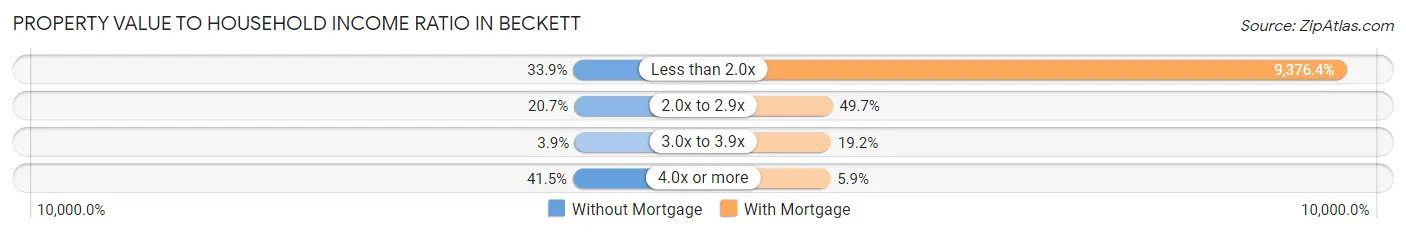
| Value-to-Income Ratio | Without Mortgage | With Mortgage |
| Less than 2.0x | 164 (33.9%) | 133,239 (9,376.4%) |
| 2.0x to 2.9x | 100 (20.7%) | 706 (49.7%) |
| 3.0x to 3.9x | 19 (3.9%) | 273 (19.2%) |
| 4.0x or more | 201 (41.5%) | 84 (5.9%) |
| Total | 484 (100.0%) | 1,421 (100.0%) |
Real Estate Taxes by Mortgage Status in Beckett
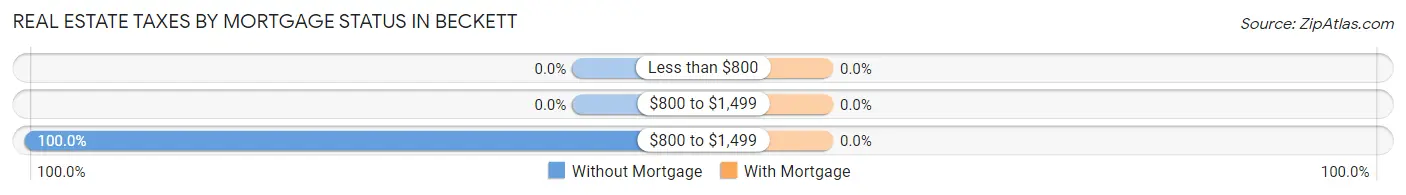
| Property Taxes | Without Mortgage | With Mortgage |
| Less than $800 | 0 (0.0%) | 0 (0.0%) |
| $800 to $1,499 | 0 (0.0%) | 0 (0.0%) |
| $800 to $1,499 | 484 (100.0%) | 0 (0.0%) |
| Total | 484 (100.0%) | 1,421 (100.0%) |
Health & Disability in Beckett
Health Insurance Coverage by Age in Beckett
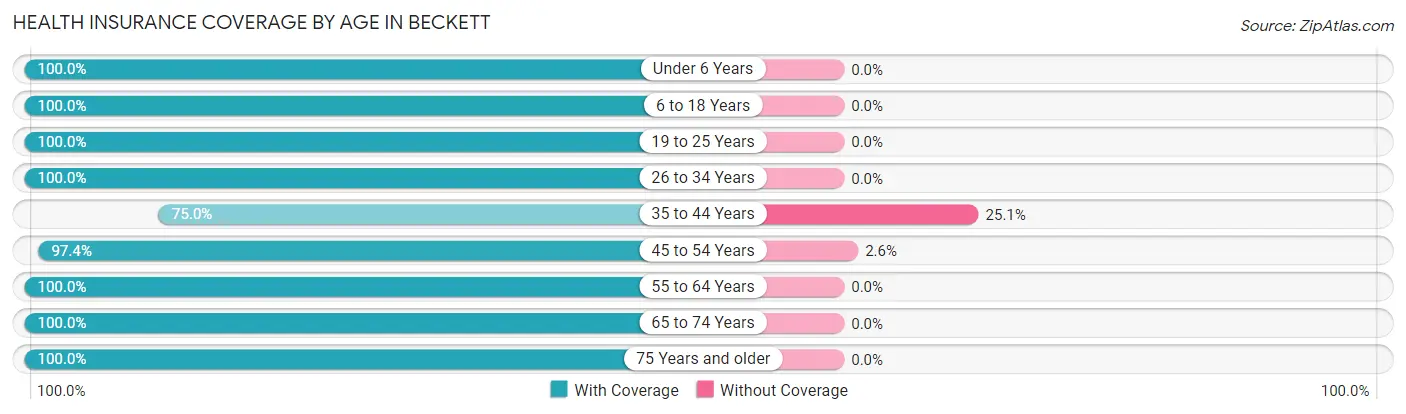
| Age Bracket | With Coverage | Without Coverage |
| Under 6 Years | 413 (100.0%) | 0 (0.0%) |
| 6 to 18 Years | 1,008 (100.0%) | 0 (0.0%) |
| 19 to 25 Years | 409 (100.0%) | 0 (0.0%) |
| 26 to 34 Years | 364 (100.0%) | 0 (0.0%) |
| 35 to 44 Years | 754 (75.0%) | 252 (25.1%) |
| 45 to 54 Years | 749 (97.4%) | 20 (2.6%) |
| 55 to 64 Years | 766 (100.0%) | 0 (0.0%) |
| 65 to 74 Years | 631 (100.0%) | 0 (0.0%) |
| 75 Years and older | 115 (100.0%) | 0 (0.0%) |
| Total | 5,209 (95.0%) | 272 (5.0%) |
Health Insurance Coverage by Citizenship Status in Beckett
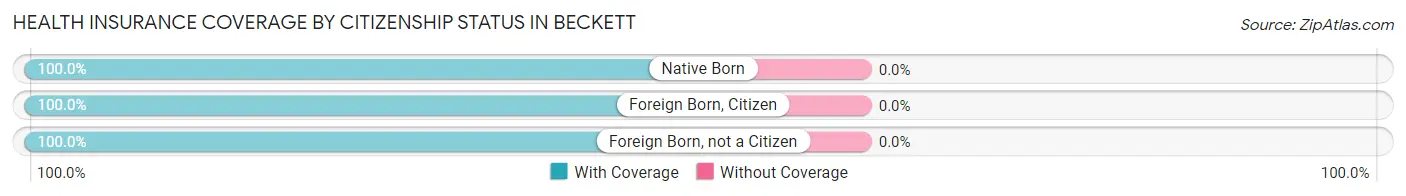
| Citizenship Status | With Coverage | Without Coverage |
| Native Born | 413 (100.0%) | 0 (0.0%) |
| Foreign Born, Citizen | 1,008 (100.0%) | 0 (0.0%) |
| Foreign Born, not a Citizen | 409 (100.0%) | 0 (0.0%) |
Health Insurance Coverage by Household Income in Beckett
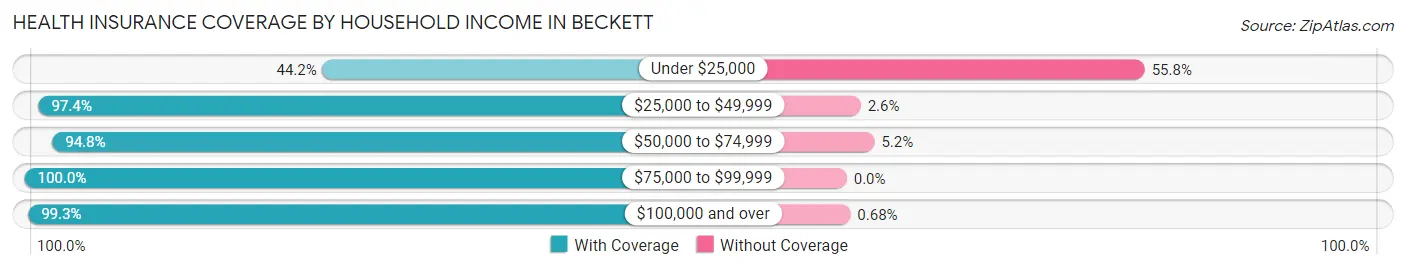
| Household Income | With Coverage | Without Coverage |
| Under $25,000 | 167 (44.2%) | 211 (55.8%) |
| $25,000 to $49,999 | 746 (97.4%) | 20 (2.6%) |
| $50,000 to $74,999 | 274 (94.8%) | 15 (5.2%) |
| $75,000 to $99,999 | 224 (100.0%) | 0 (0.0%) |
| $100,000 and over | 3,798 (99.3%) | 26 (0.7%) |
Public vs Private Health Insurance Coverage by Age in Beckett
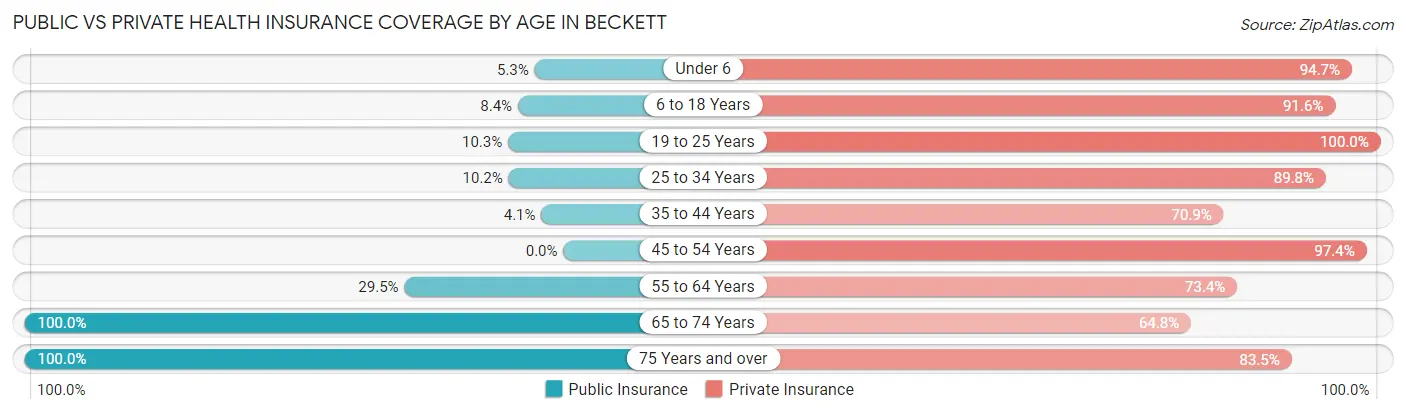
| Age Bracket | Public Insurance | Private Insurance |
| Under 6 | 22 (5.3%) | 391 (94.7%) |
| 6 to 18 Years | 85 (8.4%) | 923 (91.6%) |
| 19 to 25 Years | 42 (10.3%) | 409 (100.0%) |
| 25 to 34 Years | 37 (10.2%) | 327 (89.8%) |
| 35 to 44 Years | 41 (4.1%) | 713 (70.9%) |
| 45 to 54 Years | 0 (0.0%) | 749 (97.4%) |
| 55 to 64 Years | 226 (29.5%) | 562 (73.4%) |
| 65 to 74 Years | 631 (100.0%) | 409 (64.8%) |
| 75 Years and over | 115 (100.0%) | 96 (83.5%) |
| Total | 1,199 (21.9%) | 4,579 (83.5%) |
Disability Status by Sex by Age in Beckett
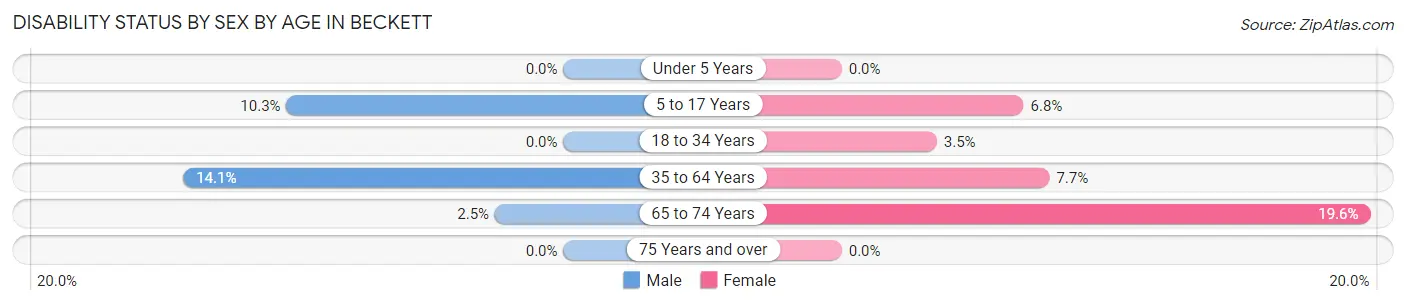
| Age Bracket | Male | Female |
| Under 5 Years | 0 (0.0%) | 0 (0.0%) |
| 5 to 17 Years | 59 (10.3%) | 40 (6.8%) |
| 18 to 34 Years | 0 (0.0%) | 17 (3.5%) |
| 35 to 64 Years | 203 (14.1%) | 85 (7.7%) |
| 65 to 74 Years | 8 (2.5%) | 62 (19.6%) |
| 75 Years and over | 0 (0.0%) | 0 (0.0%) |
Disability Class by Sex by Age in Beckett
Disability Class: Hearing Difficulty
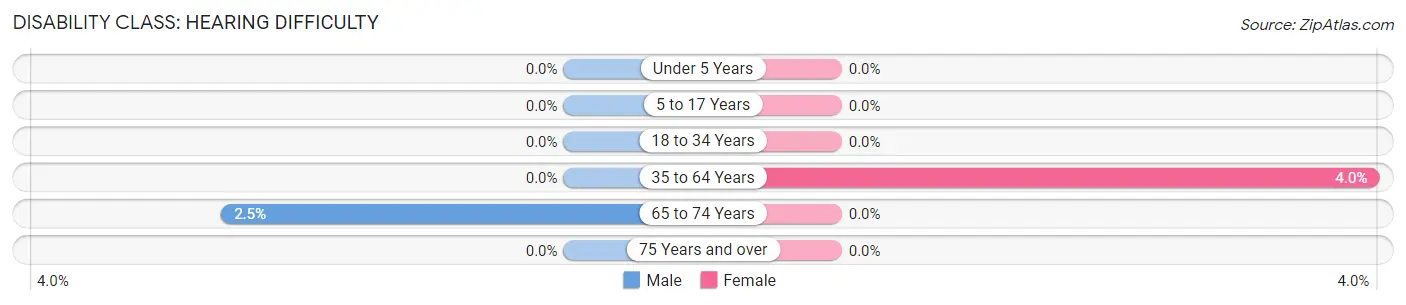
| Age Bracket | Male | Female |
| Under 5 Years | 0 (0.0%) | 0 (0.0%) |
| 5 to 17 Years | 0 (0.0%) | 0 (0.0%) |
| 18 to 34 Years | 0 (0.0%) | 0 (0.0%) |
| 35 to 64 Years | 0 (0.0%) | 44 (4.0%) |
| 65 to 74 Years | 8 (2.5%) | 0 (0.0%) |
| 75 Years and over | 0 (0.0%) | 0 (0.0%) |
Disability Class: Vision Difficulty
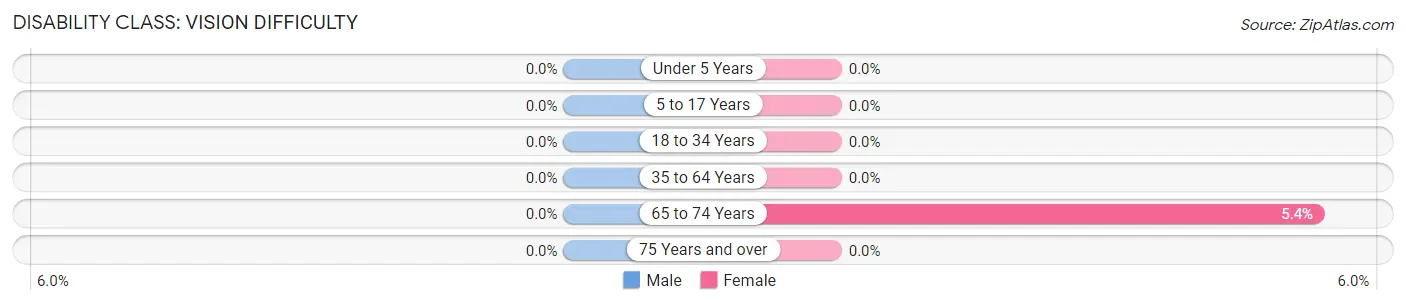
| Age Bracket | Male | Female |
| Under 5 Years | 0 (0.0%) | 0 (0.0%) |
| 5 to 17 Years | 0 (0.0%) | 0 (0.0%) |
| 18 to 34 Years | 0 (0.0%) | 0 (0.0%) |
| 35 to 64 Years | 0 (0.0%) | 0 (0.0%) |
| 65 to 74 Years | 0 (0.0%) | 17 (5.4%) |
| 75 Years and over | 0 (0.0%) | 0 (0.0%) |
Disability Class: Cognitive Difficulty
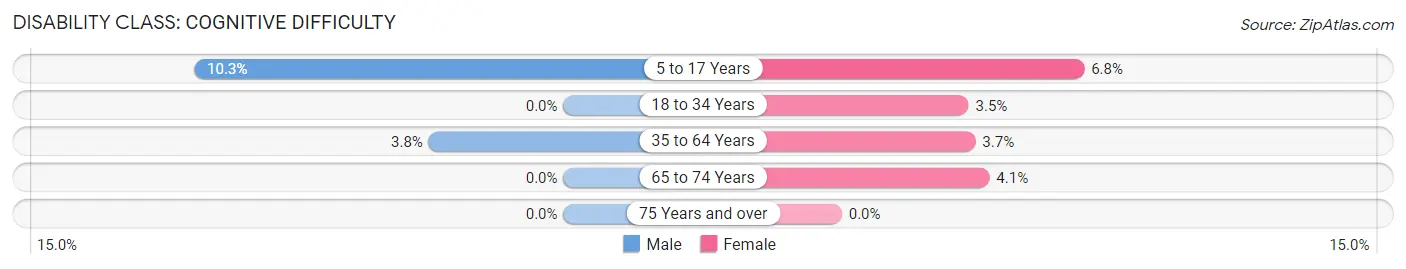
| Age Bracket | Male | Female |
| 5 to 17 Years | 59 (10.3%) | 40 (6.8%) |
| 18 to 34 Years | 0 (0.0%) | 17 (3.5%) |
| 35 to 64 Years | 54 (3.7%) | 41 (3.7%) |
| 65 to 74 Years | 0 (0.0%) | 13 (4.1%) |
| 75 Years and over | 0 (0.0%) | 0 (0.0%) |
Disability Class: Ambulatory Difficulty
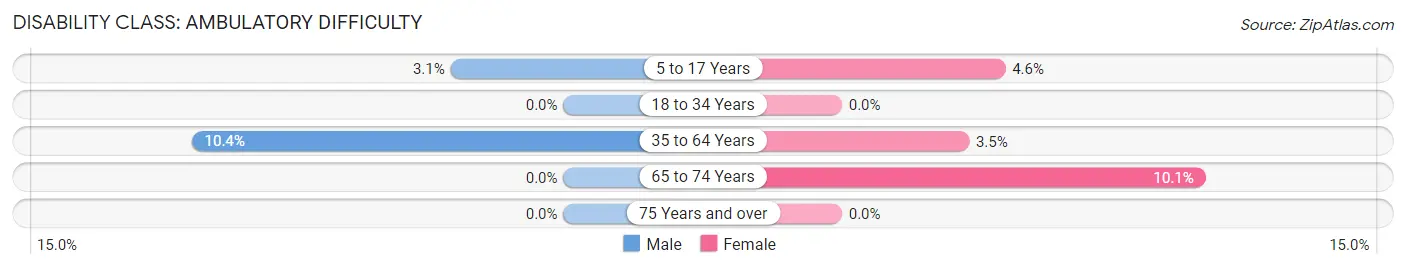
| Age Bracket | Male | Female |
| 5 to 17 Years | 18 (3.1%) | 27 (4.5%) |
| 18 to 34 Years | 0 (0.0%) | 0 (0.0%) |
| 35 to 64 Years | 149 (10.3%) | 39 (3.5%) |
| 65 to 74 Years | 0 (0.0%) | 32 (10.1%) |
| 75 Years and over | 0 (0.0%) | 0 (0.0%) |
Disability Class: Self-Care Difficulty
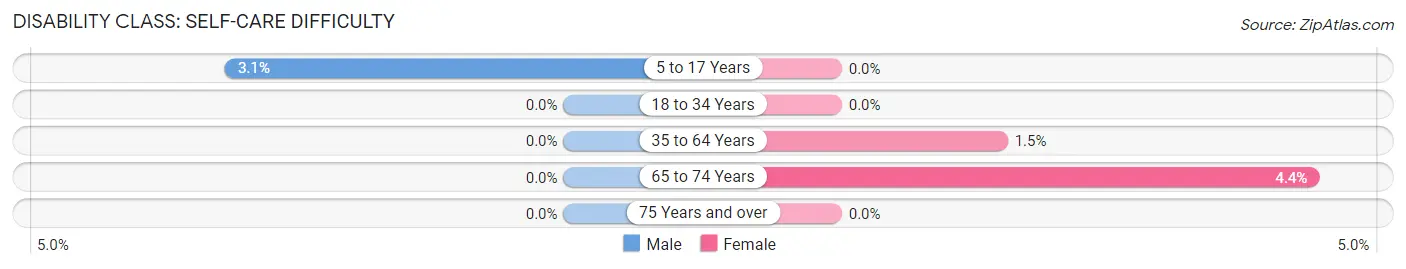
| Age Bracket | Male | Female |
| 5 to 17 Years | 18 (3.1%) | 0 (0.0%) |
| 18 to 34 Years | 0 (0.0%) | 0 (0.0%) |
| 35 to 64 Years | 0 (0.0%) | 17 (1.5%) |
| 65 to 74 Years | 0 (0.0%) | 14 (4.4%) |
| 75 Years and over | 0 (0.0%) | 0 (0.0%) |
Technology Access in Beckett
Computing Device Access in Beckett
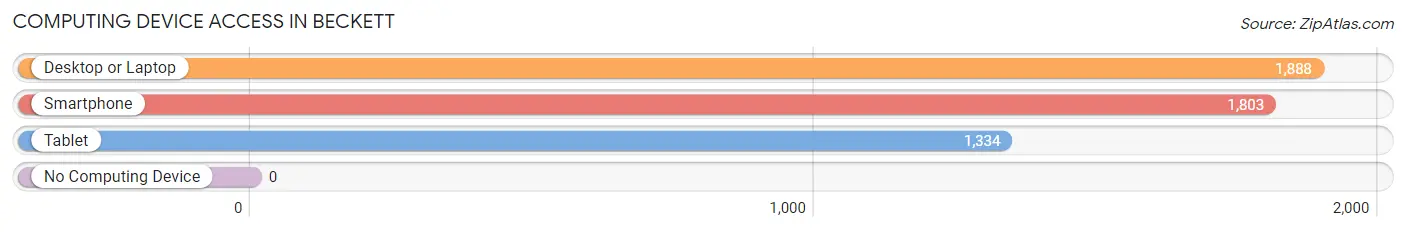
| Device Type | # Households | % Households |
| Desktop or Laptop | 1,888 | 97.1% |
| Smartphone | 1,803 | 92.7% |
| Tablet | 1,334 | 68.6% |
| No Computing Device | 0 | 0.0% |
| Total | 1,945 | 100.0% |
Internet Access in Beckett
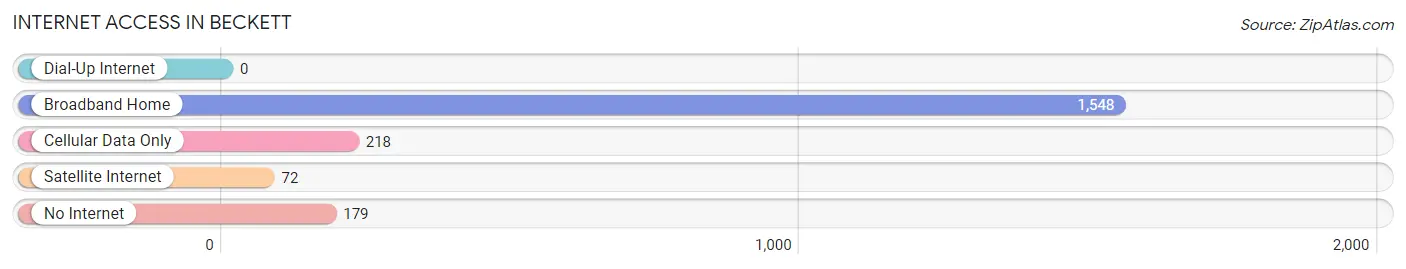
| Internet Type | # Households | % Households |
| Dial-Up Internet | 0 | 0.0% |
| Broadband Home | 1,548 | 79.6% |
| Cellular Data Only | 218 | 11.2% |
| Satellite Internet | 72 | 3.7% |
| No Internet | 179 | 9.2% |
| Total | 1,945 | 100.0% |
Beckett Summary
New Jersey, commonly referred to as the Garden State, is a state located in the Northeastern and Mid-Atlantic regions of the United States. It is bordered by New York to the north and east, Pennsylvania to the west, and Delaware to the south. The state is named after the island of Jersey in the English Channel.
History
The area that is now New Jersey was first inhabited by Native Americans, including the Lenape, Hackensack, and Raritan tribes. The first European settlers arrived in the area in the early 1600s, when Dutch and Swedish colonists established trading posts and settlements. In 1664, the English took control of the area and renamed it New Jersey after the island of Jersey in the English Channel.
During the American Revolution, New Jersey was a key battleground state, with several major battles taking place in the state. After the war, New Jersey became the third state to ratify the United States Constitution in 1787.
Geography
New Jersey is located in the Northeastern and Mid-Atlantic regions of the United States. It is bordered by New York to the north and east, Pennsylvania to the west, and Delaware to the south. The state is divided into 21 counties and contains 565 municipalities.
The state has a total area of 8,722 square miles, making it the 47th largest state in the country. The highest point in the state is High Point, located in Sussex County, which has an elevation of 1,803 feet. The state is home to several major rivers, including the Delaware, Passaic, and Raritan.
Economy
New Jersey has a diverse economy that is driven by several industries, including pharmaceuticals, finance, manufacturing, and tourism. The state is home to several major corporations, including Johnson & Johnson, Prudential Financial, and Merck & Co.
The state’s gross domestic product (GDP) was estimated at $541.3 billion in 2019, making it the 11th largest economy in the United States. The state’s unemployment rate was 4.2% in 2019, which was lower than the national average of 3.7%.
Demographics
As of 2019, New Jersey had an estimated population of 8,882,190, making it the 11th most populous state in the country. The state has a population density of 1,210 people per square mile, making it the most densely populated state in the country.
The largest racial group in the state is White, making up 58.2% of the population. Other racial groups include African American (15.4%), Hispanic or Latino (19.2%), Asian (9.2%), and Native American (0.4%). The largest ancestry groups in the state are Italian (17.2%), Irish (15.2%), German (13.2%), and Polish (7.2%).
The median household income in the state was $80,088 in 2019, which was higher than the national average of $68,703. The poverty rate in the state was 9.7%, which was lower than the national average of 11.8%.
Common Questions
What is the Total Population of Beckett?
Total Population of Beckett is 5,496.
What is the Total Male Population of Beckett?
Total Male Population of Beckett is 2,782.
What is the Total Female Population of Beckett?
Total Female Population of Beckett is 2,714.
What is the Ratio of Males per 100 Females in Beckett?
There are 102.51 Males per 100 Females in Beckett.
What is the Ratio of Females per 100 Males in Beckett?
There are 97.56 Females per 100 Males in Beckett.
What is the Median Population Age in Beckett?
Median Population Age in Beckett is 42.0 Years.
What is the Average Family Size in Beckett
Average Family Size in Beckett is 3.1 People.
What is the Average Household Size in Beckett
Average Household Size in Beckett is 2.8 People.
What is Per Capita Income in Beckett?
Per Capita income in Beckett is $47,073.
What is the Median Family Income in Beckett?
Median Family Income in Beckett is $142,784.
What is the Median Household income in Beckett?
Median Household Income in Beckett is $114,046.
What is Income or Wage Gap in Beckett?
Income or Wage Gap in Beckett is 33.6%.
Women in Beckett earn 66.4 cents for every dollar earned by a man.
What is Inequality or Gini Index in Beckett?
Inequality or Gini Index in Beckett is 0.40.
How Large is the Labor Force in Beckett?
There are 3,225 People in the Labor Forcein in Beckett.
What is the Percentage of People in the Labor Force in Beckett?
74.3% of People are in the Labor Force in Beckett.
What is the Unemployment Rate in Beckett?
Unemployment Rate in Beckett is 4.4%.