Cities with the Highest Percentage of Families with Income Below $10,000 in Kentucky
RELATED REPORTS & OPTIONS
Family Income | $0-10k
Kentucky
Compare Cities
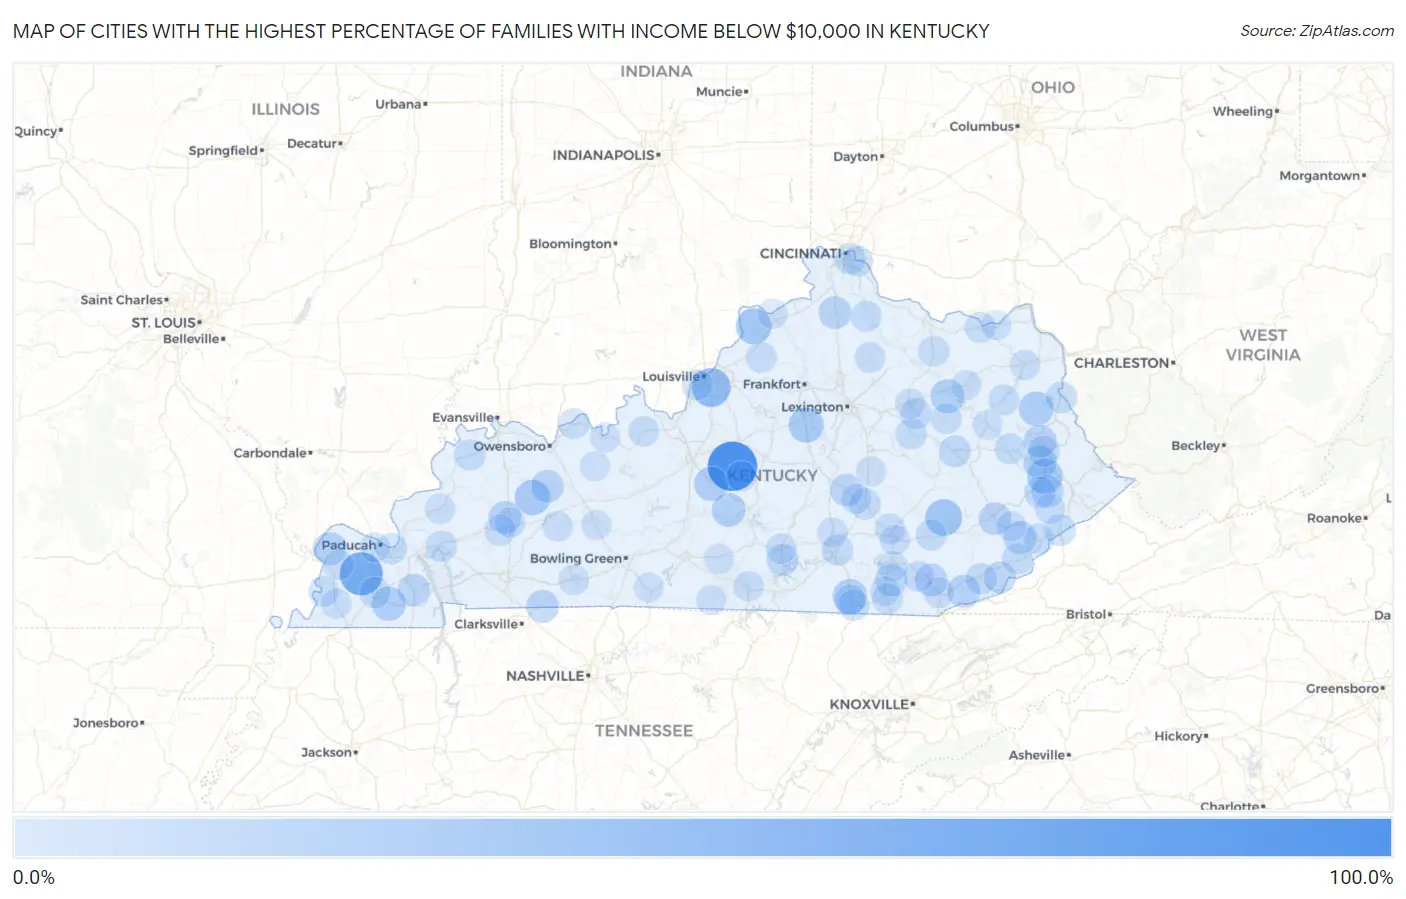
Map of Cities with the Highest Percentage of Families with Income Below $10,000 in Kentucky
0.0%
100.0%
Cities with the Highest Percentage of Families with Income Below $10,000 in Kentucky
| City | Families with Income < $10k | vs State | vs National | |
| 1. | New Hope | 100.0% | 4.2%(+95.8)#1 | 3.1%(+96.9)#28 |
| 2. | Lowes | 68.9% | 4.2%(+64.7)#2 | 3.1%(+65.8)#65 |
| 3. | Poplar Hills | 48.5% | 4.2%(+44.3)#3 | 3.1%(+45.4)#141 |
| 4. | Oneida | 38.6% | 4.2%(+34.4)#4 | 3.1%(+35.5)#237 |
| 5. | Bedford | 34.2% | 4.2%(+30.0)#5 | 3.1%(+31.1)#309 |
| 6. | Sacramento | 33.3% | 4.2%(+29.1)#6 | 3.1%(+30.2)#317 |
| 7. | Martin | 32.4% | 4.2%(+28.2)#7 | 3.1%(+29.3)#348 |
| 8. | Van Lear | 32.1% | 4.2%(+27.9)#8 | 3.1%(+29.0)#355 |
| 9. | Salvisa | 31.9% | 4.2%(+27.7)#9 | 3.1%(+28.8)#358 |
| 10. | Blaine | 29.4% | 4.2%(+25.2)#10 | 3.1%(+26.3)#422 |
| 11. | Whitley City | 28.4% | 4.2%(+24.2)#11 | 3.1%(+25.3)#455 |
| 12. | Buffalo | 27.9% | 4.2%(+23.7)#12 | 3.1%(+24.8)#470 |
| 13. | Farmington | 27.0% | 4.2%(+22.8)#13 | 3.1%(+23.9)#506 |
| 14. | Salt Lick | 26.5% | 4.2%(+22.3)#14 | 3.1%(+23.4)#524 |
| 15. | Summersville | 25.6% | 4.2%(+21.4)#15 | 3.1%(+22.5)#563 |
| 16. | Prestonsburg | 24.5% | 4.2%(+20.3)#16 | 3.1%(+21.4)#616 |
| 17. | Blackey | 23.1% | 4.2%(+18.9)#17 | 3.1%(+20.0)#699 |
| 18. | Barlow | 22.5% | 4.2%(+18.3)#18 | 3.1%(+19.4)#732 |
| 19. | Pathfork | 22.0% | 4.2%(+17.8)#19 | 3.1%(+18.9)#763 |
| 20. | Dry Ridge | 21.1% | 4.2%(+16.9)#20 | 3.1%(+18.0)#814 |
| 21. | Earlington | 21.1% | 4.2%(+16.9)#21 | 3.1%(+18.0)#815 |
| 22. | Livermore | 21.1% | 4.2%(+16.9)#22 | 3.1%(+18.0)#816 |
| 23. | Hazard | 21.0% | 4.2%(+16.8)#23 | 3.1%(+17.9)#820 |
| 24. | Flat Lick | 20.8% | 4.2%(+16.6)#24 | 3.1%(+17.7)#832 |
| 25. | Paintsville | 20.7% | 4.2%(+16.5)#25 | 3.1%(+17.6)#838 |
| 26. | Guthrie | 20.6% | 4.2%(+16.4)#26 | 3.1%(+17.5)#846 |
| 27. | Hardin | 19.5% | 4.2%(+15.3)#27 | 3.1%(+16.4)#949 |
| 28. | Rockholds | 19.5% | 4.2%(+15.3)#28 | 3.1%(+16.4)#953 |
| 29. | Crab Orchard | 19.4% | 4.2%(+15.2)#29 | 3.1%(+16.3)#961 |
| 30. | Mcdowell | 19.2% | 4.2%(+15.0)#30 | 3.1%(+16.1)#988 |
| 31. | Kenvir | 17.7% | 4.2%(+13.5)#31 | 3.1%(+14.6)#1,135 |
| 32. | Campton | 17.2% | 4.2%(+13.0)#32 | 3.1%(+14.1)#1,188 |
| 33. | Jamestown | 16.5% | 4.2%(+12.3)#33 | 3.1%(+13.4)#1,264 |
| 34. | Jenkins | 15.9% | 4.2%(+11.7)#34 | 3.1%(+12.8)#1,331 |
| 35. | Auxier | 15.8% | 4.2%(+11.6)#35 | 3.1%(+12.7)#1,347 |
| 36. | Louisa | 15.6% | 4.2%(+11.4)#36 | 3.1%(+12.5)#1,366 |
| 37. | Wayland | 15.5% | 4.2%(+11.3)#37 | 3.1%(+12.4)#1,393 |
| 38. | Mount Vernon | 15.4% | 4.2%(+11.2)#38 | 3.1%(+12.3)#1,399 |
| 39. | Harlan | 15.4% | 4.2%(+11.2)#39 | 3.1%(+12.3)#1,400 |
| 40. | Mayfield | 14.6% | 4.2%(+10.4)#40 | 3.1%(+11.5)#1,529 |
| 41. | Ferguson | 14.4% | 4.2%(+10.2)#41 | 3.1%(+11.3)#1,571 |
| 42. | Pine Knot | 14.3% | 4.2%(+10.1)#42 | 3.1%(+11.2)#1,588 |
| 43. | St Charles | 14.3% | 4.2%(+10.1)#43 | 3.1%(+11.2)#1,599 |
| 44. | Ledbetter | 14.1% | 4.2%(+9.90)#44 | 3.1%(+11.0)#1,647 |
| 45. | Clay City | 14.1% | 4.2%(+9.90)#45 | 3.1%(+11.0)#1,650 |
| 46. | Waverly | 14.0% | 4.2%(+9.80)#46 | 3.1%(+10.9)#1,676 |
| 47. | Eddyville | 13.8% | 4.2%(+9.60)#47 | 3.1%(+10.7)#1,698 |
| 48. | Falmouth | 13.6% | 4.2%(+9.40)#48 | 3.1%(+10.5)#1,735 |
| 49. | Camargo | 13.5% | 4.2%(+9.30)#49 | 3.1%(+10.4)#1,769 |
| 50. | Cumberland | 13.4% | 4.2%(+9.20)#50 | 3.1%(+10.3)#1,787 |
| 51. | Southgate | 13.3% | 4.2%(+9.10)#51 | 3.1%(+10.2)#1,803 |
| 52. | Salyersville | 13.3% | 4.2%(+9.10)#52 | 3.1%(+10.2)#1,807 |
| 53. | Manchester | 12.9% | 4.2%(+8.70)#53 | 3.1%(+9.80)#1,896 |
| 54. | Sandy Hook | 12.9% | 4.2%(+8.70)#54 | 3.1%(+9.80)#1,900 |
| 55. | Stearns | 12.8% | 4.2%(+8.60)#55 | 3.1%(+9.70)#1,916 |
| 56. | Lewisport | 12.7% | 4.2%(+8.50)#56 | 3.1%(+9.60)#1,942 |
| 57. | Vanceburg | 12.7% | 4.2%(+8.50)#57 | 3.1%(+9.60)#1,947 |
| 58. | Emlyn | 12.7% | 4.2%(+8.50)#58 | 3.1%(+9.60)#1,952 |
| 59. | Flemingsburg | 12.6% | 4.2%(+8.40)#59 | 3.1%(+9.50)#1,970 |
| 60. | Irvington | 12.5% | 4.2%(+8.30)#60 | 3.1%(+9.40)#1,986 |
| 61. | Smithfield | 12.5% | 4.2%(+8.30)#61 | 3.1%(+9.40)#2,005 |
| 62. | Silver Grove | 12.2% | 4.2%(+8.00)#62 | 3.1%(+9.10)#2,069 |
| 63. | Cynthiana | 12.1% | 4.2%(+7.90)#63 | 3.1%(+9.00)#2,091 |
| 64. | Whitesburg | 12.0% | 4.2%(+7.80)#64 | 3.1%(+8.90)#2,126 |
| 65. | Pineville | 12.0% | 4.2%(+7.80)#65 | 3.1%(+8.90)#2,129 |
| 66. | Russell Springs | 11.9% | 4.2%(+7.70)#66 | 3.1%(+8.80)#2,149 |
| 67. | Barbourville | 11.7% | 4.2%(+7.50)#67 | 3.1%(+8.60)#2,217 |
| 68. | East Bernstadt | 11.6% | 4.2%(+7.40)#68 | 3.1%(+8.50)#2,249 |
| 69. | Frenchburg | 11.6% | 4.2%(+7.40)#69 | 3.1%(+8.50)#2,252 |
| 70. | Columbus | 11.6% | 4.2%(+7.40)#70 | 3.1%(+8.50)#2,266 |
| 71. | Mortons Gap | 11.3% | 4.2%(+7.10)#71 | 3.1%(+8.20)#2,363 |
| 72. | Shively | 11.1% | 4.2%(+6.90)#72 | 3.1%(+8.00)#2,402 |
| 73. | Marion | 11.1% | 4.2%(+6.90)#73 | 3.1%(+8.00)#2,415 |
| 74. | Wheelwright | 11.1% | 4.2%(+6.90)#74 | 3.1%(+8.00)#2,426 |
| 75. | Russellville | 10.8% | 4.2%(+6.60)#75 | 3.1%(+7.70)#2,510 |
| 76. | Drakesboro | 10.8% | 4.2%(+6.60)#76 | 3.1%(+7.70)#2,538 |
| 77. | Corbin | 10.7% | 4.2%(+6.50)#77 | 3.1%(+7.60)#2,549 |
| 78. | Science Hill | 10.7% | 4.2%(+6.50)#78 | 3.1%(+7.60)#2,570 |
| 79. | Burkesville | 10.5% | 4.2%(+6.30)#79 | 3.1%(+7.40)#2,647 |
| 80. | Raywick | 10.5% | 4.2%(+6.30)#80 | 3.1%(+7.40)#2,658 |
| 81. | Blandville | 10.5% | 4.2%(+6.30)#81 | 3.1%(+7.40)#2,660 |
| 82. | Grayson | 10.4% | 4.2%(+6.20)#82 | 3.1%(+7.30)#2,670 |
| 83. | Clinton | 10.4% | 4.2%(+6.20)#83 | 3.1%(+7.30)#2,679 |
| 84. | Mount Sterling | 10.2% | 4.2%(+6.00)#84 | 3.1%(+7.10)#2,754 |
| 85. | Brodhead | 10.2% | 4.2%(+6.00)#85 | 3.1%(+7.10)#2,774 |
| 86. | London | 9.9% | 4.2%(+5.70)#86 | 3.1%(+6.80)#2,895 |
| 87. | Edmonton | 9.8% | 4.2%(+5.60)#87 | 3.1%(+6.70)#2,946 |
| 88. | Morgantown | 9.7% | 4.2%(+5.50)#88 | 3.1%(+6.60)#2,995 |
| 89. | Scottsville | 9.6% | 4.2%(+5.40)#89 | 3.1%(+6.50)#3,035 |
| 90. | Carrollton | 9.4% | 4.2%(+5.20)#90 | 3.1%(+6.30)#3,125 |
| 91. | West Liberty | 9.4% | 4.2%(+5.20)#91 | 3.1%(+6.30)#3,126 |
| 92. | Garrison | 9.4% | 4.2%(+5.20)#92 | 3.1%(+6.30)#3,141 |
| 93. | Fordsville | 9.4% | 4.2%(+5.20)#93 | 3.1%(+6.30)#3,150 |
| 94. | Paducah | 9.3% | 4.2%(+5.10)#94 | 3.1%(+6.20)#3,168 |
| 95. | Berea | 9.3% | 4.2%(+5.10)#95 | 3.1%(+6.20)#3,170 |
| 96. | Vicco | 9.3% | 4.2%(+5.10)#96 | 3.1%(+6.20)#3,206 |
| 97. | Tompkinsville | 9.2% | 4.2%(+5.00)#97 | 3.1%(+6.10)#3,233 |
| 98. | Cloverport | 9.2% | 4.2%(+5.00)#98 | 3.1%(+6.10)#3,243 |
| 99. | Morehead | 9.1% | 4.2%(+4.90)#99 | 3.1%(+6.00)#3,275 |
| 100. | Williamsburg | 9.1% | 4.2%(+4.90)#100 | 3.1%(+6.00)#3,281 |
Common Questions
What are the Top 10 Cities with the Highest Percentage of Families with Income Below $10,000 in Kentucky?
Top 10 Cities with the Highest Percentage of Families with Income Below $10,000 in Kentucky are:
#1
100.0%
#2
68.9%
#3
48.5%
#4
38.6%
#5
34.2%
#6
33.3%
#7
32.4%
#8
31.9%
#9
29.4%
#10
28.4%
What city has the Highest Percentage of Families with Income Below $10,000 in Kentucky?
New Hope has the Highest Percentage of Families with Income Below $10,000 in Kentucky with 100.0%.
What is the Percentage of Families with Income Below $10,000 in the State of Kentucky?
Percentage of Families with Income Below $10,000 in Kentucky is 4.2%.
What is the Percentage of Families with Income Below $10,000 in the United States?
Percentage of Families with Income Below $10,000 in the United States is 3.1%.