Cities with the Highest Percentage of Families with Income Below $10,000 in Nevada
RELATED REPORTS & OPTIONS
Family Income | $0-10k
Nevada
Compare Cities
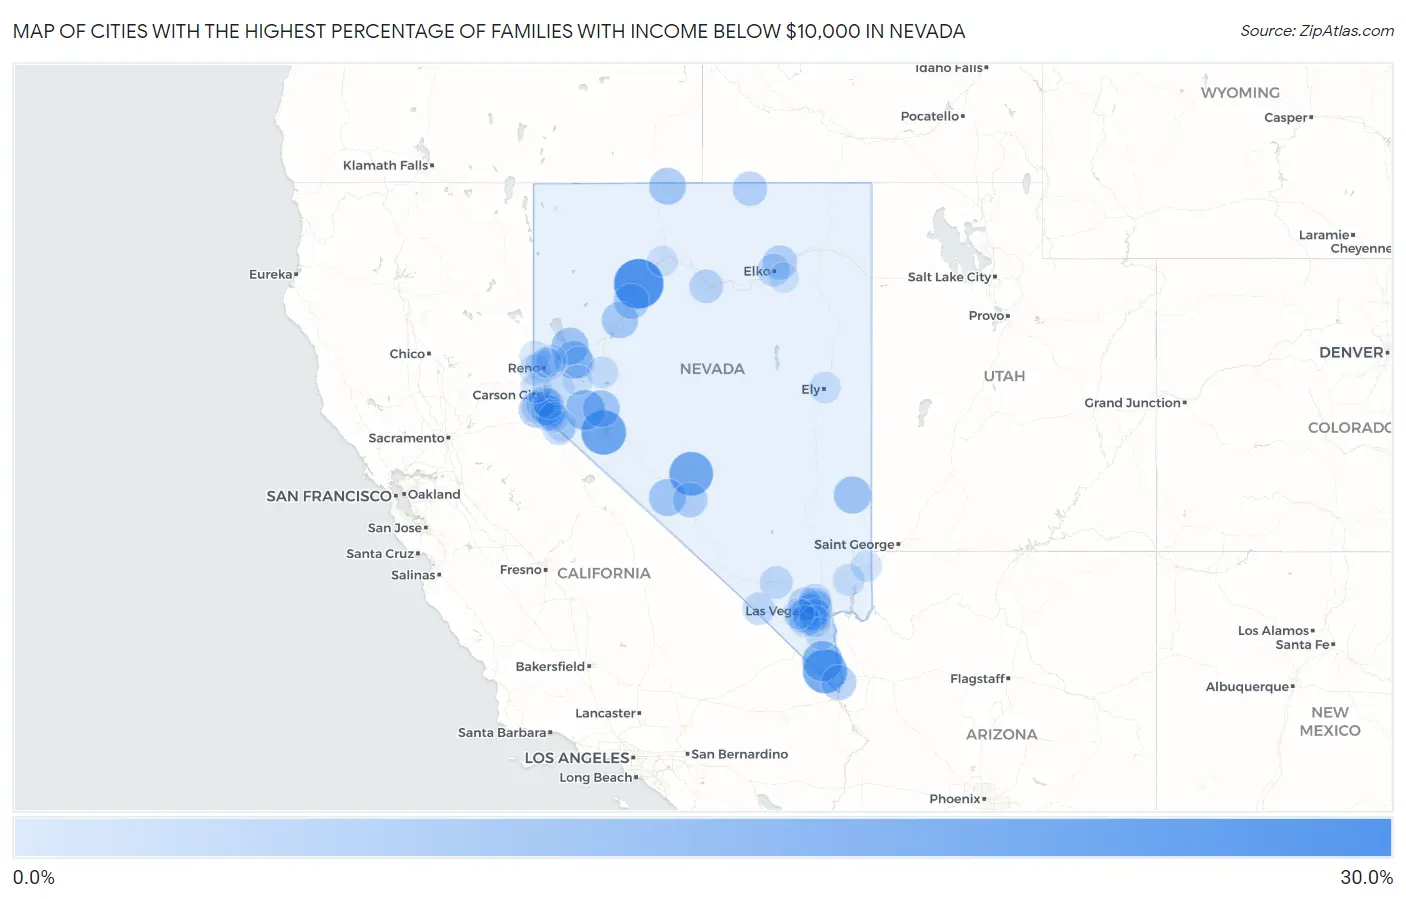
Map of Cities with the Highest Percentage of Families with Income Below $10,000 in Nevada
0.0%
30.0%
Cities with the Highest Percentage of Families with Income Below $10,000 in Nevada
| City | Families with Income < $10k | vs State | vs National | |
| 1. | Imlay | 28.1% | 3.3%(+24.8)#1 | 3.1%(+25.0)#465 |
| 2. | Walker Lake | 20.8% | 3.3%(+17.5)#2 | 3.1%(+17.7)#834 |
| 3. | Cal Nev Ari | 20.0% | 3.3%(+16.7)#3 | 3.1%(+16.9)#894 |
| 4. | Tonopah | 19.6% | 3.3%(+16.3)#4 | 3.1%(+16.5)#936 |
| 5. | Searchlight | 14.3% | 3.3%(+11.0)#5 | 3.1%(+11.2)#1,598 |
| 6. | Yerington | 13.8% | 3.3%(+10.5)#6 | 3.1%(+10.7)#1,697 |
| 7. | Wadsworth | 10.3% | 3.3%(+7.00)#7 | 3.1%(+7.20)#2,725 |
| 8. | Panaca | 10.1% | 3.3%(+6.80)#8 | 3.1%(+7.00)#2,806 |
| 9. | Nixon | 10.0% | 3.3%(+6.70)#9 | 3.1%(+6.90)#2,862 |
| 10. | Silver Peak | 9.8% | 3.3%(+6.50)#10 | 3.1%(+6.70)#2,967 |
| 11. | Schurz | 9.5% | 3.3%(+6.20)#11 | 3.1%(+6.40)#3,093 |
| 12. | Fort Mcdermitt | 9.3% | 3.3%(+6.00)#12 | 3.1%(+6.20)#3,208 |
| 13. | Lovelock | 8.9% | 3.3%(+5.60)#13 | 3.1%(+5.80)#3,403 |
| 14. | Winchester | 7.8% | 3.3%(+4.50)#14 | 3.1%(+4.70)#4,006 |
| 15. | Humboldt River Ranch | 7.5% | 3.3%(+4.20)#15 | 3.1%(+4.40)#4,277 |
| 16. | Laughlin | 7.0% | 3.3%(+3.70)#16 | 3.1%(+3.90)#4,620 |
| 17. | Stateline | 6.9% | 3.3%(+3.60)#17 | 3.1%(+3.80)#4,745 |
| 18. | Sunrise Manor | 6.7% | 3.3%(+3.40)#18 | 3.1%(+3.60)#4,864 |
| 19. | Goldfield | 6.6% | 3.3%(+3.30)#19 | 3.1%(+3.50)#5,045 |
| 20. | Genoa | 6.4% | 3.3%(+3.10)#20 | 3.1%(+3.30)#5,230 |
| 21. | Owyhee | 6.1% | 3.3%(+2.80)#21 | 3.1%(+3.00)#5,546 |
| 22. | Osino | 6.0% | 3.3%(+2.70)#22 | 3.1%(+2.90)#5,652 |
| 23. | Paradise | 5.6% | 3.3%(+2.30)#23 | 3.1%(+2.50)#6,066 |
| 24. | Battle Mountain | 5.0% | 3.3%(+1.70)#24 | 3.1%(+1.90)#6,930 |
| 25. | Nellis Afb | 4.9% | 3.3%(+1.60)#25 | 3.1%(+1.80)#7,096 |
| 26. | Las Vegas | 4.4% | 3.3%(+1.10)#26 | 3.1%(+1.30)#7,807 |
| 27. | Indian Springs | 3.7% | 3.3%(+0.400)#27 | 3.1%(+0.600)#9,270 |
| 28. | Elko | 3.5% | 3.3%(+0.200)#28 | 3.1%(+0.400)#9,556 |
| 29. | Spring Valley | 3.4% | 3.3%(+0.100)#29 | 3.1%(+0.300)#9,732 |
| 30. | Pahrump | 3.1% | 3.3%(-0.200)#30 | 3.1%(=0.000)#10,448 |
| 31. | Whitney | 3.0% | 3.3%(-0.300)#31 | 3.1%(-0.100)#10,678 |
| 32. | Gardnerville | 3.0% | 3.3%(-0.300)#32 | 3.1%(-0.100)#10,755 |
| 33. | Topaz Lake | 3.0% | 3.3%(-0.300)#33 | 3.1%(-0.100)#10,880 |
| 34. | North Las Vegas | 2.9% | 3.3%(-0.400)#34 | 3.1%(-0.200)#10,889 |
| 35. | Reno | 2.8% | 3.3%(-0.500)#35 | 3.1%(-0.300)#11,169 |
| 36. | Round Hill Village | 2.8% | 3.3%(-0.500)#36 | 3.1%(-0.300)#11,355 |
| 37. | Gardnerville Ranchos | 2.7% | 3.3%(-0.600)#37 | 3.1%(-0.400)#11,491 |
| 38. | Boulder City | 2.5% | 3.3%(-0.800)#38 | 3.1%(-0.600)#12,012 |
| 39. | Fernley | 2.4% | 3.3%(-0.900)#39 | 3.1%(-0.700)#12,261 |
| 40. | Moapa Valley | 2.4% | 3.3%(-0.900)#40 | 3.1%(-0.700)#12,331 |
| 41. | Henderson | 2.3% | 3.3%(-1.00)#41 | 3.1%(-0.800)#12,513 |
| 42. | Fallon | 2.2% | 3.3%(-1.10)#42 | 3.1%(-0.900)#12,918 |
| 43. | Enterprise | 2.0% | 3.3%(-1.30)#43 | 3.1%(-1.10)#13,434 |
| 44. | East Valley | 2.0% | 3.3%(-1.30)#44 | 3.1%(-1.10)#13,644 |
| 45. | Carson | 1.9% | 3.3%(-1.40)#45 | 3.1%(-1.20)#13,775 |
| 46. | Indian Hills | 1.8% | 3.3%(-1.50)#46 | 3.1%(-1.30)#14,166 |
| 47. | Ely | 1.8% | 3.3%(-1.50)#47 | 3.1%(-1.30)#14,193 |
| 48. | Topaz Ranch Estates | 1.7% | 3.3%(-1.60)#48 | 3.1%(-1.40)#14,562 |
| 49. | Verdi | 1.6% | 3.3%(-1.70)#49 | 3.1%(-1.50)#14,957 |
| 50. | Minden | 1.5% | 3.3%(-1.80)#50 | 3.1%(-1.60)#15,199 |
| 51. | Ruhenstroth | 1.5% | 3.3%(-1.80)#51 | 3.1%(-1.60)#15,252 |
| 52. | Sparks | 1.4% | 3.3%(-1.90)#52 | 3.1%(-1.70)#15,370 |
| 53. | Summerlin South | 1.4% | 3.3%(-1.90)#53 | 3.1%(-1.70)#15,400 |
| 54. | Mesquite | 1.4% | 3.3%(-1.90)#54 | 3.1%(-1.70)#15,420 |
| 55. | Incline Village | 1.3% | 3.3%(-2.00)#55 | 3.1%(-1.80)#15,840 |
| 56. | Spanish Springs | 1.2% | 3.3%(-2.10)#56 | 3.1%(-1.90)#16,143 |
| 57. | Dayton | 1.2% | 3.3%(-2.10)#57 | 3.1%(-1.90)#16,145 |
| 58. | Johnson Lane | 1.2% | 3.3%(-2.10)#58 | 3.1%(-1.90)#16,202 |
| 59. | Cold Springs | 1.0% | 3.3%(-2.30)#59 | 3.1%(-2.10)#16,863 |
| 60. | Winnemucca | 1.0% | 3.3%(-2.30)#60 | 3.1%(-2.10)#16,884 |
| 61. | Sun Valley | 0.80% | 3.3%(-2.50)#61 | 3.1%(-2.30)#17,509 |
| 62. | Silver Springs | 0.70% | 3.3%(-2.60)#62 | 3.1%(-2.40)#17,948 |
| 63. | Carter Springs | 0.70% | 3.3%(-2.60)#63 | 3.1%(-2.40)#18,124 |
| 64. | Spring Creek | 0.40% | 3.3%(-2.90)#64 | 3.1%(-2.70)#18,667 |
1
2Common Questions
What are the Top 10 Cities with the Highest Percentage of Families with Income Below $10,000 in Nevada?
Top 10 Cities with the Highest Percentage of Families with Income Below $10,000 in Nevada are:
#1
28.1%
#2
20.8%
#3
20.0%
#4
19.6%
#5
14.3%
#6
13.8%
#7
10.3%
#8
10.1%
#9
10.0%
#10
9.8%
What city has the Highest Percentage of Families with Income Below $10,000 in Nevada?
Imlay has the Highest Percentage of Families with Income Below $10,000 in Nevada with 28.1%.
What is the Percentage of Families with Income Below $10,000 in the State of Nevada?
Percentage of Families with Income Below $10,000 in Nevada is 3.3%.
What is the Percentage of Families with Income Below $10,000 in the United States?
Percentage of Families with Income Below $10,000 in the United States is 3.1%.