Cities with the Highest Percentage of Families with Income Below $10,000 in Nebraska
RELATED REPORTS & OPTIONS
Family Income | $0-10k
Nebraska
Compare Cities
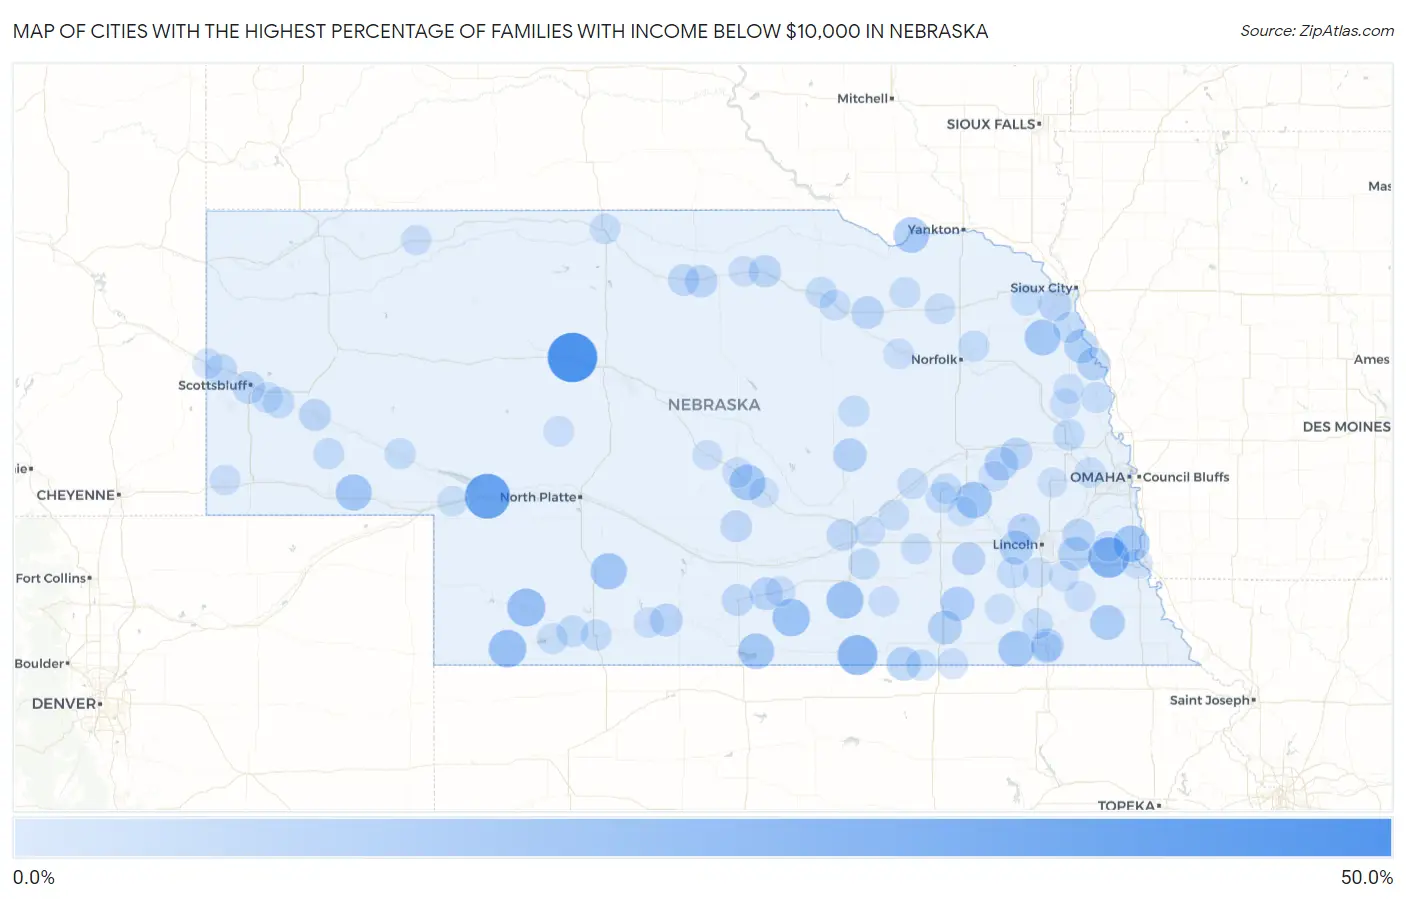
Map of Cities with the Highest Percentage of Families with Income Below $10,000 in Nebraska
0.0%
50.0%
Cities with the Highest Percentage of Families with Income Below $10,000 in Nebraska
| City | Families with Income < $10k | vs State | vs National | |
| 1. | Seneca | 50.0% | 2.1%(+47.9)#1 | 3.1%(+46.9)#133 |
| 2. | Roscoe | 38.9% | 2.1%(+36.8)#2 | 3.1%(+35.8)#232 |
| 3. | Otoe | 28.3% | 2.1%(+26.2)#3 | 3.1%(+25.2)#460 |
| 4. | Guide Rock | 26.6% | 2.1%(+24.5)#4 | 3.1%(+23.5)#519 |
| 5. | Hamlet | 22.2% | 2.1%(+20.1)#5 | 3.1%(+19.1)#753 |
| 6. | Max | 21.4% | 2.1%(+19.3)#6 | 3.1%(+18.3)#801 |
| 7. | Upland | 20.9% | 2.1%(+18.8)#7 | 3.1%(+17.8)#828 |
| 8. | Ayr | 20.0% | 2.1%(+17.9)#8 | 3.1%(+16.9)#902 |
| 9. | Surprise | 18.2% | 2.1%(+16.1)#9 | 3.1%(+15.1)#1,092 |
| 10. | Curtis | 17.9% | 2.1%(+15.8)#10 | 3.1%(+14.8)#1,116 |
| 11. | Union | 17.9% | 2.1%(+15.8)#11 | 3.1%(+14.8)#1,120 |
| 12. | Sunol | 17.8% | 2.1%(+15.7)#12 | 3.1%(+14.7)#1,130 |
| 13. | Diller | 17.1% | 2.1%(+15.0)#13 | 3.1%(+14.0)#1,197 |
| 14. | Republican City | 17.1% | 2.1%(+15.0)#14 | 3.1%(+14.0)#1,200 |
| 15. | Thurston | 17.1% | 2.1%(+15.0)#15 | 3.1%(+14.0)#1,202 |
| 16. | Mason City | 17.0% | 2.1%(+14.9)#16 | 3.1%(+13.9)#1,210 |
| 17. | Santee | 16.4% | 2.1%(+14.3)#17 | 3.1%(+13.3)#1,280 |
| 18. | Elk Creek | 14.3% | 2.1%(+12.2)#18 | 3.1%(+11.2)#1,609 |
| 19. | Ohiowa | 12.9% | 2.1%(+10.8)#19 | 3.1%(+9.80)#1,905 |
| 20. | Hardy | 12.8% | 2.1%(+10.7)#20 | 3.1%(+9.70)#1,931 |
| 21. | Pleasant Dale | 12.5% | 2.1%(+10.4)#21 | 3.1%(+9.40)#2,000 |
| 22. | Belvidere | 12.5% | 2.1%(+10.4)#22 | 3.1%(+9.40)#2,013 |
| 23. | Macy | 12.4% | 2.1%(+10.3)#23 | 3.1%(+9.30)#2,036 |
| 24. | Octavia | 12.0% | 2.1%(+9.90)#24 | 3.1%(+8.90)#2,143 |
| 25. | Woodland Hills | 11.8% | 2.1%(+9.70)#25 | 3.1%(+8.70)#2,201 |
| 26. | Wolbach | 11.5% | 2.1%(+9.40)#26 | 3.1%(+8.40)#2,300 |
| 27. | Decatur | 10.9% | 2.1%(+8.80)#27 | 3.1%(+7.80)#2,499 |
| 28. | Holbrook | 10.3% | 2.1%(+8.20)#28 | 3.1%(+7.20)#2,733 |
| 29. | Cordova | 10.3% | 2.1%(+8.20)#29 | 3.1%(+7.20)#2,740 |
| 30. | Hubbard | 10.2% | 2.1%(+8.10)#30 | 3.1%(+7.10)#2,789 |
| 31. | Axtell | 10.0% | 2.1%(+7.90)#31 | 3.1%(+6.90)#2,851 |
| 32. | Blue Springs | 10.0% | 2.1%(+7.90)#32 | 3.1%(+6.90)#2,870 |
| 33. | Malcolm | 9.9% | 2.1%(+7.80)#33 | 3.1%(+6.80)#2,917 |
| 34. | Orchard | 9.5% | 2.1%(+7.40)#34 | 3.1%(+6.40)#3,104 |
| 35. | Terrytown | 9.4% | 2.1%(+7.30)#35 | 3.1%(+6.30)#3,146 |
| 36. | Long Pine | 9.4% | 2.1%(+7.30)#36 | 3.1%(+6.30)#3,157 |
| 37. | Alvo | 9.4% | 2.1%(+7.30)#37 | 3.1%(+6.30)#3,165 |
| 38. | Stuart | 8.9% | 2.1%(+6.80)#38 | 3.1%(+5.80)#3,418 |
| 39. | Linwood | 8.7% | 2.1%(+6.60)#39 | 3.1%(+5.60)#3,544 |
| 40. | Bridgeport | 8.3% | 2.1%(+6.20)#40 | 3.1%(+5.20)#3,721 |
| 41. | Holdrege | 7.8% | 2.1%(+5.70)#41 | 3.1%(+4.70)#4,024 |
| 42. | Ainsworth | 7.8% | 2.1%(+5.70)#42 | 3.1%(+4.70)#4,041 |
| 43. | Morrill | 7.8% | 2.1%(+5.70)#43 | 3.1%(+4.70)#4,054 |
| 44. | Alda | 7.8% | 2.1%(+5.70)#44 | 3.1%(+4.70)#4,061 |
| 45. | Miller | 7.7% | 2.1%(+5.60)#45 | 3.1%(+4.60)#4,141 |
| 46. | Culbertson | 7.4% | 2.1%(+5.30)#46 | 3.1%(+4.30)#4,335 |
| 47. | Trumbull | 7.0% | 2.1%(+4.90)#47 | 3.1%(+3.90)#4,694 |
| 48. | Mcgrew | 6.9% | 2.1%(+4.80)#48 | 3.1%(+3.80)#4,783 |
| 49. | Nickerson | 6.8% | 2.1%(+4.70)#49 | 3.1%(+3.70)#4,846 |
| 50. | Wymore | 6.6% | 2.1%(+4.50)#50 | 3.1%(+3.50)#5,008 |
| 51. | Hoskins | 6.6% | 2.1%(+4.50)#51 | 3.1%(+3.50)#5,042 |
| 52. | O Neill | 6.5% | 2.1%(+4.40)#52 | 3.1%(+3.40)#5,083 |
| 53. | Oshkosh | 6.5% | 2.1%(+4.40)#53 | 3.1%(+3.40)#5,115 |
| 54. | Spalding | 6.5% | 2.1%(+4.40)#54 | 3.1%(+3.40)#5,132 |
| 55. | Allen | 6.4% | 2.1%(+4.30)#55 | 3.1%(+3.30)#5,237 |
| 56. | Crete | 6.3% | 2.1%(+4.20)#56 | 3.1%(+3.20)#5,273 |
| 57. | Stromsburg | 6.3% | 2.1%(+4.20)#57 | 3.1%(+3.20)#5,310 |
| 58. | Winnebago | 6.3% | 2.1%(+4.20)#58 | 3.1%(+3.20)#5,313 |
| 59. | Dalton | 6.3% | 2.1%(+4.20)#59 | 3.1%(+3.20)#5,336 |
| 60. | Byron | 6.3% | 2.1%(+4.20)#60 | 3.1%(+3.20)#5,366 |
| 61. | Mccook | 6.1% | 2.1%(+4.00)#61 | 3.1%(+3.00)#5,501 |
| 62. | Beatrice | 6.0% | 2.1%(+3.90)#62 | 3.1%(+2.90)#5,602 |
| 63. | Tekamah | 5.9% | 2.1%(+3.80)#63 | 3.1%(+2.80)#5,772 |
| 64. | Inman | 5.9% | 2.1%(+3.80)#64 | 3.1%(+2.80)#5,823 |
| 65. | Henderson | 5.8% | 2.1%(+3.70)#65 | 3.1%(+2.70)#5,914 |
| 66. | Creighton | 5.7% | 2.1%(+3.60)#66 | 3.1%(+2.60)#6,009 |
| 67. | Osmond | 5.7% | 2.1%(+3.60)#67 | 3.1%(+2.60)#6,031 |
| 68. | Trenton | 5.7% | 2.1%(+3.60)#68 | 3.1%(+2.60)#6,042 |
| 69. | Clarks | 5.7% | 2.1%(+3.60)#69 | 3.1%(+2.60)#6,049 |
| 70. | Hubbell | 5.6% | 2.1%(+3.50)#70 | 3.1%(+2.50)#6,199 |
| 71. | Melbeta | 5.5% | 2.1%(+3.40)#71 | 3.1%(+2.40)#6,325 |
| 72. | Osceola | 5.4% | 2.1%(+3.30)#72 | 3.1%(+2.30)#6,415 |
| 73. | Valentine | 5.3% | 2.1%(+3.20)#73 | 3.1%(+2.20)#6,506 |
| 74. | Marquette | 5.2% | 2.1%(+3.10)#74 | 3.1%(+2.10)#6,730 |
| 75. | Minden | 5.1% | 2.1%(+3.00)#75 | 3.1%(+2.00)#6,771 |
| 76. | Cambridge | 5.1% | 2.1%(+3.00)#76 | 3.1%(+2.00)#6,808 |
| 77. | Sterling | 5.1% | 2.1%(+3.00)#77 | 3.1%(+2.00)#6,834 |
| 78. | Oakdale | 5.1% | 2.1%(+3.00)#78 | 3.1%(+2.00)#6,854 |
| 79. | Phillips | 5.1% | 2.1%(+3.00)#79 | 3.1%(+2.00)#6,855 |
| 80. | Avoca | 5.1% | 2.1%(+3.00)#80 | 3.1%(+2.00)#6,863 |
| 81. | Tryon | 5.1% | 2.1%(+3.00)#81 | 3.1%(+2.00)#6,868 |
| 82. | Ansley | 5.0% | 2.1%(+2.90)#82 | 3.1%(+1.90)#7,001 |
| 83. | Fairfield | 5.0% | 2.1%(+2.90)#83 | 3.1%(+1.90)#7,015 |
| 84. | Newport | 5.0% | 2.1%(+2.90)#84 | 3.1%(+1.90)#7,035 |
| 85. | Henry | 5.0% | 2.1%(+2.90)#85 | 3.1%(+1.90)#7,036 |
| 86. | David City | 4.9% | 2.1%(+2.80)#86 | 3.1%(+1.80)#7,109 |
| 87. | Bushnell | 4.9% | 2.1%(+2.80)#87 | 3.1%(+1.80)#7,194 |
| 88. | Gordon | 4.8% | 2.1%(+2.70)#88 | 3.1%(+1.70)#7,267 |
| 89. | Uehling | 4.8% | 2.1%(+2.70)#89 | 3.1%(+1.70)#7,320 |
| 90. | Nebraska City | 4.6% | 2.1%(+2.50)#90 | 3.1%(+1.50)#7,525 |
| 91. | Waterloo | 4.6% | 2.1%(+2.50)#91 | 3.1%(+1.50)#7,588 |
| 92. | Brule | 4.5% | 2.1%(+2.40)#92 | 3.1%(+1.40)#7,791 |
| 93. | Oakland | 4.3% | 2.1%(+2.20)#93 | 3.1%(+1.20)#8,062 |
| 94. | Litchfield | 4.3% | 2.1%(+2.20)#94 | 3.1%(+1.20)#8,131 |
| 95. | Sprague | 4.3% | 2.1%(+2.20)#95 | 3.1%(+1.20)#8,167 |
| 96. | Broken Bow | 4.2% | 2.1%(+2.10)#96 | 3.1%(+1.10)#8,238 |
| 97. | Gresham | 4.2% | 2.1%(+2.10)#97 | 3.1%(+1.10)#8,315 |
| 98. | Panama | 4.2% | 2.1%(+2.10)#98 | 3.1%(+1.10)#8,319 |
| 99. | Swanton | 4.1% | 2.1%(+2.00)#99 | 3.1%(+1.000)#8,533 |
| 100. | Wahoo | 4.0% | 2.1%(+1.90)#100 | 3.1%(+0.900)#8,612 |
Common Questions
What are the Top 10 Cities with the Highest Percentage of Families with Income Below $10,000 in Nebraska?
Top 10 Cities with the Highest Percentage of Families with Income Below $10,000 in Nebraska are:
What city has the Highest Percentage of Families with Income Below $10,000 in Nebraska?
Seneca has the Highest Percentage of Families with Income Below $10,000 in Nebraska with 50.0%.
What is the Percentage of Families with Income Below $10,000 in the State of Nebraska?
Percentage of Families with Income Below $10,000 in Nebraska is 2.1%.
What is the Percentage of Families with Income Below $10,000 in the United States?
Percentage of Families with Income Below $10,000 in the United States is 3.1%.