Cities with the Lowest Poverty Level Among Seniors Over the Age of 75 in Kansas
RELATED REPORTS & OPTIONS
Lowest Poverty | Seniors 75+
Kansas
Compare Cities
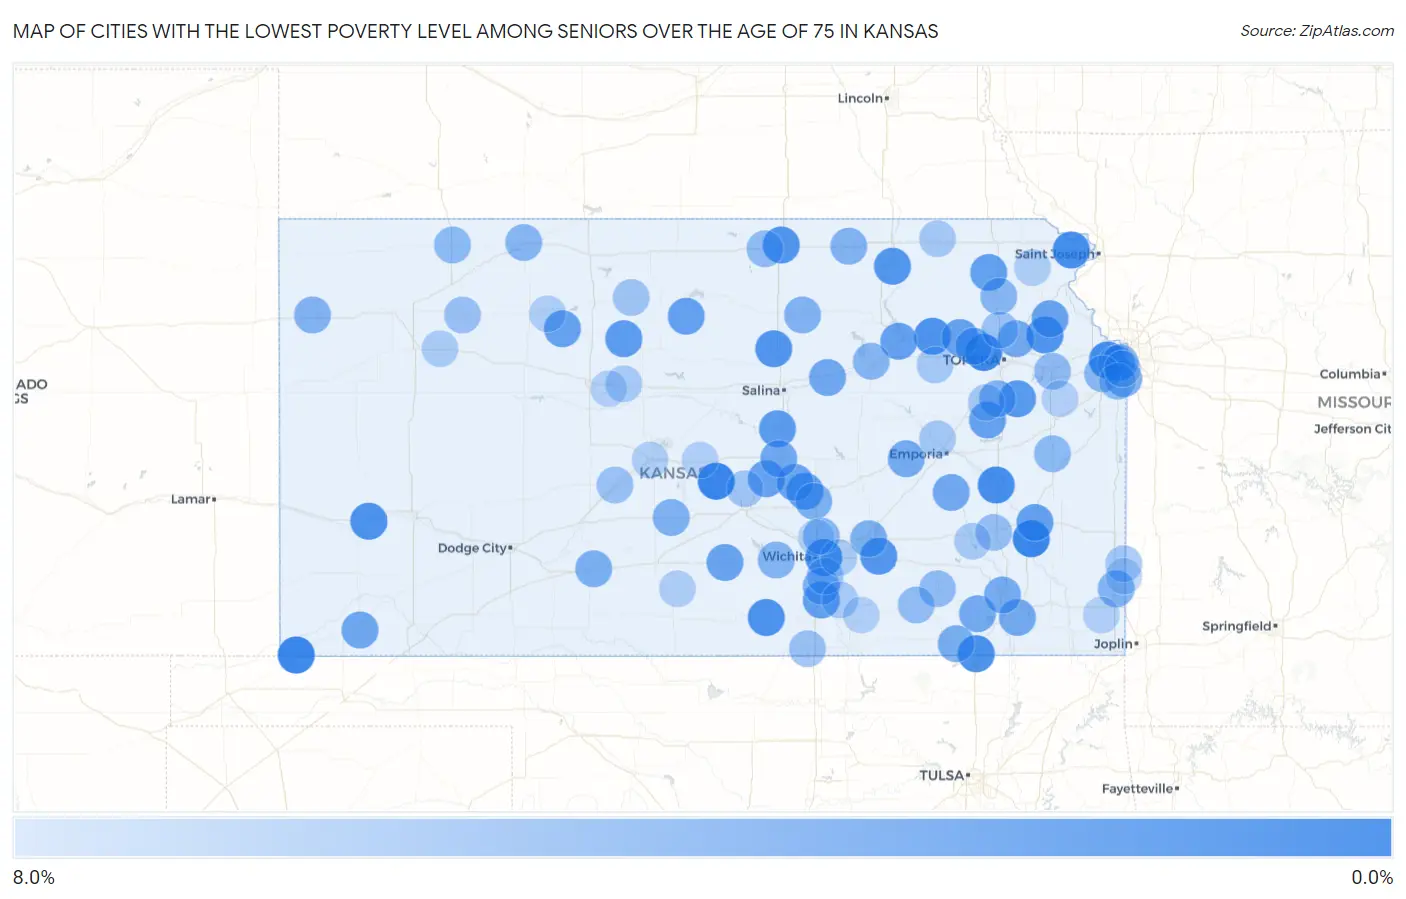
Map of Cities with the Lowest Poverty Level Among Seniors Over the Age of 75 in Kansas
8.0%
0.0%
Cities with the Lowest Poverty Level Among Seniors Over the Age of 75 in Kansas
| City | Senior Poverty | vs State | vs National | |
| 1. | Sterling | 0.53% | 9.7%(-9.17)#1 | 11.1%(-10.5)#57 |
| 2. | Elkhart | 0.60% | 9.7%(-9.10)#2 | 11.1%(-10.5)#66 |
| 3. | Humboldt | 0.67% | 9.7%(-9.03)#3 | 11.1%(-10.4)#81 |
| 4. | Silver Lake | 0.83% | 9.7%(-8.87)#4 | 11.1%(-10.2)#113 |
| 5. | Lake Quivira | 1.1% | 9.7%(-8.59)#5 | 11.1%(-9.96)#162 |
| 6. | Troy | 1.2% | 9.7%(-8.54)#6 | 11.1%(-9.90)#178 |
| 7. | Burlington | 1.3% | 9.7%(-8.44)#7 | 11.1%(-9.81)#207 |
| 8. | Eastborough | 1.4% | 9.7%(-8.31)#8 | 11.1%(-9.68)#254 |
| 9. | Caney | 1.5% | 9.7%(-8.21)#9 | 11.1%(-9.57)#290 |
| 10. | Wamego | 1.7% | 9.7%(-8.04)#10 | 11.1%(-9.41)#363 |
| 11. | Argonia | 1.7% | 9.7%(-8.03)#11 | 11.1%(-9.40)#369 |
| 12. | Lakin | 1.7% | 9.7%(-8.02)#12 | 11.1%(-9.39)#376 |
| 13. | Oskaloosa | 1.7% | 9.7%(-7.98)#13 | 11.1%(-9.34)#394 |
| 14. | Minneapolis | 1.8% | 9.7%(-7.90)#14 | 11.1%(-9.27)#422 |
| 15. | Belleville | 1.8% | 9.7%(-7.90)#15 | 11.1%(-9.27)#423 |
| 16. | Blue Rapids | 1.9% | 9.7%(-7.78)#16 | 11.1%(-9.14)#480 |
| 17. | Leon | 2.1% | 9.7%(-7.62)#17 | 11.1%(-8.98)#581 |
| 18. | Overbrook | 2.3% | 9.7%(-7.40)#18 | 11.1%(-8.77)#723 |
| 19. | Natoma | 2.4% | 9.7%(-7.32)#19 | 11.1%(-8.69)#769 |
| 20. | Lindsborg | 2.4% | 9.7%(-7.30)#20 | 11.1%(-8.67)#775 |
| 21. | Belle Plaine | 2.7% | 9.7%(-7.01)#21 | 11.1%(-8.38)#985 |
| 22. | Hesston | 2.7% | 9.7%(-6.97)#22 | 11.1%(-8.34)#1,033 |
| 23. | Wetmore | 2.8% | 9.7%(-6.92)#23 | 11.1%(-8.29)#1,070 |
| 24. | Manhattan | 2.8% | 9.7%(-6.91)#24 | 11.1%(-8.28)#1,075 |
| 25. | Iola | 2.8% | 9.7%(-6.87)#25 | 11.1%(-8.23)#1,114 |
| 26. | Tipton | 2.9% | 9.7%(-6.84)#26 | 11.1%(-8.21)#1,141 |
| 27. | Palco | 2.9% | 9.7%(-6.76)#27 | 11.1%(-8.13)#1,202 |
| 28. | Osage City | 3.0% | 9.7%(-6.71)#28 | 11.1%(-8.08)#1,222 |
| 29. | St Marys | 3.0% | 9.7%(-6.69)#29 | 11.1%(-8.06)#1,246 |
| 30. | Inman | 3.0% | 9.7%(-6.69)#30 | 11.1%(-8.06)#1,247 |
| 31. | Kingman | 3.0% | 9.7%(-6.67)#31 | 11.1%(-8.04)#1,259 |
| 32. | Winchester | 3.0% | 9.7%(-6.67)#32 | 11.1%(-8.04)#1,273 |
| 33. | Moundridge | 3.1% | 9.7%(-6.59)#33 | 11.1%(-7.95)#1,331 |
| 34. | Rossville | 3.3% | 9.7%(-6.42)#34 | 11.1%(-7.79)#1,482 |
| 35. | Hugoton | 3.3% | 9.7%(-6.35)#35 | 11.1%(-7.72)#1,545 |
| 36. | Abilene | 3.5% | 9.7%(-6.21)#36 | 11.1%(-7.58)#1,672 |
| 37. | Merriam | 3.5% | 9.7%(-6.18)#37 | 11.1%(-7.54)#1,695 |
| 38. | Madison | 3.5% | 9.7%(-6.16)#38 | 11.1%(-7.53)#1,706 |
| 39. | Mcpherson | 3.6% | 9.7%(-6.15)#39 | 11.1%(-7.52)#1,714 |
| 40. | Elk City | 3.6% | 9.7%(-6.13)#40 | 11.1%(-7.50)#1,761 |
| 41. | Cherryvale | 3.7% | 9.7%(-6.04)#41 | 11.1%(-7.41)#1,824 |
| 42. | Meriden | 3.7% | 9.7%(-6.00)#42 | 11.1%(-7.36)#1,872 |
| 43. | Cottonwood Falls | 3.8% | 9.7%(-5.93)#43 | 11.1%(-7.29)#1,945 |
| 44. | Neodesha | 3.8% | 9.7%(-5.88)#44 | 11.1%(-7.25)#1,992 |
| 45. | Peru | 3.9% | 9.7%(-5.78)#45 | 11.1%(-7.15)#2,105 |
| 46. | Mulvane | 4.1% | 9.7%(-5.65)#46 | 11.1%(-7.01)#2,225 |
| 47. | Leawood | 4.1% | 9.7%(-5.61)#47 | 11.1%(-6.98)#2,271 |
| 48. | Greensburg | 4.1% | 9.7%(-5.59)#48 | 11.1%(-6.96)#2,289 |
| 49. | North Newton | 4.2% | 9.7%(-5.55)#49 | 11.1%(-6.91)#2,318 |
| 50. | El Dorado | 4.2% | 9.7%(-5.49)#50 | 11.1%(-6.86)#2,392 |
| 51. | Scranton | 4.2% | 9.7%(-5.46)#51 | 11.1%(-6.83)#2,415 |
| 52. | Stafford | 4.3% | 9.7%(-5.44)#52 | 11.1%(-6.81)#2,440 |
| 53. | Washington | 4.3% | 9.7%(-5.35)#53 | 11.1%(-6.72)#2,526 |
| 54. | Miltonvale | 4.3% | 9.7%(-5.35)#54 | 11.1%(-6.72)#2,538 |
| 55. | Frontenac | 4.4% | 9.7%(-5.27)#55 | 11.1%(-6.64)#2,613 |
| 56. | Goodland | 4.4% | 9.7%(-5.27)#56 | 11.1%(-6.64)#2,617 |
| 57. | Garden Plain | 4.5% | 9.7%(-5.15)#57 | 11.1%(-6.52)#2,729 |
| 58. | Kechi | 4.6% | 9.7%(-5.14)#58 | 11.1%(-6.50)#2,765 |
| 59. | Mission | 4.6% | 9.7%(-5.10)#59 | 11.1%(-6.47)#2,797 |
| 60. | Junction City | 4.7% | 9.7%(-4.99)#60 | 11.1%(-6.36)#2,897 |
| 61. | Holton | 4.7% | 9.7%(-4.99)#61 | 11.1%(-6.35)#2,903 |
| 62. | Norton | 4.7% | 9.7%(-4.98)#62 | 11.1%(-6.35)#2,906 |
| 63. | Lenexa | 4.9% | 9.7%(-4.82)#63 | 11.1%(-6.19)#3,062 |
| 64. | Oberlin | 4.9% | 9.7%(-4.81)#64 | 11.1%(-6.18)#3,084 |
| 65. | Richmond | 4.9% | 9.7%(-4.78)#65 | 11.1%(-6.15)#3,114 |
| 66. | Scandia | 5.1% | 9.7%(-4.57)#66 | 11.1%(-5.94)#3,343 |
| 67. | Howard | 5.2% | 9.7%(-4.50)#67 | 11.1%(-5.87)#3,400 |
| 68. | Lawrence | 5.2% | 9.7%(-4.49)#68 | 11.1%(-5.85)#3,414 |
| 69. | Overland Park | 5.2% | 9.7%(-4.47)#69 | 11.1%(-5.83)#3,428 |
| 70. | Grenola | 5.3% | 9.7%(-4.44)#70 | 11.1%(-5.80)#3,497 |
| 71. | Yates Center | 5.5% | 9.7%(-4.22)#71 | 11.1%(-5.59)#3,674 |
| 72. | South Haven | 5.6% | 9.7%(-4.14)#72 | 11.1%(-5.51)#3,785 |
| 73. | Hoxie | 5.6% | 9.7%(-4.11)#73 | 11.1%(-5.47)#3,818 |
| 74. | Larned | 5.7% | 9.7%(-4.04)#74 | 11.1%(-5.41)#3,879 |
| 75. | Hoyt | 5.7% | 9.7%(-3.99)#75 | 11.1%(-5.35)#3,935 |
| 76. | Derby | 5.8% | 9.7%(-3.87)#76 | 11.1%(-5.24)#4,048 |
| 77. | Alton | 5.9% | 9.7%(-3.82)#77 | 11.1%(-5.18)#4,151 |
| 78. | The Highlands | 6.1% | 9.7%(-3.64)#78 | 11.1%(-5.01)#4,327 |
| 79. | Arcadia | 6.1% | 9.7%(-3.64)#79 | 11.1%(-5.01)#4,333 |
| 80. | Americus | 6.2% | 9.7%(-3.45)#80 | 11.1%(-4.82)#4,523 |
| 81. | Alma | 6.2% | 9.7%(-3.45)#81 | 11.1%(-4.82)#4,532 |
| 82. | Axtell | 6.2% | 9.7%(-3.45)#82 | 11.1%(-4.82)#4,544 |
| 83. | Burlingame | 6.3% | 9.7%(-3.35)#83 | 11.1%(-4.72)#4,648 |
| 84. | Udall | 6.5% | 9.7%(-3.25)#84 | 11.1%(-4.62)#4,756 |
| 85. | Gorham | 6.5% | 9.7%(-3.25)#85 | 11.1%(-4.62)#4,768 |
| 86. | Toronto | 6.5% | 9.7%(-3.25)#86 | 11.1%(-4.62)#4,774 |
| 87. | Grinnell | 6.6% | 9.7%(-3.14)#87 | 11.1%(-4.51)#4,873 |
| 88. | Andover | 6.6% | 9.7%(-3.10)#88 | 11.1%(-4.46)#4,905 |
| 89. | Prairie Village | 6.6% | 9.7%(-3.06)#89 | 11.1%(-4.42)#4,933 |
| 90. | Everest | 6.7% | 9.7%(-3.03)#90 | 11.1%(-4.40)#4,997 |
| 91. | Isabel | 6.7% | 9.7%(-3.03)#91 | 11.1%(-4.40)#5,018 |
| 92. | Bogue | 6.7% | 9.7%(-3.03)#92 | 11.1%(-4.40)#5,021 |
| 93. | Great Bend | 6.8% | 9.7%(-2.93)#93 | 11.1%(-4.30)#5,090 |
| 94. | Baldwin City | 6.9% | 9.7%(-2.82)#94 | 11.1%(-4.18)#5,191 |
| 95. | Victoria | 6.9% | 9.7%(-2.80)#95 | 11.1%(-4.17)#5,209 |
| 96. | Chase | 6.9% | 9.7%(-2.80)#96 | 11.1%(-4.17)#5,230 |
| 97. | Scammon | 6.9% | 9.7%(-2.80)#97 | 11.1%(-4.17)#5,235 |
| 98. | Winfield | 6.9% | 9.7%(-2.78)#98 | 11.1%(-4.15)#5,253 |
| 99. | Park City | 7.1% | 9.7%(-2.59)#99 | 11.1%(-3.95)#5,420 |
| 100. | Mulberry | 7.1% | 9.7%(-2.56)#100 | 11.1%(-3.92)#5,464 |
Common Questions
What are the Top 10 Cities with the Lowest Poverty Level Among Seniors Over the Age of 75 in Kansas?
Top 10 Cities with the Lowest Poverty Level Among Seniors Over the Age of 75 in Kansas are:
#1
0.53%
#2
0.60%
#3
0.67%
#4
0.83%
#5
1.1%
#6
1.2%
#7
1.3%
#8
1.4%
#9
1.5%
#10
1.7%
What city has the Lowest Poverty Level Among Seniors Over the Age of 75 in Kansas?
Sterling has the Lowest Poverty Level Among Seniors Over the Age of 75 in Kansas with 0.53%.
What is the Poverty Level Among Seniors Over the Age of 75 in the State of Kansas?
Poverty Level Among Seniors Over the Age of 75 in Kansas is 9.7%.
What is the Poverty Level Among Seniors Over the Age of 75 in the United States?
Poverty Level Among Seniors Over the Age of 75 in the United States is 11.1%.