Cities with the Lowest Poverty Level Among Seniors Over the Age of 75 in North Dakota
RELATED REPORTS & OPTIONS
Lowest Poverty | Seniors 75+
North Dakota
Compare Cities
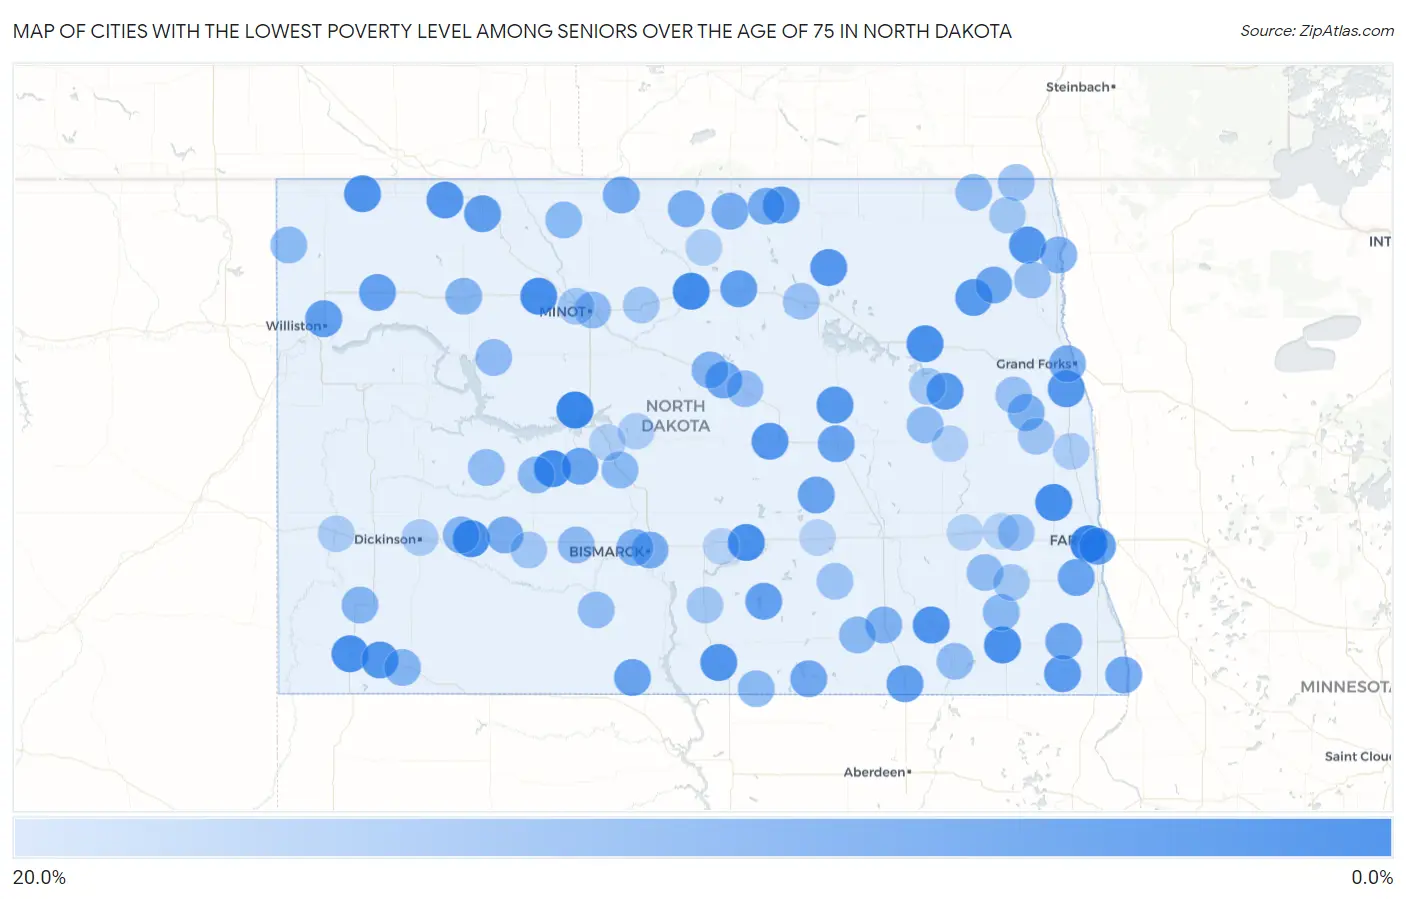
Map of Cities with the Lowest Poverty Level Among Seniors Over the Age of 75 in North Dakota
20.0%
0.0%
Cities with the Lowest Poverty Level Among Seniors Over the Age of 75 in North Dakota
| City | Senior Poverty | vs State | vs National | |
| 1. | West Fargo | 1.4% | 11.9%(-10.5)#1 | 11.1%(-9.62)#271 |
| 2. | Garrison | 1.7% | 11.9%(-10.2)#2 | 11.1%(-9.39)#377 |
| 3. | Towner | 2.9% | 11.9%(-8.97)#3 | 11.1%(-8.13)#1,199 |
| 4. | Hazen | 3.2% | 11.9%(-8.72)#4 | 11.1%(-7.87)#1,400 |
| 5. | Arthur | 3.2% | 11.9%(-8.69)#5 | 11.1%(-7.84)#1,443 |
| 6. | Berthold | 3.4% | 11.9%(-8.53)#6 | 11.1%(-7.68)#1,595 |
| 7. | Richardton | 3.4% | 11.9%(-8.47)#7 | 11.1%(-7.62)#1,635 |
| 8. | Steele | 3.8% | 11.9%(-8.14)#8 | 11.1%(-7.29)#1,946 |
| 9. | Bowman | 3.8% | 11.9%(-8.10)#9 | 11.1%(-7.25)#1,987 |
| 10. | Lakota | 4.1% | 11.9%(-7.83)#10 | 11.1%(-6.99)#2,264 |
| 11. | Gwinner | 4.3% | 11.9%(-7.66)#11 | 11.1%(-6.81)#2,438 |
| 12. | Lamoure | 4.8% | 11.9%(-7.15)#12 | 11.1%(-6.31)#2,945 |
| 13. | Crosby | 4.8% | 11.9%(-7.09)#13 | 11.1%(-6.24)#3,027 |
| 14. | Strasburg | 5.0% | 11.9%(-6.92)#14 | 11.1%(-6.07)#3,206 |
| 15. | St Thomas | 5.3% | 11.9%(-6.65)#15 | 11.1%(-5.80)#3,493 |
| 16. | Scranton | 5.4% | 11.9%(-6.51)#16 | 11.1%(-5.66)#3,613 |
| 17. | Lignite | 5.6% | 11.9%(-6.36)#17 | 11.1%(-5.51)#3,799 |
| 18. | Cando | 5.7% | 11.9%(-6.20)#18 | 11.1%(-5.35)#3,930 |
| 19. | Bowdon | 5.7% | 11.9%(-6.20)#19 | 11.1%(-5.35)#3,948 |
| 20. | New Rockford | 5.9% | 11.9%(-6.00)#20 | 11.1%(-5.15)#4,169 |
| 21. | Thompson | 6.0% | 11.9%(-5.92)#21 | 11.1%(-5.07)#4,256 |
| 22. | Mcville | 6.2% | 11.9%(-5.67)#22 | 11.1%(-4.82)#4,559 |
| 23. | Lankin | 6.2% | 11.9%(-5.67)#23 | 11.1%(-4.82)#4,574 |
| 24. | Lidgerwood | 6.4% | 11.9%(-5.51)#24 | 11.1%(-4.66)#4,715 |
| 25. | Rolla | 6.7% | 11.9%(-5.25)#25 | 11.1%(-4.40)#4,963 |
| 26. | Bowbells | 7.1% | 11.9%(-4.77)#26 | 11.1%(-3.92)#5,477 |
| 27. | Fargo | 7.4% | 11.9%(-4.56)#27 | 11.1%(-3.71)#5,678 |
| 28. | Rugby | 7.4% | 11.9%(-4.50)#28 | 11.1%(-3.65)#5,751 |
| 29. | Ellendale | 7.5% | 11.9%(-4.44)#29 | 11.1%(-3.59)#5,796 |
| 30. | Williston | 7.5% | 11.9%(-4.42)#30 | 11.1%(-3.57)#5,808 |
| 31. | Napoleon | 7.6% | 11.9%(-4.30)#31 | 11.1%(-3.45)#5,914 |
| 32. | Ray | 7.8% | 11.9%(-4.10)#32 | 11.1%(-3.25)#6,105 |
| 33. | Carrington | 8.3% | 11.9%(-3.58)#33 | 11.1%(-2.73)#6,575 |
| 34. | Selfridge | 8.3% | 11.9%(-3.58)#34 | 11.1%(-2.73)#6,645 |
| 35. | Woodworth | 8.3% | 11.9%(-3.58)#35 | 11.1%(-2.73)#6,664 |
| 36. | Stanton | 8.6% | 11.9%(-3.34)#36 | 11.1%(-2.50)#6,850 |
| 37. | Kindred | 8.7% | 11.9%(-3.22)#37 | 11.1%(-2.37)#6,961 |
| 38. | Wyndmere | 9.1% | 11.9%(-2.82)#38 | 11.1%(-1.98)#7,345 |
| 39. | Martin | 9.1% | 11.9%(-2.82)#39 | 11.1%(-1.98)#7,403 |
| 40. | Park River | 9.2% | 11.9%(-2.67)#40 | 11.1%(-1.82)#7,515 |
| 41. | Fairmount | 9.5% | 11.9%(-2.39)#41 | 11.1%(-1.54)#7,770 |
| 42. | Ashley | 9.6% | 11.9%(-2.35)#42 | 11.1%(-1.50)#7,806 |
| 43. | Dunseith | 10.2% | 11.9%(-1.71)#43 | 11.1%(-0.863)#8,397 |
| 44. | Belcourt | 10.3% | 11.9%(-1.57)#44 | 11.1%(-0.722)#8,515 |
| 45. | Westhope | 10.3% | 11.9%(-1.57)#45 | 11.1%(-0.722)#8,535 |
| 46. | Hebron | 10.6% | 11.9%(-1.33)#46 | 11.1%(-0.479)#8,775 |
| 47. | Grand Forks | 10.6% | 11.9%(-1.33)#47 | 11.1%(-0.477)#8,778 |
| 48. | Bismarck | 10.6% | 11.9%(-1.29)#48 | 11.1%(-0.441)#8,803 |
| 49. | Bottineau | 10.9% | 11.9%(-1.02)#49 | 11.1%(-0.176)#9,024 |
| 50. | Hatton | 11.1% | 11.9%(-0.804)#50 | 11.1%(+0.044)#9,220 |
| 51. | Edgeley | 11.5% | 11.9%(-0.440)#51 | 11.1%(+0.408)#9,542 |
| 52. | Mandan | 11.6% | 11.9%(-0.349)#52 | 11.1%(+0.500)#9,609 |
| 53. | Drayton | 11.7% | 11.9%(-0.249)#53 | 11.1%(+0.600)#9,690 |
| 54. | Anamoose | 12.1% | 11.9%(+0.206)#54 | 11.1%(+1.05)#10,046 |
| 55. | Stanley | 12.3% | 11.9%(+0.430)#55 | 11.1%(+1.28)#10,198 |
| 56. | Taylor | 12.5% | 11.9%(+0.584)#56 | 11.1%(+1.43)#10,392 |
| 57. | Reeder | 12.5% | 11.9%(+0.584)#57 | 11.1%(+1.43)#10,415 |
| 58. | Amidon | 12.5% | 11.9%(+0.584)#58 | 11.1%(+1.43)#10,424 |
| 59. | Lisbon | 12.9% | 11.9%(+0.950)#59 | 11.1%(+1.80)#10,669 |
| 60. | Beulah | 13.0% | 11.9%(+1.07)#60 | 11.1%(+1.91)#10,752 |
| 61. | Kulm | 13.0% | 11.9%(+1.13)#61 | 11.1%(+1.98)#10,807 |
| 62. | Washburn | 13.2% | 11.9%(+1.27)#62 | 11.1%(+2.12)#10,900 |
| 63. | Mohall | 13.3% | 11.9%(+1.42)#63 | 11.1%(+2.27)#11,015 |
| 64. | Grenora | 13.3% | 11.9%(+1.42)#64 | 11.1%(+2.27)#11,034 |
| 65. | Zeeland | 13.3% | 11.9%(+1.42)#65 | 11.1%(+2.27)#11,058 |
| 66. | New Salem | 13.7% | 11.9%(+1.77)#66 | 11.1%(+2.62)#11,278 |
| 67. | Minot | 13.8% | 11.9%(+1.87)#67 | 11.1%(+2.71)#11,341 |
| 68. | Parshall | 13.8% | 11.9%(+1.88)#68 | 11.1%(+2.73)#11,349 |
| 69. | Walhalla | 14.2% | 11.9%(+2.26)#69 | 11.1%(+3.11)#11,574 |
| 70. | Oakes | 14.3% | 11.9%(+2.37)#70 | 11.1%(+3.22)#11,620 |
| 71. | Flasher | 14.3% | 11.9%(+2.37)#71 | 11.1%(+3.22)#11,706 |
| 72. | Binford | 14.3% | 11.9%(+2.37)#72 | 11.1%(+3.22)#11,722 |
| 73. | Dodge | 14.3% | 11.9%(+2.37)#73 | 11.1%(+3.22)#11,739 |
| 74. | Nome | 14.3% | 11.9%(+2.37)#74 | 11.1%(+3.22)#11,748 |
| 75. | Harvey | 14.3% | 11.9%(+2.43)#75 | 11.1%(+3.27)#11,761 |
| 76. | Grafton | 14.8% | 11.9%(+2.91)#76 | 11.1%(+3.76)#12,056 |
| 77. | Neche | 15.0% | 11.9%(+3.08)#77 | 11.1%(+3.93)#12,142 |
| 78. | Buffalo | 15.0% | 11.9%(+3.08)#78 | 11.1%(+3.93)#12,153 |
| 79. | Northwood | 15.4% | 11.9%(+3.47)#79 | 11.1%(+4.32)#12,334 |
| 80. | Leeds | 15.4% | 11.9%(+3.47)#80 | 11.1%(+4.32)#12,350 |
| 81. | Gackle | 15.8% | 11.9%(+3.87)#81 | 11.1%(+4.72)#12,585 |
| 82. | Portland | 15.9% | 11.9%(+3.99)#82 | 11.1%(+4.84)#12,633 |
| 83. | Glen Ullin | 16.1% | 11.9%(+4.21)#83 | 11.1%(+5.06)#12,757 |
| 84. | Enderlin | 16.5% | 11.9%(+4.54)#84 | 11.1%(+5.39)#12,894 |
| 85. | Cavalier | 16.7% | 11.9%(+4.75)#85 | 11.1%(+5.60)#12,994 |
| 86. | Burlington | 16.7% | 11.9%(+4.75)#86 | 11.1%(+5.60)#12,996 |
| 87. | Granville | 16.7% | 11.9%(+4.75)#87 | 11.1%(+5.60)#13,072 |
| 88. | Hazelton | 16.7% | 11.9%(+4.75)#88 | 11.1%(+5.60)#13,086 |
| 89. | Pekin | 16.7% | 11.9%(+4.75)#89 | 11.1%(+5.60)#13,124 |
| 90. | Medora | 17.6% | 11.9%(+5.73)#90 | 11.1%(+6.58)#13,542 |
| 91. | Hillsboro | 17.9% | 11.9%(+5.94)#91 | 11.1%(+6.79)#13,631 |
| 92. | Dickinson | 17.9% | 11.9%(+5.95)#92 | 11.1%(+6.80)#13,650 |
| 93. | Turtle Lake | 18.0% | 11.9%(+6.12)#93 | 11.1%(+6.97)#13,698 |
| 94. | Underwood | 18.2% | 11.9%(+6.27)#94 | 11.1%(+7.11)#13,766 |
| 95. | Willow City | 18.2% | 11.9%(+6.27)#95 | 11.1%(+7.11)#13,815 |
| 96. | Cooperstown | 18.3% | 11.9%(+6.36)#96 | 11.1%(+7.21)#13,853 |
| 97. | Valley City | 18.8% | 11.9%(+6.91)#97 | 11.1%(+7.76)#14,075 |
| 98. | Tower City | 19.0% | 11.9%(+7.13)#98 | 11.1%(+7.98)#14,164 |
| 99. | Medina | 19.2% | 11.9%(+7.32)#99 | 11.1%(+8.16)#14,245 |
| 100. | Driscoll | 19.2% | 11.9%(+7.32)#100 | 11.1%(+8.16)#14,246 |
Common Questions
What are the Top 10 Cities with the Lowest Poverty Level Among Seniors Over the Age of 75 in North Dakota?
Top 10 Cities with the Lowest Poverty Level Among Seniors Over the Age of 75 in North Dakota are:
#1
1.4%
#2
1.7%
#3
2.9%
#4
3.2%
#5
3.2%
#6
3.4%
#7
3.4%
#8
3.8%
#9
3.8%
#10
4.1%
What city has the Lowest Poverty Level Among Seniors Over the Age of 75 in North Dakota?
West Fargo has the Lowest Poverty Level Among Seniors Over the Age of 75 in North Dakota with 1.4%.
What is the Poverty Level Among Seniors Over the Age of 75 in the State of North Dakota?
Poverty Level Among Seniors Over the Age of 75 in North Dakota is 11.9%.
What is the Poverty Level Among Seniors Over the Age of 75 in the United States?
Poverty Level Among Seniors Over the Age of 75 in the United States is 11.1%.