Martin Lake, MN
Martin Lake Map
Martin Lake Overview
882
TOTAL POPULATION
447
MALE POPULATION
435
FEMALE POPULATION
102.76
MALES / 100 FEMALES
97.32
FEMALES / 100 MALES
54.8
MEDIAN AGE
2.7
AVG FAMILY SIZE
2.2
AVG HOUSEHOLD SIZE
$48,494
PER CAPITA INCOME
$117,222
AVG FAMILY INCOME
$111,607
AVG HOUSEHOLD INCOME
45.3%
WAGE / INCOME GAP [ % ]
54.7¢/ $1
WAGE / INCOME GAP [ $ ]
0.32
INEQUALITY / GINI INDEX
508
LABOR FORCE [ PEOPLE ]
67.8%
PERCENT IN LABOR FORCE
2.6%
UNEMPLOYMENT RATE
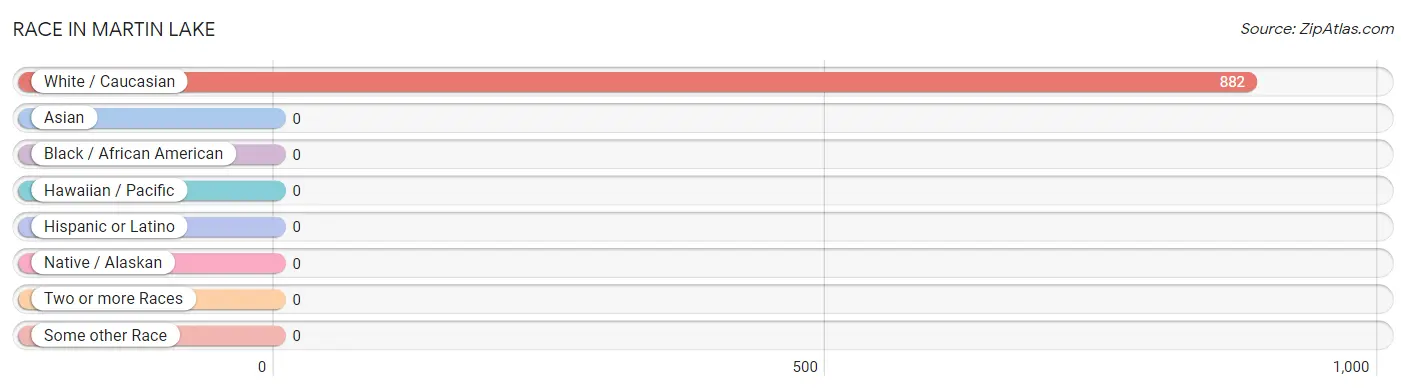
Race in Martin Lake
The most populous races in Martin Lake are , and White / Caucasian (882 | 100.0%).
| Race | # Population | % Population |
| Asian | 0 | 0.0% |
| Black / African American | 0 | 0.0% |
| Hawaiian / Pacific | 0 | 0.0% |
| Hispanic or Latino | 0 | 0.0% |
| Native / Alaskan | 0 | 0.0% |
| White / Caucasian | 882 | 100.0% |
| Two or more Races | 0 | 0.0% |
| Some other Race | 0 | 0.0% |
| Total | 882 | 100.0% |
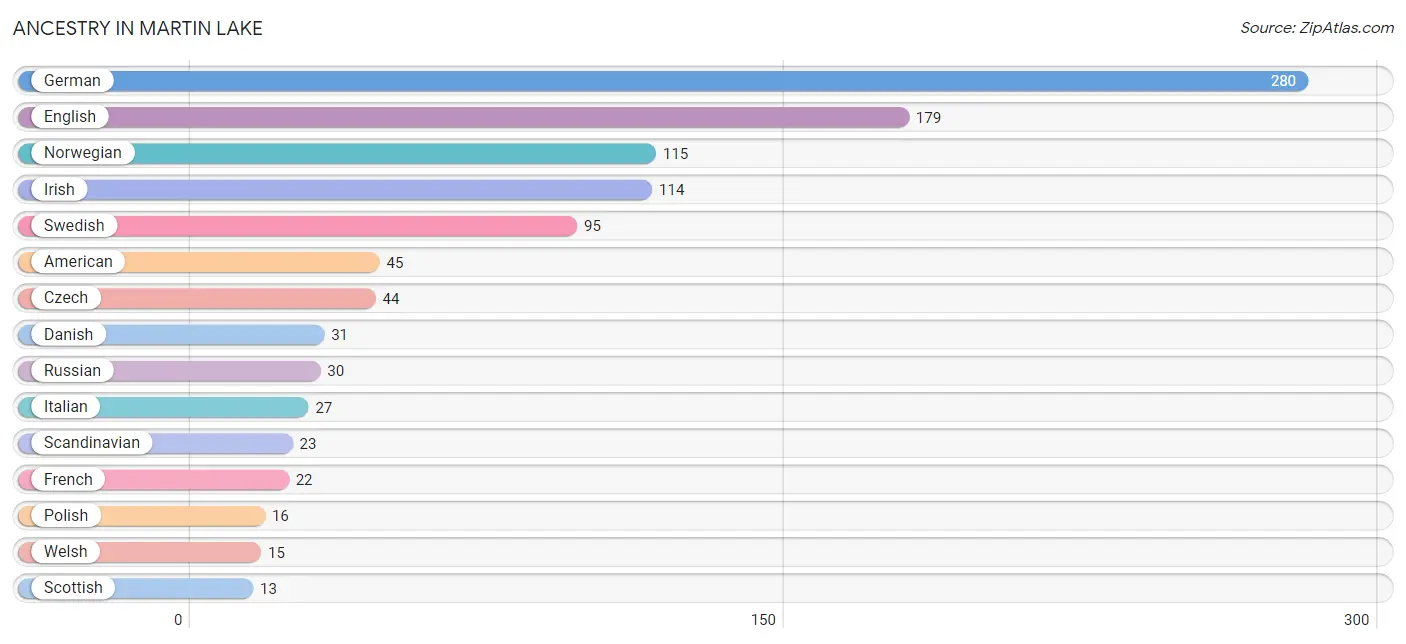
Ancestry in Martin Lake
The most populous ancestries reported in Martin Lake are German (280 | 31.8%), English (179 | 20.3%), Norwegian (115 | 13.0%), Irish (114 | 12.9%), and Swedish (95 | 10.8%), together accounting for 88.8% of all Martin Lake residents.
| Ancestry | # Population | % Population |
| American | 45 | 5.1% |
| Czech | 44 | 5.0% |
| Danish | 31 | 3.5% |
| Dutch | 9 | 1.0% |
| English | 179 | 20.3% |
| French | 22 | 2.5% |
| German | 280 | 31.8% |
| Irish | 114 | 12.9% |
| Italian | 27 | 3.1% |
| Norwegian | 115 | 13.0% |
| Polish | 16 | 1.8% |
| Russian | 30 | 3.4% |
| Scandinavian | 23 | 2.6% |
| Scottish | 13 | 1.5% |
| Swedish | 95 | 10.8% |
| Welsh | 15 | 1.7% | View All 16 Rows |
Immigrants in Martin Lake

| Immigration Origin | # Population | % Population | View All 0 Rows |
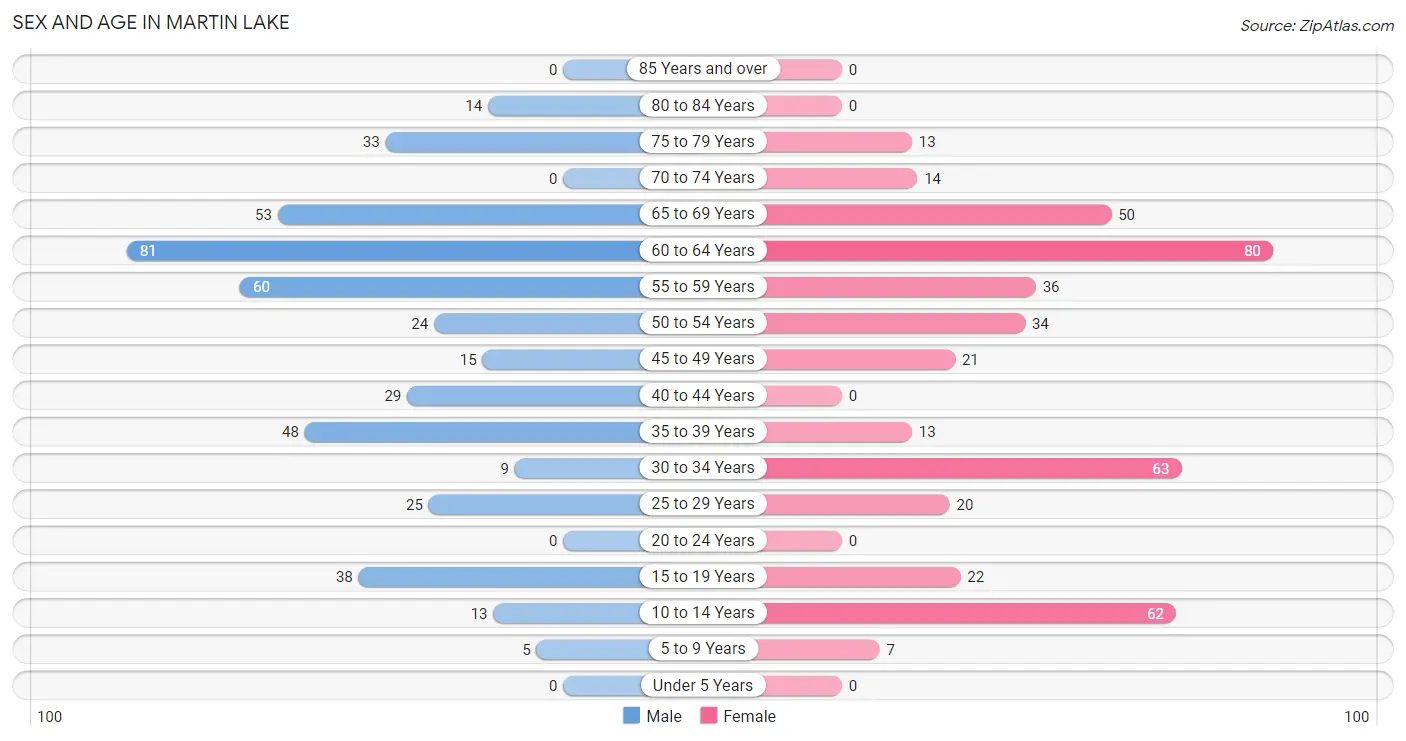
Sex and Age in Martin Lake
Sex and Age in Martin Lake
The most populous age groups in Martin Lake are 60 to 64 Years (81 | 18.1%) for men and 60 to 64 Years (80 | 18.4%) for women.
| Age Bracket | Male | Female |
| Under 5 Years | 0 (0.0%) | 0 (0.0%) |
| 5 to 9 Years | 5 (1.1%) | 7 (1.6%) |
| 10 to 14 Years | 13 (2.9%) | 62 (14.2%) |
| 15 to 19 Years | 38 (8.5%) | 22 (5.1%) |
| 20 to 24 Years | 0 (0.0%) | 0 (0.0%) |
| 25 to 29 Years | 25 (5.6%) | 20 (4.6%) |
| 30 to 34 Years | 9 (2.0%) | 63 (14.5%) |
| 35 to 39 Years | 48 (10.7%) | 13 (3.0%) |
| 40 to 44 Years | 29 (6.5%) | 0 (0.0%) |
| 45 to 49 Years | 15 (3.4%) | 21 (4.8%) |
| 50 to 54 Years | 24 (5.4%) | 34 (7.8%) |
| 55 to 59 Years | 60 (13.4%) | 36 (8.3%) |
| 60 to 64 Years | 81 (18.1%) | 80 (18.4%) |
| 65 to 69 Years | 53 (11.9%) | 50 (11.5%) |
| 70 to 74 Years | 0 (0.0%) | 14 (3.2%) |
| 75 to 79 Years | 33 (7.4%) | 13 (3.0%) |
| 80 to 84 Years | 14 (3.1%) | 0 (0.0%) |
| 85 Years and over | 0 (0.0%) | 0 (0.0%) |
| Total | 447 (100.0%) | 435 (100.0%) |
Families and Households in Martin Lake
Median Family Size in Martin Lake
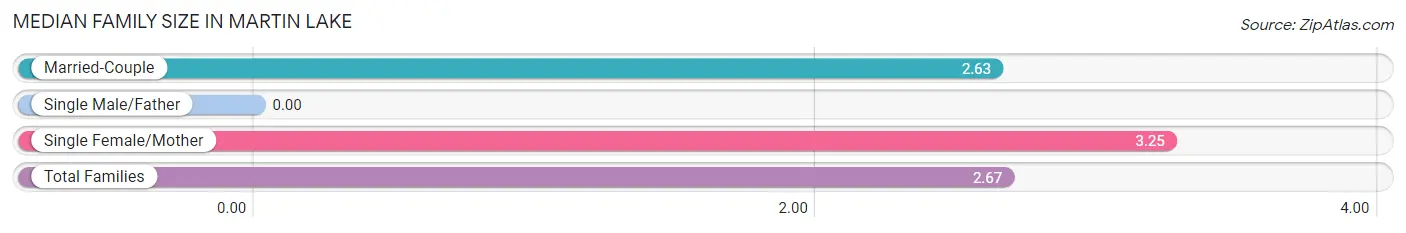
| Family Type | # Families | Family Size |
| Married-Couple | 272 (93.1%) | 2.63 |
| Single Male/Father | 0 (0.0%) | - |
| Single Female/Mother | 20 (6.9%) | 3.25 |
| Total Families | 292 (100.0%) | 2.67 |
Median Household Size in Martin Lake
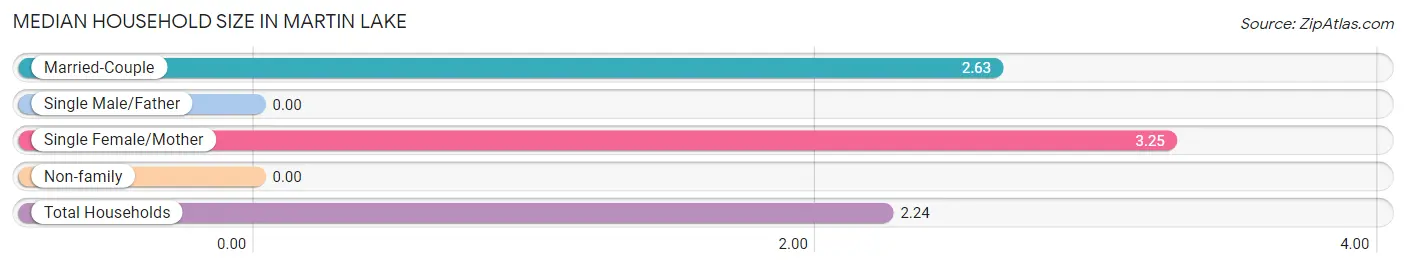
| Household Type | # Households | Household Size |
| Married-Couple | 272 (69.2%) | 2.63 |
| Single Male/Father | 0 (0.0%) | - |
| Single Female/Mother | 20 (5.1%) | 3.25 |
| Non-family | 101 (25.7%) | - |
| Total Households | 393 (100.0%) | 2.24 |
Household Size by Marriage Status in Martin Lake
Out of a total of 393 households in Martin Lake, 292 (74.3%) are family households, while 101 (25.7%) are nonfamily households. The most numerous type of family households are 2-person households, comprising 194, and the most common type of nonfamily households are 1-person households, comprising 101.
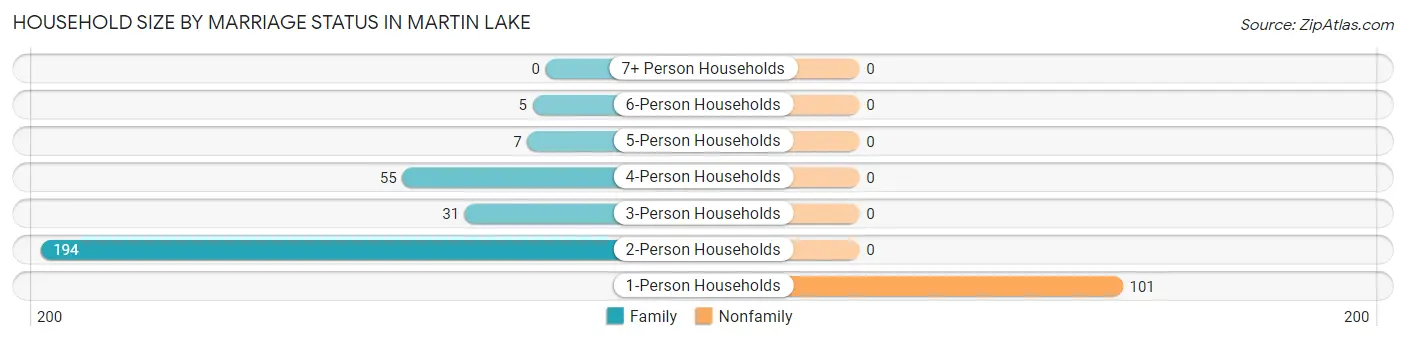
| Household Size | Family Households | Nonfamily Households |
| 1-Person Households | - | 101 (25.7%) |
| 2-Person Households | 194 (49.4%) | 0 (0.0%) |
| 3-Person Households | 31 (7.9%) | 0 (0.0%) |
| 4-Person Households | 55 (14.0%) | 0 (0.0%) |
| 5-Person Households | 7 (1.8%) | 0 (0.0%) |
| 6-Person Households | 5 (1.3%) | 0 (0.0%) |
| 7+ Person Households | 0 (0.0%) | 0 (0.0%) |
| Total | 292 (74.3%) | 101 (25.7%) |
Female Fertility in Martin Lake
Fertility by Age in Martin Lake
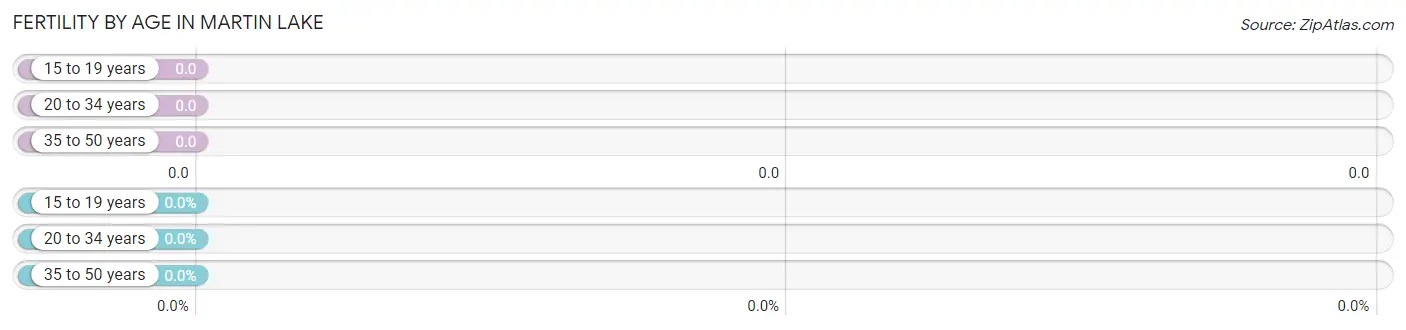
| Age Bracket | Women with Births | Births / 1,000 Women |
| 15 to 19 years | 0 (0.0%) | 0.0 |
| 20 to 34 years | 0 (0.0%) | 0.0 |
| 35 to 50 years | 0 (0.0%) | 0.0 |
| Total | 0 (0.0%) | 0.0 |
Fertility by Age by Marriage Status in Martin Lake
| Age Bracket | Married | Unmarried |
| 15 to 19 years | 0 (0.0%) | 0 (0.0%) |
| 20 to 34 years | 0 (0.0%) | 0 (0.0%) |
| 35 to 50 years | 0 (0.0%) | 0 (0.0%) |
| Total | 0 (0.0%) | 0 (0.0%) |
Fertility by Education in Martin Lake
| Educational Attainment | Women with Births | Births / 1,000 Women |
| Less than High School | 0 (0.0%) | 0.0 |
| High School Diploma | 0 (0.0%) | 0.0 |
| College or Associate's Degree | 0 (0.0%) | 0.0 |
| Bachelor's Degree | 0 (0.0%) | 0.0 |
| Graduate Degree | 0 (0.0%) | 0.0 |
| Total | 0 (0.0%) | 0.0 |
Fertility by Education by Marriage Status in Martin Lake
| Educational Attainment | Married | Unmarried |
| Less than High School | 0 (0.0%) | 0 (0.0%) |
| High School Diploma | 0 (0.0%) | 0 (0.0%) |
| College or Associate's Degree | 0 (0.0%) | 0 (0.0%) |
| Bachelor's Degree | 0 (0.0%) | 0 (0.0%) |
| Graduate Degree | 0 (0.0%) | 0 (0.0%) |
| Total | 0 (0.0%) | 0 (0.0%) |
Income in Martin Lake
Income Overview in Martin Lake
Per Capita Income in Martin Lake is $48,494, while median incomes of families and households are $117,222 and $111,607 respectively.
| Characteristic | Number | Measure |
| Per Capita Income | 882 | $48,494 |
| Median Family Income | 292 | $117,222 |
| Mean Family Income | 292 | $129,455 |
| Median Household Income | 393 | $111,607 |
| Mean Household Income | 393 | $107,299 |
| Income Deficit | 292 | $0 |
| Wage / Income Gap (%) | 882 | 45.28% |
| Wage / Income Gap ($) | 882 | 54.72¢ per $1 |
| Gini / Inequality Index | 882 | 0.32 |
Earnings by Sex in Martin Lake
Average Earnings in Martin Lake are $51,747, $64,250 for men and $35,156 for women, a difference of 45.3%.
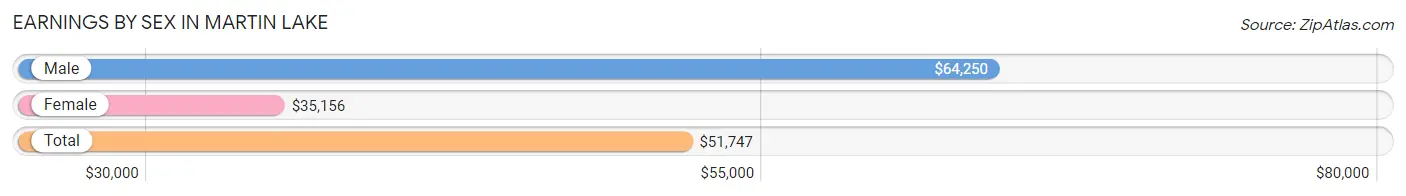
| Sex | Number | Average Earnings |
| Male | 289 (53.3%) | $64,250 |
| Female | 253 (46.7%) | $35,156 |
| Total | 542 (100.0%) | $51,747 |
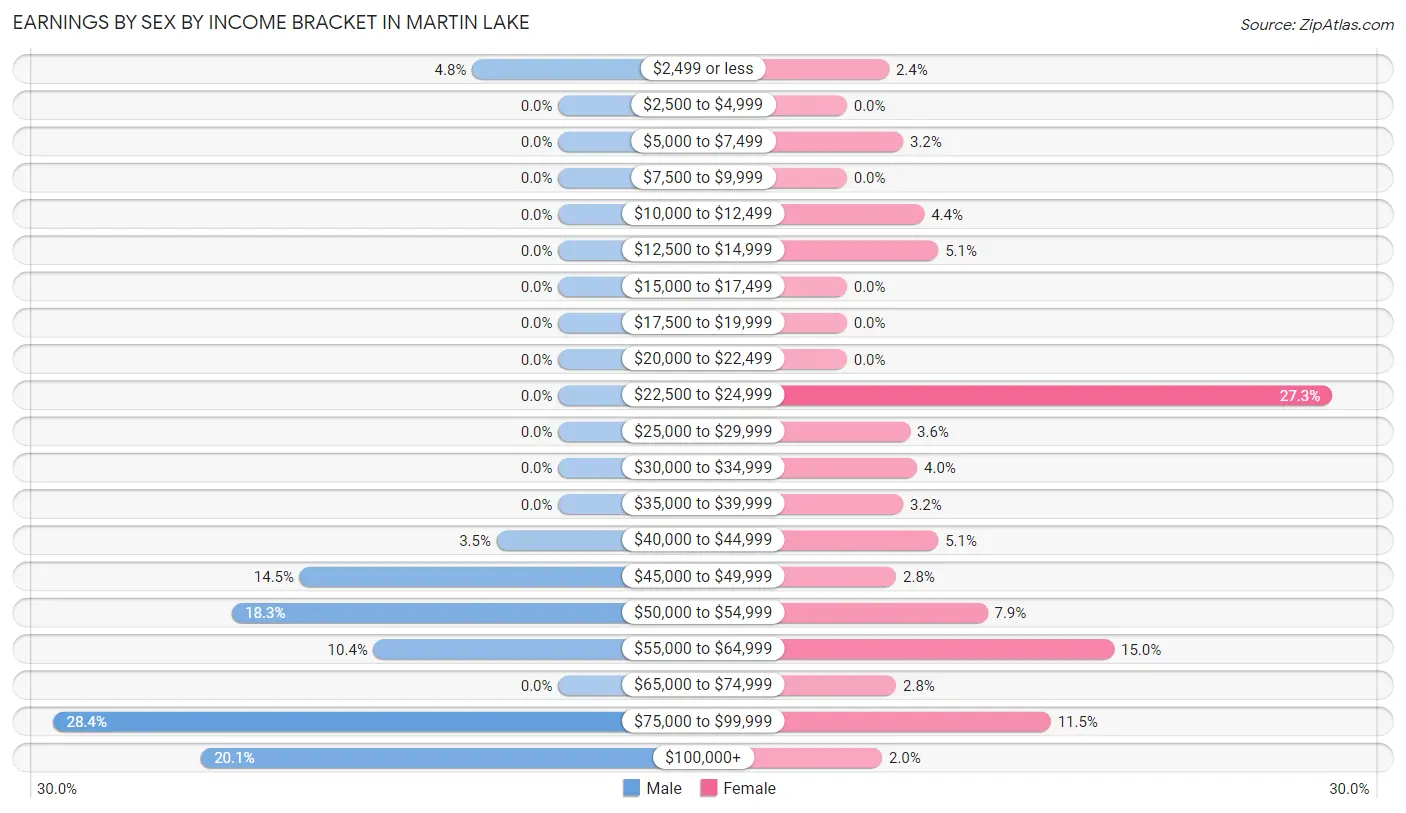
Earnings by Sex by Income Bracket in Martin Lake
The most common earnings brackets in Martin Lake are $75,000 to $99,999 for men (82 | 28.4%) and $22,500 to $24,999 for women (69 | 27.3%).
| Income | Male | Female |
| $2,499 or less | 14 (4.8%) | 6 (2.4%) |
| $2,500 to $4,999 | 0 (0.0%) | 0 (0.0%) |
| $5,000 to $7,499 | 0 (0.0%) | 8 (3.2%) |
| $7,500 to $9,999 | 0 (0.0%) | 0 (0.0%) |
| $10,000 to $12,499 | 0 (0.0%) | 11 (4.3%) |
| $12,500 to $14,999 | 0 (0.0%) | 13 (5.1%) |
| $15,000 to $17,499 | 0 (0.0%) | 0 (0.0%) |
| $17,500 to $19,999 | 0 (0.0%) | 0 (0.0%) |
| $20,000 to $22,499 | 0 (0.0%) | 0 (0.0%) |
| $22,500 to $24,999 | 0 (0.0%) | 69 (27.3%) |
| $25,000 to $29,999 | 0 (0.0%) | 9 (3.6%) |
| $30,000 to $34,999 | 0 (0.0%) | 10 (4.0%) |
| $35,000 to $39,999 | 0 (0.0%) | 8 (3.2%) |
| $40,000 to $44,999 | 10 (3.5%) | 13 (5.1%) |
| $45,000 to $49,999 | 42 (14.5%) | 7 (2.8%) |
| $50,000 to $54,999 | 53 (18.3%) | 20 (7.9%) |
| $55,000 to $64,999 | 30 (10.4%) | 38 (15.0%) |
| $65,000 to $74,999 | 0 (0.0%) | 7 (2.8%) |
| $75,000 to $99,999 | 82 (28.4%) | 29 (11.5%) |
| $100,000+ | 58 (20.1%) | 5 (2.0%) |
| Total | 289 (100.0%) | 253 (100.0%) |
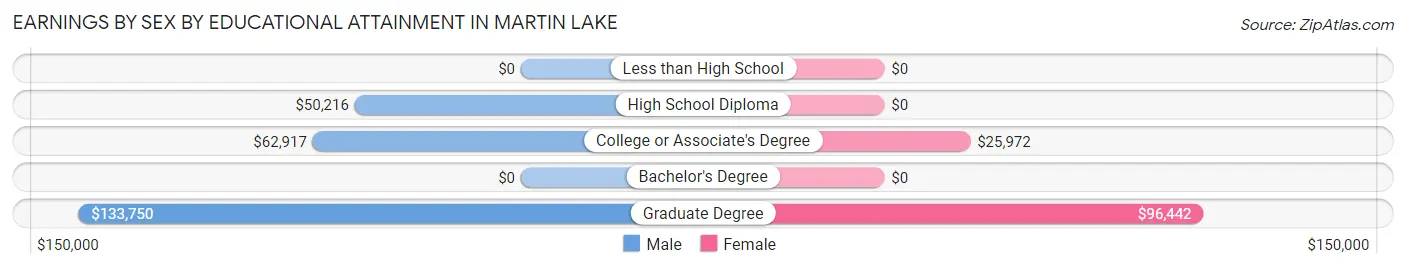
Earnings by Sex by Educational Attainment in Martin Lake
Average earnings in Martin Lake are $64,250 for men and $37,344 for women, a difference of 41.9%. Men with an educational attainment of graduate degree enjoy the highest average annual earnings of $133,750, while those with high school diploma education earn the least with $50,216. Women with an educational attainment of graduate degree earn the most with the average annual earnings of $96,442, while those with college or associate's degree education have the smallest earnings of $25,972.
| Educational Attainment | Male Income | Female Income |
| Less than High School | - | - |
| High School Diploma | $50,216 | $0 |
| College or Associate's Degree | $62,917 | $25,972 |
| Bachelor's Degree | - | - |
| Graduate Degree | $133,750 | $96,442 |
| Total | $64,250 | $37,344 |
Family Income in Martin Lake
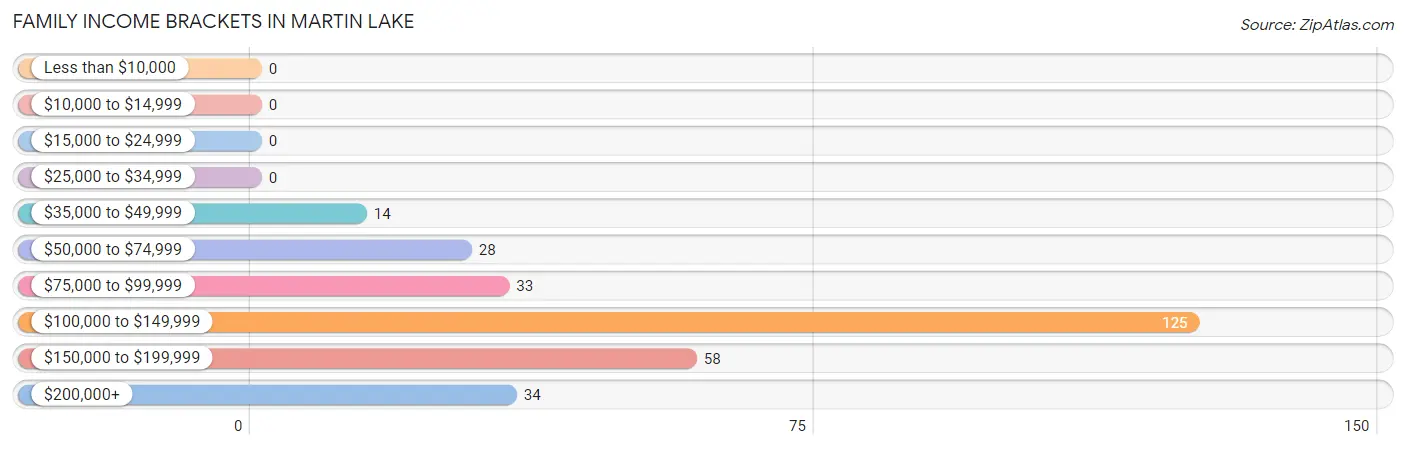
Family Income Brackets in Martin Lake
According to the Martin Lake family income data, there are 125 families falling into the $100,000 to $149,999 income range, which is the most common income bracket and makes up 42.8% of all families.
| Income Bracket | # Families | % Families |
| Less than $10,000 | 0 | 0.0% |
| $10,000 to $14,999 | 0 | 0.0% |
| $15,000 to $24,999 | 0 | 0.0% |
| $25,000 to $34,999 | 0 | 0.0% |
| $35,000 to $49,999 | 14 | 4.8% |
| $50,000 to $74,999 | 28 | 9.6% |
| $75,000 to $99,999 | 33 | 11.3% |
| $100,000 to $149,999 | 125 | 42.8% |
| $150,000 to $199,999 | 58 | 19.9% |
| $200,000+ | 34 | 11.6% |
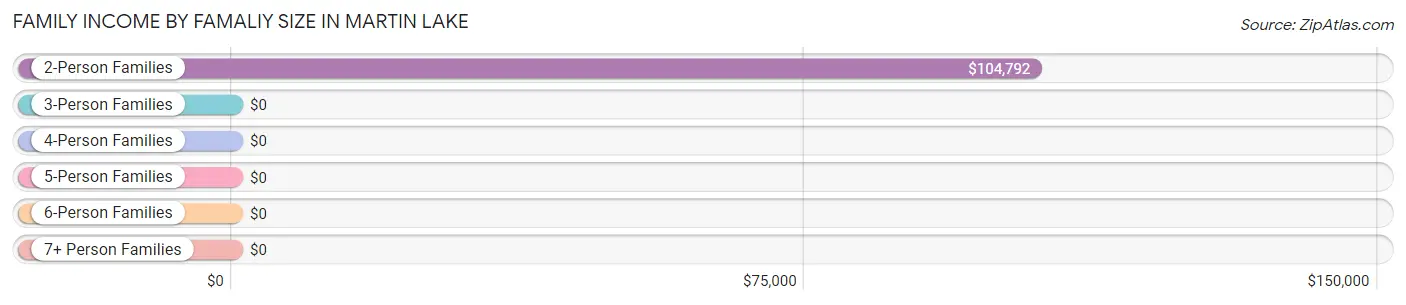
Family Income by Famaliy Size in Martin Lake
2-person families (194 | 66.4%) account for the highest median family income in Martin Lake with $104,792 per family, while 2-person families (194 | 66.4%) have the highest median income of $52,396 per family member.
| Income Bracket | # Families | Median Income |
| 2-Person Families | 194 (66.4%) | $104,792 |
| 3-Person Families | 31 (10.6%) | $0 |
| 4-Person Families | 55 (18.8%) | $0 |
| 5-Person Families | 7 (2.4%) | $0 |
| 6-Person Families | 5 (1.7%) | $0 |
| 7+ Person Families | 0 (0.0%) | $0 |
| Total | 292 (100.0%) | $117,222 |
Family Income by Number of Earners in Martin Lake
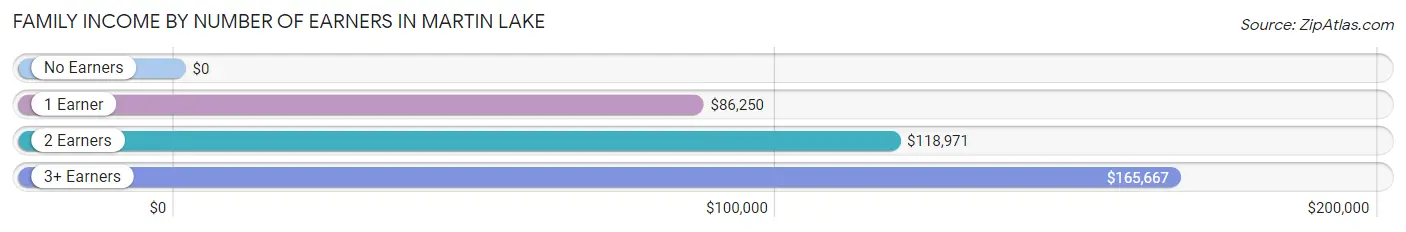
| Number of Earners | # Families | Median Income |
| No Earners | 0 (0.0%) | $0 |
| 1 Earner | 118 (40.4%) | $86,250 |
| 2 Earners | 152 (52.0%) | $118,971 |
| 3+ Earners | 22 (7.5%) | $165,667 |
| Total | 292 (100.0%) | $117,222 |
Household Income in Martin Lake
Household Income Brackets in Martin Lake
With 133 households falling in the category, the $100,000 to $149,999 income range is the most frequent in Martin Lake, accounting for 33.8% of all households.
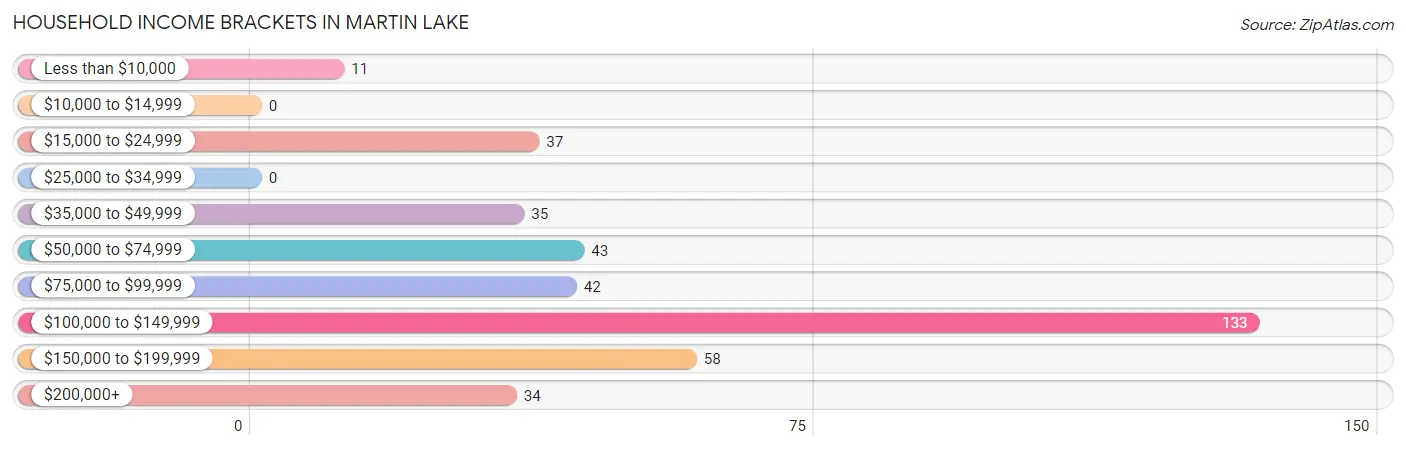
| Income Bracket | # Households | % Households |
| Less than $10,000 | 11 | 2.8% |
| $10,000 to $14,999 | 0 | 0.0% |
| $15,000 to $24,999 | 37 | 9.4% |
| $25,000 to $34,999 | 0 | 0.0% |
| $35,000 to $49,999 | 35 | 8.9% |
| $50,000 to $74,999 | 43 | 10.9% |
| $75,000 to $99,999 | 42 | 10.7% |
| $100,000 to $149,999 | 133 | 33.8% |
| $150,000 to $199,999 | 58 | 14.8% |
| $200,000+ | 34 | 8.7% |
Household Income by Householder Age in Martin Lake
The median household income in Martin Lake is $111,607, with the highest median household income of $117,831 found in the 25 to 44 years age bracket for the primary householder. A total of 87 households (22.1%) fall into this category.
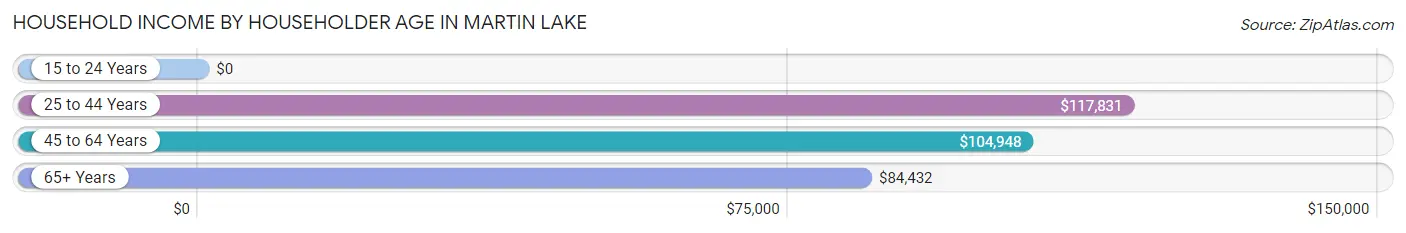
| Income Bracket | # Households | Median Income |
| 15 to 24 Years | 0 (0.0%) | $0 |
| 25 to 44 Years | 87 (22.1%) | $117,831 |
| 45 to 64 Years | 197 (50.1%) | $104,948 |
| 65+ Years | 109 (27.7%) | $84,432 |
| Total | 393 (100.0%) | $111,607 |
Poverty in Martin Lake
Income Below Poverty by Sex and Age in Martin Lake
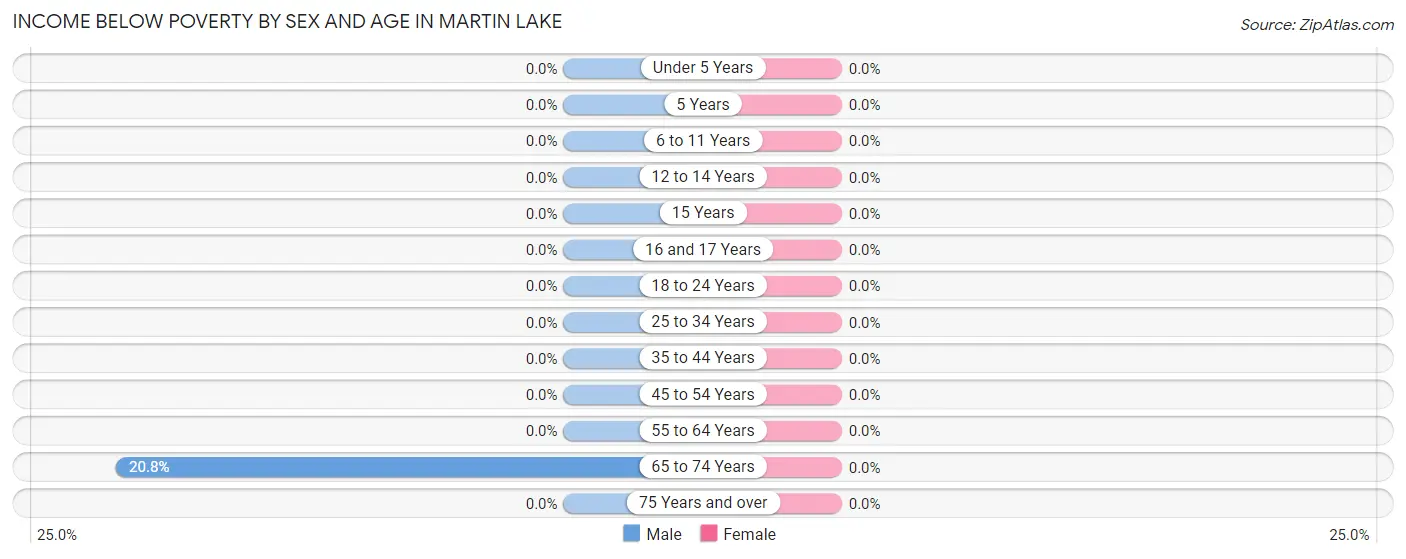
| Age Bracket | Male | Female |
| Under 5 Years | 0 (0.0%) | 0 (0.0%) |
| 5 Years | 0 (0.0%) | 0 (0.0%) |
| 6 to 11 Years | 0 (0.0%) | 0 (0.0%) |
| 12 to 14 Years | 0 (0.0%) | 0 (0.0%) |
| 15 Years | 0 (0.0%) | 0 (0.0%) |
| 16 and 17 Years | 0 (0.0%) | 0 (0.0%) |
| 18 to 24 Years | 0 (0.0%) | 0 (0.0%) |
| 25 to 34 Years | 0 (0.0%) | 0 (0.0%) |
| 35 to 44 Years | 0 (0.0%) | 0 (0.0%) |
| 45 to 54 Years | 0 (0.0%) | 0 (0.0%) |
| 55 to 64 Years | 0 (0.0%) | 0 (0.0%) |
| 65 to 74 Years | 11 (20.7%) | 0 (0.0%) |
| 75 Years and over | 0 (0.0%) | 0 (0.0%) |
| Total | 11 (2.5%) | 0 (0.0%) |
Income Above Poverty by Sex and Age in Martin Lake
According to the poverty statistics in Martin Lake, males aged 6 to 11 years and females aged 6 to 11 years are the age groups that are most secure financially, with 100.0% of males and 100.0% of females in these age groups living above the poverty line.
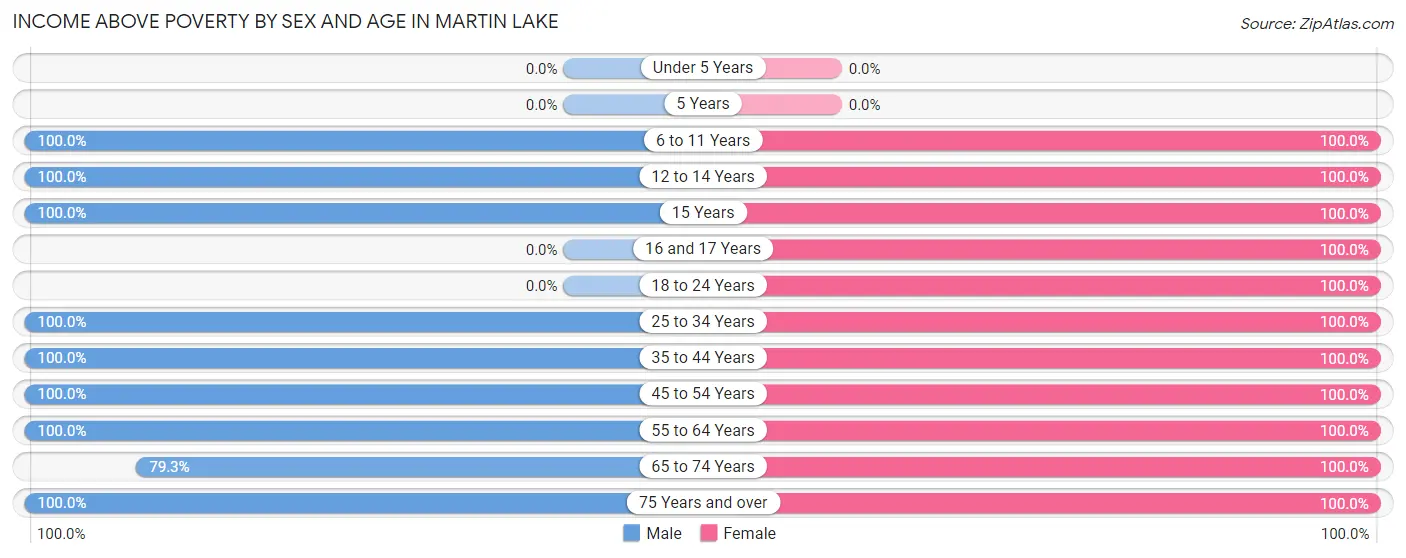
| Age Bracket | Male | Female |
| Under 5 Years | 0 (0.0%) | 0 (0.0%) |
| 5 Years | 0 (0.0%) | 0 (0.0%) |
| 6 to 11 Years | 5 (100.0%) | 44 (100.0%) |
| 12 to 14 Years | 13 (100.0%) | 25 (100.0%) |
| 15 Years | 38 (100.0%) | 8 (100.0%) |
| 16 and 17 Years | 0 (0.0%) | 6 (100.0%) |
| 18 to 24 Years | 0 (0.0%) | 8 (100.0%) |
| 25 to 34 Years | 34 (100.0%) | 83 (100.0%) |
| 35 to 44 Years | 77 (100.0%) | 13 (100.0%) |
| 45 to 54 Years | 39 (100.0%) | 55 (100.0%) |
| 55 to 64 Years | 141 (100.0%) | 116 (100.0%) |
| 65 to 74 Years | 42 (79.2%) | 64 (100.0%) |
| 75 Years and over | 47 (100.0%) | 13 (100.0%) |
| Total | 436 (97.5%) | 435 (100.0%) |
Income Below Poverty Among Married-Couple Families in Martin Lake
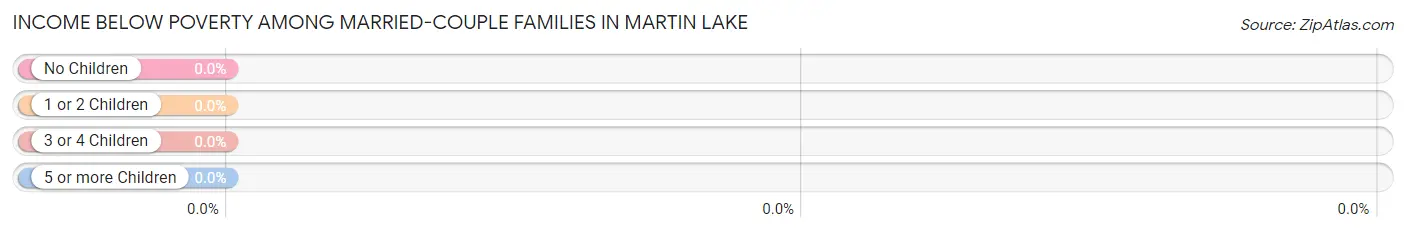
| Children | Above Poverty | Below Poverty |
| No Children | 210 (100.0%) | 0 (0.0%) |
| 1 or 2 Children | 62 (100.0%) | 0 (0.0%) |
| 3 or 4 Children | 0 (0.0%) | 0 (0.0%) |
| 5 or more Children | 0 (0.0%) | 0 (0.0%) |
| Total | 272 (100.0%) | 0 (0.0%) |
Income Below Poverty Among Single-Parent Households in Martin Lake
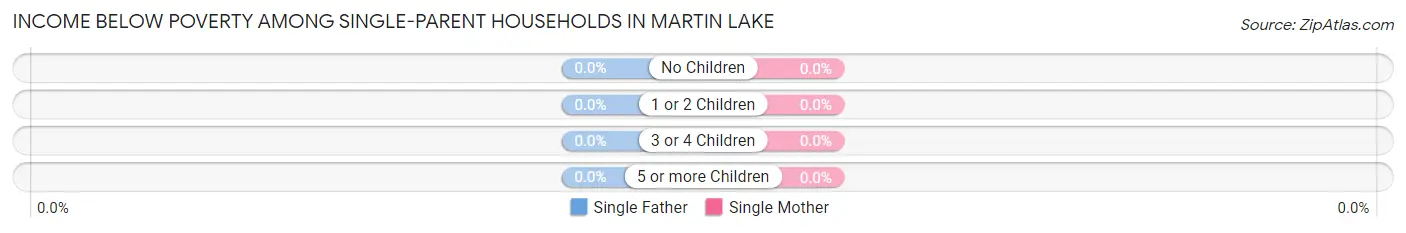
| Children | Single Father | Single Mother |
| No Children | 0 (0.0%) | 0 (0.0%) |
| 1 or 2 Children | 0 (0.0%) | 0 (0.0%) |
| 3 or 4 Children | 0 (0.0%) | 0 (0.0%) |
| 5 or more Children | 0 (0.0%) | 0 (0.0%) |
| Total | 0 (0.0%) | 0 (0.0%) |
Income Below Poverty Among Married-Couple vs Single-Parent Households in Martin Lake
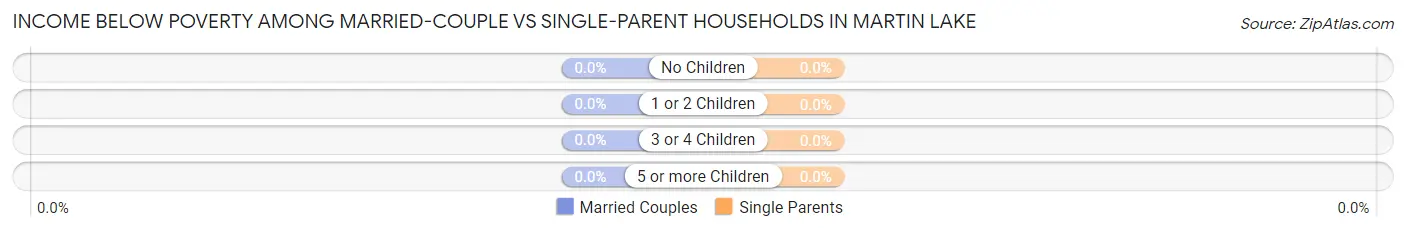
| Children | Married-Couple Families | Single-Parent Households |
| No Children | 0 (0.0%) | 0 (0.0%) |
| 1 or 2 Children | 0 (0.0%) | 0 (0.0%) |
| 3 or 4 Children | 0 (0.0%) | 0 (0.0%) |
| 5 or more Children | 0 (0.0%) | 0 (0.0%) |
| Total | 0 (0.0%) | 0 (0.0%) |
Employment Characteristics in Martin Lake
Employment by Class of Employer in Martin Lake
Among the 479 employed individuals in Martin Lake, private company employees (272 | 56.8%), not-for-profit organizations (97 | 20.3%), and local government employees (70 | 14.6%) make up the most common classes of employment.
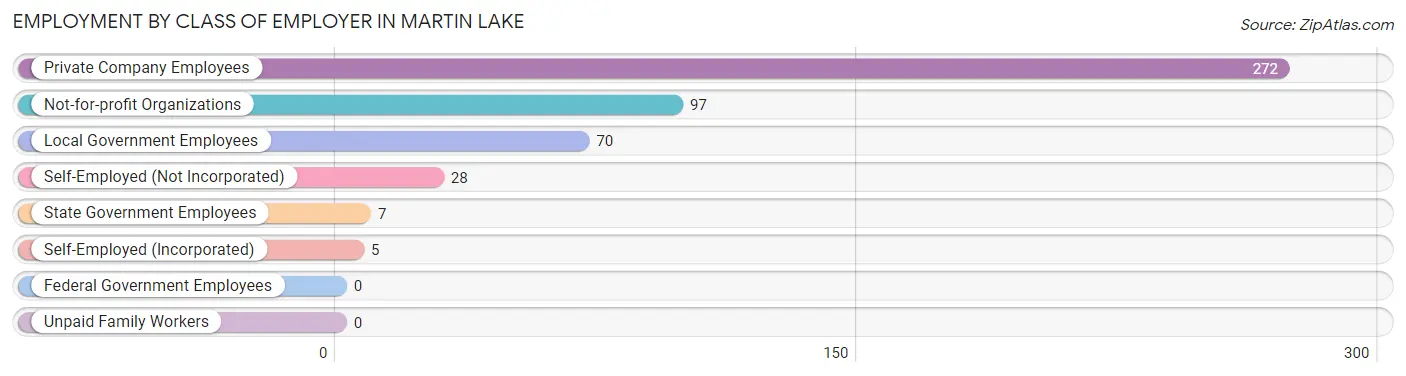
| Employer Class | # Employees | % Employees |
| Private Company Employees | 272 | 56.8% |
| Self-Employed (Incorporated) | 5 | 1.0% |
| Self-Employed (Not Incorporated) | 28 | 5.9% |
| Not-for-profit Organizations | 97 | 20.3% |
| Local Government Employees | 70 | 14.6% |
| State Government Employees | 7 | 1.5% |
| Federal Government Employees | 0 | 0.0% |
| Unpaid Family Workers | 0 | 0.0% |
| Total | 479 | 100.0% |
Employment Status by Age in Martin Lake
According to the labor force statistics for Martin Lake, out of the total population over 16 years of age (749), 67.8% or 508 individuals are in the labor force, with 2.6% or 13 of them unemployed. The age group with the highest labor force participation rate is 16 to 19 years, with 100.0% or 14 individuals in the labor force. Within the labor force, the 35 to 44 years age range has the highest percentage of unemployed individuals, with 14.4% or 13 of them being unemployed.
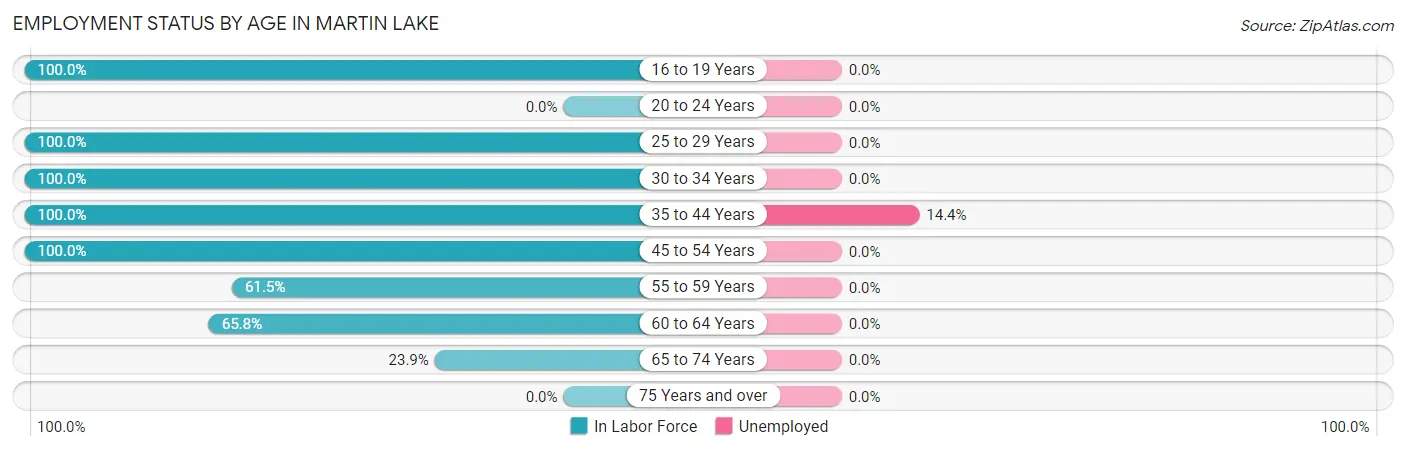
| Age Bracket | In Labor Force | Unemployed |
| 16 to 19 Years | 14 (100.0%) | 0 (0.0%) |
| 20 to 24 Years | 0 (0.0%) | 0 (0.0%) |
| 25 to 29 Years | 45 (100.0%) | 0 (0.0%) |
| 30 to 34 Years | 72 (100.0%) | 0 (0.0%) |
| 35 to 44 Years | 90 (100.0%) | 13 (14.4%) |
| 45 to 54 Years | 94 (100.0%) | 0 (0.0%) |
| 55 to 59 Years | 59 (61.5%) | 0 (0.0%) |
| 60 to 64 Years | 106 (65.8%) | 0 (0.0%) |
| 65 to 74 Years | 28 (23.9%) | 0 (0.0%) |
| 75 Years and over | 0 (0.0%) | 0 (0.0%) |
| Total | 508 (67.8%) | 13 (2.6%) |
Employment Status by Educational Attainment in Martin Lake
According to labor force statistics for Martin Lake, 83.5% of individuals (466) out of the total population between 25 and 64 years of age (558) are in the labor force, with 2.8% or 13 of them being unemployed. The group with the highest labor force participation rate are those with the educational attainment of less than high school, with 100.0% or 24 individuals in the labor force. Within the labor force, individuals with college / associate degree education have the highest percentage of unemployment, with 6.8% or 13 of them being unemployed.
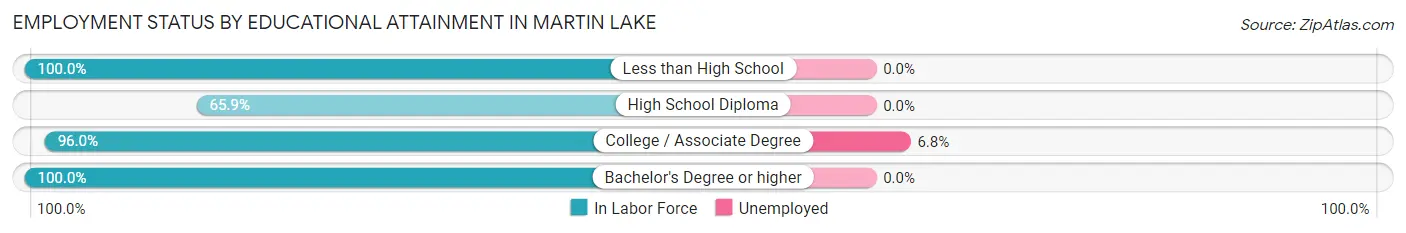
| Educational Attainment | In Labor Force | Unemployed |
| Less than High School | 24 (100.0%) | 0 (0.0%) |
| High School Diploma | 162 (65.9%) | 0 (0.0%) |
| College / Associate Degree | 192 (96.0%) | 14 (6.8%) |
| Bachelor's Degree or higher | 88 (100.0%) | 0 (0.0%) |
| Total | 466 (83.5%) | 16 (2.8%) |
Employment Occupations by Sex in Martin Lake
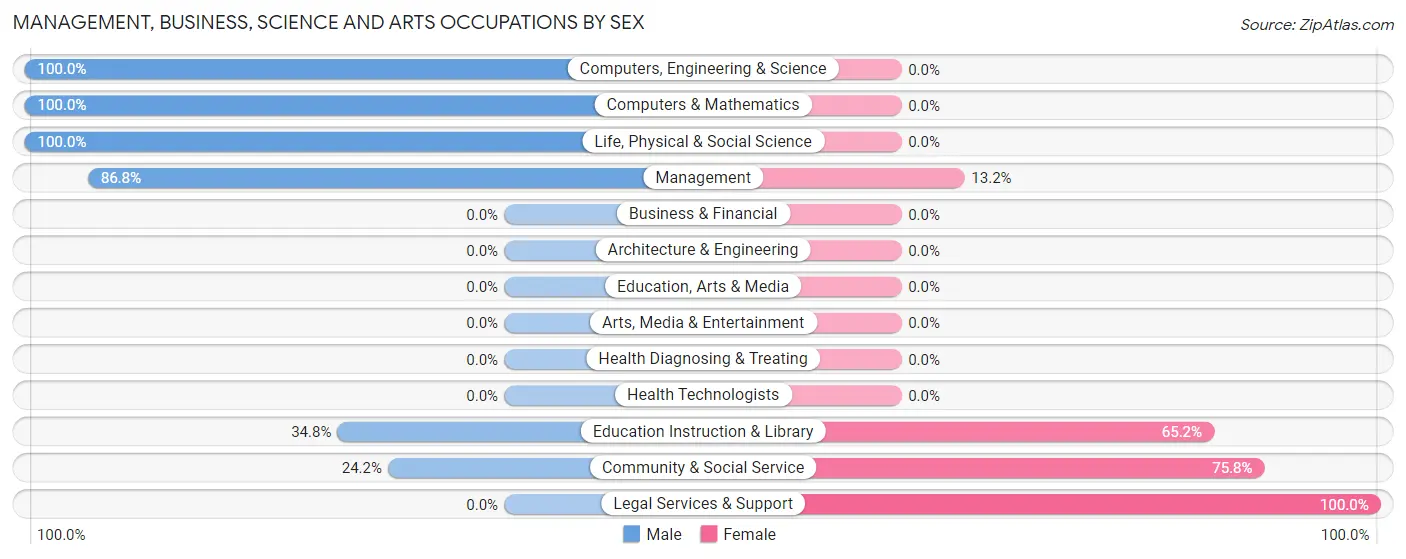
Management, Business, Science and Arts Occupations
The most common Management, Business, Science and Arts occupations in Martin Lake are Management (91 | 18.4%), Community & Social Service (66 | 13.3%), Computers, Engineering & Science (47 | 9.5%), Education Instruction & Library (46 | 9.3%), and Computers & Mathematics (34 | 6.9%).
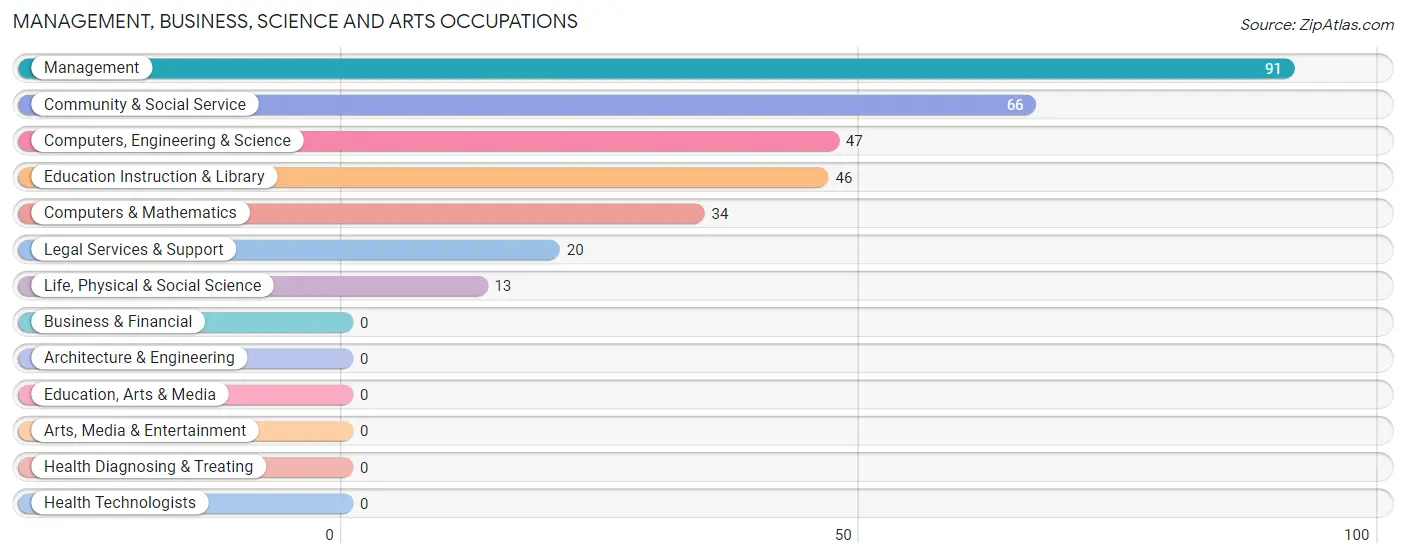
Management, Business, Science and Arts Occupations by Sex
Within the Management, Business, Science and Arts occupations in Martin Lake, the most male-oriented occupations are Computers, Engineering & Science (100.0%), Computers & Mathematics (100.0%), and Life, Physical & Social Science (100.0%), while the most female-oriented occupations are Legal Services & Support (100.0%), Community & Social Service (75.8%), and Education Instruction & Library (65.2%).
| Occupation | Male | Female |
| Management | 79 (86.8%) | 12 (13.2%) |
| Business & Financial | 0 (0.0%) | 0 (0.0%) |
| Computers, Engineering & Science | 47 (100.0%) | 0 (0.0%) |
| Computers & Mathematics | 34 (100.0%) | 0 (0.0%) |
| Architecture & Engineering | 0 (0.0%) | 0 (0.0%) |
| Life, Physical & Social Science | 13 (100.0%) | 0 (0.0%) |
| Community & Social Service | 16 (24.2%) | 50 (75.8%) |
| Education, Arts & Media | 0 (0.0%) | 0 (0.0%) |
| Legal Services & Support | 0 (0.0%) | 20 (100.0%) |
| Education Instruction & Library | 16 (34.8%) | 30 (65.2%) |
| Arts, Media & Entertainment | 0 (0.0%) | 0 (0.0%) |
| Health Diagnosing & Treating | 0 (0.0%) | 0 (0.0%) |
| Health Technologists | 0 (0.0%) | 0 (0.0%) |
| Total (Category) | 142 (69.6%) | 62 (30.4%) |
| Total (Overall) | 268 (54.1%) | 227 (45.9%) |
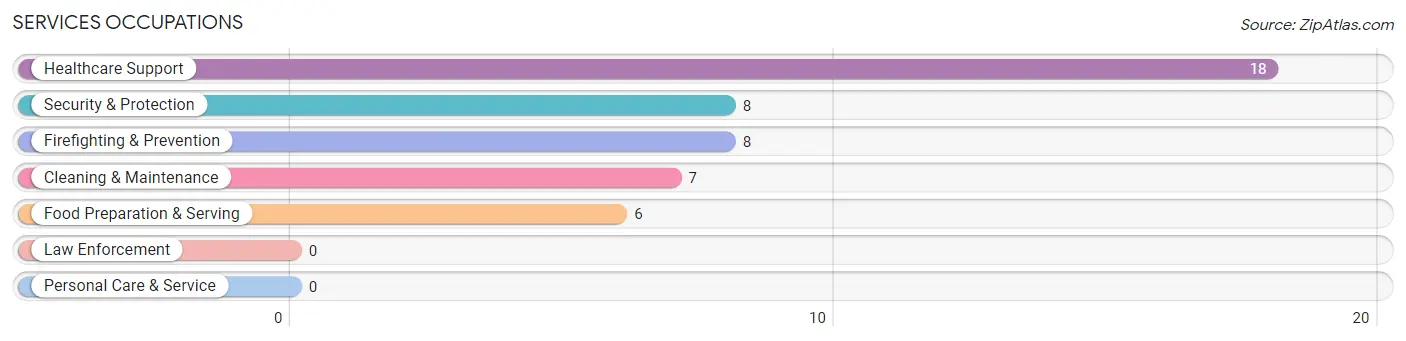
Services Occupations
The most common Services occupations in Martin Lake are Healthcare Support (18 | 3.6%), Security & Protection (8 | 1.6%), Firefighting & Prevention (8 | 1.6%), Cleaning & Maintenance (7 | 1.4%), and Food Preparation & Serving (6 | 1.2%).
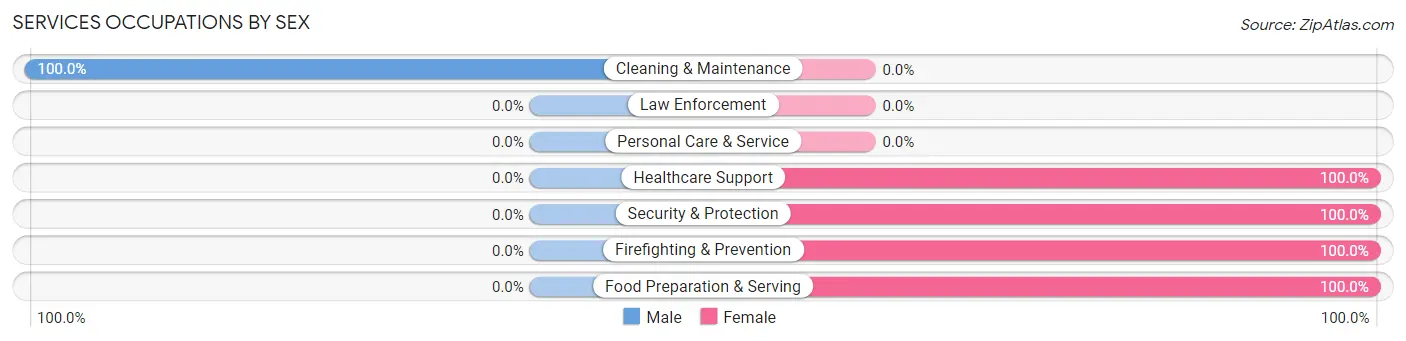
Services Occupations by Sex
| Occupation | Male | Female |
| Healthcare Support | 0 (0.0%) | 18 (100.0%) |
| Security & Protection | 0 (0.0%) | 8 (100.0%) |
| Firefighting & Prevention | 0 (0.0%) | 8 (100.0%) |
| Law Enforcement | 0 (0.0%) | 0 (0.0%) |
| Food Preparation & Serving | 0 (0.0%) | 6 (100.0%) |
| Cleaning & Maintenance | 7 (100.0%) | 0 (0.0%) |
| Personal Care & Service | 0 (0.0%) | 0 (0.0%) |
| Total (Category) | 7 (17.9%) | 32 (82.1%) |
| Total (Overall) | 268 (54.1%) | 227 (45.9%) |
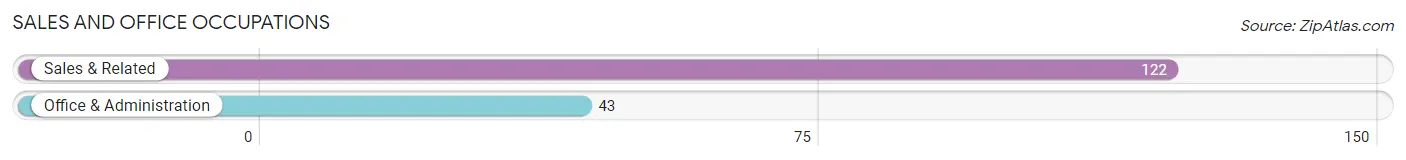
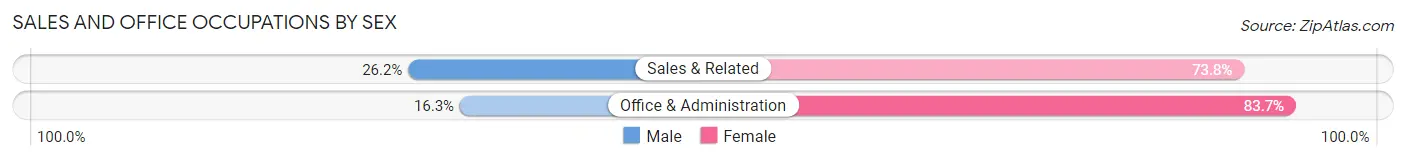
Sales and Office Occupations
The most common Sales and Office occupations in Martin Lake are Sales & Related (122 | 24.6%), and Office & Administration (43 | 8.7%).
Sales and Office Occupations by Sex
| Occupation | Male | Female |
| Sales & Related | 32 (26.2%) | 90 (73.8%) |
| Office & Administration | 7 (16.3%) | 36 (83.7%) |
| Total (Category) | 39 (23.6%) | 126 (76.4%) |
| Total (Overall) | 268 (54.1%) | 227 (45.9%) |
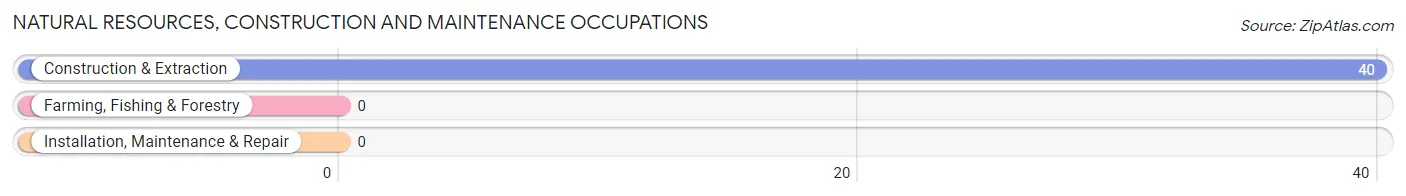
Natural Resources, Construction and Maintenance Occupations
The most common Natural Resources, Construction and Maintenance occupations in Martin Lake are , and Construction & Extraction (40 | 8.1%).
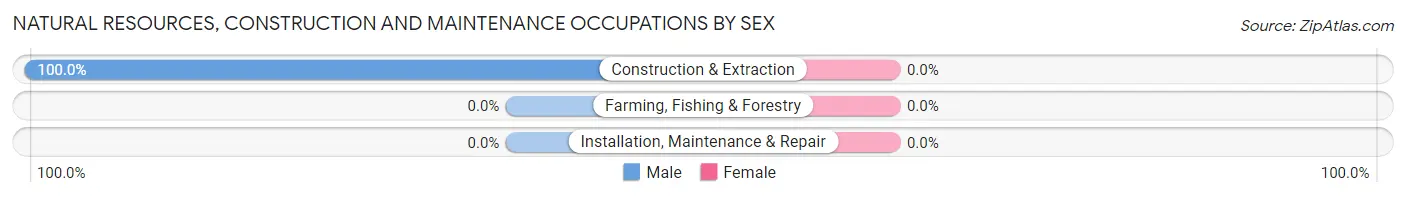
Natural Resources, Construction and Maintenance Occupations by Sex
| Occupation | Male | Female |
| Farming, Fishing & Forestry | 0 (0.0%) | 0 (0.0%) |
| Construction & Extraction | 40 (100.0%) | 0 (0.0%) |
| Installation, Maintenance & Repair | 0 (0.0%) | 0 (0.0%) |
| Total (Category) | 40 (100.0%) | 0 (0.0%) |
| Total (Overall) | 268 (54.1%) | 227 (45.9%) |
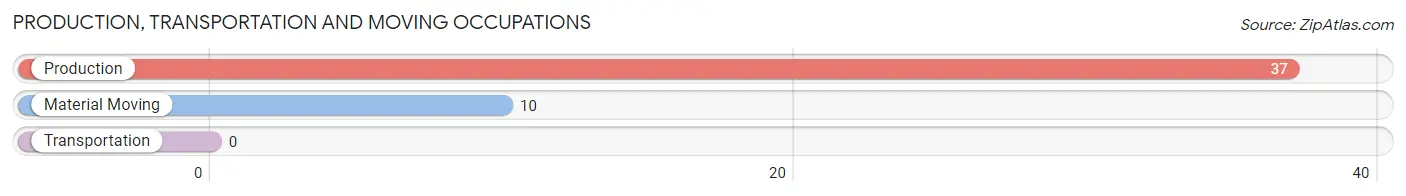
Production, Transportation and Moving Occupations
The most common Production, Transportation and Moving occupations in Martin Lake are Production (37 | 7.5%), and Material Moving (10 | 2.0%).
Production, Transportation and Moving Occupations by Sex
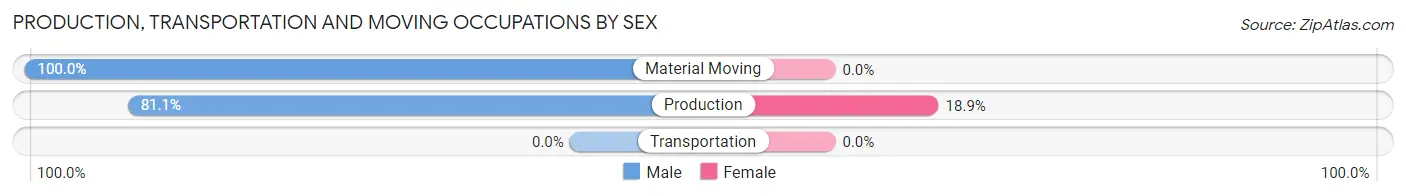
| Occupation | Male | Female |
| Production | 30 (81.1%) | 7 (18.9%) |
| Transportation | 0 (0.0%) | 0 (0.0%) |
| Material Moving | 10 (100.0%) | 0 (0.0%) |
| Total (Category) | 40 (85.1%) | 7 (14.9%) |
| Total (Overall) | 268 (54.1%) | 227 (45.9%) |
Employment Industries by Sex in Martin Lake
Employment Industries in Martin Lake
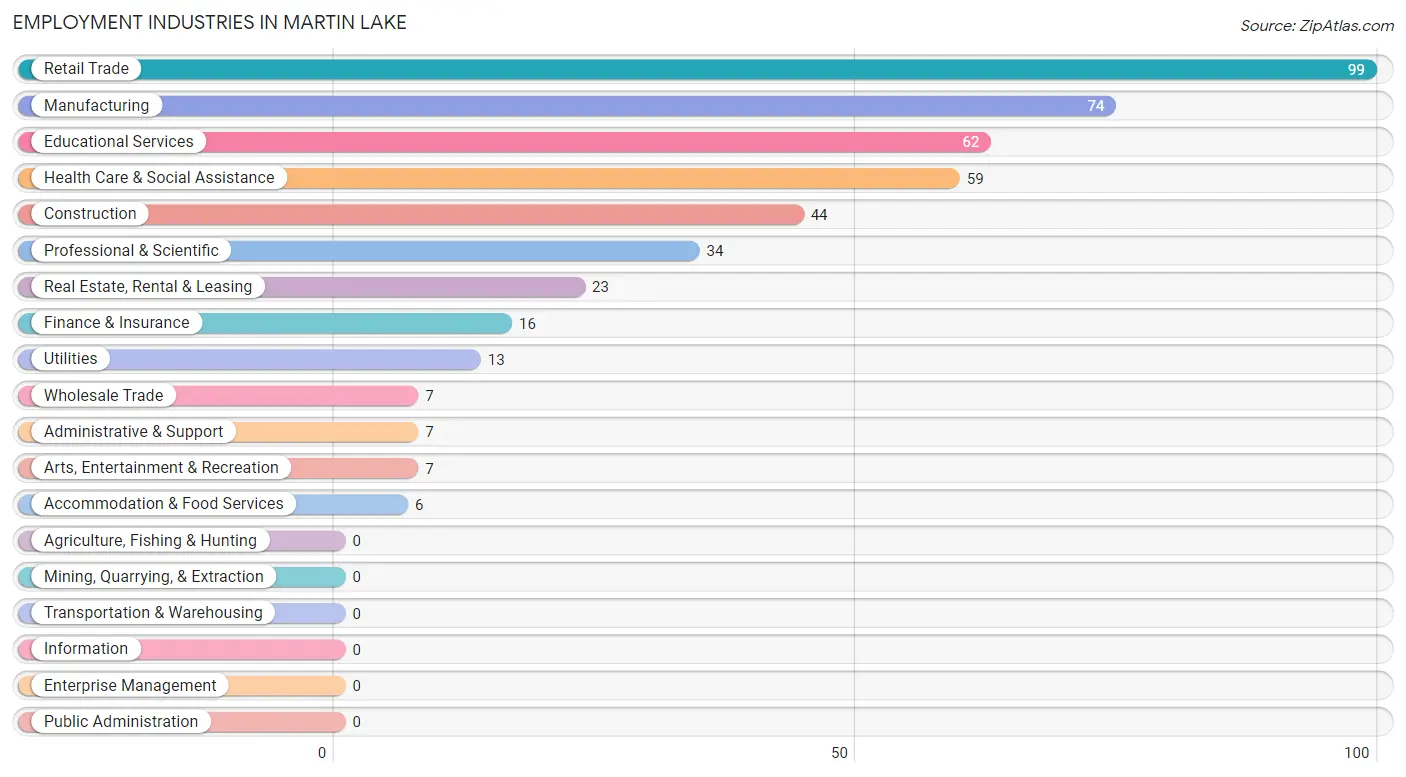
The major employment industries in Martin Lake include Retail Trade (99 | 20.0%), Manufacturing (74 | 14.9%), Educational Services (62 | 12.5%), Health Care & Social Assistance (59 | 11.9%), and Construction (44 | 8.9%).
Employment Industries by Sex in Martin Lake
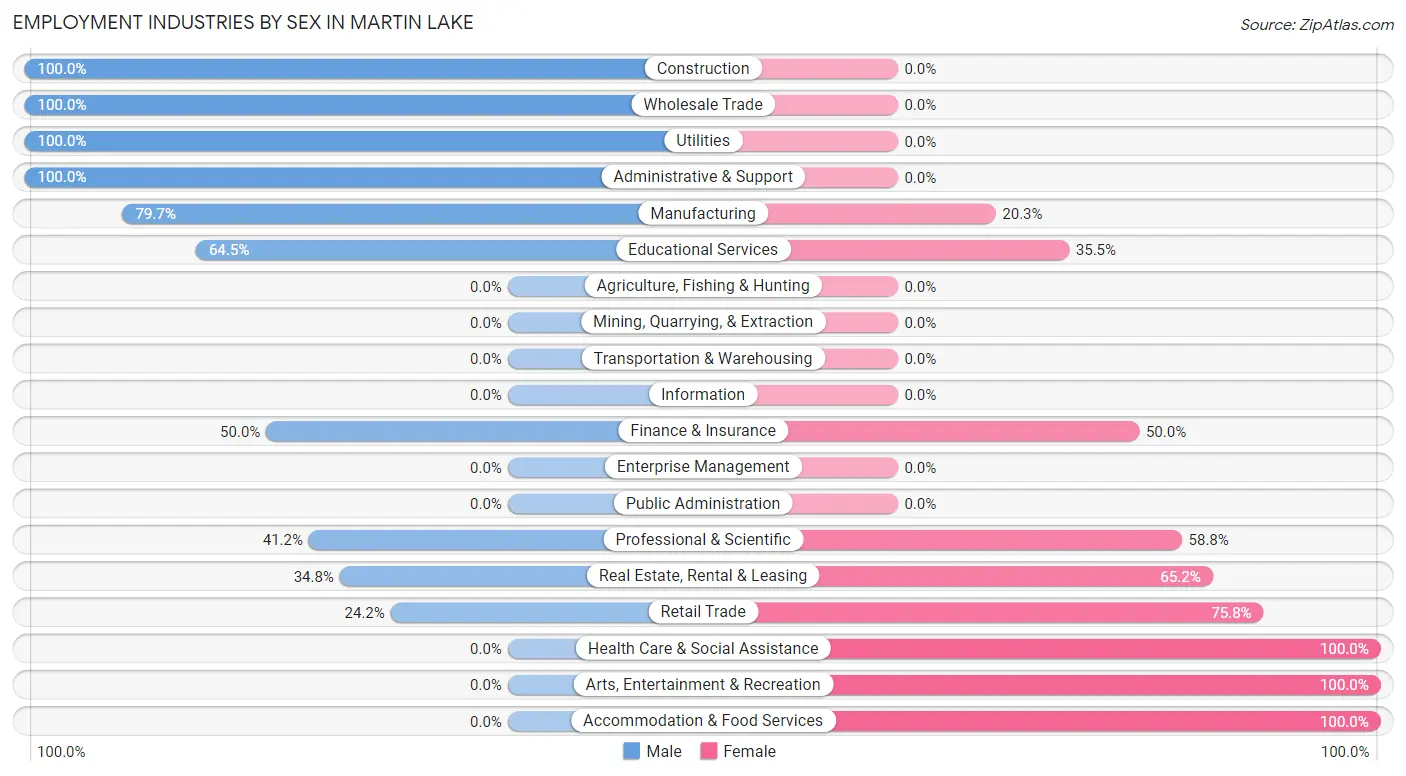
The Martin Lake industries that see more men than women are Construction (100.0%), Wholesale Trade (100.0%), and Utilities (100.0%), whereas the industries that tend to have a higher number of women are Health Care & Social Assistance (100.0%), Arts, Entertainment & Recreation (100.0%), and Accommodation & Food Services (100.0%).
| Industry | Male | Female |
| Agriculture, Fishing & Hunting | 0 (0.0%) | 0 (0.0%) |
| Mining, Quarrying, & Extraction | 0 (0.0%) | 0 (0.0%) |
| Construction | 44 (100.0%) | 0 (0.0%) |
| Manufacturing | 59 (79.7%) | 15 (20.3%) |
| Wholesale Trade | 7 (100.0%) | 0 (0.0%) |
| Retail Trade | 24 (24.2%) | 75 (75.8%) |
| Transportation & Warehousing | 0 (0.0%) | 0 (0.0%) |
| Utilities | 13 (100.0%) | 0 (0.0%) |
| Information | 0 (0.0%) | 0 (0.0%) |
| Finance & Insurance | 8 (50.0%) | 8 (50.0%) |
| Real Estate, Rental & Leasing | 8 (34.8%) | 15 (65.2%) |
| Professional & Scientific | 14 (41.2%) | 20 (58.8%) |
| Enterprise Management | 0 (0.0%) | 0 (0.0%) |
| Administrative & Support | 7 (100.0%) | 0 (0.0%) |
| Educational Services | 40 (64.5%) | 22 (35.5%) |
| Health Care & Social Assistance | 0 (0.0%) | 59 (100.0%) |
| Arts, Entertainment & Recreation | 0 (0.0%) | 7 (100.0%) |
| Accommodation & Food Services | 0 (0.0%) | 6 (100.0%) |
| Public Administration | 0 (0.0%) | 0 (0.0%) |
| Total | 268 (54.1%) | 227 (45.9%) |
Education in Martin Lake
School Enrollment in Martin Lake
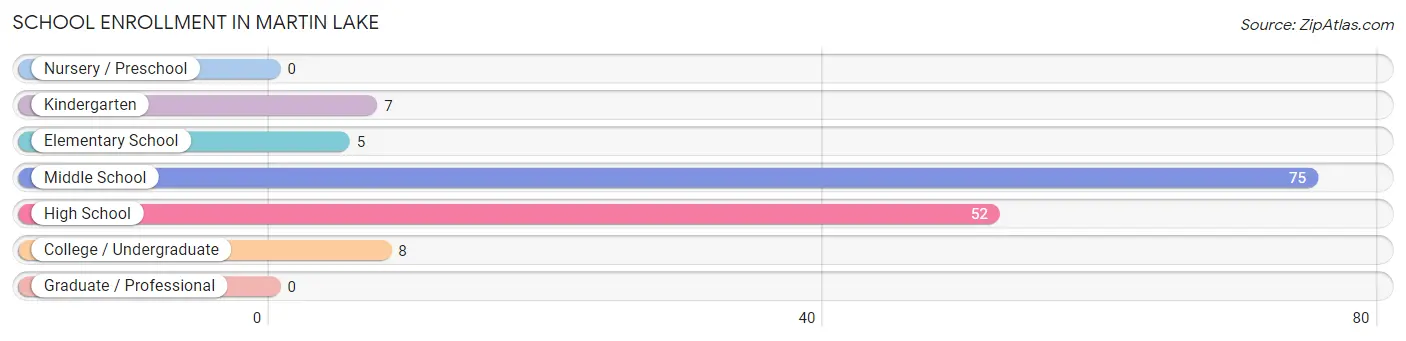
The most common levels of schooling among the 147 students in Martin Lake are middle school (75 | 51.0%), high school (52 | 35.4%), and college / undergraduate (8 | 5.4%).
| School Level | # Students | % Students |
| Nursery / Preschool | 0 | 0.0% |
| Kindergarten | 7 | 4.8% |
| Elementary School | 5 | 3.4% |
| Middle School | 75 | 51.0% |
| High School | 52 | 35.4% |
| College / Undergraduate | 8 | 5.4% |
| Graduate / Professional | 0 | 0.0% |
| Total | 147 | 100.0% |
School Enrollment by Age by Funding Source in Martin Lake
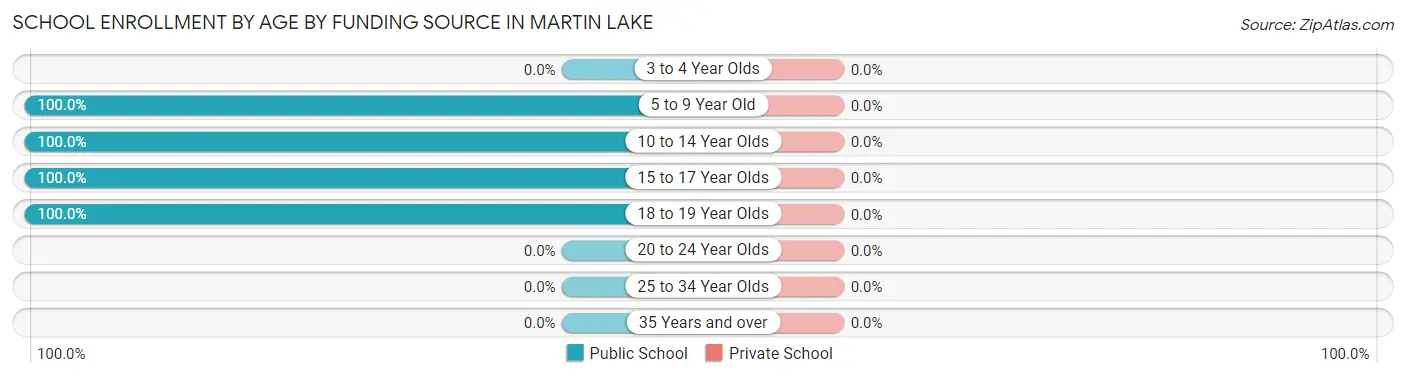
| Age Bracket | Public School | Private School |
| 3 to 4 Year Olds | 0 (0.0%) | 0 (0.0%) |
| 5 to 9 Year Old | 12 (100.0%) | 0 (0.0%) |
| 10 to 14 Year Olds | 75 (100.0%) | 0 (0.0%) |
| 15 to 17 Year Olds | 52 (100.0%) | 0 (0.0%) |
| 18 to 19 Year Olds | 8 (100.0%) | 0 (0.0%) |
| 20 to 24 Year Olds | 0 (0.0%) | 0 (0.0%) |
| 25 to 34 Year Olds | 0 (0.0%) | 0 (0.0%) |
| 35 Years and over | 0 (0.0%) | 0 (0.0%) |
| Total | 147 (100.0%) | 0 (0.0%) |
Educational Attainment by Field of Study in Martin Lake
Business (36 | 28.8%), education (35 | 28.0%), psychology (15 | 12.0%), bio, nature & agricultural (8 | 6.4%), and physical & health sciences (8 | 6.4%) are the most common fields of study among 125 individuals in Martin Lake who have obtained a bachelor's degree or higher.
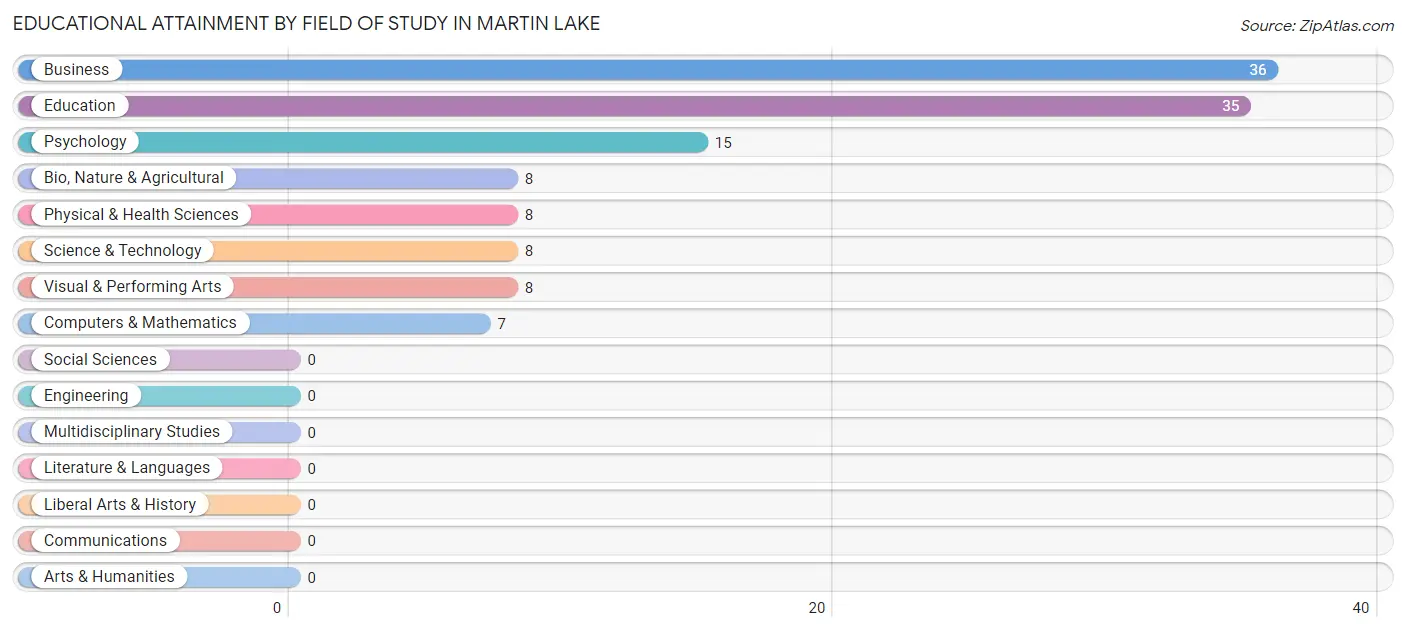
| Field of Study | # Graduates | % Graduates |
| Computers & Mathematics | 7 | 5.6% |
| Bio, Nature & Agricultural | 8 | 6.4% |
| Physical & Health Sciences | 8 | 6.4% |
| Psychology | 15 | 12.0% |
| Social Sciences | 0 | 0.0% |
| Engineering | 0 | 0.0% |
| Multidisciplinary Studies | 0 | 0.0% |
| Science & Technology | 8 | 6.4% |
| Business | 36 | 28.8% |
| Education | 35 | 28.0% |
| Literature & Languages | 0 | 0.0% |
| Liberal Arts & History | 0 | 0.0% |
| Visual & Performing Arts | 8 | 6.4% |
| Communications | 0 | 0.0% |
| Arts & Humanities | 0 | 0.0% |
| Total | 125 | 100.0% |
Transportation & Commute in Martin Lake
Vehicle Availability by Sex in Martin Lake
The most prevalent vehicle ownership categories in Martin Lake are males with 3 vehicles (132, accounting for 51.2%) and females with 3 vehicles (96, making up 59.7%).
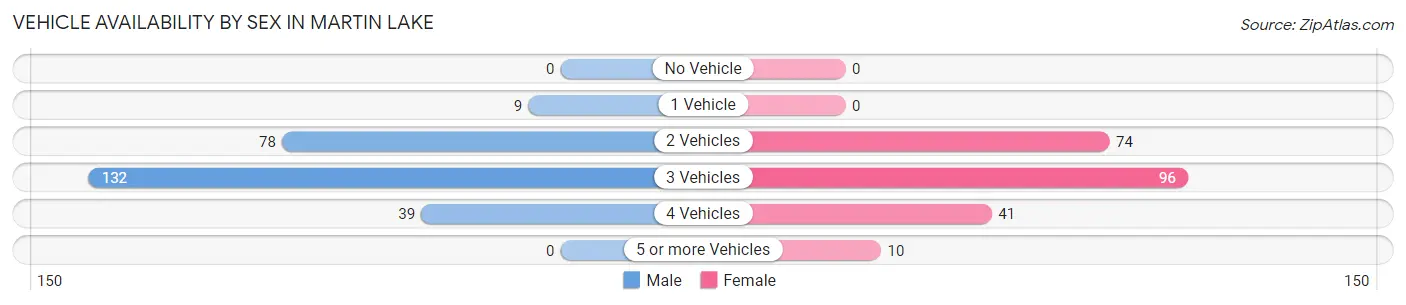
| Vehicles Available | Male | Female |
| No Vehicle | 0 (0.0%) | 0 (0.0%) |
| 1 Vehicle | 9 (3.5%) | 0 (0.0%) |
| 2 Vehicles | 78 (30.2%) | 74 (33.5%) |
| 3 Vehicles | 132 (51.2%) | 96 (43.4%) |
| 4 Vehicles | 39 (15.1%) | 41 (18.5%) |
| 5 or more Vehicles | 0 (0.0%) | 10 (4.5%) |
| Total | 258 (100.0%) | 221 (100.0%) |
Commute Time in Martin Lake
The most frequently occuring commute durations in Martin Lake are 20 to 24 minutes (98 commuters, 22.7%), 30 to 34 minutes (91 commuters, 21.1%), and 45 to 59 minutes (57 commuters, 13.2%).
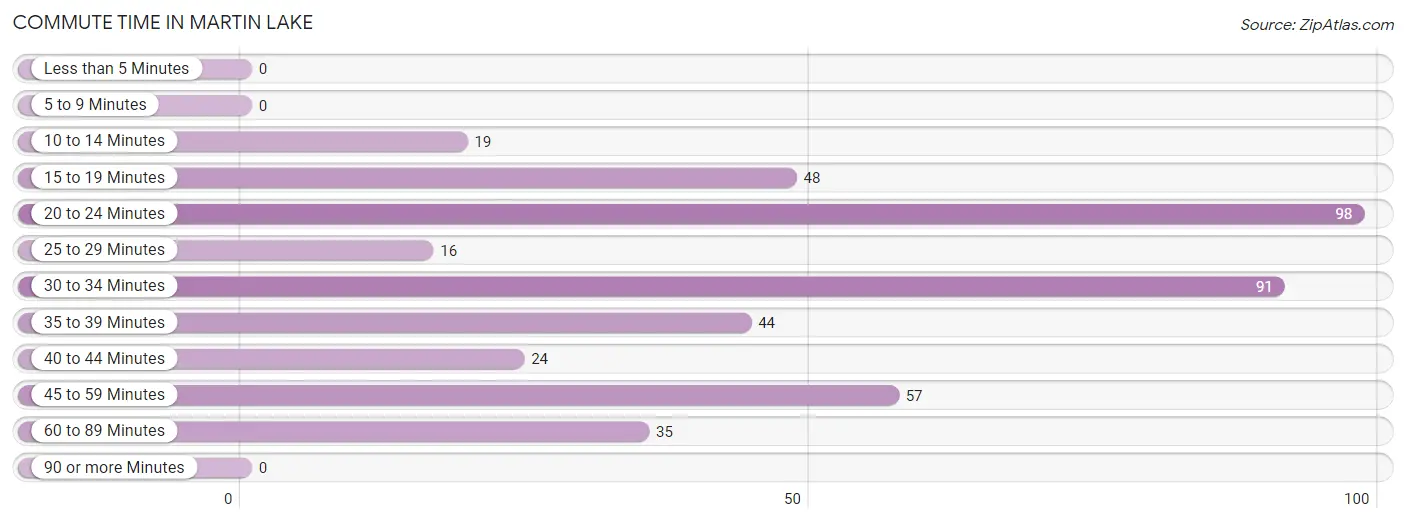
| Commute Time | # Commuters | % Commuters |
| Less than 5 Minutes | 0 | 0.0% |
| 5 to 9 Minutes | 0 | 0.0% |
| 10 to 14 Minutes | 19 | 4.4% |
| 15 to 19 Minutes | 48 | 11.1% |
| 20 to 24 Minutes | 98 | 22.7% |
| 25 to 29 Minutes | 16 | 3.7% |
| 30 to 34 Minutes | 91 | 21.1% |
| 35 to 39 Minutes | 44 | 10.2% |
| 40 to 44 Minutes | 24 | 5.6% |
| 45 to 59 Minutes | 57 | 13.2% |
| 60 to 89 Minutes | 35 | 8.1% |
| 90 or more Minutes | 0 | 0.0% |
Commute Time by Sex in Martin Lake
The most common commute times in Martin Lake are 20 to 24 minutes (69 commuters, 30.8%) for males and 30 to 34 minutes (69 commuters, 33.2%) for females.
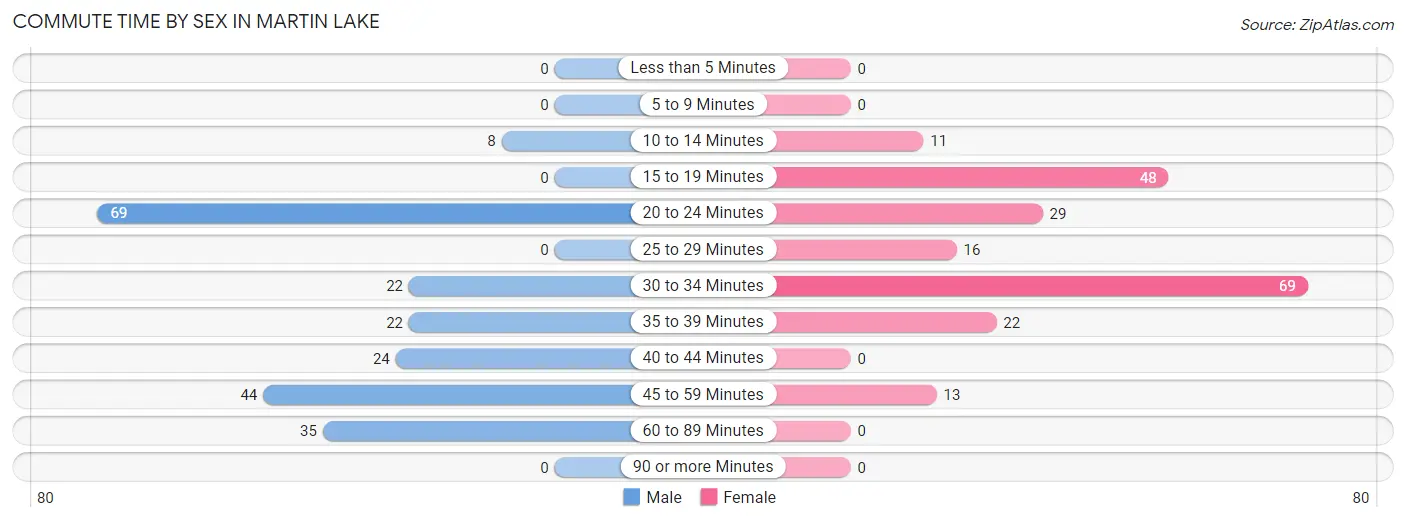
| Commute Time | Male | Female |
| Less than 5 Minutes | 0 (0.0%) | 0 (0.0%) |
| 5 to 9 Minutes | 0 (0.0%) | 0 (0.0%) |
| 10 to 14 Minutes | 8 (3.6%) | 11 (5.3%) |
| 15 to 19 Minutes | 0 (0.0%) | 48 (23.1%) |
| 20 to 24 Minutes | 69 (30.8%) | 29 (13.9%) |
| 25 to 29 Minutes | 0 (0.0%) | 16 (7.7%) |
| 30 to 34 Minutes | 22 (9.8%) | 69 (33.2%) |
| 35 to 39 Minutes | 22 (9.8%) | 22 (10.6%) |
| 40 to 44 Minutes | 24 (10.7%) | 0 (0.0%) |
| 45 to 59 Minutes | 44 (19.6%) | 13 (6.2%) |
| 60 to 89 Minutes | 35 (15.6%) | 0 (0.0%) |
| 90 or more Minutes | 0 (0.0%) | 0 (0.0%) |
Time of Departure to Work by Sex in Martin Lake
The most frequent times of departure to work in Martin Lake are 7:30 AM to 7:59 AM (51, 22.8%) for males and 7:00 AM to 7:29 AM (44, 21.1%) for females.
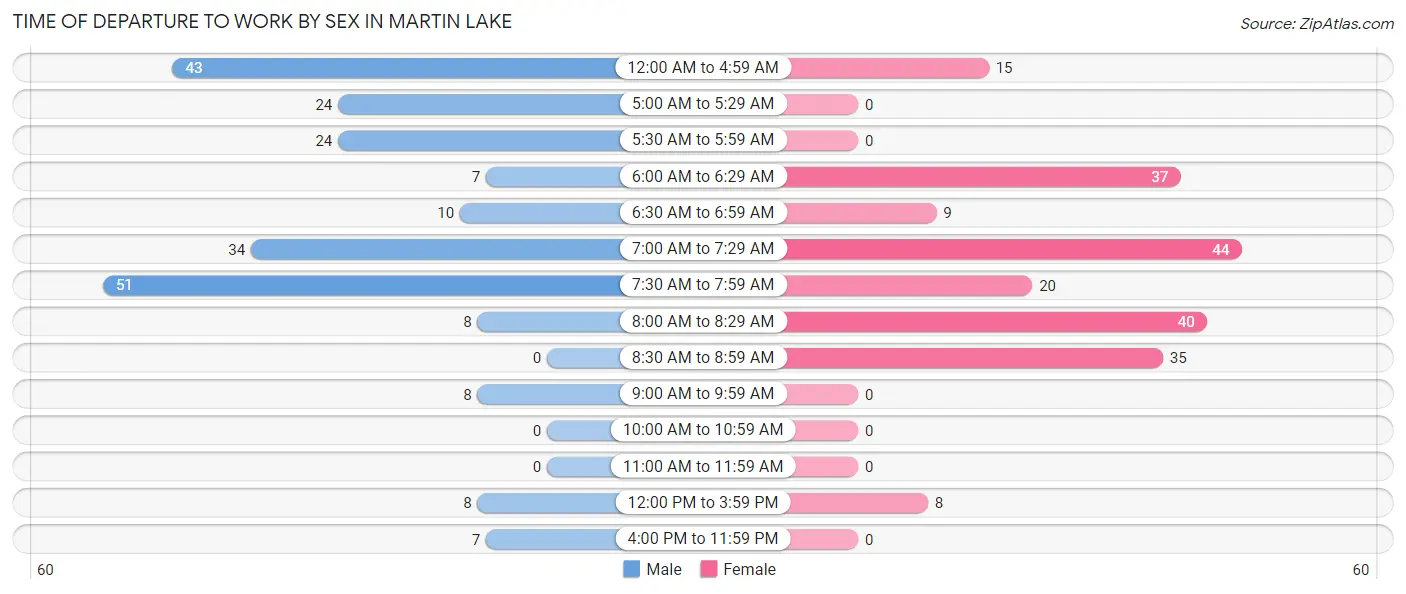
| Time of Departure | Male | Female |
| 12:00 AM to 4:59 AM | 43 (19.2%) | 15 (7.2%) |
| 5:00 AM to 5:29 AM | 24 (10.7%) | 0 (0.0%) |
| 5:30 AM to 5:59 AM | 24 (10.7%) | 0 (0.0%) |
| 6:00 AM to 6:29 AM | 7 (3.1%) | 37 (17.8%) |
| 6:30 AM to 6:59 AM | 10 (4.5%) | 9 (4.3%) |
| 7:00 AM to 7:29 AM | 34 (15.2%) | 44 (21.1%) |
| 7:30 AM to 7:59 AM | 51 (22.8%) | 20 (9.6%) |
| 8:00 AM to 8:29 AM | 8 (3.6%) | 40 (19.2%) |
| 8:30 AM to 8:59 AM | 0 (0.0%) | 35 (16.8%) |
| 9:00 AM to 9:59 AM | 8 (3.6%) | 0 (0.0%) |
| 10:00 AM to 10:59 AM | 0 (0.0%) | 0 (0.0%) |
| 11:00 AM to 11:59 AM | 0 (0.0%) | 0 (0.0%) |
| 12:00 PM to 3:59 PM | 8 (3.6%) | 8 (3.8%) |
| 4:00 PM to 11:59 PM | 7 (3.1%) | 0 (0.0%) |
| Total | 224 (100.0%) | 208 (100.0%) |
Housing Occupancy in Martin Lake
Occupancy by Ownership in Martin Lake
Of the total 393 dwellings in Martin Lake, owner-occupied units account for 331 (84.2%), while renter-occupied units make up 62 (15.8%).
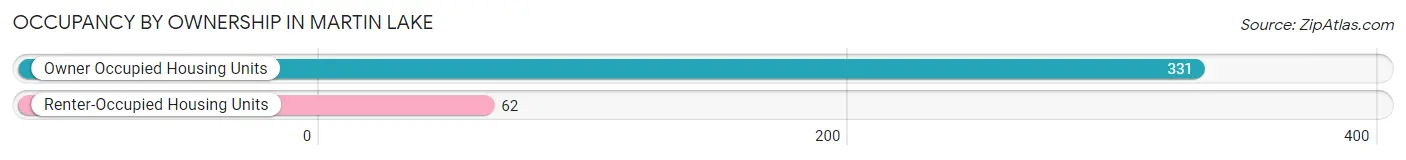
| Occupancy | # Housing Units | % Housing Units |
| Owner Occupied Housing Units | 331 | 84.2% |
| Renter-Occupied Housing Units | 62 | 15.8% |
| Total Occupied Housing Units | 393 | 100.0% |
Occupancy by Household Size in Martin Lake
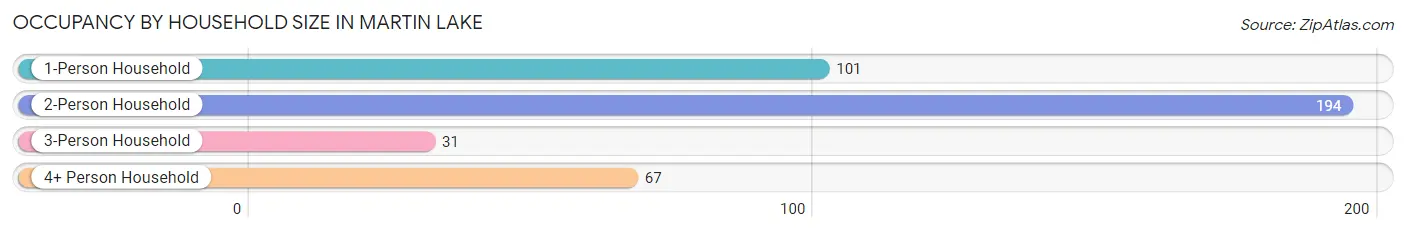
| Household Size | # Housing Units | % Housing Units |
| 1-Person Household | 101 | 25.7% |
| 2-Person Household | 194 | 49.4% |
| 3-Person Household | 31 | 7.9% |
| 4+ Person Household | 67 | 17.1% |
| Total Housing Units | 393 | 100.0% |
Occupancy by Ownership by Household Size in Martin Lake
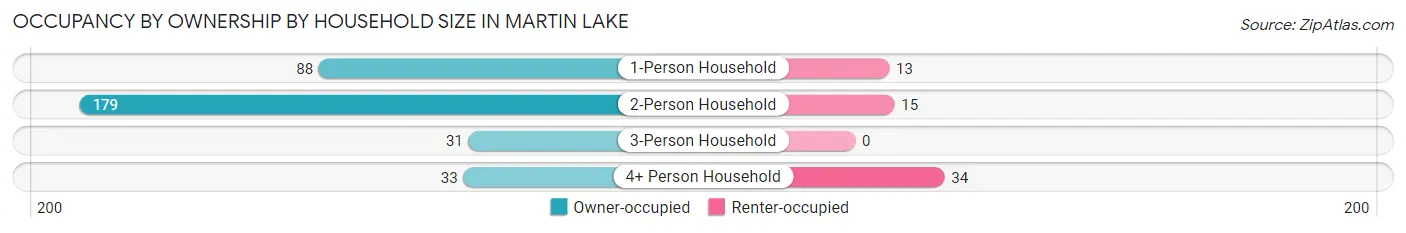
| Household Size | Owner-occupied | Renter-occupied |
| 1-Person Household | 88 (87.1%) | 13 (12.9%) |
| 2-Person Household | 179 (92.3%) | 15 (7.7%) |
| 3-Person Household | 31 (100.0%) | 0 (0.0%) |
| 4+ Person Household | 33 (49.2%) | 34 (50.7%) |
| Total Housing Units | 331 (84.2%) | 62 (15.8%) |
Occupancy by Educational Attainment in Martin Lake
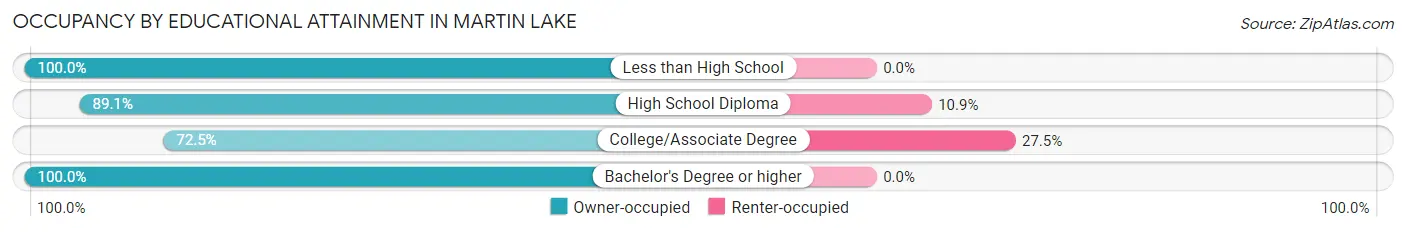
| Household Size | Owner-occupied | Renter-occupied |
| Less than High School | 24 (100.0%) | 0 (0.0%) |
| High School Diploma | 106 (89.1%) | 13 (10.9%) |
| College/Associate Degree | 129 (72.5%) | 49 (27.5%) |
| Bachelor's Degree or higher | 72 (100.0%) | 0 (0.0%) |
Occupancy by Age of Householder in Martin Lake
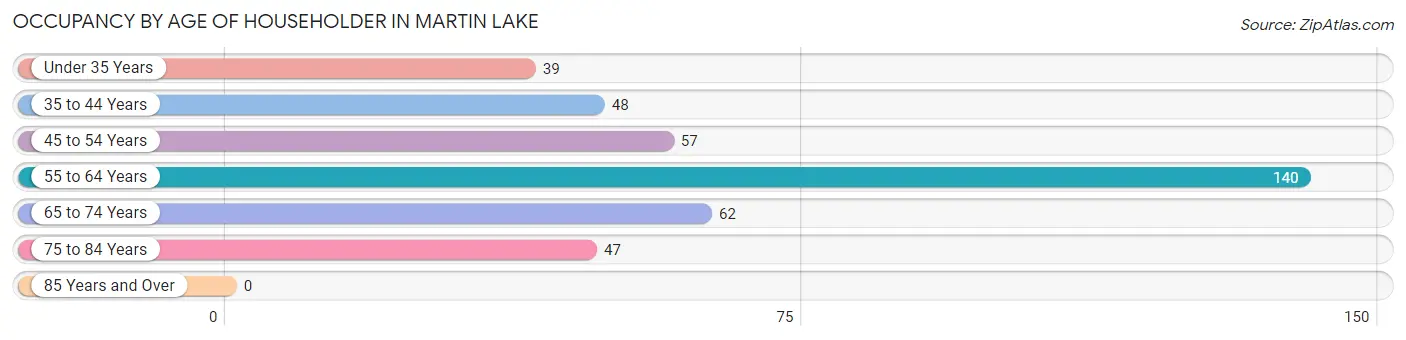
| Age Bracket | # Households | % Households |
| Under 35 Years | 39 | 9.9% |
| 35 to 44 Years | 48 | 12.2% |
| 45 to 54 Years | 57 | 14.5% |
| 55 to 64 Years | 140 | 35.6% |
| 65 to 74 Years | 62 | 15.8% |
| 75 to 84 Years | 47 | 12.0% |
| 85 Years and Over | 0 | 0.0% |
| Total | 393 | 100.0% |
Housing Finances in Martin Lake
Median Income by Occupancy in Martin Lake
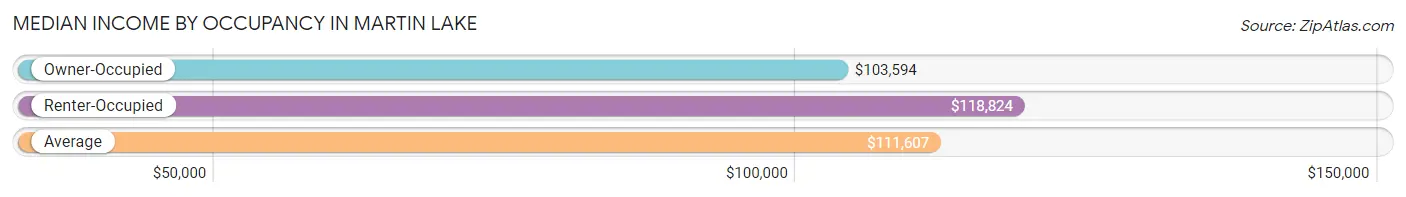
| Occupancy Type | # Households | Median Income |
| Owner-Occupied | 331 (84.2%) | $103,594 |
| Renter-Occupied | 62 (15.8%) | $118,824 |
| Average | 393 (100.0%) | $111,607 |
Occupancy by Householder Income Bracket in Martin Lake
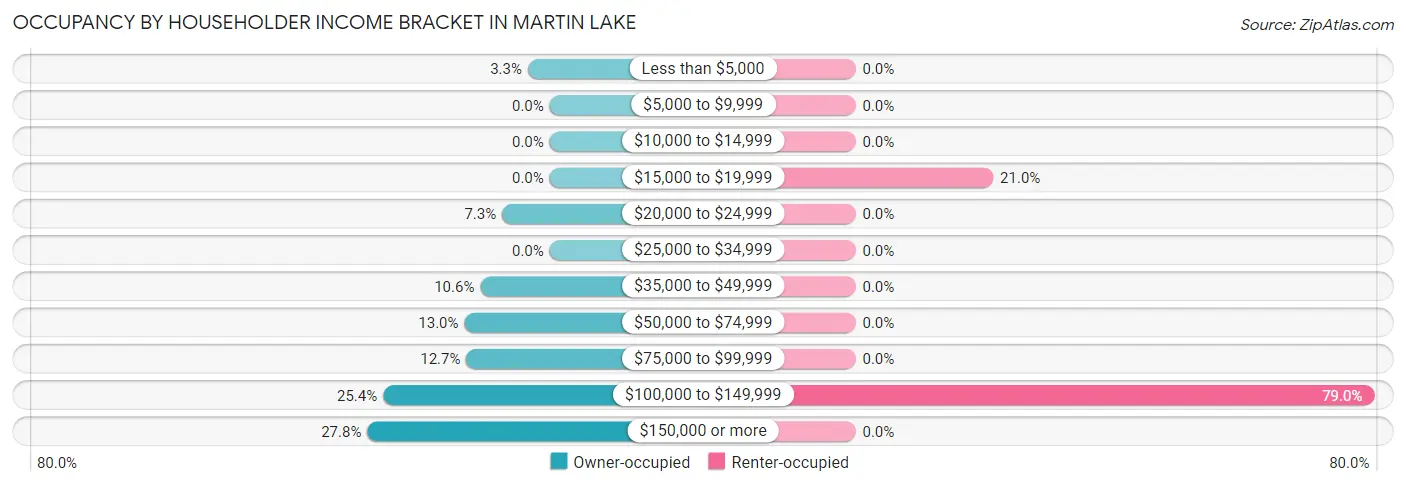
| Income Bracket | Owner-occupied | Renter-occupied |
| Less than $5,000 | 11 (3.3%) | 0 (0.0%) |
| $5,000 to $9,999 | 0 (0.0%) | 0 (0.0%) |
| $10,000 to $14,999 | 0 (0.0%) | 0 (0.0%) |
| $15,000 to $19,999 | 0 (0.0%) | 13 (21.0%) |
| $20,000 to $24,999 | 24 (7.2%) | 0 (0.0%) |
| $25,000 to $34,999 | 0 (0.0%) | 0 (0.0%) |
| $35,000 to $49,999 | 35 (10.6%) | 0 (0.0%) |
| $50,000 to $74,999 | 43 (13.0%) | 0 (0.0%) |
| $75,000 to $99,999 | 42 (12.7%) | 0 (0.0%) |
| $100,000 to $149,999 | 84 (25.4%) | 49 (79.0%) |
| $150,000 or more | 92 (27.8%) | 0 (0.0%) |
| Total | 331 (100.0%) | 62 (100.0%) |
Monthly Housing Cost Tiers in Martin Lake
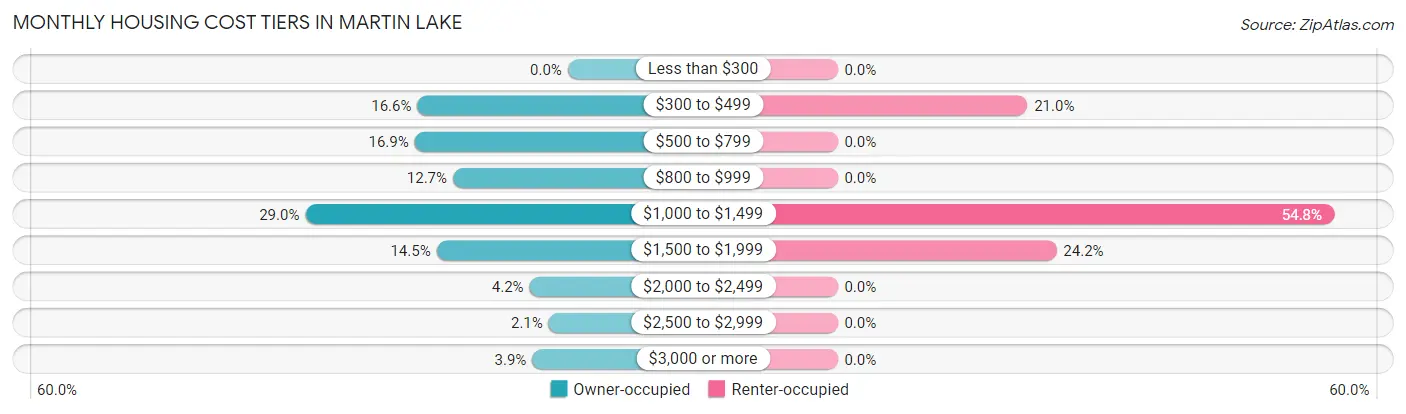
| Monthly Cost | Owner-occupied | Renter-occupied |
| Less than $300 | 0 (0.0%) | 0 (0.0%) |
| $300 to $499 | 55 (16.6%) | 13 (21.0%) |
| $500 to $799 | 56 (16.9%) | 0 (0.0%) |
| $800 to $999 | 42 (12.7%) | 0 (0.0%) |
| $1,000 to $1,499 | 96 (29.0%) | 34 (54.8%) |
| $1,500 to $1,999 | 48 (14.5%) | 15 (24.2%) |
| $2,000 to $2,499 | 14 (4.2%) | 0 (0.0%) |
| $2,500 to $2,999 | 7 (2.1%) | 0 (0.0%) |
| $3,000 or more | 13 (3.9%) | 0 (0.0%) |
| Total | 331 (100.0%) | 62 (100.0%) |
Physical Housing Characteristics in Martin Lake
Housing Structures in Martin Lake
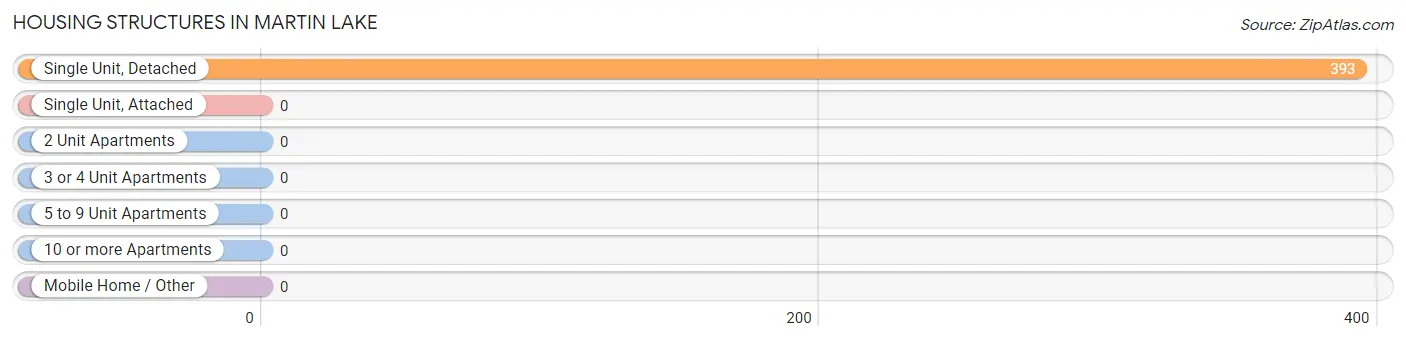
| Structure Type | # Housing Units | % Housing Units |
| Single Unit, Detached | 393 | 100.0% |
| Single Unit, Attached | 0 | 0.0% |
| 2 Unit Apartments | 0 | 0.0% |
| 3 or 4 Unit Apartments | 0 | 0.0% |
| 5 to 9 Unit Apartments | 0 | 0.0% |
| 10 or more Apartments | 0 | 0.0% |
| Mobile Home / Other | 0 | 0.0% |
| Total | 393 | 100.0% |
Housing Structures by Occupancy in Martin Lake
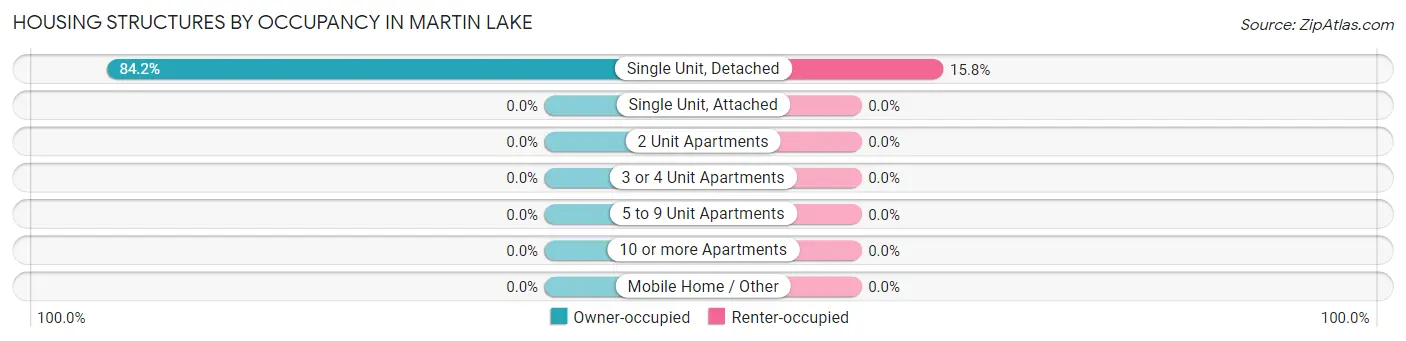
| Structure Type | Owner-occupied | Renter-occupied |
| Single Unit, Detached | 331 (84.2%) | 62 (15.8%) |
| Single Unit, Attached | 0 (0.0%) | 0 (0.0%) |
| 2 Unit Apartments | 0 (0.0%) | 0 (0.0%) |
| 3 or 4 Unit Apartments | 0 (0.0%) | 0 (0.0%) |
| 5 to 9 Unit Apartments | 0 (0.0%) | 0 (0.0%) |
| 10 or more Apartments | 0 (0.0%) | 0 (0.0%) |
| Mobile Home / Other | 0 (0.0%) | 0 (0.0%) |
| Total | 331 (84.2%) | 62 (15.8%) |
Housing Structures by Number of Rooms in Martin Lake
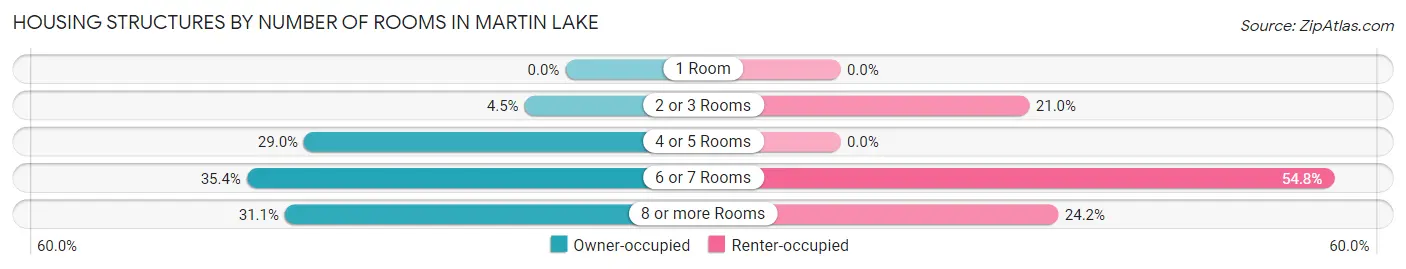
| Number of Rooms | Owner-occupied | Renter-occupied |
| 1 Room | 0 (0.0%) | 0 (0.0%) |
| 2 or 3 Rooms | 15 (4.5%) | 13 (21.0%) |
| 4 or 5 Rooms | 96 (29.0%) | 0 (0.0%) |
| 6 or 7 Rooms | 117 (35.3%) | 34 (54.8%) |
| 8 or more Rooms | 103 (31.1%) | 15 (24.2%) |
| Total | 331 (100.0%) | 62 (100.0%) |
Housing Structure by Heating Type in Martin Lake
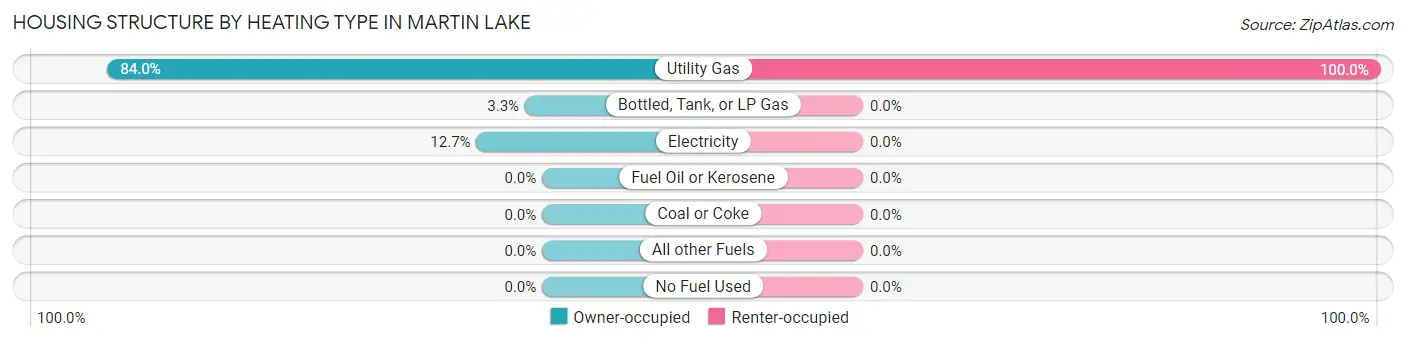
| Heating Type | Owner-occupied | Renter-occupied |
| Utility Gas | 278 (84.0%) | 62 (100.0%) |
| Bottled, Tank, or LP Gas | 11 (3.3%) | 0 (0.0%) |
| Electricity | 42 (12.7%) | 0 (0.0%) |
| Fuel Oil or Kerosene | 0 (0.0%) | 0 (0.0%) |
| Coal or Coke | 0 (0.0%) | 0 (0.0%) |
| All other Fuels | 0 (0.0%) | 0 (0.0%) |
| No Fuel Used | 0 (0.0%) | 0 (0.0%) |
| Total | 331 (100.0%) | 62 (100.0%) |
Household Vehicle Usage in Martin Lake
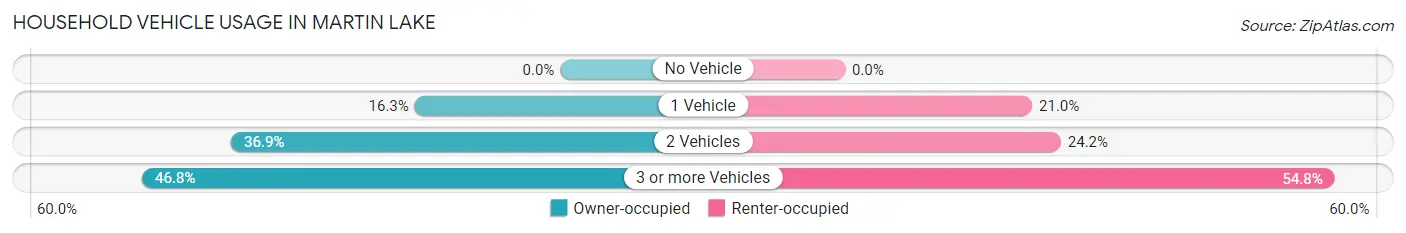
| Vehicles per Household | Owner-occupied | Renter-occupied |
| No Vehicle | 0 (0.0%) | 0 (0.0%) |
| 1 Vehicle | 54 (16.3%) | 13 (21.0%) |
| 2 Vehicles | 122 (36.9%) | 15 (24.2%) |
| 3 or more Vehicles | 155 (46.8%) | 34 (54.8%) |
| Total | 331 (100.0%) | 62 (100.0%) |
Real Estate & Mortgages in Martin Lake
Real Estate and Mortgage Overview in Martin Lake
| Characteristic | Without Mortgage | With Mortgage |
| Housing Units | 128 | 203 |
| Median Property Value | $362,500 | $319,600 |
| Median Household Income | $115,435 | $55 |
| Monthly Housing Costs | $547 | $13 |
| Real Estate Taxes | $2,933 | $0 |
Property Value by Mortgage Status in Martin Lake

| Property Value | Without Mortgage | With Mortgage |
| Less than $50,000 | 0 (0.0%) | 0 (0.0%) |
| $50,000 to $99,999 | 0 (0.0%) | 11 (5.4%) |
| $100,000 to $299,999 | 59 (46.1%) | 85 (41.9%) |
| $300,000 to $499,999 | 16 (12.5%) | 81 (39.9%) |
| $500,000 to $749,999 | 31 (24.2%) | 13 (6.4%) |
| $750,000 to $999,999 | 22 (17.2%) | 13 (6.4%) |
| $1,000,000 or more | 0 (0.0%) | 0 (0.0%) |
| Total | 128 (100.0%) | 203 (100.0%) |
Household Income by Mortgage Status in Martin Lake
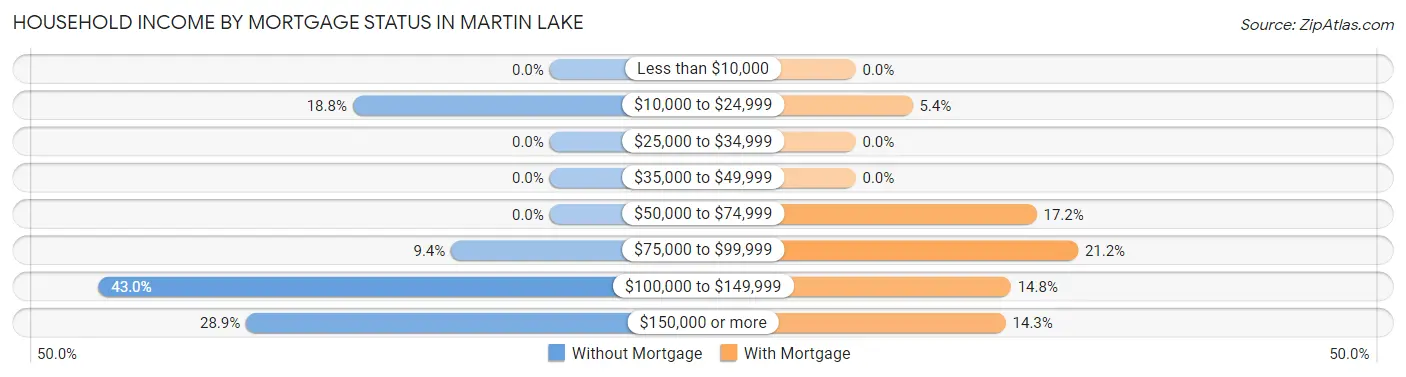
| Household Income | Without Mortgage | With Mortgage |
| Less than $10,000 | 0 (0.0%) | 0 (0.0%) |
| $10,000 to $24,999 | 24 (18.8%) | 11 (5.4%) |
| $25,000 to $34,999 | 0 (0.0%) | 0 (0.0%) |
| $35,000 to $49,999 | 0 (0.0%) | 0 (0.0%) |
| $50,000 to $74,999 | 0 (0.0%) | 35 (17.2%) |
| $75,000 to $99,999 | 12 (9.4%) | 43 (21.2%) |
| $100,000 to $149,999 | 55 (43.0%) | 30 (14.8%) |
| $150,000 or more | 37 (28.9%) | 29 (14.3%) |
| Total | 128 (100.0%) | 203 (100.0%) |
Property Value to Household Income Ratio in Martin Lake
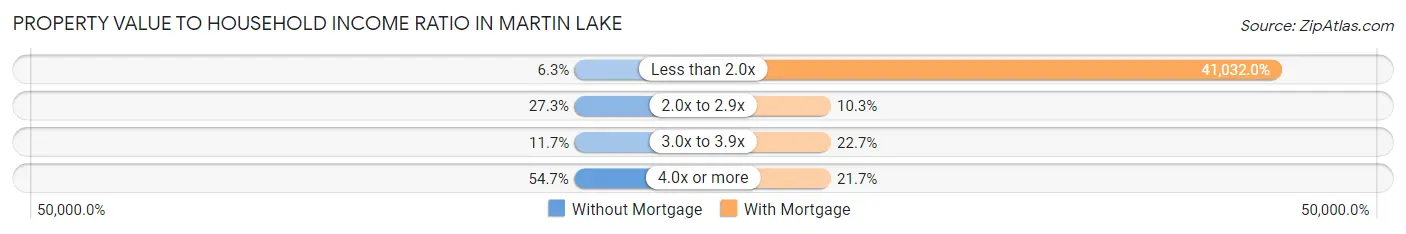
| Value-to-Income Ratio | Without Mortgage | With Mortgage |
| Less than 2.0x | 8 (6.2%) | 83,295 (41,032.0%) |
| 2.0x to 2.9x | 35 (27.3%) | 21 (10.3%) |
| 3.0x to 3.9x | 15 (11.7%) | 46 (22.7%) |
| 4.0x or more | 70 (54.7%) | 44 (21.7%) |
| Total | 128 (100.0%) | 203 (100.0%) |
Real Estate Taxes by Mortgage Status in Martin Lake
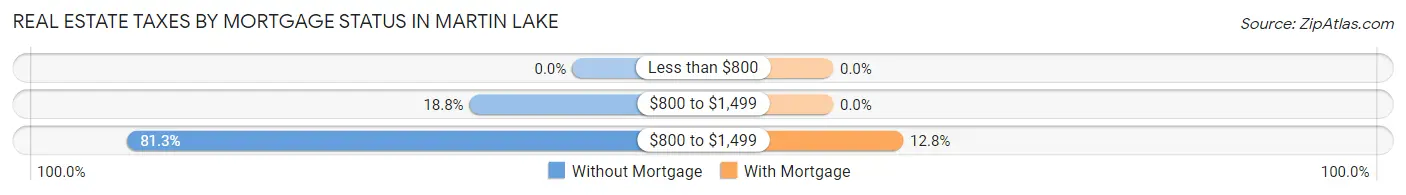
| Property Taxes | Without Mortgage | With Mortgage |
| Less than $800 | 0 (0.0%) | 0 (0.0%) |
| $800 to $1,499 | 24 (18.8%) | 0 (0.0%) |
| $800 to $1,499 | 104 (81.2%) | 26 (12.8%) |
| Total | 128 (100.0%) | 203 (100.0%) |
Health & Disability in Martin Lake
Health Insurance Coverage by Age in Martin Lake
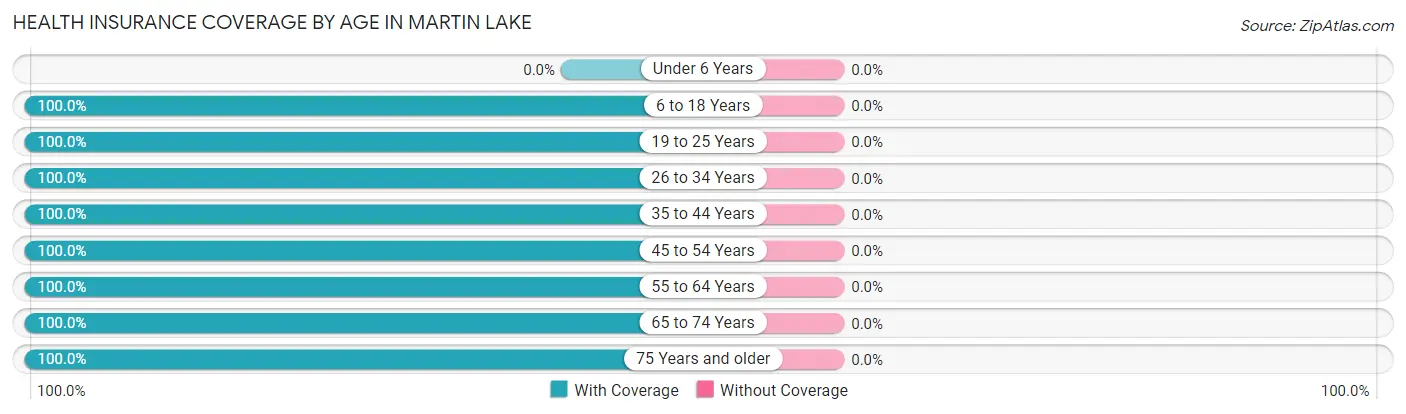
| Age Bracket | With Coverage | Without Coverage |
| Under 6 Years | 0 (0.0%) | 0 (0.0%) |
| 6 to 18 Years | 139 (100.0%) | 0 (0.0%) |
| 19 to 25 Years | 28 (100.0%) | 0 (0.0%) |
| 26 to 34 Years | 97 (100.0%) | 0 (0.0%) |
| 35 to 44 Years | 90 (100.0%) | 0 (0.0%) |
| 45 to 54 Years | 94 (100.0%) | 0 (0.0%) |
| 55 to 64 Years | 257 (100.0%) | 0 (0.0%) |
| 65 to 74 Years | 117 (100.0%) | 0 (0.0%) |
| 75 Years and older | 60 (100.0%) | 0 (0.0%) |
| Total | 882 (100.0%) | 0 (0.0%) |
Health Insurance Coverage by Citizenship Status in Martin Lake
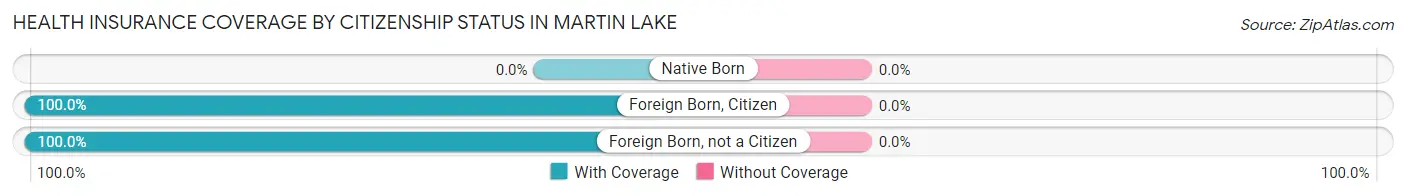
| Citizenship Status | With Coverage | Without Coverage |
| Native Born | 0 (0.0%) | 0 (0.0%) |
| Foreign Born, Citizen | 139 (100.0%) | 0 (0.0%) |
| Foreign Born, not a Citizen | 28 (100.0%) | 0 (0.0%) |
Health Insurance Coverage by Household Income in Martin Lake
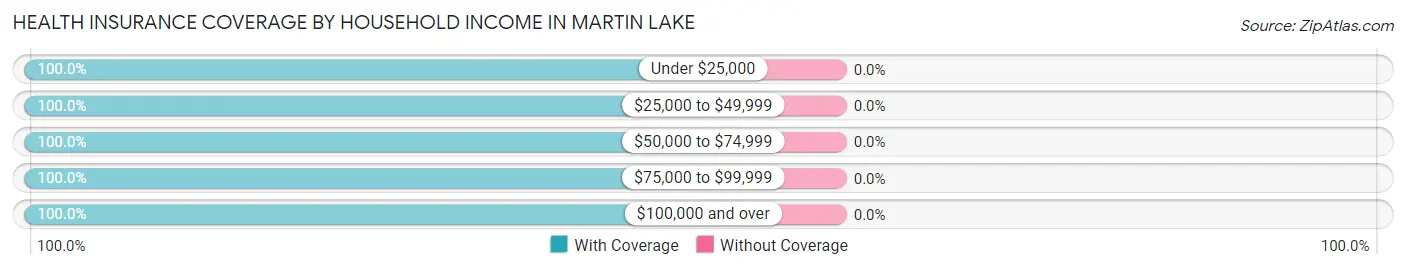
| Household Income | With Coverage | Without Coverage |
| Under $25,000 | 48 (100.0%) | 0 (0.0%) |
| $25,000 to $49,999 | 48 (100.0%) | 0 (0.0%) |
| $50,000 to $74,999 | 69 (100.0%) | 0 (0.0%) |
| $75,000 to $99,999 | 72 (100.0%) | 0 (0.0%) |
| $100,000 and over | 645 (100.0%) | 0 (0.0%) |
Public vs Private Health Insurance Coverage by Age in Martin Lake
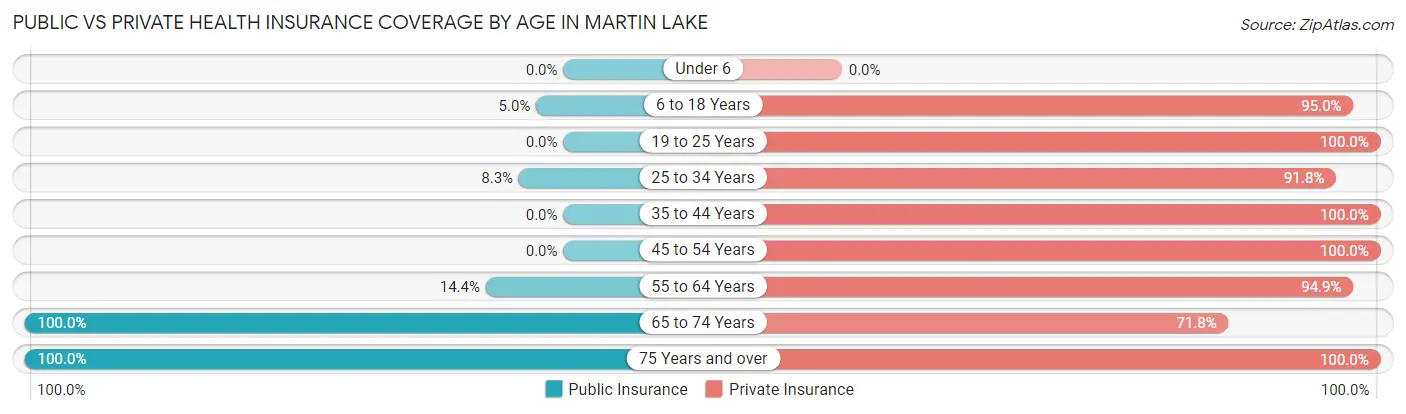
| Age Bracket | Public Insurance | Private Insurance |
| Under 6 | 0 (0.0%) | 0 (0.0%) |
| 6 to 18 Years | 7 (5.0%) | 132 (95.0%) |
| 19 to 25 Years | 0 (0.0%) | 28 (100.0%) |
| 25 to 34 Years | 8 (8.3%) | 89 (91.7%) |
| 35 to 44 Years | 0 (0.0%) | 90 (100.0%) |
| 45 to 54 Years | 0 (0.0%) | 94 (100.0%) |
| 55 to 64 Years | 37 (14.4%) | 244 (94.9%) |
| 65 to 74 Years | 117 (100.0%) | 84 (71.8%) |
| 75 Years and over | 60 (100.0%) | 60 (100.0%) |
| Total | 229 (26.0%) | 821 (93.1%) |
Disability Status by Sex by Age in Martin Lake
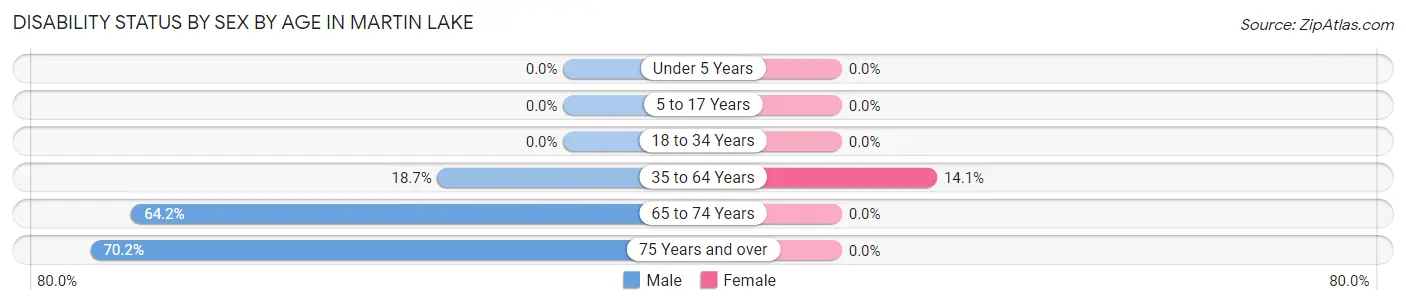
| Age Bracket | Male | Female |
| Under 5 Years | 0 (0.0%) | 0 (0.0%) |
| 5 to 17 Years | 0 (0.0%) | 0 (0.0%) |
| 18 to 34 Years | 0 (0.0%) | 0 (0.0%) |
| 35 to 64 Years | 48 (18.7%) | 26 (14.1%) |
| 65 to 74 Years | 34 (64.1%) | 0 (0.0%) |
| 75 Years and over | 33 (70.2%) | 0 (0.0%) |
Disability Class by Sex by Age in Martin Lake
Disability Class: Hearing Difficulty
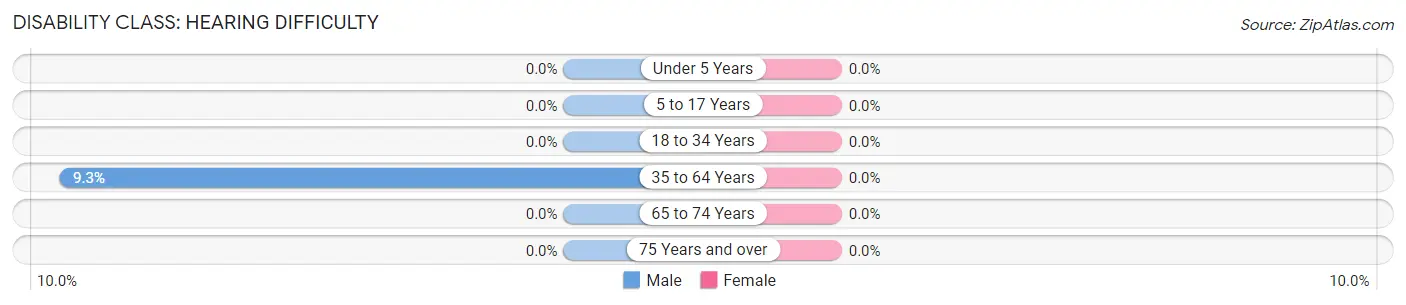
| Age Bracket | Male | Female |
| Under 5 Years | 0 (0.0%) | 0 (0.0%) |
| 5 to 17 Years | 0 (0.0%) | 0 (0.0%) |
| 18 to 34 Years | 0 (0.0%) | 0 (0.0%) |
| 35 to 64 Years | 24 (9.3%) | 0 (0.0%) |
| 65 to 74 Years | 0 (0.0%) | 0 (0.0%) |
| 75 Years and over | 0 (0.0%) | 0 (0.0%) |
Disability Class: Vision Difficulty
| Age Bracket | Male | Female |
| Under 5 Years | 0 (0.0%) | 0 (0.0%) |
| 5 to 17 Years | 0 (0.0%) | 0 (0.0%) |
| 18 to 34 Years | 0 (0.0%) | 0 (0.0%) |
| 35 to 64 Years | 0 (0.0%) | 0 (0.0%) |
| 65 to 74 Years | 0 (0.0%) | 0 (0.0%) |
| 75 Years and over | 0 (0.0%) | 0 (0.0%) |
Disability Class: Cognitive Difficulty
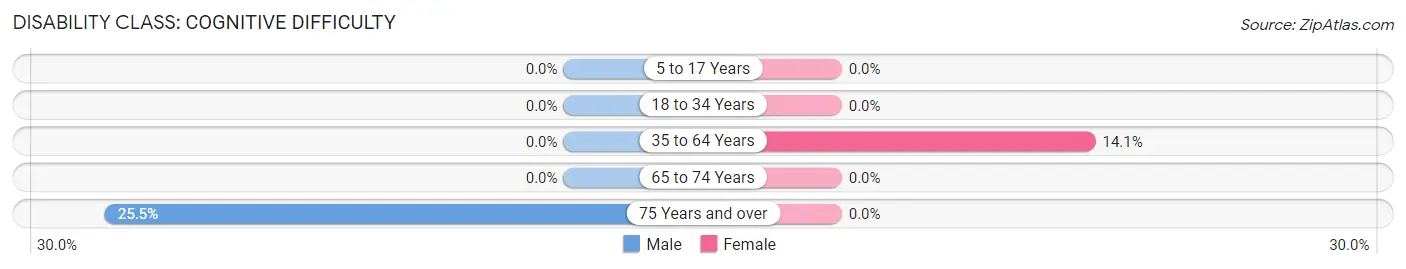
| Age Bracket | Male | Female |
| 5 to 17 Years | 0 (0.0%) | 0 (0.0%) |
| 18 to 34 Years | 0 (0.0%) | 0 (0.0%) |
| 35 to 64 Years | 0 (0.0%) | 26 (14.1%) |
| 65 to 74 Years | 0 (0.0%) | 0 (0.0%) |
| 75 Years and over | 12 (25.5%) | 0 (0.0%) |
Disability Class: Ambulatory Difficulty
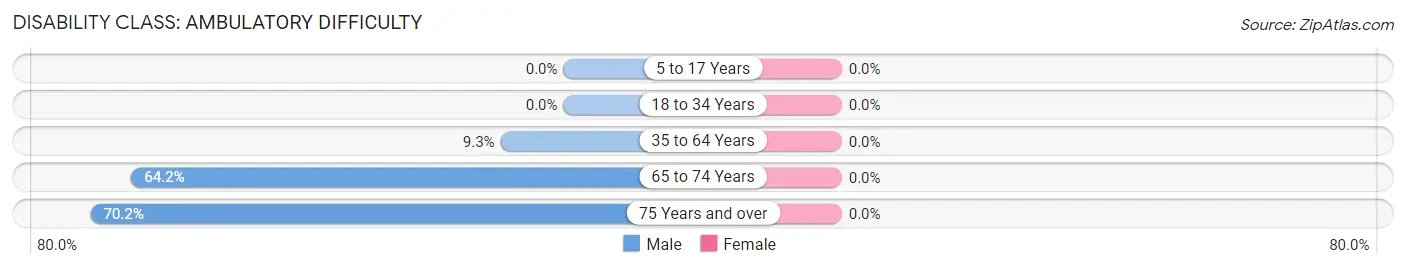
| Age Bracket | Male | Female |
| 5 to 17 Years | 0 (0.0%) | 0 (0.0%) |
| 18 to 34 Years | 0 (0.0%) | 0 (0.0%) |
| 35 to 64 Years | 24 (9.3%) | 0 (0.0%) |
| 65 to 74 Years | 34 (64.1%) | 0 (0.0%) |
| 75 Years and over | 33 (70.2%) | 0 (0.0%) |
Disability Class: Self-Care Difficulty
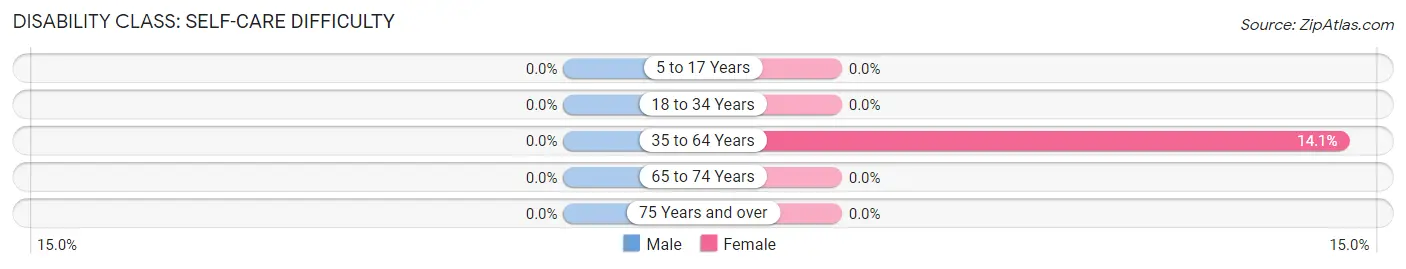
| Age Bracket | Male | Female |
| 5 to 17 Years | 0 (0.0%) | 0 (0.0%) |
| 18 to 34 Years | 0 (0.0%) | 0 (0.0%) |
| 35 to 64 Years | 0 (0.0%) | 26 (14.1%) |
| 65 to 74 Years | 0 (0.0%) | 0 (0.0%) |
| 75 Years and over | 0 (0.0%) | 0 (0.0%) |
Technology Access in Martin Lake
Computing Device Access in Martin Lake
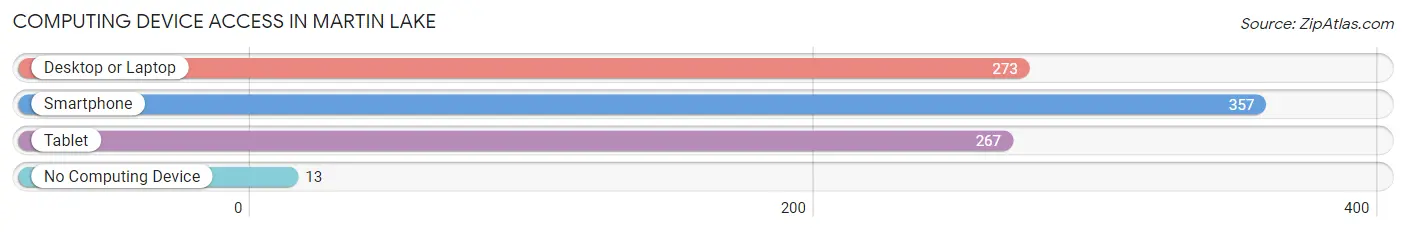
| Device Type | # Households | % Households |
| Desktop or Laptop | 273 | 69.5% |
| Smartphone | 357 | 90.8% |
| Tablet | 267 | 67.9% |
| No Computing Device | 13 | 3.3% |
| Total | 393 | 100.0% |
Internet Access in Martin Lake
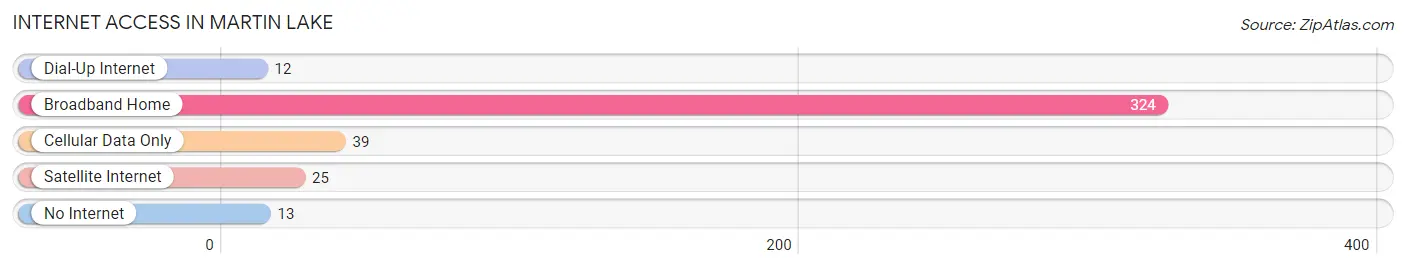
| Internet Type | # Households | % Households |
| Dial-Up Internet | 12 | 3.0% |
| Broadband Home | 324 | 82.4% |
| Cellular Data Only | 39 | 9.9% |
| Satellite Internet | 25 | 6.4% |
| No Internet | 13 | 3.3% |
| Total | 393 | 100.0% |
Martin Lake Summary
Lake History
The area now known as Martin Lake, Minnesota was first inhabited by the Dakota Sioux people. The area was part of the Dakota Territory until 1858 when it became part of the Minnesota Territory. The first settlers in the area were mostly of German and Scandinavian descent. The first permanent settlement in the area was established in 1868 by a group of German immigrants. The settlement was named Martin Lake after the first settler, Martin Schmieder.
The area was primarily an agricultural community until the early 1900s when the lumber industry began to take off. The area was home to several sawmills and logging camps. The lumber industry provided jobs and economic stability to the area for many years.
In the late 1940s, the area began to experience a population boom as people moved to the area for the plentiful jobs in the lumber industry. The population of Martin Lake grew rapidly and by the 1950s, the town had become a bustling community.
Geography
Martin Lake is located in the northern part of Minnesota, in the county of Itasca. The town is situated on the shores of Martin Lake, a small lake that is part of the Mississippi River watershed. The town is surrounded by forests and lakes, making it a popular destination for outdoor recreation.
The town is located about 30 miles north of Grand Rapids, Minnesota and about 60 miles south of Duluth, Minnesota. The nearest major city is Minneapolis, which is about 150 miles away.
Economy
The economy of Martin Lake is largely based on the lumber industry. The town is home to several sawmills and logging camps, which provide jobs for many of the town’s residents. The lumber industry is the main source of income for the town and has been for many years.
In addition to the lumber industry, Martin Lake is also home to several small businesses. These businesses include restaurants, retail stores, and other services. The town also has a small tourism industry, as it is a popular destination for outdoor recreation.
Demographics
As of the 2010 census, the population of Martin Lake was 1,845. The town is predominantly white, with 95.3% of the population being white. The remaining 4.7% of the population is made up of African Americans, Native Americans, Asians, and other races.
The median household income in Martin Lake is $41,944, which is slightly lower than the national average. The median age of the population is 44.7 years, which is slightly higher than the national average.
Conclusion
Martin Lake, Minnesota is a small town located in the northern part of the state. The town is home to a thriving lumber industry and is a popular destination for outdoor recreation. The town has a population of 1,845 and is predominantly white. The median household income is slightly lower than the national average and the median age of the population is slightly higher than the national average.
Common Questions
What is the Total Population of Martin Lake?
Total Population of Martin Lake is 882.
What is the Total Male Population of Martin Lake?
Total Male Population of Martin Lake is 447.
What is the Total Female Population of Martin Lake?
Total Female Population of Martin Lake is 435.
What is the Ratio of Males per 100 Females in Martin Lake?
There are 102.76 Males per 100 Females in Martin Lake.
What is the Ratio of Females per 100 Males in Martin Lake?
There are 97.32 Females per 100 Males in Martin Lake.
What is the Median Population Age in Martin Lake?
Median Population Age in Martin Lake is 54.8 Years.
What is the Average Family Size in Martin Lake
Average Family Size in Martin Lake is 2.7 People.
What is the Average Household Size in Martin Lake
Average Household Size in Martin Lake is 2.2 People.
What is Per Capita Income in Martin Lake?
Per Capita income in Martin Lake is $48,494.
What is the Median Family Income in Martin Lake?
Median Family Income in Martin Lake is $117,222.
What is the Median Household income in Martin Lake?
Median Household Income in Martin Lake is $111,607.
What is Income or Wage Gap in Martin Lake?
Income or Wage Gap in Martin Lake is 45.3%.
Women in Martin Lake earn 54.7 cents for every dollar earned by a man.
What is Inequality or Gini Index in Martin Lake?
Inequality or Gini Index in Martin Lake is 0.32.
How Large is the Labor Force in Martin Lake?
There are 508 People in the Labor Forcein in Martin Lake.
What is the Percentage of People in the Labor Force in Martin Lake?
67.8% of People are in the Labor Force in Martin Lake.
What is the Unemployment Rate in Martin Lake?
Unemployment Rate in Martin Lake is 2.6%.