Solway, MN
Solway Map
Solway Overview
114
TOTAL POPULATION
76
MALE POPULATION
38
FEMALE POPULATION
200.00
MALES / 100 FEMALES
50.00
FEMALES / 100 MALES
25.8
MEDIAN AGE
3.0
AVG FAMILY SIZE
2.8
AVG HOUSEHOLD SIZE
$31,888
PER CAPITA INCOME
$122,917
AVG FAMILY INCOME
$122,560
AVG HOUSEHOLD INCOME
27.3%
WAGE / INCOME GAP [ % ]
72.7¢/ $1
WAGE / INCOME GAP [ $ ]
0.20
INEQUALITY / GINI INDEX
58
LABOR FORCE [ PEOPLE ]
76.3%
PERCENT IN LABOR FORCE
Solway Zip Codes
Solway Area Codes
Race in Solway
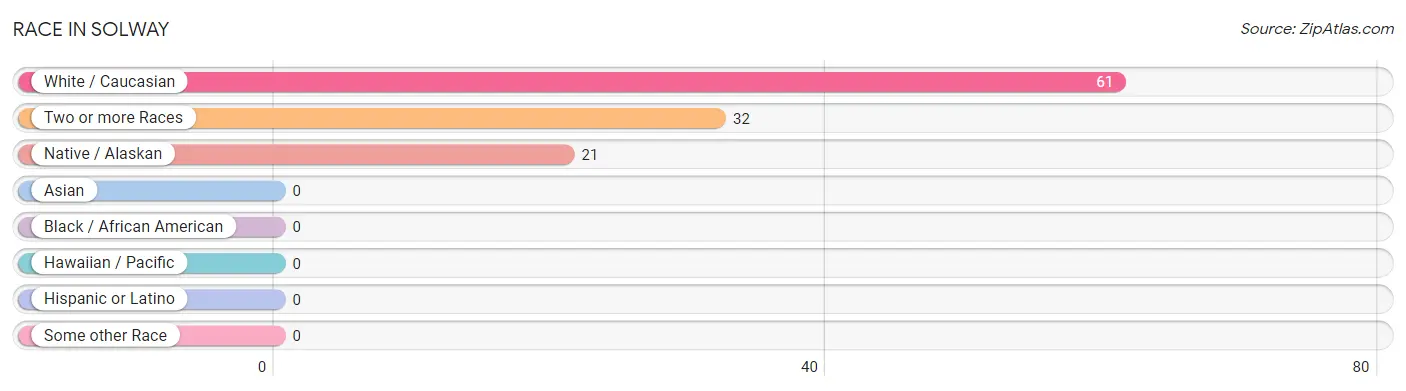
The most populous races in Solway are White / Caucasian (61 | 53.5%), Two or more Races (32 | 28.1%), and Native / Alaskan (21 | 18.4%).
| Race | # Population | % Population |
| Asian | 0 | 0.0% |
| Black / African American | 0 | 0.0% |
| Hawaiian / Pacific | 0 | 0.0% |
| Hispanic or Latino | 0 | 0.0% |
| Native / Alaskan | 21 | 18.4% |
| White / Caucasian | 61 | 53.5% |
| Two or more Races | 32 | 28.1% |
| Some other Race | 0 | 0.0% |
| Total | 114 | 100.0% |
Ancestry in Solway
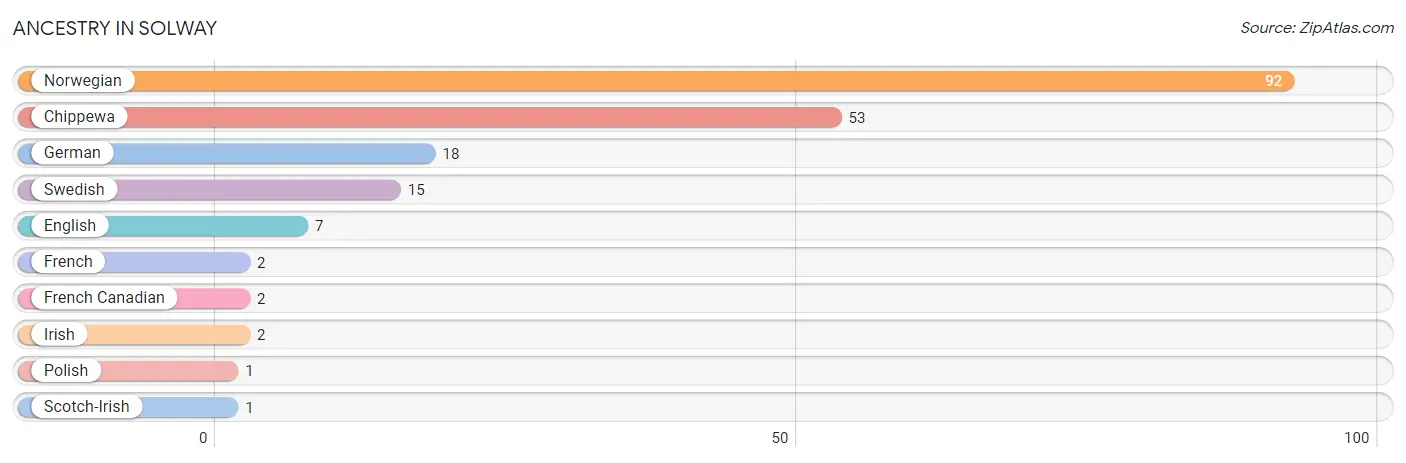
The most populous ancestries reported in Solway are Norwegian (92 | 80.7%), Chippewa (53 | 46.5%), German (18 | 15.8%), Swedish (15 | 13.2%), and English (7 | 6.1%), together accounting for 162.3% of all Solway residents.
| Ancestry | # Population | % Population |
| Chippewa | 53 | 46.5% |
| English | 7 | 6.1% |
| French | 2 | 1.8% |
| French Canadian | 2 | 1.8% |
| German | 18 | 15.8% |
| Irish | 2 | 1.8% |
| Norwegian | 92 | 80.7% |
| Polish | 1 | 0.9% |
| Scotch-Irish | 1 | 0.9% |
| Swedish | 15 | 13.2% | View All 10 Rows |
Immigrants in Solway

| Immigration Origin | # Population | % Population | View All 0 Rows |
Sex and Age in Solway
Sex and Age in Solway
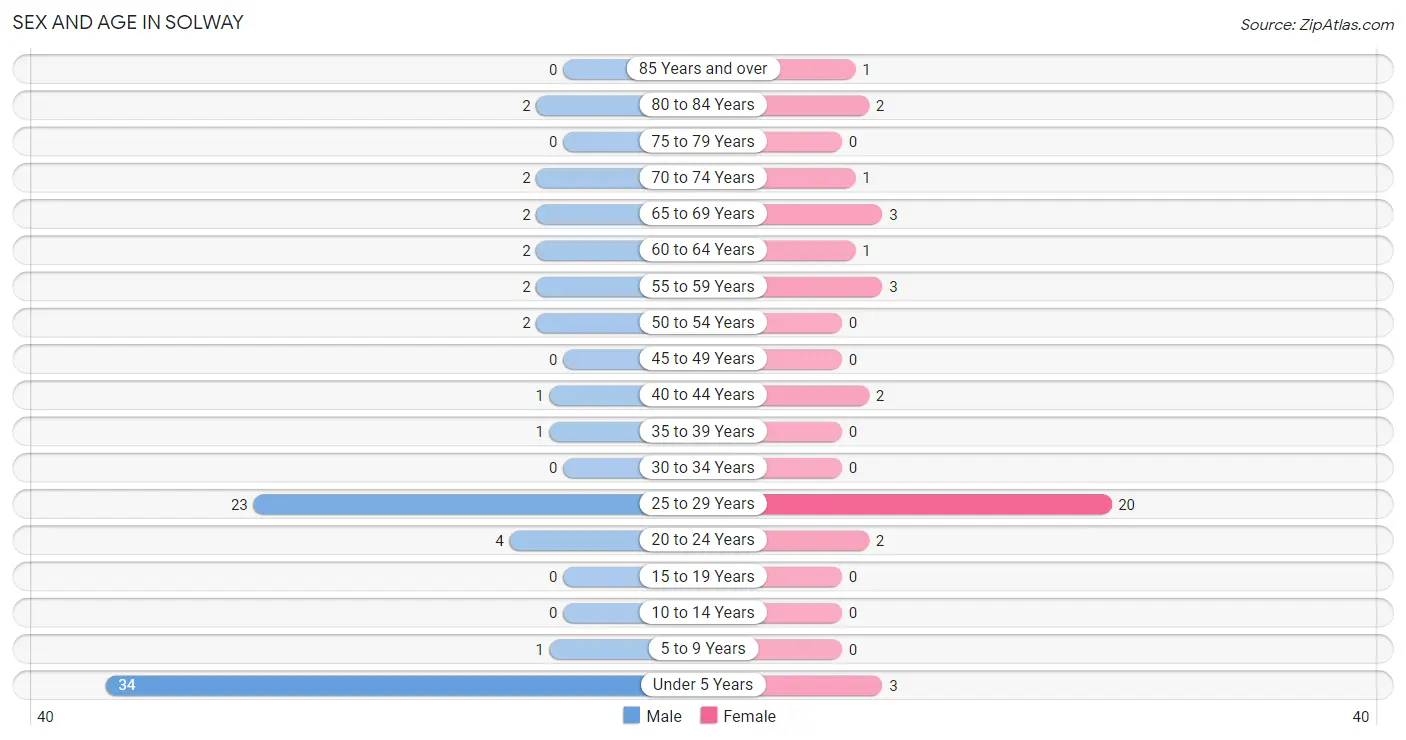
The most populous age groups in Solway are Under 5 Years (34 | 44.7%) for men and 25 to 29 Years (20 | 52.6%) for women.
| Age Bracket | Male | Female |
| Under 5 Years | 34 (44.7%) | 3 (7.9%) |
| 5 to 9 Years | 1 (1.3%) | 0 (0.0%) |
| 10 to 14 Years | 0 (0.0%) | 0 (0.0%) |
| 15 to 19 Years | 0 (0.0%) | 0 (0.0%) |
| 20 to 24 Years | 4 (5.3%) | 2 (5.3%) |
| 25 to 29 Years | 23 (30.3%) | 20 (52.6%) |
| 30 to 34 Years | 0 (0.0%) | 0 (0.0%) |
| 35 to 39 Years | 1 (1.3%) | 0 (0.0%) |
| 40 to 44 Years | 1 (1.3%) | 2 (5.3%) |
| 45 to 49 Years | 0 (0.0%) | 0 (0.0%) |
| 50 to 54 Years | 2 (2.6%) | 0 (0.0%) |
| 55 to 59 Years | 2 (2.6%) | 3 (7.9%) |
| 60 to 64 Years | 2 (2.6%) | 1 (2.6%) |
| 65 to 69 Years | 2 (2.6%) | 3 (7.9%) |
| 70 to 74 Years | 2 (2.6%) | 1 (2.6%) |
| 75 to 79 Years | 0 (0.0%) | 0 (0.0%) |
| 80 to 84 Years | 2 (2.6%) | 2 (5.3%) |
| 85 Years and over | 0 (0.0%) | 1 (2.6%) |
| Total | 76 (100.0%) | 38 (100.0%) |
Families and Households in Solway
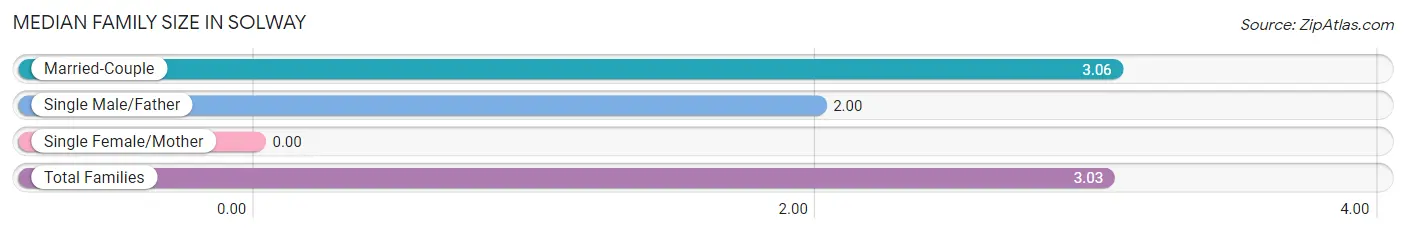
Median Family Size in Solway
| Family Type | # Families | Family Size |
| Married-Couple | 34 (97.1%) | 3.06 |
| Single Male/Father | 1 (2.9%) | 2.00 |
| Single Female/Mother | 0 (0.0%) | - |
| Total Families | 35 (100.0%) | 3.03 |
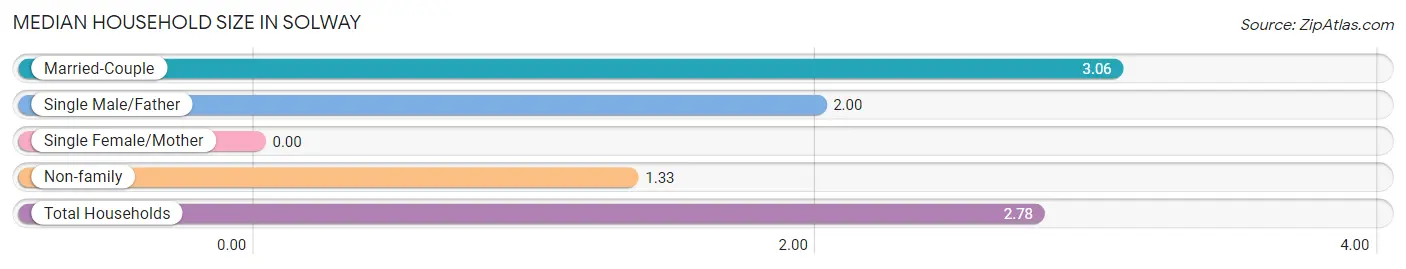
Median Household Size in Solway
| Household Type | # Households | Household Size |
| Married-Couple | 34 (82.9%) | 3.06 |
| Single Male/Father | 1 (2.4%) | 2.00 |
| Single Female/Mother | 0 (0.0%) | - |
| Non-family | 6 (14.6%) | 1.33 |
| Total Households | 41 (100.0%) | 2.78 |
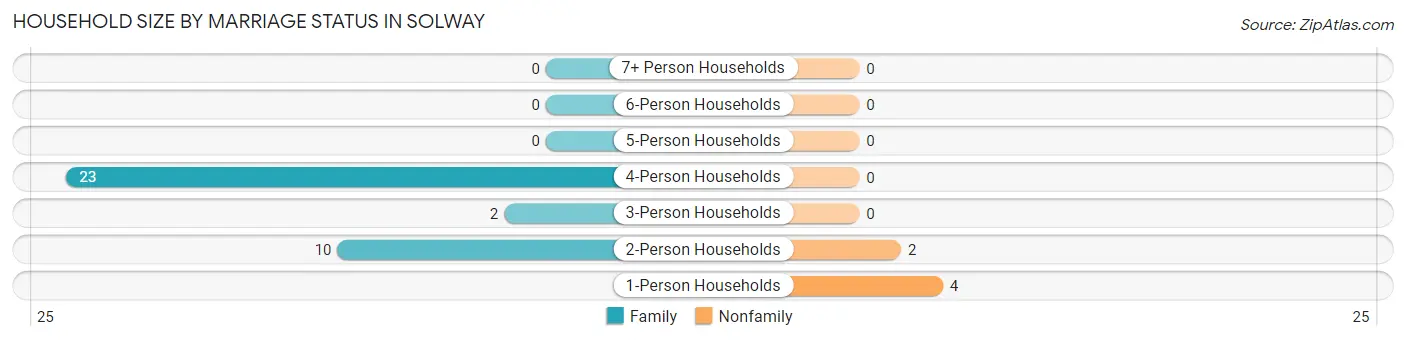
Household Size by Marriage Status in Solway
Out of a total of 41 households in Solway, 35 (85.4%) are family households, while 6 (14.6%) are nonfamily households. The most numerous type of family households are 4-person households, comprising 23, and the most common type of nonfamily households are 1-person households, comprising 4.
| Household Size | Family Households | Nonfamily Households |
| 1-Person Households | - | 4 (9.8%) |
| 2-Person Households | 10 (24.4%) | 2 (4.9%) |
| 3-Person Households | 2 (4.9%) | 0 (0.0%) |
| 4-Person Households | 23 (56.1%) | 0 (0.0%) |
| 5-Person Households | 0 (0.0%) | 0 (0.0%) |
| 6-Person Households | 0 (0.0%) | 0 (0.0%) |
| 7+ Person Households | 0 (0.0%) | 0 (0.0%) |
| Total | 35 (85.4%) | 6 (14.6%) |
Female Fertility in Solway
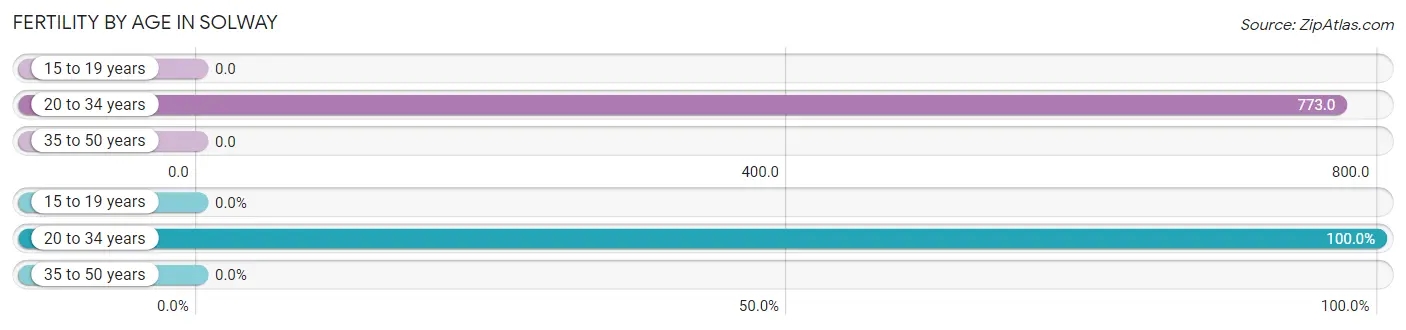
Fertility by Age in Solway
Average fertility rate in Solway is 708.0 births per 1,000 women. Women in the age bracket of 20 to 34 years have the highest fertility rate with 773.0 births per 1,000 women. Women in the age bracket of 20 to 34 years acount for 100.0% of all women with births.
| Age Bracket | Women with Births | Births / 1,000 Women |
| 15 to 19 years | 0 (0.0%) | 0.0 |
| 20 to 34 years | 17 (100.0%) | 773.0 |
| 35 to 50 years | 0 (0.0%) | 0.0 |
| Total | 17 (100.0%) | 708.0 |
Fertility by Age by Marriage Status in Solway
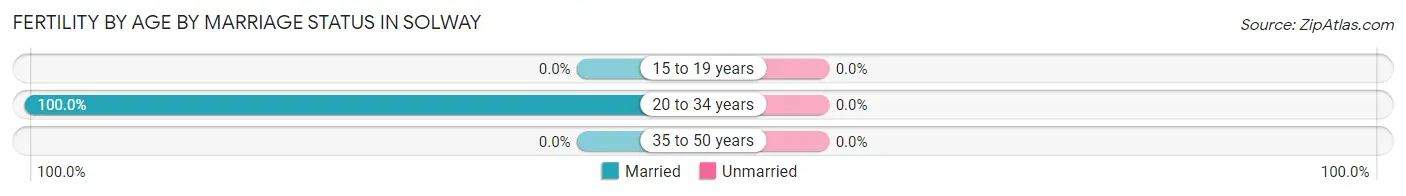
| Age Bracket | Married | Unmarried |
| 15 to 19 years | 0 (0.0%) | 0 (0.0%) |
| 20 to 34 years | 17 (100.0%) | 0 (0.0%) |
| 35 to 50 years | 0 (0.0%) | 0 (0.0%) |
| Total | 17 (100.0%) | 0 (0.0%) |
Fertility by Education in Solway
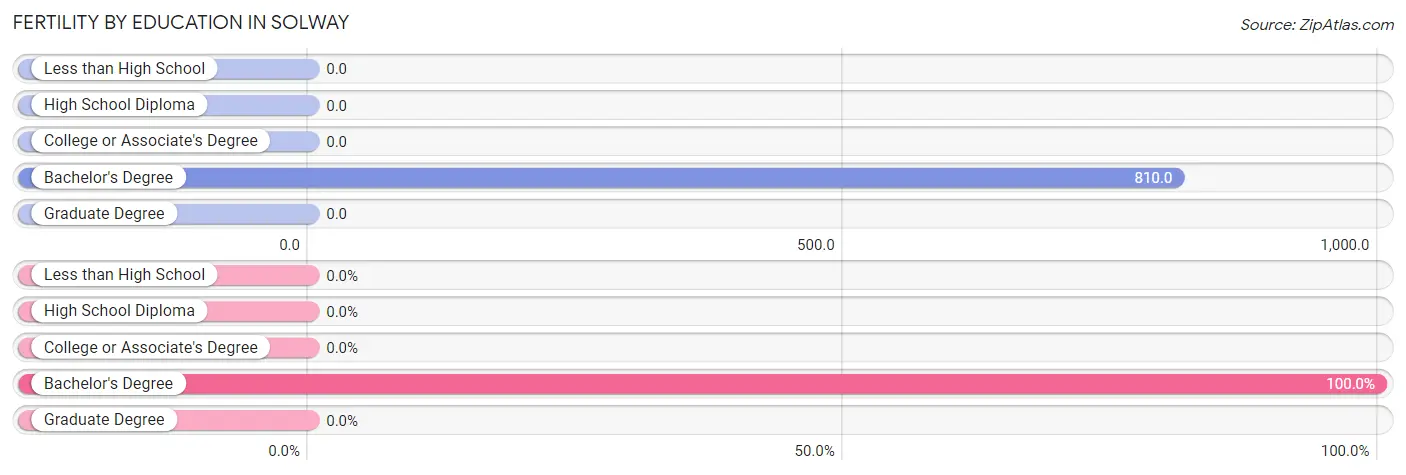
| Educational Attainment | Women with Births | Births / 1,000 Women |
| Less than High School | 0 (0.0%) | 0.0 |
| High School Diploma | 0 (0.0%) | 0.0 |
| College or Associate's Degree | 0 (0.0%) | 0.0 |
| Bachelor's Degree | 17 (100.0%) | 810.0 |
| Graduate Degree | 0 (0.0%) | 0.0 |
| Total | 17 (100.0%) | 708.0 |
Fertility by Education by Marriage Status in Solway
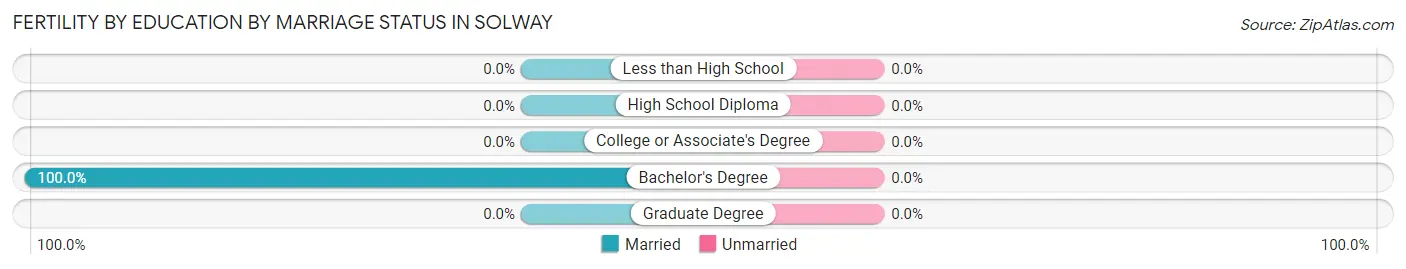
| Educational Attainment | Married | Unmarried |
| Less than High School | 0 (0.0%) | 0 (0.0%) |
| High School Diploma | 0 (0.0%) | 0 (0.0%) |
| College or Associate's Degree | 0 (0.0%) | 0 (0.0%) |
| Bachelor's Degree | 17 (100.0%) | 0 (0.0%) |
| Graduate Degree | 0 (0.0%) | 0 (0.0%) |
| Total | 17 (100.0%) | 0 (0.0%) |
Income in Solway
Income Overview in Solway
Per Capita Income in Solway is $31,888, while median incomes of families and households are $122,917 and $122,560 respectively.
| Characteristic | Number | Measure |
| Per Capita Income | 114 | $31,888 |
| Median Family Income | 35 | $122,917 |
| Mean Family Income | 35 | $102,917 |
| Median Household Income | 41 | $122,560 |
| Mean Household Income | 41 | $94,729 |
| Income Deficit | 35 | $0 |
| Wage / Income Gap (%) | 114 | 27.27% |
| Wage / Income Gap ($) | 114 | 72.73¢ per $1 |
| Gini / Inequality Index | 114 | 0.20 |
Earnings by Sex in Solway
Average Earnings in Solway are $45,500, $44,226 for men and $60,809 for women, a difference of 27.3%.
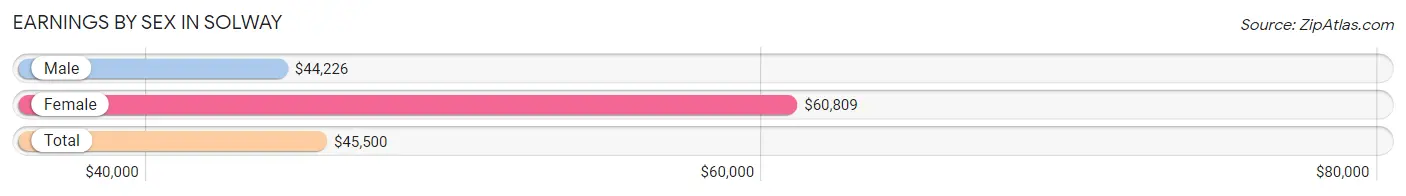
| Sex | Number | Average Earnings |
| Male | 33 (56.9%) | $44,226 |
| Female | 25 (43.1%) | $60,809 |
| Total | 58 (100.0%) | $45,500 |
Earnings by Sex by Income Bracket in Solway
The most common earnings brackets in Solway are $40,000 to $44,999 for men (21 | 63.6%) and $55,000 to $64,999 for women (18 | 72.0%).
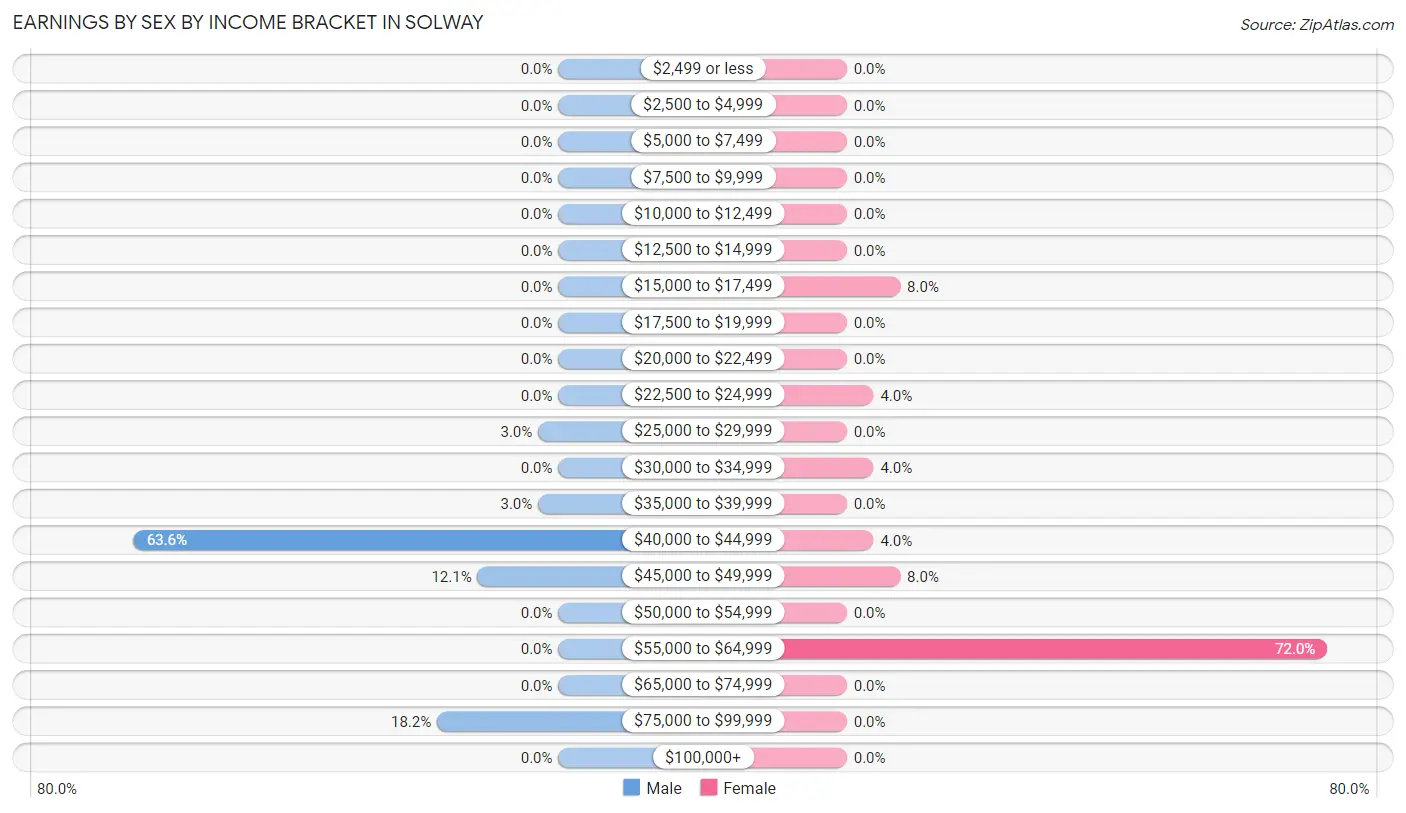
| Income | Male | Female |
| $2,499 or less | 0 (0.0%) | 0 (0.0%) |
| $2,500 to $4,999 | 0 (0.0%) | 0 (0.0%) |
| $5,000 to $7,499 | 0 (0.0%) | 0 (0.0%) |
| $7,500 to $9,999 | 0 (0.0%) | 0 (0.0%) |
| $10,000 to $12,499 | 0 (0.0%) | 0 (0.0%) |
| $12,500 to $14,999 | 0 (0.0%) | 0 (0.0%) |
| $15,000 to $17,499 | 0 (0.0%) | 2 (8.0%) |
| $17,500 to $19,999 | 0 (0.0%) | 0 (0.0%) |
| $20,000 to $22,499 | 0 (0.0%) | 0 (0.0%) |
| $22,500 to $24,999 | 0 (0.0%) | 1 (4.0%) |
| $25,000 to $29,999 | 1 (3.0%) | 0 (0.0%) |
| $30,000 to $34,999 | 0 (0.0%) | 1 (4.0%) |
| $35,000 to $39,999 | 1 (3.0%) | 0 (0.0%) |
| $40,000 to $44,999 | 21 (63.6%) | 1 (4.0%) |
| $45,000 to $49,999 | 4 (12.1%) | 2 (8.0%) |
| $50,000 to $54,999 | 0 (0.0%) | 0 (0.0%) |
| $55,000 to $64,999 | 0 (0.0%) | 18 (72.0%) |
| $65,000 to $74,999 | 0 (0.0%) | 0 (0.0%) |
| $75,000 to $99,999 | 6 (18.2%) | 0 (0.0%) |
| $100,000+ | 0 (0.0%) | 0 (0.0%) |
| Total | 33 (100.0%) | 25 (100.0%) |
Earnings by Sex by Educational Attainment in Solway
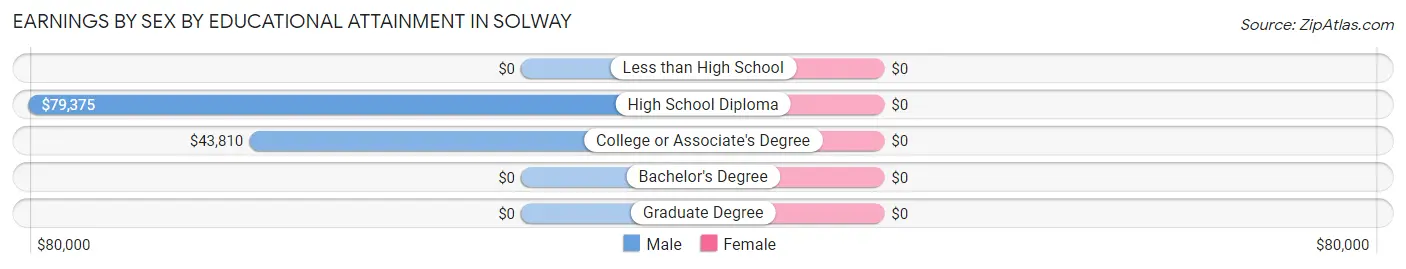
| Educational Attainment | Male Income | Female Income |
| Less than High School | - | - |
| High School Diploma | $79,375 | $0 |
| College or Associate's Degree | $43,810 | $0 |
| Bachelor's Degree | - | - |
| Graduate Degree | - | - |
| Total | $44,107 | $60,956 |
Family Income in Solway
Family Income Brackets in Solway
According to the Solway family income data, there are 22 families falling into the $100,000 to $149,999 income range, which is the most common income bracket and makes up 62.9% of all families.
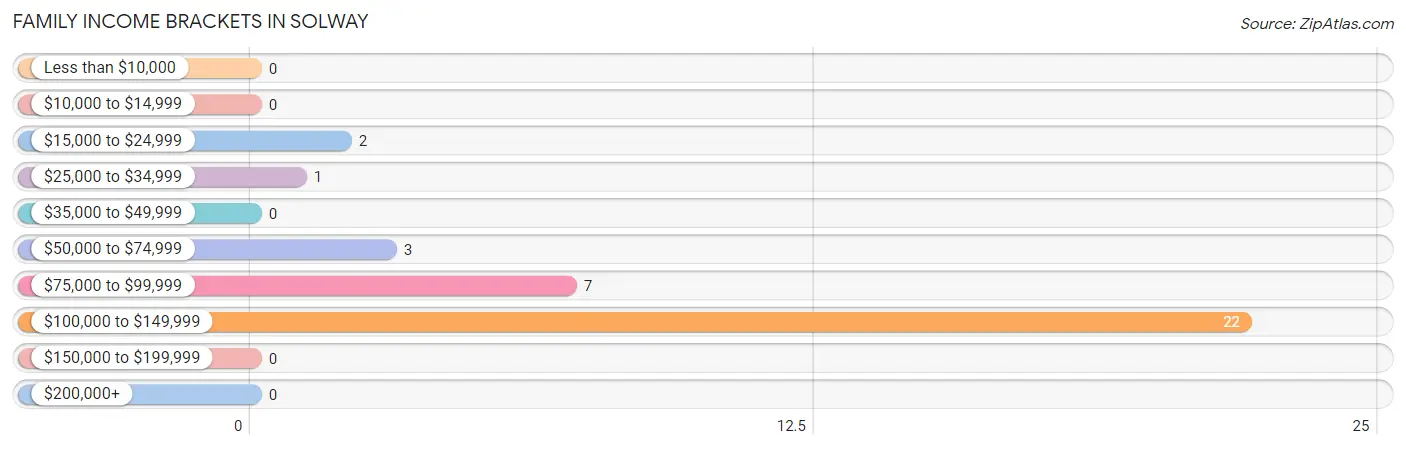
| Income Bracket | # Families | % Families |
| Less than $10,000 | 0 | 0.0% |
| $10,000 to $14,999 | 0 | 0.0% |
| $15,000 to $24,999 | 2 | 5.7% |
| $25,000 to $34,999 | 1 | 2.9% |
| $35,000 to $49,999 | 0 | 0.0% |
| $50,000 to $74,999 | 3 | 8.6% |
| $75,000 to $99,999 | 7 | 20.0% |
| $100,000 to $149,999 | 22 | 62.9% |
| $150,000 to $199,999 | 0 | 0.0% |
| $200,000+ | 0 | 0.0% |
Family Income by Famaliy Size in Solway
2-person families (10 | 28.6%) account for the highest median family income in Solway with $59,167 per family, while 2-person families (10 | 28.6%) have the highest median income of $29,584 per family member.
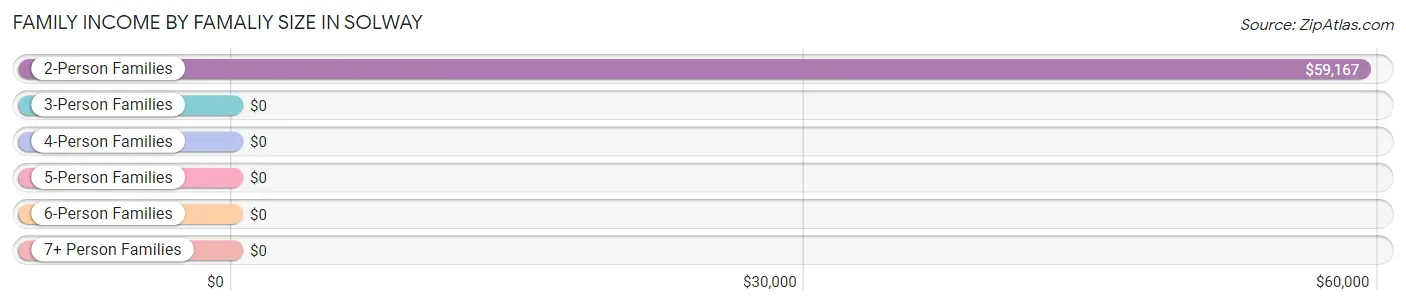
| Income Bracket | # Families | Median Income |
| 2-Person Families | 10 (28.6%) | $59,167 |
| 3-Person Families | 2 (5.7%) | $0 |
| 4-Person Families | 23 (65.7%) | $0 |
| 5-Person Families | 0 (0.0%) | $0 |
| 6-Person Families | 0 (0.0%) | $0 |
| 7+ Person Families | 0 (0.0%) | $0 |
| Total | 35 (100.0%) | $122,917 |
Family Income by Number of Earners in Solway
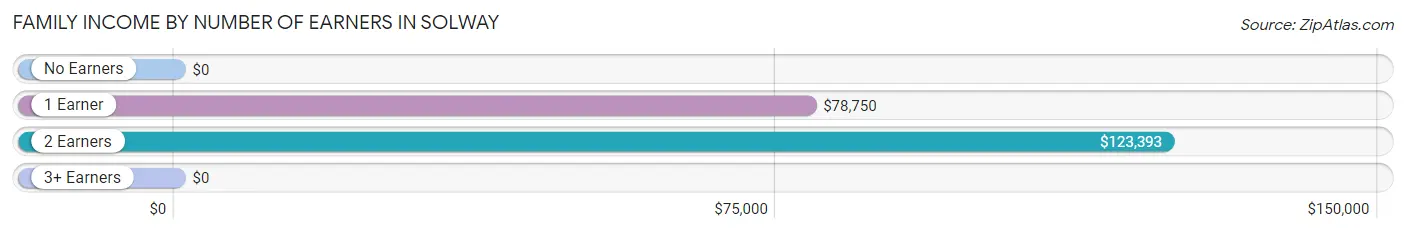
| Number of Earners | # Families | Median Income |
| No Earners | 4 (11.4%) | $0 |
| 1 Earner | 4 (11.4%) | $78,750 |
| 2 Earners | 27 (77.1%) | $123,393 |
| 3+ Earners | 0 (0.0%) | $0 |
| Total | 35 (100.0%) | $122,917 |
Household Income in Solway
Household Income Brackets in Solway
With 22 households falling in the category, the $100,000 to $149,999 income range is the most frequent in Solway, accounting for 53.7% of all households.
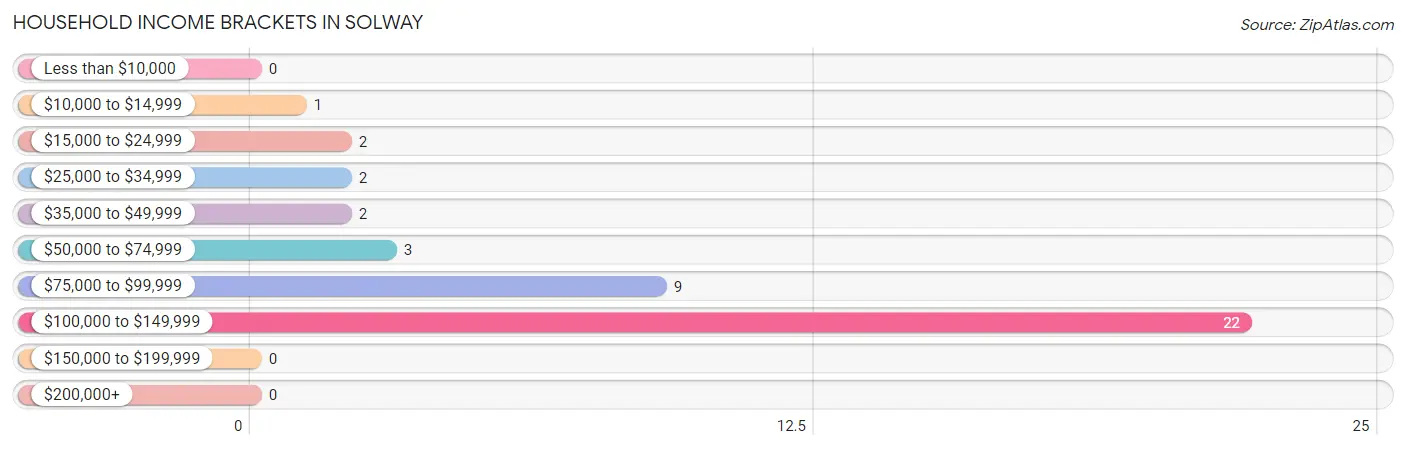
| Income Bracket | # Households | % Households |
| Less than $10,000 | 0 | 0.0% |
| $10,000 to $14,999 | 1 | 2.4% |
| $15,000 to $24,999 | 2 | 4.9% |
| $25,000 to $34,999 | 2 | 4.9% |
| $35,000 to $49,999 | 2 | 4.9% |
| $50,000 to $74,999 | 3 | 7.3% |
| $75,000 to $99,999 | 9 | 22.0% |
| $100,000 to $149,999 | 22 | 53.7% |
| $150,000 to $199,999 | 0 | 0.0% |
| $200,000+ | 0 | 0.0% |
Household Income by Householder Age in Solway
The median household income in Solway is $122,560, with the highest median household income of $123,452 found in the 25 to 44 years age bracket for the primary householder. A total of 26 households (63.4%) fall into this category. Meanwhile, the 15 to 24 years age bracket for the primary householder has the lowest median household income of $0, with 2 households (4.9%) in this group.
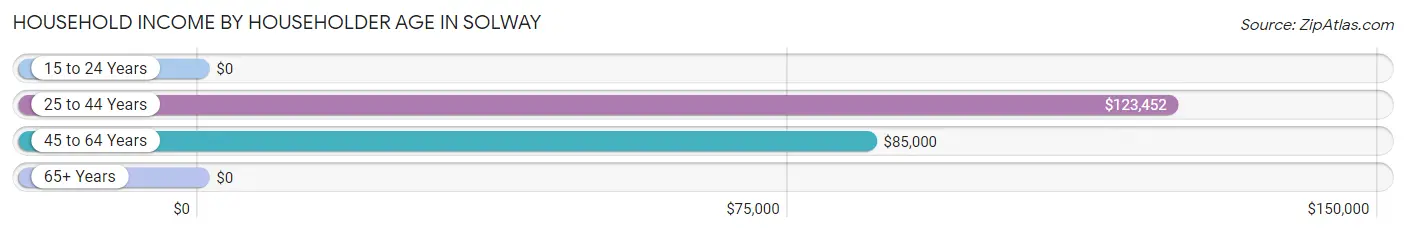
| Income Bracket | # Households | Median Income |
| 15 to 24 Years | 2 (4.9%) | $0 |
| 25 to 44 Years | 26 (63.4%) | $123,452 |
| 45 to 64 Years | 6 (14.6%) | $85,000 |
| 65+ Years | 7 (17.1%) | $0 |
| Total | 41 (100.0%) | $122,560 |
Poverty in Solway
Income Below Poverty by Sex and Age in Solway
With 4.0% poverty level for males and 7.9% for females among the residents of Solway, 75 year old and over males and 75 year old and over females are the most vulnerable to poverty, with 2 males (100.0%) and 2 females (66.7%) in their respective age groups living below the poverty level.
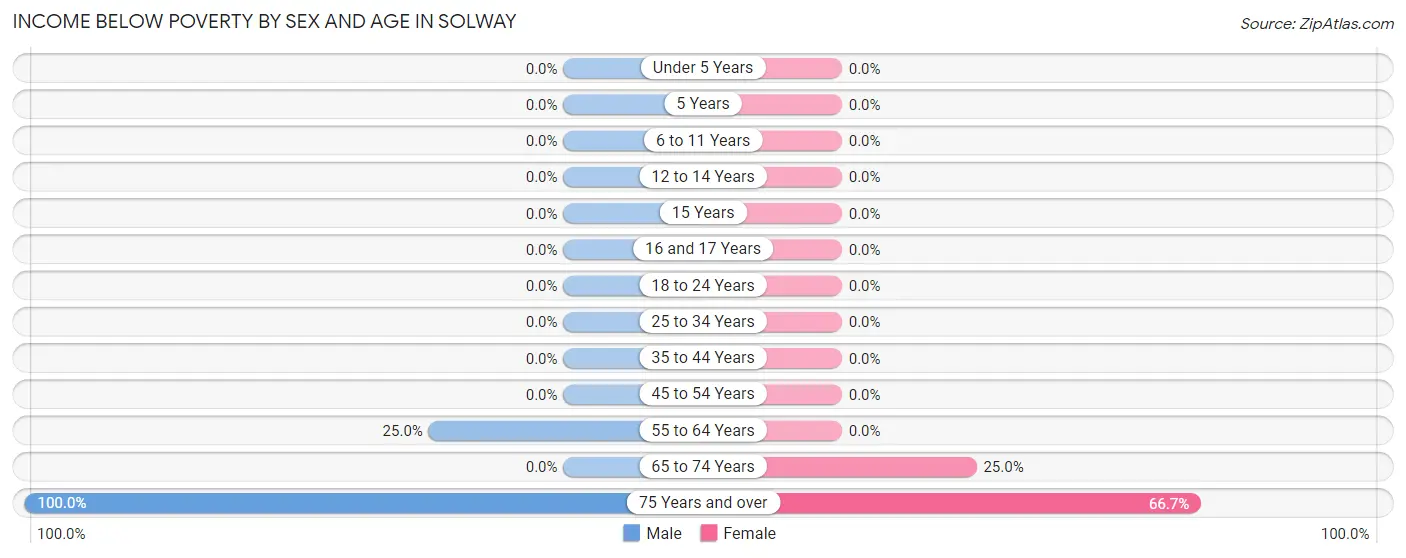
| Age Bracket | Male | Female |
| Under 5 Years | 0 (0.0%) | 0 (0.0%) |
| 5 Years | 0 (0.0%) | 0 (0.0%) |
| 6 to 11 Years | 0 (0.0%) | 0 (0.0%) |
| 12 to 14 Years | 0 (0.0%) | 0 (0.0%) |
| 15 Years | 0 (0.0%) | 0 (0.0%) |
| 16 and 17 Years | 0 (0.0%) | 0 (0.0%) |
| 18 to 24 Years | 0 (0.0%) | 0 (0.0%) |
| 25 to 34 Years | 0 (0.0%) | 0 (0.0%) |
| 35 to 44 Years | 0 (0.0%) | 0 (0.0%) |
| 45 to 54 Years | 0 (0.0%) | 0 (0.0%) |
| 55 to 64 Years | 1 (25.0%) | 0 (0.0%) |
| 65 to 74 Years | 0 (0.0%) | 1 (25.0%) |
| 75 Years and over | 2 (100.0%) | 2 (66.7%) |
| Total | 3 (4.0%) | 3 (7.9%) |
Income Above Poverty by Sex and Age in Solway
According to the poverty statistics in Solway, males aged under 5 years and females aged under 5 years are the age groups that are most secure financially, with 100.0% of males and 100.0% of females in these age groups living above the poverty line.
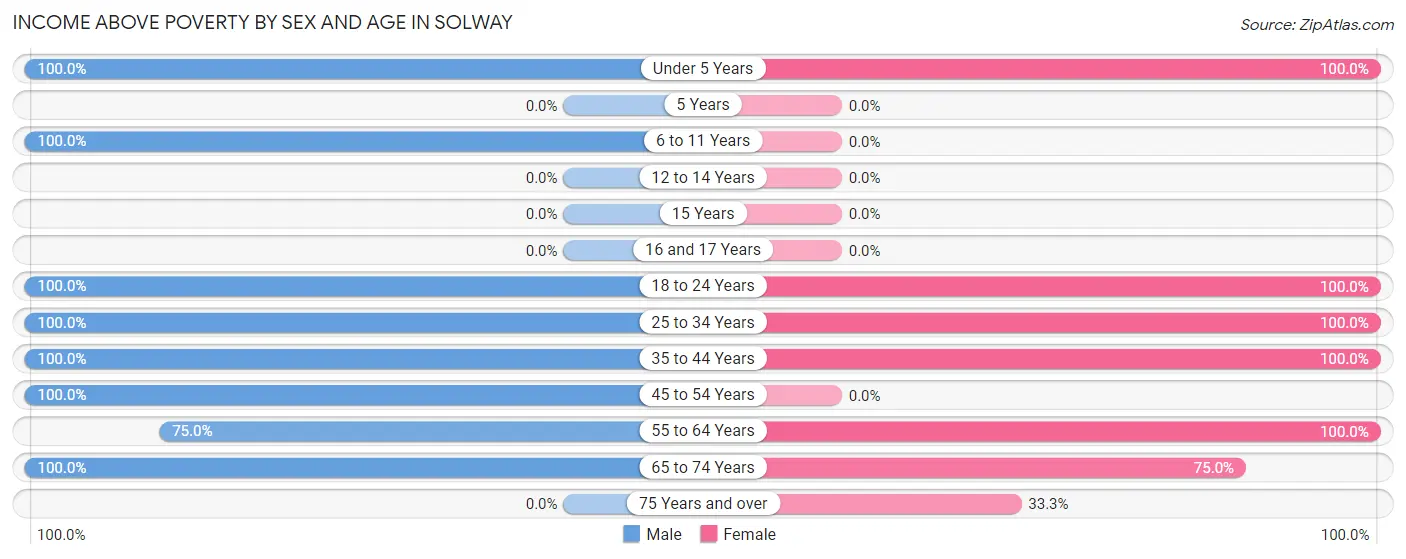
| Age Bracket | Male | Female |
| Under 5 Years | 34 (100.0%) | 3 (100.0%) |
| 5 Years | 0 (0.0%) | 0 (0.0%) |
| 6 to 11 Years | 1 (100.0%) | 0 (0.0%) |
| 12 to 14 Years | 0 (0.0%) | 0 (0.0%) |
| 15 Years | 0 (0.0%) | 0 (0.0%) |
| 16 and 17 Years | 0 (0.0%) | 0 (0.0%) |
| 18 to 24 Years | 4 (100.0%) | 2 (100.0%) |
| 25 to 34 Years | 23 (100.0%) | 20 (100.0%) |
| 35 to 44 Years | 2 (100.0%) | 2 (100.0%) |
| 45 to 54 Years | 2 (100.0%) | 0 (0.0%) |
| 55 to 64 Years | 3 (75.0%) | 4 (100.0%) |
| 65 to 74 Years | 4 (100.0%) | 3 (75.0%) |
| 75 Years and over | 0 (0.0%) | 1 (33.3%) |
| Total | 73 (96.1%) | 35 (92.1%) |
Income Below Poverty Among Married-Couple Families in Solway
The poverty statistics for married-couple families in Solway show that 5.9% or 2 of the total 34 families live below the poverty line. Families with no children have the highest poverty rate of 18.2%, comprising of 2 families. On the other hand, families with 1 or 2 children have the lowest poverty rate of 0.0%, which includes 0 families.
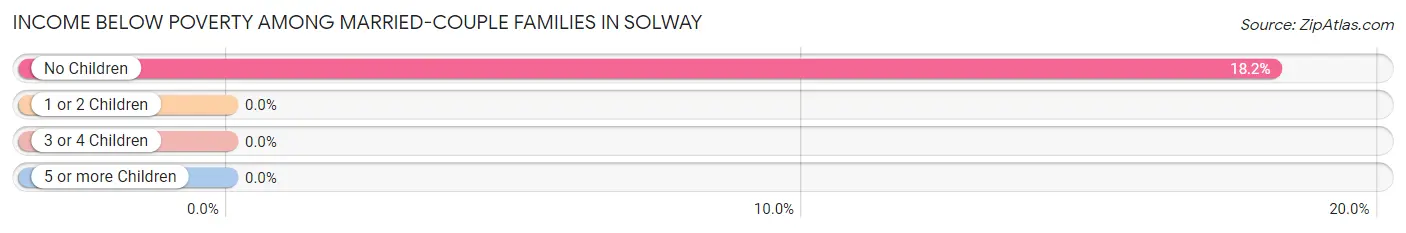
| Children | Above Poverty | Below Poverty |
| No Children | 9 (81.8%) | 2 (18.2%) |
| 1 or 2 Children | 23 (100.0%) | 0 (0.0%) |
| 3 or 4 Children | 0 (0.0%) | 0 (0.0%) |
| 5 or more Children | 0 (0.0%) | 0 (0.0%) |
| Total | 32 (94.1%) | 2 (5.9%) |
Income Below Poverty Among Single-Parent Households in Solway
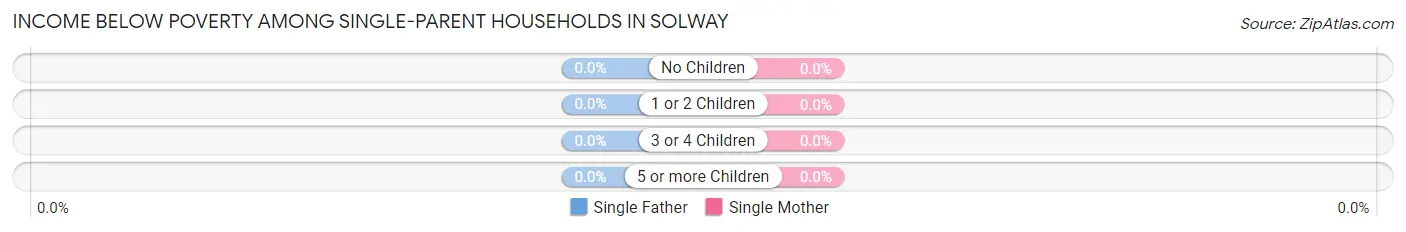
| Children | Single Father | Single Mother |
| No Children | 0 (0.0%) | 0 (0.0%) |
| 1 or 2 Children | 0 (0.0%) | 0 (0.0%) |
| 3 or 4 Children | 0 (0.0%) | 0 (0.0%) |
| 5 or more Children | 0 (0.0%) | 0 (0.0%) |
| Total | 0 (0.0%) | 0 (0.0%) |
Income Below Poverty Among Married-Couple vs Single-Parent Households in Solway
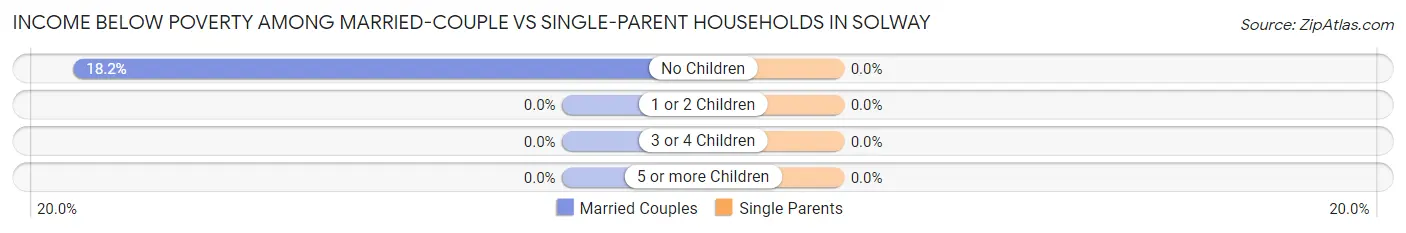
| Children | Married-Couple Families | Single-Parent Households |
| No Children | 2 (18.2%) | 0 (0.0%) |
| 1 or 2 Children | 0 (0.0%) | 0 (0.0%) |
| 3 or 4 Children | 0 (0.0%) | 0 (0.0%) |
| 5 or more Children | 0 (0.0%) | 0 (0.0%) |
| Total | 2 (5.9%) | 0 (0.0%) |
Employment Characteristics in Solway
Employment by Class of Employer in Solway
Among the 41 employed individuals in Solway, private company employees (36 | 87.8%), not-for-profit organizations (2 | 4.9%), and state government employees (2 | 4.9%) make up the most common classes of employment.
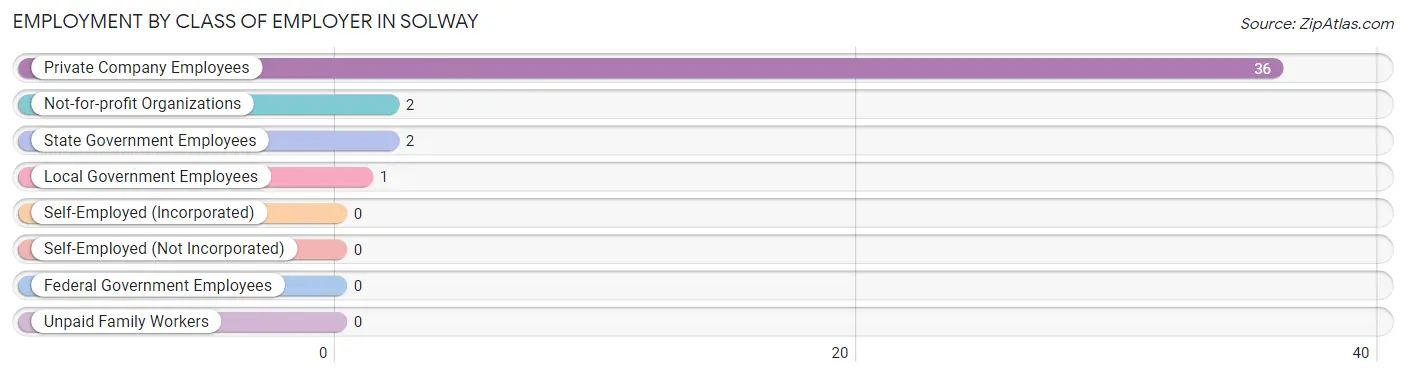
| Employer Class | # Employees | % Employees |
| Private Company Employees | 36 | 87.8% |
| Self-Employed (Incorporated) | 0 | 0.0% |
| Self-Employed (Not Incorporated) | 0 | 0.0% |
| Not-for-profit Organizations | 2 | 4.9% |
| Local Government Employees | 1 | 2.4% |
| State Government Employees | 2 | 4.9% |
| Federal Government Employees | 0 | 0.0% |
| Unpaid Family Workers | 0 | 0.0% |
| Total | 41 | 100.0% |
Employment Status by Age in Solway
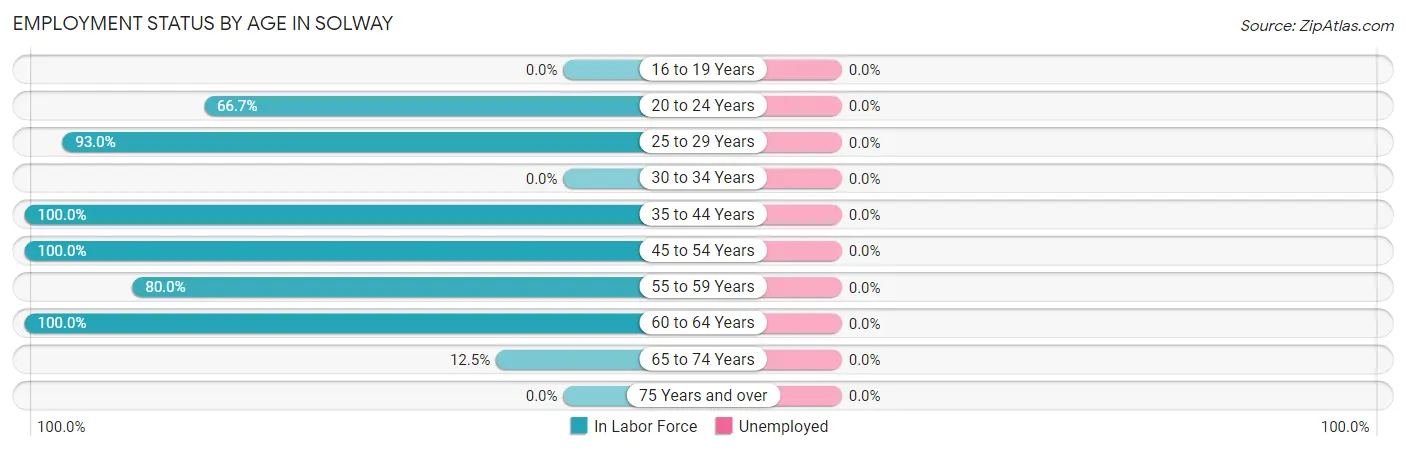
| Age Bracket | In Labor Force | Unemployed |
| 16 to 19 Years | 0 (0.0%) | 0 (0.0%) |
| 20 to 24 Years | 4 (66.7%) | 0 (0.0%) |
| 25 to 29 Years | 40 (93.0%) | 0 (0.0%) |
| 30 to 34 Years | 0 (0.0%) | 0 (0.0%) |
| 35 to 44 Years | 4 (100.0%) | 0 (0.0%) |
| 45 to 54 Years | 2 (100.0%) | 0 (0.0%) |
| 55 to 59 Years | 4 (80.0%) | 0 (0.0%) |
| 60 to 64 Years | 3 (100.0%) | 0 (0.0%) |
| 65 to 74 Years | 1 (12.5%) | 0 (0.0%) |
| 75 Years and over | 0 (0.0%) | 0 (0.0%) |
| Total | 58 (76.3%) | 0 (0.0%) |
Employment Status by Educational Attainment in Solway

| Educational Attainment | In Labor Force | Unemployed |
| Less than High School | 0 (0.0%) | 0 (0.0%) |
| High School Diploma | 6 (85.7%) | 0 (0.0%) |
| College / Associate Degree | 28 (100.0%) | 0 (0.0%) |
| Bachelor's Degree or higher | 19 (86.4%) | 0 (0.0%) |
| Total | 53 (93.0%) | 0 (0.0%) |
Employment Occupations by Sex in Solway
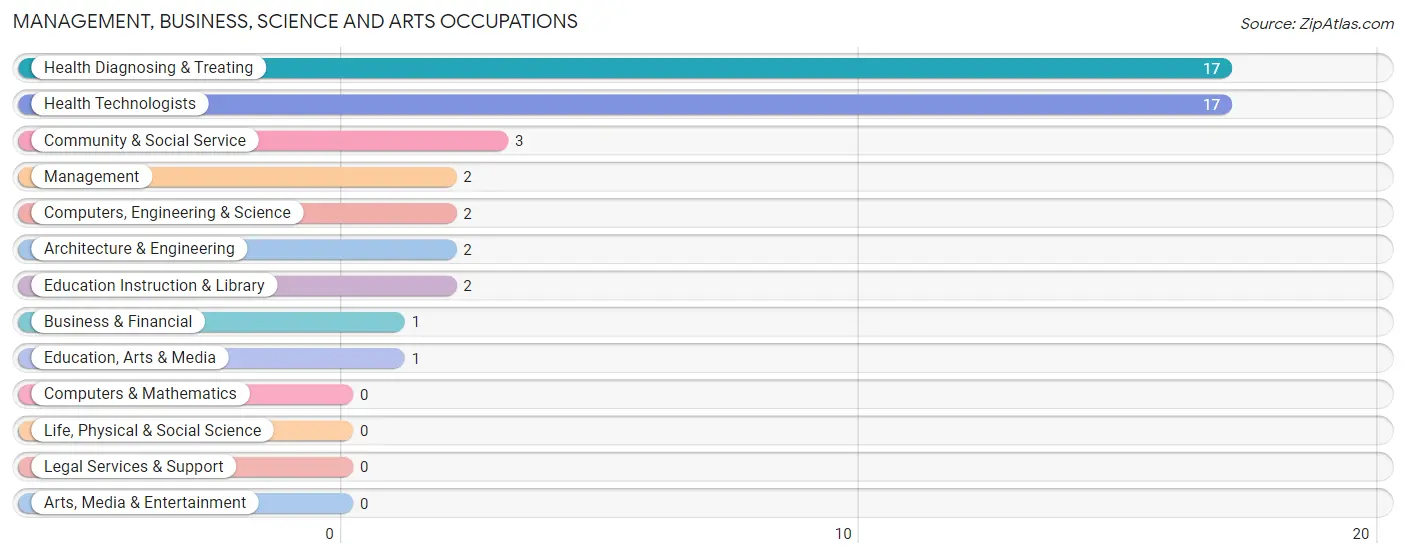
Management, Business, Science and Arts Occupations
The most common Management, Business, Science and Arts occupations in Solway are Health Diagnosing & Treating (17 | 29.3%), Health Technologists (17 | 29.3%), Community & Social Service (3 | 5.2%), Management (2 | 3.5%), and Computers, Engineering & Science (2 | 3.5%).
Management, Business, Science and Arts Occupations by Sex
Within the Management, Business, Science and Arts occupations in Solway, the most male-oriented occupations are Management (100.0%), Computers, Engineering & Science (100.0%), and Architecture & Engineering (100.0%), while the most female-oriented occupations are Business & Financial (100.0%), Health Diagnosing & Treating (100.0%), and Health Technologists (100.0%).
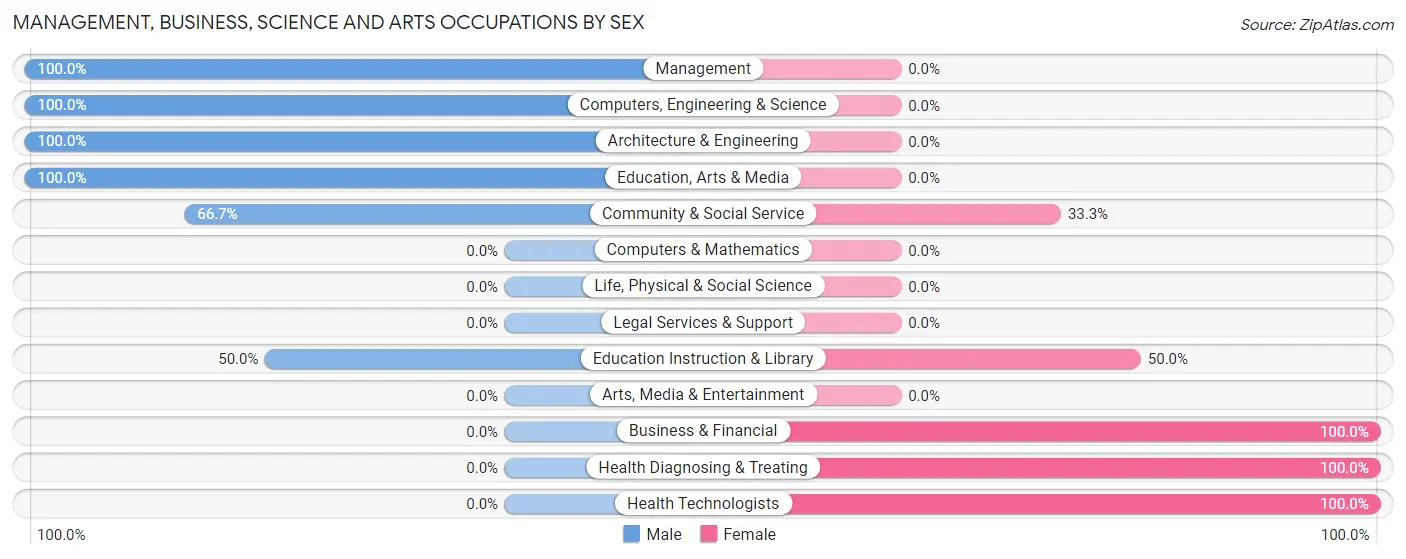
| Occupation | Male | Female |
| Management | 2 (100.0%) | 0 (0.0%) |
| Business & Financial | 0 (0.0%) | 1 (100.0%) |
| Computers, Engineering & Science | 2 (100.0%) | 0 (0.0%) |
| Computers & Mathematics | 0 (0.0%) | 0 (0.0%) |
| Architecture & Engineering | 2 (100.0%) | 0 (0.0%) |
| Life, Physical & Social Science | 0 (0.0%) | 0 (0.0%) |
| Community & Social Service | 2 (66.7%) | 1 (33.3%) |
| Education, Arts & Media | 1 (100.0%) | 0 (0.0%) |
| Legal Services & Support | 0 (0.0%) | 0 (0.0%) |
| Education Instruction & Library | 1 (50.0%) | 1 (50.0%) |
| Arts, Media & Entertainment | 0 (0.0%) | 0 (0.0%) |
| Health Diagnosing & Treating | 0 (0.0%) | 17 (100.0%) |
| Health Technologists | 0 (0.0%) | 17 (100.0%) |
| Total (Category) | 6 (24.0%) | 19 (76.0%) |
| Total (Overall) | 33 (56.9%) | 25 (43.1%) |
Services Occupations
The most common Services occupations in Solway are , and Cleaning & Maintenance (1 | 1.7%).
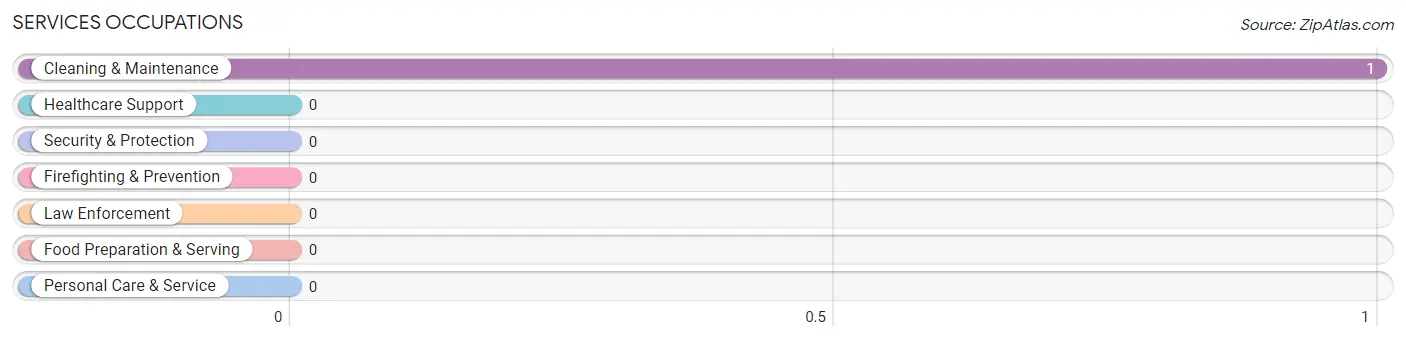
Services Occupations by Sex
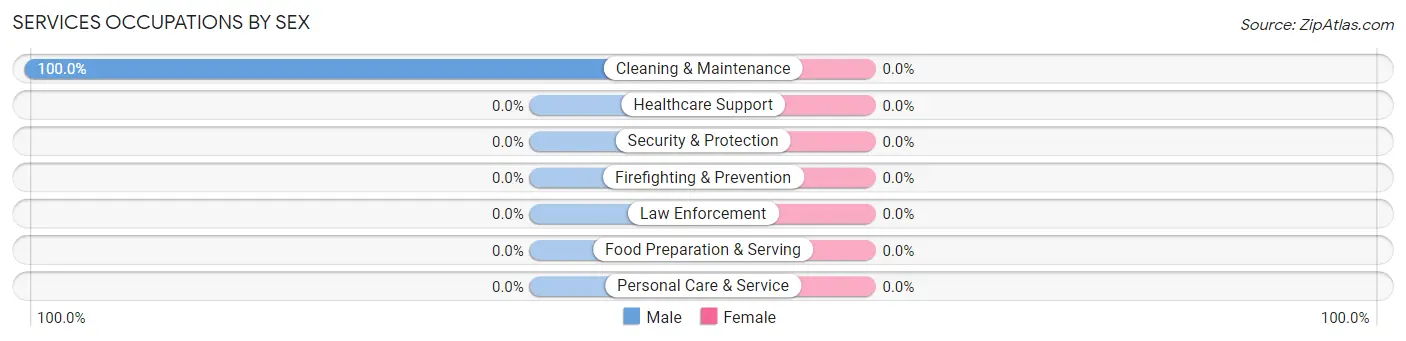
| Occupation | Male | Female |
| Healthcare Support | 0 (0.0%) | 0 (0.0%) |
| Security & Protection | 0 (0.0%) | 0 (0.0%) |
| Firefighting & Prevention | 0 (0.0%) | 0 (0.0%) |
| Law Enforcement | 0 (0.0%) | 0 (0.0%) |
| Food Preparation & Serving | 0 (0.0%) | 0 (0.0%) |
| Cleaning & Maintenance | 1 (100.0%) | 0 (0.0%) |
| Personal Care & Service | 0 (0.0%) | 0 (0.0%) |
| Total (Category) | 1 (100.0%) | 0 (0.0%) |
| Total (Overall) | 33 (56.9%) | 25 (43.1%) |
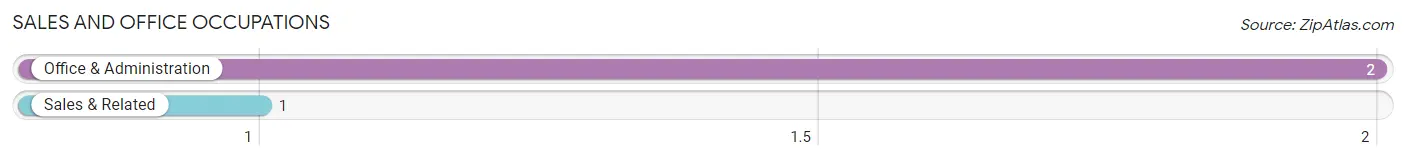
Sales and Office Occupations
The most common Sales and Office occupations in Solway are Office & Administration (2 | 3.5%), and Sales & Related (1 | 1.7%).
Sales and Office Occupations by Sex
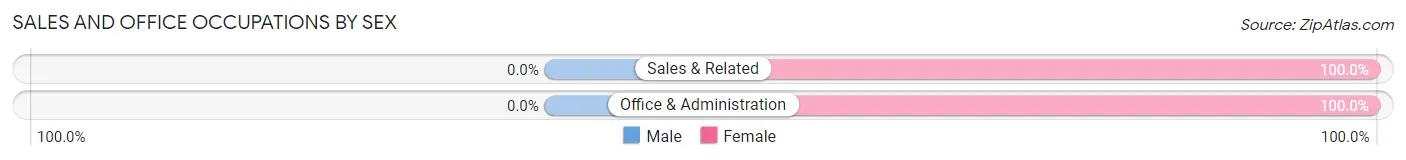
| Occupation | Male | Female |
| Sales & Related | 0 (0.0%) | 1 (100.0%) |
| Office & Administration | 0 (0.0%) | 2 (100.0%) |
| Total (Category) | 0 (0.0%) | 3 (100.0%) |
| Total (Overall) | 33 (56.9%) | 25 (43.1%) |
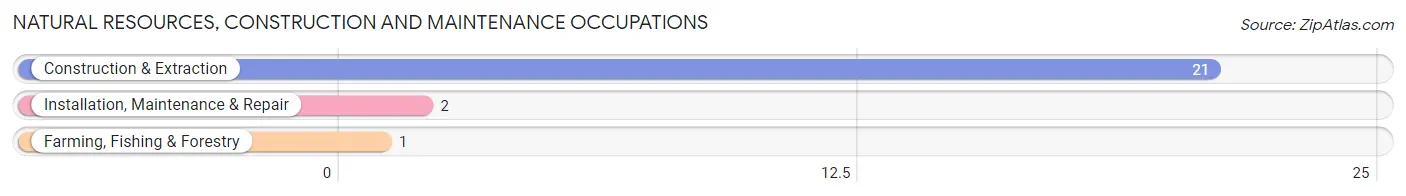
Natural Resources, Construction and Maintenance Occupations
The most common Natural Resources, Construction and Maintenance occupations in Solway are Construction & Extraction (21 | 36.2%), Installation, Maintenance & Repair (2 | 3.5%), and Farming, Fishing & Forestry (1 | 1.7%).
Natural Resources, Construction and Maintenance Occupations by Sex
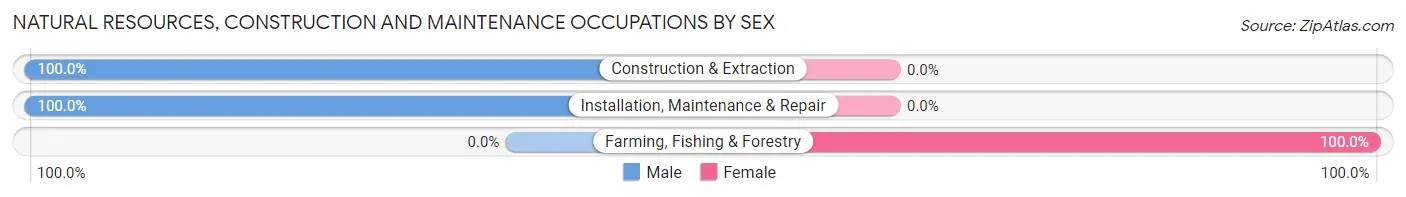
| Occupation | Male | Female |
| Farming, Fishing & Forestry | 0 (0.0%) | 1 (100.0%) |
| Construction & Extraction | 21 (100.0%) | 0 (0.0%) |
| Installation, Maintenance & Repair | 2 (100.0%) | 0 (0.0%) |
| Total (Category) | 23 (95.8%) | 1 (4.2%) |
| Total (Overall) | 33 (56.9%) | 25 (43.1%) |
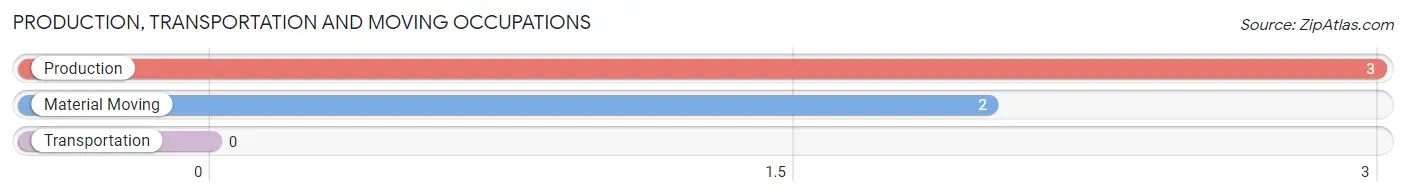
Production, Transportation and Moving Occupations
The most common Production, Transportation and Moving occupations in Solway are Production (3 | 5.2%), and Material Moving (2 | 3.5%).
Production, Transportation and Moving Occupations by Sex
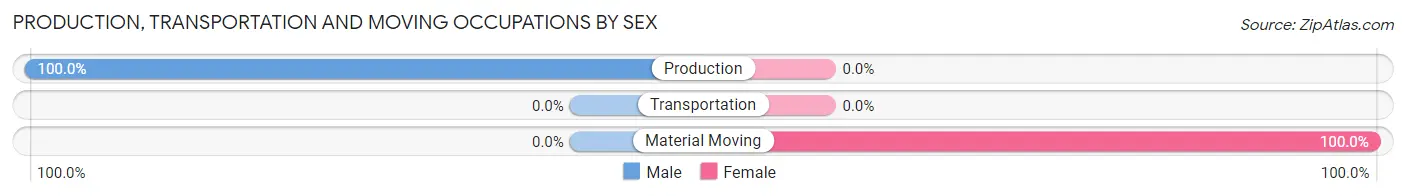
| Occupation | Male | Female |
| Production | 3 (100.0%) | 0 (0.0%) |
| Transportation | 0 (0.0%) | 0 (0.0%) |
| Material Moving | 0 (0.0%) | 2 (100.0%) |
| Total (Category) | 3 (60.0%) | 2 (40.0%) |
| Total (Overall) | 33 (56.9%) | 25 (43.1%) |
Employment Industries by Sex in Solway
Employment Industries in Solway
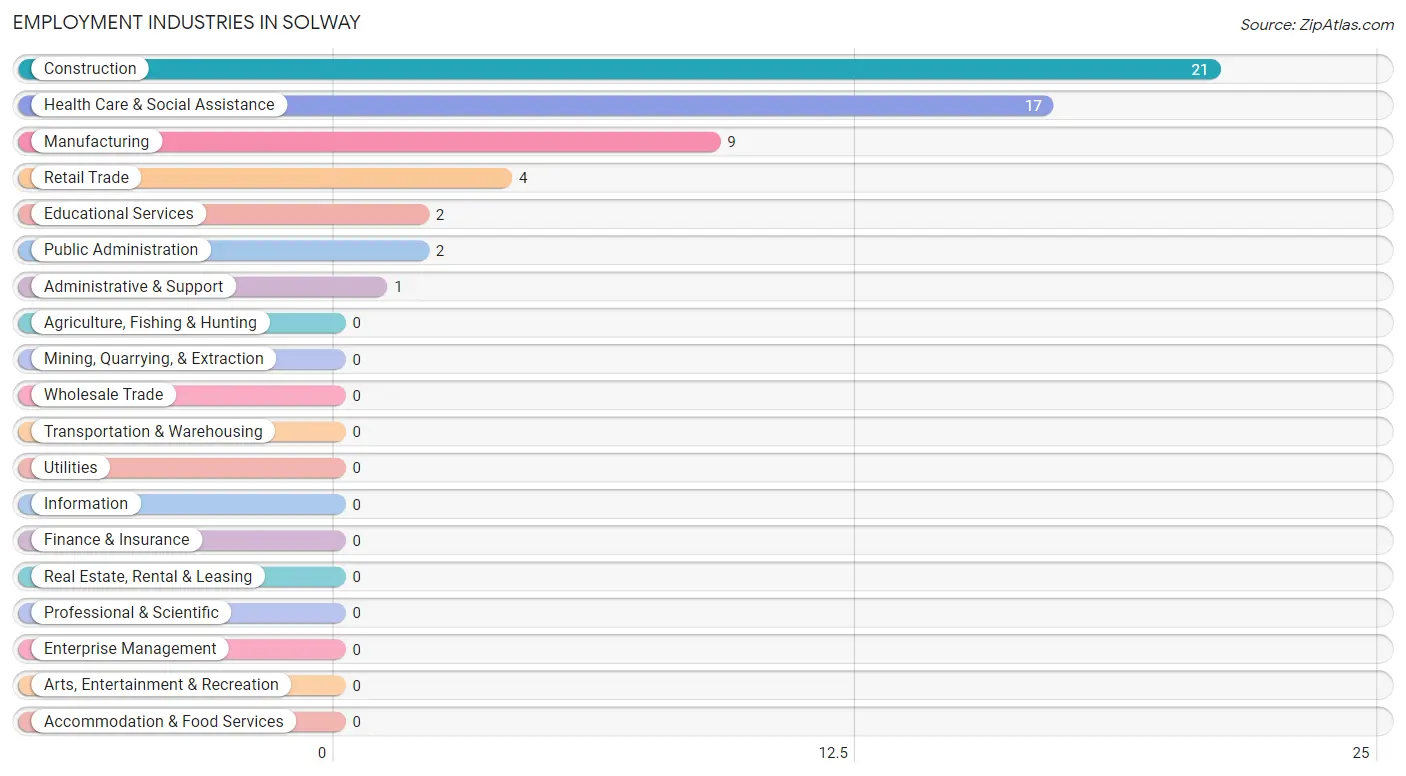
The major employment industries in Solway include Construction (21 | 36.2%), Health Care & Social Assistance (17 | 29.3%), Manufacturing (9 | 15.5%), Retail Trade (4 | 6.9%), and Educational Services (2 | 3.5%).
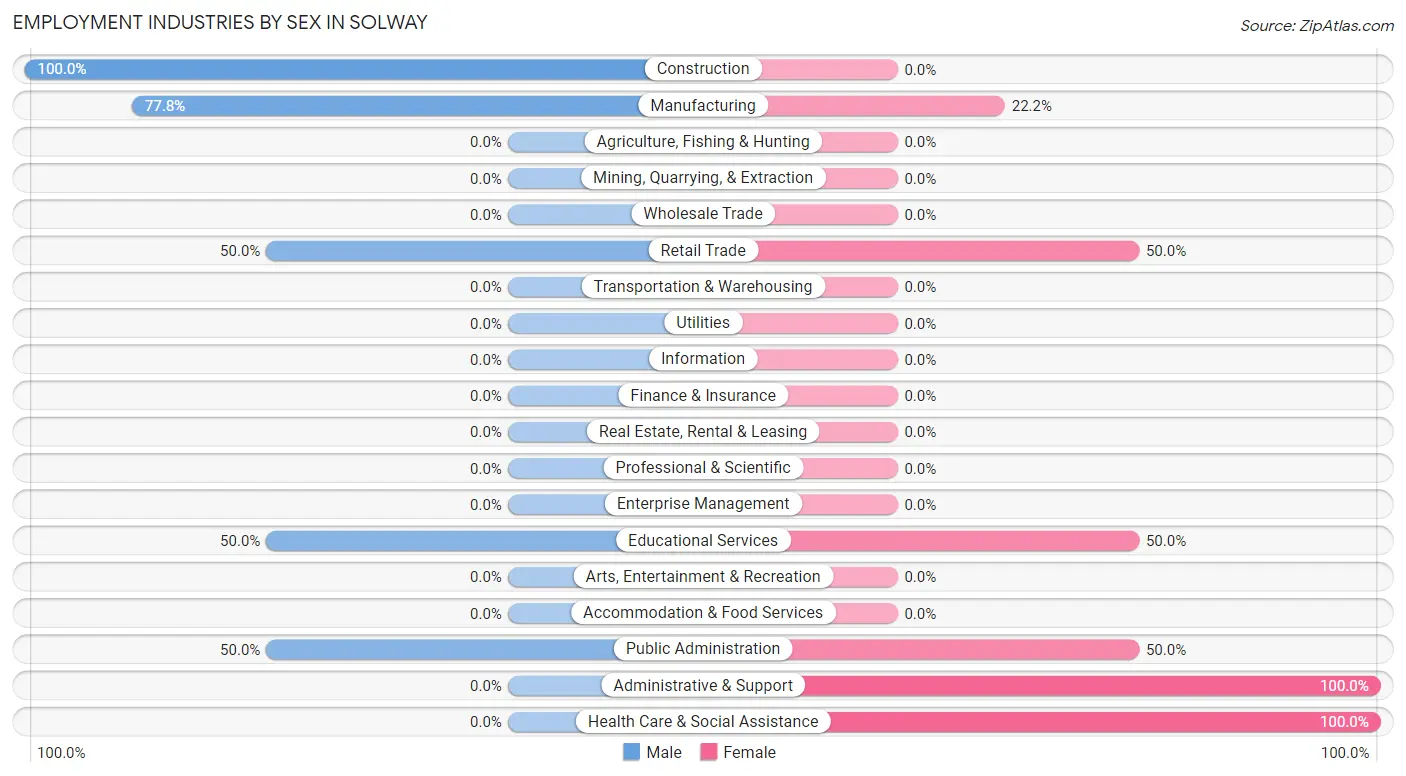
Employment Industries by Sex in Solway
The Solway industries that see more men than women are Construction (100.0%), Manufacturing (77.8%), and Retail Trade (50.0%), whereas the industries that tend to have a higher number of women are Administrative & Support (100.0%), Health Care & Social Assistance (100.0%), and Retail Trade (50.0%).
| Industry | Male | Female |
| Agriculture, Fishing & Hunting | 0 (0.0%) | 0 (0.0%) |
| Mining, Quarrying, & Extraction | 0 (0.0%) | 0 (0.0%) |
| Construction | 21 (100.0%) | 0 (0.0%) |
| Manufacturing | 7 (77.8%) | 2 (22.2%) |
| Wholesale Trade | 0 (0.0%) | 0 (0.0%) |
| Retail Trade | 2 (50.0%) | 2 (50.0%) |
| Transportation & Warehousing | 0 (0.0%) | 0 (0.0%) |
| Utilities | 0 (0.0%) | 0 (0.0%) |
| Information | 0 (0.0%) | 0 (0.0%) |
| Finance & Insurance | 0 (0.0%) | 0 (0.0%) |
| Real Estate, Rental & Leasing | 0 (0.0%) | 0 (0.0%) |
| Professional & Scientific | 0 (0.0%) | 0 (0.0%) |
| Enterprise Management | 0 (0.0%) | 0 (0.0%) |
| Administrative & Support | 0 (0.0%) | 1 (100.0%) |
| Educational Services | 1 (50.0%) | 1 (50.0%) |
| Health Care & Social Assistance | 0 (0.0%) | 17 (100.0%) |
| Arts, Entertainment & Recreation | 0 (0.0%) | 0 (0.0%) |
| Accommodation & Food Services | 0 (0.0%) | 0 (0.0%) |
| Public Administration | 1 (50.0%) | 1 (50.0%) |
| Total | 33 (56.9%) | 25 (43.1%) |
Education in Solway
School Enrollment in Solway
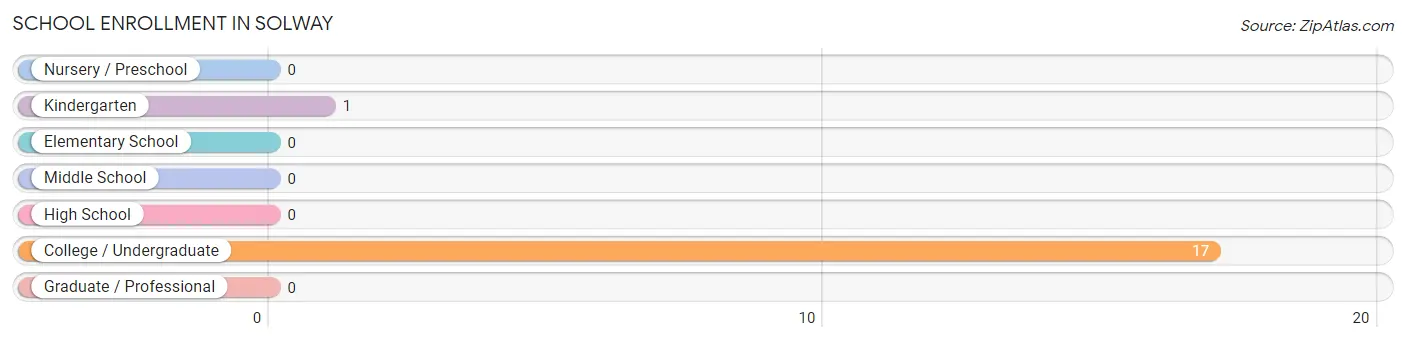
The most common levels of schooling among the 18 students in Solway are college / undergraduate (17 | 94.4%), and kindergarten (1 | 5.6%).
| School Level | # Students | % Students |
| Nursery / Preschool | 0 | 0.0% |
| Kindergarten | 1 | 5.6% |
| Elementary School | 0 | 0.0% |
| Middle School | 0 | 0.0% |
| High School | 0 | 0.0% |
| College / Undergraduate | 17 | 94.4% |
| Graduate / Professional | 0 | 0.0% |
| Total | 18 | 100.0% |
School Enrollment by Age by Funding Source in Solway
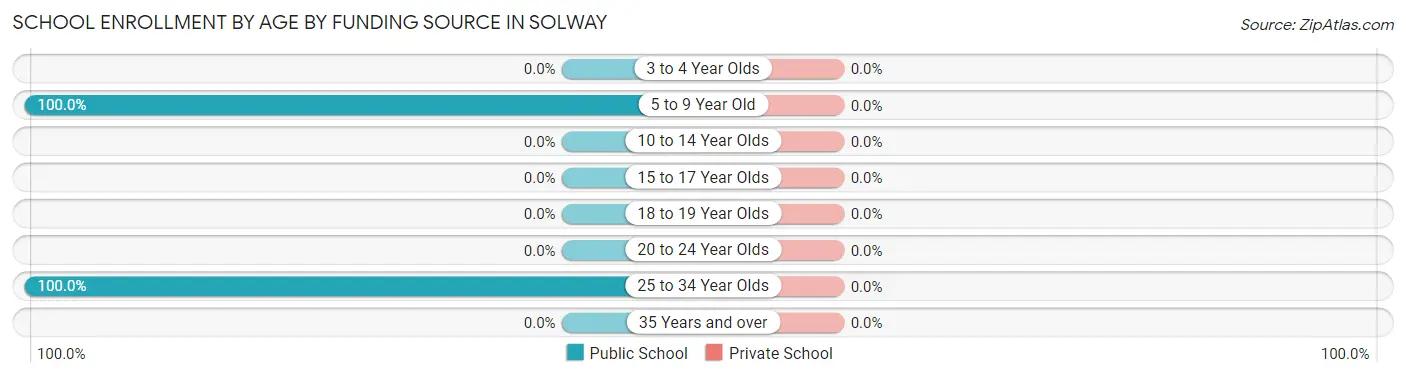
| Age Bracket | Public School | Private School |
| 3 to 4 Year Olds | 0 (0.0%) | 0 (0.0%) |
| 5 to 9 Year Old | 1 (100.0%) | 0 (0.0%) |
| 10 to 14 Year Olds | 0 (0.0%) | 0 (0.0%) |
| 15 to 17 Year Olds | 0 (0.0%) | 0 (0.0%) |
| 18 to 19 Year Olds | 0 (0.0%) | 0 (0.0%) |
| 20 to 24 Year Olds | 0 (0.0%) | 0 (0.0%) |
| 25 to 34 Year Olds | 17 (100.0%) | 0 (0.0%) |
| 35 Years and over | 0 (0.0%) | 0 (0.0%) |
| Total | 18 (100.0%) | 0 (0.0%) |
Educational Attainment by Field of Study in Solway
Science & technology (17 | 68.0%), education (4 | 16.0%), psychology (3 | 12.0%), and liberal arts & history (1 | 4.0%) are the most common fields of study among 25 individuals in Solway who have obtained a bachelor's degree or higher.
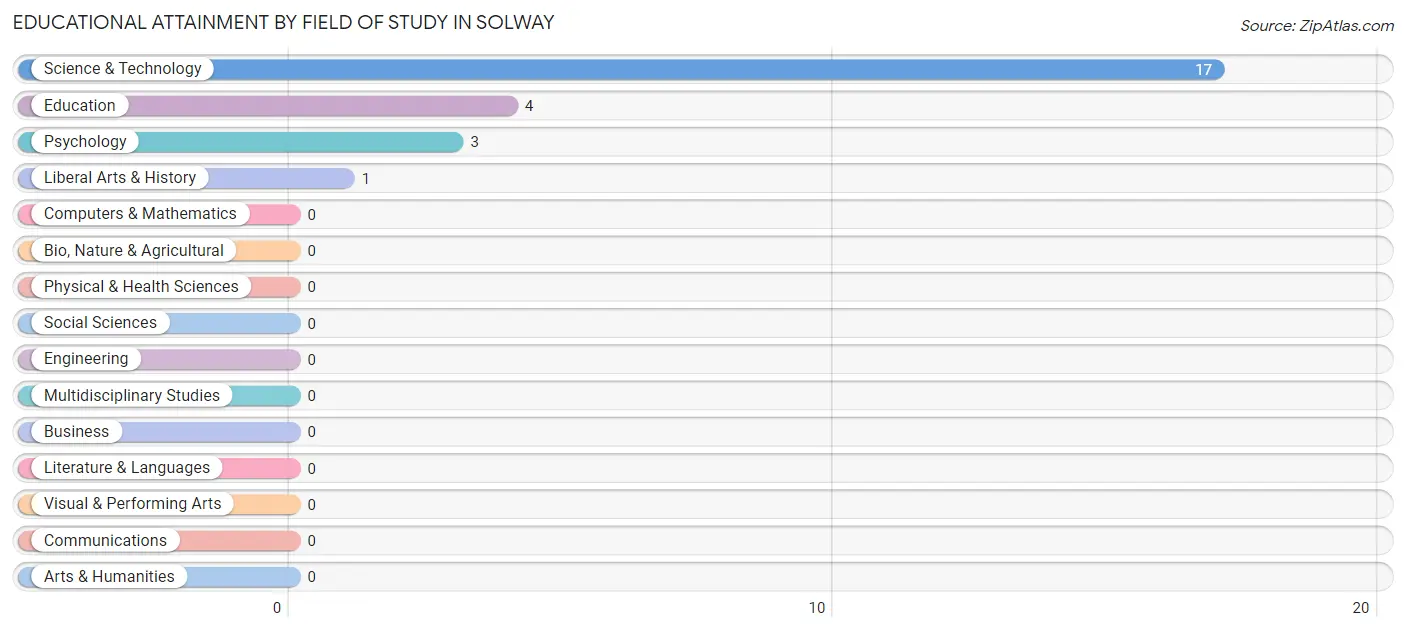
| Field of Study | # Graduates | % Graduates |
| Computers & Mathematics | 0 | 0.0% |
| Bio, Nature & Agricultural | 0 | 0.0% |
| Physical & Health Sciences | 0 | 0.0% |
| Psychology | 3 | 12.0% |
| Social Sciences | 0 | 0.0% |
| Engineering | 0 | 0.0% |
| Multidisciplinary Studies | 0 | 0.0% |
| Science & Technology | 17 | 68.0% |
| Business | 0 | 0.0% |
| Education | 4 | 16.0% |
| Literature & Languages | 0 | 0.0% |
| Liberal Arts & History | 1 | 4.0% |
| Visual & Performing Arts | 0 | 0.0% |
| Communications | 0 | 0.0% |
| Arts & Humanities | 0 | 0.0% |
| Total | 25 | 100.0% |
Transportation & Commute in Solway
Vehicle Availability by Sex in Solway
The most prevalent vehicle ownership categories in Solway are males with 4 vehicles (23, accounting for 69.7%) and females with 4 vehicles (0, making up 287.5%).
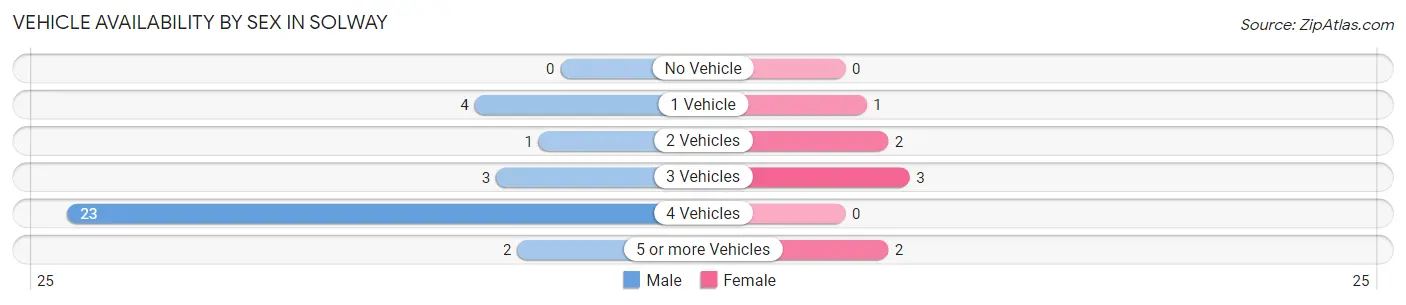
| Vehicles Available | Male | Female |
| No Vehicle | 0 (0.0%) | 0 (0.0%) |
| 1 Vehicle | 4 (12.1%) | 1 (12.5%) |
| 2 Vehicles | 1 (3.0%) | 2 (25.0%) |
| 3 Vehicles | 3 (9.1%) | 3 (37.5%) |
| 4 Vehicles | 23 (69.7%) | 0 (0.0%) |
| 5 or more Vehicles | 2 (6.1%) | 2 (25.0%) |
| Total | 33 (100.0%) | 8 (100.0%) |
Commute Time in Solway
The most frequently occuring commute durations in Solway are 15 to 19 minutes (24 commuters, 58.5%), 10 to 14 minutes (7 commuters, 17.1%), and 5 to 9 minutes (4 commuters, 9.8%).
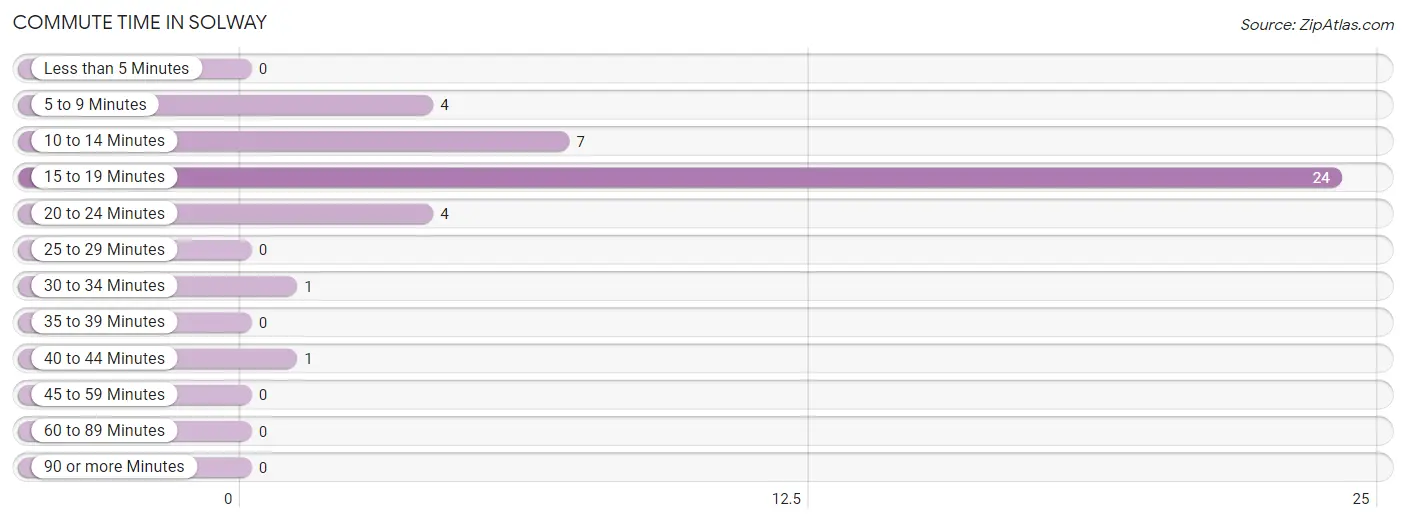
| Commute Time | # Commuters | % Commuters |
| Less than 5 Minutes | 0 | 0.0% |
| 5 to 9 Minutes | 4 | 9.8% |
| 10 to 14 Minutes | 7 | 17.1% |
| 15 to 19 Minutes | 24 | 58.5% |
| 20 to 24 Minutes | 4 | 9.8% |
| 25 to 29 Minutes | 0 | 0.0% |
| 30 to 34 Minutes | 1 | 2.4% |
| 35 to 39 Minutes | 0 | 0.0% |
| 40 to 44 Minutes | 1 | 2.4% |
| 45 to 59 Minutes | 0 | 0.0% |
| 60 to 89 Minutes | 0 | 0.0% |
| 90 or more Minutes | 0 | 0.0% |
Commute Time by Sex in Solway
The most common commute times in Solway are 15 to 19 minutes (21 commuters, 63.6%) for males and 15 to 19 minutes (3 commuters, 37.5%) for females.
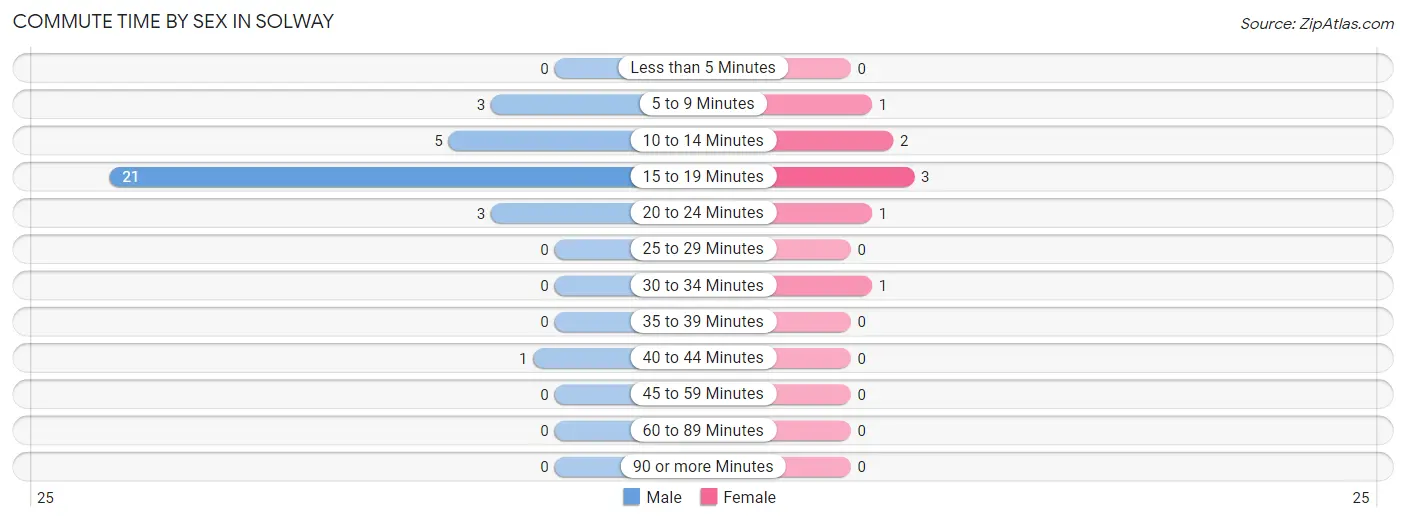
| Commute Time | Male | Female |
| Less than 5 Minutes | 0 (0.0%) | 0 (0.0%) |
| 5 to 9 Minutes | 3 (9.1%) | 1 (12.5%) |
| 10 to 14 Minutes | 5 (15.1%) | 2 (25.0%) |
| 15 to 19 Minutes | 21 (63.6%) | 3 (37.5%) |
| 20 to 24 Minutes | 3 (9.1%) | 1 (12.5%) |
| 25 to 29 Minutes | 0 (0.0%) | 0 (0.0%) |
| 30 to 34 Minutes | 0 (0.0%) | 1 (12.5%) |
| 35 to 39 Minutes | 0 (0.0%) | 0 (0.0%) |
| 40 to 44 Minutes | 1 (3.0%) | 0 (0.0%) |
| 45 to 59 Minutes | 0 (0.0%) | 0 (0.0%) |
| 60 to 89 Minutes | 0 (0.0%) | 0 (0.0%) |
| 90 or more Minutes | 0 (0.0%) | 0 (0.0%) |
Time of Departure to Work by Sex in Solway
The most frequent times of departure to work in Solway are 6:00 AM to 6:29 AM (23, 69.7%) for males and 7:30 AM to 7:59 AM (5, 62.5%) for females.
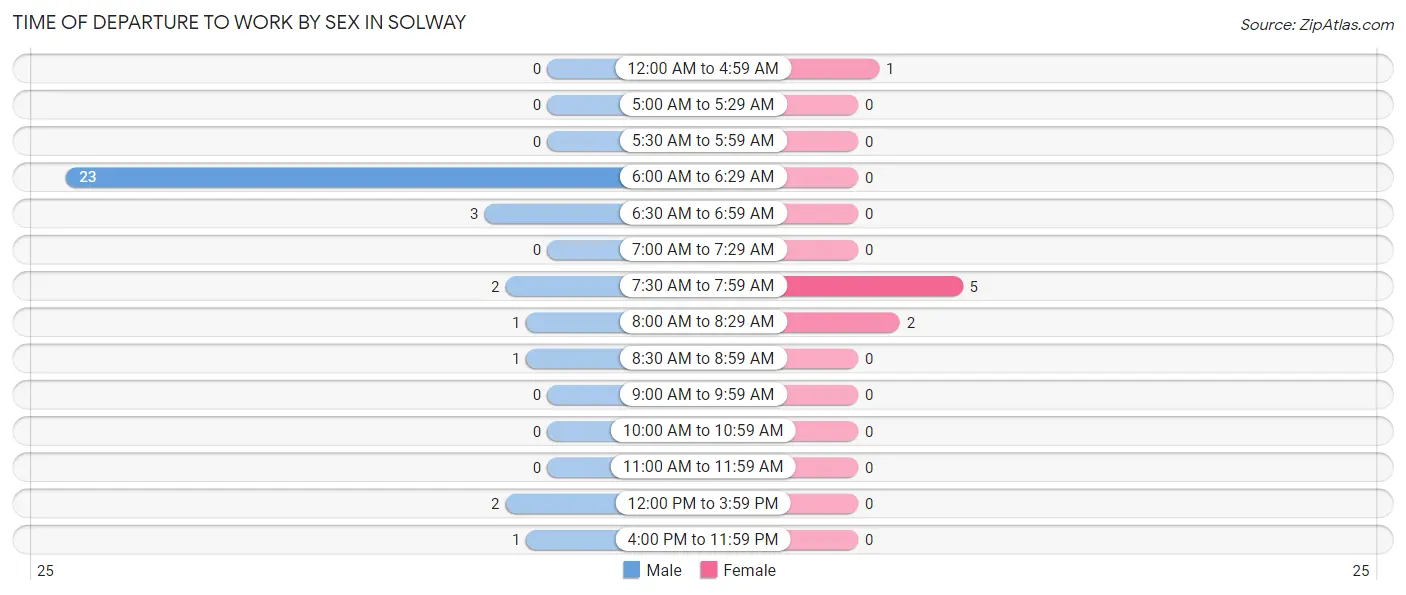
| Time of Departure | Male | Female |
| 12:00 AM to 4:59 AM | 0 (0.0%) | 1 (12.5%) |
| 5:00 AM to 5:29 AM | 0 (0.0%) | 0 (0.0%) |
| 5:30 AM to 5:59 AM | 0 (0.0%) | 0 (0.0%) |
| 6:00 AM to 6:29 AM | 23 (69.7%) | 0 (0.0%) |
| 6:30 AM to 6:59 AM | 3 (9.1%) | 0 (0.0%) |
| 7:00 AM to 7:29 AM | 0 (0.0%) | 0 (0.0%) |
| 7:30 AM to 7:59 AM | 2 (6.1%) | 5 (62.5%) |
| 8:00 AM to 8:29 AM | 1 (3.0%) | 2 (25.0%) |
| 8:30 AM to 8:59 AM | 1 (3.0%) | 0 (0.0%) |
| 9:00 AM to 9:59 AM | 0 (0.0%) | 0 (0.0%) |
| 10:00 AM to 10:59 AM | 0 (0.0%) | 0 (0.0%) |
| 11:00 AM to 11:59 AM | 0 (0.0%) | 0 (0.0%) |
| 12:00 PM to 3:59 PM | 2 (6.1%) | 0 (0.0%) |
| 4:00 PM to 11:59 PM | 1 (3.0%) | 0 (0.0%) |
| Total | 33 (100.0%) | 8 (100.0%) |
Housing Occupancy in Solway
Occupancy by Ownership in Solway
Of the total 41 dwellings in Solway, owner-occupied units account for 38 (92.7%), while renter-occupied units make up 3 (7.3%).
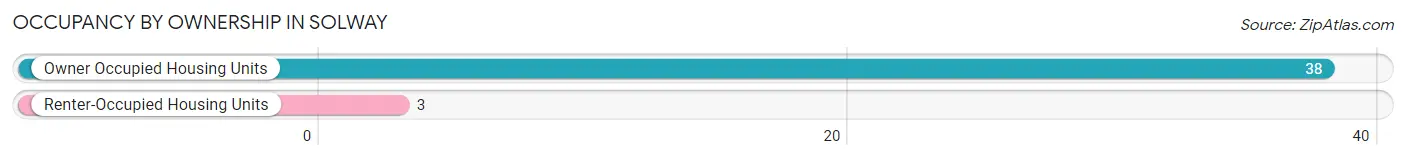
| Occupancy | # Housing Units | % Housing Units |
| Owner Occupied Housing Units | 38 | 92.7% |
| Renter-Occupied Housing Units | 3 | 7.3% |
| Total Occupied Housing Units | 41 | 100.0% |
Occupancy by Household Size in Solway
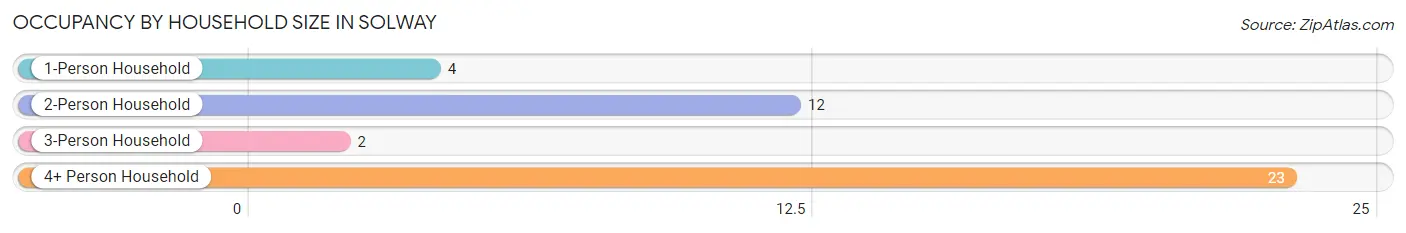
| Household Size | # Housing Units | % Housing Units |
| 1-Person Household | 4 | 9.8% |
| 2-Person Household | 12 | 29.3% |
| 3-Person Household | 2 | 4.9% |
| 4+ Person Household | 23 | 56.1% |
| Total Housing Units | 41 | 100.0% |
Occupancy by Ownership by Household Size in Solway
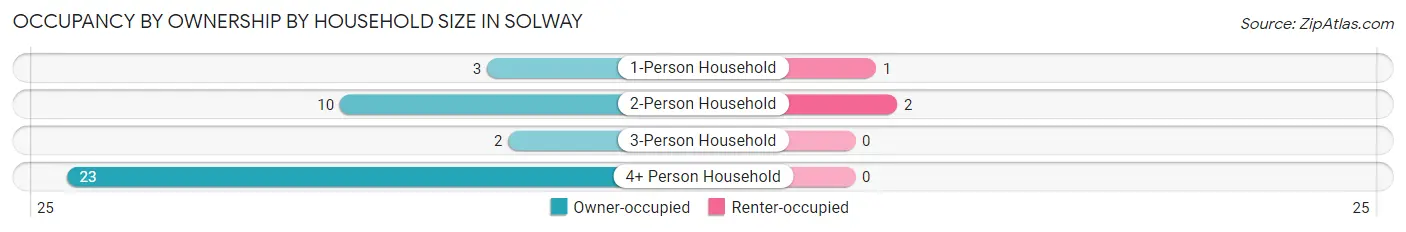
| Household Size | Owner-occupied | Renter-occupied |
| 1-Person Household | 3 (75.0%) | 1 (25.0%) |
| 2-Person Household | 10 (83.3%) | 2 (16.7%) |
| 3-Person Household | 2 (100.0%) | 0 (0.0%) |
| 4+ Person Household | 23 (100.0%) | 0 (0.0%) |
| Total Housing Units | 38 (92.7%) | 3 (7.3%) |
Occupancy by Educational Attainment in Solway
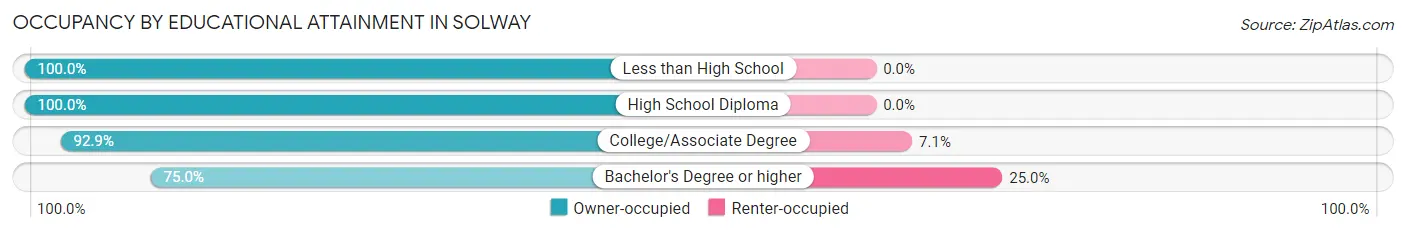
| Household Size | Owner-occupied | Renter-occupied |
| Less than High School | 2 (100.0%) | 0 (0.0%) |
| High School Diploma | 7 (100.0%) | 0 (0.0%) |
| College/Associate Degree | 26 (92.9%) | 2 (7.1%) |
| Bachelor's Degree or higher | 3 (75.0%) | 1 (25.0%) |
Occupancy by Age of Householder in Solway
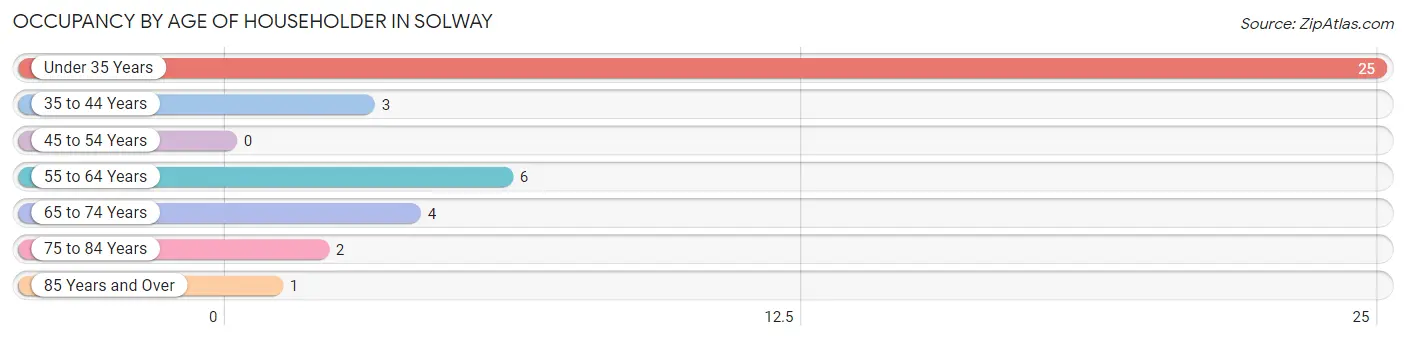
| Age Bracket | # Households | % Households |
| Under 35 Years | 25 | 61.0% |
| 35 to 44 Years | 3 | 7.3% |
| 45 to 54 Years | 0 | 0.0% |
| 55 to 64 Years | 6 | 14.6% |
| 65 to 74 Years | 4 | 9.8% |
| 75 to 84 Years | 2 | 4.9% |
| 85 Years and Over | 1 | 2.4% |
| Total | 41 | 100.0% |
Housing Finances in Solway
Median Income by Occupancy in Solway
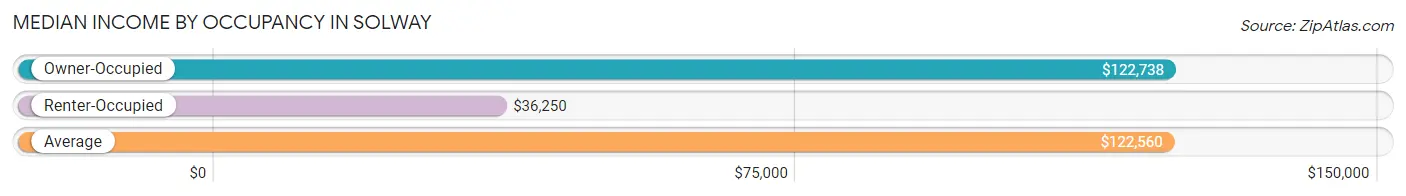
| Occupancy Type | # Households | Median Income |
| Owner-Occupied | 38 (92.7%) | $122,738 |
| Renter-Occupied | 3 (7.3%) | $36,250 |
| Average | 41 (100.0%) | $122,560 |
Occupancy by Householder Income Bracket in Solway
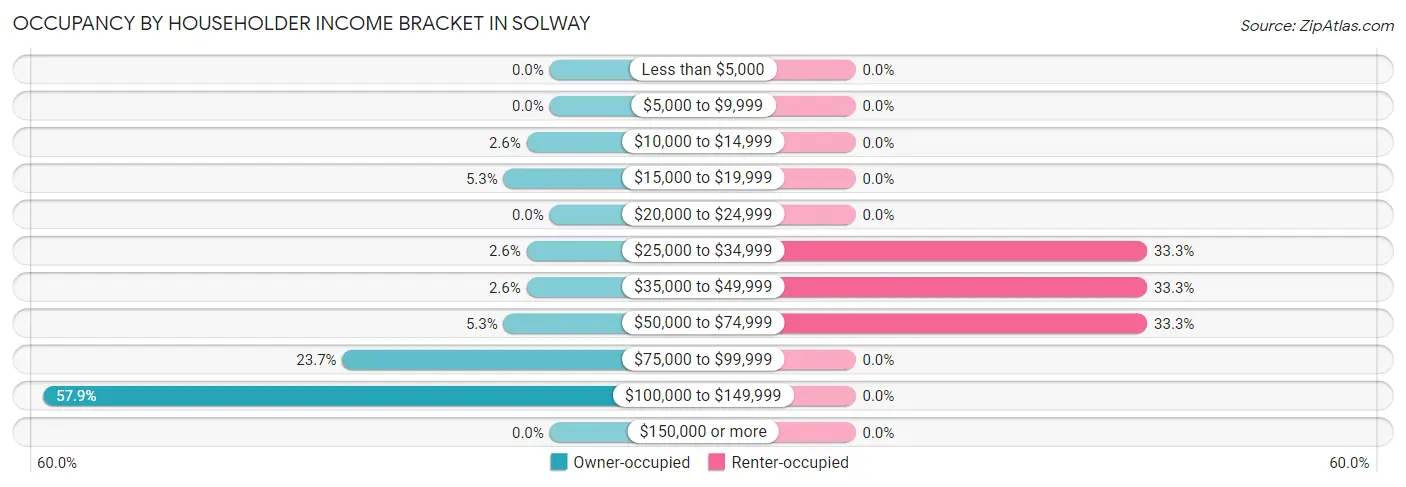
| Income Bracket | Owner-occupied | Renter-occupied |
| Less than $5,000 | 0 (0.0%) | 0 (0.0%) |
| $5,000 to $9,999 | 0 (0.0%) | 0 (0.0%) |
| $10,000 to $14,999 | 1 (2.6%) | 0 (0.0%) |
| $15,000 to $19,999 | 2 (5.3%) | 0 (0.0%) |
| $20,000 to $24,999 | 0 (0.0%) | 0 (0.0%) |
| $25,000 to $34,999 | 1 (2.6%) | 1 (33.3%) |
| $35,000 to $49,999 | 1 (2.6%) | 1 (33.3%) |
| $50,000 to $74,999 | 2 (5.3%) | 1 (33.3%) |
| $75,000 to $99,999 | 9 (23.7%) | 0 (0.0%) |
| $100,000 to $149,999 | 22 (57.9%) | 0 (0.0%) |
| $150,000 or more | 0 (0.0%) | 0 (0.0%) |
| Total | 38 (100.0%) | 3 (100.0%) |
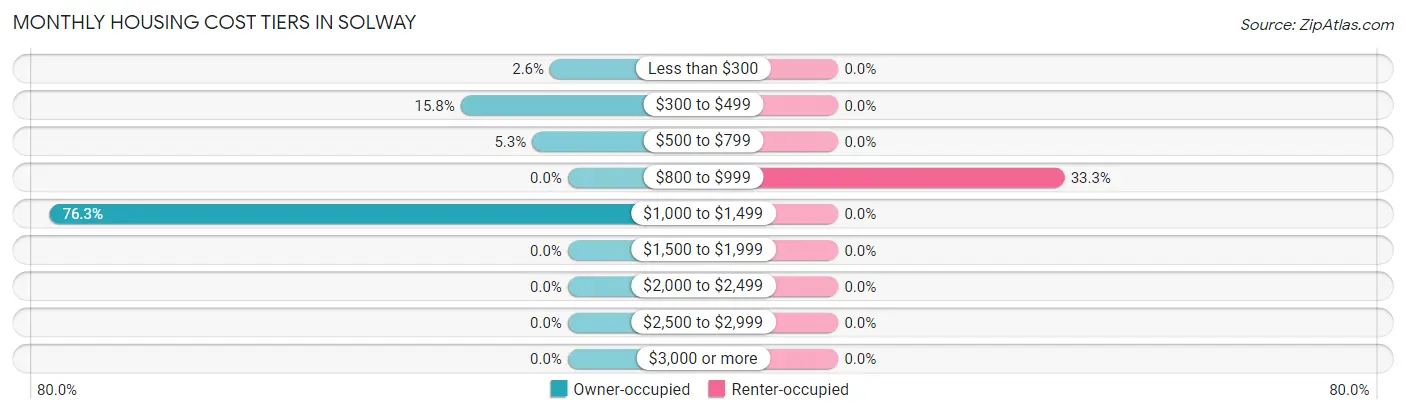
Monthly Housing Cost Tiers in Solway
| Monthly Cost | Owner-occupied | Renter-occupied |
| Less than $300 | 1 (2.6%) | 0 (0.0%) |
| $300 to $499 | 6 (15.8%) | 0 (0.0%) |
| $500 to $799 | 2 (5.3%) | 0 (0.0%) |
| $800 to $999 | 0 (0.0%) | 1 (33.3%) |
| $1,000 to $1,499 | 29 (76.3%) | 0 (0.0%) |
| $1,500 to $1,999 | 0 (0.0%) | 0 (0.0%) |
| $2,000 to $2,499 | 0 (0.0%) | 0 (0.0%) |
| $2,500 to $2,999 | 0 (0.0%) | 0 (0.0%) |
| $3,000 or more | 0 (0.0%) | 0 (0.0%) |
| Total | 38 (100.0%) | 3 (100.0%) |
Physical Housing Characteristics in Solway
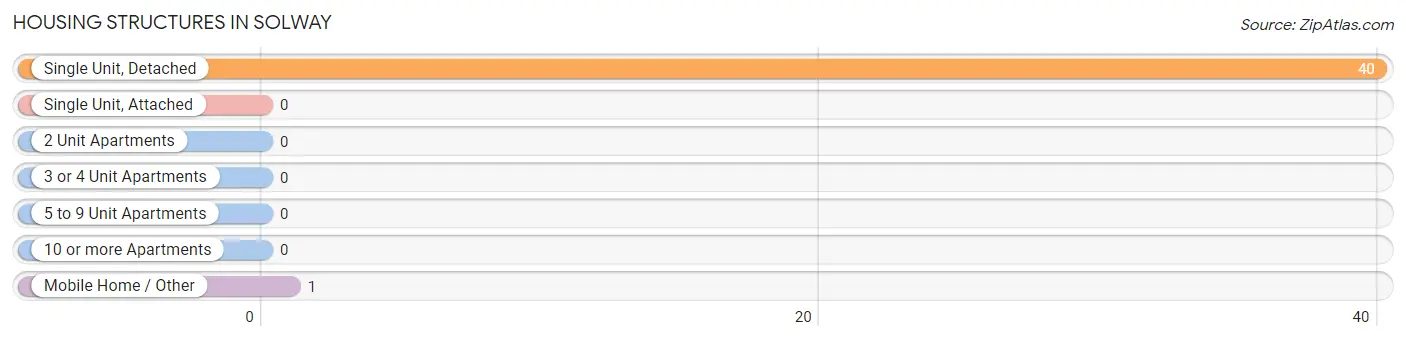
Housing Structures in Solway
| Structure Type | # Housing Units | % Housing Units |
| Single Unit, Detached | 40 | 97.6% |
| Single Unit, Attached | 0 | 0.0% |
| 2 Unit Apartments | 0 | 0.0% |
| 3 or 4 Unit Apartments | 0 | 0.0% |
| 5 to 9 Unit Apartments | 0 | 0.0% |
| 10 or more Apartments | 0 | 0.0% |
| Mobile Home / Other | 1 | 2.4% |
| Total | 41 | 100.0% |
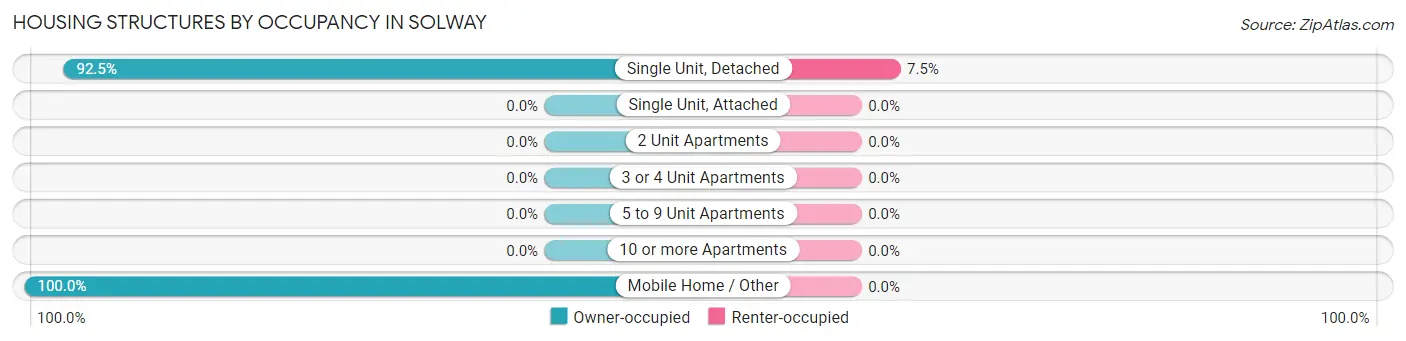
Housing Structures by Occupancy in Solway
| Structure Type | Owner-occupied | Renter-occupied |
| Single Unit, Detached | 37 (92.5%) | 3 (7.5%) |
| Single Unit, Attached | 0 (0.0%) | 0 (0.0%) |
| 2 Unit Apartments | 0 (0.0%) | 0 (0.0%) |
| 3 or 4 Unit Apartments | 0 (0.0%) | 0 (0.0%) |
| 5 to 9 Unit Apartments | 0 (0.0%) | 0 (0.0%) |
| 10 or more Apartments | 0 (0.0%) | 0 (0.0%) |
| Mobile Home / Other | 1 (100.0%) | 0 (0.0%) |
| Total | 38 (92.7%) | 3 (7.3%) |
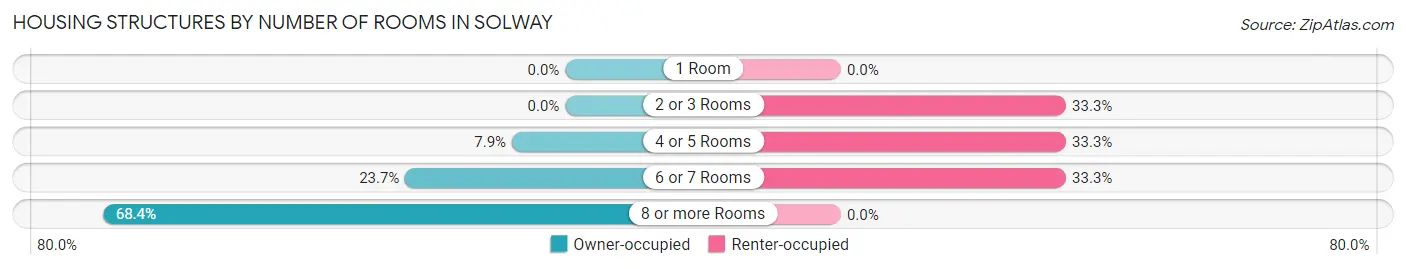
Housing Structures by Number of Rooms in Solway
| Number of Rooms | Owner-occupied | Renter-occupied |
| 1 Room | 0 (0.0%) | 0 (0.0%) |
| 2 or 3 Rooms | 0 (0.0%) | 1 (33.3%) |
| 4 or 5 Rooms | 3 (7.9%) | 1 (33.3%) |
| 6 or 7 Rooms | 9 (23.7%) | 1 (33.3%) |
| 8 or more Rooms | 26 (68.4%) | 0 (0.0%) |
| Total | 38 (100.0%) | 3 (100.0%) |
Housing Structure by Heating Type in Solway
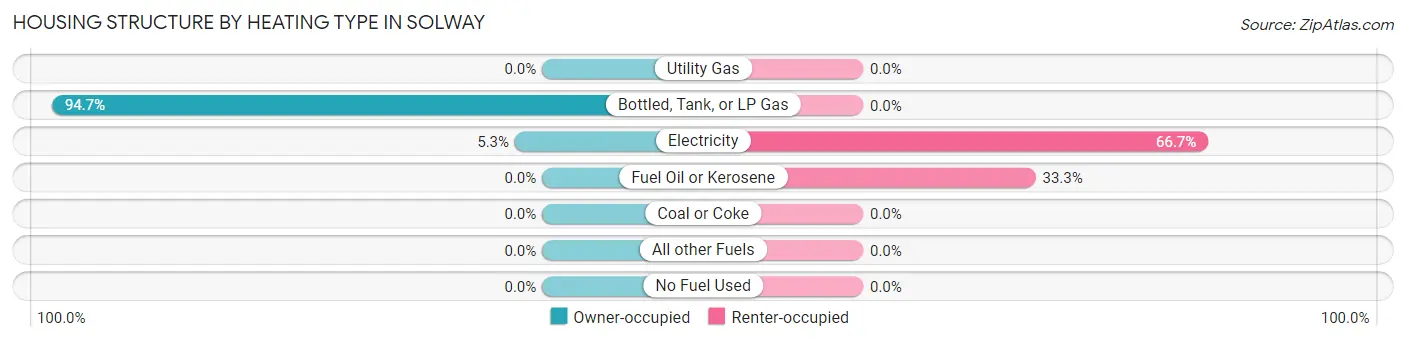
| Heating Type | Owner-occupied | Renter-occupied |
| Utility Gas | 0 (0.0%) | 0 (0.0%) |
| Bottled, Tank, or LP Gas | 36 (94.7%) | 0 (0.0%) |
| Electricity | 2 (5.3%) | 2 (66.7%) |
| Fuel Oil or Kerosene | 0 (0.0%) | 1 (33.3%) |
| Coal or Coke | 0 (0.0%) | 0 (0.0%) |
| All other Fuels | 0 (0.0%) | 0 (0.0%) |
| No Fuel Used | 0 (0.0%) | 0 (0.0%) |
| Total | 38 (100.0%) | 3 (100.0%) |
Household Vehicle Usage in Solway
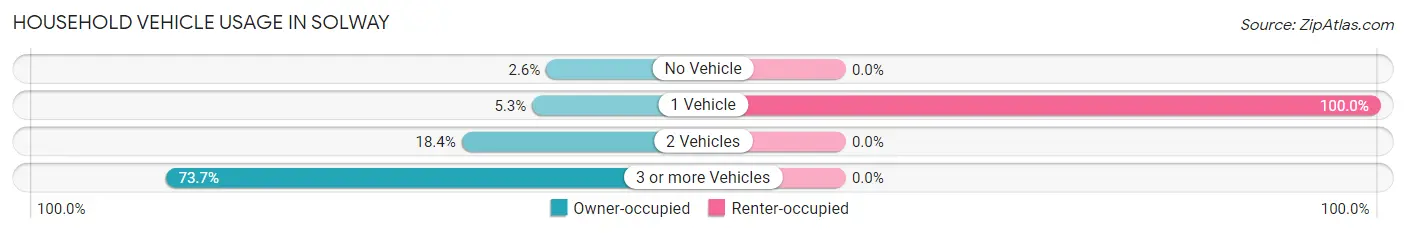
| Vehicles per Household | Owner-occupied | Renter-occupied |
| No Vehicle | 1 (2.6%) | 0 (0.0%) |
| 1 Vehicle | 2 (5.3%) | 3 (100.0%) |
| 2 Vehicles | 7 (18.4%) | 0 (0.0%) |
| 3 or more Vehicles | 28 (73.7%) | 0 (0.0%) |
| Total | 38 (100.0%) | 3 (100.0%) |
Real Estate & Mortgages in Solway
Real Estate and Mortgage Overview in Solway
| Characteristic | Without Mortgage | With Mortgage |
| Housing Units | 5 | 33 |
| Median Property Value | - | - |
| Median Household Income | - | - |
| Monthly Housing Costs | $417 | $0 |
| Real Estate Taxes | $875 | $0 |
Property Value by Mortgage Status in Solway
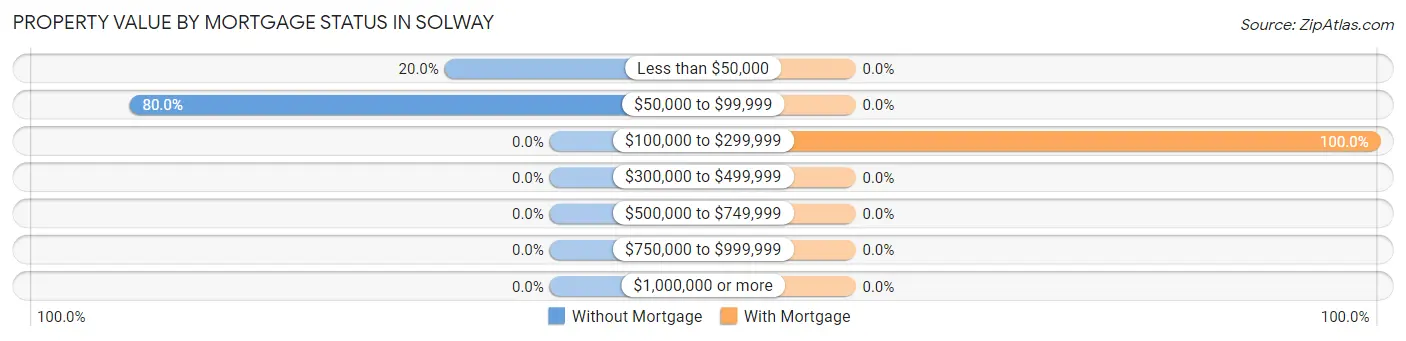
| Property Value | Without Mortgage | With Mortgage |
| Less than $50,000 | 1 (20.0%) | 0 (0.0%) |
| $50,000 to $99,999 | 4 (80.0%) | 0 (0.0%) |
| $100,000 to $299,999 | 0 (0.0%) | 33 (100.0%) |
| $300,000 to $499,999 | 0 (0.0%) | 0 (0.0%) |
| $500,000 to $749,999 | 0 (0.0%) | 0 (0.0%) |
| $750,000 to $999,999 | 0 (0.0%) | 0 (0.0%) |
| $1,000,000 or more | 0 (0.0%) | 0 (0.0%) |
| Total | 5 (100.0%) | 33 (100.0%) |
Household Income by Mortgage Status in Solway
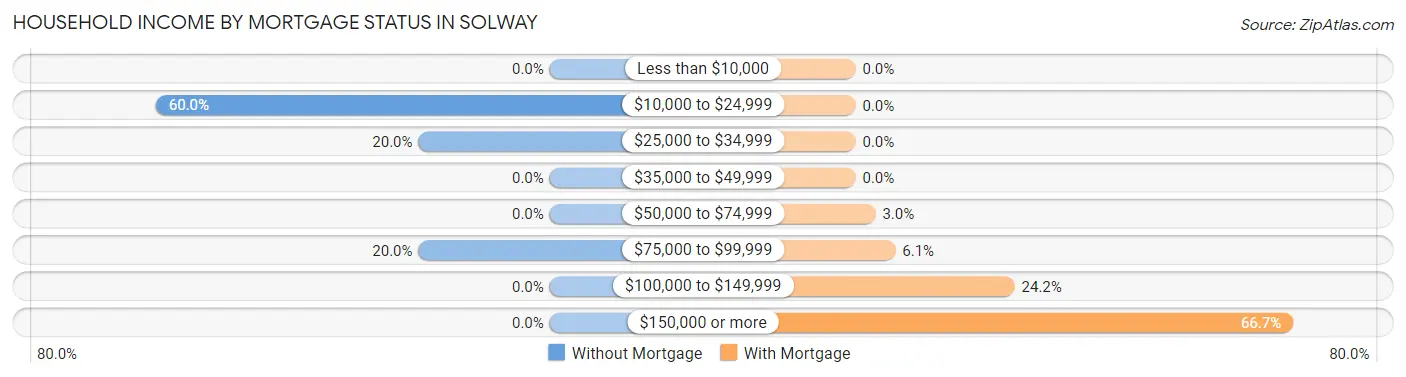
| Household Income | Without Mortgage | With Mortgage |
| Less than $10,000 | 0 (0.0%) | 0 (0.0%) |
| $10,000 to $24,999 | 3 (60.0%) | 0 (0.0%) |
| $25,000 to $34,999 | 1 (20.0%) | 0 (0.0%) |
| $35,000 to $49,999 | 0 (0.0%) | 0 (0.0%) |
| $50,000 to $74,999 | 0 (0.0%) | 1 (3.0%) |
| $75,000 to $99,999 | 1 (20.0%) | 2 (6.1%) |
| $100,000 to $149,999 | 0 (0.0%) | 8 (24.2%) |
| $150,000 or more | 0 (0.0%) | 22 (66.7%) |
| Total | 5 (100.0%) | 33 (100.0%) |
Property Value to Household Income Ratio in Solway
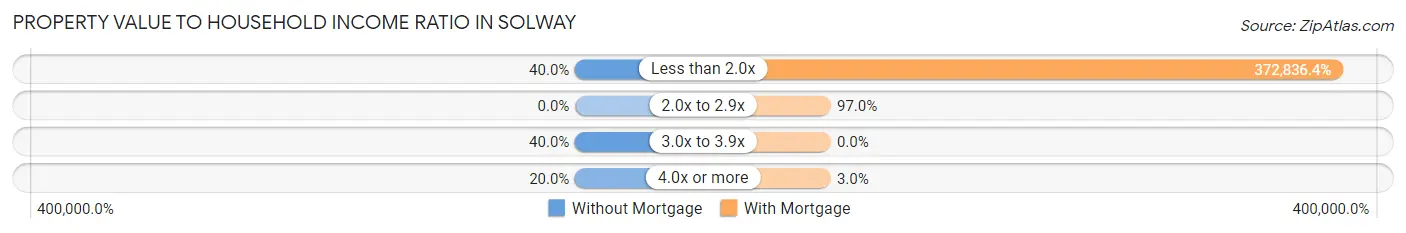
| Value-to-Income Ratio | Without Mortgage | With Mortgage |
| Less than 2.0x | 2 (40.0%) | 123,036 (372,836.4%) |
| 2.0x to 2.9x | 0 (0.0%) | 32 (97.0%) |
| 3.0x to 3.9x | 2 (40.0%) | 0 (0.0%) |
| 4.0x or more | 1 (20.0%) | 1 (3.0%) |
| Total | 5 (100.0%) | 33 (100.0%) |
Real Estate Taxes by Mortgage Status in Solway
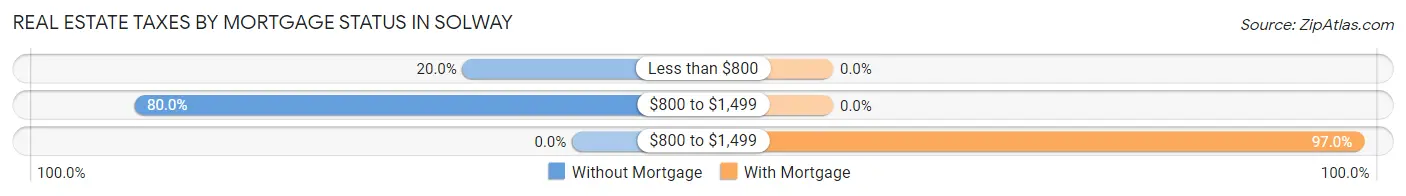
| Property Taxes | Without Mortgage | With Mortgage |
| Less than $800 | 1 (20.0%) | 0 (0.0%) |
| $800 to $1,499 | 4 (80.0%) | 0 (0.0%) |
| $800 to $1,499 | 0 (0.0%) | 32 (97.0%) |
| Total | 5 (100.0%) | 33 (100.0%) |
Health & Disability in Solway
Health Insurance Coverage by Age in Solway

| Age Bracket | With Coverage | Without Coverage |
| Under 6 Years | 5 (13.5%) | 32 (86.5%) |
| 6 to 18 Years | 0 (0.0%) | 1 (100.0%) |
| 19 to 25 Years | 23 (100.0%) | 0 (0.0%) |
| 26 to 34 Years | 5 (19.2%) | 21 (80.8%) |
| 35 to 44 Years | 3 (75.0%) | 1 (25.0%) |
| 45 to 54 Years | 2 (100.0%) | 0 (0.0%) |
| 55 to 64 Years | 8 (100.0%) | 0 (0.0%) |
| 65 to 74 Years | 8 (100.0%) | 0 (0.0%) |
| 75 Years and older | 5 (100.0%) | 0 (0.0%) |
| Total | 59 (51.7%) | 55 (48.2%) |
Health Insurance Coverage by Citizenship Status in Solway
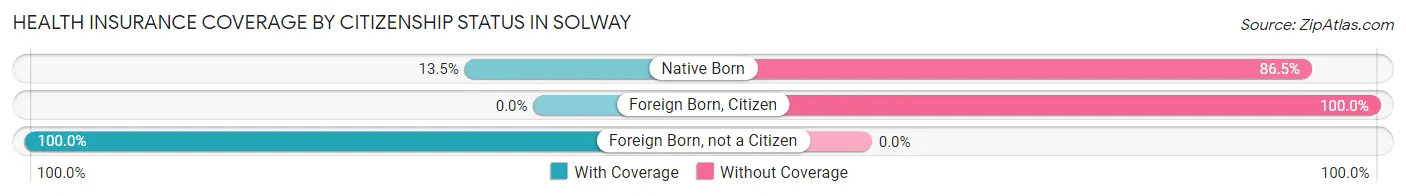
| Citizenship Status | With Coverage | Without Coverage |
| Native Born | 5 (13.5%) | 32 (86.5%) |
| Foreign Born, Citizen | 0 (0.0%) | 1 (100.0%) |
| Foreign Born, not a Citizen | 23 (100.0%) | 0 (0.0%) |
Health Insurance Coverage by Household Income in Solway
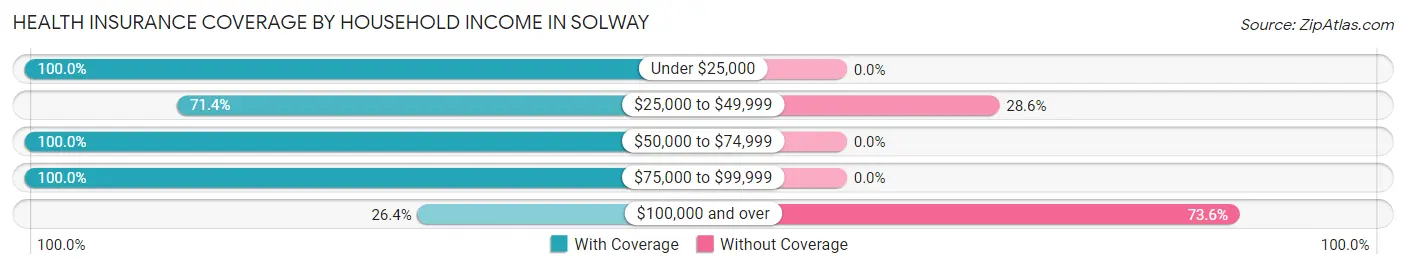
| Household Income | With Coverage | Without Coverage |
| Under $25,000 | 5 (100.0%) | 0 (0.0%) |
| $25,000 to $49,999 | 5 (71.4%) | 2 (28.6%) |
| $50,000 to $74,999 | 6 (100.0%) | 0 (0.0%) |
| $75,000 to $99,999 | 24 (100.0%) | 0 (0.0%) |
| $100,000 and over | 19 (26.4%) | 53 (73.6%) |
Public vs Private Health Insurance Coverage by Age in Solway
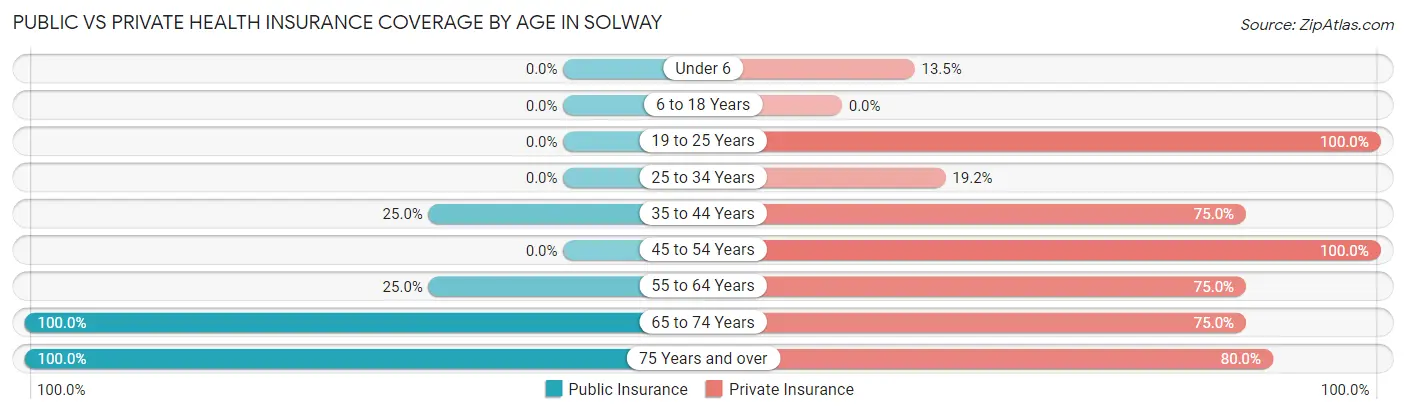
| Age Bracket | Public Insurance | Private Insurance |
| Under 6 | 0 (0.0%) | 5 (13.5%) |
| 6 to 18 Years | 0 (0.0%) | 0 (0.0%) |
| 19 to 25 Years | 0 (0.0%) | 23 (100.0%) |
| 25 to 34 Years | 0 (0.0%) | 5 (19.2%) |
| 35 to 44 Years | 1 (25.0%) | 3 (75.0%) |
| 45 to 54 Years | 0 (0.0%) | 2 (100.0%) |
| 55 to 64 Years | 2 (25.0%) | 6 (75.0%) |
| 65 to 74 Years | 8 (100.0%) | 6 (75.0%) |
| 75 Years and over | 5 (100.0%) | 4 (80.0%) |
| Total | 16 (14.0%) | 54 (47.4%) |
Disability Status by Sex by Age in Solway
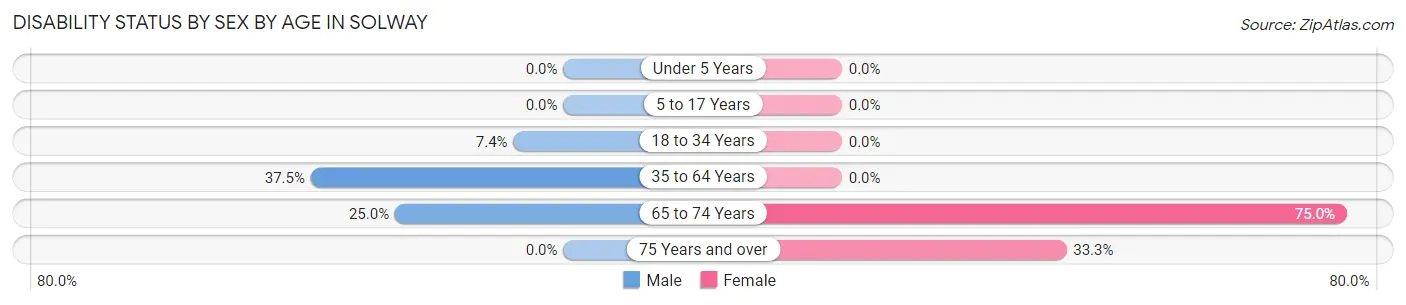
| Age Bracket | Male | Female |
| Under 5 Years | 0 (0.0%) | 0 (0.0%) |
| 5 to 17 Years | 0 (0.0%) | 0 (0.0%) |
| 18 to 34 Years | 2 (7.4%) | 0 (0.0%) |
| 35 to 64 Years | 3 (37.5%) | 0 (0.0%) |
| 65 to 74 Years | 1 (25.0%) | 3 (75.0%) |
| 75 Years and over | 0 (0.0%) | 1 (33.3%) |
Disability Class by Sex by Age in Solway
Disability Class: Hearing Difficulty
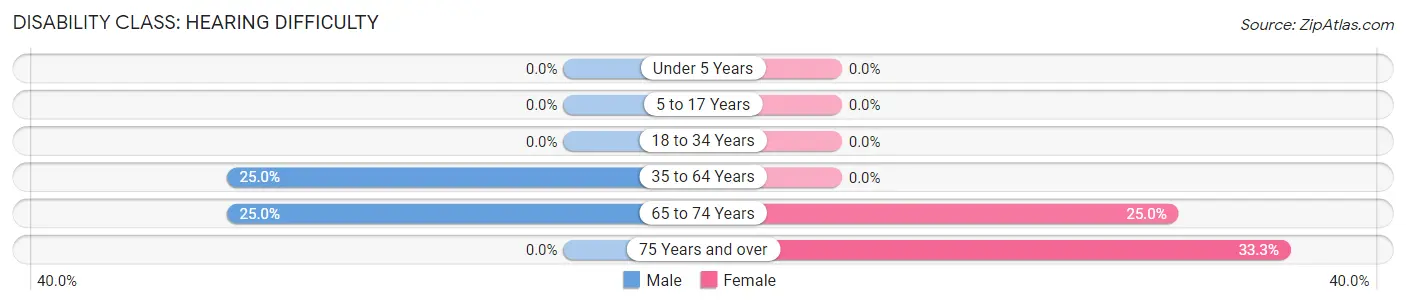
| Age Bracket | Male | Female |
| Under 5 Years | 0 (0.0%) | 0 (0.0%) |
| 5 to 17 Years | 0 (0.0%) | 0 (0.0%) |
| 18 to 34 Years | 0 (0.0%) | 0 (0.0%) |
| 35 to 64 Years | 2 (25.0%) | 0 (0.0%) |
| 65 to 74 Years | 1 (25.0%) | 1 (25.0%) |
| 75 Years and over | 0 (0.0%) | 1 (33.3%) |
Disability Class: Vision Difficulty
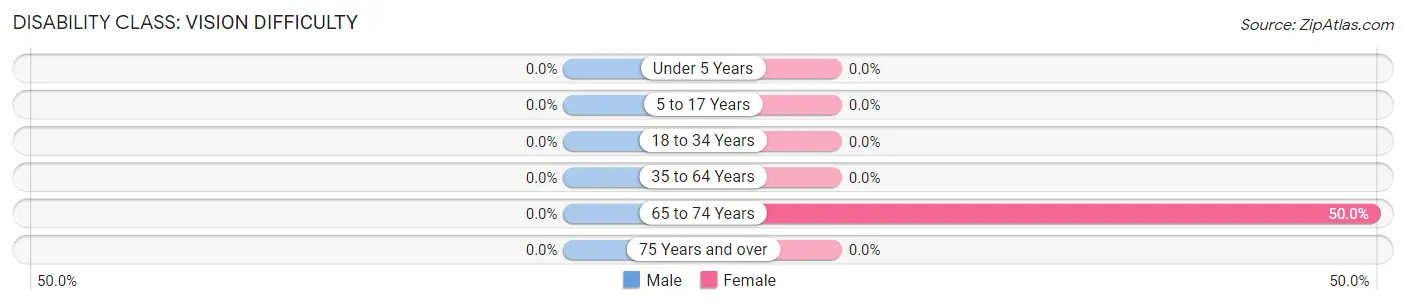
| Age Bracket | Male | Female |
| Under 5 Years | 0 (0.0%) | 0 (0.0%) |
| 5 to 17 Years | 0 (0.0%) | 0 (0.0%) |
| 18 to 34 Years | 0 (0.0%) | 0 (0.0%) |
| 35 to 64 Years | 0 (0.0%) | 0 (0.0%) |
| 65 to 74 Years | 0 (0.0%) | 2 (50.0%) |
| 75 Years and over | 0 (0.0%) | 0 (0.0%) |
Disability Class: Cognitive Difficulty
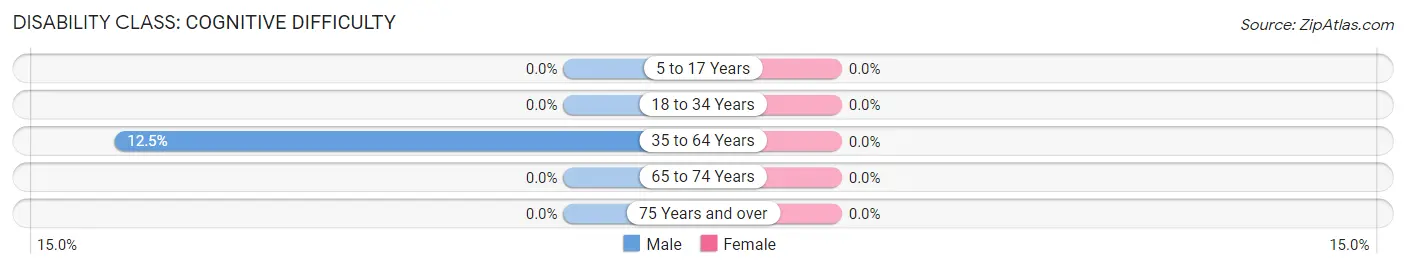
| Age Bracket | Male | Female |
| 5 to 17 Years | 0 (0.0%) | 0 (0.0%) |
| 18 to 34 Years | 0 (0.0%) | 0 (0.0%) |
| 35 to 64 Years | 1 (12.5%) | 0 (0.0%) |
| 65 to 74 Years | 0 (0.0%) | 0 (0.0%) |
| 75 Years and over | 0 (0.0%) | 0 (0.0%) |
Disability Class: Ambulatory Difficulty
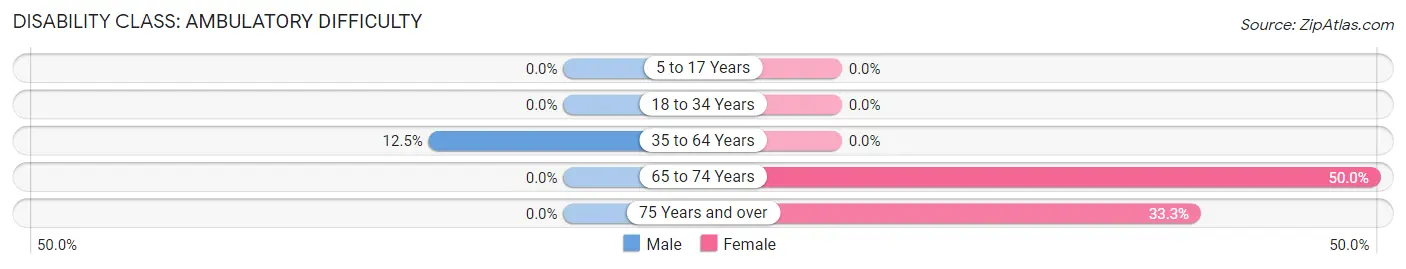
| Age Bracket | Male | Female |
| 5 to 17 Years | 0 (0.0%) | 0 (0.0%) |
| 18 to 34 Years | 0 (0.0%) | 0 (0.0%) |
| 35 to 64 Years | 1 (12.5%) | 0 (0.0%) |
| 65 to 74 Years | 0 (0.0%) | 2 (50.0%) |
| 75 Years and over | 0 (0.0%) | 1 (33.3%) |
Disability Class: Self-Care Difficulty
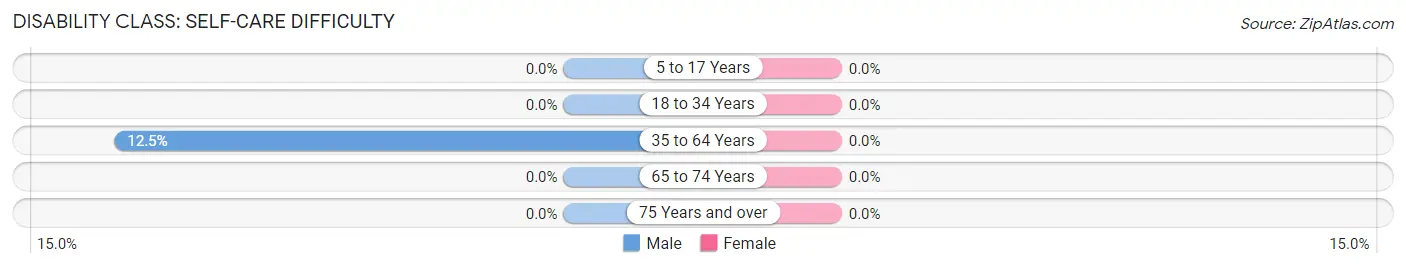
| Age Bracket | Male | Female |
| 5 to 17 Years | 0 (0.0%) | 0 (0.0%) |
| 18 to 34 Years | 0 (0.0%) | 0 (0.0%) |
| 35 to 64 Years | 1 (12.5%) | 0 (0.0%) |
| 65 to 74 Years | 0 (0.0%) | 0 (0.0%) |
| 75 Years and over | 0 (0.0%) | 0 (0.0%) |
Technology Access in Solway
Computing Device Access in Solway
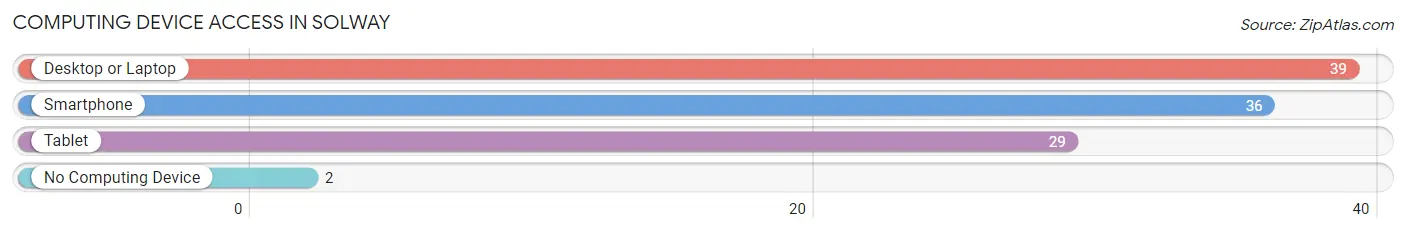
| Device Type | # Households | % Households |
| Desktop or Laptop | 39 | 95.1% |
| Smartphone | 36 | 87.8% |
| Tablet | 29 | 70.7% |
| No Computing Device | 2 | 4.9% |
| Total | 41 | 100.0% |
Internet Access in Solway
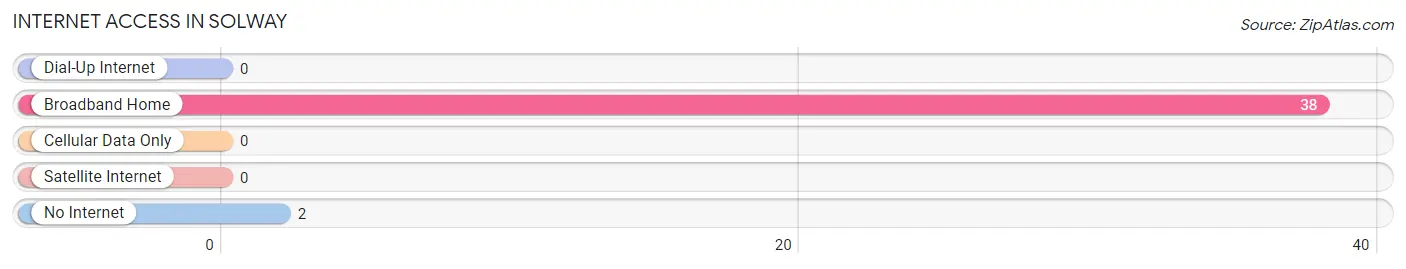
| Internet Type | # Households | % Households |
| Dial-Up Internet | 0 | 0.0% |
| Broadband Home | 38 | 92.7% |
| Cellular Data Only | 0 | 0.0% |
| Satellite Internet | 0 | 0.0% |
| No Internet | 2 | 4.9% |
| Total | 41 | 100.0% |
Solway Summary
Solway, Minnesota is a small unincorporated community located in St. Louis County, Minnesota. It is situated on the western shore of Lake Superior, approximately 20 miles northeast of Duluth. The population of Solway was estimated to be around 200 people in 2020.
History
Solway was first settled in the late 1800s by Finnish immigrants. The first settlers were attracted to the area due to its abundance of natural resources, including timber and fish. The town was originally named “Kivimaa”, which means “stone land” in Finnish. The name was changed to Solway in the early 1900s, after the nearby Solway Township.
The town was initially a logging and fishing community, but it soon developed into a small farming community. The first school in Solway was built in 1902, and the first church was built in 1906. The town also had a post office, a general store, and a blacksmith shop.
In the early 1900s, the town was home to a number of Finnish-American businesses, including a sawmill, a creamery, and a cheese factory. The town also had a number of small businesses, such as a bakery, a barber shop, and a tailor shop.
Geography
Solway is located in St. Louis County, Minnesota, on the western shore of Lake Superior. The town is situated on the north side of the lake, approximately 20 miles northeast of Duluth. The town is surrounded by the Superior National Forest, which provides a variety of recreational activities, including hiking, camping, and fishing.
The town is located in a rural area, and the nearest major city is Duluth. The town is accessible by car via Highway 61, which runs along the western shore of Lake Superior.
Economy
Solway’s economy is largely based on tourism and recreation. The town is home to a number of small businesses, including a general store, a barber shop, and a tailor shop. The town also has a number of restaurants, including a pizza parlor and a diner.
The town is also home to a number of recreational activities, including fishing, camping, and hiking. The nearby Superior National Forest provides a variety of outdoor activities, including hunting, snowmobiling, and cross-country skiing.
Demographics
As of the 2020 census, the population of Solway was estimated to be around 200 people. The town is predominantly white, with a small percentage of African American and Native American residents. The median household income in Solway is $45,000, and the median home value is $150,000.
The town is served by the St. Louis County School District, which includes two elementary schools and one high school. The town also has a public library and a community center.
Conclusion
Solway, Minnesota is a small unincorporated community located in St. Louis County, Minnesota. It is situated on the western shore of Lake Superior, approximately 20 miles northeast of Duluth. The town was first settled in the late 1800s by Finnish immigrants, and it has since developed into a small farming community. The town’s economy is largely based on tourism and recreation, and it is home to a number of small businesses. The population of Solway was estimated to be around 200 people in 2020.
Common Questions
What is the Total Population of Solway?
Total Population of Solway is 114.
What is the Total Male Population of Solway?
Total Male Population of Solway is 76.
What is the Total Female Population of Solway?
Total Female Population of Solway is 38.
What is the Ratio of Males per 100 Females in Solway?
There are 200.00 Males per 100 Females in Solway.
What is the Ratio of Females per 100 Males in Solway?
There are 50.00 Females per 100 Males in Solway.
What is the Median Population Age in Solway?
Median Population Age in Solway is 25.8 Years.
What is the Average Family Size in Solway
Average Family Size in Solway is 3.0 People.
What is the Average Household Size in Solway
Average Household Size in Solway is 2.8 People.
What is Per Capita Income in Solway?
Per Capita income in Solway is $31,888.
What is the Median Family Income in Solway?
Median Family Income in Solway is $122,917.
What is the Median Household income in Solway?
Median Household Income in Solway is $122,560.
What is Income or Wage Gap in Solway?
Income or Wage Gap in Solway is 27.3%.
Women in Solway earn 72.7 cents for every dollar earned by a man.
What is Inequality or Gini Index in Solway?
Inequality or Gini Index in Solway is 0.20.
How Large is the Labor Force in Solway?
There are 58 People in the Labor Forcein in Solway.
What is the Percentage of People in the Labor Force in Solway?
76.3% of People are in the Labor Force in Solway.