Delhi, MN
Delhi Map
Delhi Overview
38
TOTAL POPULATION
26
MALE POPULATION
12
FEMALE POPULATION
216.67
MALES / 100 FEMALES
46.15
FEMALES / 100 MALES
57.4
MEDIAN AGE
2.3
AVG FAMILY SIZE
1.7
AVG HOUSEHOLD SIZE
$52,905
PER CAPITA INCOME
$65,000
AVG HOUSEHOLD INCOME
67.3%
WAGE / INCOME GAP [ % ]
32.7¢/ $1
WAGE / INCOME GAP [ $ ]
0.43
INEQUALITY / GINI INDEX
25
LABOR FORCE [ PEOPLE ]
65.8%
PERCENT IN LABOR FORCE
4.0%
UNEMPLOYMENT RATE
Delhi Area Codes
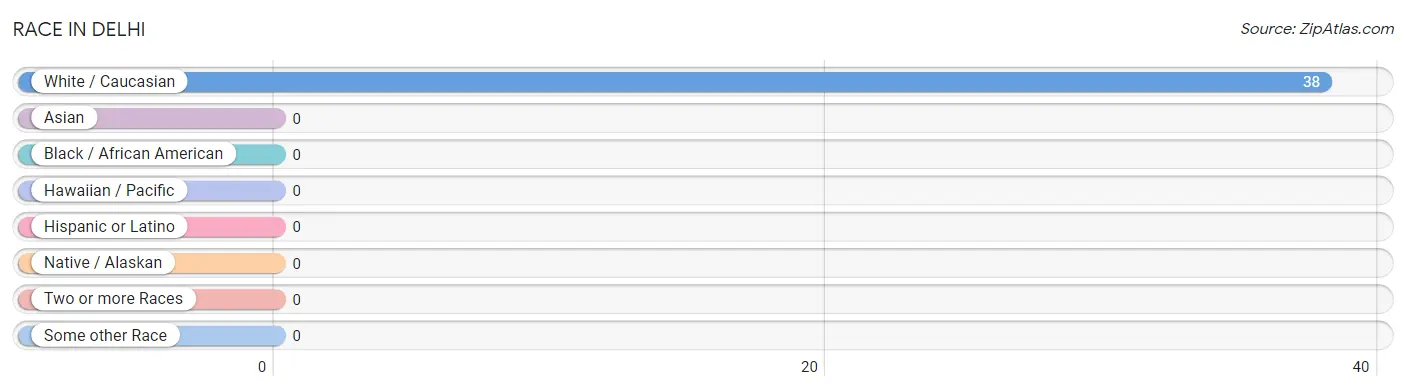
Race in Delhi
The most populous races in Delhi are , and White / Caucasian (38 | 100.0%).
| Race | # Population | % Population |
| Asian | 0 | 0.0% |
| Black / African American | 0 | 0.0% |
| Hawaiian / Pacific | 0 | 0.0% |
| Hispanic or Latino | 0 | 0.0% |
| Native / Alaskan | 0 | 0.0% |
| White / Caucasian | 38 | 100.0% |
| Two or more Races | 0 | 0.0% |
| Some other Race | 0 | 0.0% |
| Total | 38 | 100.0% |
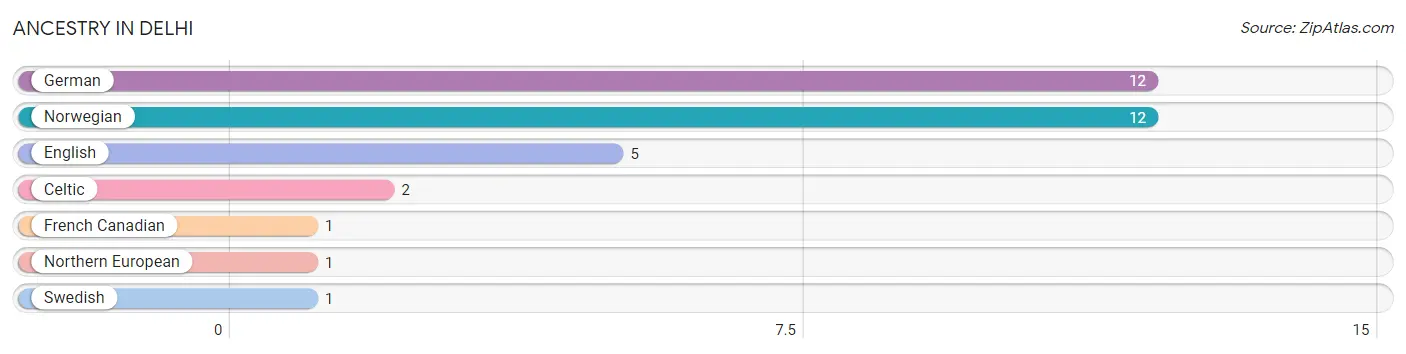
Ancestry in Delhi
The most populous ancestries reported in Delhi are German (12 | 31.6%), Norwegian (12 | 31.6%), English (5 | 13.2%), Celtic (2 | 5.3%), and French Canadian (1 | 2.6%), together accounting for 84.2% of all Delhi residents.
| Ancestry | # Population | % Population |
| Celtic | 2 | 5.3% |
| English | 5 | 13.2% |
| French Canadian | 1 | 2.6% |
| German | 12 | 31.6% |
| Northern European | 1 | 2.6% |
| Norwegian | 12 | 31.6% |
| Swedish | 1 | 2.6% | View All 7 Rows |
Immigrants in Delhi
The most numerous immigrant groups reported in Delhi came from , and Canada (1 | 2.6%), together accounting for 2.6% of all Delhi residents.

| Immigration Origin | # Population | % Population |
| Canada | 1 | 2.6% | View All 1 Rows |
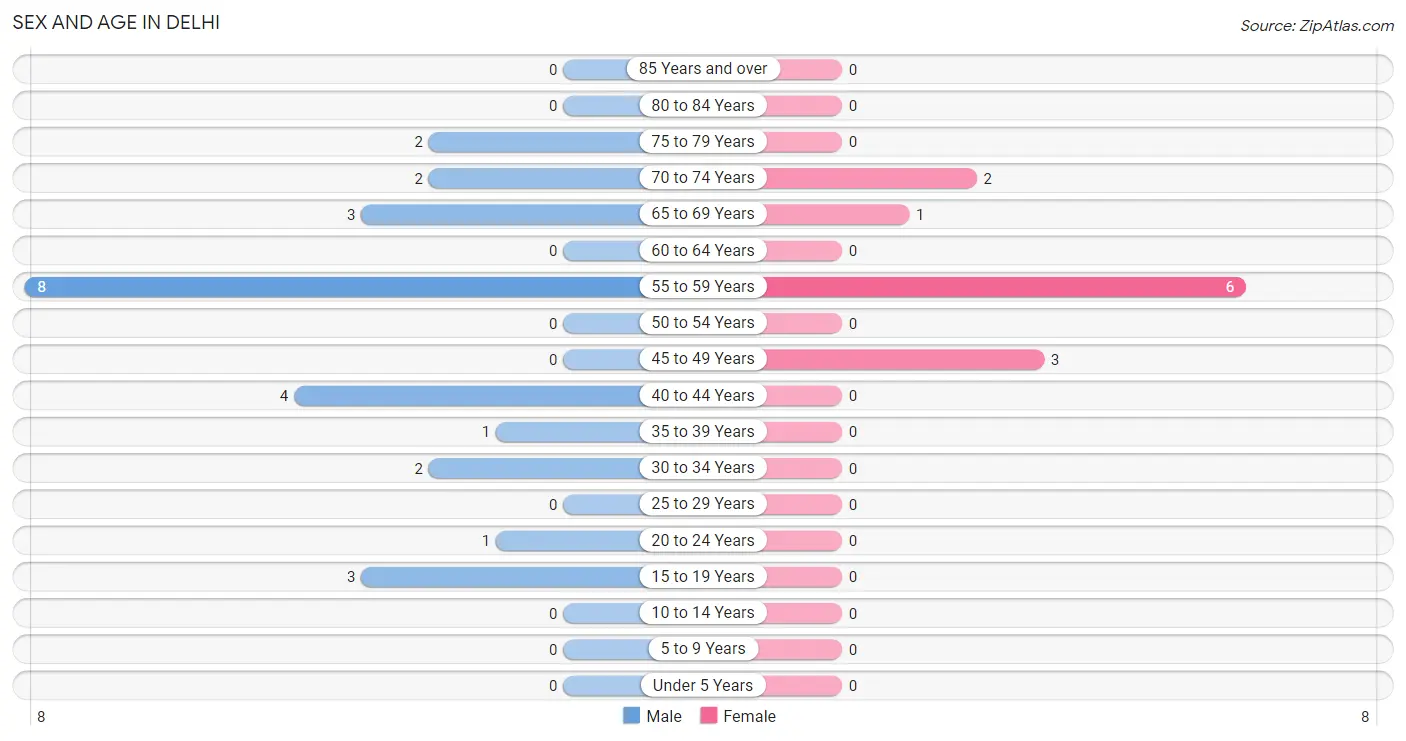
Sex and Age in Delhi
Sex and Age in Delhi
The most populous age groups in Delhi are 55 to 59 Years (8 | 30.8%) for men and 55 to 59 Years (6 | 50.0%) for women.
| Age Bracket | Male | Female |
| Under 5 Years | 0 (0.0%) | 0 (0.0%) |
| 5 to 9 Years | 0 (0.0%) | 0 (0.0%) |
| 10 to 14 Years | 0 (0.0%) | 0 (0.0%) |
| 15 to 19 Years | 3 (11.5%) | 0 (0.0%) |
| 20 to 24 Years | 1 (3.8%) | 0 (0.0%) |
| 25 to 29 Years | 0 (0.0%) | 0 (0.0%) |
| 30 to 34 Years | 2 (7.7%) | 0 (0.0%) |
| 35 to 39 Years | 1 (3.8%) | 0 (0.0%) |
| 40 to 44 Years | 4 (15.4%) | 0 (0.0%) |
| 45 to 49 Years | 0 (0.0%) | 3 (25.0%) |
| 50 to 54 Years | 0 (0.0%) | 0 (0.0%) |
| 55 to 59 Years | 8 (30.8%) | 6 (50.0%) |
| 60 to 64 Years | 0 (0.0%) | 0 (0.0%) |
| 65 to 69 Years | 3 (11.5%) | 1 (8.3%) |
| 70 to 74 Years | 2 (7.7%) | 2 (16.7%) |
| 75 to 79 Years | 2 (7.7%) | 0 (0.0%) |
| 80 to 84 Years | 0 (0.0%) | 0 (0.0%) |
| 85 Years and over | 0 (0.0%) | 0 (0.0%) |
| Total | 26 (100.0%) | 12 (100.0%) |
Families and Households in Delhi
Median Family Size in Delhi
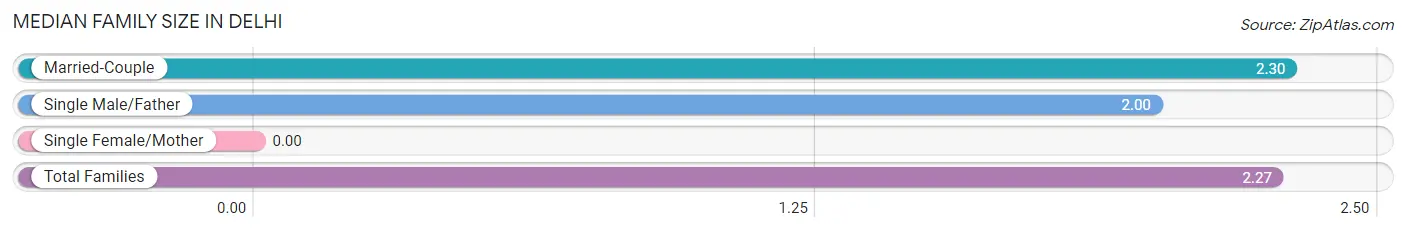
| Family Type | # Families | Family Size |
| Married-Couple | 10 (90.9%) | 2.30 |
| Single Male/Father | 1 (9.1%) | 2.00 |
| Single Female/Mother | 0 (0.0%) | - |
| Total Families | 11 (100.0%) | 2.27 |
Median Household Size in Delhi
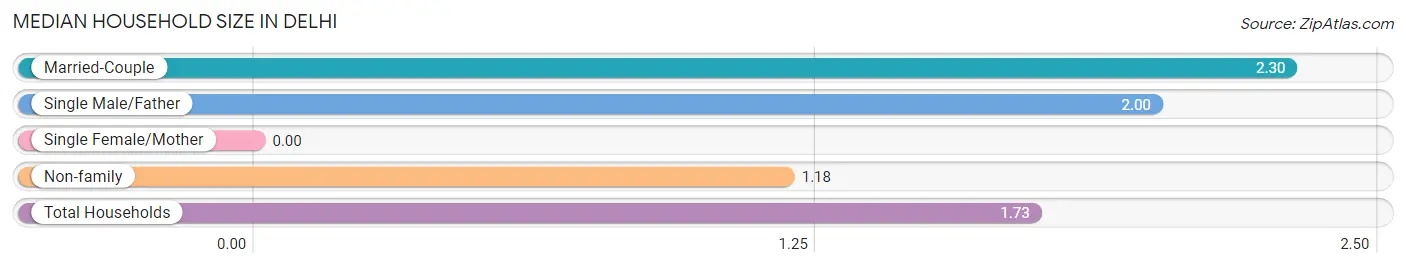
| Household Type | # Households | Household Size |
| Married-Couple | 10 (45.5%) | 2.30 |
| Single Male/Father | 1 (4.5%) | 2.00 |
| Single Female/Mother | 0 (0.0%) | - |
| Non-family | 11 (50.0%) | 1.18 |
| Total Households | 22 (100.0%) | 1.73 |
Household Size by Marriage Status in Delhi
Out of a total of 22 households in Delhi, 11 (50.0%) are family households, while 11 (50.0%) are nonfamily households. The most numerous type of family households are 2-person households, comprising 8, and the most common type of nonfamily households are 1-person households, comprising 10.
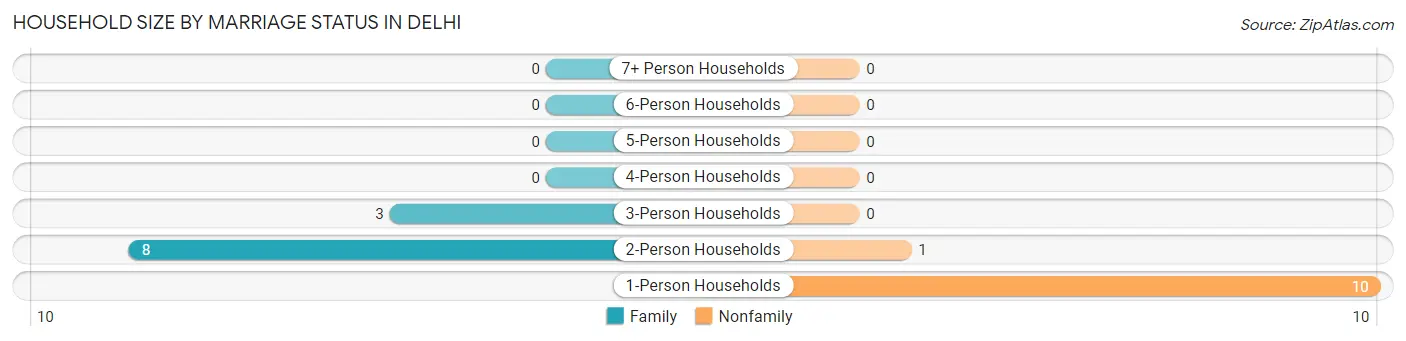
| Household Size | Family Households | Nonfamily Households |
| 1-Person Households | - | 10 (45.5%) |
| 2-Person Households | 8 (36.4%) | 1 (4.5%) |
| 3-Person Households | 3 (13.6%) | 0 (0.0%) |
| 4-Person Households | 0 (0.0%) | 0 (0.0%) |
| 5-Person Households | 0 (0.0%) | 0 (0.0%) |
| 6-Person Households | 0 (0.0%) | 0 (0.0%) |
| 7+ Person Households | 0 (0.0%) | 0 (0.0%) |
| Total | 11 (50.0%) | 11 (50.0%) |
Female Fertility in Delhi
Fertility by Age in Delhi
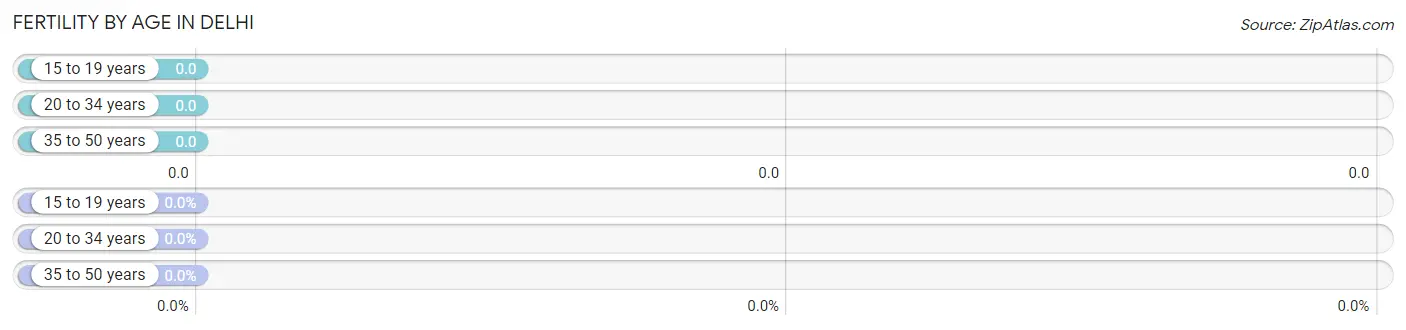
| Age Bracket | Women with Births | Births / 1,000 Women |
| 15 to 19 years | 0 (0.0%) | 0.0 |
| 20 to 34 years | 0 (0.0%) | 0.0 |
| 35 to 50 years | 0 (0.0%) | 0.0 |
| Total | 0 (0.0%) | 0.0 |
Fertility by Age by Marriage Status in Delhi
| Age Bracket | Married | Unmarried |
| 15 to 19 years | 0 (0.0%) | 0 (0.0%) |
| 20 to 34 years | 0 (0.0%) | 0 (0.0%) |
| 35 to 50 years | 0 (0.0%) | 0 (0.0%) |
| Total | 0 (0.0%) | 0 (0.0%) |
Fertility by Education in Delhi
| Educational Attainment | Women with Births | Births / 1,000 Women |
| Less than High School | 0 (0.0%) | 0.0 |
| High School Diploma | 0 (0.0%) | 0.0 |
| College or Associate's Degree | 0 (0.0%) | 0.0 |
| Bachelor's Degree | 0 (0.0%) | 0.0 |
| Graduate Degree | 0 (0.0%) | 0.0 |
| Total | 0 (0.0%) | 0.0 |
Fertility by Education by Marriage Status in Delhi
| Educational Attainment | Married | Unmarried |
| Less than High School | 0 (0.0%) | 0 (0.0%) |
| High School Diploma | 0 (0.0%) | 0 (0.0%) |
| College or Associate's Degree | 0 (0.0%) | 0 (0.0%) |
| Bachelor's Degree | 0 (0.0%) | 0 (0.0%) |
| Graduate Degree | 0 (0.0%) | 0 (0.0%) |
| Total | 0 (0.0%) | 0 (0.0%) |
Income in Delhi
Income Overview in Delhi
| Characteristic | Number | Measure |
| Per Capita Income | 38 | $52,905 |
| Median Family Income | 11 | $0 |
| Mean Family Income | 11 | $132,282 |
| Median Household Income | 22 | $65,000 |
| Mean Household Income | 22 | $88,500 |
| Income Deficit | 11 | $0 |
| Wage / Income Gap (%) | 38 | 67.32% |
| Wage / Income Gap ($) | 38 | 32.68¢ per $1 |
| Gini / Inequality Index | 38 | 0.43 |
Earnings by Sex in Delhi
Average Earnings in Delhi are $41,250, $63,750 for men and $20,833 for women, a difference of 67.3%.
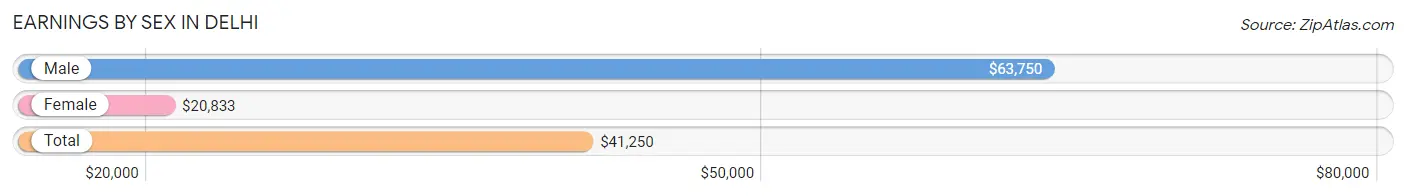
| Sex | Number | Average Earnings |
| Male | 20 (76.9%) | $63,750 |
| Female | 6 (23.1%) | $20,833 |
| Total | 26 (100.0%) | $41,250 |
Earnings by Sex by Income Bracket in Delhi
The most common earnings brackets in Delhi are $55,000 to $64,999 for men (4 | 20.0%) and $20,000 to $22,499 for women (3 | 50.0%).
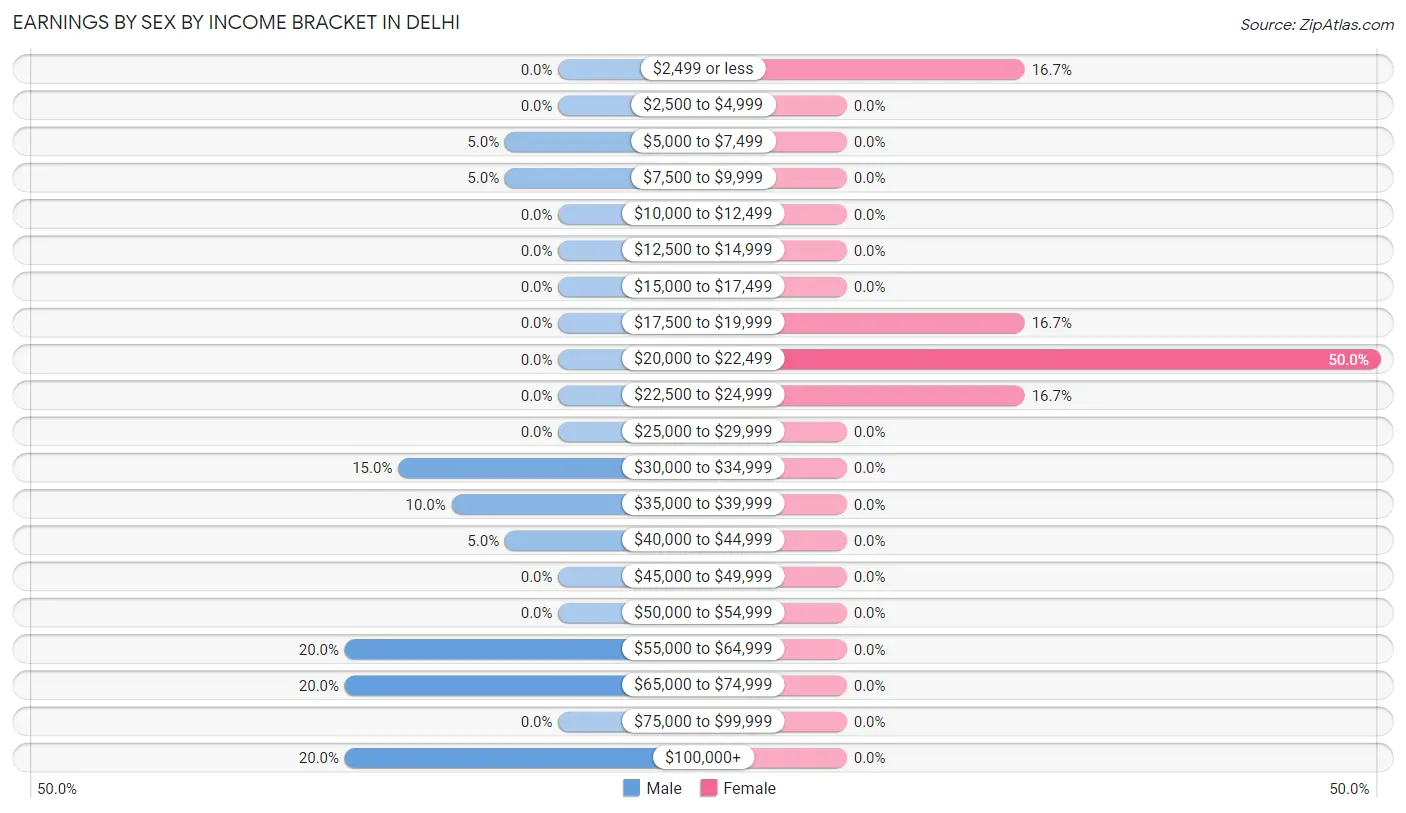
| Income | Male | Female |
| $2,499 or less | 0 (0.0%) | 1 (16.7%) |
| $2,500 to $4,999 | 0 (0.0%) | 0 (0.0%) |
| $5,000 to $7,499 | 1 (5.0%) | 0 (0.0%) |
| $7,500 to $9,999 | 1 (5.0%) | 0 (0.0%) |
| $10,000 to $12,499 | 0 (0.0%) | 0 (0.0%) |
| $12,500 to $14,999 | 0 (0.0%) | 0 (0.0%) |
| $15,000 to $17,499 | 0 (0.0%) | 0 (0.0%) |
| $17,500 to $19,999 | 0 (0.0%) | 1 (16.7%) |
| $20,000 to $22,499 | 0 (0.0%) | 3 (50.0%) |
| $22,500 to $24,999 | 0 (0.0%) | 1 (16.7%) |
| $25,000 to $29,999 | 0 (0.0%) | 0 (0.0%) |
| $30,000 to $34,999 | 3 (15.0%) | 0 (0.0%) |
| $35,000 to $39,999 | 2 (10.0%) | 0 (0.0%) |
| $40,000 to $44,999 | 1 (5.0%) | 0 (0.0%) |
| $45,000 to $49,999 | 0 (0.0%) | 0 (0.0%) |
| $50,000 to $54,999 | 0 (0.0%) | 0 (0.0%) |
| $55,000 to $64,999 | 4 (20.0%) | 0 (0.0%) |
| $65,000 to $74,999 | 4 (20.0%) | 0 (0.0%) |
| $75,000 to $99,999 | 0 (0.0%) | 0 (0.0%) |
| $100,000+ | 4 (20.0%) | 0 (0.0%) |
| Total | 20 (100.0%) | 6 (100.0%) |
Earnings by Sex by Educational Attainment in Delhi
| Educational Attainment | Male Income | Female Income |
| Less than High School | - | - |
| High School Diploma | - | - |
| College or Associate's Degree | - | - |
| Bachelor's Degree | - | - |
| Graduate Degree | - | - |
| Total | $66,250 | $20,833 |
Family Income in Delhi
Family Income Brackets in Delhi
According to the Delhi family income data, there are 4 families falling into the $200,000+ income range, which is the most common income bracket and makes up 36.4% of all families.
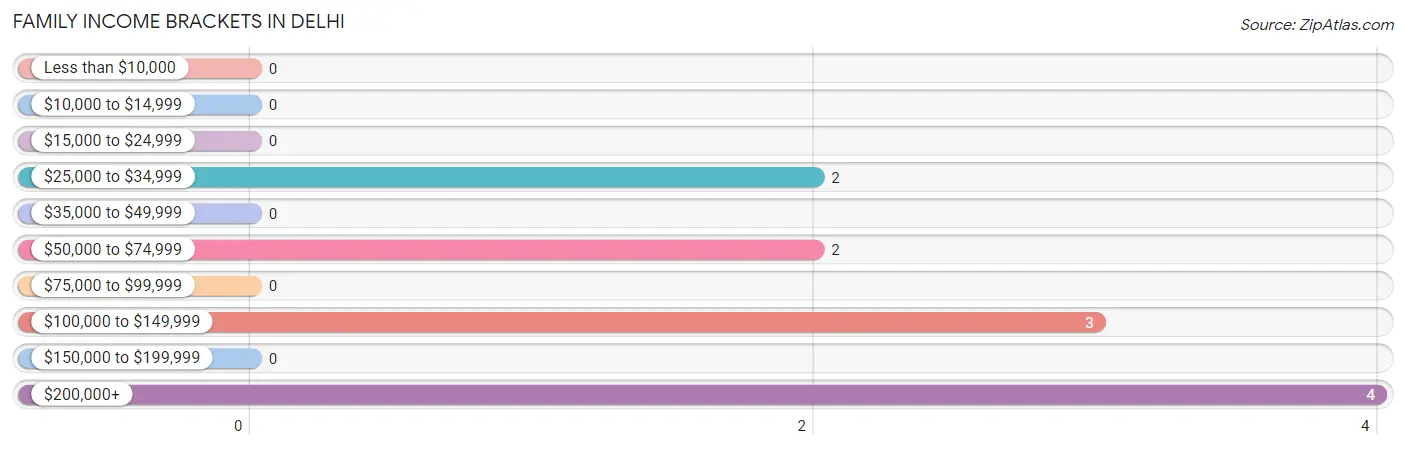
| Income Bracket | # Families | % Families |
| Less than $10,000 | 0 | 0.0% |
| $10,000 to $14,999 | 0 | 0.0% |
| $15,000 to $24,999 | 0 | 0.0% |
| $25,000 to $34,999 | 2 | 18.2% |
| $35,000 to $49,999 | 0 | 0.0% |
| $50,000 to $74,999 | 2 | 18.2% |
| $75,000 to $99,999 | 0 | 0.0% |
| $100,000 to $149,999 | 3 | 27.3% |
| $150,000 to $199,999 | 0 | 0.0% |
| $200,000+ | 4 | 36.4% |
Family Income by Famaliy Size in Delhi
| Income Bracket | # Families | Median Income |
| 2-Person Families | 8 (72.7%) | $0 |
| 3-Person Families | 3 (27.3%) | $0 |
| 4-Person Families | 0 (0.0%) | $0 |
| 5-Person Families | 0 (0.0%) | $0 |
| 6-Person Families | 0 (0.0%) | $0 |
| 7+ Person Families | 0 (0.0%) | $0 |
| Total | 11 (100.0%) | $0 |
Family Income by Number of Earners in Delhi
| Number of Earners | # Families | Median Income |
| No Earners | 2 (18.2%) | $0 |
| 1 Earner | 5 (45.5%) | $0 |
| 2 Earners | 1 (9.1%) | $0 |
| 3+ Earners | 3 (27.3%) | $0 |
| Total | 11 (100.0%) | $0 |
Household Income in Delhi
Household Income Brackets in Delhi
With 6 households falling in the category, the $50,000 to $74,999 income range is the most frequent in Delhi, accounting for 27.3% of all households.
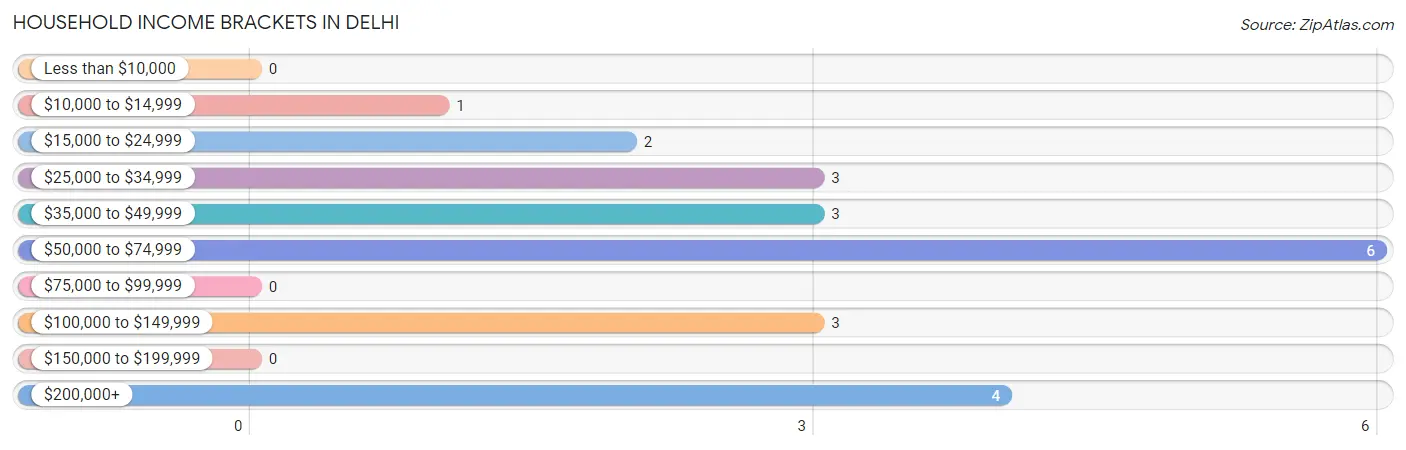
| Income Bracket | # Households | % Households |
| Less than $10,000 | 0 | 0.0% |
| $10,000 to $14,999 | 1 | 4.5% |
| $15,000 to $24,999 | 2 | 9.1% |
| $25,000 to $34,999 | 3 | 13.6% |
| $35,000 to $49,999 | 3 | 13.6% |
| $50,000 to $74,999 | 6 | 27.3% |
| $75,000 to $99,999 | 0 | 0.0% |
| $100,000 to $149,999 | 3 | 13.6% |
| $150,000 to $199,999 | 0 | 0.0% |
| $200,000+ | 4 | 18.2% |
Household Income by Householder Age in Delhi
The median household income in Delhi is $65,000, with the highest median household income of $28,750 found in the 65+ years age bracket for the primary householder. A total of 6 households (27.3%) fall into this category. Meanwhile, the 15 to 24 years age bracket for the primary householder has the lowest median household income of $0, with 1 households (4.5%) in this group.
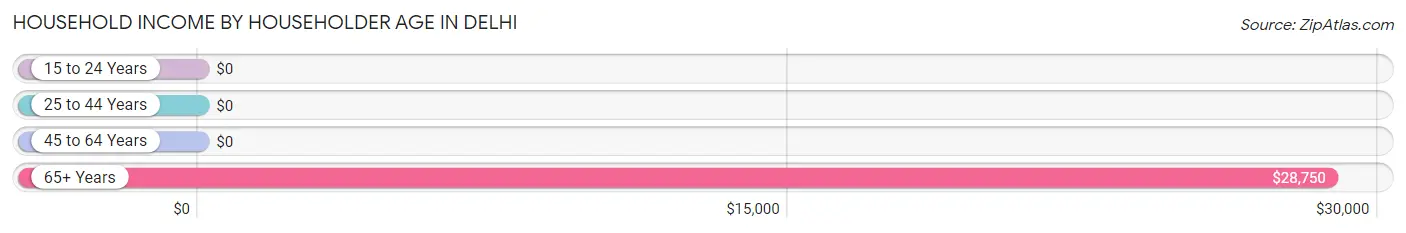
| Income Bracket | # Households | Median Income |
| 15 to 24 Years | 1 (4.5%) | $0 |
| 25 to 44 Years | 2 (9.1%) | $0 |
| 45 to 64 Years | 13 (59.1%) | $0 |
| 65+ Years | 6 (27.3%) | $28,750 |
| Total | 22 (100.0%) | $65,000 |
Poverty in Delhi
Income Below Poverty by Sex and Age in Delhi
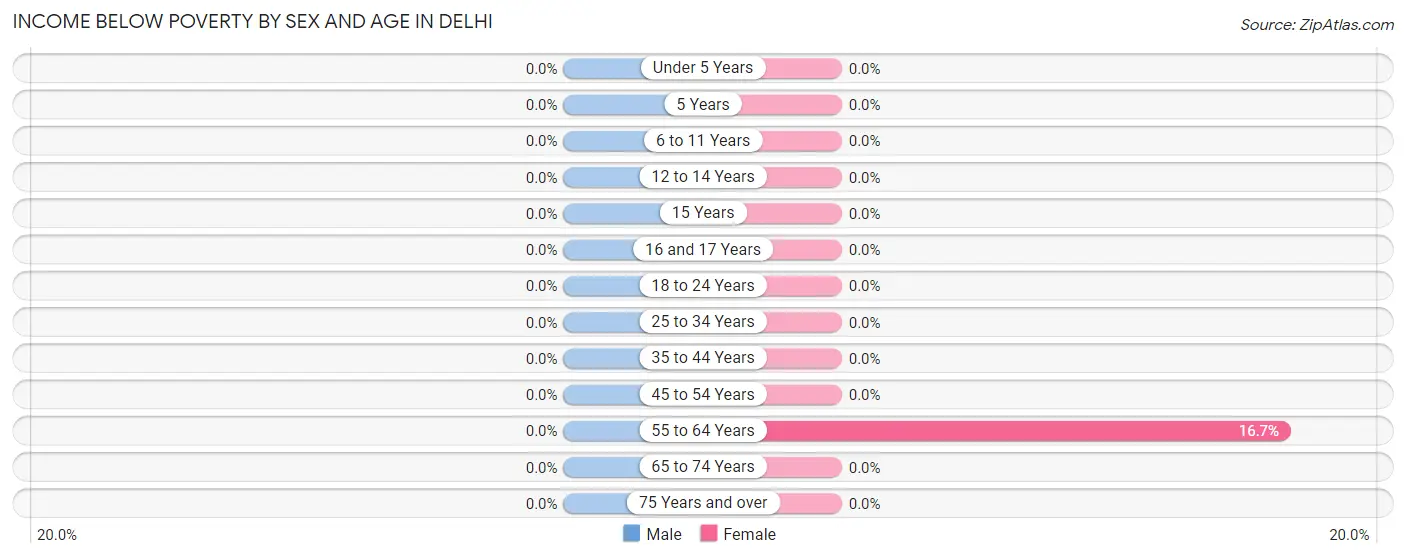
| Age Bracket | Male | Female |
| Under 5 Years | 0 (0.0%) | 0 (0.0%) |
| 5 Years | 0 (0.0%) | 0 (0.0%) |
| 6 to 11 Years | 0 (0.0%) | 0 (0.0%) |
| 12 to 14 Years | 0 (0.0%) | 0 (0.0%) |
| 15 Years | 0 (0.0%) | 0 (0.0%) |
| 16 and 17 Years | 0 (0.0%) | 0 (0.0%) |
| 18 to 24 Years | 0 (0.0%) | 0 (0.0%) |
| 25 to 34 Years | 0 (0.0%) | 0 (0.0%) |
| 35 to 44 Years | 0 (0.0%) | 0 (0.0%) |
| 45 to 54 Years | 0 (0.0%) | 0 (0.0%) |
| 55 to 64 Years | 0 (0.0%) | 1 (16.7%) |
| 65 to 74 Years | 0 (0.0%) | 0 (0.0%) |
| 75 Years and over | 0 (0.0%) | 0 (0.0%) |
| Total | 0 (0.0%) | 1 (8.3%) |
Income Above Poverty by Sex and Age in Delhi
According to the poverty statistics in Delhi, males aged 18 to 24 years and females aged 45 to 54 years are the age groups that are most secure financially, with 100.0% of males and 100.0% of females in these age groups living above the poverty line.
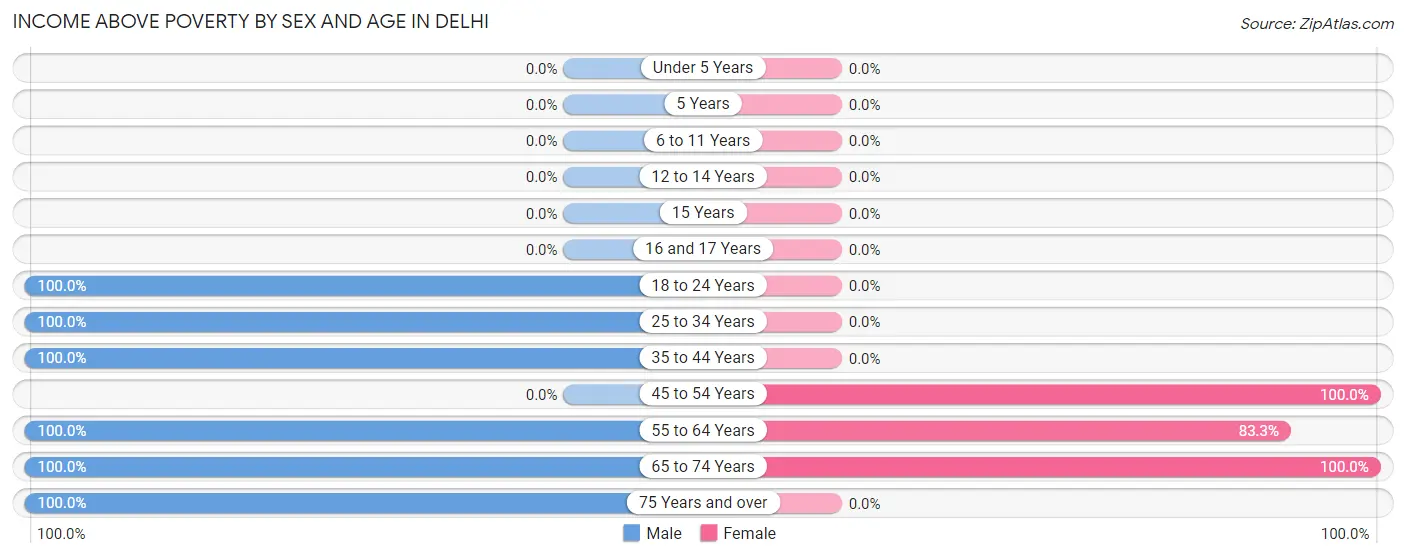
| Age Bracket | Male | Female |
| Under 5 Years | 0 (0.0%) | 0 (0.0%) |
| 5 Years | 0 (0.0%) | 0 (0.0%) |
| 6 to 11 Years | 0 (0.0%) | 0 (0.0%) |
| 12 to 14 Years | 0 (0.0%) | 0 (0.0%) |
| 15 Years | 0 (0.0%) | 0 (0.0%) |
| 16 and 17 Years | 0 (0.0%) | 0 (0.0%) |
| 18 to 24 Years | 4 (100.0%) | 0 (0.0%) |
| 25 to 34 Years | 2 (100.0%) | 0 (0.0%) |
| 35 to 44 Years | 5 (100.0%) | 0 (0.0%) |
| 45 to 54 Years | 0 (0.0%) | 3 (100.0%) |
| 55 to 64 Years | 8 (100.0%) | 5 (83.3%) |
| 65 to 74 Years | 5 (100.0%) | 3 (100.0%) |
| 75 Years and over | 2 (100.0%) | 0 (0.0%) |
| Total | 26 (100.0%) | 11 (91.7%) |
Income Below Poverty Among Married-Couple Families in Delhi
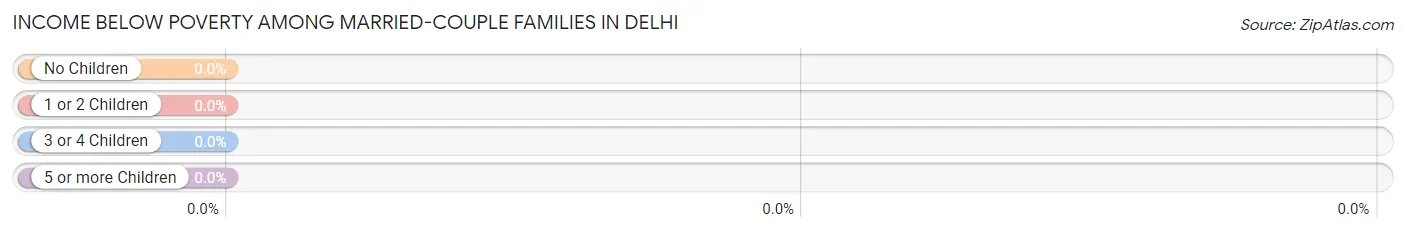
| Children | Above Poverty | Below Poverty |
| No Children | 10 (100.0%) | 0 (0.0%) |
| 1 or 2 Children | 0 (0.0%) | 0 (0.0%) |
| 3 or 4 Children | 0 (0.0%) | 0 (0.0%) |
| 5 or more Children | 0 (0.0%) | 0 (0.0%) |
| Total | 10 (100.0%) | 0 (0.0%) |
Income Below Poverty Among Single-Parent Households in Delhi
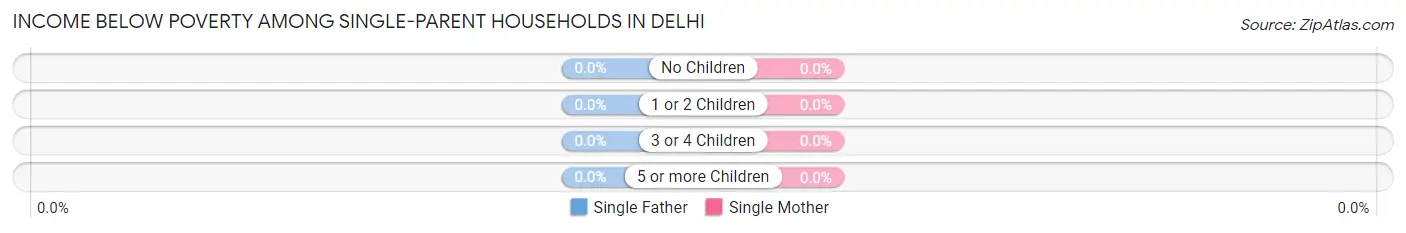
| Children | Single Father | Single Mother |
| No Children | 0 (0.0%) | 0 (0.0%) |
| 1 or 2 Children | 0 (0.0%) | 0 (0.0%) |
| 3 or 4 Children | 0 (0.0%) | 0 (0.0%) |
| 5 or more Children | 0 (0.0%) | 0 (0.0%) |
| Total | 0 (0.0%) | 0 (0.0%) |
Income Below Poverty Among Married-Couple vs Single-Parent Households in Delhi
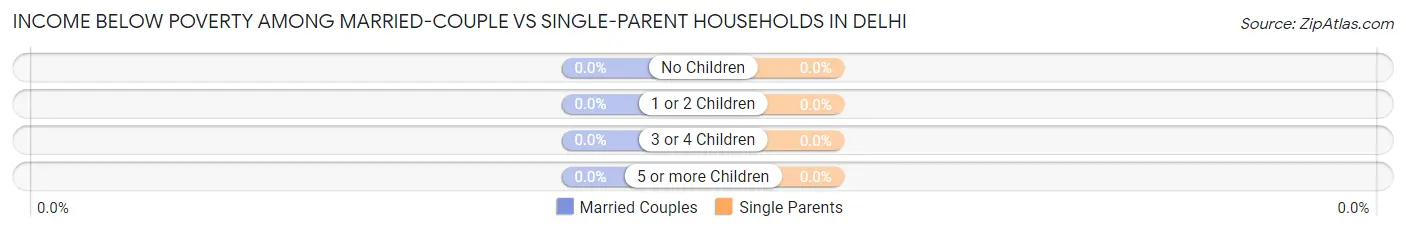
| Children | Married-Couple Families | Single-Parent Households |
| No Children | 0 (0.0%) | 0 (0.0%) |
| 1 or 2 Children | 0 (0.0%) | 0 (0.0%) |
| 3 or 4 Children | 0 (0.0%) | 0 (0.0%) |
| 5 or more Children | 0 (0.0%) | 0 (0.0%) |
| Total | 0 (0.0%) | 0 (0.0%) |
Employment Characteristics in Delhi
Employment by Class of Employer in Delhi
Among the 24 employed individuals in Delhi, private company employees (23 | 95.8%), and local government employees (1 | 4.2%) make up the most common classes of employment.
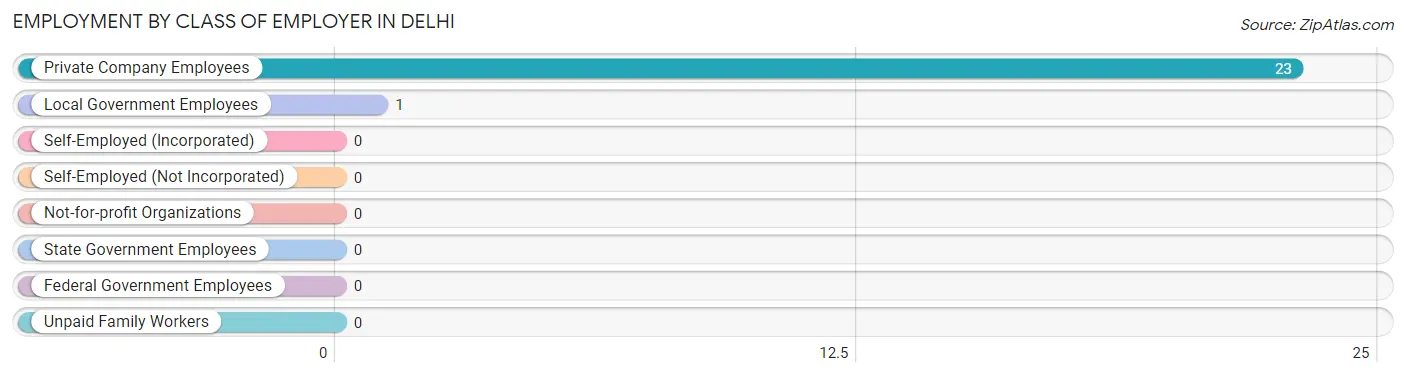
| Employer Class | # Employees | % Employees |
| Private Company Employees | 23 | 95.8% |
| Self-Employed (Incorporated) | 0 | 0.0% |
| Self-Employed (Not Incorporated) | 0 | 0.0% |
| Not-for-profit Organizations | 0 | 0.0% |
| Local Government Employees | 1 | 4.2% |
| State Government Employees | 0 | 0.0% |
| Federal Government Employees | 0 | 0.0% |
| Unpaid Family Workers | 0 | 0.0% |
| Total | 24 | 100.0% |
Employment Status by Age in Delhi
According to the labor force statistics for Delhi, out of the total population over 16 years of age (38), 65.8% or 25 individuals are in the labor force, with 4.0% or 1 of them unemployed. The age group with the highest labor force participation rate is 16 to 19 years, with 100.0% or 3 individuals in the labor force. Within the labor force, the 35 to 44 years age range has the highest percentage of unemployed individuals, with 20.0% or 1 of them being unemployed.
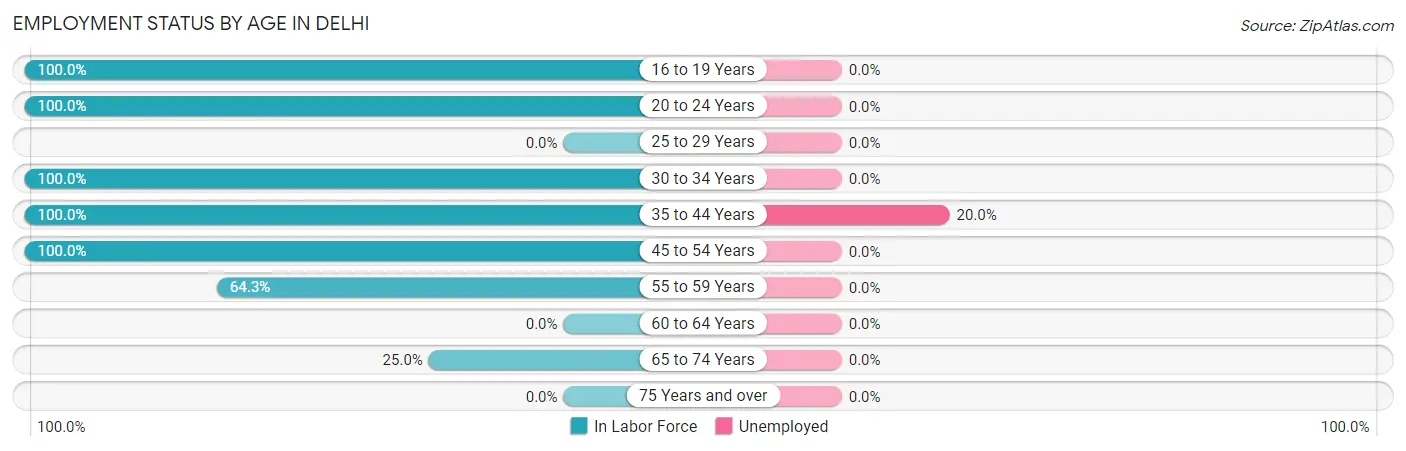
| Age Bracket | In Labor Force | Unemployed |
| 16 to 19 Years | 3 (100.0%) | 0 (0.0%) |
| 20 to 24 Years | 1 (100.0%) | 0 (0.0%) |
| 25 to 29 Years | 0 (0.0%) | 0 (0.0%) |
| 30 to 34 Years | 2 (100.0%) | 0 (0.0%) |
| 35 to 44 Years | 5 (100.0%) | 1 (20.0%) |
| 45 to 54 Years | 3 (100.0%) | 0 (0.0%) |
| 55 to 59 Years | 9 (64.3%) | 0 (0.0%) |
| 60 to 64 Years | 0 (0.0%) | 0 (0.0%) |
| 65 to 74 Years | 2 (25.0%) | 0 (0.0%) |
| 75 Years and over | 0 (0.0%) | 0 (0.0%) |
| Total | 25 (65.8%) | 1 (4.0%) |
Employment Status by Educational Attainment in Delhi
According to labor force statistics for Delhi, 79.2% of individuals (19) out of the total population between 25 and 64 years of age (24) are in the labor force, with 5.3% or 1 of them being unemployed. The group with the highest labor force participation rate are those with the educational attainment of less than high school, with 100.0% or 4 individuals in the labor force. Within the labor force, individuals with high school diploma education have the highest percentage of unemployment, with 12.5% or 1 of them being unemployed.
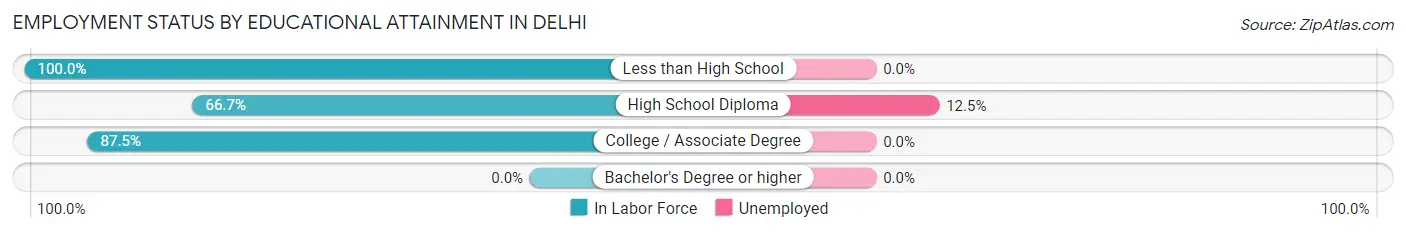
| Educational Attainment | In Labor Force | Unemployed |
| Less than High School | 4 (100.0%) | 0 (0.0%) |
| High School Diploma | 8 (66.7%) | 2 (12.5%) |
| College / Associate Degree | 7 (87.5%) | 0 (0.0%) |
| Bachelor's Degree or higher | 0 (0.0%) | 0 (0.0%) |
| Total | 19 (79.2%) | 1 (5.3%) |
Employment Occupations by Sex in Delhi
Management, Business, Science and Arts Occupations
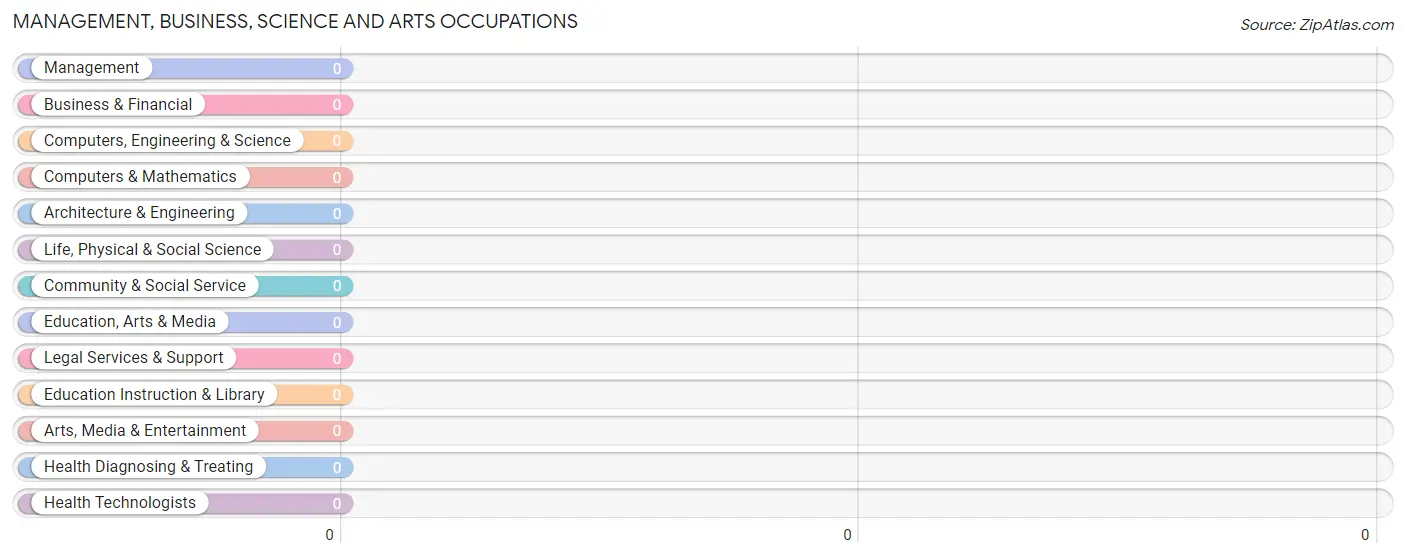
Management, Business, Science and Arts Occupations by Sex
| Occupation | Male | Female |
| Management | 0 (0.0%) | 0 (0.0%) |
| Business & Financial | 0 (0.0%) | 0 (0.0%) |
| Computers, Engineering & Science | 0 (0.0%) | 0 (0.0%) |
| Computers & Mathematics | 0 (0.0%) | 0 (0.0%) |
| Architecture & Engineering | 0 (0.0%) | 0 (0.0%) |
| Life, Physical & Social Science | 0 (0.0%) | 0 (0.0%) |
| Community & Social Service | 0 (0.0%) | 0 (0.0%) |
| Education, Arts & Media | 0 (0.0%) | 0 (0.0%) |
| Legal Services & Support | 0 (0.0%) | 0 (0.0%) |
| Education Instruction & Library | 0 (0.0%) | 0 (0.0%) |
| Arts, Media & Entertainment | 0 (0.0%) | 0 (0.0%) |
| Health Diagnosing & Treating | 0 (0.0%) | 0 (0.0%) |
| Health Technologists | 0 (0.0%) | 0 (0.0%) |
| Total (Category) | 0 (0.0%) | 0 (0.0%) |
| Total (Overall) | 19 (79.2%) | 5 (20.8%) |
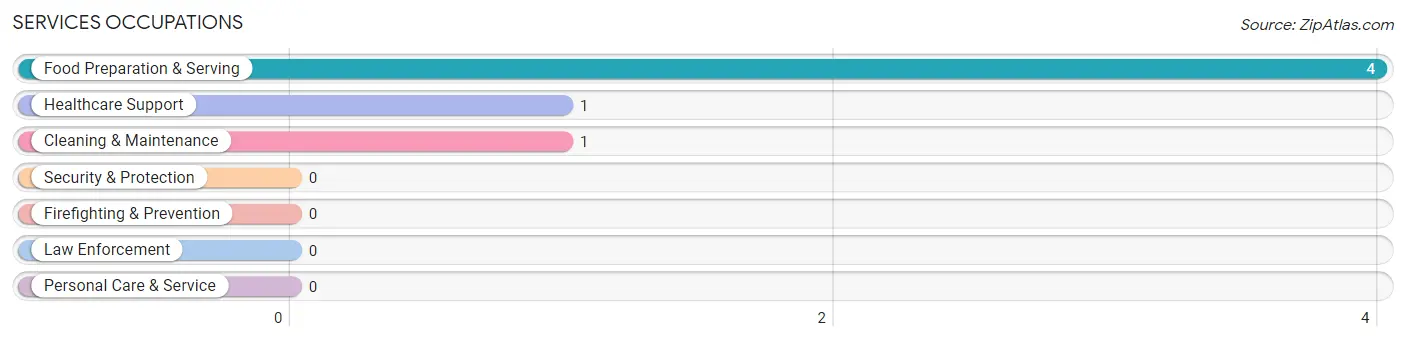
Services Occupations
The most common Services occupations in Delhi are Food Preparation & Serving (4 | 16.7%), Healthcare Support (1 | 4.2%), and Cleaning & Maintenance (1 | 4.2%).
Services Occupations by Sex
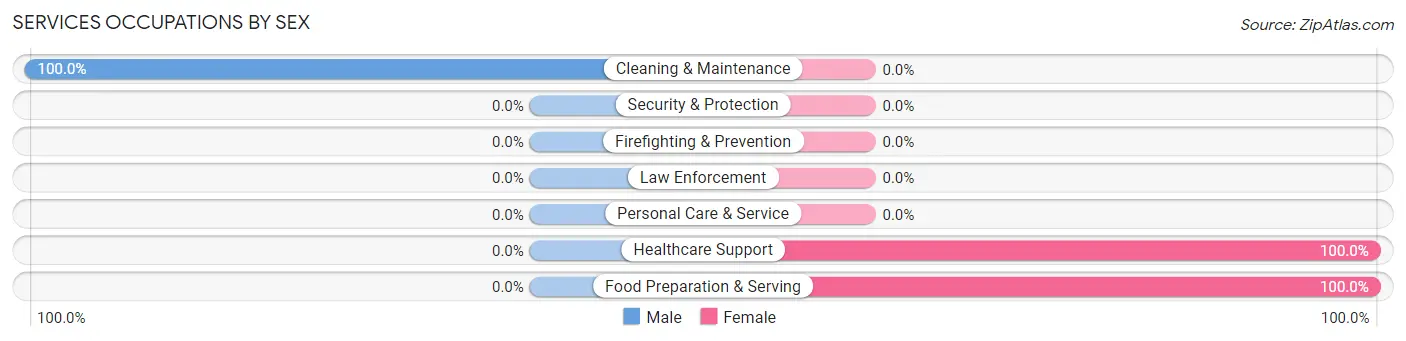
| Occupation | Male | Female |
| Healthcare Support | 0 (0.0%) | 1 (100.0%) |
| Security & Protection | 0 (0.0%) | 0 (0.0%) |
| Firefighting & Prevention | 0 (0.0%) | 0 (0.0%) |
| Law Enforcement | 0 (0.0%) | 0 (0.0%) |
| Food Preparation & Serving | 0 (0.0%) | 4 (100.0%) |
| Cleaning & Maintenance | 1 (100.0%) | 0 (0.0%) |
| Personal Care & Service | 0 (0.0%) | 0 (0.0%) |
| Total (Category) | 1 (16.7%) | 5 (83.3%) |
| Total (Overall) | 19 (79.2%) | 5 (20.8%) |
Sales and Office Occupations
The most common Sales and Office occupations in Delhi are , and Sales & Related (4 | 16.7%).
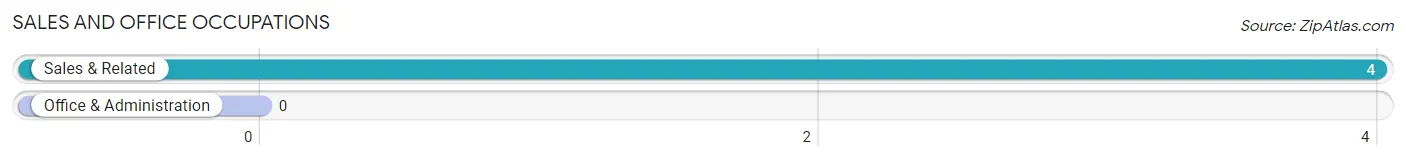
Sales and Office Occupations by Sex

| Occupation | Male | Female |
| Sales & Related | 4 (100.0%) | 0 (0.0%) |
| Office & Administration | 0 (0.0%) | 0 (0.0%) |
| Total (Category) | 4 (100.0%) | 0 (0.0%) |
| Total (Overall) | 19 (79.2%) | 5 (20.8%) |
Natural Resources, Construction and Maintenance Occupations
The most common Natural Resources, Construction and Maintenance occupations in Delhi are Installation, Maintenance & Repair (3 | 12.5%), and Construction & Extraction (1 | 4.2%).
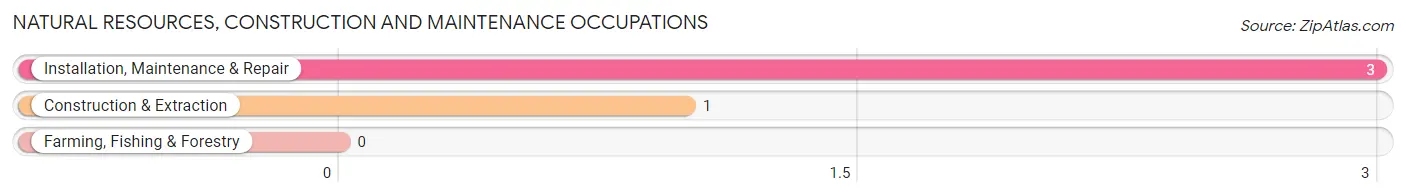
Natural Resources, Construction and Maintenance Occupations by Sex
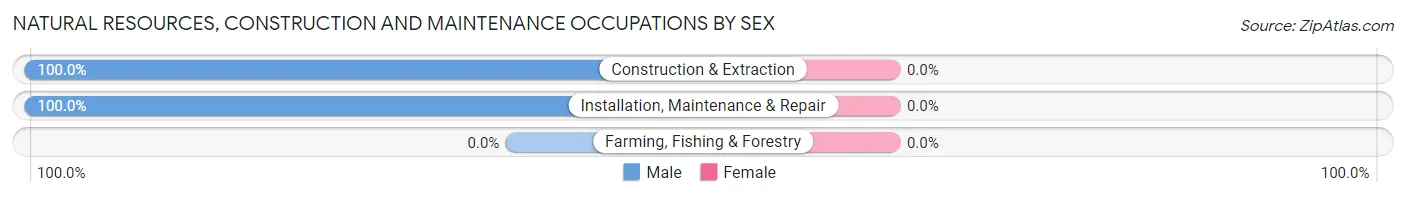
| Occupation | Male | Female |
| Farming, Fishing & Forestry | 0 (0.0%) | 0 (0.0%) |
| Construction & Extraction | 1 (100.0%) | 0 (0.0%) |
| Installation, Maintenance & Repair | 3 (100.0%) | 0 (0.0%) |
| Total (Category) | 4 (100.0%) | 0 (0.0%) |
| Total (Overall) | 19 (79.2%) | 5 (20.8%) |
Production, Transportation and Moving Occupations
The most common Production, Transportation and Moving occupations in Delhi are Transportation (4 | 16.7%), Material Moving (4 | 16.7%), and Production (2 | 8.3%).
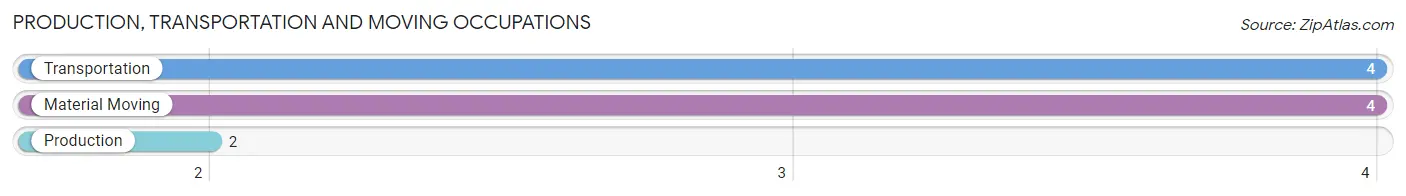
Production, Transportation and Moving Occupations by Sex
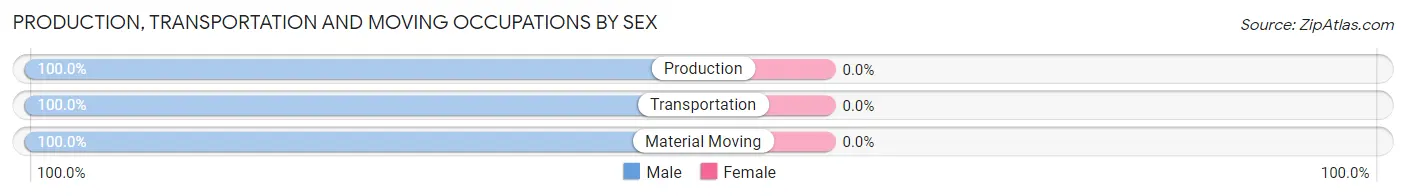
| Occupation | Male | Female |
| Production | 2 (100.0%) | 0 (0.0%) |
| Transportation | 4 (100.0%) | 0 (0.0%) |
| Material Moving | 4 (100.0%) | 0 (0.0%) |
| Total (Category) | 10 (100.0%) | 0 (0.0%) |
| Total (Overall) | 19 (79.2%) | 5 (20.8%) |
Employment Industries by Sex in Delhi
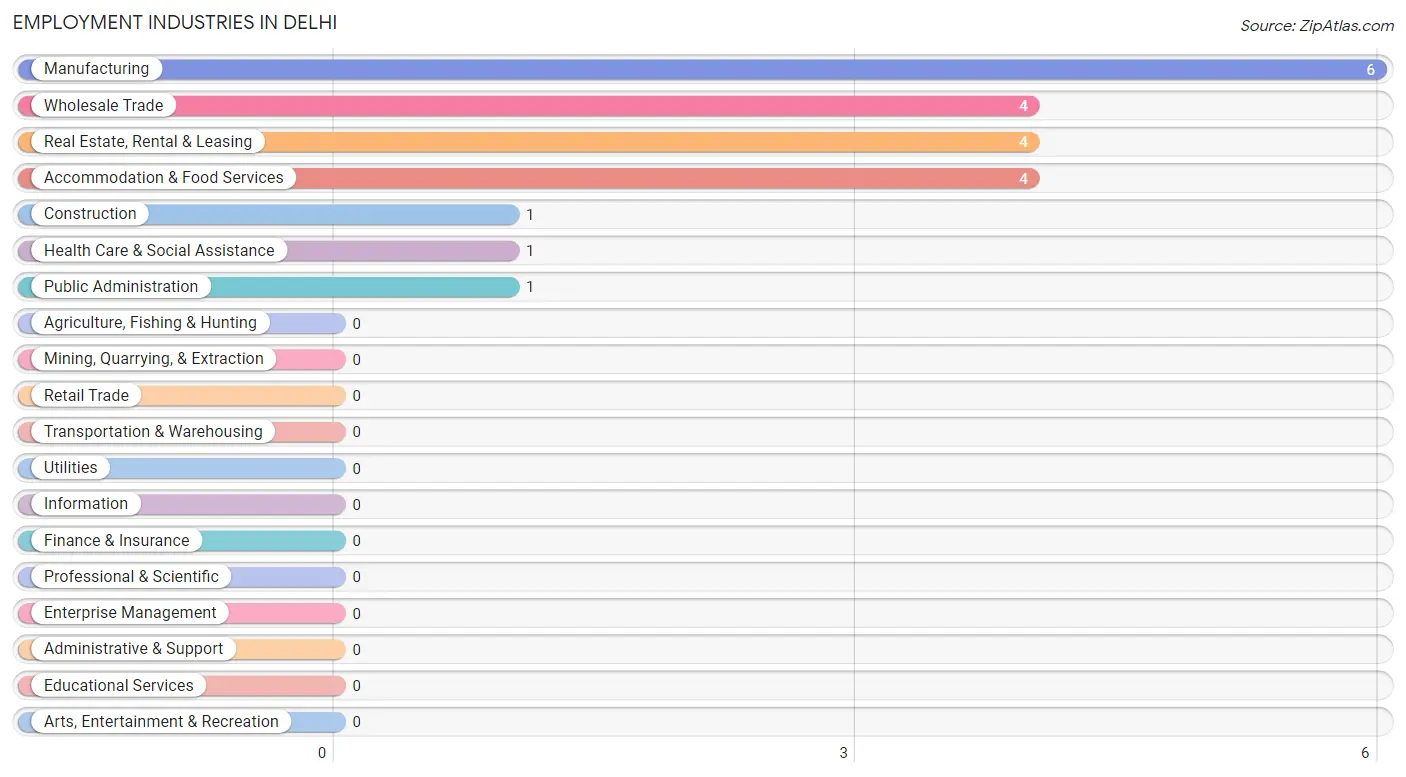
Employment Industries in Delhi
The major employment industries in Delhi include Manufacturing (6 | 25.0%), Wholesale Trade (4 | 16.7%), Real Estate, Rental & Leasing (4 | 16.7%), Accommodation & Food Services (4 | 16.7%), and Construction (1 | 4.2%).
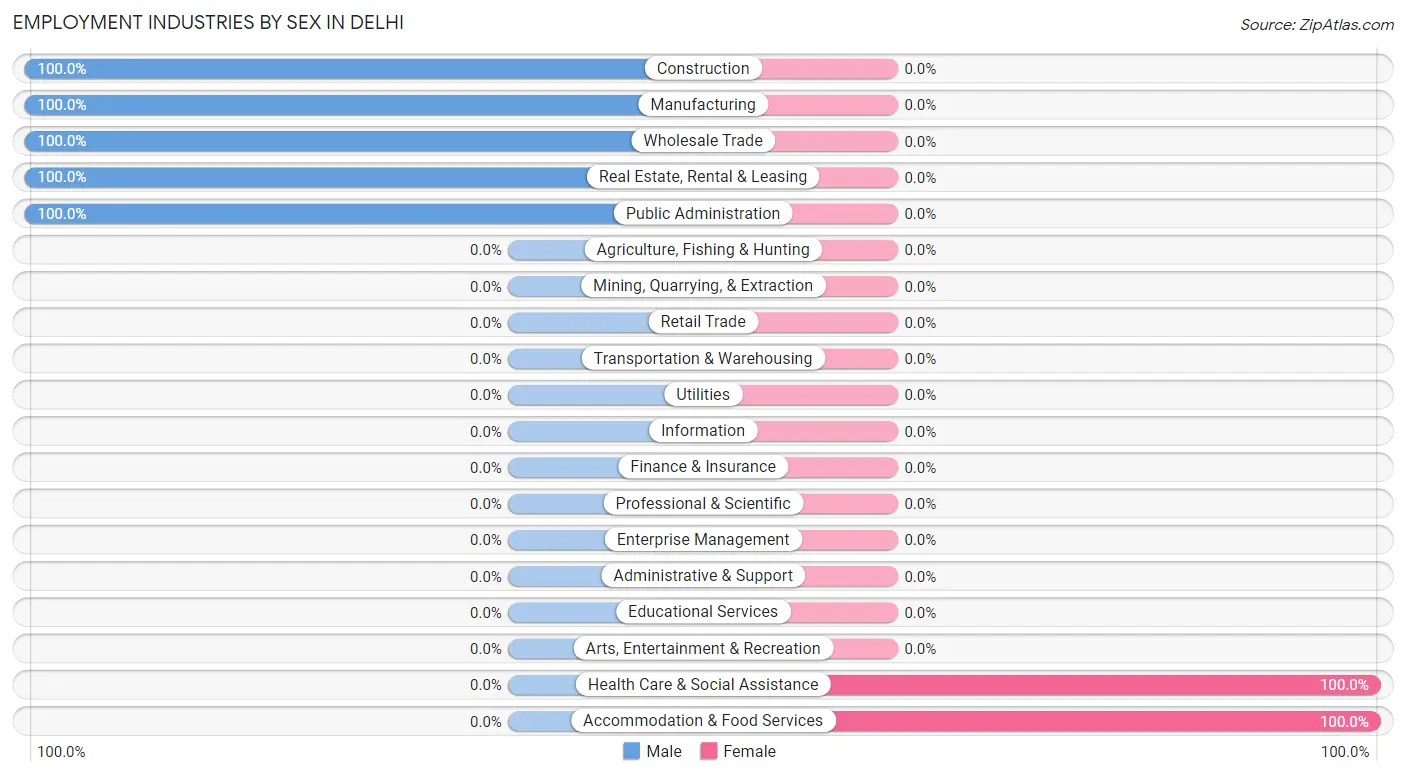
Employment Industries by Sex in Delhi
The Delhi industries that see more men than women are Construction (100.0%), Manufacturing (100.0%), and Wholesale Trade (100.0%), whereas the industries that tend to have a higher number of women are Health Care & Social Assistance (100.0%), and Accommodation & Food Services (100.0%).
| Industry | Male | Female |
| Agriculture, Fishing & Hunting | 0 (0.0%) | 0 (0.0%) |
| Mining, Quarrying, & Extraction | 0 (0.0%) | 0 (0.0%) |
| Construction | 1 (100.0%) | 0 (0.0%) |
| Manufacturing | 6 (100.0%) | 0 (0.0%) |
| Wholesale Trade | 4 (100.0%) | 0 (0.0%) |
| Retail Trade | 0 (0.0%) | 0 (0.0%) |
| Transportation & Warehousing | 0 (0.0%) | 0 (0.0%) |
| Utilities | 0 (0.0%) | 0 (0.0%) |
| Information | 0 (0.0%) | 0 (0.0%) |
| Finance & Insurance | 0 (0.0%) | 0 (0.0%) |
| Real Estate, Rental & Leasing | 4 (100.0%) | 0 (0.0%) |
| Professional & Scientific | 0 (0.0%) | 0 (0.0%) |
| Enterprise Management | 0 (0.0%) | 0 (0.0%) |
| Administrative & Support | 0 (0.0%) | 0 (0.0%) |
| Educational Services | 0 (0.0%) | 0 (0.0%) |
| Health Care & Social Assistance | 0 (0.0%) | 1 (100.0%) |
| Arts, Entertainment & Recreation | 0 (0.0%) | 0 (0.0%) |
| Accommodation & Food Services | 0 (0.0%) | 4 (100.0%) |
| Public Administration | 1 (100.0%) | 0 (0.0%) |
| Total | 19 (79.2%) | 5 (20.8%) |
Education in Delhi
School Enrollment in Delhi
| School Level | # Students | % Students |
| Nursery / Preschool | 0 | 0.0% |
| Kindergarten | 0 | 0.0% |
| Elementary School | 0 | 0.0% |
| Middle School | 0 | 0.0% |
| High School | 0 | 0.0% |
| College / Undergraduate | 0 | 0.0% |
| Graduate / Professional | 0 | 0.0% |
| Total | 0 | 0.0% |
School Enrollment by Age by Funding Source in Delhi
| Age Bracket | Public School | Private School |
| 3 to 4 Year Olds | 0 (0.0%) | 0 (0.0%) |
| 5 to 9 Year Old | 0 (0.0%) | 0 (0.0%) |
| 10 to 14 Year Olds | 0 (0.0%) | 0 (0.0%) |
| 15 to 17 Year Olds | 0 (0.0%) | 0 (0.0%) |
| 18 to 19 Year Olds | 0 (0.0%) | 0 (0.0%) |
| 20 to 24 Year Olds | 0 (0.0%) | 0 (0.0%) |
| 25 to 34 Year Olds | 0 (0.0%) | 0 (0.0%) |
| 35 Years and over | 0 (0.0%) | 0 (0.0%) |
| Total | 0 (0.0%) | 0 (0.0%) |
Educational Attainment by Field of Study in Delhi
| Field of Study | # Graduates | % Graduates |
| Computers & Mathematics | 0 | 0.0% |
| Bio, Nature & Agricultural | 0 | 0.0% |
| Physical & Health Sciences | 0 | 0.0% |
| Psychology | 0 | 0.0% |
| Social Sciences | 0 | 0.0% |
| Engineering | 0 | 0.0% |
| Multidisciplinary Studies | 0 | 0.0% |
| Science & Technology | 0 | 0.0% |
| Business | 0 | 0.0% |
| Education | 0 | 0.0% |
| Literature & Languages | 0 | 0.0% |
| Liberal Arts & History | 0 | 0.0% |
| Visual & Performing Arts | 0 | 0.0% |
| Communications | 0 | 0.0% |
| Arts & Humanities | 0 | 0.0% |
| Total | 0 | 0.0% |
Transportation & Commute in Delhi
Vehicle Availability by Sex in Delhi
The most prevalent vehicle ownership categories in Delhi are males with 2 vehicles (11, accounting for 57.9%) and females with 2 vehicles (1, making up 220.0%).
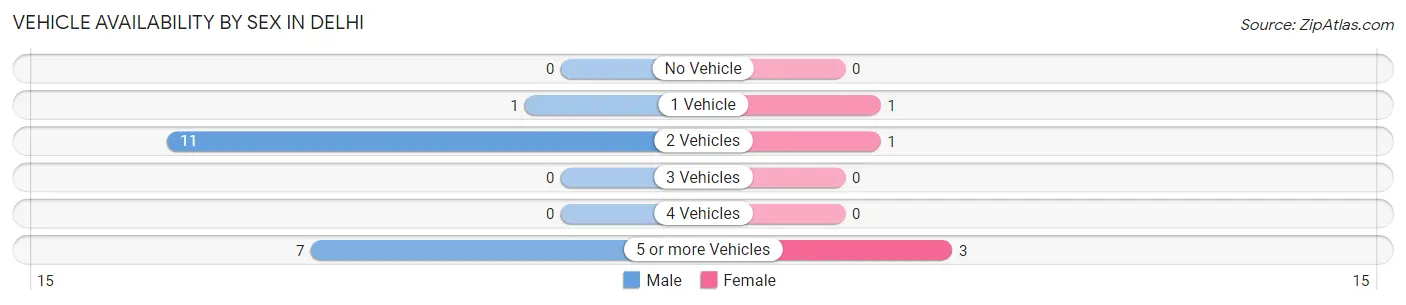
| Vehicles Available | Male | Female |
| No Vehicle | 0 (0.0%) | 0 (0.0%) |
| 1 Vehicle | 1 (5.3%) | 1 (20.0%) |
| 2 Vehicles | 11 (57.9%) | 1 (20.0%) |
| 3 Vehicles | 0 (0.0%) | 0 (0.0%) |
| 4 Vehicles | 0 (0.0%) | 0 (0.0%) |
| 5 or more Vehicles | 7 (36.8%) | 3 (60.0%) |
| Total | 19 (100.0%) | 5 (100.0%) |
Commute Time in Delhi
The most frequently occuring commute durations in Delhi are 30 to 34 minutes (7 commuters, 30.4%), 10 to 14 minutes (5 commuters, 21.7%), and 15 to 19 minutes (4 commuters, 17.4%).
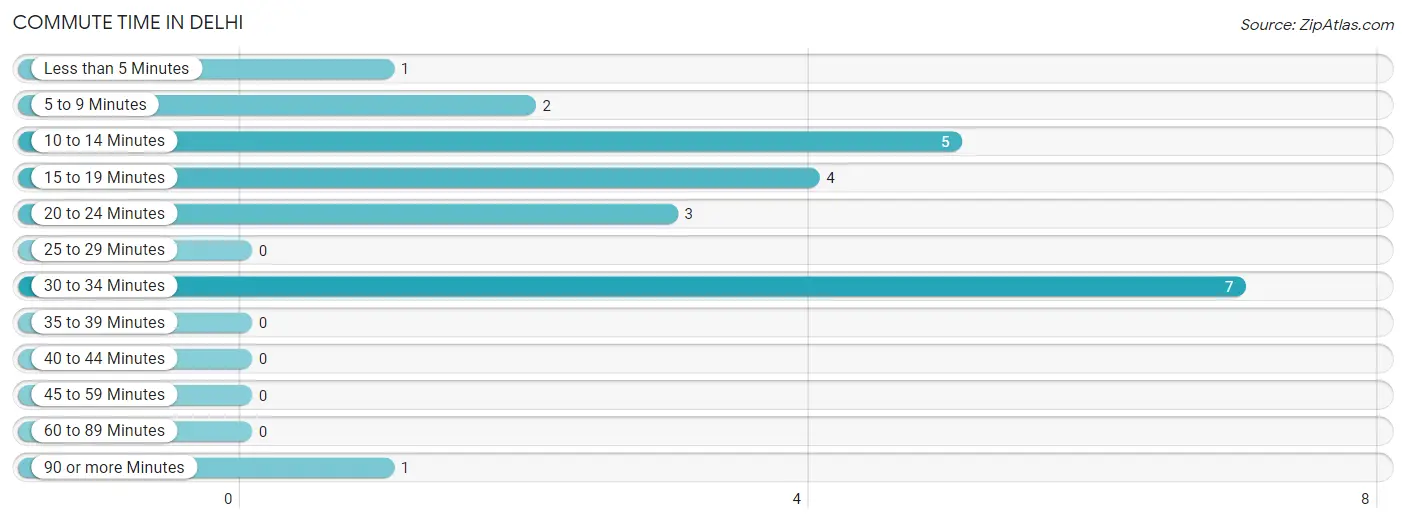
| Commute Time | # Commuters | % Commuters |
| Less than 5 Minutes | 1 | 4.3% |
| 5 to 9 Minutes | 2 | 8.7% |
| 10 to 14 Minutes | 5 | 21.7% |
| 15 to 19 Minutes | 4 | 17.4% |
| 20 to 24 Minutes | 3 | 13.0% |
| 25 to 29 Minutes | 0 | 0.0% |
| 30 to 34 Minutes | 7 | 30.4% |
| 35 to 39 Minutes | 0 | 0.0% |
| 40 to 44 Minutes | 0 | 0.0% |
| 45 to 59 Minutes | 0 | 0.0% |
| 60 to 89 Minutes | 0 | 0.0% |
| 90 or more Minutes | 1 | 4.3% |
Commute Time by Sex in Delhi
The most common commute times in Delhi are 30 to 34 minutes (7 commuters, 38.9%) for males and 20 to 24 minutes (3 commuters, 60.0%) for females.
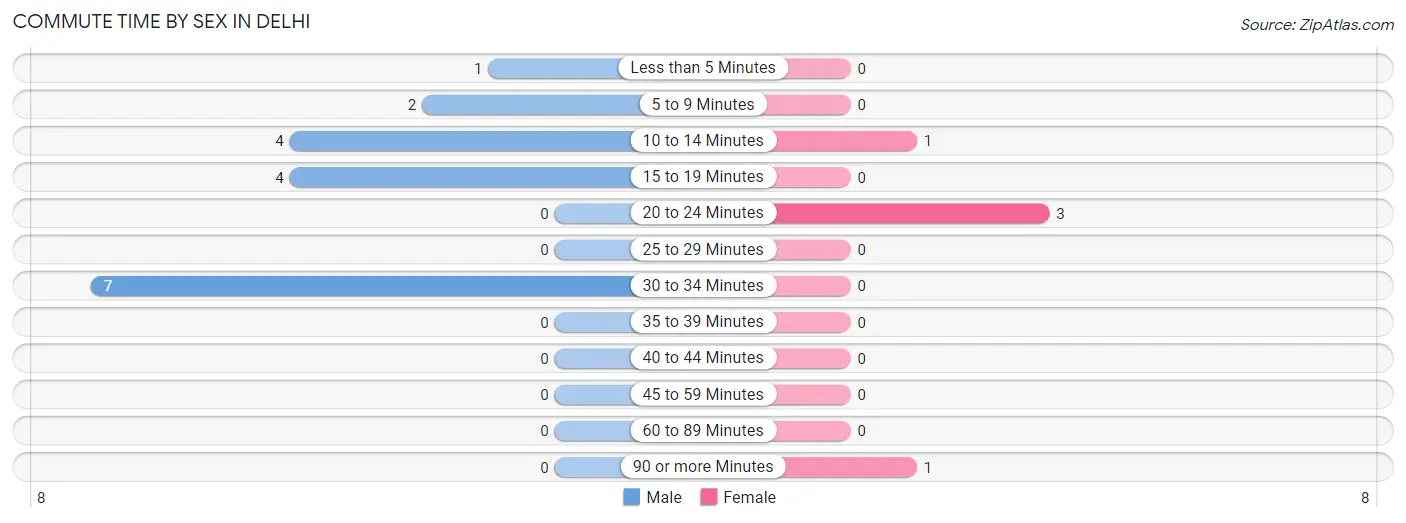
| Commute Time | Male | Female |
| Less than 5 Minutes | 1 (5.6%) | 0 (0.0%) |
| 5 to 9 Minutes | 2 (11.1%) | 0 (0.0%) |
| 10 to 14 Minutes | 4 (22.2%) | 1 (20.0%) |
| 15 to 19 Minutes | 4 (22.2%) | 0 (0.0%) |
| 20 to 24 Minutes | 0 (0.0%) | 3 (60.0%) |
| 25 to 29 Minutes | 0 (0.0%) | 0 (0.0%) |
| 30 to 34 Minutes | 7 (38.9%) | 0 (0.0%) |
| 35 to 39 Minutes | 0 (0.0%) | 0 (0.0%) |
| 40 to 44 Minutes | 0 (0.0%) | 0 (0.0%) |
| 45 to 59 Minutes | 0 (0.0%) | 0 (0.0%) |
| 60 to 89 Minutes | 0 (0.0%) | 0 (0.0%) |
| 90 or more Minutes | 0 (0.0%) | 1 (20.0%) |
Time of Departure to Work by Sex in Delhi
The most frequent times of departure to work in Delhi are 8:00 AM to 8:29 AM (8, 44.4%) for males and 6:30 AM to 6:59 AM (3, 60.0%) for females.
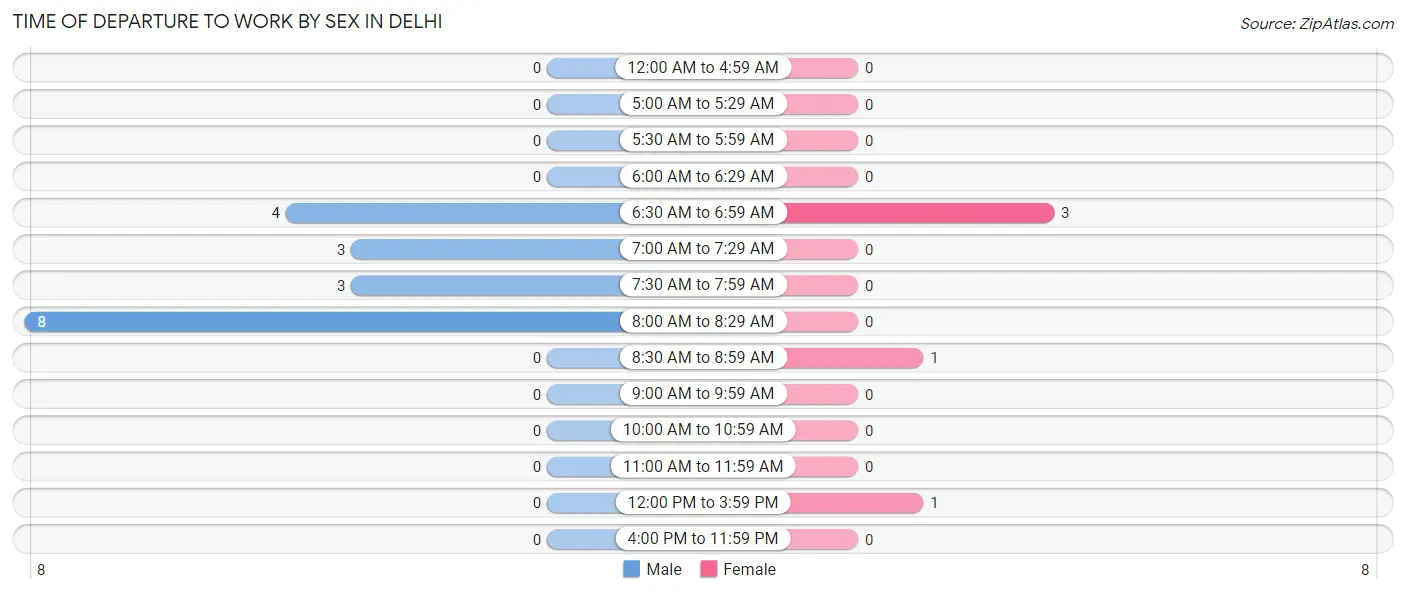
| Time of Departure | Male | Female |
| 12:00 AM to 4:59 AM | 0 (0.0%) | 0 (0.0%) |
| 5:00 AM to 5:29 AM | 0 (0.0%) | 0 (0.0%) |
| 5:30 AM to 5:59 AM | 0 (0.0%) | 0 (0.0%) |
| 6:00 AM to 6:29 AM | 0 (0.0%) | 0 (0.0%) |
| 6:30 AM to 6:59 AM | 4 (22.2%) | 3 (60.0%) |
| 7:00 AM to 7:29 AM | 3 (16.7%) | 0 (0.0%) |
| 7:30 AM to 7:59 AM | 3 (16.7%) | 0 (0.0%) |
| 8:00 AM to 8:29 AM | 8 (44.4%) | 0 (0.0%) |
| 8:30 AM to 8:59 AM | 0 (0.0%) | 1 (20.0%) |
| 9:00 AM to 9:59 AM | 0 (0.0%) | 0 (0.0%) |
| 10:00 AM to 10:59 AM | 0 (0.0%) | 0 (0.0%) |
| 11:00 AM to 11:59 AM | 0 (0.0%) | 0 (0.0%) |
| 12:00 PM to 3:59 PM | 0 (0.0%) | 1 (20.0%) |
| 4:00 PM to 11:59 PM | 0 (0.0%) | 0 (0.0%) |
| Total | 18 (100.0%) | 5 (100.0%) |
Housing Occupancy in Delhi
Occupancy by Ownership in Delhi
Of the total 22 dwellings in Delhi, owner-occupied units account for 21 (95.5%), while renter-occupied units make up 1 (4.5%).
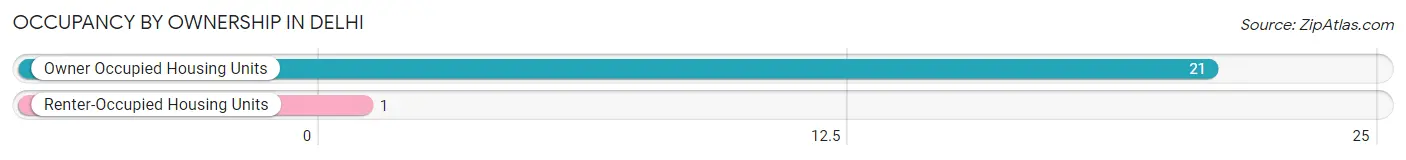
| Occupancy | # Housing Units | % Housing Units |
| Owner Occupied Housing Units | 21 | 95.5% |
| Renter-Occupied Housing Units | 1 | 4.5% |
| Total Occupied Housing Units | 22 | 100.0% |
Occupancy by Household Size in Delhi
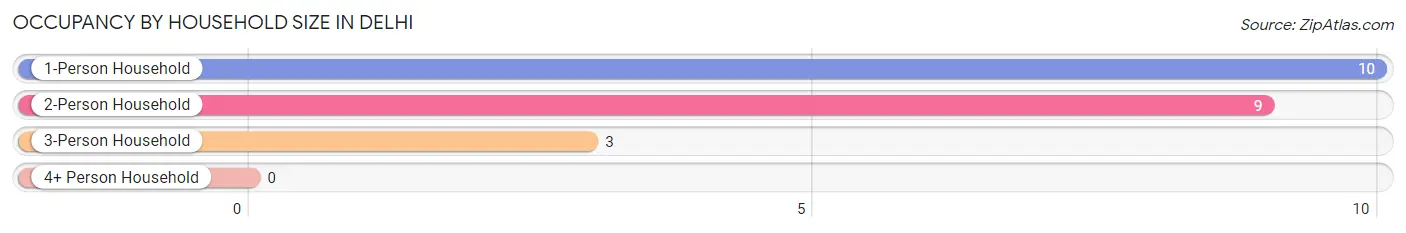
| Household Size | # Housing Units | % Housing Units |
| 1-Person Household | 10 | 45.5% |
| 2-Person Household | 9 | 40.9% |
| 3-Person Household | 3 | 13.6% |
| 4+ Person Household | 0 | 0.0% |
| Total Housing Units | 22 | 100.0% |
Occupancy by Ownership by Household Size in Delhi
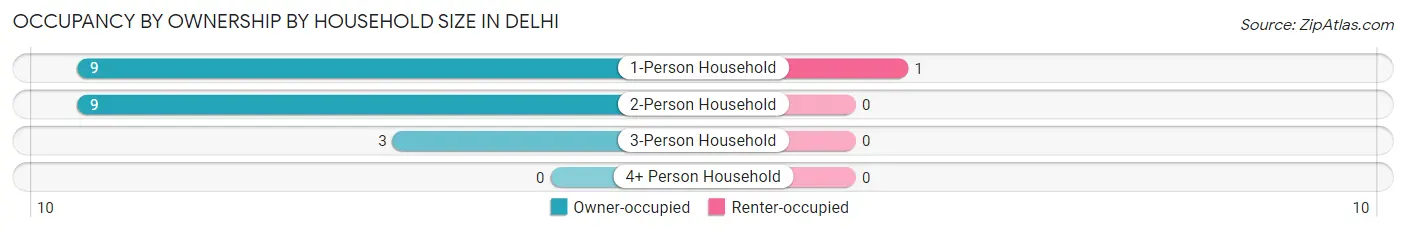
| Household Size | Owner-occupied | Renter-occupied |
| 1-Person Household | 9 (90.0%) | 1 (10.0%) |
| 2-Person Household | 9 (100.0%) | 0 (0.0%) |
| 3-Person Household | 3 (100.0%) | 0 (0.0%) |
| 4+ Person Household | 0 (0.0%) | 0 (0.0%) |
| Total Housing Units | 21 (95.5%) | 1 (4.5%) |
Occupancy by Educational Attainment in Delhi
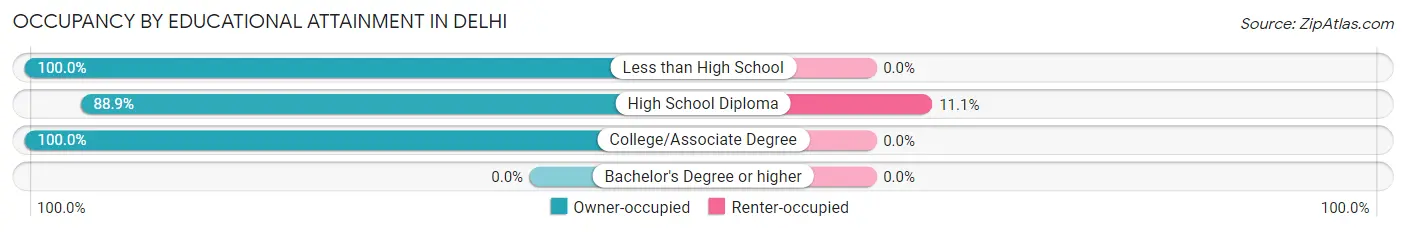
| Household Size | Owner-occupied | Renter-occupied |
| Less than High School | 4 (100.0%) | 0 (0.0%) |
| High School Diploma | 8 (88.9%) | 1 (11.1%) |
| College/Associate Degree | 9 (100.0%) | 0 (0.0%) |
| Bachelor's Degree or higher | 0 (0.0%) | 0 (0.0%) |
Occupancy by Age of Householder in Delhi
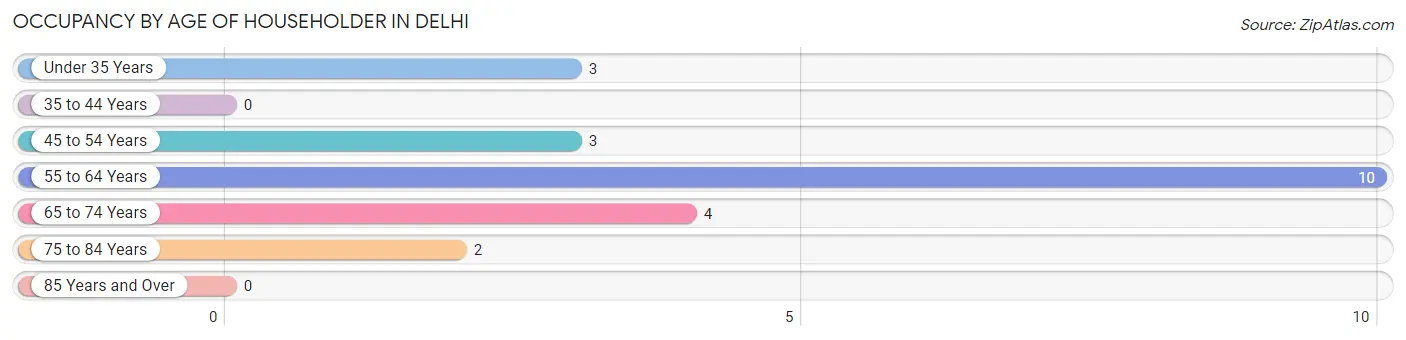
| Age Bracket | # Households | % Households |
| Under 35 Years | 3 | 13.6% |
| 35 to 44 Years | 0 | 0.0% |
| 45 to 54 Years | 3 | 13.6% |
| 55 to 64 Years | 10 | 45.5% |
| 65 to 74 Years | 4 | 18.2% |
| 75 to 84 Years | 2 | 9.1% |
| 85 Years and Over | 0 | 0.0% |
| Total | 22 | 100.0% |
Housing Finances in Delhi
Median Income by Occupancy in Delhi
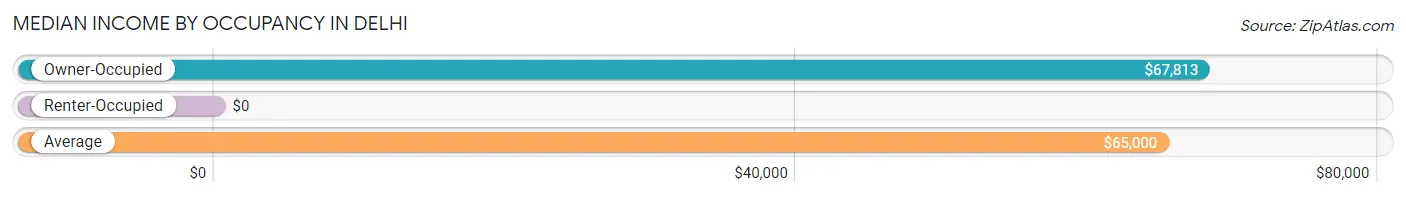
| Occupancy Type | # Households | Median Income |
| Owner-Occupied | 21 (95.5%) | $67,813 |
| Renter-Occupied | 1 (4.5%) | $0 |
| Average | 22 (100.0%) | $65,000 |
Occupancy by Householder Income Bracket in Delhi
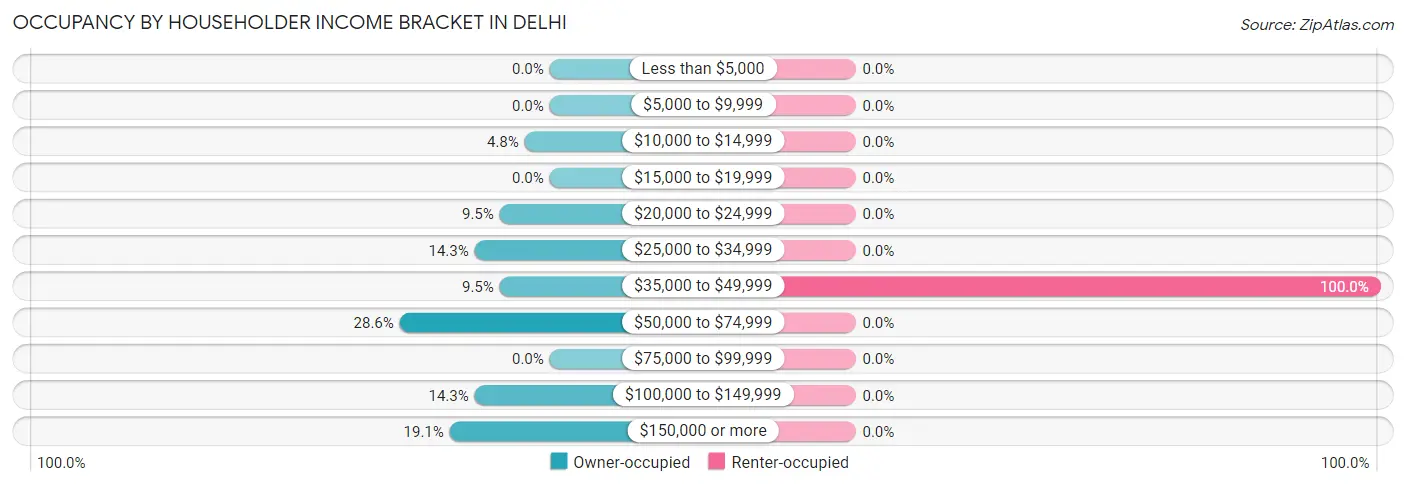
| Income Bracket | Owner-occupied | Renter-occupied |
| Less than $5,000 | 0 (0.0%) | 0 (0.0%) |
| $5,000 to $9,999 | 0 (0.0%) | 0 (0.0%) |
| $10,000 to $14,999 | 1 (4.8%) | 0 (0.0%) |
| $15,000 to $19,999 | 0 (0.0%) | 0 (0.0%) |
| $20,000 to $24,999 | 2 (9.5%) | 0 (0.0%) |
| $25,000 to $34,999 | 3 (14.3%) | 0 (0.0%) |
| $35,000 to $49,999 | 2 (9.5%) | 1 (100.0%) |
| $50,000 to $74,999 | 6 (28.6%) | 0 (0.0%) |
| $75,000 to $99,999 | 0 (0.0%) | 0 (0.0%) |
| $100,000 to $149,999 | 3 (14.3%) | 0 (0.0%) |
| $150,000 or more | 4 (19.1%) | 0 (0.0%) |
| Total | 21 (100.0%) | 1 (100.0%) |
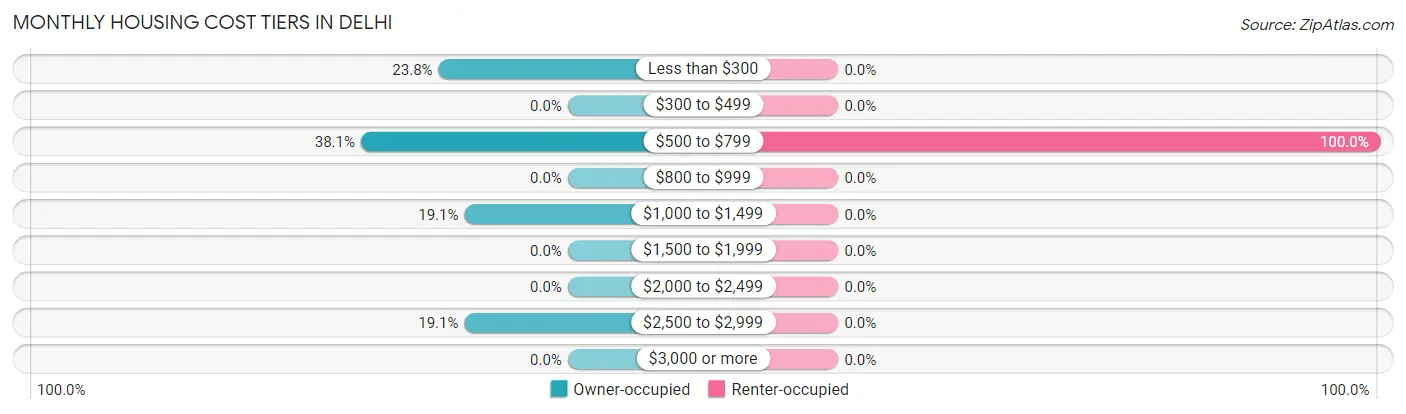
Monthly Housing Cost Tiers in Delhi
| Monthly Cost | Owner-occupied | Renter-occupied |
| Less than $300 | 5 (23.8%) | 0 (0.0%) |
| $300 to $499 | 0 (0.0%) | 0 (0.0%) |
| $500 to $799 | 8 (38.1%) | 1 (100.0%) |
| $800 to $999 | 0 (0.0%) | 0 (0.0%) |
| $1,000 to $1,499 | 4 (19.1%) | 0 (0.0%) |
| $1,500 to $1,999 | 0 (0.0%) | 0 (0.0%) |
| $2,000 to $2,499 | 0 (0.0%) | 0 (0.0%) |
| $2,500 to $2,999 | 4 (19.1%) | 0 (0.0%) |
| $3,000 or more | 0 (0.0%) | 0 (0.0%) |
| Total | 21 (100.0%) | 1 (100.0%) |
Physical Housing Characteristics in Delhi
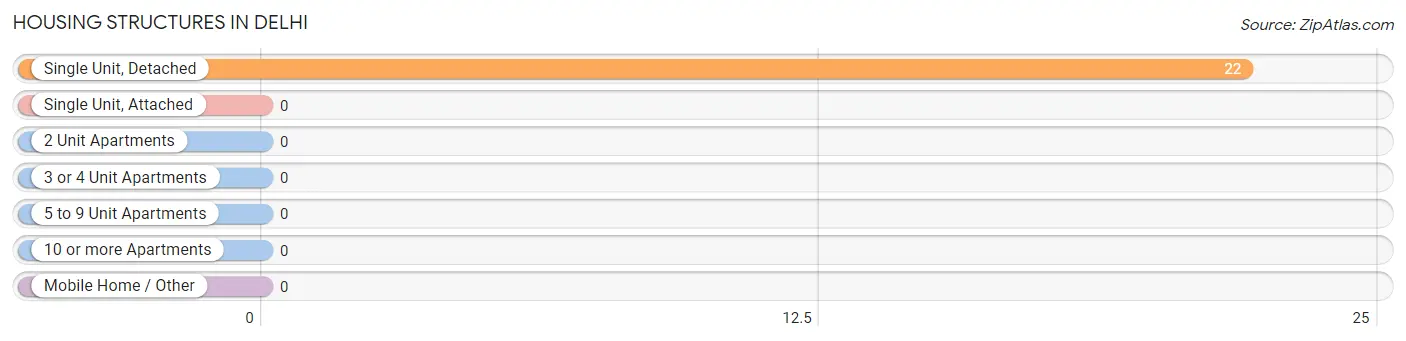
Housing Structures in Delhi
| Structure Type | # Housing Units | % Housing Units |
| Single Unit, Detached | 22 | 100.0% |
| Single Unit, Attached | 0 | 0.0% |
| 2 Unit Apartments | 0 | 0.0% |
| 3 or 4 Unit Apartments | 0 | 0.0% |
| 5 to 9 Unit Apartments | 0 | 0.0% |
| 10 or more Apartments | 0 | 0.0% |
| Mobile Home / Other | 0 | 0.0% |
| Total | 22 | 100.0% |
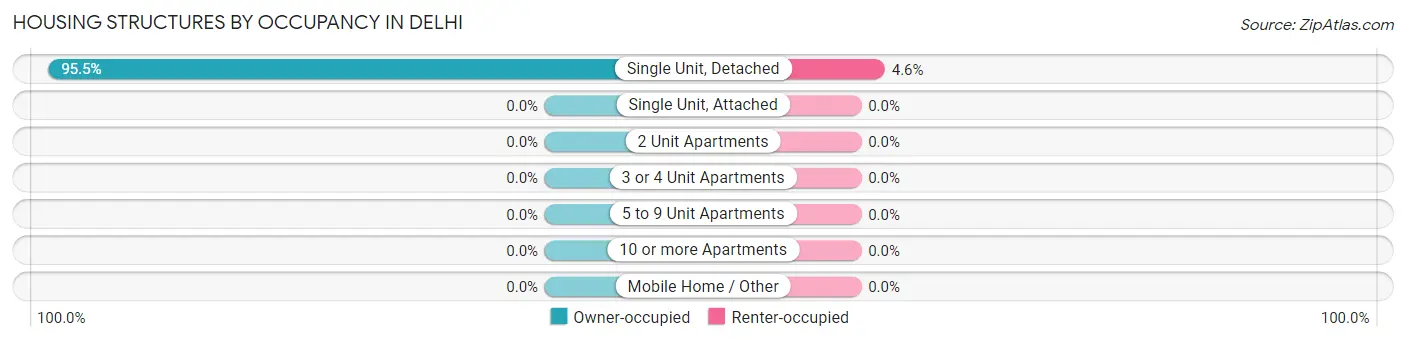
Housing Structures by Occupancy in Delhi
| Structure Type | Owner-occupied | Renter-occupied |
| Single Unit, Detached | 21 (95.5%) | 1 (4.5%) |
| Single Unit, Attached | 0 (0.0%) | 0 (0.0%) |
| 2 Unit Apartments | 0 (0.0%) | 0 (0.0%) |
| 3 or 4 Unit Apartments | 0 (0.0%) | 0 (0.0%) |
| 5 to 9 Unit Apartments | 0 (0.0%) | 0 (0.0%) |
| 10 or more Apartments | 0 (0.0%) | 0 (0.0%) |
| Mobile Home / Other | 0 (0.0%) | 0 (0.0%) |
| Total | 21 (95.5%) | 1 (4.5%) |
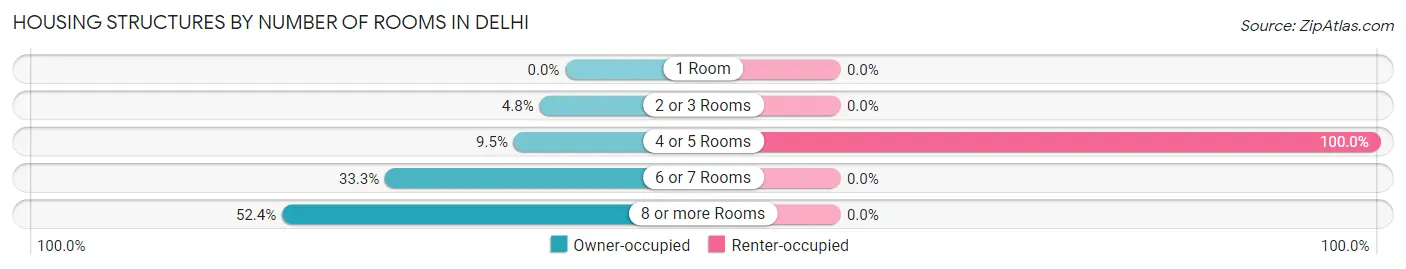
Housing Structures by Number of Rooms in Delhi
| Number of Rooms | Owner-occupied | Renter-occupied |
| 1 Room | 0 (0.0%) | 0 (0.0%) |
| 2 or 3 Rooms | 1 (4.8%) | 0 (0.0%) |
| 4 or 5 Rooms | 2 (9.5%) | 1 (100.0%) |
| 6 or 7 Rooms | 7 (33.3%) | 0 (0.0%) |
| 8 or more Rooms | 11 (52.4%) | 0 (0.0%) |
| Total | 21 (100.0%) | 1 (100.0%) |
Housing Structure by Heating Type in Delhi
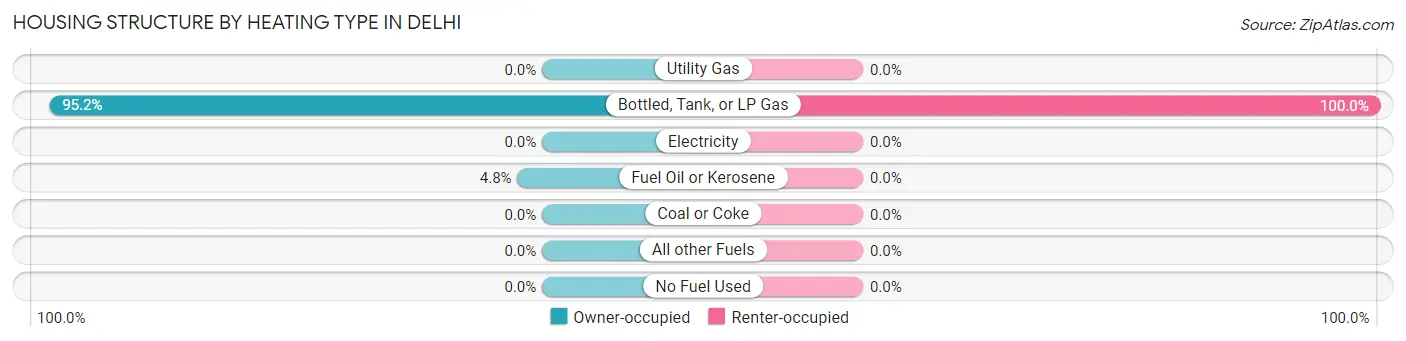
| Heating Type | Owner-occupied | Renter-occupied |
| Utility Gas | 0 (0.0%) | 0 (0.0%) |
| Bottled, Tank, or LP Gas | 20 (95.2%) | 1 (100.0%) |
| Electricity | 0 (0.0%) | 0 (0.0%) |
| Fuel Oil or Kerosene | 1 (4.8%) | 0 (0.0%) |
| Coal or Coke | 0 (0.0%) | 0 (0.0%) |
| All other Fuels | 0 (0.0%) | 0 (0.0%) |
| No Fuel Used | 0 (0.0%) | 0 (0.0%) |
| Total | 21 (100.0%) | 1 (100.0%) |
Household Vehicle Usage in Delhi
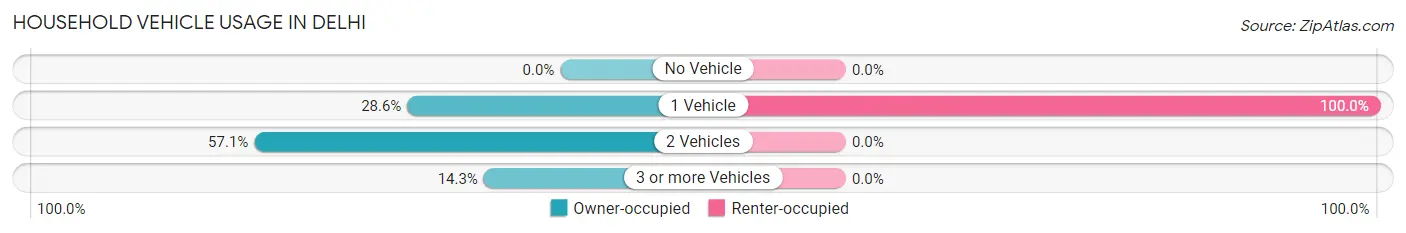
| Vehicles per Household | Owner-occupied | Renter-occupied |
| No Vehicle | 0 (0.0%) | 0 (0.0%) |
| 1 Vehicle | 6 (28.6%) | 1 (100.0%) |
| 2 Vehicles | 12 (57.1%) | 0 (0.0%) |
| 3 or more Vehicles | 3 (14.3%) | 0 (0.0%) |
| Total | 21 (100.0%) | 1 (100.0%) |
Real Estate & Mortgages in Delhi
Real Estate and Mortgage Overview in Delhi
| Characteristic | Without Mortgage | With Mortgage |
| Housing Units | 13 | 8 |
| Median Property Value | - | - |
| Median Household Income | - | - |
| Monthly Housing Costs | $550 | $0 |
| Real Estate Taxes | $270 | $0 |
Property Value by Mortgage Status in Delhi
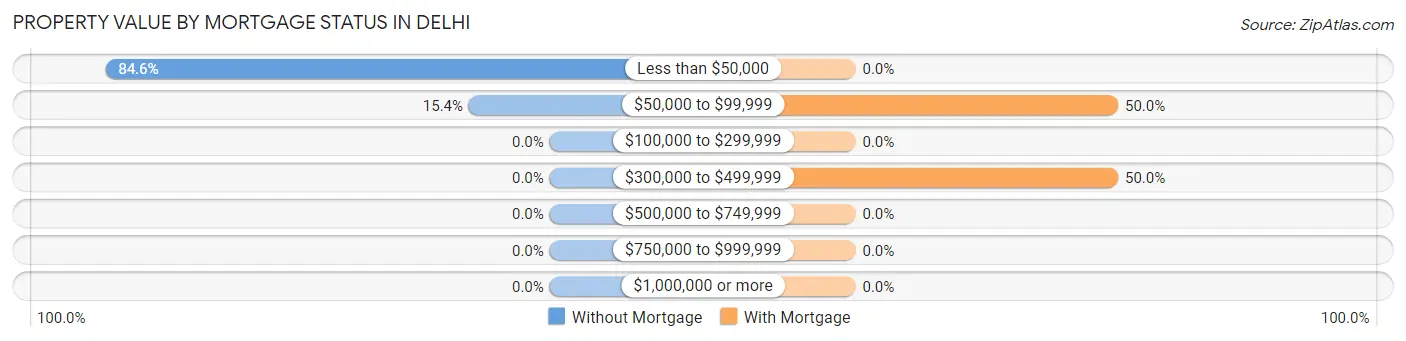
| Property Value | Without Mortgage | With Mortgage |
| Less than $50,000 | 11 (84.6%) | 0 (0.0%) |
| $50,000 to $99,999 | 2 (15.4%) | 4 (50.0%) |
| $100,000 to $299,999 | 0 (0.0%) | 0 (0.0%) |
| $300,000 to $499,999 | 0 (0.0%) | 4 (50.0%) |
| $500,000 to $749,999 | 0 (0.0%) | 0 (0.0%) |
| $750,000 to $999,999 | 0 (0.0%) | 0 (0.0%) |
| $1,000,000 or more | 0 (0.0%) | 0 (0.0%) |
| Total | 13 (100.0%) | 8 (100.0%) |
Household Income by Mortgage Status in Delhi
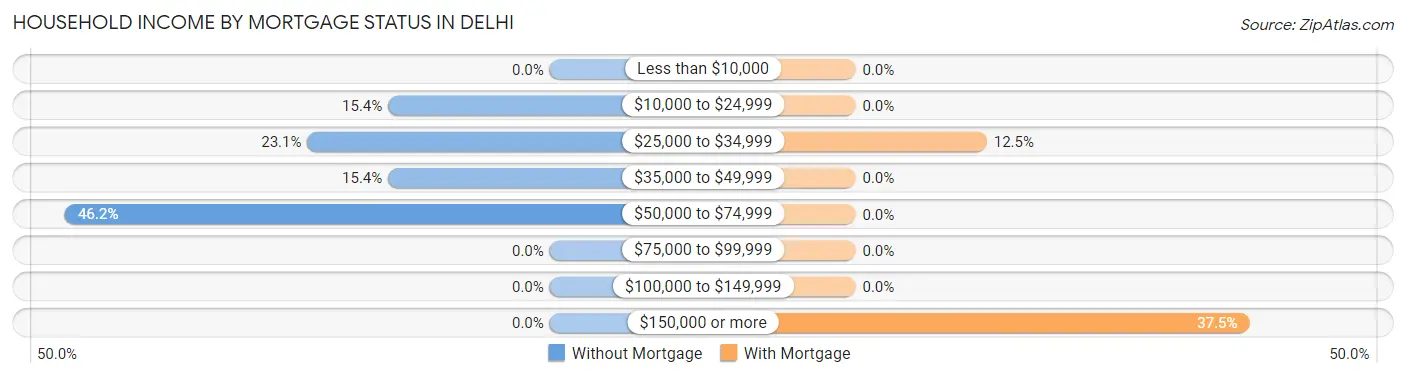
| Household Income | Without Mortgage | With Mortgage |
| Less than $10,000 | 0 (0.0%) | 0 (0.0%) |
| $10,000 to $24,999 | 2 (15.4%) | 0 (0.0%) |
| $25,000 to $34,999 | 3 (23.1%) | 1 (12.5%) |
| $35,000 to $49,999 | 2 (15.4%) | 0 (0.0%) |
| $50,000 to $74,999 | 6 (46.2%) | 0 (0.0%) |
| $75,000 to $99,999 | 0 (0.0%) | 0 (0.0%) |
| $100,000 to $149,999 | 0 (0.0%) | 0 (0.0%) |
| $150,000 or more | 0 (0.0%) | 3 (37.5%) |
| Total | 13 (100.0%) | 8 (100.0%) |
Property Value to Household Income Ratio in Delhi
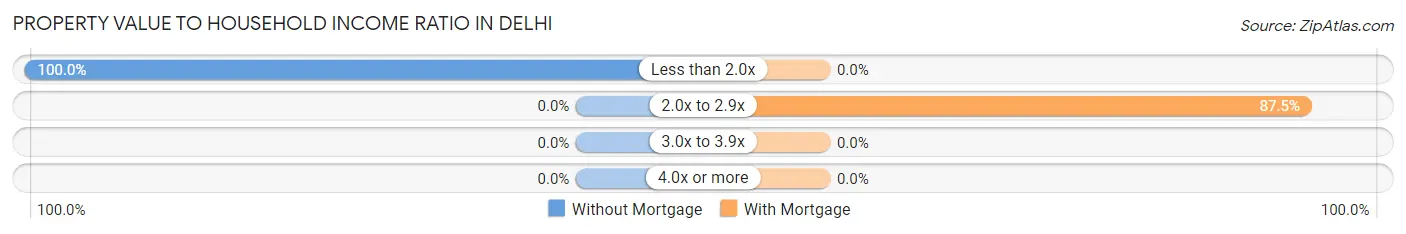
| Value-to-Income Ratio | Without Mortgage | With Mortgage |
| Less than 2.0x | 13 (100.0%) | 0 (0.0%) |
| 2.0x to 2.9x | 0 (0.0%) | 7 (87.5%) |
| 3.0x to 3.9x | 0 (0.0%) | 0 (0.0%) |
| 4.0x or more | 0 (0.0%) | 0 (0.0%) |
| Total | 13 (100.0%) | 8 (100.0%) |
Real Estate Taxes by Mortgage Status in Delhi
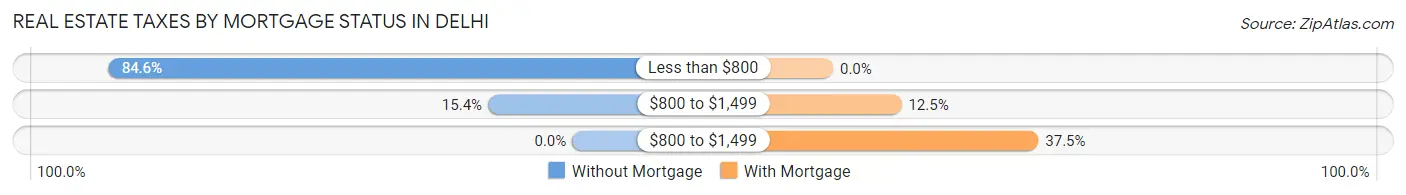
| Property Taxes | Without Mortgage | With Mortgage |
| Less than $800 | 11 (84.6%) | 0 (0.0%) |
| $800 to $1,499 | 2 (15.4%) | 1 (12.5%) |
| $800 to $1,499 | 0 (0.0%) | 3 (37.5%) |
| Total | 13 (100.0%) | 8 (100.0%) |
Health & Disability in Delhi
Health Insurance Coverage by Age in Delhi
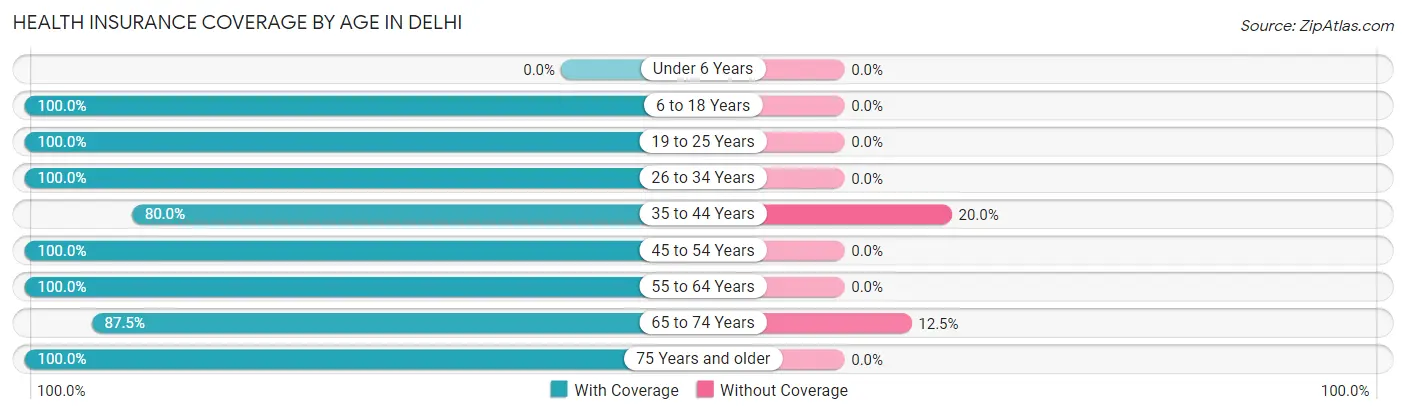
| Age Bracket | With Coverage | Without Coverage |
| Under 6 Years | 0 (0.0%) | 0 (0.0%) |
| 6 to 18 Years | 3 (100.0%) | 0 (0.0%) |
| 19 to 25 Years | 1 (100.0%) | 0 (0.0%) |
| 26 to 34 Years | 2 (100.0%) | 0 (0.0%) |
| 35 to 44 Years | 4 (80.0%) | 1 (20.0%) |
| 45 to 54 Years | 3 (100.0%) | 0 (0.0%) |
| 55 to 64 Years | 14 (100.0%) | 0 (0.0%) |
| 65 to 74 Years | 7 (87.5%) | 1 (12.5%) |
| 75 Years and older | 2 (100.0%) | 0 (0.0%) |
| Total | 36 (94.7%) | 2 (5.3%) |
Health Insurance Coverage by Citizenship Status in Delhi
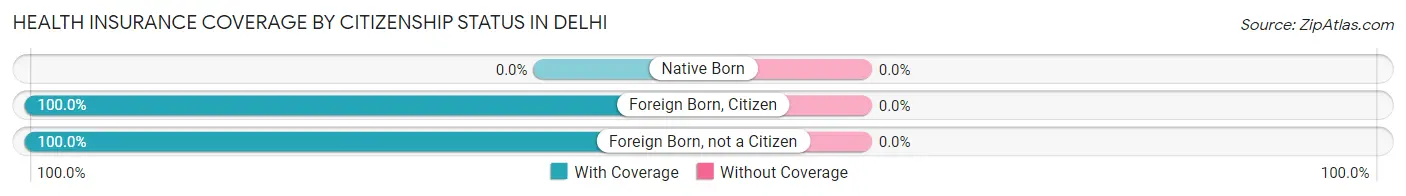
| Citizenship Status | With Coverage | Without Coverage |
| Native Born | 0 (0.0%) | 0 (0.0%) |
| Foreign Born, Citizen | 3 (100.0%) | 0 (0.0%) |
| Foreign Born, not a Citizen | 1 (100.0%) | 0 (0.0%) |
Health Insurance Coverage by Household Income in Delhi
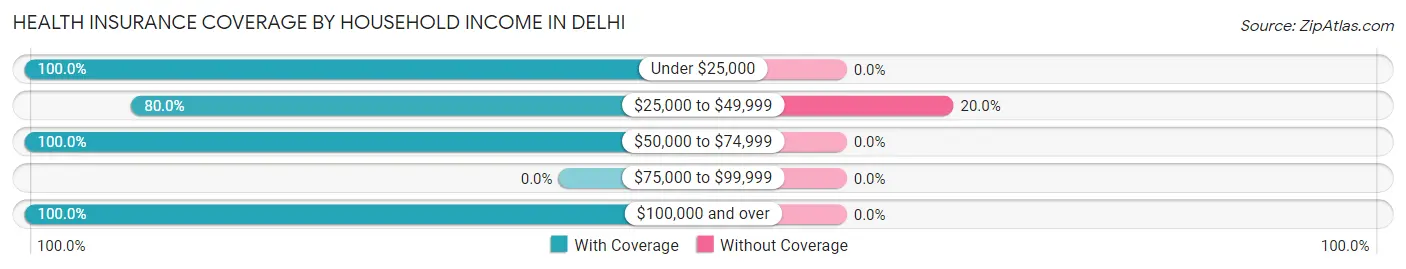
| Household Income | With Coverage | Without Coverage |
| Under $25,000 | 3 (100.0%) | 0 (0.0%) |
| $25,000 to $49,999 | 8 (80.0%) | 2 (20.0%) |
| $50,000 to $74,999 | 7 (100.0%) | 0 (0.0%) |
| $75,000 to $99,999 | 0 (0.0%) | 0 (0.0%) |
| $100,000 and over | 18 (100.0%) | 0 (0.0%) |
Public vs Private Health Insurance Coverage by Age in Delhi
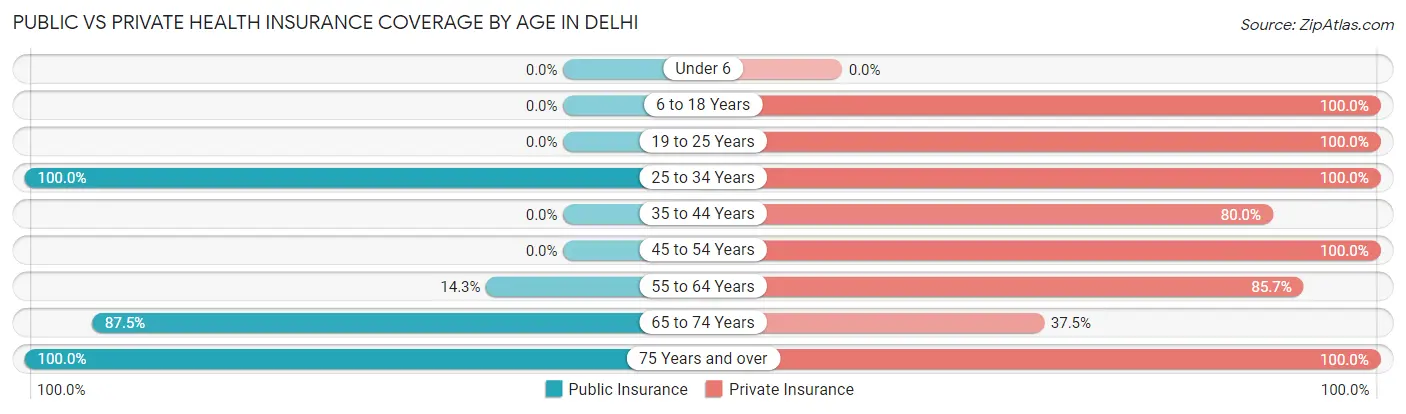
| Age Bracket | Public Insurance | Private Insurance |
| Under 6 | 0 (0.0%) | 0 (0.0%) |
| 6 to 18 Years | 0 (0.0%) | 3 (100.0%) |
| 19 to 25 Years | 0 (0.0%) | 1 (100.0%) |
| 25 to 34 Years | 2 (100.0%) | 2 (100.0%) |
| 35 to 44 Years | 0 (0.0%) | 4 (80.0%) |
| 45 to 54 Years | 0 (0.0%) | 3 (100.0%) |
| 55 to 64 Years | 2 (14.3%) | 12 (85.7%) |
| 65 to 74 Years | 7 (87.5%) | 3 (37.5%) |
| 75 Years and over | 2 (100.0%) | 2 (100.0%) |
| Total | 13 (34.2%) | 30 (78.9%) |
Disability Status by Sex by Age in Delhi
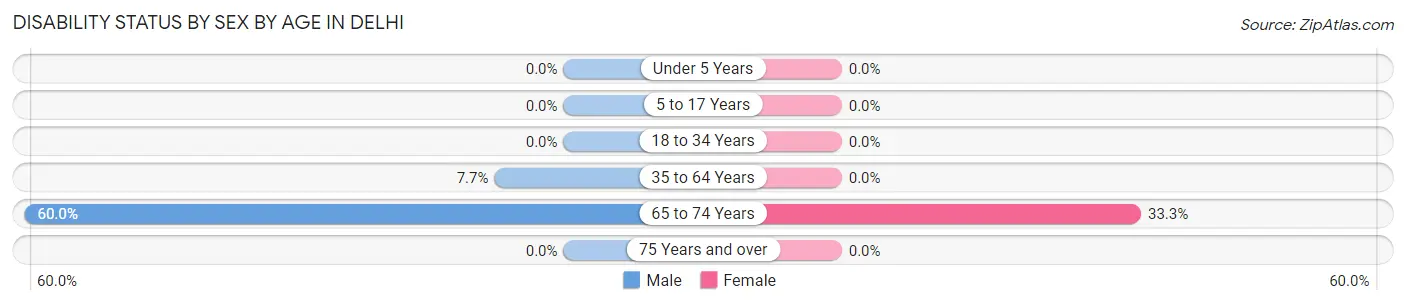
| Age Bracket | Male | Female |
| Under 5 Years | 0 (0.0%) | 0 (0.0%) |
| 5 to 17 Years | 0 (0.0%) | 0 (0.0%) |
| 18 to 34 Years | 0 (0.0%) | 0 (0.0%) |
| 35 to 64 Years | 1 (7.7%) | 0 (0.0%) |
| 65 to 74 Years | 3 (60.0%) | 1 (33.3%) |
| 75 Years and over | 0 (0.0%) | 0 (0.0%) |
Disability Class by Sex by Age in Delhi
Disability Class: Hearing Difficulty
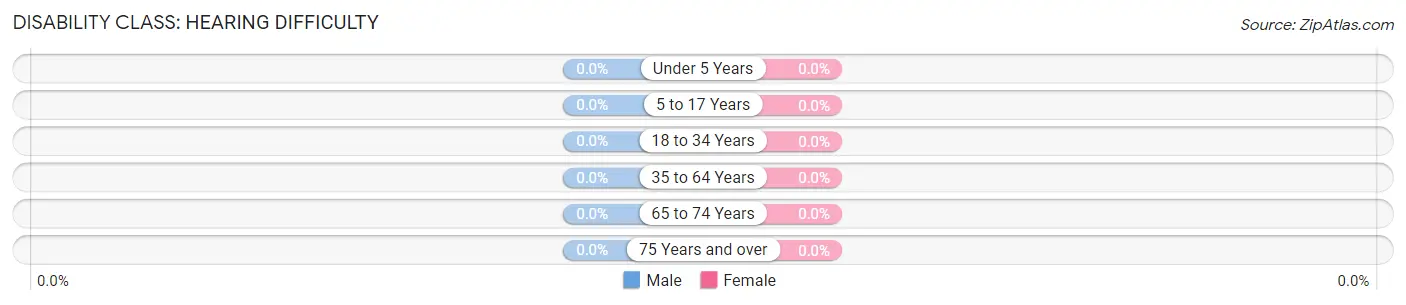
| Age Bracket | Male | Female |
| Under 5 Years | 0 (0.0%) | 0 (0.0%) |
| 5 to 17 Years | 0 (0.0%) | 0 (0.0%) |
| 18 to 34 Years | 0 (0.0%) | 0 (0.0%) |
| 35 to 64 Years | 0 (0.0%) | 0 (0.0%) |
| 65 to 74 Years | 0 (0.0%) | 0 (0.0%) |
| 75 Years and over | 0 (0.0%) | 0 (0.0%) |
Disability Class: Vision Difficulty
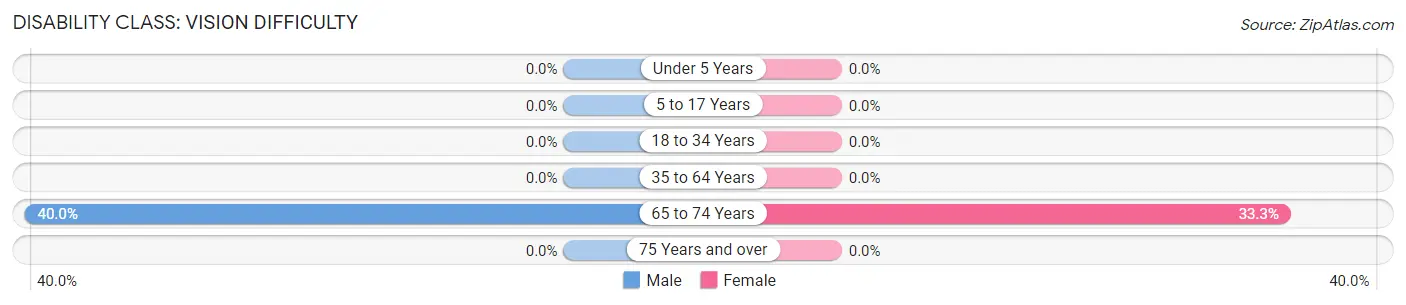
| Age Bracket | Male | Female |
| Under 5 Years | 0 (0.0%) | 0 (0.0%) |
| 5 to 17 Years | 0 (0.0%) | 0 (0.0%) |
| 18 to 34 Years | 0 (0.0%) | 0 (0.0%) |
| 35 to 64 Years | 0 (0.0%) | 0 (0.0%) |
| 65 to 74 Years | 2 (40.0%) | 1 (33.3%) |
| 75 Years and over | 0 (0.0%) | 0 (0.0%) |
Disability Class: Cognitive Difficulty
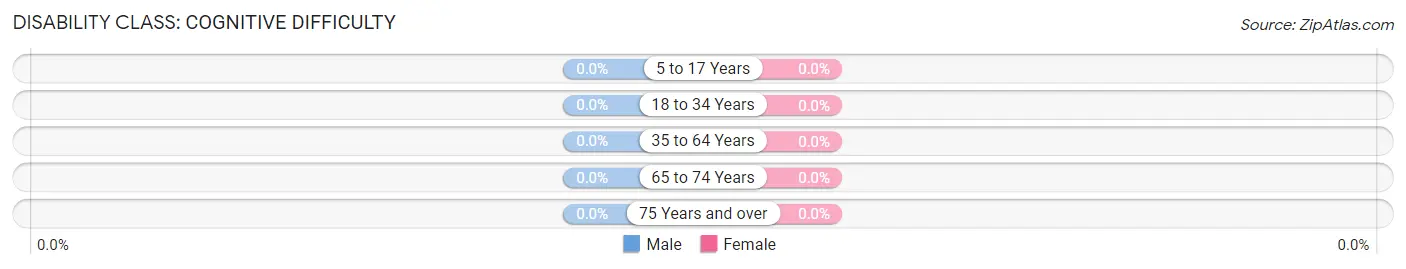
| Age Bracket | Male | Female |
| 5 to 17 Years | 0 (0.0%) | 0 (0.0%) |
| 18 to 34 Years | 0 (0.0%) | 0 (0.0%) |
| 35 to 64 Years | 0 (0.0%) | 0 (0.0%) |
| 65 to 74 Years | 0 (0.0%) | 0 (0.0%) |
| 75 Years and over | 0 (0.0%) | 0 (0.0%) |
Disability Class: Ambulatory Difficulty
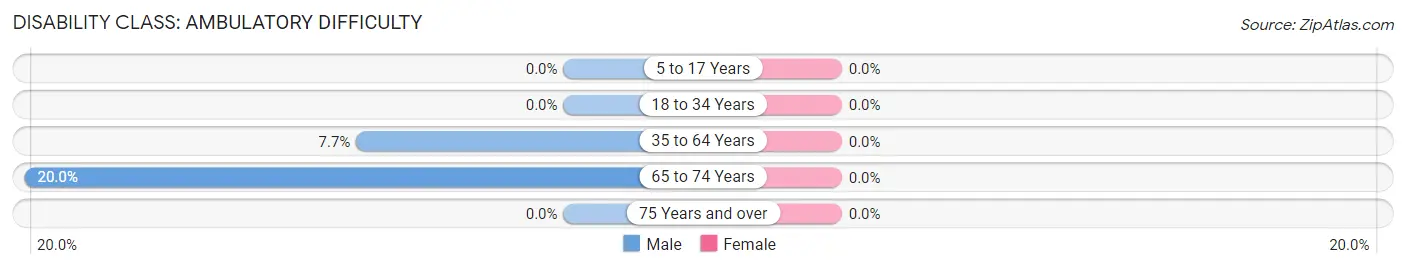
| Age Bracket | Male | Female |
| 5 to 17 Years | 0 (0.0%) | 0 (0.0%) |
| 18 to 34 Years | 0 (0.0%) | 0 (0.0%) |
| 35 to 64 Years | 1 (7.7%) | 0 (0.0%) |
| 65 to 74 Years | 1 (20.0%) | 0 (0.0%) |
| 75 Years and over | 0 (0.0%) | 0 (0.0%) |
Disability Class: Self-Care Difficulty
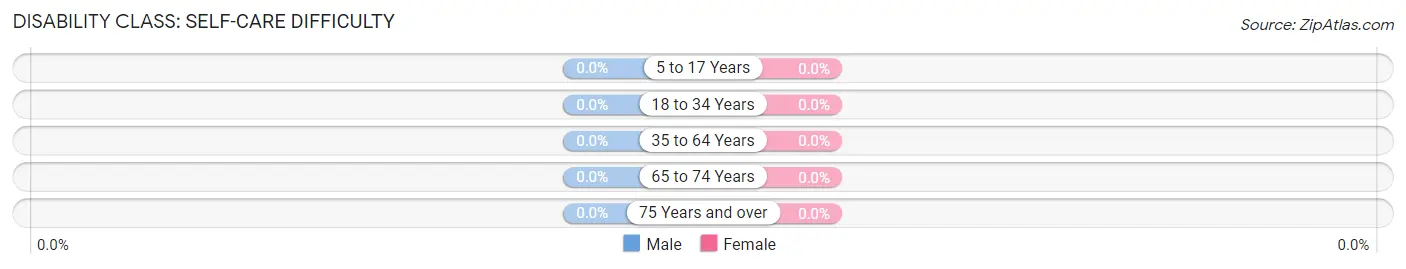
| Age Bracket | Male | Female |
| 5 to 17 Years | 0 (0.0%) | 0 (0.0%) |
| 18 to 34 Years | 0 (0.0%) | 0 (0.0%) |
| 35 to 64 Years | 0 (0.0%) | 0 (0.0%) |
| 65 to 74 Years | 0 (0.0%) | 0 (0.0%) |
| 75 Years and over | 0 (0.0%) | 0 (0.0%) |
Technology Access in Delhi
Computing Device Access in Delhi
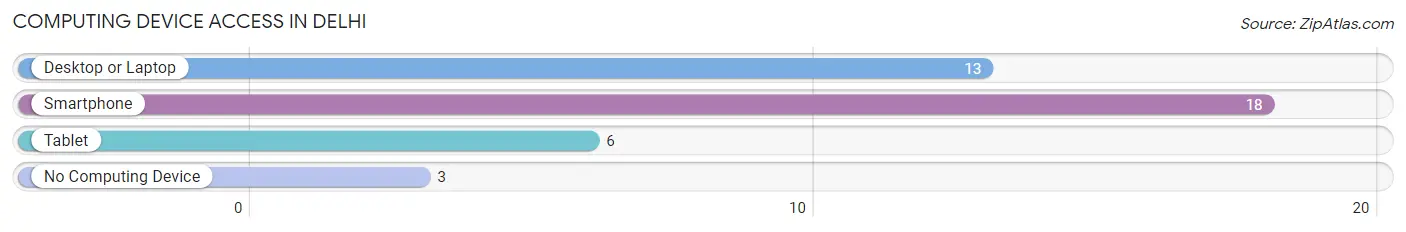
| Device Type | # Households | % Households |
| Desktop or Laptop | 13 | 59.1% |
| Smartphone | 18 | 81.8% |
| Tablet | 6 | 27.3% |
| No Computing Device | 3 | 13.6% |
| Total | 22 | 100.0% |
Internet Access in Delhi
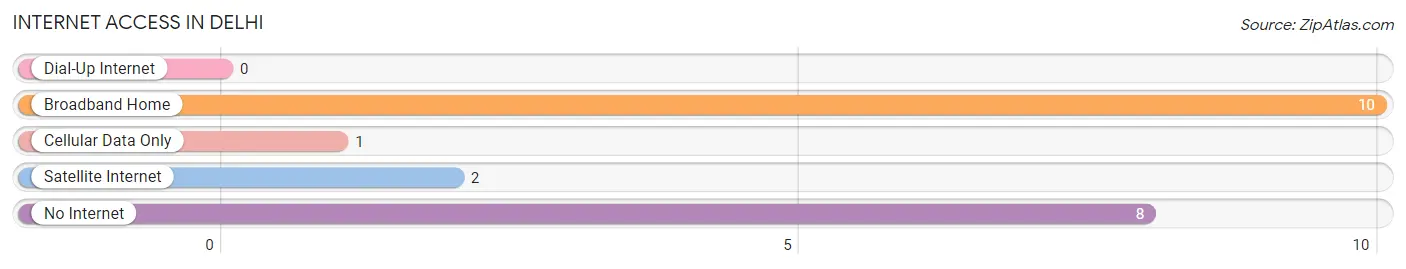
| Internet Type | # Households | % Households |
| Dial-Up Internet | 0 | 0.0% |
| Broadband Home | 10 | 45.5% |
| Cellular Data Only | 1 | 4.5% |
| Satellite Internet | 2 | 9.1% |
| No Internet | 8 | 36.4% |
| Total | 22 | 100.0% |
Delhi Summary
Delhi is a small city located in the state of Minnesota, United States. It is situated in the southeastern part of the state, in the county of Renville. The city is located on the banks of the Minnesota River, and is part of the Twin Cities metropolitan area. The population of Delhi was estimated to be 1,845 in 2019.
Geography
Delhi is located at the intersection of Minnesota State Highways 4 and 19. It is situated in the southeastern part of the state, in the county of Renville. The city is located on the banks of the Minnesota River, and is part of the Twin Cities metropolitan area. The city has a total area of 1.2 square miles, all of which is land. The elevation of Delhi is 1,072 feet above sea level.
Climate
Delhi has a humid continental climate, with cold winters and hot summers. The average annual temperature is 43.2°F, with an average high of 57.2°F in July and an average low of 28.2°F in January. The average annual precipitation is 28.3 inches, with an average of 2.7 inches of snowfall per year.
Demographics
As of the 2010 census, the population of Delhi was 1,845. The racial makeup of the city was 94.2% White, 0.3% African American, 0.2% Native American, 0.2% Asian, 0.1% Pacific Islander, 3.3% from other races, and 1.7% from two or more races. Hispanic or Latino of any race were 5.2% of the population.
Economy
The economy of Delhi is largely based on agriculture. The city is home to several farms, as well as a number of small businesses. The city is also home to a number of manufacturing companies, including a plastics manufacturer and a metal fabrication company.
Education
Delhi is served by the Renville County West School District. The district operates one elementary school, one middle school, and one high school. The city is also home to a number of private schools, including a Catholic school and a Lutheran school.
Transportation
Delhi is served by Minnesota State Highways 4 and 19. The city is also served by a number of local bus routes. The nearest airport is the Minneapolis-St. Paul International Airport, located about 50 miles away.
Culture
Delhi is home to a number of cultural attractions, including the Renville County Historical Society Museum, the Renville County Fairgrounds, and the Delhi Community Center. The city also hosts a number of annual events, including the Delhi Days Festival and the Delhi Car Show.
Delhi is a small city with a rich history and a vibrant culture. The city is home to a number of farms and businesses, as well as a number of educational and cultural attractions. The city is served by a number of highways and local bus routes, and is located close to the Minneapolis-St. Paul International Airport. Delhi is a great place to live, work, and visit.
Common Questions
What is the Total Population of Delhi?
Total Population of Delhi is 38.
What is the Total Male Population of Delhi?
Total Male Population of Delhi is 26.
What is the Total Female Population of Delhi?
Total Female Population of Delhi is 12.
What is the Ratio of Males per 100 Females in Delhi?
There are 216.67 Males per 100 Females in Delhi.
What is the Ratio of Females per 100 Males in Delhi?
There are 46.15 Females per 100 Males in Delhi.
What is the Median Population Age in Delhi?
Median Population Age in Delhi is 57.4 Years.
What is the Average Family Size in Delhi
Average Family Size in Delhi is 2.3 People.
What is the Average Household Size in Delhi
Average Household Size in Delhi is 1.7 People.
What is Per Capita Income in Delhi?
Per Capita income in Delhi is $52,905.
What is the Median Household income in Delhi?
Median Household Income in Delhi is $65,000.
What is Income or Wage Gap in Delhi?
Income or Wage Gap in Delhi is 67.3%.
Women in Delhi earn 32.7 cents for every dollar earned by a man.
What is Inequality or Gini Index in Delhi?
Inequality or Gini Index in Delhi is 0.43.
How Large is the Labor Force in Delhi?
There are 25 People in the Labor Forcein in Delhi.
What is the Percentage of People in the Labor Force in Delhi?
65.8% of People are in the Labor Force in Delhi.
What is the Unemployment Rate in Delhi?
Unemployment Rate in Delhi is 4.0%.