Palm Harbor, FL
Palm Harbor Map
Palm Harbor Overview
61,589
TOTAL POPULATION
28,956
MALE POPULATION
32,633
FEMALE POPULATION
88.73
MALES / 100 FEMALES
112.70
FEMALES / 100 MALES
50.8
MEDIAN AGE
2.9
AVG FAMILY SIZE
2.3
AVG HOUSEHOLD SIZE
$44,016
PER CAPITA INCOME
$95,367
AVG FAMILY INCOME
$70,493
AVG HOUSEHOLD INCOME
26.3%
WAGE / INCOME GAP [ % ]
73.7¢/ $1
WAGE / INCOME GAP [ $ ]
$8,919
FAMILY INCOME DEFICIT
0.47
INEQUALITY / GINI INDEX
30,564
LABOR FORCE [ PEOPLE ]
58.1%
PERCENT IN LABOR FORCE
2.9%
UNEMPLOYMENT RATE
Palm Harbor Area Codes
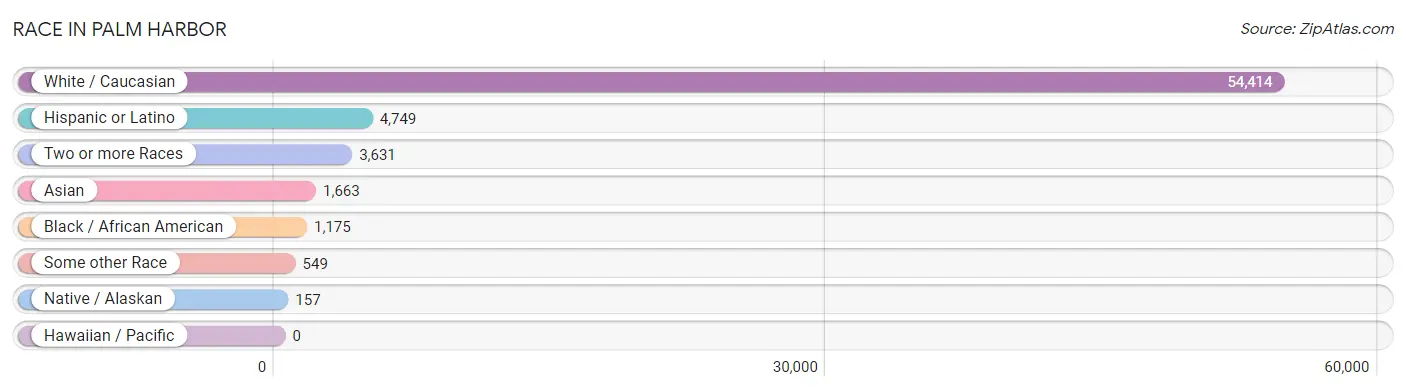
Race in Palm Harbor
The most populous races in Palm Harbor are White / Caucasian (54,414 | 88.3%), Hispanic or Latino (4,749 | 7.7%), and Two or more Races (3,631 | 5.9%).
| Race | # Population | % Population |
| Asian | 1,663 | 2.7% |
| Black / African American | 1,175 | 1.9% |
| Hawaiian / Pacific | 0 | 0.0% |
| Hispanic or Latino | 4,749 | 7.7% |
| Native / Alaskan | 157 | 0.3% |
| White / Caucasian | 54,414 | 88.3% |
| Two or more Races | 3,631 | 5.9% |
| Some other Race | 549 | 0.9% |
| Total | 61,589 | 100.0% |
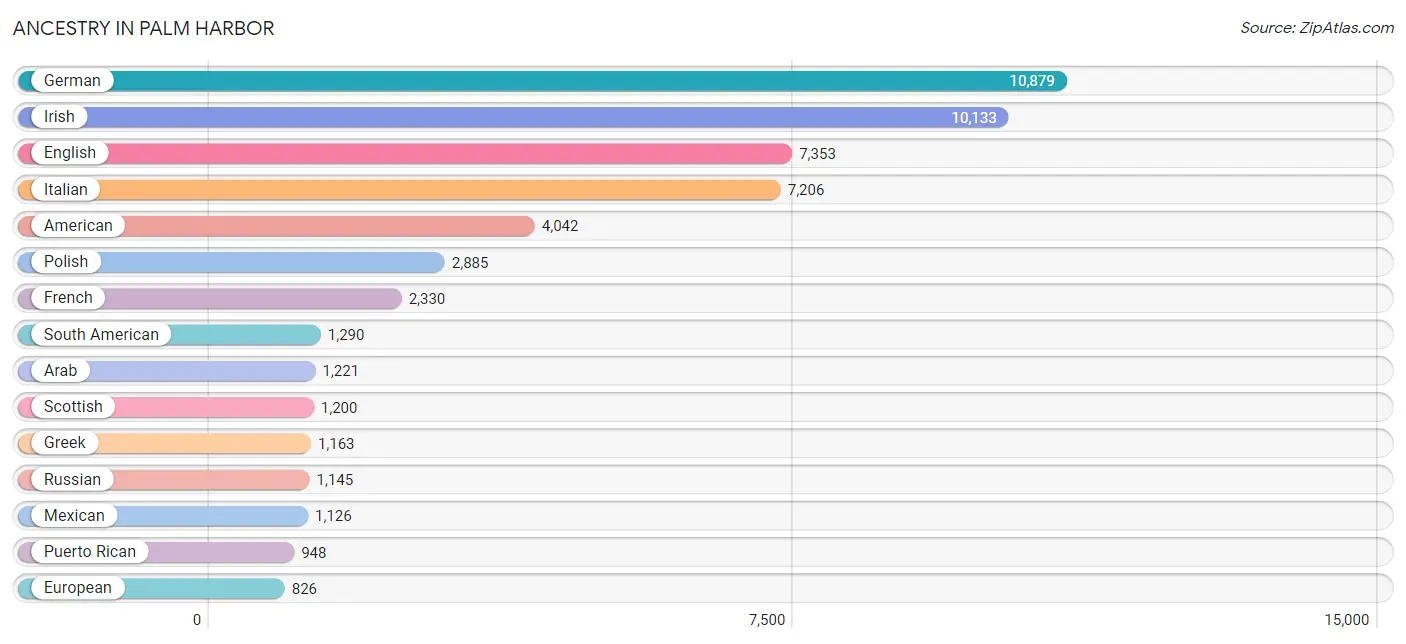
Ancestry in Palm Harbor
The most populous ancestries reported in Palm Harbor are German (10,879 | 17.7%), Irish (10,133 | 16.5%), English (7,353 | 11.9%), Italian (7,206 | 11.7%), and American (4,042 | 6.6%), together accounting for 64.3% of all Palm Harbor residents.
| Ancestry | # Population | % Population |
| African | 50 | 0.1% |
| Albanian | 274 | 0.4% |
| American | 4,042 | 6.6% |
| Apache | 26 | 0.0% |
| Arab | 1,221 | 2.0% |
| Argentinean | 117 | 0.2% |
| Armenian | 14 | 0.0% |
| Australian | 19 | 0.0% |
| Austrian | 344 | 0.6% |
| Basque | 51 | 0.1% |
| Belgian | 181 | 0.3% |
| Bhutanese | 144 | 0.2% |
| Blackfeet | 34 | 0.1% |
| Bolivian | 31 | 0.1% |
| Brazilian | 239 | 0.4% |
| British | 450 | 0.7% |
| Burmese | 118 | 0.2% |
| Cajun | 51 | 0.1% |
| Canadian | 135 | 0.2% |
| Celtic | 39 | 0.1% |
| Central American | 341 | 0.5% |
| Cherokee | 77 | 0.1% |
| Chilean | 322 | 0.5% |
| Chippewa | 9 | 0.0% |
| Choctaw | 52 | 0.1% |
| Colombian | 495 | 0.8% |
| Costa Rican | 11 | 0.0% |
| Croatian | 84 | 0.1% |
| Cuban | 579 | 0.9% |
| Cypriot | 12 | 0.0% |
| Czech | 222 | 0.4% |
| Czechoslovakian | 90 | 0.2% |
| Danish | 187 | 0.3% |
| Dominican | 140 | 0.2% |
| Dutch | 538 | 0.9% |
| Eastern European | 220 | 0.4% |
| Ecuadorian | 39 | 0.1% |
| Egyptian | 604 | 1.0% |
| English | 7,353 | 11.9% |
| Ethiopian | 67 | 0.1% |
| European | 826 | 1.3% |
| Filipino | 40 | 0.1% |
| Finnish | 173 | 0.3% |
| French | 2,330 | 3.8% |
| French Canadian | 665 | 1.1% |
| German | 10,879 | 17.7% |
| Ghanaian | 44 | 0.1% |
| Greek | 1,163 | 1.9% |
| Guatemalan | 24 | 0.0% |
| Guyanese | 9 | 0.0% |
| Honduran | 65 | 0.1% |
| Hungarian | 719 | 1.2% |
| Indian (Asian) | 445 | 0.7% |
| Iranian | 8 | 0.0% |
| Irish | 10,133 | 16.5% |
| Israeli | 22 | 0.0% |
| Italian | 7,206 | 11.7% |
| Jamaican | 178 | 0.3% |
| Korean | 541 | 0.9% |
| Latvian | 20 | 0.0% |
| Lebanese | 436 | 0.7% |
| Lithuanian | 198 | 0.3% |
| Maltese | 9 | 0.0% |
| Mexican | 1,126 | 1.8% |
| Mongolian | 38 | 0.1% |
| Moroccan | 35 | 0.1% |
| Native Hawaiian | 6 | 0.0% |
| Nicaraguan | 119 | 0.2% |
| Northern European | 35 | 0.1% |
| Norwegian | 543 | 0.9% |
| Pakistani | 81 | 0.1% |
| Panamanian | 57 | 0.1% |
| Pennsylvania German | 28 | 0.1% |
| Peruvian | 197 | 0.3% |
| Polish | 2,885 | 4.7% |
| Portuguese | 331 | 0.5% |
| Puerto Rican | 948 | 1.5% |
| Romanian | 122 | 0.2% |
| Russian | 1,145 | 1.9% |
| Salvadoran | 65 | 0.1% |
| Samoan | 8 | 0.0% |
| Scandinavian | 252 | 0.4% |
| Scotch-Irish | 759 | 1.2% |
| Scottish | 1,200 | 1.9% |
| Senegalese | 65 | 0.1% |
| Serbian | 67 | 0.1% |
| Slavic | 30 | 0.1% |
| Slovak | 120 | 0.2% |
| Slovene | 23 | 0.0% |
| South African | 98 | 0.2% |
| South American | 1,290 | 2.1% |
| Spaniard | 71 | 0.1% |
| Spanish | 194 | 0.3% |
| Sri Lankan | 341 | 0.5% |
| Subsaharan African | 357 | 0.6% |
| Swedish | 709 | 1.1% |
| Swiss | 174 | 0.3% |
| Syrian | 146 | 0.2% |
| Thai | 468 | 0.8% |
| Turkish | 21 | 0.0% |
| Ugandan | 33 | 0.1% |
| Ukrainian | 455 | 0.7% |
| Venezuelan | 89 | 0.1% |
| Welsh | 352 | 0.6% |
| Yugoslavian | 134 | 0.2% | View All 105 Rows |
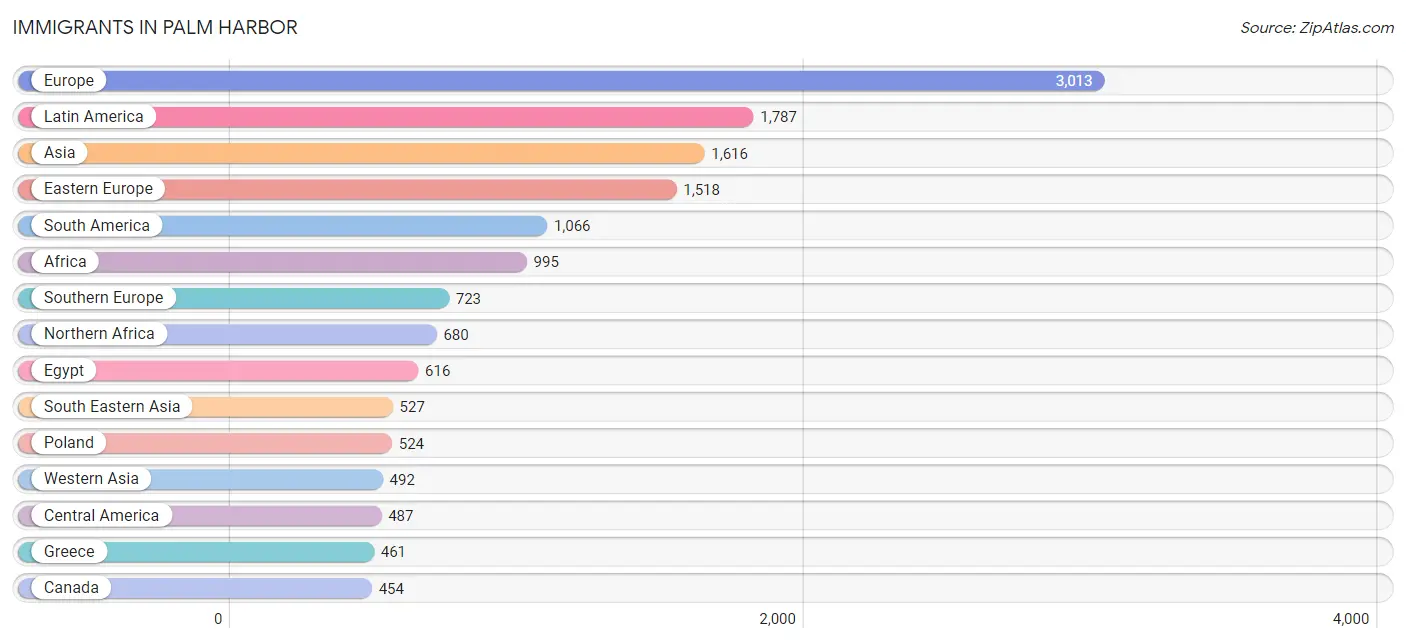
Immigrants in Palm Harbor
The most numerous immigrant groups reported in Palm Harbor came from Europe (3,013 | 4.9%), Latin America (1,787 | 2.9%), Asia (1,616 | 2.6%), Eastern Europe (1,518 | 2.5%), and South America (1,066 | 1.7%), together accounting for 14.6% of all Palm Harbor residents.
| Immigration Origin | # Population | % Population |
| Africa | 995 | 1.6% |
| Albania | 185 | 0.3% |
| Argentina | 108 | 0.2% |
| Asia | 1,616 | 2.6% |
| Australia | 19 | 0.0% |
| Austria | 55 | 0.1% |
| Azores | 17 | 0.0% |
| Belgium | 72 | 0.1% |
| Bolivia | 31 | 0.1% |
| Bosnia and Herzegovina | 33 | 0.1% |
| Brazil | 201 | 0.3% |
| Canada | 454 | 0.7% |
| Caribbean | 234 | 0.4% |
| Central America | 487 | 0.8% |
| Chile | 148 | 0.2% |
| China | 255 | 0.4% |
| Colombia | 262 | 0.4% |
| Costa Rica | 11 | 0.0% |
| Croatia | 57 | 0.1% |
| Cuba | 154 | 0.3% |
| Czechoslovakia | 22 | 0.0% |
| Denmark | 8 | 0.0% |
| Dominican Republic | 16 | 0.0% |
| Eastern Africa | 170 | 0.3% |
| Eastern Asia | 371 | 0.6% |
| Eastern Europe | 1,518 | 2.5% |
| Ecuador | 46 | 0.1% |
| Egypt | 616 | 1.0% |
| England | 126 | 0.2% |
| Ethiopia | 67 | 0.1% |
| Europe | 3,013 | 4.9% |
| France | 59 | 0.1% |
| Germany | 153 | 0.3% |
| Greece | 461 | 0.7% |
| Grenada | 34 | 0.1% |
| Guatemala | 24 | 0.0% |
| Guyana | 27 | 0.0% |
| Honduras | 34 | 0.1% |
| Hong Kong | 42 | 0.1% |
| Hungary | 102 | 0.2% |
| India | 199 | 0.3% |
| Iran | 10 | 0.0% |
| Ireland | 104 | 0.2% |
| Israel | 85 | 0.1% |
| Italy | 172 | 0.3% |
| Jamaica | 30 | 0.1% |
| Japan | 58 | 0.1% |
| Korea | 58 | 0.1% |
| Kuwait | 146 | 0.2% |
| Laos | 10 | 0.0% |
| Latin America | 1,787 | 2.9% |
| Lebanon | 122 | 0.2% |
| Malaysia | 17 | 0.0% |
| Mexico | 397 | 0.6% |
| Moldova | 34 | 0.1% |
| Morocco | 25 | 0.0% |
| Netherlands | 49 | 0.1% |
| Nicaragua | 21 | 0.0% |
| Northern Africa | 680 | 1.1% |
| Northern Europe | 365 | 0.6% |
| Oceania | 57 | 0.1% |
| Pakistan | 17 | 0.0% |
| Peru | 182 | 0.3% |
| Philippines | 335 | 0.5% |
| Poland | 524 | 0.9% |
| Portugal | 17 | 0.0% |
| Romania | 11 | 0.0% |
| Russia | 110 | 0.2% |
| Saudi Arabia | 8 | 0.0% |
| Scotland | 31 | 0.1% |
| Senegal | 32 | 0.1% |
| South Africa | 113 | 0.2% |
| South America | 1,066 | 1.7% |
| South Central Asia | 226 | 0.4% |
| South Eastern Asia | 527 | 0.9% |
| Southern Europe | 723 | 1.2% |
| Spain | 73 | 0.1% |
| Sudan | 39 | 0.1% |
| Switzerland | 19 | 0.0% |
| Taiwan | 90 | 0.2% |
| Thailand | 66 | 0.1% |
| Turkey | 10 | 0.0% |
| Uganda | 33 | 0.1% |
| Ukraine | 399 | 0.6% |
| Venezuela | 61 | 0.1% |
| Vietnam | 99 | 0.2% |
| Western Africa | 32 | 0.1% |
| Western Asia | 492 | 0.8% |
| Western Europe | 407 | 0.7% |
| Zimbabwe | 10 | 0.0% | View All 90 Rows |
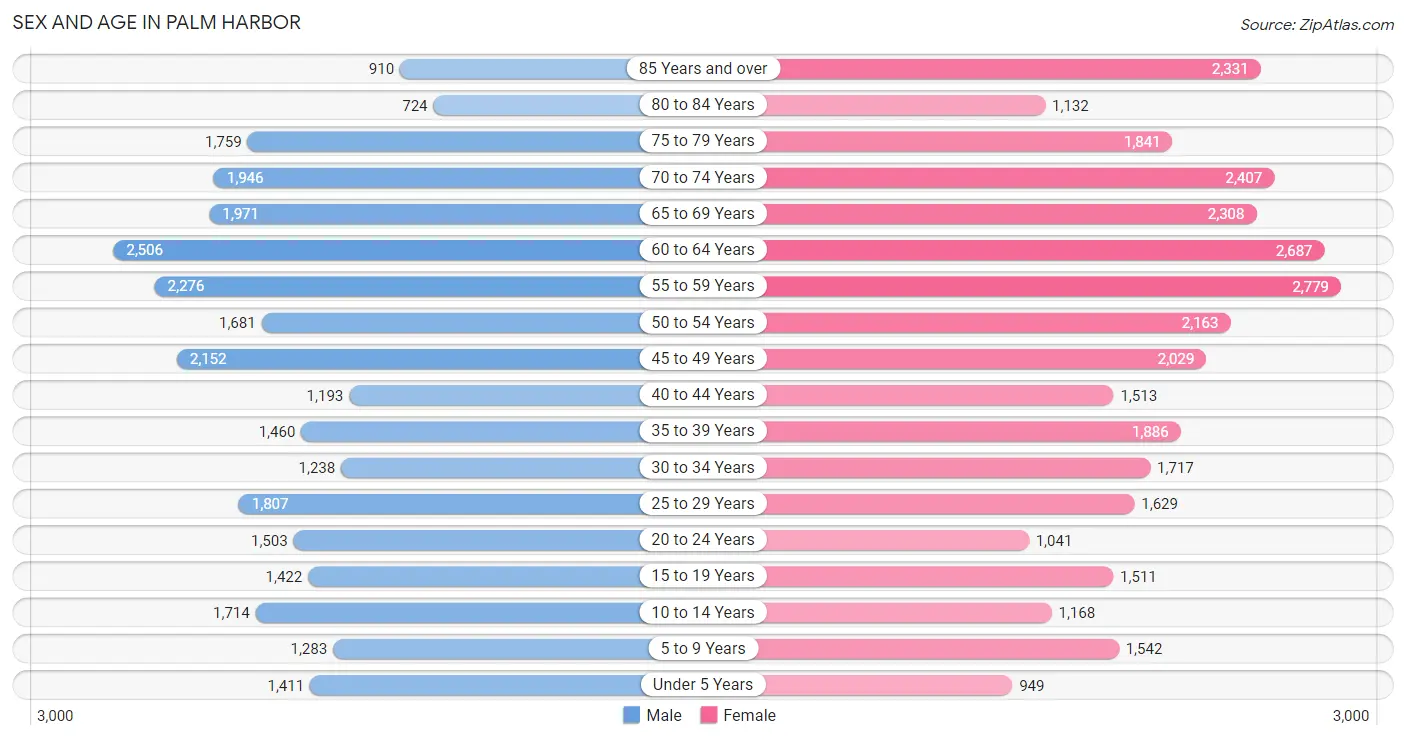
Sex and Age in Palm Harbor
Sex and Age in Palm Harbor
The most populous age groups in Palm Harbor are 60 to 64 Years (2,506 | 8.6%) for men and 55 to 59 Years (2,779 | 8.5%) for women.
| Age Bracket | Male | Female |
| Under 5 Years | 1,411 (4.9%) | 949 (2.9%) |
| 5 to 9 Years | 1,283 (4.4%) | 1,542 (4.7%) |
| 10 to 14 Years | 1,714 (5.9%) | 1,168 (3.6%) |
| 15 to 19 Years | 1,422 (4.9%) | 1,511 (4.6%) |
| 20 to 24 Years | 1,503 (5.2%) | 1,041 (3.2%) |
| 25 to 29 Years | 1,807 (6.2%) | 1,629 (5.0%) |
| 30 to 34 Years | 1,238 (4.3%) | 1,717 (5.3%) |
| 35 to 39 Years | 1,460 (5.0%) | 1,886 (5.8%) |
| 40 to 44 Years | 1,193 (4.1%) | 1,513 (4.6%) |
| 45 to 49 Years | 2,152 (7.4%) | 2,029 (6.2%) |
| 50 to 54 Years | 1,681 (5.8%) | 2,163 (6.6%) |
| 55 to 59 Years | 2,276 (7.9%) | 2,779 (8.5%) |
| 60 to 64 Years | 2,506 (8.6%) | 2,687 (8.2%) |
| 65 to 69 Years | 1,971 (6.8%) | 2,308 (7.1%) |
| 70 to 74 Years | 1,946 (6.7%) | 2,407 (7.4%) |
| 75 to 79 Years | 1,759 (6.1%) | 1,841 (5.6%) |
| 80 to 84 Years | 724 (2.5%) | 1,132 (3.5%) |
| 85 Years and over | 910 (3.1%) | 2,331 (7.1%) |
| Total | 28,956 (100.0%) | 32,633 (100.0%) |
Families and Households in Palm Harbor
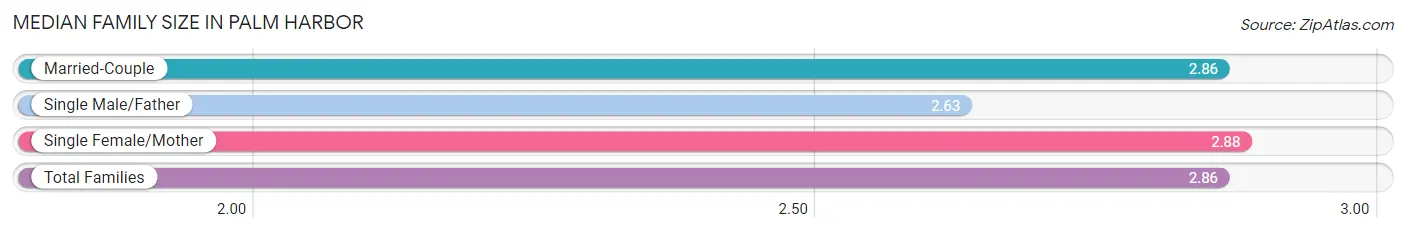
Median Family Size in Palm Harbor
The median family size in Palm Harbor is 2.86 persons per family, with single female/mother families (2,779 | 17.1%) accounting for the largest median family size of 2.88 persons per family. On the other hand, single male/father families (651 | 4.0%) represent the smallest median family size with 2.63 persons per family.
| Family Type | # Families | Family Size |
| Married-Couple | 12,815 (78.9%) | 2.86 |
| Single Male/Father | 651 (4.0%) | 2.63 |
| Single Female/Mother | 2,779 (17.1%) | 2.88 |
| Total Families | 16,245 (100.0%) | 2.86 |
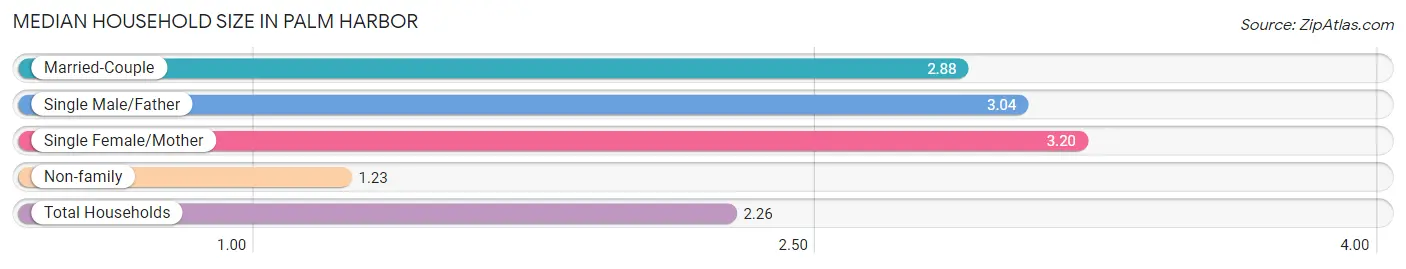
Median Household Size in Palm Harbor
The median household size in Palm Harbor is 2.26 persons per household, with single female/mother households (2,779 | 10.3%) accounting for the largest median household size of 3.2 persons per household. non-family households (10,637 | 39.6%) represent the smallest median household size with 1.23 persons per household.
| Household Type | # Households | Household Size |
| Married-Couple | 12,815 (47.7%) | 2.88 |
| Single Male/Father | 651 (2.4%) | 3.04 |
| Single Female/Mother | 2,779 (10.3%) | 3.20 |
| Non-family | 10,637 (39.6%) | 1.23 |
| Total Households | 26,882 (100.0%) | 2.26 |
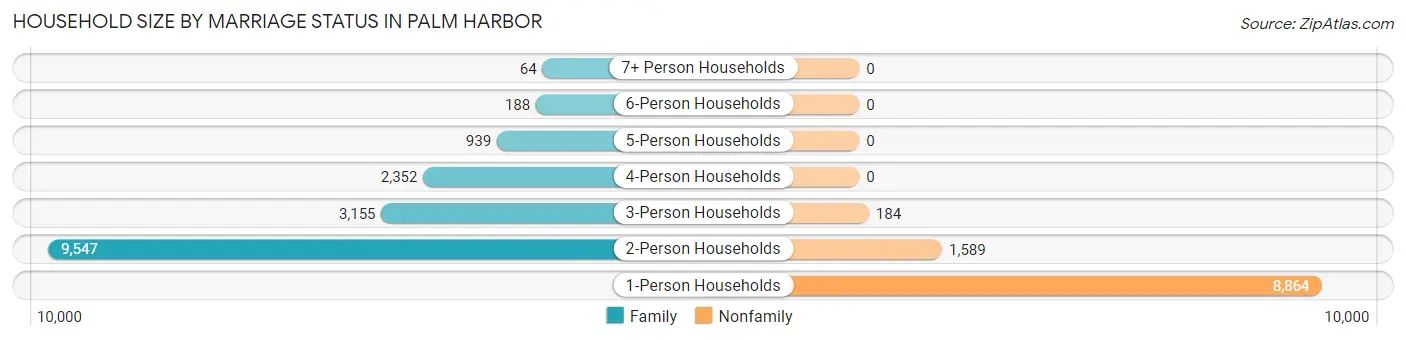
Household Size by Marriage Status in Palm Harbor
Out of a total of 26,882 households in Palm Harbor, 16,245 (60.4%) are family households, while 10,637 (39.6%) are nonfamily households. The most numerous type of family households are 2-person households, comprising 9,547, and the most common type of nonfamily households are 1-person households, comprising 8,864.
| Household Size | Family Households | Nonfamily Households |
| 1-Person Households | - | 8,864 (33.0%) |
| 2-Person Households | 9,547 (35.5%) | 1,589 (5.9%) |
| 3-Person Households | 3,155 (11.7%) | 184 (0.7%) |
| 4-Person Households | 2,352 (8.7%) | 0 (0.0%) |
| 5-Person Households | 939 (3.5%) | 0 (0.0%) |
| 6-Person Households | 188 (0.7%) | 0 (0.0%) |
| 7+ Person Households | 64 (0.2%) | 0 (0.0%) |
| Total | 16,245 (60.4%) | 10,637 (39.6%) |
Female Fertility in Palm Harbor
Fertility by Age in Palm Harbor
Average fertility rate in Palm Harbor is 22.0 births per 1,000 women. Women in the age bracket of 20 to 34 years have the highest fertility rate with 46.0 births per 1,000 women. Women in the age bracket of 20 to 34 years acount for 78.9% of all women with births.
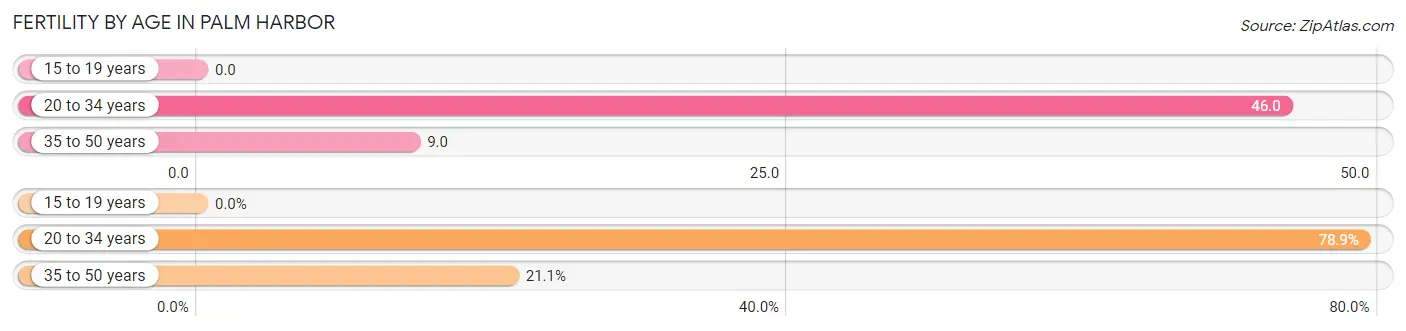
| Age Bracket | Women with Births | Births / 1,000 Women |
| 15 to 19 years | 0 (0.0%) | 0.0 |
| 20 to 34 years | 202 (78.9%) | 46.0 |
| 35 to 50 years | 54 (21.1%) | 9.0 |
| Total | 256 (100.0%) | 22.0 |
Fertility by Age by Marriage Status in Palm Harbor
89.8% of women with births (256) in Palm Harbor are married. The highest percentage of unmarried women with births falls into 20 to 34 years age bracket with 12.9% of them unmarried at the time of birth, while the lowest percentage of unmarried women with births belong to 35 to 50 years age bracket with 0.0% of them unmarried.
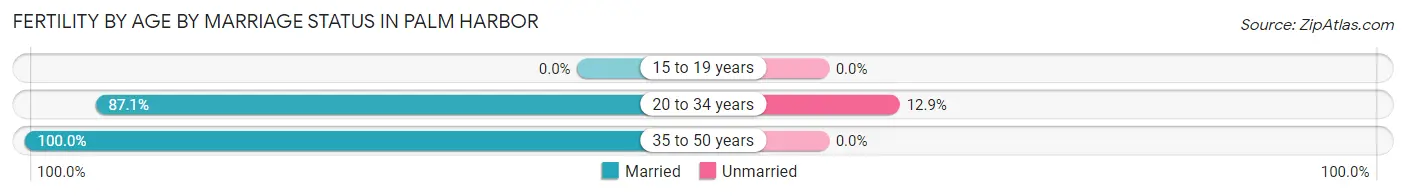
| Age Bracket | Married | Unmarried |
| 15 to 19 years | 0 (0.0%) | 0 (0.0%) |
| 20 to 34 years | 176 (87.1%) | 26 (12.9%) |
| 35 to 50 years | 54 (100.0%) | 0 (0.0%) |
| Total | 230 (89.8%) | 26 (10.2%) |
Fertility by Education in Palm Harbor
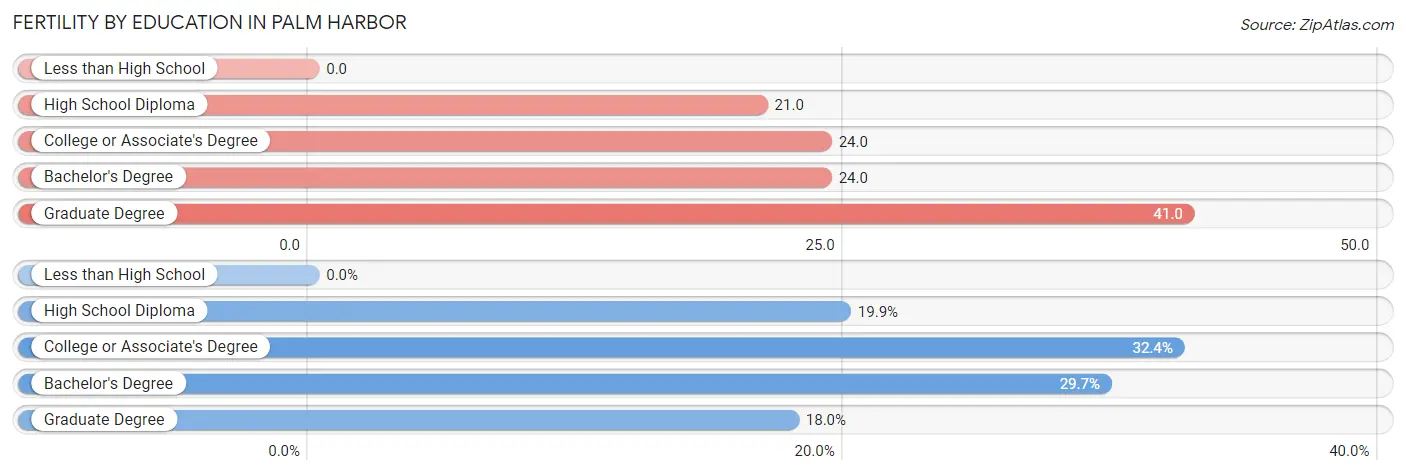
| Educational Attainment | Women with Births | Births / 1,000 Women |
| Less than High School | 0 (0.0%) | 0.0 |
| High School Diploma | 51 (19.9%) | 21.0 |
| College or Associate's Degree | 83 (32.4%) | 24.0 |
| Bachelor's Degree | 76 (29.7%) | 24.0 |
| Graduate Degree | 46 (18.0%) | 41.0 |
| Total | 256 (100.0%) | 22.0 |
Fertility by Education by Marriage Status in Palm Harbor
10.2% of women with births in Palm Harbor are unmarried. Women with the educational attainment of bachelor's degree are most likely to be married with 100.0% of them married at childbirth, while women with the educational attainment of high school diploma are least likely to be married with 21.6% of them unmarried at childbirth.
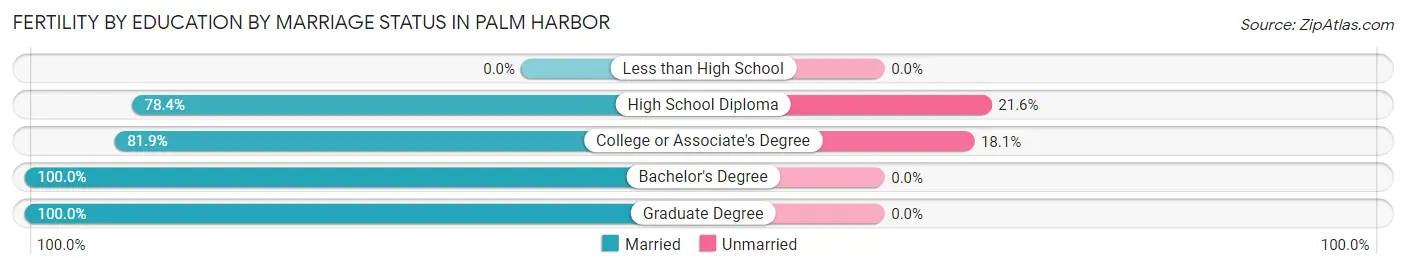
| Educational Attainment | Married | Unmarried |
| Less than High School | 0 (0.0%) | 0 (0.0%) |
| High School Diploma | 40 (78.4%) | 11 (21.6%) |
| College or Associate's Degree | 68 (81.9%) | 15 (18.1%) |
| Bachelor's Degree | 76 (100.0%) | 0 (0.0%) |
| Graduate Degree | 46 (100.0%) | 0 (0.0%) |
| Total | 230 (89.8%) | 26 (10.2%) |
Income in Palm Harbor
Income Overview in Palm Harbor
Per Capita Income in Palm Harbor is $44,016, while median incomes of families and households are $95,367 and $70,493 respectively.
| Characteristic | Number | Measure |
| Per Capita Income | 61,589 | $44,016 |
| Median Family Income | 16,245 | $95,367 |
| Mean Family Income | 16,245 | $120,731 |
| Median Household Income | 26,882 | $70,493 |
| Mean Household Income | 26,882 | $97,976 |
| Income Deficit | 16,245 | $8,919 |
| Wage / Income Gap (%) | 61,589 | 26.26% |
| Wage / Income Gap ($) | 61,589 | 73.74¢ per $1 |
| Gini / Inequality Index | 61,589 | 0.47 |
Earnings by Sex in Palm Harbor
Average Earnings in Palm Harbor are $47,107, $54,195 for men and $39,962 for women, a difference of 26.3%.
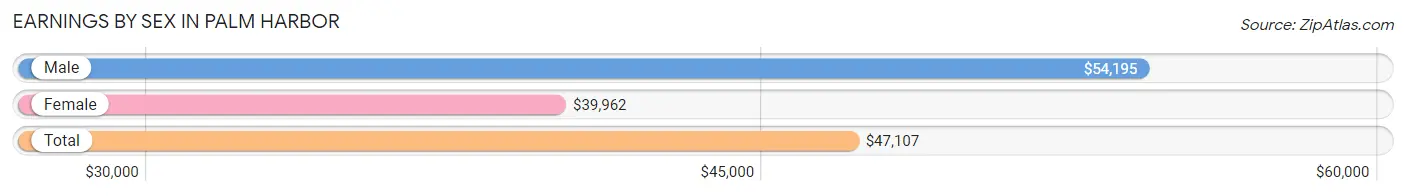
| Sex | Number | Average Earnings |
| Male | 15,981 (50.9%) | $54,195 |
| Female | 15,407 (49.1%) | $39,962 |
| Total | 31,388 (100.0%) | $47,107 |
Earnings by Sex by Income Bracket in Palm Harbor
The most common earnings brackets in Palm Harbor are $100,000+ for men (3,555 | 22.3%) and $75,000 to $99,999 for women (1,679 | 10.9%).
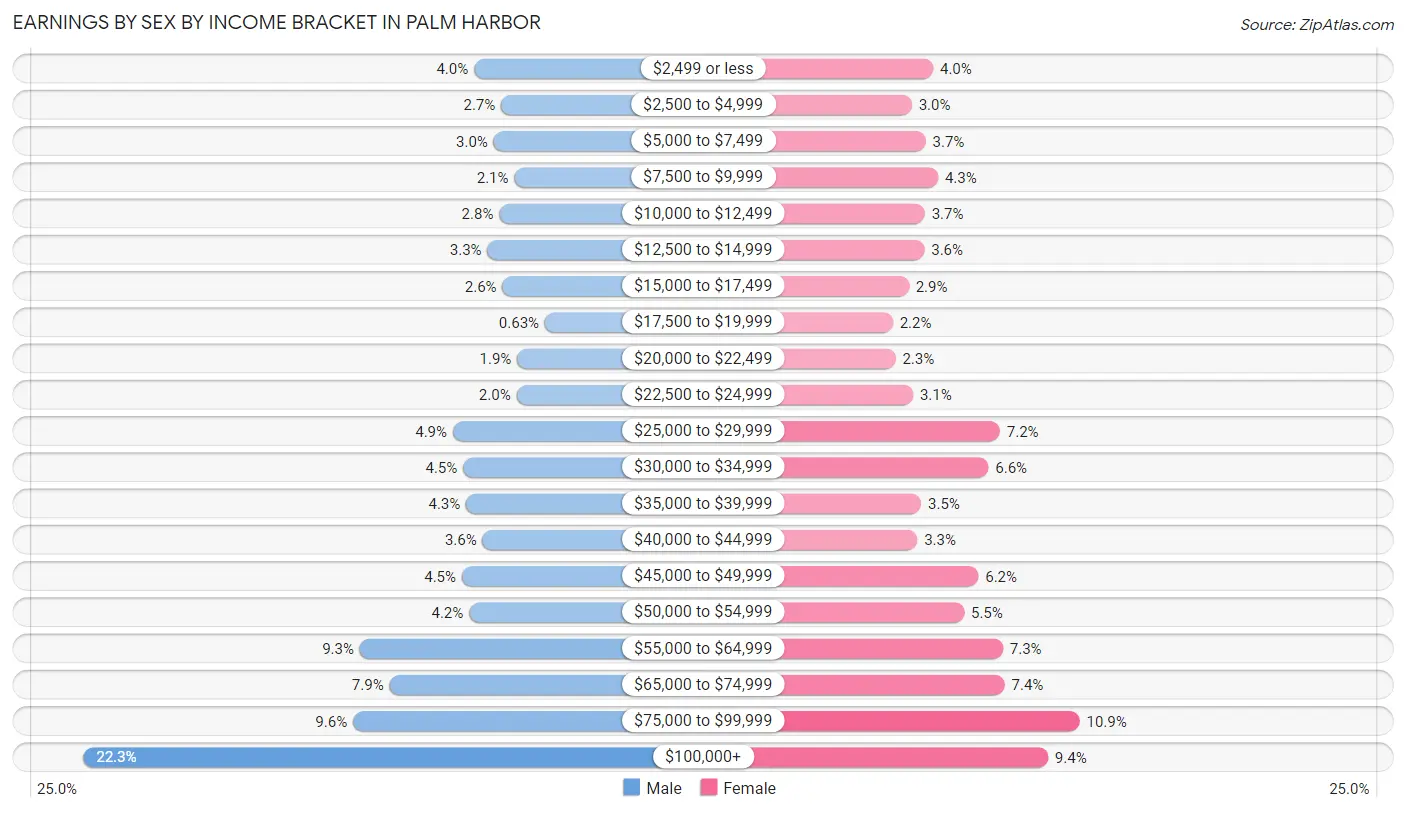
| Income | Male | Female |
| $2,499 or less | 631 (4.0%) | 622 (4.0%) |
| $2,500 to $4,999 | 428 (2.7%) | 469 (3.0%) |
| $5,000 to $7,499 | 485 (3.0%) | 569 (3.7%) |
| $7,500 to $9,999 | 329 (2.1%) | 658 (4.3%) |
| $10,000 to $12,499 | 442 (2.8%) | 562 (3.6%) |
| $12,500 to $14,999 | 530 (3.3%) | 559 (3.6%) |
| $15,000 to $17,499 | 419 (2.6%) | 447 (2.9%) |
| $17,500 to $19,999 | 101 (0.6%) | 331 (2.1%) |
| $20,000 to $22,499 | 308 (1.9%) | 351 (2.3%) |
| $22,500 to $24,999 | 314 (2.0%) | 478 (3.1%) |
| $25,000 to $29,999 | 790 (4.9%) | 1,105 (7.2%) |
| $30,000 to $34,999 | 712 (4.5%) | 1,021 (6.6%) |
| $35,000 to $39,999 | 691 (4.3%) | 536 (3.5%) |
| $40,000 to $44,999 | 568 (3.5%) | 508 (3.3%) |
| $45,000 to $49,999 | 722 (4.5%) | 949 (6.2%) |
| $50,000 to $54,999 | 668 (4.2%) | 846 (5.5%) |
| $55,000 to $64,999 | 1,487 (9.3%) | 1,126 (7.3%) |
| $65,000 to $74,999 | 1,264 (7.9%) | 1,139 (7.4%) |
| $75,000 to $99,999 | 1,537 (9.6%) | 1,679 (10.9%) |
| $100,000+ | 3,555 (22.3%) | 1,452 (9.4%) |
| Total | 15,981 (100.0%) | 15,407 (100.0%) |
Earnings by Sex by Educational Attainment in Palm Harbor
Average earnings in Palm Harbor are $57,647 for men and $45,986 for women, a difference of 20.2%. Men with an educational attainment of graduate degree enjoy the highest average annual earnings of $82,361, while those with less than high school education earn the least with $37,542. Women with an educational attainment of graduate degree earn the most with the average annual earnings of $66,472, while those with less than high school education have the smallest earnings of $23,333.
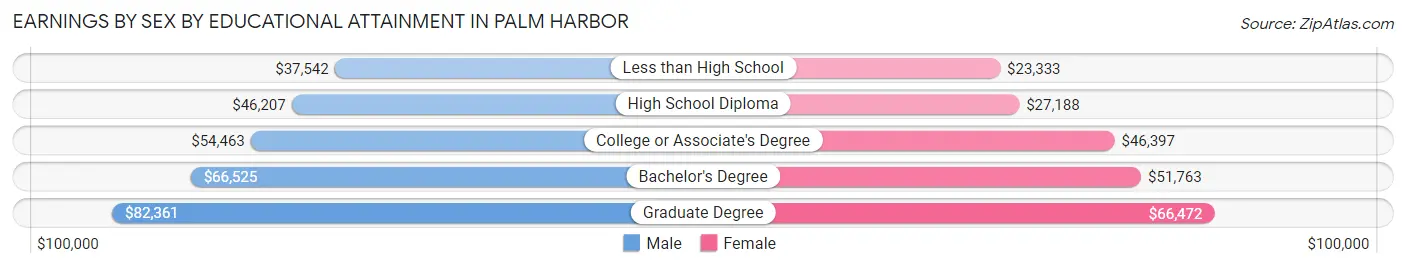
| Educational Attainment | Male Income | Female Income |
| Less than High School | $37,542 | $23,333 |
| High School Diploma | $46,207 | $27,188 |
| College or Associate's Degree | $54,463 | $46,397 |
| Bachelor's Degree | $66,525 | $51,763 |
| Graduate Degree | $82,361 | $66,472 |
| Total | $57,647 | $45,986 |
Family Income in Palm Harbor
Family Income Brackets in Palm Harbor
According to the Palm Harbor family income data, there are 3,590 families falling into the $100,000 to $149,999 income range, which is the most common income bracket and makes up 22.1% of all families. Conversely, the $10,000 to $14,999 income bracket is the least frequent group with only 341 families (2.1%) belonging to this category.
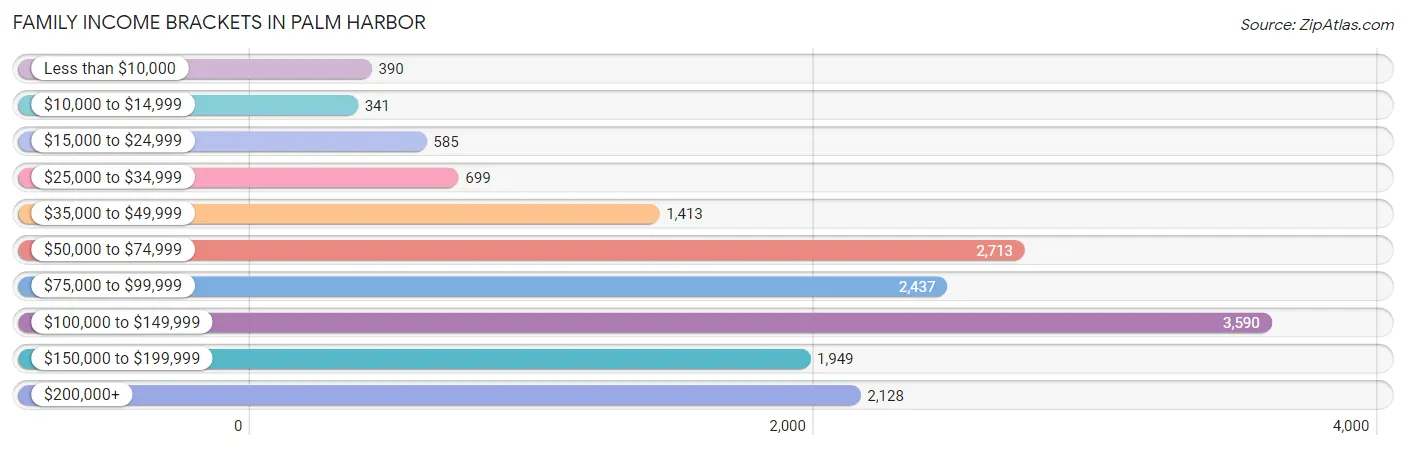
| Income Bracket | # Families | % Families |
| Less than $10,000 | 390 | 2.4% |
| $10,000 to $14,999 | 341 | 2.1% |
| $15,000 to $24,999 | 585 | 3.6% |
| $25,000 to $34,999 | 699 | 4.3% |
| $35,000 to $49,999 | 1,413 | 8.7% |
| $50,000 to $74,999 | 2,713 | 16.7% |
| $75,000 to $99,999 | 2,437 | 15.0% |
| $100,000 to $149,999 | 3,590 | 22.1% |
| $150,000 to $199,999 | 1,949 | 12.0% |
| $200,000+ | 2,128 | 13.1% |
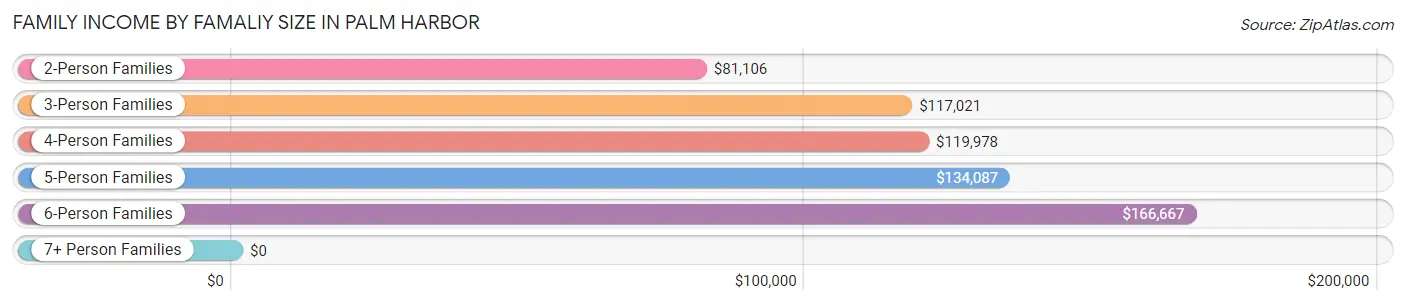
Family Income by Famaliy Size in Palm Harbor
6-person families (140 | 0.9%) account for the highest median family income in Palm Harbor with $166,667 per family, while 2-person families (9,875 | 60.8%) have the highest median income of $40,553 per family member.
| Income Bracket | # Families | Median Income |
| 2-Person Families | 9,875 (60.8%) | $81,106 |
| 3-Person Families | 3,110 (19.1%) | $117,021 |
| 4-Person Families | 2,239 (13.8%) | $119,978 |
| 5-Person Families | 852 (5.2%) | $134,087 |
| 6-Person Families | 140 (0.9%) | $166,667 |
| 7+ Person Families | 29 (0.2%) | $0 |
| Total | 16,245 (100.0%) | $95,367 |
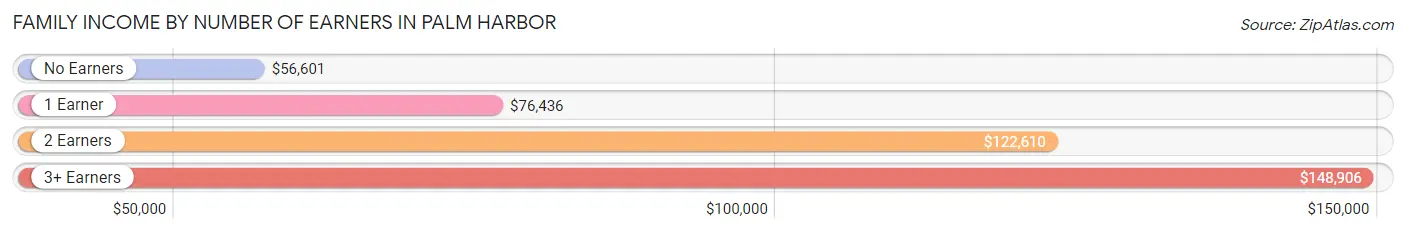
Family Income by Number of Earners in Palm Harbor
The median family income in Palm Harbor is $95,367, with families comprising 3+ earners (1,337) having the highest median family income of $148,906, while families with no earners (3,013) have the lowest median family income of $56,601, accounting for 8.2% and 18.5% of families, respectively.
| Number of Earners | # Families | Median Income |
| No Earners | 3,013 (18.5%) | $56,601 |
| 1 Earner | 5,374 (33.1%) | $76,436 |
| 2 Earners | 6,521 (40.1%) | $122,610 |
| 3+ Earners | 1,337 (8.2%) | $148,906 |
| Total | 16,245 (100.0%) | $95,367 |
Household Income in Palm Harbor
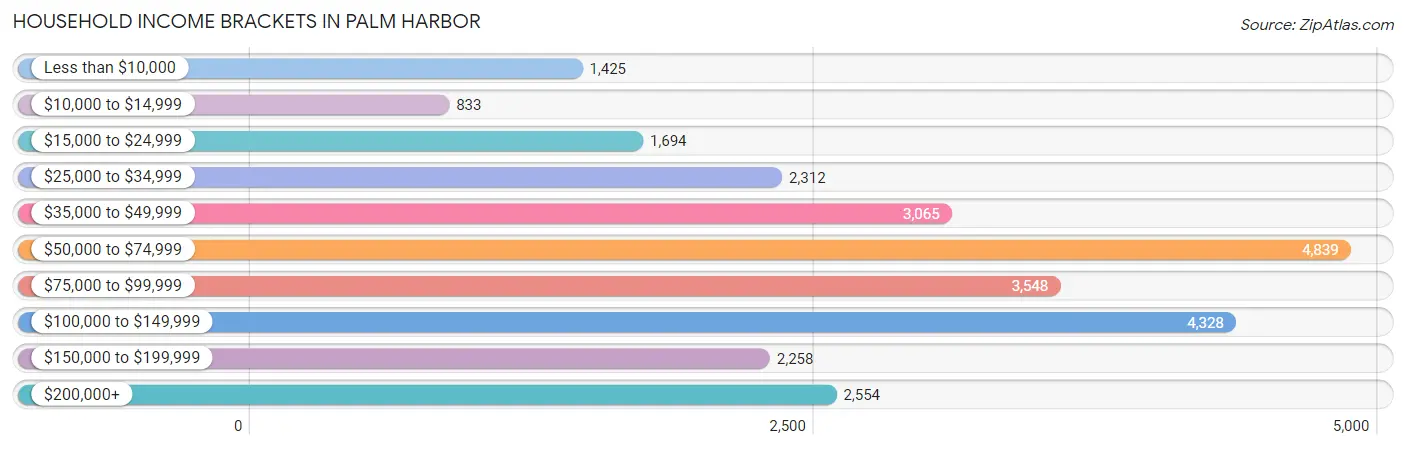
Household Income Brackets in Palm Harbor
With 4,839 households falling in the category, the $50,000 to $74,999 income range is the most frequent in Palm Harbor, accounting for 18.0% of all households. In contrast, only 833 households (3.1%) fall into the $10,000 to $14,999 income bracket, making it the least populous group.
| Income Bracket | # Households | % Households |
| Less than $10,000 | 1,425 | 5.3% |
| $10,000 to $14,999 | 833 | 3.1% |
| $15,000 to $24,999 | 1,694 | 6.3% |
| $25,000 to $34,999 | 2,312 | 8.6% |
| $35,000 to $49,999 | 3,065 | 11.4% |
| $50,000 to $74,999 | 4,839 | 18.0% |
| $75,000 to $99,999 | 3,548 | 13.2% |
| $100,000 to $149,999 | 4,328 | 16.1% |
| $150,000 to $199,999 | 2,258 | 8.4% |
| $200,000+ | 2,554 | 9.5% |
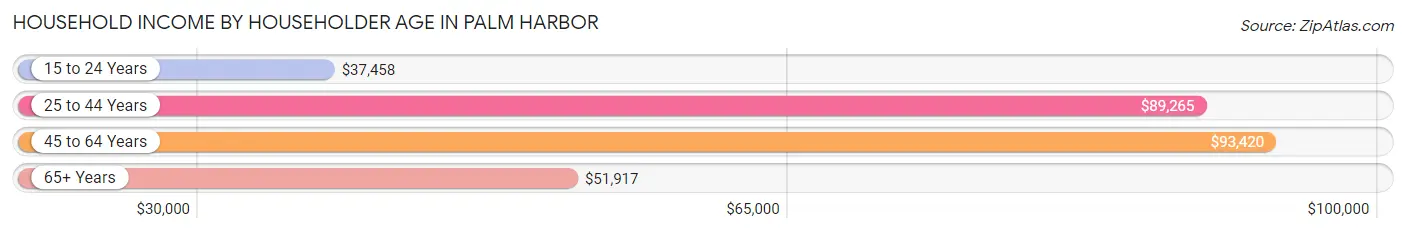
Household Income by Householder Age in Palm Harbor
The median household income in Palm Harbor is $70,493, with the highest median household income of $93,420 found in the 45 to 64 years age bracket for the primary householder. A total of 10,240 households (38.1%) fall into this category. Meanwhile, the 15 to 24 years age bracket for the primary householder has the lowest median household income of $37,458, with 301 households (1.1%) in this group.
| Income Bracket | # Households | Median Income |
| 15 to 24 Years | 301 (1.1%) | $37,458 |
| 25 to 44 Years | 5,364 (20.0%) | $89,265 |
| 45 to 64 Years | 10,240 (38.1%) | $93,420 |
| 65+ Years | 10,977 (40.8%) | $51,917 |
| Total | 26,882 (100.0%) | $70,493 |
Poverty in Palm Harbor
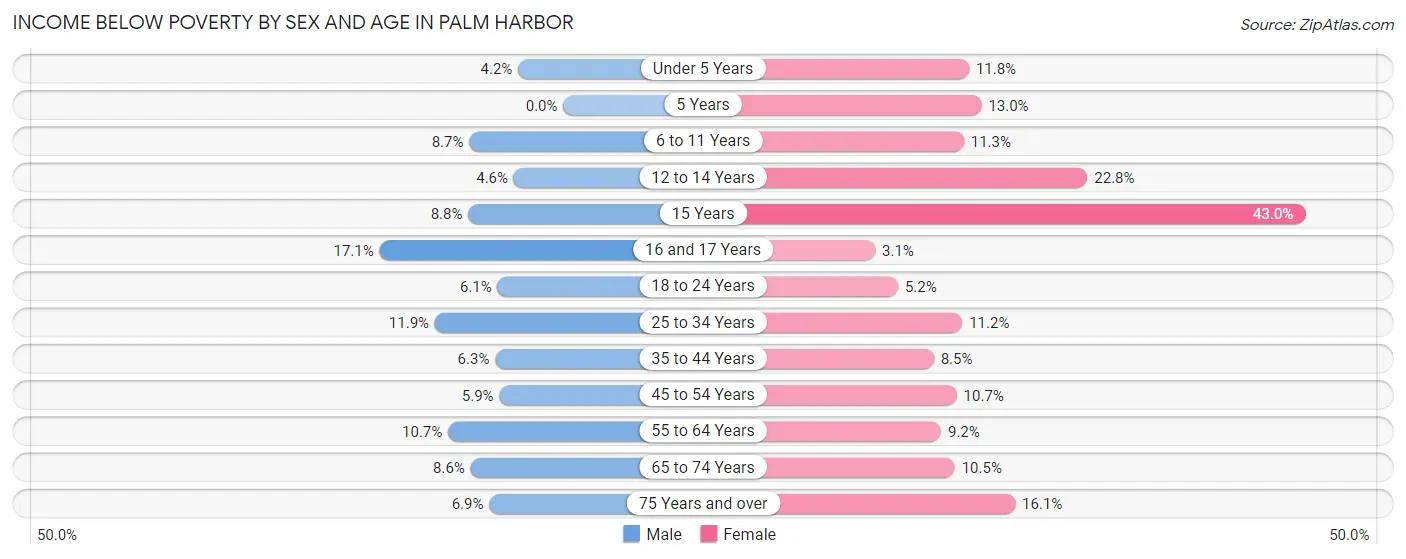
Income Below Poverty by Sex and Age in Palm Harbor
With 8.1% poverty level for males and 11.5% for females among the residents of Palm Harbor, 16 and 17 year old males and 15 year old females are the most vulnerable to poverty, with 101 males (17.1%) and 209 females (43.0%) in their respective age groups living below the poverty level.
| Age Bracket | Male | Female |
| Under 5 Years | 59 (4.2%) | 112 (11.8%) |
| 5 Years | 0 (0.0%) | 49 (13.0%) |
| 6 to 11 Years | 148 (8.7%) | 181 (11.3%) |
| 12 to 14 Years | 51 (4.6%) | 142 (22.8%) |
| 15 Years | 38 (8.8%) | 209 (43.0%) |
| 16 and 17 Years | 101 (17.1%) | 17 (3.1%) |
| 18 to 24 Years | 116 (6.1%) | 79 (5.2%) |
| 25 to 34 Years | 363 (11.9%) | 374 (11.2%) |
| 35 to 44 Years | 167 (6.3%) | 289 (8.5%) |
| 45 to 54 Years | 227 (5.9%) | 447 (10.7%) |
| 55 to 64 Years | 503 (10.7%) | 497 (9.2%) |
| 65 to 74 Years | 331 (8.6%) | 491 (10.5%) |
| 75 Years and over | 225 (6.9%) | 813 (16.1%) |
| Total | 2,329 (8.1%) | 3,700 (11.5%) |
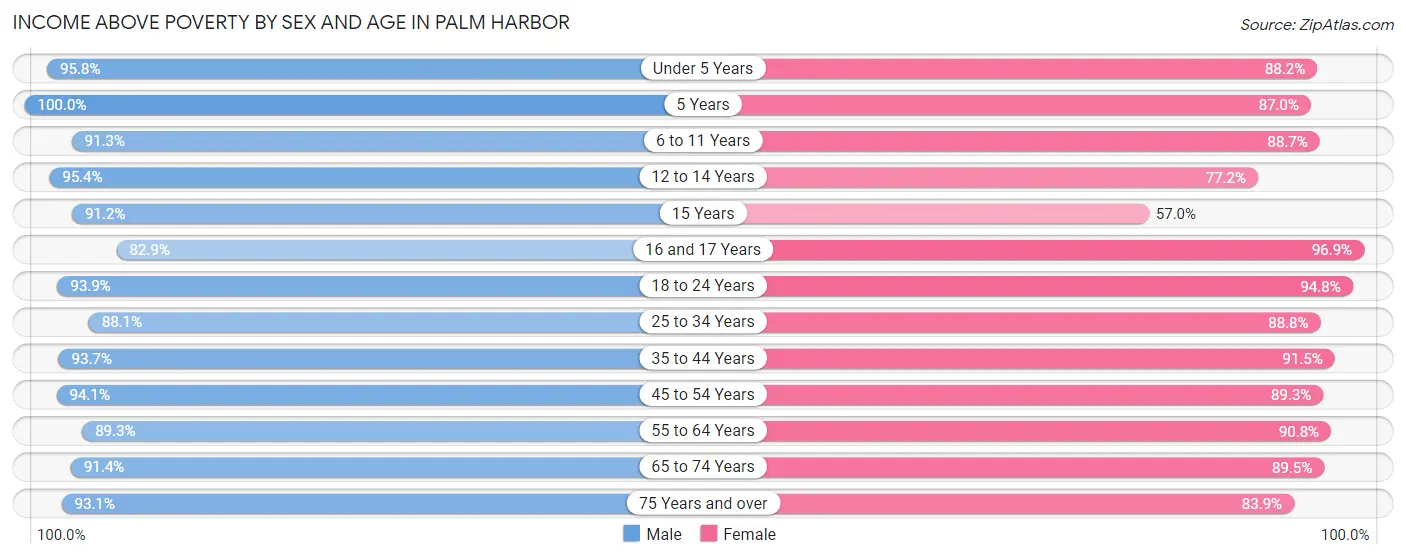
Income Above Poverty by Sex and Age in Palm Harbor
According to the poverty statistics in Palm Harbor, males aged 5 years and females aged 16 and 17 years are the age groups that are most secure financially, with 100.0% of males and 96.9% of females in these age groups living above the poverty line.
| Age Bracket | Male | Female |
| Under 5 Years | 1,348 (95.8%) | 837 (88.2%) |
| 5 Years | 137 (100.0%) | 329 (87.0%) |
| 6 to 11 Years | 1,547 (91.3%) | 1,418 (88.7%) |
| 12 to 14 Years | 1,060 (95.4%) | 481 (77.2%) |
| 15 Years | 393 (91.2%) | 277 (57.0%) |
| 16 and 17 Years | 491 (82.9%) | 534 (96.9%) |
| 18 to 24 Years | 1,786 (93.9%) | 1,436 (94.8%) |
| 25 to 34 Years | 2,682 (88.1%) | 2,972 (88.8%) |
| 35 to 44 Years | 2,475 (93.7%) | 3,101 (91.5%) |
| 45 to 54 Years | 3,599 (94.1%) | 3,745 (89.3%) |
| 55 to 64 Years | 4,197 (89.3%) | 4,897 (90.8%) |
| 65 to 74 Years | 3,519 (91.4%) | 4,194 (89.5%) |
| 75 Years and over | 3,050 (93.1%) | 4,241 (83.9%) |
| Total | 26,284 (91.9%) | 28,462 (88.5%) |
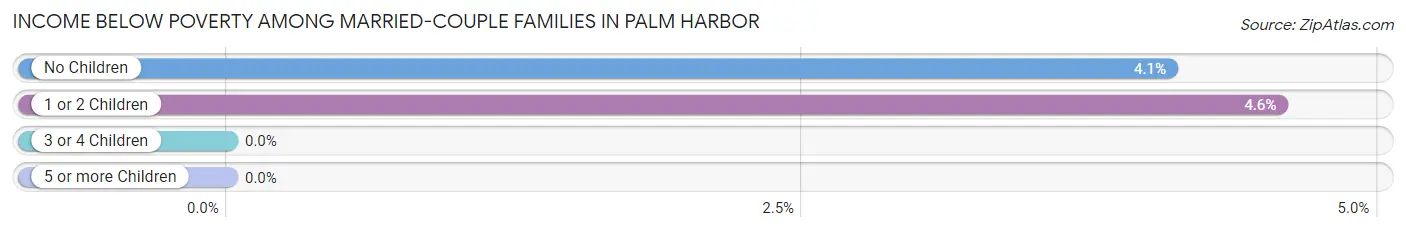
Income Below Poverty Among Married-Couple Families in Palm Harbor
The poverty statistics for married-couple families in Palm Harbor show that 4.1% or 519 of the total 12,815 families live below the poverty line. Families with 1 or 2 children have the highest poverty rate of 4.6%, comprising of 149 families. On the other hand, families with 3 or 4 children have the lowest poverty rate of 0.0%, which includes 0 families.
| Children | Above Poverty | Below Poverty |
| No Children | 8,679 (95.9%) | 370 (4.1%) |
| 1 or 2 Children | 3,109 (95.4%) | 149 (4.6%) |
| 3 or 4 Children | 498 (100.0%) | 0 (0.0%) |
| 5 or more Children | 10 (100.0%) | 0 (0.0%) |
| Total | 12,296 (96.0%) | 519 (4.1%) |
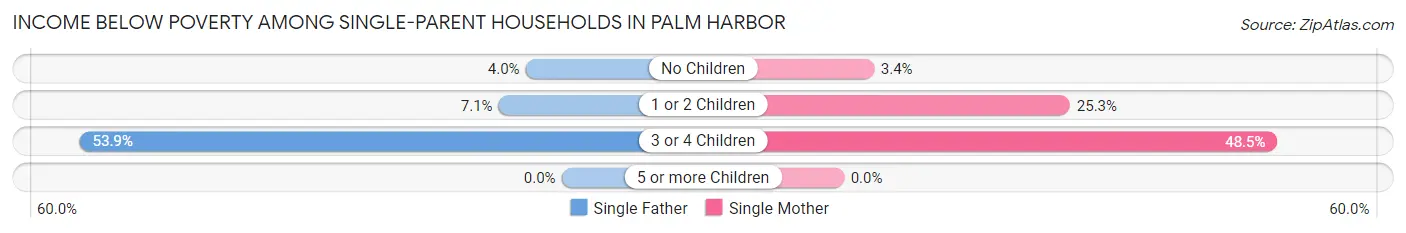
Income Below Poverty Among Single-Parent Households in Palm Harbor
According to the poverty data in Palm Harbor, 6.1% or 40 single-father households and 17.5% or 486 single-mother households are living below the poverty line. Among single-father households, those with 3 or 4 children have the highest poverty rate, with 7 households (53.8%) experiencing poverty. Likewise, among single-mother households, those with 3 or 4 children have the highest poverty rate, with 63 households (48.5%) falling below the poverty line.
| Children | Single Father | Single Mother |
| No Children | 16 (4.0%) | 38 (3.4%) |
| 1 or 2 Children | 17 (7.0%) | 385 (25.3%) |
| 3 or 4 Children | 7 (53.8%) | 63 (48.5%) |
| 5 or more Children | 0 (0.0%) | 0 (0.0%) |
| Total | 40 (6.1%) | 486 (17.5%) |
Income Below Poverty Among Married-Couple vs Single-Parent Households in Palm Harbor
The poverty data for Palm Harbor shows that 519 of the married-couple family households (4.1%) and 526 of the single-parent households (15.3%) are living below the poverty level. Within the married-couple family households, those with 1 or 2 children have the highest poverty rate, with 149 households (4.6%) falling below the poverty line. Among the single-parent households, those with 3 or 4 children have the highest poverty rate, with 70 household (48.9%) living below poverty.
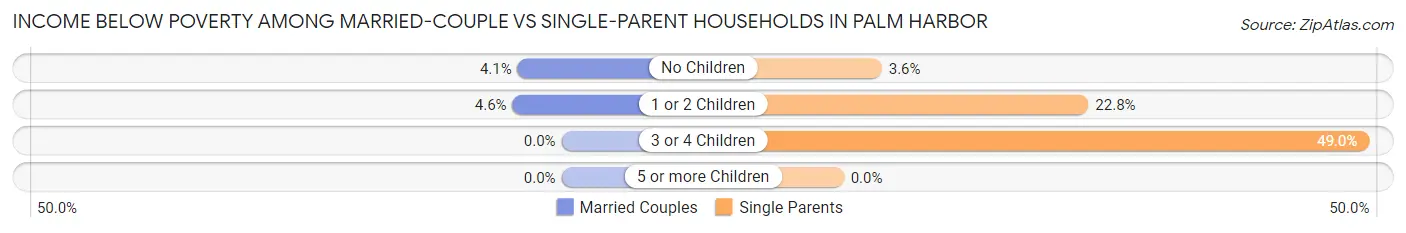
| Children | Married-Couple Families | Single-Parent Households |
| No Children | 370 (4.1%) | 54 (3.5%) |
| 1 or 2 Children | 149 (4.6%) | 402 (22.8%) |
| 3 or 4 Children | 0 (0.0%) | 70 (48.9%) |
| 5 or more Children | 0 (0.0%) | 0 (0.0%) |
| Total | 519 (4.1%) | 526 (15.3%) |
Employment Characteristics in Palm Harbor
Employment by Class of Employer in Palm Harbor
Among the 29,302 employed individuals in Palm Harbor, private company employees (20,066 | 68.5%), not-for-profit organizations (2,379 | 8.1%), and local government employees (2,212 | 7.5%) make up the most common classes of employment.
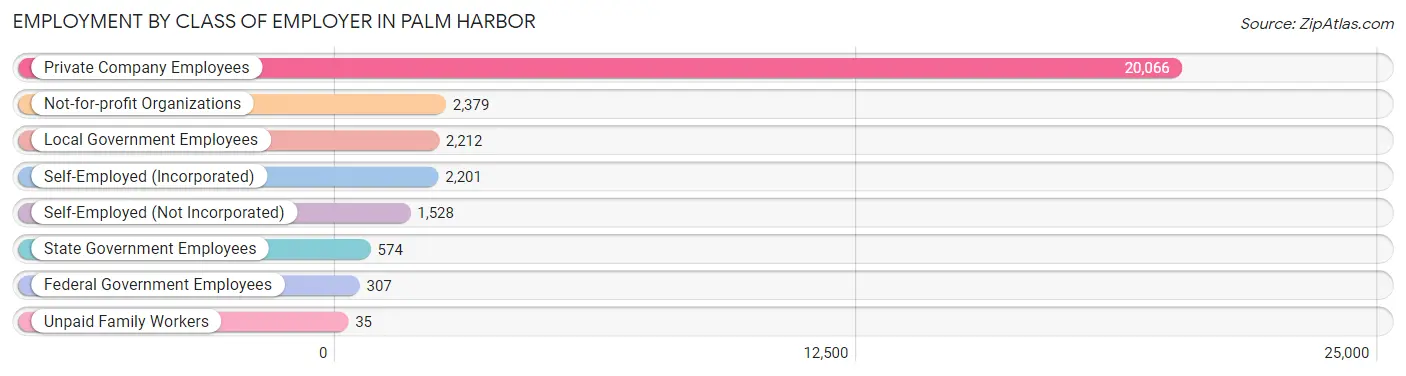
| Employer Class | # Employees | % Employees |
| Private Company Employees | 20,066 | 68.5% |
| Self-Employed (Incorporated) | 2,201 | 7.5% |
| Self-Employed (Not Incorporated) | 1,528 | 5.2% |
| Not-for-profit Organizations | 2,379 | 8.1% |
| Local Government Employees | 2,212 | 7.5% |
| State Government Employees | 574 | 2.0% |
| Federal Government Employees | 307 | 1.1% |
| Unpaid Family Workers | 35 | 0.1% |
| Total | 29,302 | 100.0% |
Employment Status by Age in Palm Harbor
According to the labor force statistics for Palm Harbor, out of the total population over 16 years of age (52,605), 58.1% or 30,564 individuals are in the labor force, with 2.9% or 886 of them unemployed. The age group with the highest labor force participation rate is 25 to 29 years, with 89.8% or 3,086 individuals in the labor force. Within the labor force, the 16 to 19 years age range has the highest percentage of unemployed individuals, with 6.7% or 63 of them being unemployed.
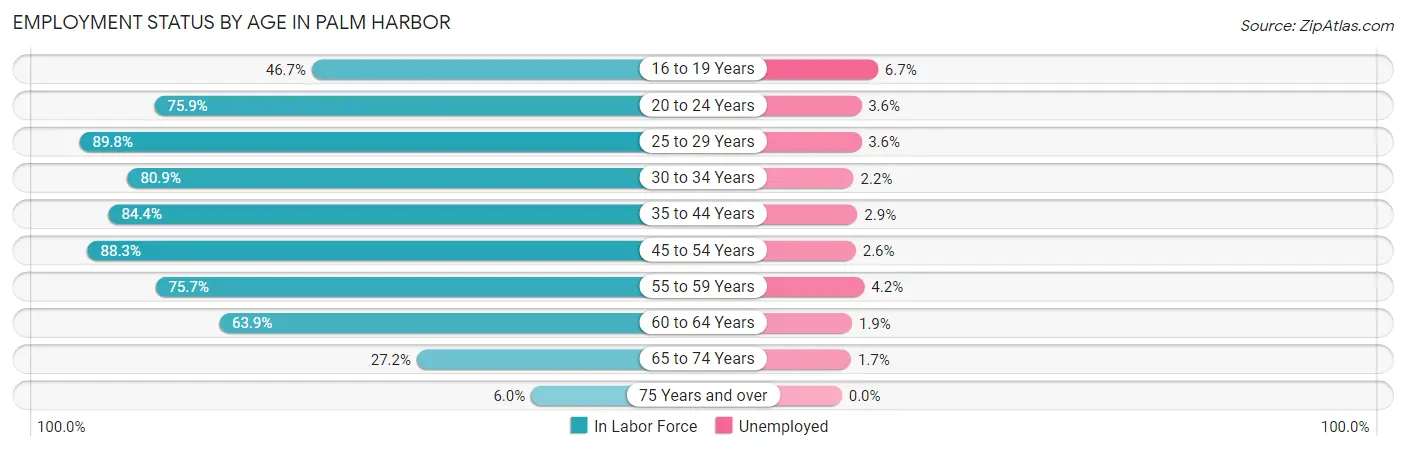
| Age Bracket | In Labor Force | Unemployed |
| 16 to 19 Years | 941 (46.7%) | 63 (6.7%) |
| 20 to 24 Years | 1,931 (75.9%) | 70 (3.6%) |
| 25 to 29 Years | 3,086 (89.8%) | 111 (3.6%) |
| 30 to 34 Years | 2,391 (80.9%) | 53 (2.2%) |
| 35 to 44 Years | 5,108 (84.4%) | 148 (2.9%) |
| 45 to 54 Years | 7,086 (88.3%) | 184 (2.6%) |
| 55 to 59 Years | 3,827 (75.7%) | 161 (4.2%) |
| 60 to 64 Years | 3,318 (63.9%) | 63 (1.9%) |
| 65 to 74 Years | 2,348 (27.2%) | 40 (1.7%) |
| 75 Years and over | 522 (6.0%) | 0 (0.0%) |
| Total | 30,564 (58.1%) | 886 (2.9%) |
Employment Status by Educational Attainment in Palm Harbor
According to labor force statistics for Palm Harbor, 80.8% of individuals (24,819) out of the total population between 25 and 64 years of age (30,716) are in the labor force, with 2.9% or 720 of them being unemployed. The group with the highest labor force participation rate are those with the educational attainment of bachelor's degree or higher, with 86.0% or 10,646 individuals in the labor force. Within the labor force, individuals with less than high school education have the highest percentage of unemployment, with 8.7% or 70 of them being unemployed.
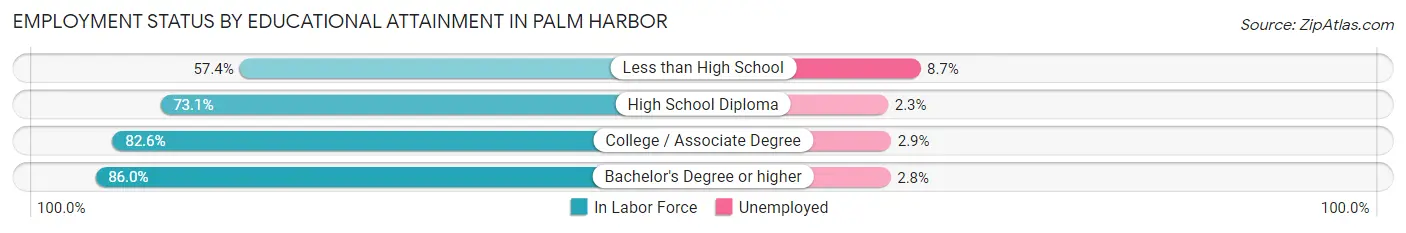
| Educational Attainment | In Labor Force | Unemployed |
| Less than High School | 804 (57.4%) | 122 (8.7%) |
| High School Diploma | 4,809 (73.1%) | 151 (2.3%) |
| College / Associate Degree | 8,557 (82.6%) | 300 (2.9%) |
| Bachelor's Degree or higher | 10,646 (86.0%) | 347 (2.8%) |
| Total | 24,819 (80.8%) | 891 (2.9%) |
Employment Occupations by Sex in Palm Harbor
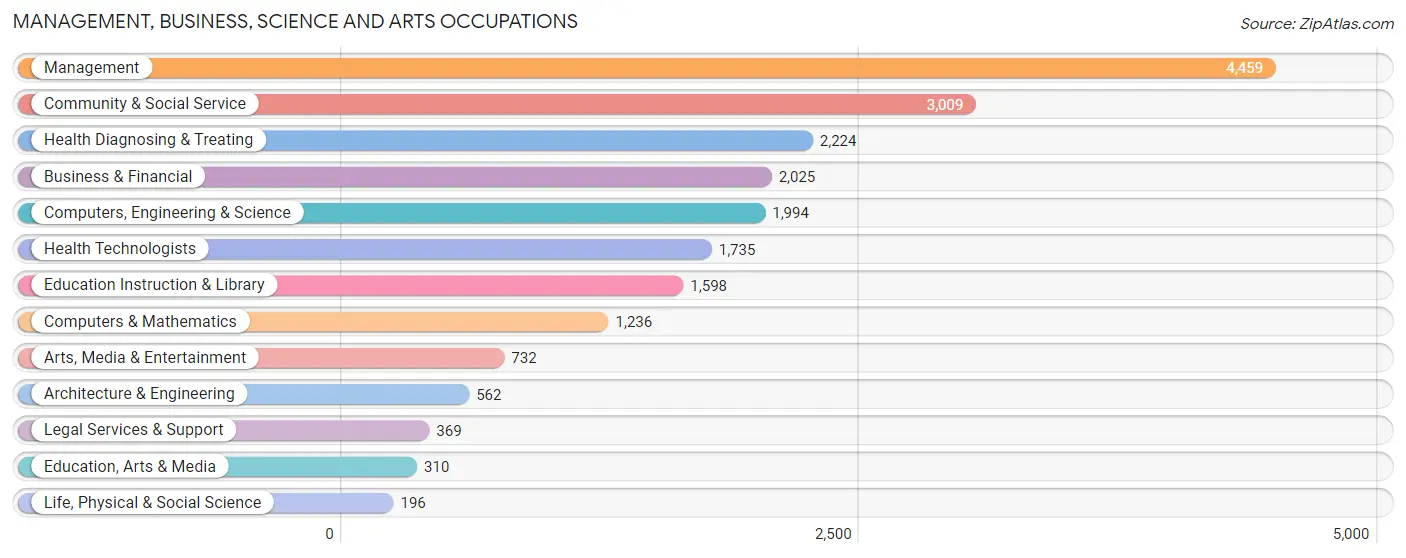
Management, Business, Science and Arts Occupations
The most common Management, Business, Science and Arts occupations in Palm Harbor are Management (4,459 | 15.1%), Community & Social Service (3,009 | 10.2%), Health Diagnosing & Treating (2,224 | 7.5%), Business & Financial (2,025 | 6.8%), and Computers, Engineering & Science (1,994 | 6.7%).
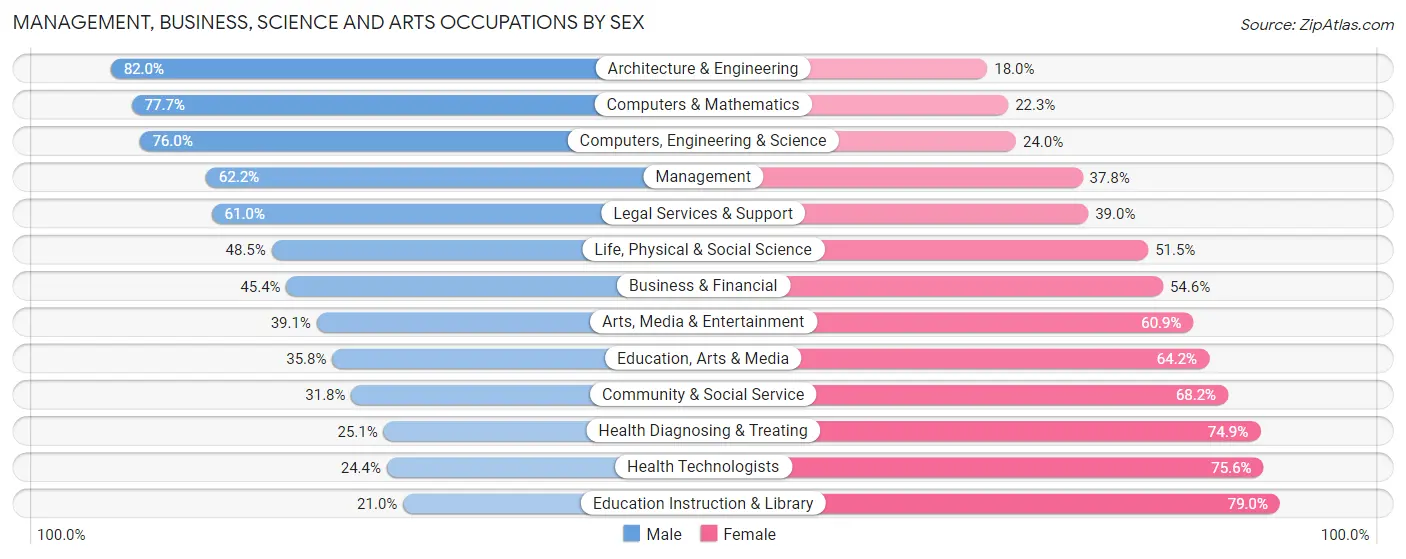
Management, Business, Science and Arts Occupations by Sex
Within the Management, Business, Science and Arts occupations in Palm Harbor, the most male-oriented occupations are Architecture & Engineering (82.0%), Computers & Mathematics (77.7%), and Computers, Engineering & Science (76.0%), while the most female-oriented occupations are Education Instruction & Library (79.0%), Health Technologists (75.6%), and Health Diagnosing & Treating (74.9%).
| Occupation | Male | Female |
| Management | 2,772 (62.2%) | 1,687 (37.8%) |
| Business & Financial | 919 (45.4%) | 1,106 (54.6%) |
| Computers, Engineering & Science | 1,516 (76.0%) | 478 (24.0%) |
| Computers & Mathematics | 960 (77.7%) | 276 (22.3%) |
| Architecture & Engineering | 461 (82.0%) | 101 (18.0%) |
| Life, Physical & Social Science | 95 (48.5%) | 101 (51.5%) |
| Community & Social Service | 958 (31.8%) | 2,051 (68.2%) |
| Education, Arts & Media | 111 (35.8%) | 199 (64.2%) |
| Legal Services & Support | 225 (61.0%) | 144 (39.0%) |
| Education Instruction & Library | 336 (21.0%) | 1,262 (79.0%) |
| Arts, Media & Entertainment | 286 (39.1%) | 446 (60.9%) |
| Health Diagnosing & Treating | 559 (25.1%) | 1,665 (74.9%) |
| Health Technologists | 424 (24.4%) | 1,311 (75.6%) |
| Total (Category) | 6,724 (49.0%) | 6,987 (51.0%) |
| Total (Overall) | 15,023 (50.7%) | 14,589 (49.3%) |
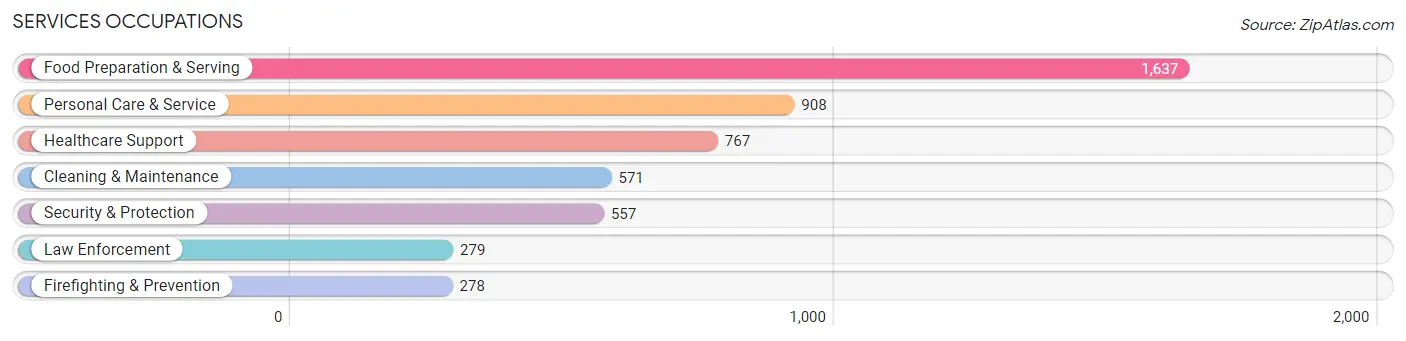
Services Occupations
The most common Services occupations in Palm Harbor are Food Preparation & Serving (1,637 | 5.5%), Personal Care & Service (908 | 3.1%), Healthcare Support (767 | 2.6%), Cleaning & Maintenance (571 | 1.9%), and Security & Protection (557 | 1.9%).
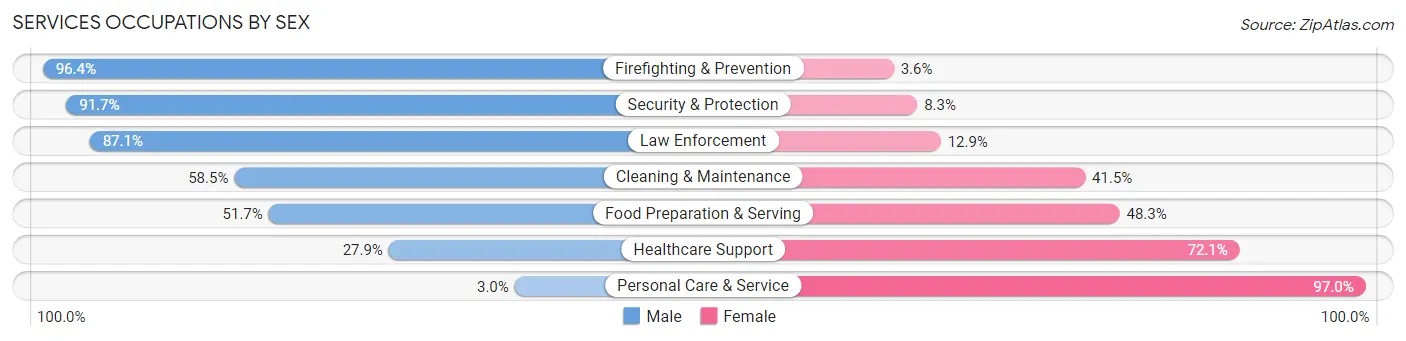
Services Occupations by Sex
Within the Services occupations in Palm Harbor, the most male-oriented occupations are Firefighting & Prevention (96.4%), Security & Protection (91.7%), and Law Enforcement (87.1%), while the most female-oriented occupations are Personal Care & Service (97.0%), Healthcare Support (72.1%), and Food Preparation & Serving (48.3%).
| Occupation | Male | Female |
| Healthcare Support | 214 (27.9%) | 553 (72.1%) |
| Security & Protection | 511 (91.7%) | 46 (8.3%) |
| Firefighting & Prevention | 268 (96.4%) | 10 (3.6%) |
| Law Enforcement | 243 (87.1%) | 36 (12.9%) |
| Food Preparation & Serving | 846 (51.7%) | 791 (48.3%) |
| Cleaning & Maintenance | 334 (58.5%) | 237 (41.5%) |
| Personal Care & Service | 27 (3.0%) | 881 (97.0%) |
| Total (Category) | 1,932 (43.5%) | 2,508 (56.5%) |
| Total (Overall) | 15,023 (50.7%) | 14,589 (49.3%) |
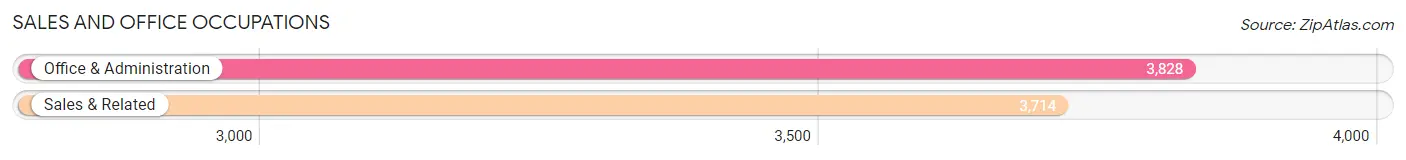
Sales and Office Occupations
The most common Sales and Office occupations in Palm Harbor are Office & Administration (3,828 | 12.9%), and Sales & Related (3,714 | 12.5%).
Sales and Office Occupations by Sex
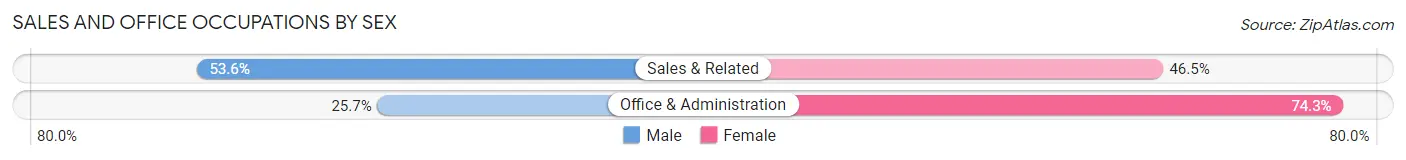
| Occupation | Male | Female |
| Sales & Related | 1,989 (53.5%) | 1,725 (46.5%) |
| Office & Administration | 984 (25.7%) | 2,844 (74.3%) |
| Total (Category) | 2,973 (39.4%) | 4,569 (60.6%) |
| Total (Overall) | 15,023 (50.7%) | 14,589 (49.3%) |
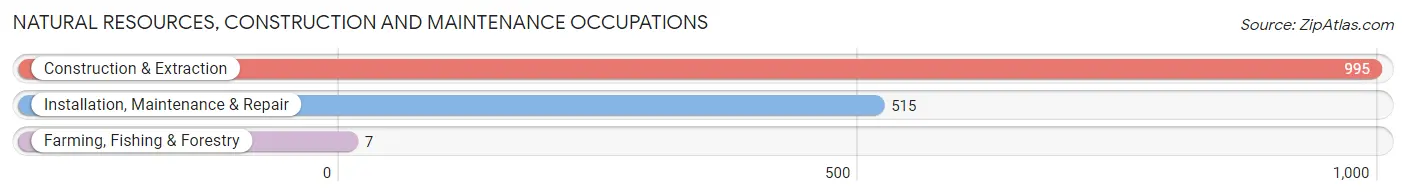
Natural Resources, Construction and Maintenance Occupations
The most common Natural Resources, Construction and Maintenance occupations in Palm Harbor are Construction & Extraction (995 | 3.4%), Installation, Maintenance & Repair (515 | 1.7%), and Farming, Fishing & Forestry (7 | 0.0%).
Natural Resources, Construction and Maintenance Occupations by Sex
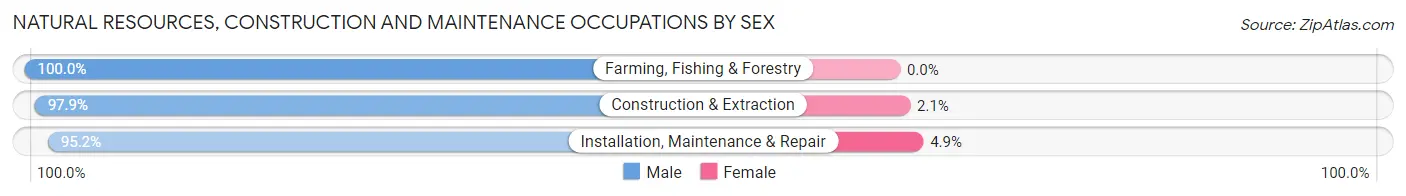
| Occupation | Male | Female |
| Farming, Fishing & Forestry | 7 (100.0%) | 0 (0.0%) |
| Construction & Extraction | 974 (97.9%) | 21 (2.1%) |
| Installation, Maintenance & Repair | 490 (95.2%) | 25 (4.9%) |
| Total (Category) | 1,471 (97.0%) | 46 (3.0%) |
| Total (Overall) | 15,023 (50.7%) | 14,589 (49.3%) |
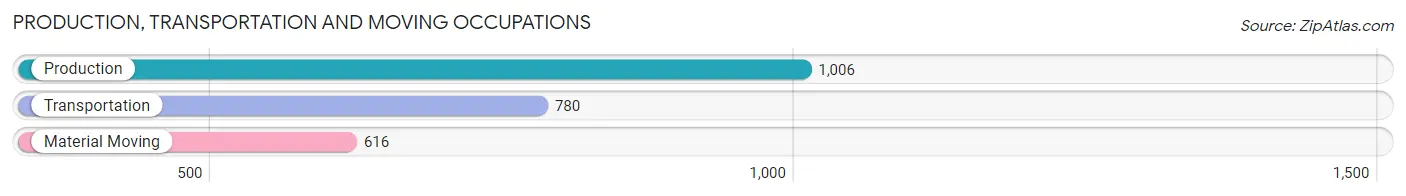
Production, Transportation and Moving Occupations
The most common Production, Transportation and Moving occupations in Palm Harbor are Production (1,006 | 3.4%), Transportation (780 | 2.6%), and Material Moving (616 | 2.1%).
Production, Transportation and Moving Occupations by Sex
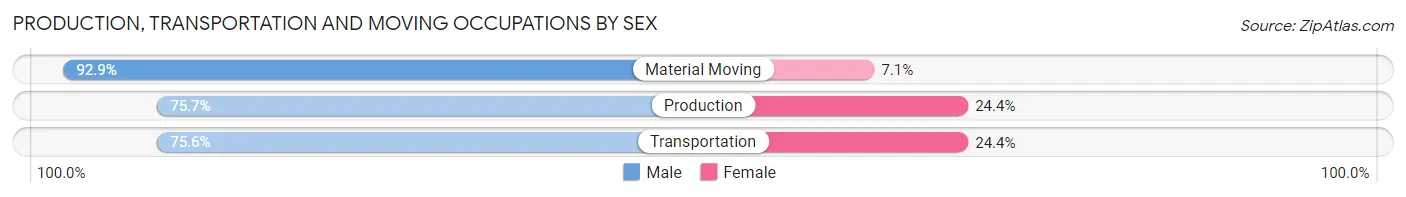
| Occupation | Male | Female |
| Production | 761 (75.6%) | 245 (24.3%) |
| Transportation | 590 (75.6%) | 190 (24.4%) |
| Material Moving | 572 (92.9%) | 44 (7.1%) |
| Total (Category) | 1,923 (80.1%) | 479 (19.9%) |
| Total (Overall) | 15,023 (50.7%) | 14,589 (49.3%) |
Employment Industries by Sex in Palm Harbor
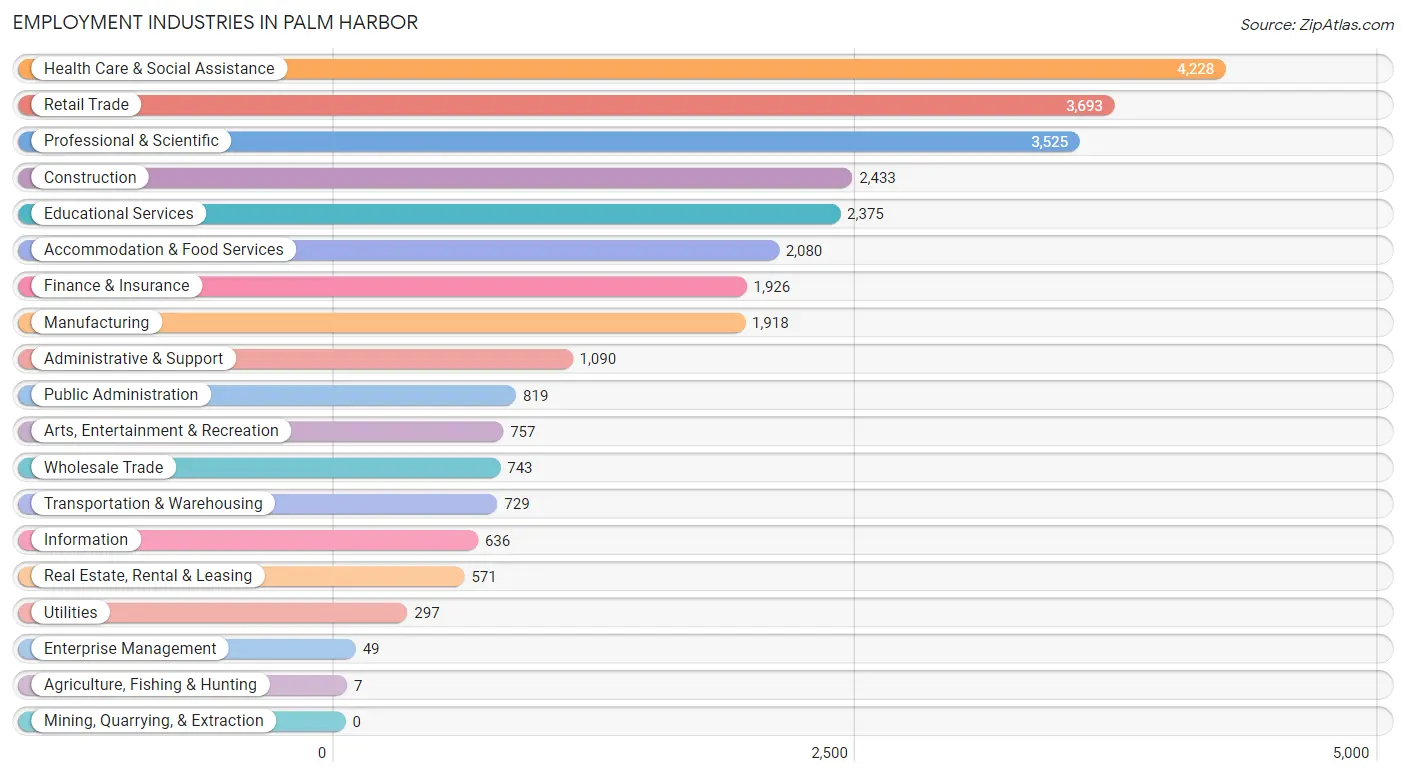
Employment Industries in Palm Harbor
The major employment industries in Palm Harbor include Health Care & Social Assistance (4,228 | 14.3%), Retail Trade (3,693 | 12.5%), Professional & Scientific (3,525 | 11.9%), Construction (2,433 | 8.2%), and Educational Services (2,375 | 8.0%).
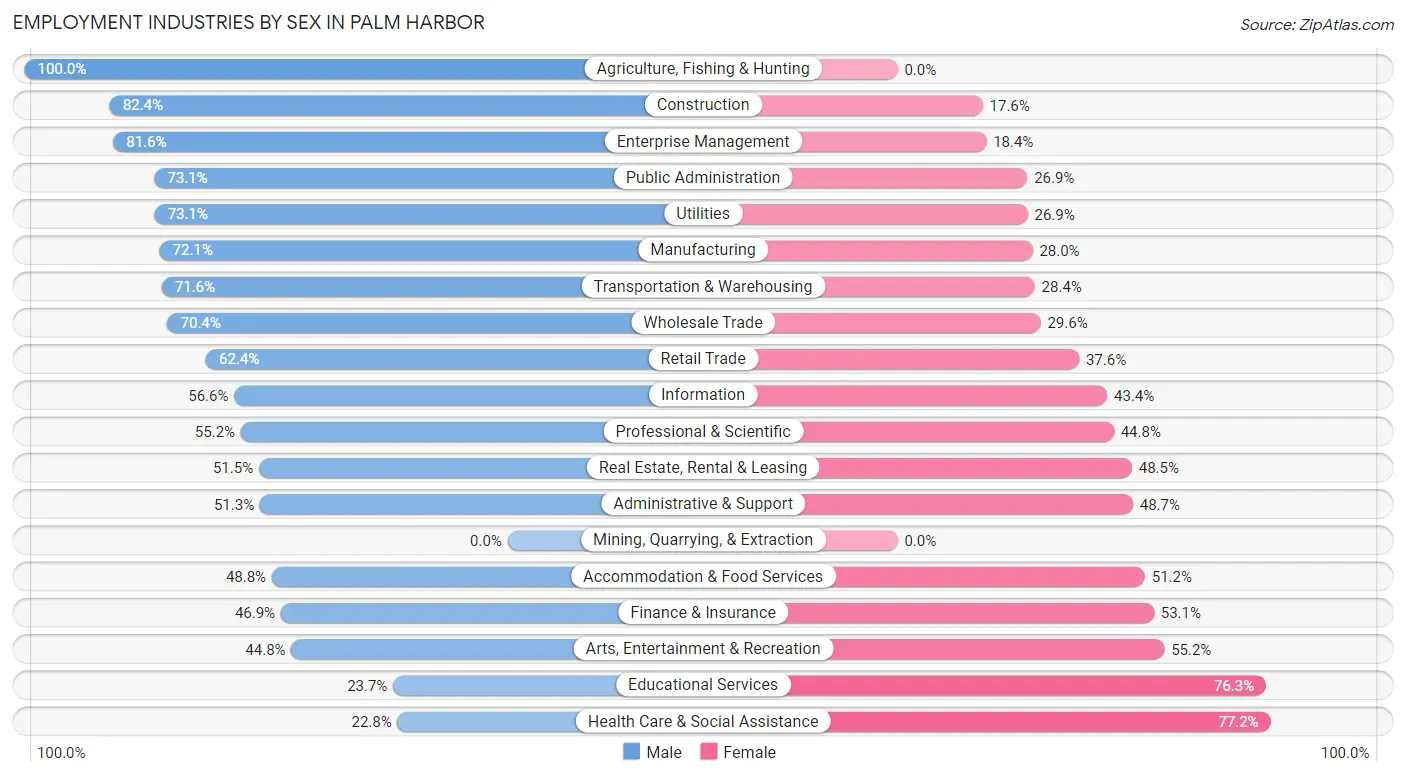
Employment Industries by Sex in Palm Harbor
The Palm Harbor industries that see more men than women are Agriculture, Fishing & Hunting (100.0%), Construction (82.4%), and Enterprise Management (81.6%), whereas the industries that tend to have a higher number of women are Health Care & Social Assistance (77.2%), Educational Services (76.3%), and Arts, Entertainment & Recreation (55.2%).
| Industry | Male | Female |
| Agriculture, Fishing & Hunting | 7 (100.0%) | 0 (0.0%) |
| Mining, Quarrying, & Extraction | 0 (0.0%) | 0 (0.0%) |
| Construction | 2,004 (82.4%) | 429 (17.6%) |
| Manufacturing | 1,382 (72.1%) | 536 (28.0%) |
| Wholesale Trade | 523 (70.4%) | 220 (29.6%) |
| Retail Trade | 2,305 (62.4%) | 1,388 (37.6%) |
| Transportation & Warehousing | 522 (71.6%) | 207 (28.4%) |
| Utilities | 217 (73.1%) | 80 (26.9%) |
| Information | 360 (56.6%) | 276 (43.4%) |
| Finance & Insurance | 904 (46.9%) | 1,022 (53.1%) |
| Real Estate, Rental & Leasing | 294 (51.5%) | 277 (48.5%) |
| Professional & Scientific | 1,947 (55.2%) | 1,578 (44.8%) |
| Enterprise Management | 40 (81.6%) | 9 (18.4%) |
| Administrative & Support | 559 (51.3%) | 531 (48.7%) |
| Educational Services | 563 (23.7%) | 1,812 (76.3%) |
| Health Care & Social Assistance | 964 (22.8%) | 3,264 (77.2%) |
| Arts, Entertainment & Recreation | 339 (44.8%) | 418 (55.2%) |
| Accommodation & Food Services | 1,015 (48.8%) | 1,065 (51.2%) |
| Public Administration | 599 (73.1%) | 220 (26.9%) |
| Total | 15,023 (50.7%) | 14,589 (49.3%) |
Education in Palm Harbor
School Enrollment in Palm Harbor
The most common levels of schooling among the 11,232 students in Palm Harbor are high school (2,824 | 25.1%), elementary school (2,405 | 21.4%), and college / undergraduate (2,048 | 18.2%).
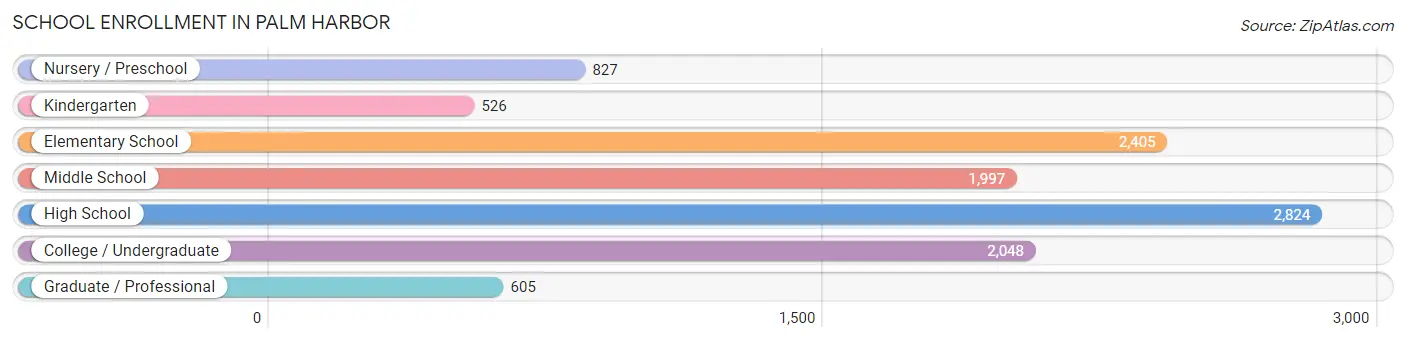
| School Level | # Students | % Students |
| Nursery / Preschool | 827 | 7.4% |
| Kindergarten | 526 | 4.7% |
| Elementary School | 2,405 | 21.4% |
| Middle School | 1,997 | 17.8% |
| High School | 2,824 | 25.1% |
| College / Undergraduate | 2,048 | 18.2% |
| Graduate / Professional | 605 | 5.4% |
| Total | 11,232 | 100.0% |
School Enrollment by Age by Funding Source in Palm Harbor
Out of a total of 11,232 students who are enrolled in schools in Palm Harbor, 1,921 (17.1%) attend a private institution, while the remaining 9,311 (82.9%) are enrolled in public schools. The age group of 3 to 4 year olds has the highest likelihood of being enrolled in private schools, with 463 (71.3% in the age bracket) enrolled. Conversely, the age group of 18 to 19 year olds has the lowest likelihood of being enrolled in a private school, with 568 (96.4% in the age bracket) attending a public institution.
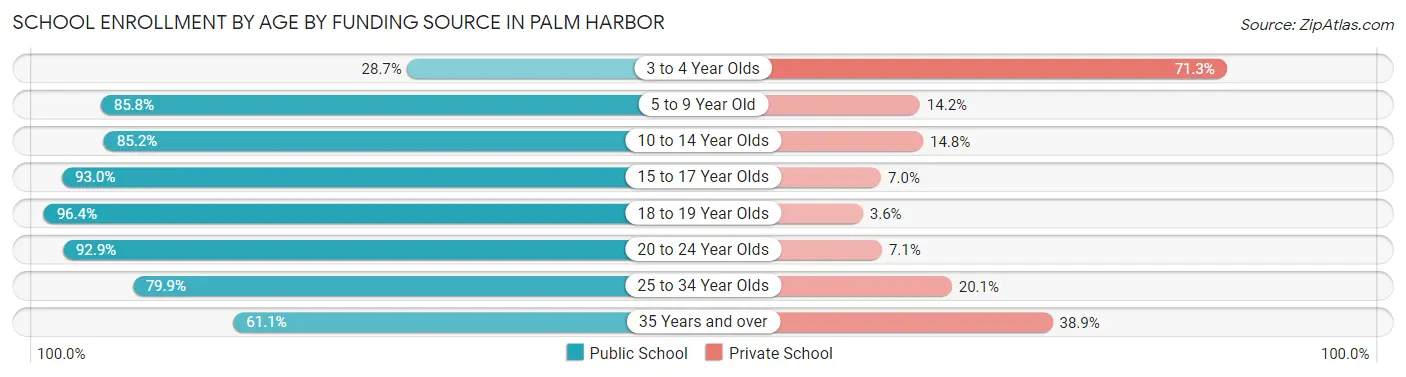
| Age Bracket | Public School | Private School |
| 3 to 4 Year Olds | 186 (28.7%) | 463 (71.3%) |
| 5 to 9 Year Old | 2,375 (85.8%) | 393 (14.2%) |
| 10 to 14 Year Olds | 2,392 (85.2%) | 415 (14.8%) |
| 15 to 17 Year Olds | 1,905 (93.0%) | 143 (7.0%) |
| 18 to 19 Year Olds | 568 (96.4%) | 21 (3.6%) |
| 20 to 24 Year Olds | 858 (92.9%) | 66 (7.1%) |
| 25 to 34 Year Olds | 587 (79.9%) | 148 (20.1%) |
| 35 Years and over | 435 (61.1%) | 277 (38.9%) |
| Total | 9,311 (82.9%) | 1,921 (17.1%) |
Educational Attainment by Field of Study in Palm Harbor
Business (4,329 | 23.3%), education (2,864 | 15.4%), science & technology (1,915 | 10.3%), social sciences (1,425 | 7.6%), and arts & humanities (1,132 | 6.1%) are the most common fields of study among 18,621 individuals in Palm Harbor who have obtained a bachelor's degree or higher.
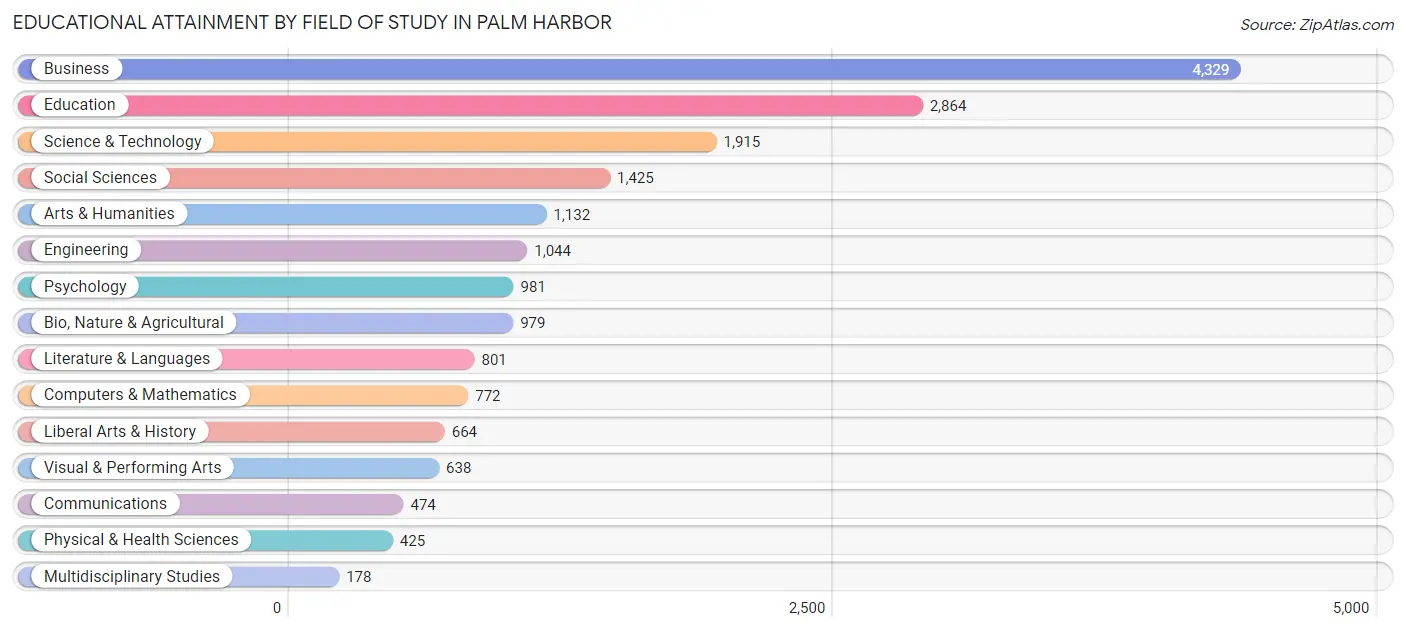
| Field of Study | # Graduates | % Graduates |
| Computers & Mathematics | 772 | 4.2% |
| Bio, Nature & Agricultural | 979 | 5.3% |
| Physical & Health Sciences | 425 | 2.3% |
| Psychology | 981 | 5.3% |
| Social Sciences | 1,425 | 7.6% |
| Engineering | 1,044 | 5.6% |
| Multidisciplinary Studies | 178 | 1.0% |
| Science & Technology | 1,915 | 10.3% |
| Business | 4,329 | 23.3% |
| Education | 2,864 | 15.4% |
| Literature & Languages | 801 | 4.3% |
| Liberal Arts & History | 664 | 3.6% |
| Visual & Performing Arts | 638 | 3.4% |
| Communications | 474 | 2.5% |
| Arts & Humanities | 1,132 | 6.1% |
| Total | 18,621 | 100.0% |
Transportation & Commute in Palm Harbor
Vehicle Availability by Sex in Palm Harbor
The most prevalent vehicle ownership categories in Palm Harbor are males with 2 vehicles (7,507, accounting for 50.5%) and females with 2 vehicles (7,050, making up 52.1%).
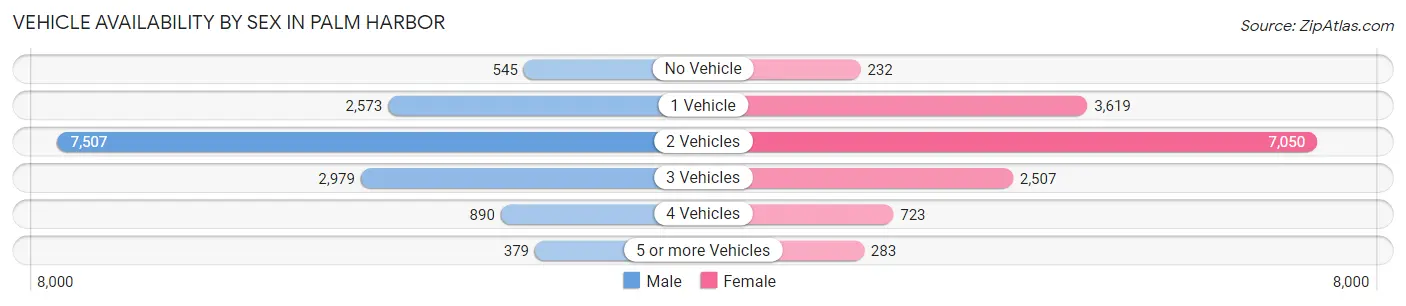
| Vehicles Available | Male | Female |
| No Vehicle | 545 (3.7%) | 232 (1.6%) |
| 1 Vehicle | 2,573 (17.3%) | 3,619 (25.1%) |
| 2 Vehicles | 7,507 (50.5%) | 7,050 (48.9%) |
| 3 Vehicles | 2,979 (20.0%) | 2,507 (17.4%) |
| 4 Vehicles | 890 (6.0%) | 723 (5.0%) |
| 5 or more Vehicles | 379 (2.5%) | 283 (2.0%) |
| Total | 14,873 (100.0%) | 14,414 (100.0%) |
Commute Time in Palm Harbor
The most frequently occuring commute durations in Palm Harbor are 20 to 24 minutes (3,348 commuters, 13.9%), 15 to 19 minutes (3,108 commuters, 12.9%), and 10 to 14 minutes (3,065 commuters, 12.7%).
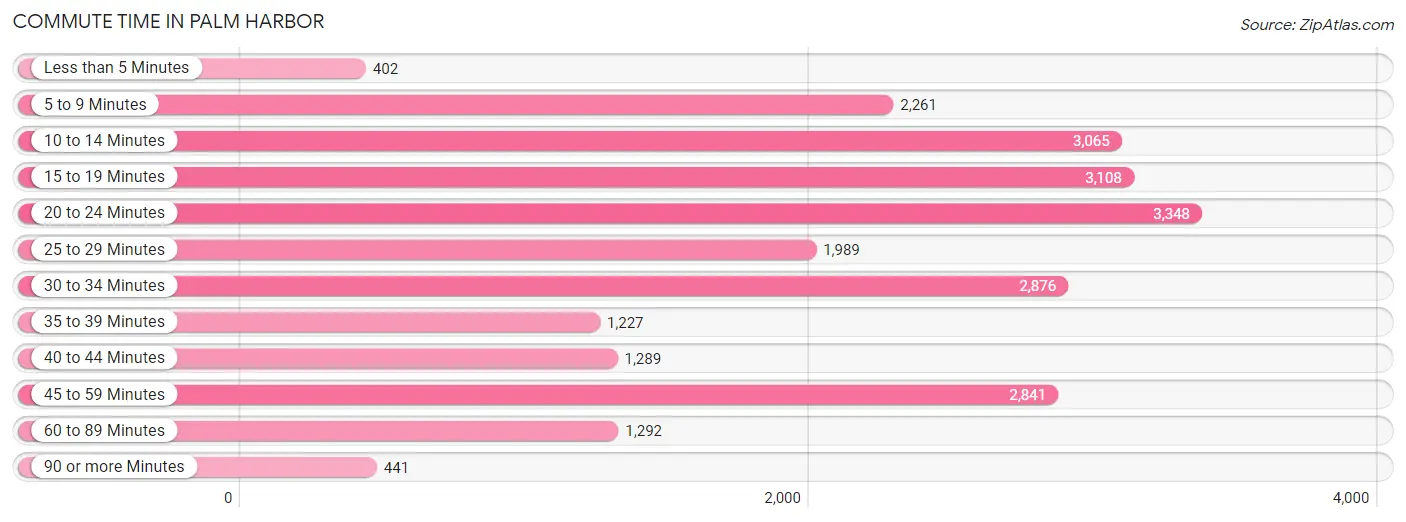
| Commute Time | # Commuters | % Commuters |
| Less than 5 Minutes | 402 | 1.7% |
| 5 to 9 Minutes | 2,261 | 9.4% |
| 10 to 14 Minutes | 3,065 | 12.7% |
| 15 to 19 Minutes | 3,108 | 12.9% |
| 20 to 24 Minutes | 3,348 | 13.9% |
| 25 to 29 Minutes | 1,989 | 8.2% |
| 30 to 34 Minutes | 2,876 | 11.9% |
| 35 to 39 Minutes | 1,227 | 5.1% |
| 40 to 44 Minutes | 1,289 | 5.3% |
| 45 to 59 Minutes | 2,841 | 11.8% |
| 60 to 89 Minutes | 1,292 | 5.3% |
| 90 or more Minutes | 441 | 1.8% |
Commute Time by Sex in Palm Harbor
The most common commute times in Palm Harbor are 45 to 59 minutes (1,831 commuters, 14.5%) for males and 15 to 19 minutes (1,745 commuters, 15.1%) for females.
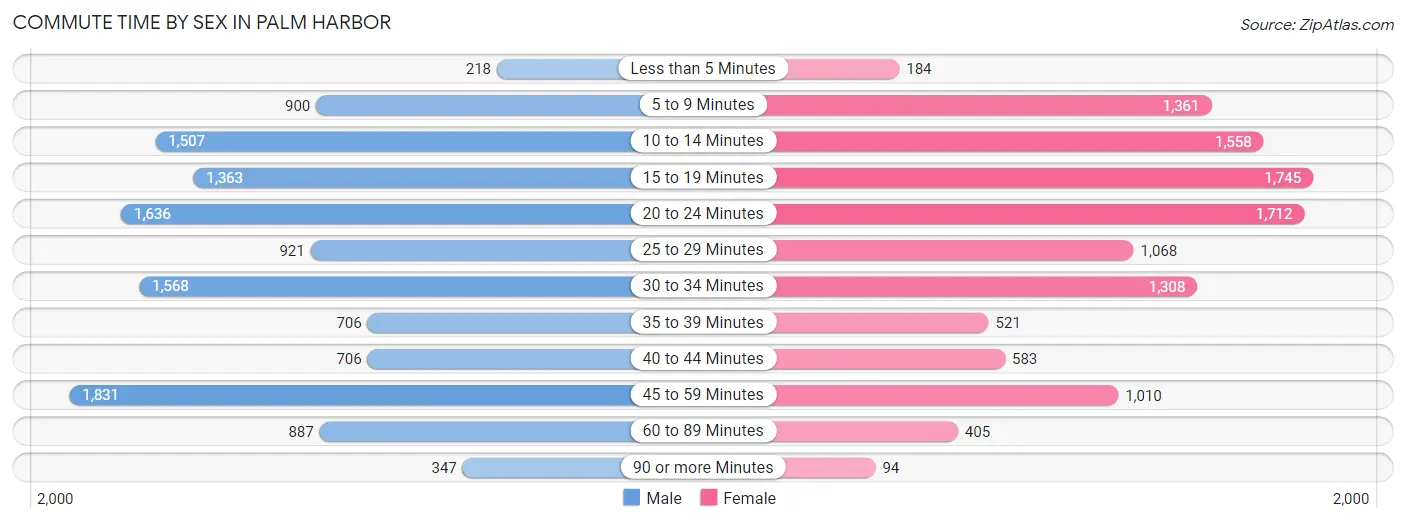
| Commute Time | Male | Female |
| Less than 5 Minutes | 218 (1.7%) | 184 (1.6%) |
| 5 to 9 Minutes | 900 (7.1%) | 1,361 (11.8%) |
| 10 to 14 Minutes | 1,507 (12.0%) | 1,558 (13.5%) |
| 15 to 19 Minutes | 1,363 (10.8%) | 1,745 (15.1%) |
| 20 to 24 Minutes | 1,636 (13.0%) | 1,712 (14.8%) |
| 25 to 29 Minutes | 921 (7.3%) | 1,068 (9.2%) |
| 30 to 34 Minutes | 1,568 (12.4%) | 1,308 (11.3%) |
| 35 to 39 Minutes | 706 (5.6%) | 521 (4.5%) |
| 40 to 44 Minutes | 706 (5.6%) | 583 (5.1%) |
| 45 to 59 Minutes | 1,831 (14.5%) | 1,010 (8.7%) |
| 60 to 89 Minutes | 887 (7.0%) | 405 (3.5%) |
| 90 or more Minutes | 347 (2.8%) | 94 (0.8%) |
Time of Departure to Work by Sex in Palm Harbor
The most frequent times of departure to work in Palm Harbor are 7:00 AM to 7:29 AM (1,640, 13.0%) for males and 7:30 AM to 7:59 AM (1,874, 16.2%) for females.
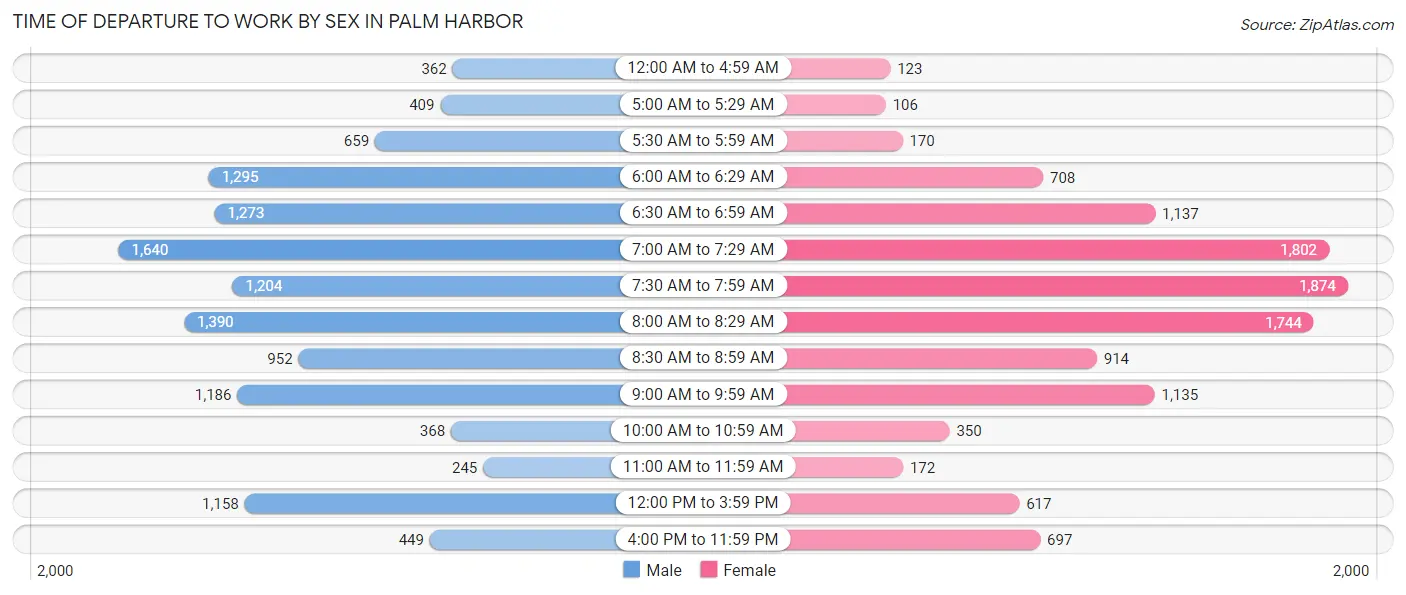
| Time of Departure | Male | Female |
| 12:00 AM to 4:59 AM | 362 (2.9%) | 123 (1.1%) |
| 5:00 AM to 5:29 AM | 409 (3.3%) | 106 (0.9%) |
| 5:30 AM to 5:59 AM | 659 (5.2%) | 170 (1.5%) |
| 6:00 AM to 6:29 AM | 1,295 (10.3%) | 708 (6.1%) |
| 6:30 AM to 6:59 AM | 1,273 (10.1%) | 1,137 (9.9%) |
| 7:00 AM to 7:29 AM | 1,640 (13.0%) | 1,802 (15.6%) |
| 7:30 AM to 7:59 AM | 1,204 (9.6%) | 1,874 (16.2%) |
| 8:00 AM to 8:29 AM | 1,390 (11.0%) | 1,744 (15.1%) |
| 8:30 AM to 8:59 AM | 952 (7.6%) | 914 (7.9%) |
| 9:00 AM to 9:59 AM | 1,186 (9.4%) | 1,135 (9.8%) |
| 10:00 AM to 10:59 AM | 368 (2.9%) | 350 (3.0%) |
| 11:00 AM to 11:59 AM | 245 (1.9%) | 172 (1.5%) |
| 12:00 PM to 3:59 PM | 1,158 (9.2%) | 617 (5.3%) |
| 4:00 PM to 11:59 PM | 449 (3.6%) | 697 (6.0%) |
| Total | 12,590 (100.0%) | 11,549 (100.0%) |
Housing Occupancy in Palm Harbor
Occupancy by Ownership in Palm Harbor
Of the total 26,882 dwellings in Palm Harbor, owner-occupied units account for 20,559 (76.5%), while renter-occupied units make up 6,323 (23.5%).
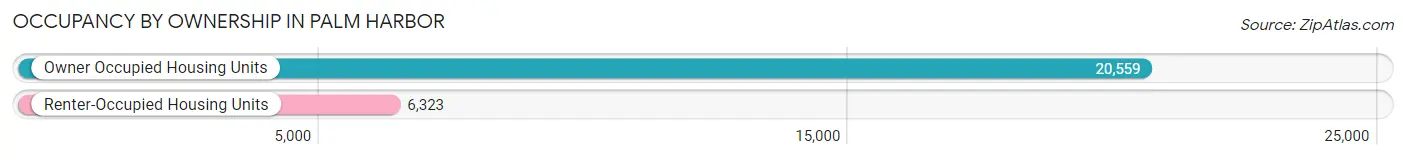
| Occupancy | # Housing Units | % Housing Units |
| Owner Occupied Housing Units | 20,559 | 76.5% |
| Renter-Occupied Housing Units | 6,323 | 23.5% |
| Total Occupied Housing Units | 26,882 | 100.0% |
Occupancy by Household Size in Palm Harbor
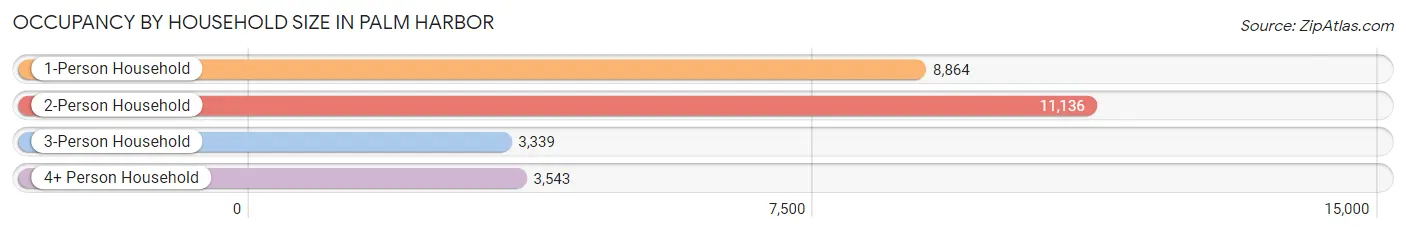
| Household Size | # Housing Units | % Housing Units |
| 1-Person Household | 8,864 | 33.0% |
| 2-Person Household | 11,136 | 41.4% |
| 3-Person Household | 3,339 | 12.4% |
| 4+ Person Household | 3,543 | 13.2% |
| Total Housing Units | 26,882 | 100.0% |
Occupancy by Ownership by Household Size in Palm Harbor
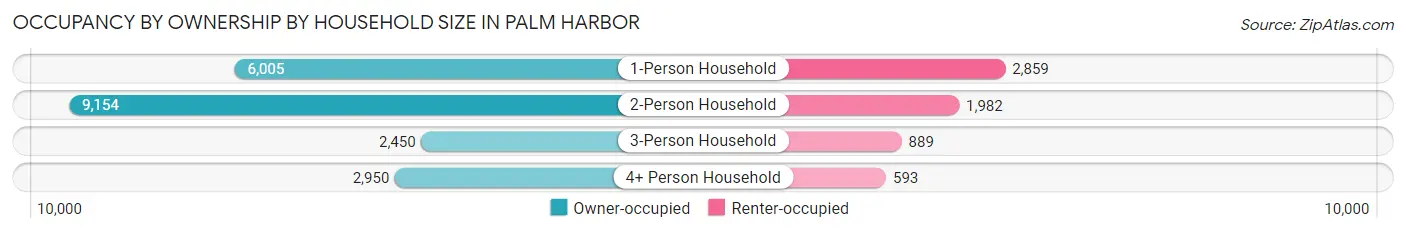
| Household Size | Owner-occupied | Renter-occupied |
| 1-Person Household | 6,005 (67.7%) | 2,859 (32.3%) |
| 2-Person Household | 9,154 (82.2%) | 1,982 (17.8%) |
| 3-Person Household | 2,450 (73.4%) | 889 (26.6%) |
| 4+ Person Household | 2,950 (83.3%) | 593 (16.7%) |
| Total Housing Units | 20,559 (76.5%) | 6,323 (23.5%) |
Occupancy by Educational Attainment in Palm Harbor
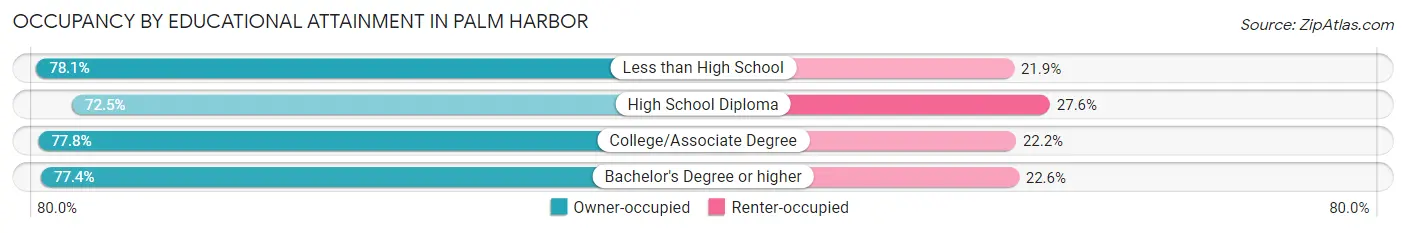
| Household Size | Owner-occupied | Renter-occupied |
| Less than High School | 922 (78.1%) | 258 (21.9%) |
| High School Diploma | 4,296 (72.5%) | 1,634 (27.6%) |
| College/Associate Degree | 7,159 (77.8%) | 2,039 (22.2%) |
| Bachelor's Degree or higher | 8,182 (77.4%) | 2,392 (22.6%) |
Occupancy by Age of Householder in Palm Harbor
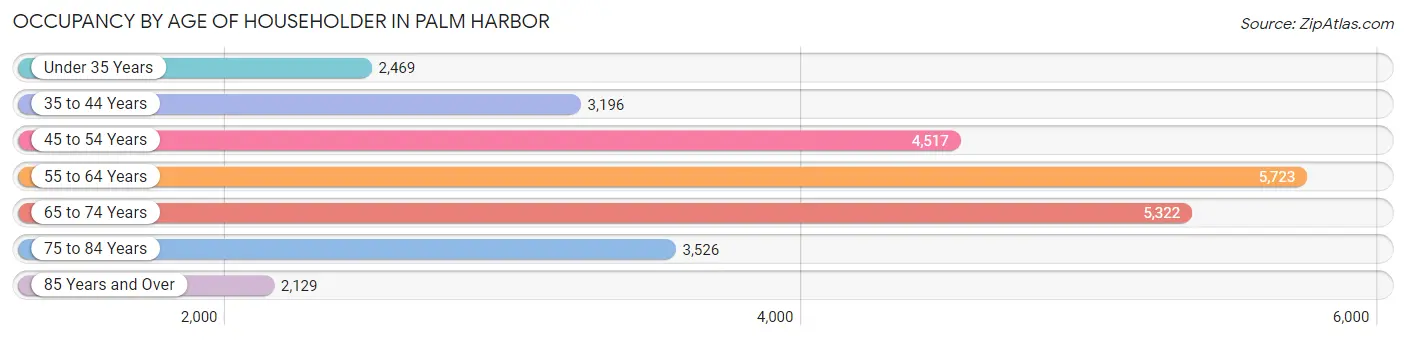
| Age Bracket | # Households | % Households |
| Under 35 Years | 2,469 | 9.2% |
| 35 to 44 Years | 3,196 | 11.9% |
| 45 to 54 Years | 4,517 | 16.8% |
| 55 to 64 Years | 5,723 | 21.3% |
| 65 to 74 Years | 5,322 | 19.8% |
| 75 to 84 Years | 3,526 | 13.1% |
| 85 Years and Over | 2,129 | 7.9% |
| Total | 26,882 | 100.0% |
Housing Finances in Palm Harbor
Median Income by Occupancy in Palm Harbor
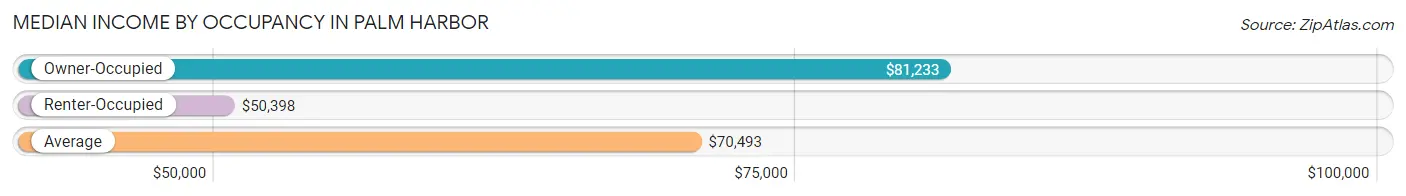
| Occupancy Type | # Households | Median Income |
| Owner-Occupied | 20,559 (76.5%) | $81,233 |
| Renter-Occupied | 6,323 (23.5%) | $50,398 |
| Average | 26,882 (100.0%) | $70,493 |
Occupancy by Householder Income Bracket in Palm Harbor
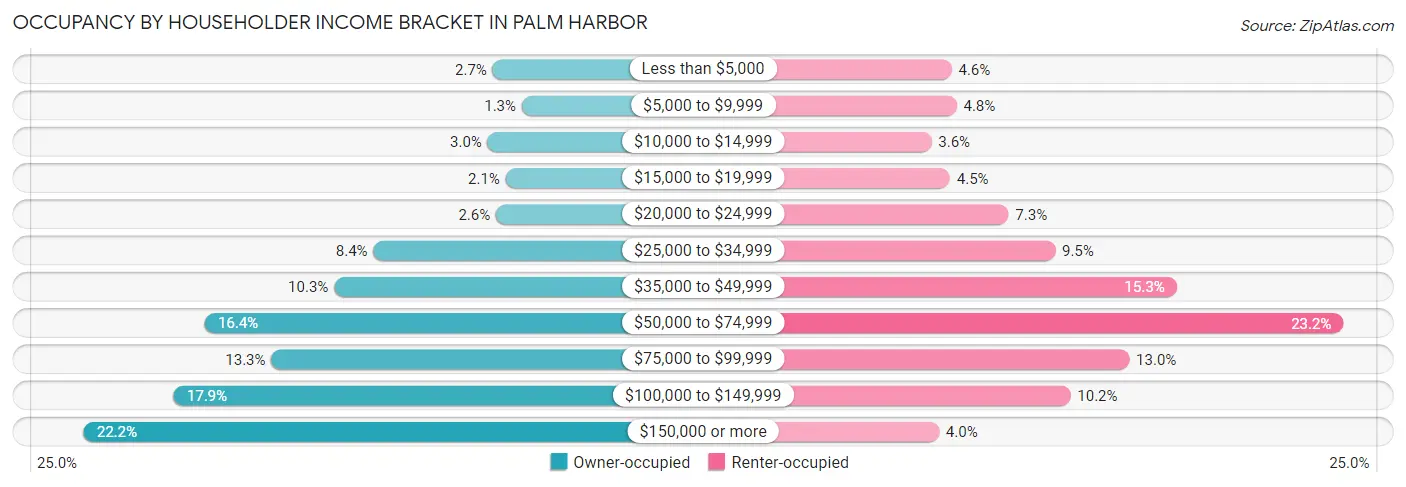
| Income Bracket | Owner-occupied | Renter-occupied |
| Less than $5,000 | 557 (2.7%) | 289 (4.6%) |
| $5,000 to $9,999 | 272 (1.3%) | 304 (4.8%) |
| $10,000 to $14,999 | 606 (2.9%) | 228 (3.6%) |
| $15,000 to $19,999 | 429 (2.1%) | 284 (4.5%) |
| $20,000 to $24,999 | 525 (2.5%) | 460 (7.3%) |
| $25,000 to $34,999 | 1,724 (8.4%) | 601 (9.5%) |
| $35,000 to $49,999 | 2,110 (10.3%) | 967 (15.3%) |
| $50,000 to $74,999 | 3,373 (16.4%) | 1,468 (23.2%) |
| $75,000 to $99,999 | 2,724 (13.3%) | 824 (13.0%) |
| $100,000 to $149,999 | 3,678 (17.9%) | 647 (10.2%) |
| $150,000 or more | 4,561 (22.2%) | 251 (4.0%) |
| Total | 20,559 (100.0%) | 6,323 (100.0%) |
Monthly Housing Cost Tiers in Palm Harbor
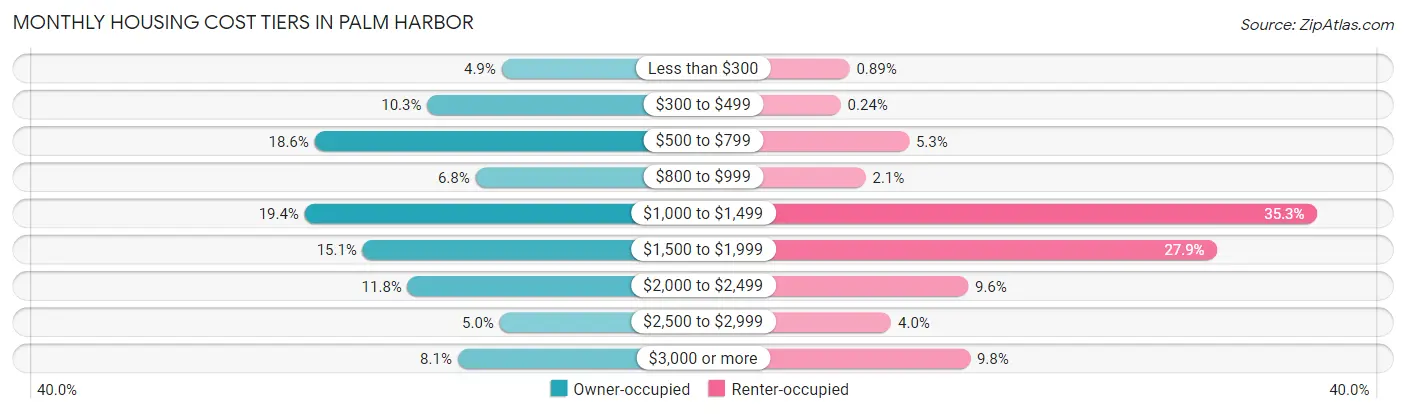
| Monthly Cost | Owner-occupied | Renter-occupied |
| Less than $300 | 1,001 (4.9%) | 56 (0.9%) |
| $300 to $499 | 2,125 (10.3%) | 15 (0.2%) |
| $500 to $799 | 3,833 (18.6%) | 333 (5.3%) |
| $800 to $999 | 1,395 (6.8%) | 131 (2.1%) |
| $1,000 to $1,499 | 3,982 (19.4%) | 2,230 (35.3%) |
| $1,500 to $1,999 | 3,105 (15.1%) | 1,765 (27.9%) |
| $2,000 to $2,499 | 2,423 (11.8%) | 608 (9.6%) |
| $2,500 to $2,999 | 1,029 (5.0%) | 250 (4.0%) |
| $3,000 or more | 1,666 (8.1%) | 617 (9.8%) |
| Total | 20,559 (100.0%) | 6,323 (100.0%) |
Physical Housing Characteristics in Palm Harbor
Housing Structures in Palm Harbor
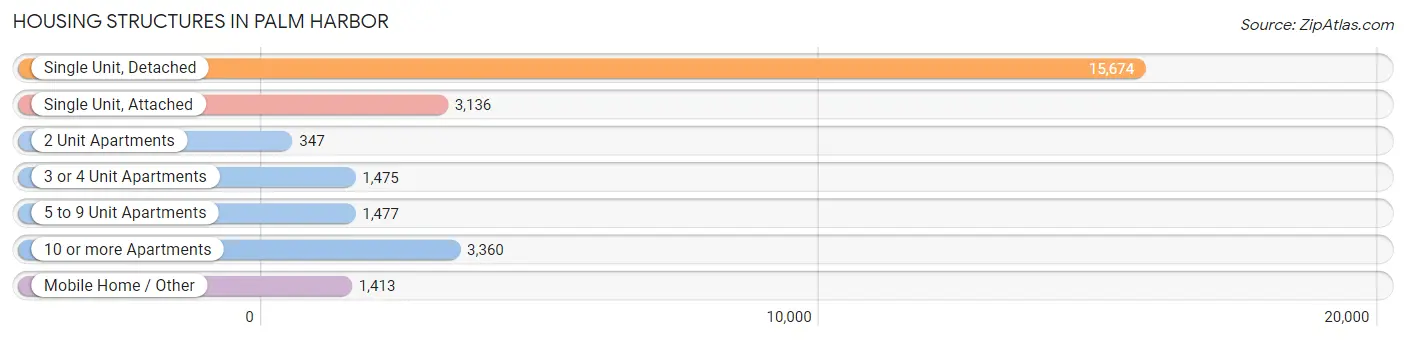
| Structure Type | # Housing Units | % Housing Units |
| Single Unit, Detached | 15,674 | 58.3% |
| Single Unit, Attached | 3,136 | 11.7% |
| 2 Unit Apartments | 347 | 1.3% |
| 3 or 4 Unit Apartments | 1,475 | 5.5% |
| 5 to 9 Unit Apartments | 1,477 | 5.5% |
| 10 or more Apartments | 3,360 | 12.5% |
| Mobile Home / Other | 1,413 | 5.3% |
| Total | 26,882 | 100.0% |
Housing Structures by Occupancy in Palm Harbor
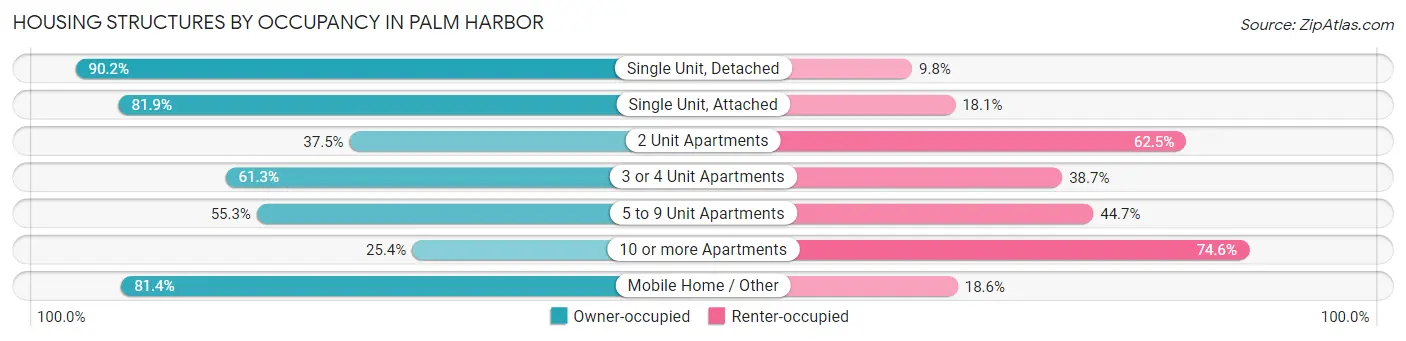
| Structure Type | Owner-occupied | Renter-occupied |
| Single Unit, Detached | 14,137 (90.2%) | 1,537 (9.8%) |
| Single Unit, Attached | 2,568 (81.9%) | 568 (18.1%) |
| 2 Unit Apartments | 130 (37.5%) | 217 (62.5%) |
| 3 or 4 Unit Apartments | 904 (61.3%) | 571 (38.7%) |
| 5 to 9 Unit Apartments | 817 (55.3%) | 660 (44.7%) |
| 10 or more Apartments | 853 (25.4%) | 2,507 (74.6%) |
| Mobile Home / Other | 1,150 (81.4%) | 263 (18.6%) |
| Total | 20,559 (76.5%) | 6,323 (23.5%) |
Housing Structures by Number of Rooms in Palm Harbor
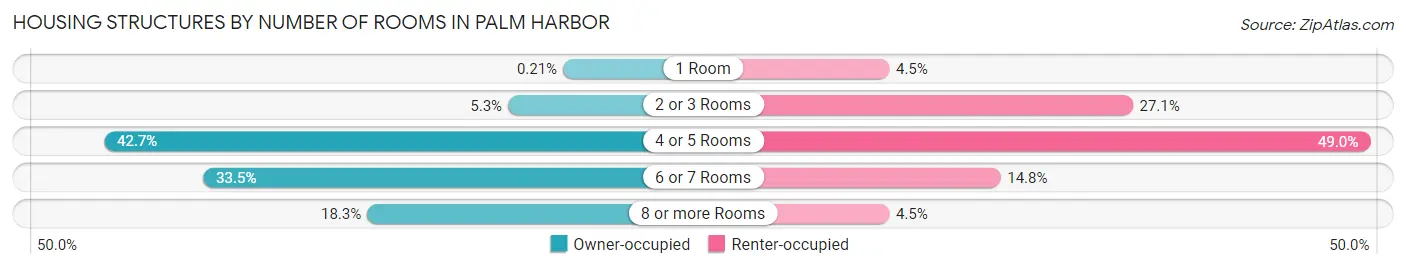
| Number of Rooms | Owner-occupied | Renter-occupied |
| 1 Room | 44 (0.2%) | 287 (4.5%) |
| 2 or 3 Rooms | 1,089 (5.3%) | 1,711 (27.1%) |
| 4 or 5 Rooms | 8,771 (42.7%) | 3,100 (49.0%) |
| 6 or 7 Rooms | 6,887 (33.5%) | 938 (14.8%) |
| 8 or more Rooms | 3,768 (18.3%) | 287 (4.5%) |
| Total | 20,559 (100.0%) | 6,323 (100.0%) |
Housing Structure by Heating Type in Palm Harbor
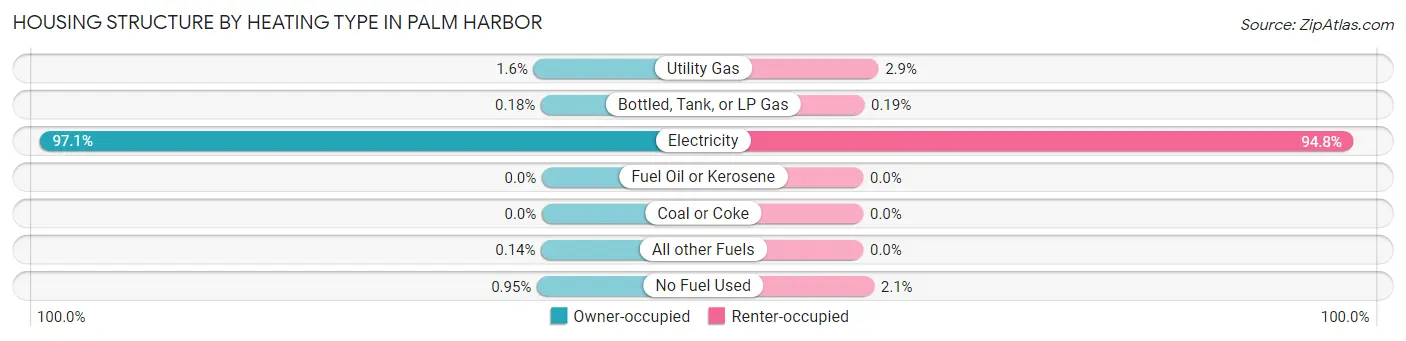
| Heating Type | Owner-occupied | Renter-occupied |
| Utility Gas | 332 (1.6%) | 185 (2.9%) |
| Bottled, Tank, or LP Gas | 36 (0.2%) | 12 (0.2%) |
| Electricity | 19,967 (97.1%) | 5,994 (94.8%) |
| Fuel Oil or Kerosene | 0 (0.0%) | 0 (0.0%) |
| Coal or Coke | 0 (0.0%) | 0 (0.0%) |
| All other Fuels | 29 (0.1%) | 0 (0.0%) |
| No Fuel Used | 195 (0.9%) | 132 (2.1%) |
| Total | 20,559 (100.0%) | 6,323 (100.0%) |
Household Vehicle Usage in Palm Harbor
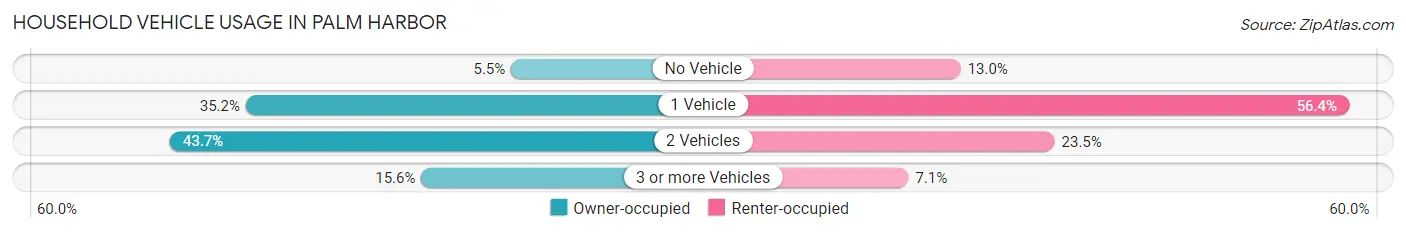
| Vehicles per Household | Owner-occupied | Renter-occupied |
| No Vehicle | 1,131 (5.5%) | 820 (13.0%) |
| 1 Vehicle | 7,241 (35.2%) | 3,568 (56.4%) |
| 2 Vehicles | 8,988 (43.7%) | 1,485 (23.5%) |
| 3 or more Vehicles | 3,199 (15.6%) | 450 (7.1%) |
| Total | 20,559 (100.0%) | 6,323 (100.0%) |
Real Estate & Mortgages in Palm Harbor
Real Estate and Mortgage Overview in Palm Harbor
| Characteristic | Without Mortgage | With Mortgage |
| Housing Units | 8,580 | 11,979 |
| Median Property Value | $265,700 | $348,400 |
| Median Household Income | $59,547 | $3,291 |
| Monthly Housing Costs | $606 | $1,598 |
| Real Estate Taxes | $1,940 | $319 |
Property Value by Mortgage Status in Palm Harbor
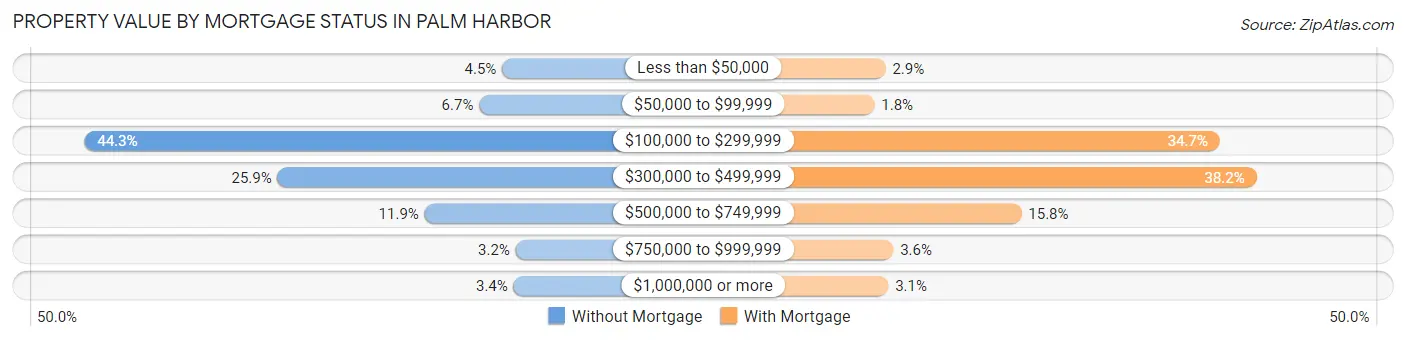
| Property Value | Without Mortgage | With Mortgage |
| Less than $50,000 | 388 (4.5%) | 342 (2.9%) |
| $50,000 to $99,999 | 575 (6.7%) | 214 (1.8%) |
| $100,000 to $299,999 | 3,802 (44.3%) | 4,155 (34.7%) |
| $300,000 to $499,999 | 2,223 (25.9%) | 4,575 (38.2%) |
| $500,000 to $749,999 | 1,021 (11.9%) | 1,891 (15.8%) |
| $750,000 to $999,999 | 277 (3.2%) | 430 (3.6%) |
| $1,000,000 or more | 294 (3.4%) | 372 (3.1%) |
| Total | 8,580 (100.0%) | 11,979 (100.0%) |
Household Income by Mortgage Status in Palm Harbor
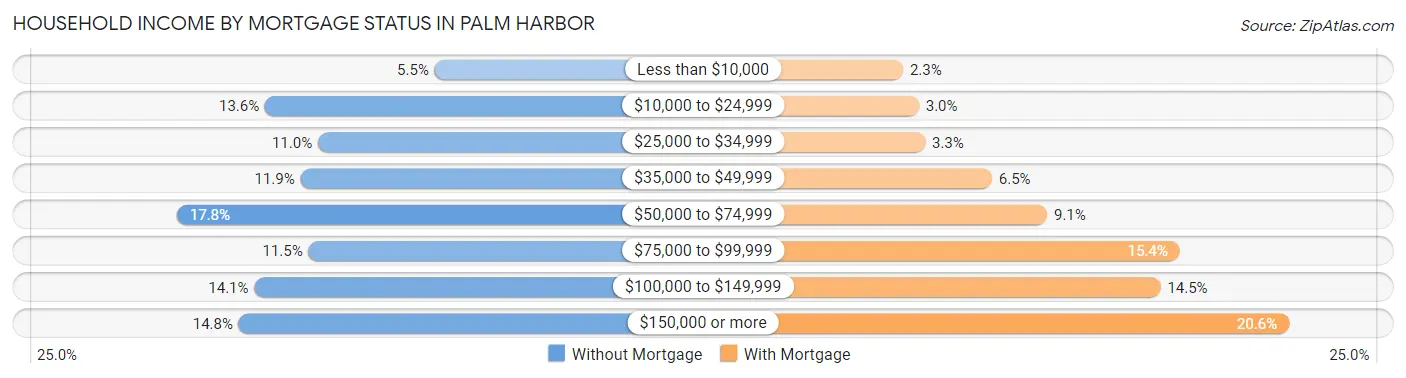
| Household Income | Without Mortgage | With Mortgage |
| Less than $10,000 | 469 (5.5%) | 271 (2.3%) |
| $10,000 to $24,999 | 1,163 (13.6%) | 360 (3.0%) |
| $25,000 to $34,999 | 946 (11.0%) | 397 (3.3%) |
| $35,000 to $49,999 | 1,018 (11.9%) | 778 (6.5%) |
| $50,000 to $74,999 | 1,523 (17.7%) | 1,092 (9.1%) |
| $75,000 to $99,999 | 985 (11.5%) | 1,850 (15.4%) |
| $100,000 to $149,999 | 1,206 (14.1%) | 1,739 (14.5%) |
| $150,000 or more | 1,270 (14.8%) | 2,472 (20.6%) |
| Total | 8,580 (100.0%) | 11,979 (100.0%) |
Property Value to Household Income Ratio in Palm Harbor
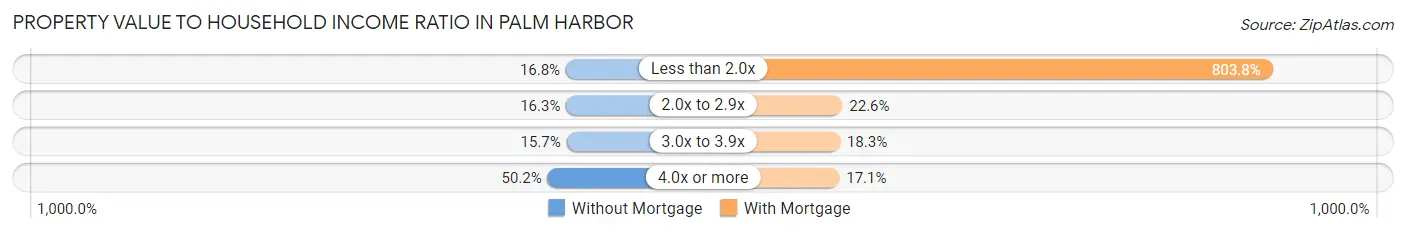
| Value-to-Income Ratio | Without Mortgage | With Mortgage |
| Less than 2.0x | 1,445 (16.8%) | 96,289 (803.8%) |
| 2.0x to 2.9x | 1,399 (16.3%) | 2,710 (22.6%) |
| 3.0x to 3.9x | 1,348 (15.7%) | 2,192 (18.3%) |
| 4.0x or more | 4,308 (50.2%) | 2,047 (17.1%) |
| Total | 8,580 (100.0%) | 11,979 (100.0%) |
Real Estate Taxes by Mortgage Status in Palm Harbor
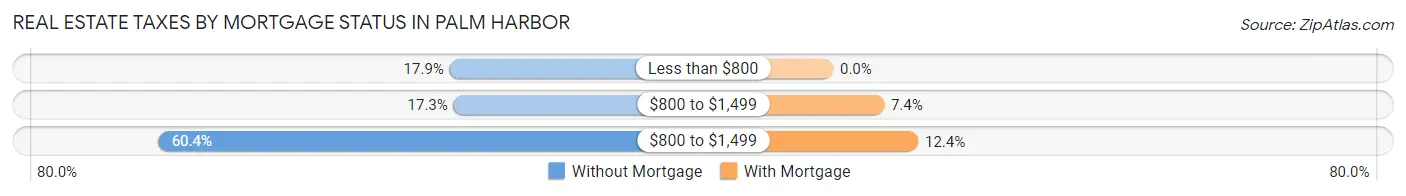
| Property Taxes | Without Mortgage | With Mortgage |
| Less than $800 | 1,535 (17.9%) | 0 (0.0%) |
| $800 to $1,499 | 1,485 (17.3%) | 891 (7.4%) |
| $800 to $1,499 | 5,182 (60.4%) | 1,488 (12.4%) |
| Total | 8,580 (100.0%) | 11,979 (100.0%) |
Health & Disability in Palm Harbor
Health Insurance Coverage by Age in Palm Harbor
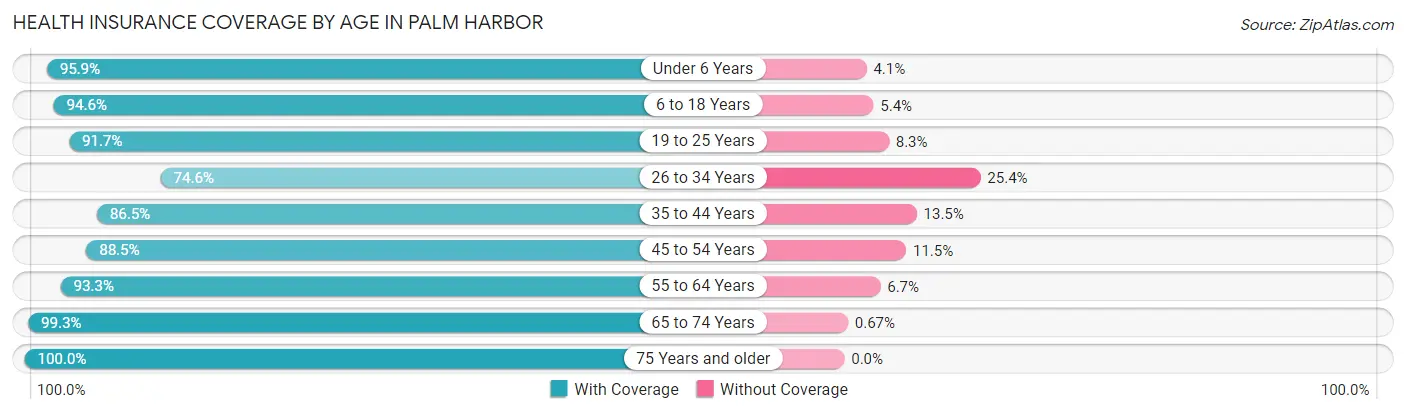
| Age Bracket | With Coverage | Without Coverage |
| Under 6 Years | 2,756 (95.9%) | 119 (4.1%) |
| 6 to 18 Years | 7,343 (94.6%) | 421 (5.4%) |
| 19 to 25 Years | 3,405 (91.7%) | 308 (8.3%) |
| 26 to 34 Years | 4,157 (74.6%) | 1,414 (25.4%) |
| 35 to 44 Years | 5,170 (86.5%) | 806 (13.5%) |
| 45 to 54 Years | 7,095 (88.5%) | 923 (11.5%) |
| 55 to 64 Years | 9,417 (93.3%) | 677 (6.7%) |
| 65 to 74 Years | 8,478 (99.3%) | 57 (0.7%) |
| 75 Years and older | 8,329 (100.0%) | 0 (0.0%) |
| Total | 56,150 (92.2%) | 4,725 (7.8%) |
Health Insurance Coverage by Citizenship Status in Palm Harbor
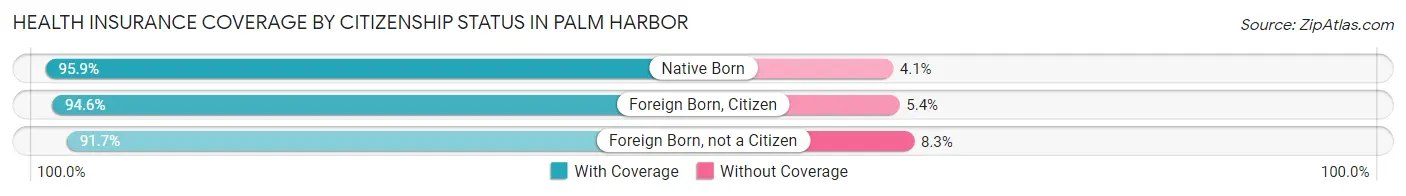
| Citizenship Status | With Coverage | Without Coverage |
| Native Born | 2,756 (95.9%) | 119 (4.1%) |
| Foreign Born, Citizen | 7,343 (94.6%) | 421 (5.4%) |
| Foreign Born, not a Citizen | 3,405 (91.7%) | 308 (8.3%) |
Health Insurance Coverage by Household Income in Palm Harbor
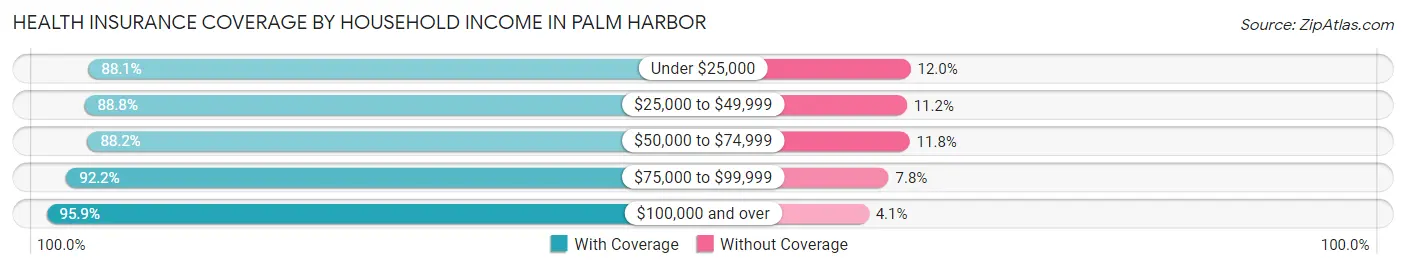
| Household Income | With Coverage | Without Coverage |
| Under $25,000 | 4,944 (88.0%) | 671 (11.9%) |
| $25,000 to $49,999 | 9,063 (88.8%) | 1,146 (11.2%) |
| $50,000 to $74,999 | 8,483 (88.2%) | 1,133 (11.8%) |
| $75,000 to $99,999 | 7,672 (92.2%) | 652 (7.8%) |
| $100,000 and over | 25,891 (95.9%) | 1,111 (4.1%) |
Public vs Private Health Insurance Coverage by Age in Palm Harbor
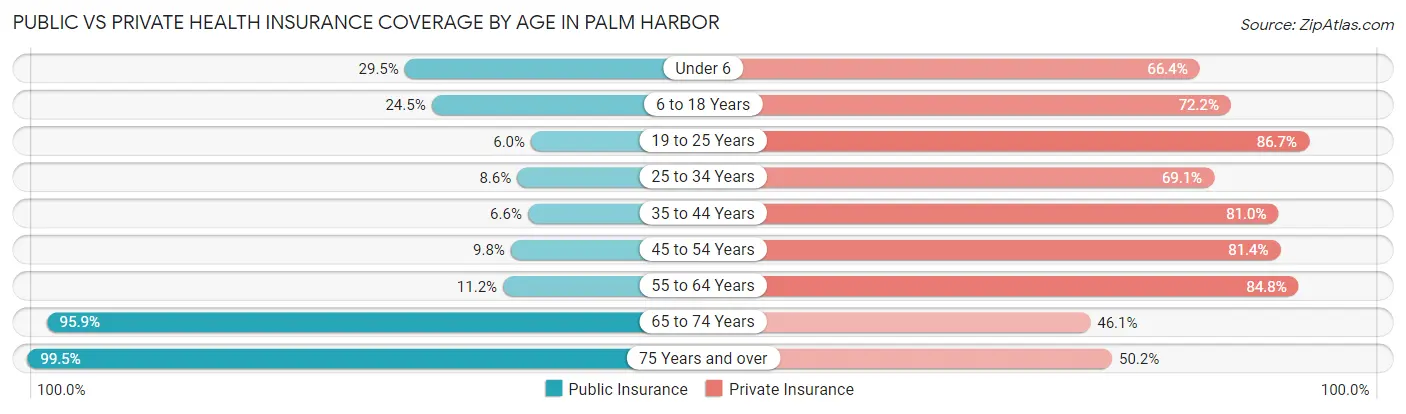
| Age Bracket | Public Insurance | Private Insurance |
| Under 6 | 847 (29.5%) | 1,909 (66.4%) |
| 6 to 18 Years | 1,901 (24.5%) | 5,605 (72.2%) |
| 19 to 25 Years | 224 (6.0%) | 3,218 (86.7%) |
| 25 to 34 Years | 479 (8.6%) | 3,848 (69.1%) |
| 35 to 44 Years | 395 (6.6%) | 4,842 (81.0%) |
| 45 to 54 Years | 784 (9.8%) | 6,526 (81.4%) |
| 55 to 64 Years | 1,133 (11.2%) | 8,558 (84.8%) |
| 65 to 74 Years | 8,185 (95.9%) | 3,936 (46.1%) |
| 75 Years and over | 8,286 (99.5%) | 4,179 (50.2%) |
| Total | 22,234 (36.5%) | 42,621 (70.0%) |
Disability Status by Sex by Age in Palm Harbor
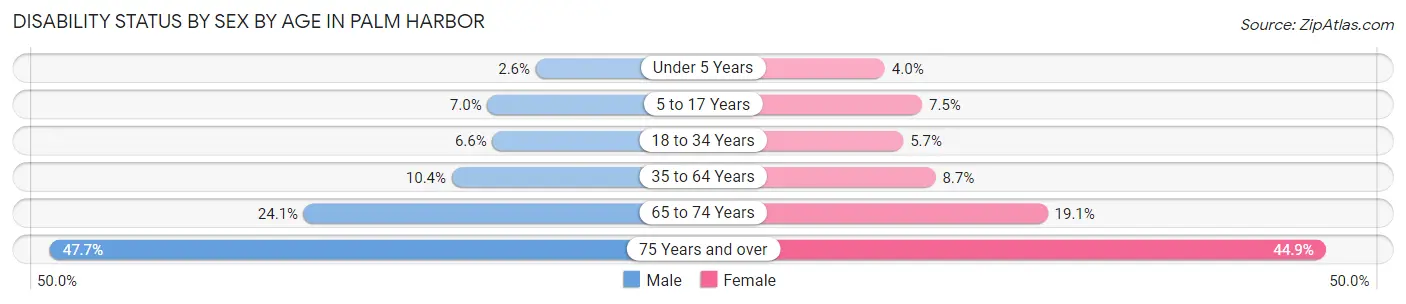
| Age Bracket | Male | Female |
| Under 5 Years | 36 (2.5%) | 38 (4.0%) |
| 5 to 17 Years | 283 (7.0%) | 279 (7.4%) |
| 18 to 34 Years | 324 (6.6%) | 277 (5.7%) |
| 35 to 64 Years | 1,150 (10.3%) | 1,128 (8.7%) |
| 65 to 74 Years | 927 (24.1%) | 895 (19.1%) |
| 75 Years and over | 1,561 (47.7%) | 2,269 (44.9%) |
Disability Class by Sex by Age in Palm Harbor
Disability Class: Hearing Difficulty
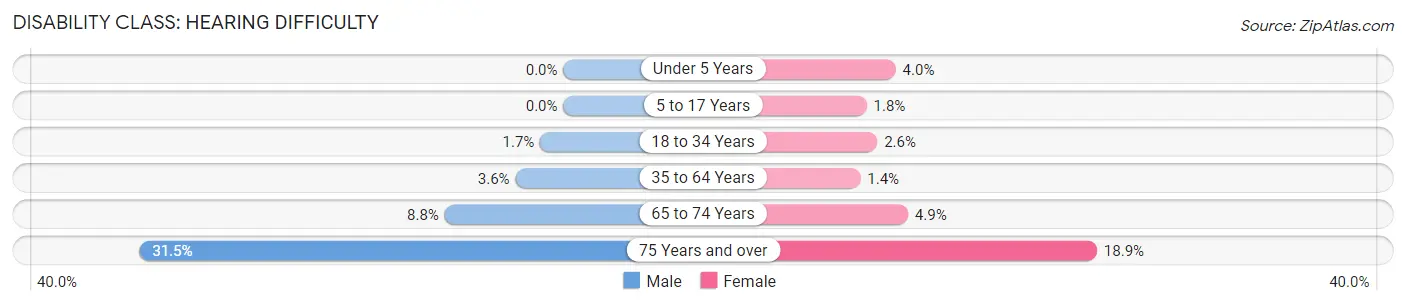
| Age Bracket | Male | Female |
| Under 5 Years | 0 (0.0%) | 38 (4.0%) |
| 5 to 17 Years | 0 (0.0%) | 69 (1.8%) |
| 18 to 34 Years | 85 (1.7%) | 128 (2.6%) |
| 35 to 64 Years | 396 (3.6%) | 179 (1.4%) |
| 65 to 74 Years | 339 (8.8%) | 230 (4.9%) |
| 75 Years and over | 1,031 (31.5%) | 957 (18.9%) |
Disability Class: Vision Difficulty
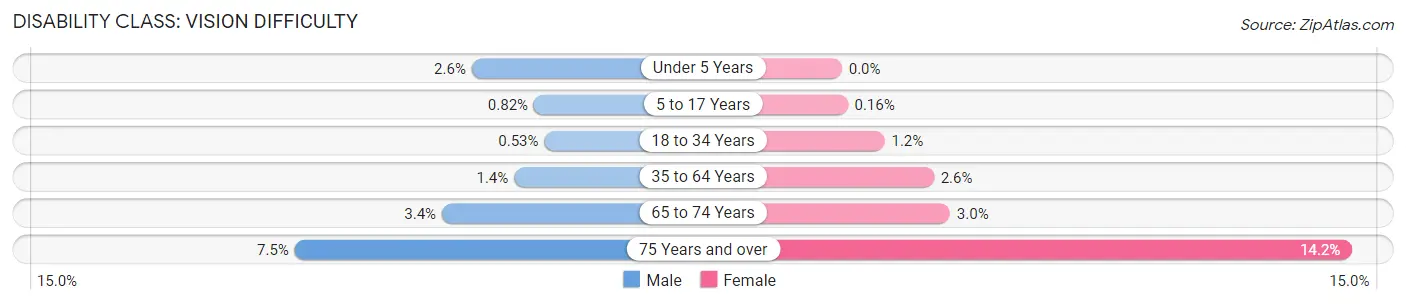
| Age Bracket | Male | Female |
| Under 5 Years | 36 (2.5%) | 0 (0.0%) |
| 5 to 17 Years | 33 (0.8%) | 6 (0.2%) |
| 18 to 34 Years | 26 (0.5%) | 58 (1.2%) |
| 35 to 64 Years | 152 (1.4%) | 332 (2.6%) |
| 65 to 74 Years | 130 (3.4%) | 141 (3.0%) |
| 75 Years and over | 245 (7.5%) | 718 (14.2%) |
Disability Class: Cognitive Difficulty
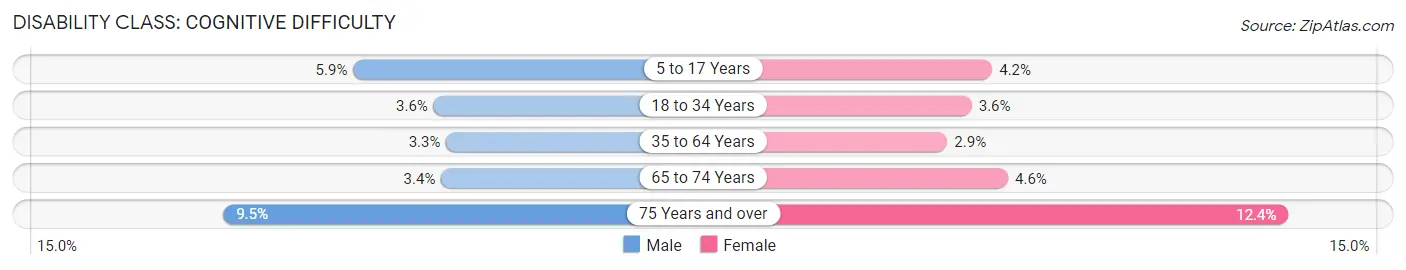
| Age Bracket | Male | Female |
| 5 to 17 Years | 235 (5.9%) | 157 (4.2%) |
| 18 to 34 Years | 178 (3.6%) | 176 (3.6%) |
| 35 to 64 Years | 362 (3.3%) | 382 (2.9%) |
| 65 to 74 Years | 131 (3.4%) | 217 (4.6%) |
| 75 Years and over | 310 (9.5%) | 628 (12.4%) |
Disability Class: Ambulatory Difficulty
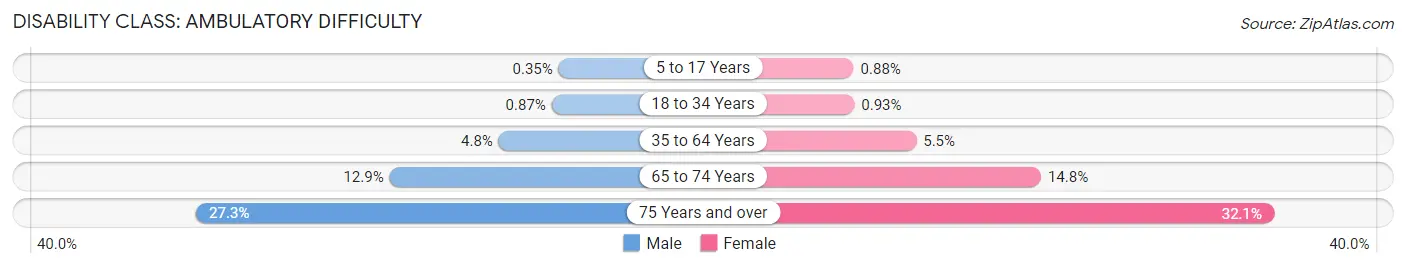
| Age Bracket | Male | Female |
| 5 to 17 Years | 14 (0.4%) | 33 (0.9%) |
| 18 to 34 Years | 43 (0.9%) | 45 (0.9%) |
| 35 to 64 Years | 533 (4.8%) | 718 (5.5%) |
| 65 to 74 Years | 497 (12.9%) | 693 (14.8%) |
| 75 Years and over | 893 (27.3%) | 1,621 (32.1%) |
Disability Class: Self-Care Difficulty
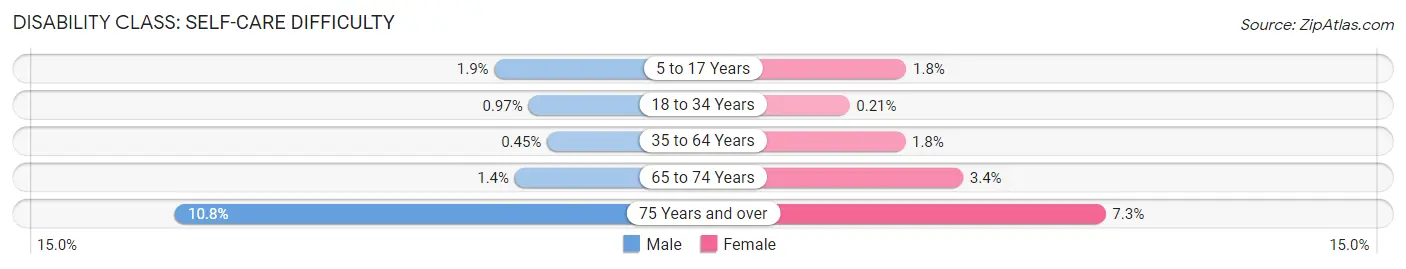
| Age Bracket | Male | Female |
| 5 to 17 Years | 77 (1.9%) | 67 (1.8%) |
| 18 to 34 Years | 48 (1.0%) | 10 (0.2%) |
| 35 to 64 Years | 50 (0.4%) | 228 (1.8%) |
| 65 to 74 Years | 52 (1.3%) | 158 (3.4%) |
| 75 Years and over | 354 (10.8%) | 371 (7.3%) |
Technology Access in Palm Harbor
Computing Device Access in Palm Harbor
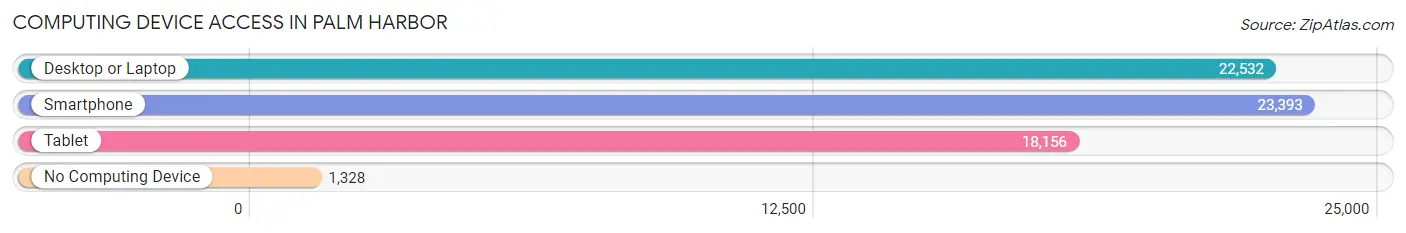
| Device Type | # Households | % Households |
| Desktop or Laptop | 22,532 | 83.8% |
| Smartphone | 23,393 | 87.0% |
| Tablet | 18,156 | 67.5% |
| No Computing Device | 1,328 | 4.9% |
| Total | 26,882 | 100.0% |
Internet Access in Palm Harbor
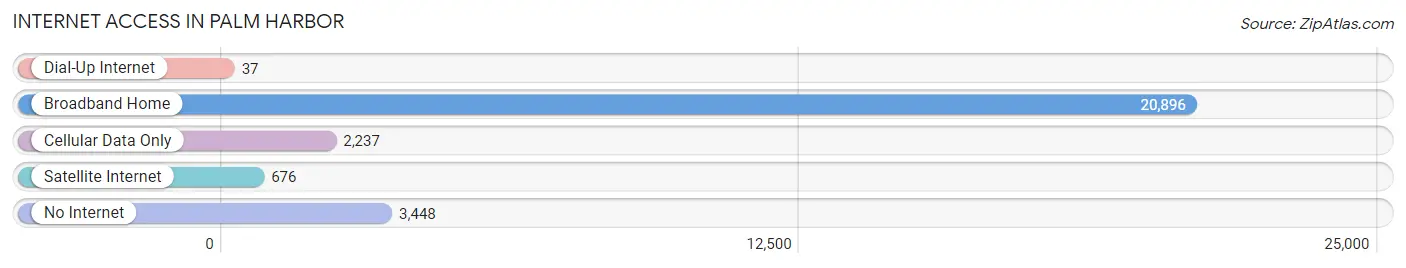
| Internet Type | # Households | % Households |
| Dial-Up Internet | 37 | 0.1% |
| Broadband Home | 20,896 | 77.7% |
| Cellular Data Only | 2,237 | 8.3% |
| Satellite Internet | 676 | 2.5% |
| No Internet | 3,448 | 12.8% |
| Total | 26,882 | 100.0% |
Palm Harbor Summary
Palm Harbor is a census-designated place (CDP) located in Pinellas County, Florida, United States. It is a suburb of the Tampa Bay Area and is located north of Clearwater and west of Tampa. As of the 2010 census, the population was 64,301.
History
Palm Harbor was first settled in the late 1800s by a group of settlers from the Midwest. The area was originally known as Sutherland, after the Sutherland family who owned much of the land. In the early 1900s, the area was renamed Palm Harbor after the abundance of palm trees in the area.
The area was largely rural until the 1950s when it began to experience rapid growth due to the influx of people from the Midwest and the development of the area’s beaches. The area was incorporated as a town in 1953 and was later annexed by Pinellas County in 1974.
Geography
Palm Harbor is located in Pinellas County, Florida, at 28°06′N 82°43′W. It is bordered by Clearwater to the south, Oldsmar to the east, and Tarpon Springs to the north. The city covers an area of approximately 25 square miles and has a population density of 2,541 people per square mile.
The terrain of Palm Harbor is mostly flat, with some rolling hills in the northern part of the city. The city is located on the Gulf of Mexico and is home to several beaches, including Honeymoon Island State Park and Caladesi Island State Park.
Economy
Palm Harbor’s economy is largely driven by tourism, with many visitors coming to the area to enjoy its beaches and other attractions. The city is also home to several large employers, including the Nielsen Company, Raymond James Financial, and Tech Data Corporation.
The median household income in Palm Harbor is $60,845, which is higher than the national average. The unemployment rate in the city is 4.2%, which is lower than the national average.
Demographics
As of the 2010 census, the population of Palm Harbor was 64,301. The racial makeup of the city was 87.3% White, 5.3% African American, 0.4% Native American, 2.2% Asian, 0.1% Pacific Islander, 2.2% from other races, and 2.5% from two or more races. Hispanic or Latino of any race were 8.3% of the population.
The median age in Palm Harbor is 44.7 years, which is higher than the national average. The median household income is $60,845, which is higher than the national average. The homeownership rate in the city is 73.3%, which is higher than the national average.
Common Questions
What is the Total Population of Palm Harbor?
Total Population of Palm Harbor is 61,589.
What is the Total Male Population of Palm Harbor?
Total Male Population of Palm Harbor is 28,956.
What is the Total Female Population of Palm Harbor?
Total Female Population of Palm Harbor is 32,633.
What is the Ratio of Males per 100 Females in Palm Harbor?
There are 88.73 Males per 100 Females in Palm Harbor.
What is the Ratio of Females per 100 Males in Palm Harbor?
There are 112.70 Females per 100 Males in Palm Harbor.
What is the Median Population Age in Palm Harbor?
Median Population Age in Palm Harbor is 50.8 Years.
What is the Average Family Size in Palm Harbor
Average Family Size in Palm Harbor is 2.9 People.
What is the Average Household Size in Palm Harbor
Average Household Size in Palm Harbor is 2.3 People.
What is Per Capita Income in Palm Harbor?
Per Capita income in Palm Harbor is $44,016.
What is the Median Family Income in Palm Harbor?
Median Family Income in Palm Harbor is $95,367.
What is the Median Household income in Palm Harbor?
Median Household Income in Palm Harbor is $70,493.
What is Income or Wage Gap in Palm Harbor?
Income or Wage Gap in Palm Harbor is 26.3%.
Women in Palm Harbor earn 73.7 cents for every dollar earned by a man.
What is Family Income Deficit in Palm Harbor?
Family Income Deficit in Palm Harbor is $8,919.
Families that are below poverty line in Palm Harbor earn $8,919 less on average than the poverty threshold level.
What is Inequality or Gini Index in Palm Harbor?
Inequality or Gini Index in Palm Harbor is 0.47.
How Large is the Labor Force in Palm Harbor?
There are 30,564 People in the Labor Forcein in Palm Harbor.
What is the Percentage of People in the Labor Force in Palm Harbor?
58.1% of People are in the Labor Force in Palm Harbor.
What is the Unemployment Rate in Palm Harbor?
Unemployment Rate in Palm Harbor is 2.9%.