Celebration, FL
Celebration Map
Celebration Overview
12,030
TOTAL POPULATION
5,787
MALE POPULATION
6,243
FEMALE POPULATION
92.70
MALES / 100 FEMALES
107.88
FEMALES / 100 MALES
39.7
MEDIAN AGE
3.3
AVG FAMILY SIZE
2.8
AVG HOUSEHOLD SIZE
$58,564
PER CAPITA INCOME
$130,787
AVG FAMILY INCOME
$99,642
AVG HOUSEHOLD INCOME
37.4%
WAGE / INCOME GAP [ % ]
62.6¢/ $1
WAGE / INCOME GAP [ $ ]
0.48
INEQUALITY / GINI INDEX
5,468
LABOR FORCE [ PEOPLE ]
61.6%
PERCENT IN LABOR FORCE
4.2%
UNEMPLOYMENT RATE
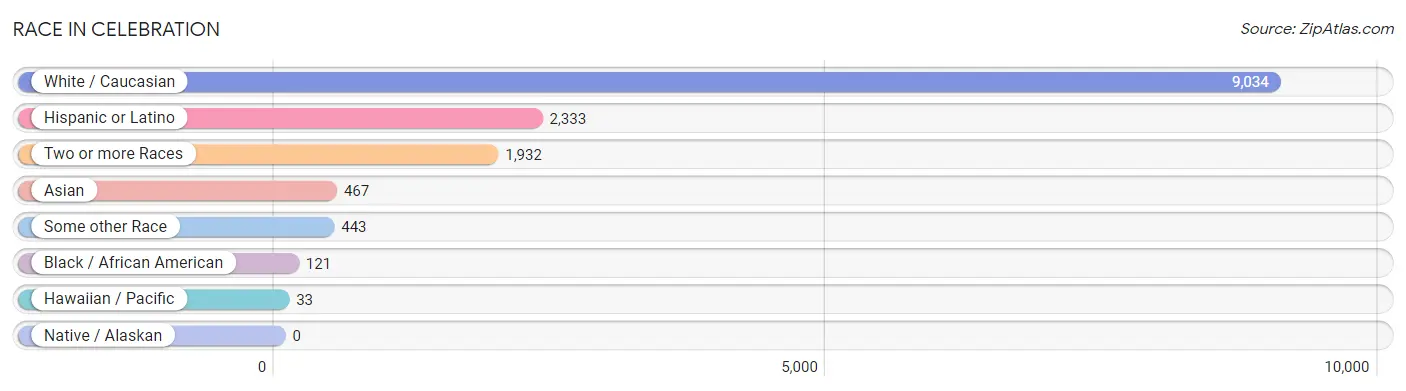
Race in Celebration
The most populous races in Celebration are White / Caucasian (9,034 | 75.1%), Hispanic or Latino (2,333 | 19.4%), and Two or more Races (1,932 | 16.1%).
| Race | # Population | % Population |
| Asian | 467 | 3.9% |
| Black / African American | 121 | 1.0% |
| Hawaiian / Pacific | 33 | 0.3% |
| Hispanic or Latino | 2,333 | 19.4% |
| Native / Alaskan | 0 | 0.0% |
| White / Caucasian | 9,034 | 75.1% |
| Two or more Races | 1,932 | 16.1% |
| Some other Race | 443 | 3.7% |
| Total | 12,030 | 100.0% |
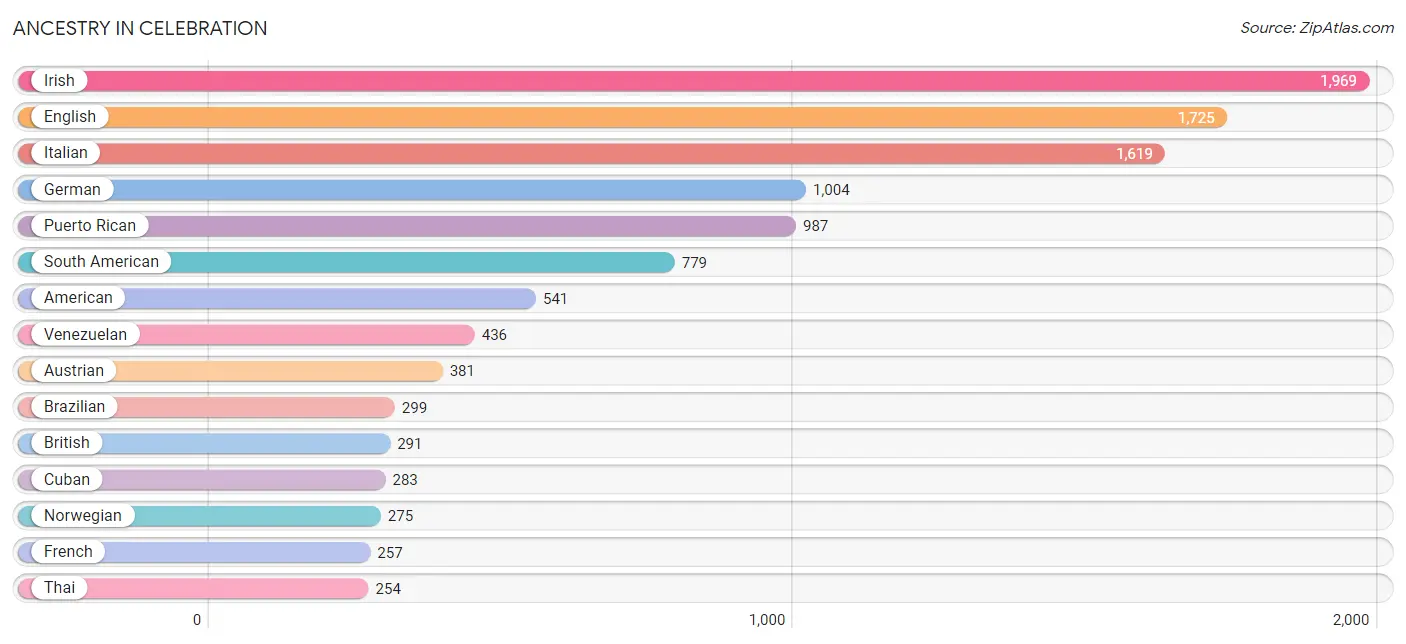
Ancestry in Celebration
The most populous ancestries reported in Celebration are Irish (1,969 | 16.4%), English (1,725 | 14.3%), Italian (1,619 | 13.5%), German (1,004 | 8.4%), and Puerto Rican (987 | 8.2%), together accounting for 60.7% of all Celebration residents.
| Ancestry | # Population | % Population |
| American | 541 | 4.5% |
| Arab | 73 | 0.6% |
| Austrian | 381 | 3.2% |
| Brazilian | 299 | 2.5% |
| British | 291 | 2.4% |
| Bulgarian | 83 | 0.7% |
| Burmese | 14 | 0.1% |
| Canadian | 33 | 0.3% |
| Central American | 57 | 0.5% |
| Chilean | 25 | 0.2% |
| Colombian | 112 | 0.9% |
| Croatian | 32 | 0.3% |
| Cuban | 283 | 2.4% |
| Czechoslovakian | 18 | 0.2% |
| Danish | 28 | 0.2% |
| Dutch | 83 | 0.7% |
| Eastern European | 102 | 0.9% |
| Ecuadorian | 24 | 0.2% |
| Egyptian | 42 | 0.4% |
| English | 1,725 | 14.3% |
| European | 64 | 0.5% |
| French | 257 | 2.1% |
| French Canadian | 45 | 0.4% |
| German | 1,004 | 8.4% |
| Greek | 33 | 0.3% |
| Hungarian | 235 | 1.9% |
| Indian (Asian) | 159 | 1.3% |
| Irish | 1,969 | 16.4% |
| Italian | 1,619 | 13.5% |
| Korean | 65 | 0.5% |
| Lebanese | 15 | 0.1% |
| Lithuanian | 64 | 0.5% |
| Mexican | 182 | 1.5% |
| Native Hawaiian | 40 | 0.3% |
| Northern European | 42 | 0.4% |
| Norwegian | 275 | 2.3% |
| Panamanian | 57 | 0.5% |
| Pennsylvania German | 15 | 0.1% |
| Polish | 217 | 1.8% |
| Portuguese | 50 | 0.4% |
| Puerto Rican | 987 | 8.2% |
| Russian | 36 | 0.3% |
| Scandinavian | 68 | 0.6% |
| Scotch-Irish | 140 | 1.2% |
| Scottish | 253 | 2.1% |
| Slovak | 198 | 1.7% |
| South American | 779 | 6.5% |
| Spanish | 45 | 0.4% |
| Sri Lankan | 21 | 0.2% |
| Swedish | 84 | 0.7% |
| Swiss | 43 | 0.4% |
| Syrian | 16 | 0.1% |
| Thai | 254 | 2.1% |
| Turkish | 48 | 0.4% |
| Venezuelan | 436 | 3.6% |
| Welsh | 87 | 0.7% |
| West Indian | 31 | 0.3% |
| Yugoslavian | 9 | 0.1% | View All 58 Rows |
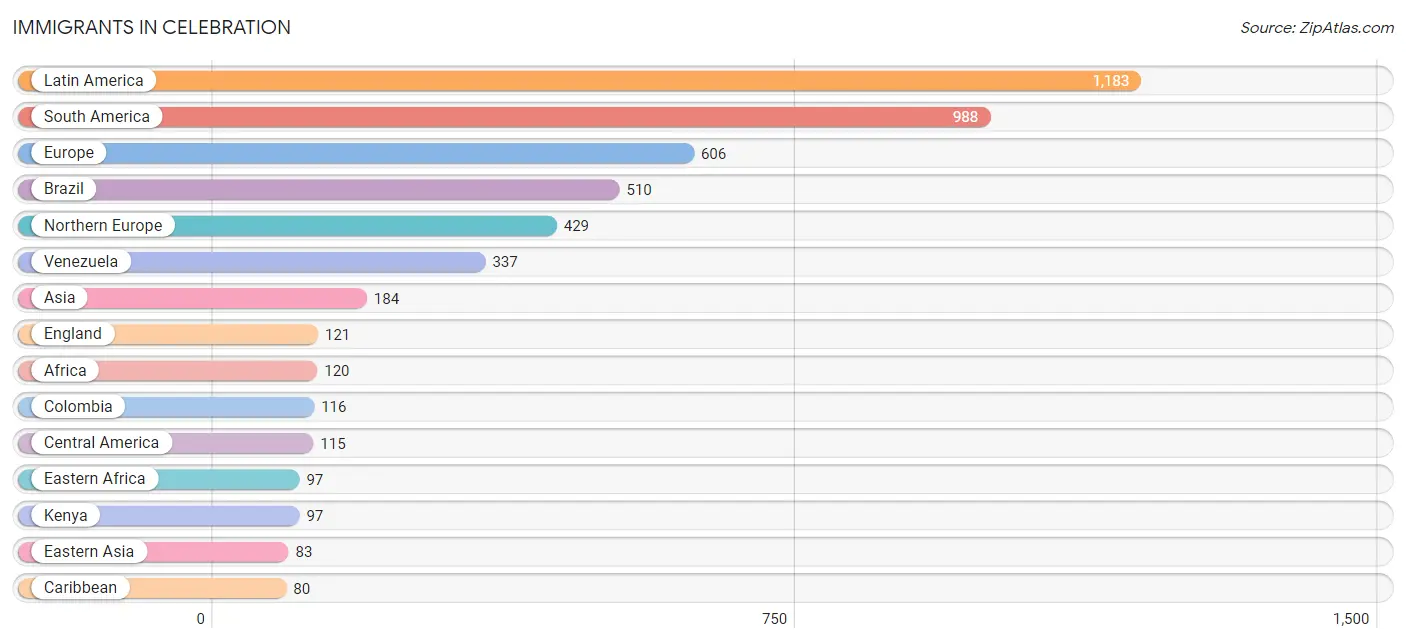
Immigrants in Celebration
The most numerous immigrant groups reported in Celebration came from Latin America (1,183 | 9.8%), South America (988 | 8.2%), Europe (606 | 5.0%), Brazil (510 | 4.2%), and Northern Europe (429 | 3.6%), together accounting for 30.9% of all Celebration residents.
| Immigration Origin | # Population | % Population |
| Africa | 120 | 1.0% |
| Asia | 184 | 1.5% |
| Brazil | 510 | 4.2% |
| Bulgaria | 21 | 0.2% |
| Canada | 31 | 0.3% |
| Caribbean | 80 | 0.7% |
| Central America | 115 | 1.0% |
| Chile | 25 | 0.2% |
| China | 69 | 0.6% |
| Colombia | 116 | 1.0% |
| Cuba | 80 | 0.7% |
| Czechoslovakia | 14 | 0.1% |
| Eastern Africa | 97 | 0.8% |
| Eastern Asia | 83 | 0.7% |
| Eastern Europe | 58 | 0.5% |
| Egypt | 23 | 0.2% |
| England | 121 | 1.0% |
| Europe | 606 | 5.0% |
| Germany | 79 | 0.7% |
| Hong Kong | 30 | 0.3% |
| Hungary | 23 | 0.2% |
| India | 16 | 0.1% |
| Italy | 15 | 0.1% |
| Kenya | 97 | 0.8% |
| Korea | 14 | 0.1% |
| Latin America | 1,183 | 9.8% |
| Mexico | 58 | 0.5% |
| Northern Africa | 23 | 0.2% |
| Northern Europe | 429 | 3.6% |
| Panama | 57 | 0.5% |
| Philippines | 13 | 0.1% |
| Portugal | 13 | 0.1% |
| Saudi Arabia | 12 | 0.1% |
| South America | 988 | 8.2% |
| South Central Asia | 33 | 0.3% |
| South Eastern Asia | 13 | 0.1% |
| Southern Europe | 28 | 0.2% |
| Syria | 16 | 0.1% |
| Turkey | 27 | 0.2% |
| Uzbekistan | 17 | 0.1% |
| Venezuela | 337 | 2.8% |
| Western Asia | 55 | 0.5% |
| Western Europe | 79 | 0.7% | View All 43 Rows |
Sex and Age in Celebration
Sex and Age in Celebration
The most populous age groups in Celebration are 10 to 14 Years (675 | 11.7%) for men and 5 to 9 Years (914 | 14.6%) for women.
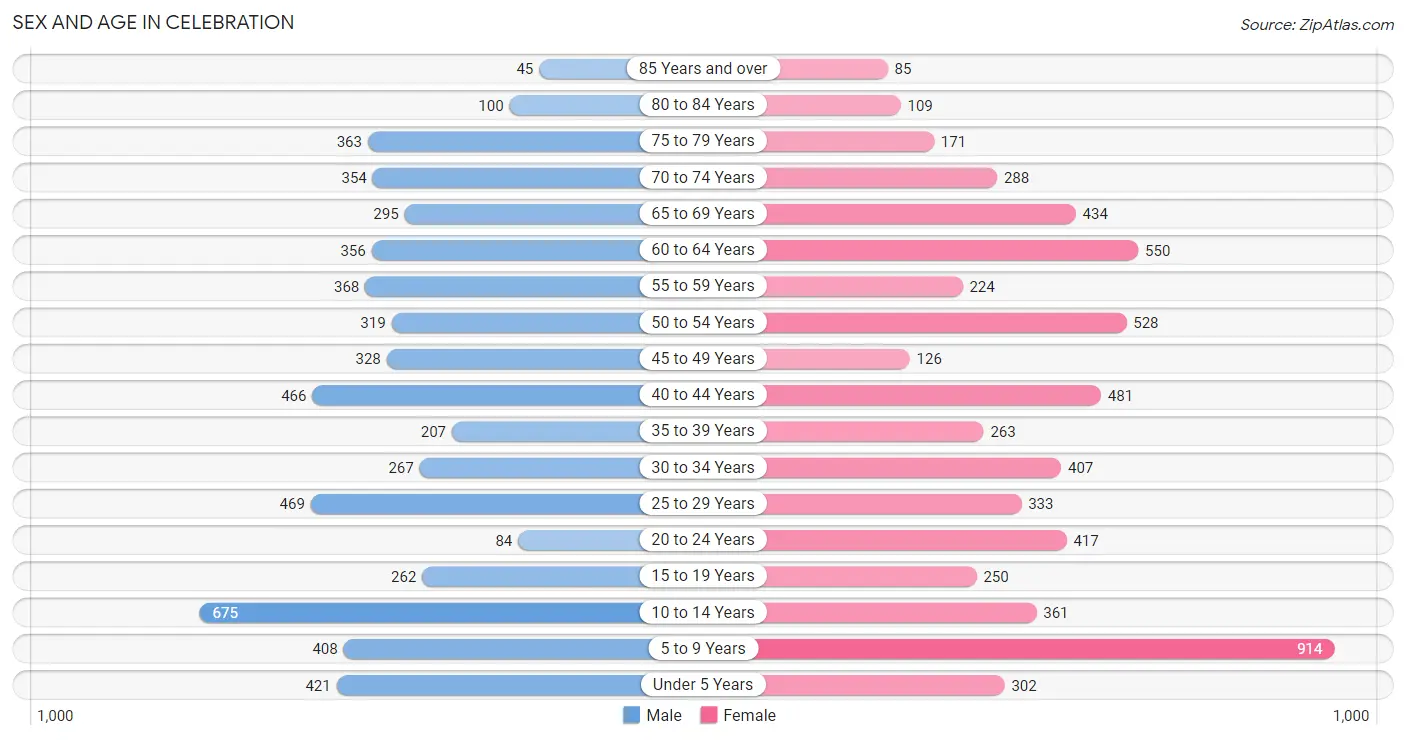
| Age Bracket | Male | Female |
| Under 5 Years | 421 (7.3%) | 302 (4.8%) |
| 5 to 9 Years | 408 (7.0%) | 914 (14.6%) |
| 10 to 14 Years | 675 (11.7%) | 361 (5.8%) |
| 15 to 19 Years | 262 (4.5%) | 250 (4.0%) |
| 20 to 24 Years | 84 (1.5%) | 417 (6.7%) |
| 25 to 29 Years | 469 (8.1%) | 333 (5.3%) |
| 30 to 34 Years | 267 (4.6%) | 407 (6.5%) |
| 35 to 39 Years | 207 (3.6%) | 263 (4.2%) |
| 40 to 44 Years | 466 (8.1%) | 481 (7.7%) |
| 45 to 49 Years | 328 (5.7%) | 126 (2.0%) |
| 50 to 54 Years | 319 (5.5%) | 528 (8.5%) |
| 55 to 59 Years | 368 (6.4%) | 224 (3.6%) |
| 60 to 64 Years | 356 (6.1%) | 550 (8.8%) |
| 65 to 69 Years | 295 (5.1%) | 434 (7.0%) |
| 70 to 74 Years | 354 (6.1%) | 288 (4.6%) |
| 75 to 79 Years | 363 (6.3%) | 171 (2.7%) |
| 80 to 84 Years | 100 (1.7%) | 109 (1.8%) |
| 85 Years and over | 45 (0.8%) | 85 (1.4%) |
| Total | 5,787 (100.0%) | 6,243 (100.0%) |
Families and Households in Celebration
Median Family Size in Celebration
The median family size in Celebration is 3.30 persons per family, with single male/father families (218 | 7.6%) accounting for the largest median family size of 3.47 persons per family. On the other hand, single female/mother families (314 | 10.9%) represent the smallest median family size with 3.03 persons per family.
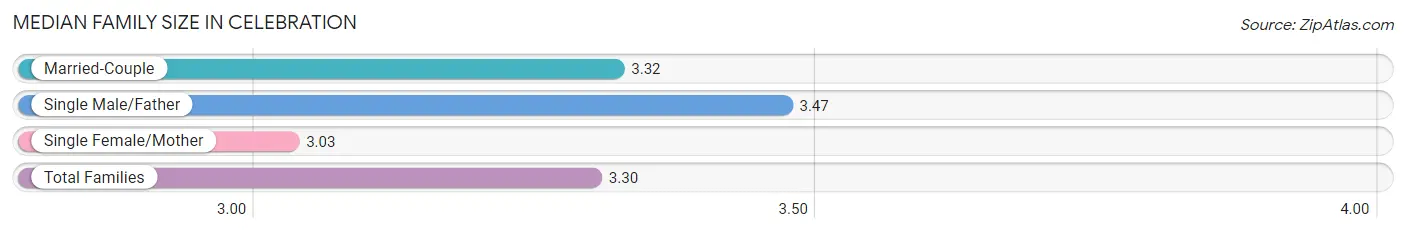
| Family Type | # Families | Family Size |
| Married-Couple | 2,337 (81.5%) | 3.32 |
| Single Male/Father | 218 (7.6%) | 3.47 |
| Single Female/Mother | 314 (10.9%) | 3.03 |
| Total Families | 2,869 (100.0%) | 3.30 |
Median Household Size in Celebration
The median household size in Celebration is 2.79 persons per household, with single male/father households (218 | 5.1%) accounting for the largest median household size of 3.56 persons per household. non-family households (1,438 | 33.4%) represent the smallest median household size with 1.38 persons per household.
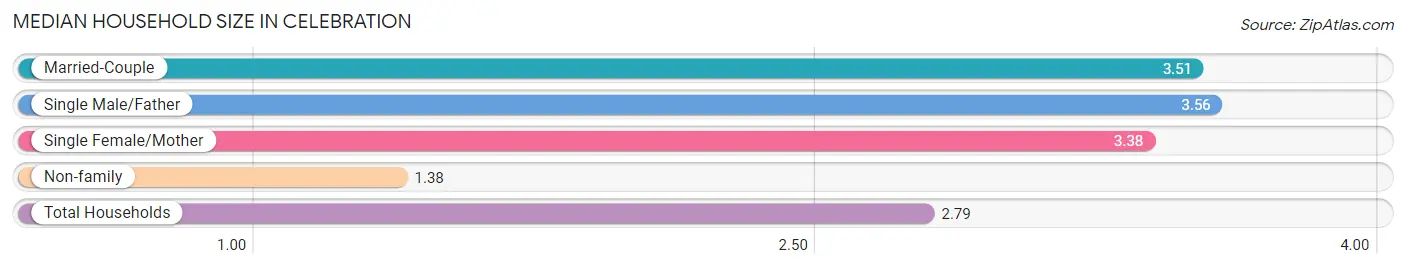
| Household Type | # Households | Household Size |
| Married-Couple | 2,337 (54.3%) | 3.51 |
| Single Male/Father | 218 (5.1%) | 3.56 |
| Single Female/Mother | 314 (7.3%) | 3.38 |
| Non-family | 1,438 (33.4%) | 1.38 |
| Total Households | 4,307 (100.0%) | 2.79 |
Household Size by Marriage Status in Celebration
Out of a total of 4,307 households in Celebration, 2,869 (66.6%) are family households, while 1,438 (33.4%) are nonfamily households. The most numerous type of family households are 2-person households, comprising 1,440, and the most common type of nonfamily households are 1-person households, comprising 1,057.
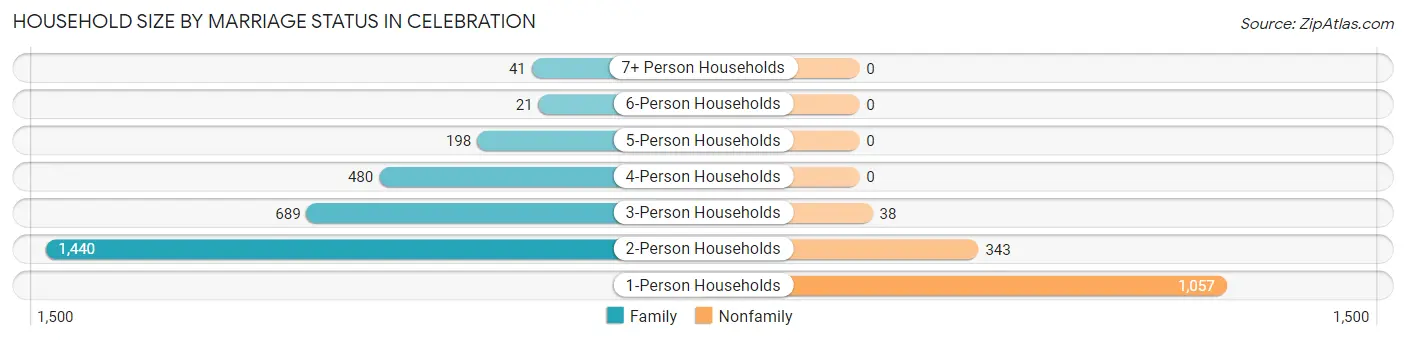
| Household Size | Family Households | Nonfamily Households |
| 1-Person Households | - | 1,057 (24.5%) |
| 2-Person Households | 1,440 (33.4%) | 343 (8.0%) |
| 3-Person Households | 689 (16.0%) | 38 (0.9%) |
| 4-Person Households | 480 (11.1%) | 0 (0.0%) |
| 5-Person Households | 198 (4.6%) | 0 (0.0%) |
| 6-Person Households | 21 (0.5%) | 0 (0.0%) |
| 7+ Person Households | 41 (0.9%) | 0 (0.0%) |
| Total | 2,869 (66.6%) | 1,438 (33.4%) |
Female Fertility in Celebration
Fertility by Age in Celebration
Average fertility rate in Celebration is 28.0 births per 1,000 women. Women in the age bracket of 35 to 50 years have the highest fertility rate with 35.0 births per 1,000 women. Women in the age bracket of 20 to 34 years acount for 50.0% of all women with births.
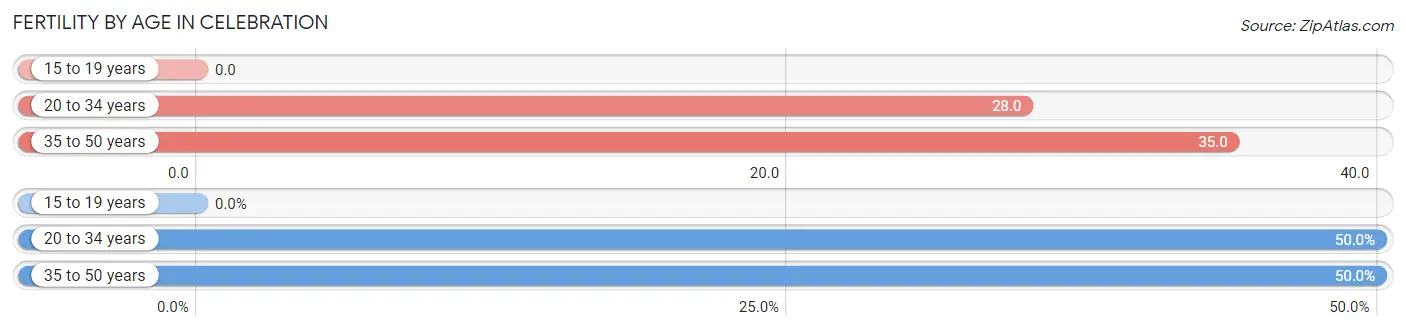
| Age Bracket | Women with Births | Births / 1,000 Women |
| 15 to 19 years | 0 (0.0%) | 0.0 |
| 20 to 34 years | 32 (50.0%) | 28.0 |
| 35 to 50 years | 32 (50.0%) | 35.0 |
| Total | 64 (100.0%) | 28.0 |
Fertility by Age by Marriage Status in Celebration
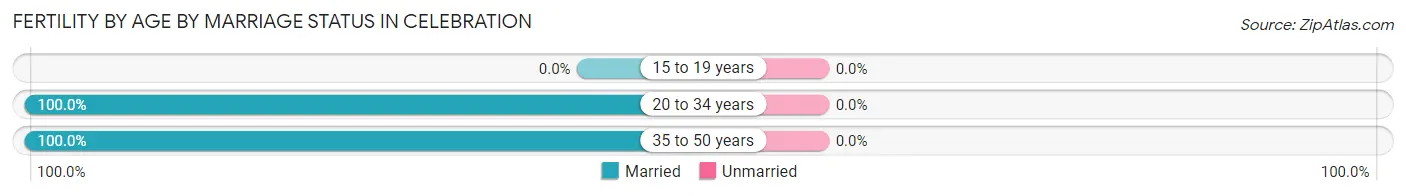
| Age Bracket | Married | Unmarried |
| 15 to 19 years | 0 (0.0%) | 0 (0.0%) |
| 20 to 34 years | 32 (100.0%) | 0 (0.0%) |
| 35 to 50 years | 32 (100.0%) | 0 (0.0%) |
| Total | 64 (100.0%) | 0 (0.0%) |
Fertility by Education in Celebration
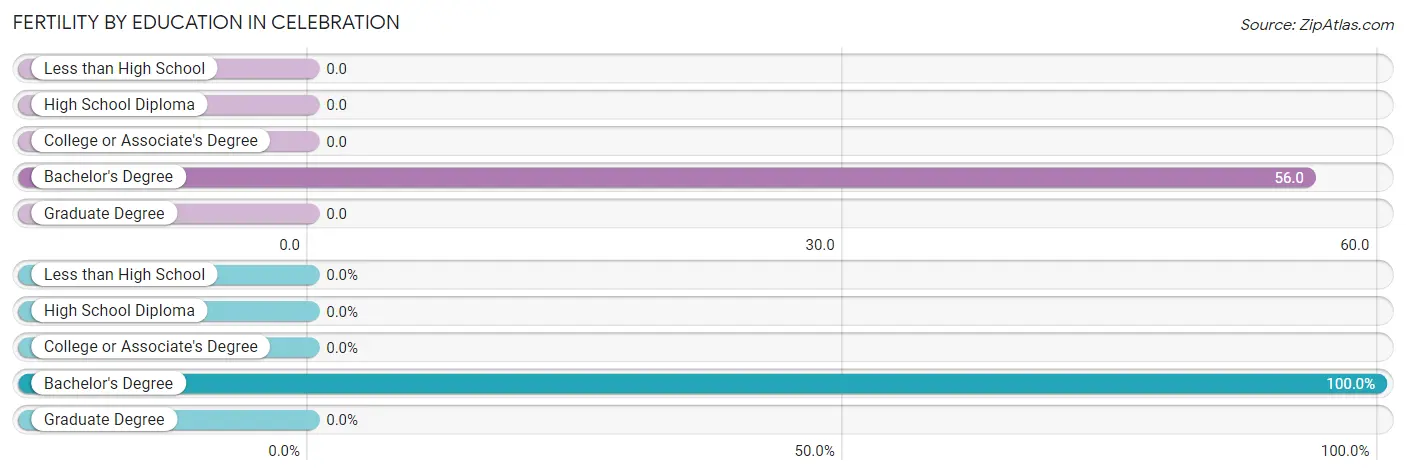
| Educational Attainment | Women with Births | Births / 1,000 Women |
| Less than High School | 0 (0.0%) | 0.0 |
| High School Diploma | 0 (0.0%) | 0.0 |
| College or Associate's Degree | 0 (0.0%) | 0.0 |
| Bachelor's Degree | 64 (100.0%) | 56.0 |
| Graduate Degree | 0 (0.0%) | 0.0 |
| Total | 64 (100.0%) | 28.0 |
Fertility by Education by Marriage Status in Celebration
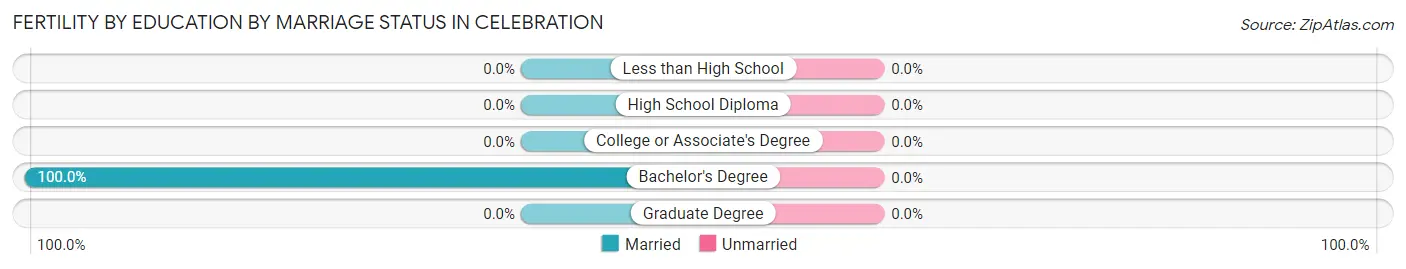
| Educational Attainment | Married | Unmarried |
| Less than High School | 0 (0.0%) | 0 (0.0%) |
| High School Diploma | 0 (0.0%) | 0 (0.0%) |
| College or Associate's Degree | 0 (0.0%) | 0 (0.0%) |
| Bachelor's Degree | 64 (100.0%) | 0 (0.0%) |
| Graduate Degree | 0 (0.0%) | 0 (0.0%) |
| Total | 64 (100.0%) | 0 (0.0%) |
Income in Celebration
Income Overview in Celebration
Per Capita Income in Celebration is $58,564, while median incomes of families and households are $130,787 and $99,642 respectively.
| Characteristic | Number | Measure |
| Per Capita Income | 12,030 | $58,564 |
| Median Family Income | 2,869 | $130,787 |
| Mean Family Income | 2,869 | $186,790 |
| Median Household Income | 4,307 | $99,642 |
| Mean Household Income | 4,307 | $156,697 |
| Income Deficit | 2,869 | $0 |
| Wage / Income Gap (%) | 12,030 | 37.43% |
| Wage / Income Gap ($) | 12,030 | 62.57¢ per $1 |
| Gini / Inequality Index | 12,030 | 0.48 |
Earnings by Sex in Celebration
Average Earnings in Celebration are $53,669, $75,078 for men and $46,977 for women, a difference of 37.4%.
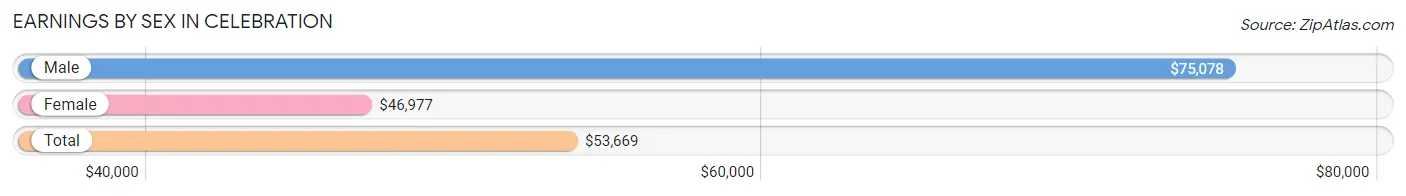
| Sex | Number | Average Earnings |
| Male | 2,982 (53.6%) | $75,078 |
| Female | 2,580 (46.4%) | $46,977 |
| Total | 5,562 (100.0%) | $53,669 |
Earnings by Sex by Income Bracket in Celebration
The most common earnings brackets in Celebration are $100,000+ for men (1,113 | 37.3%) and $100,000+ for women (374 | 14.5%).
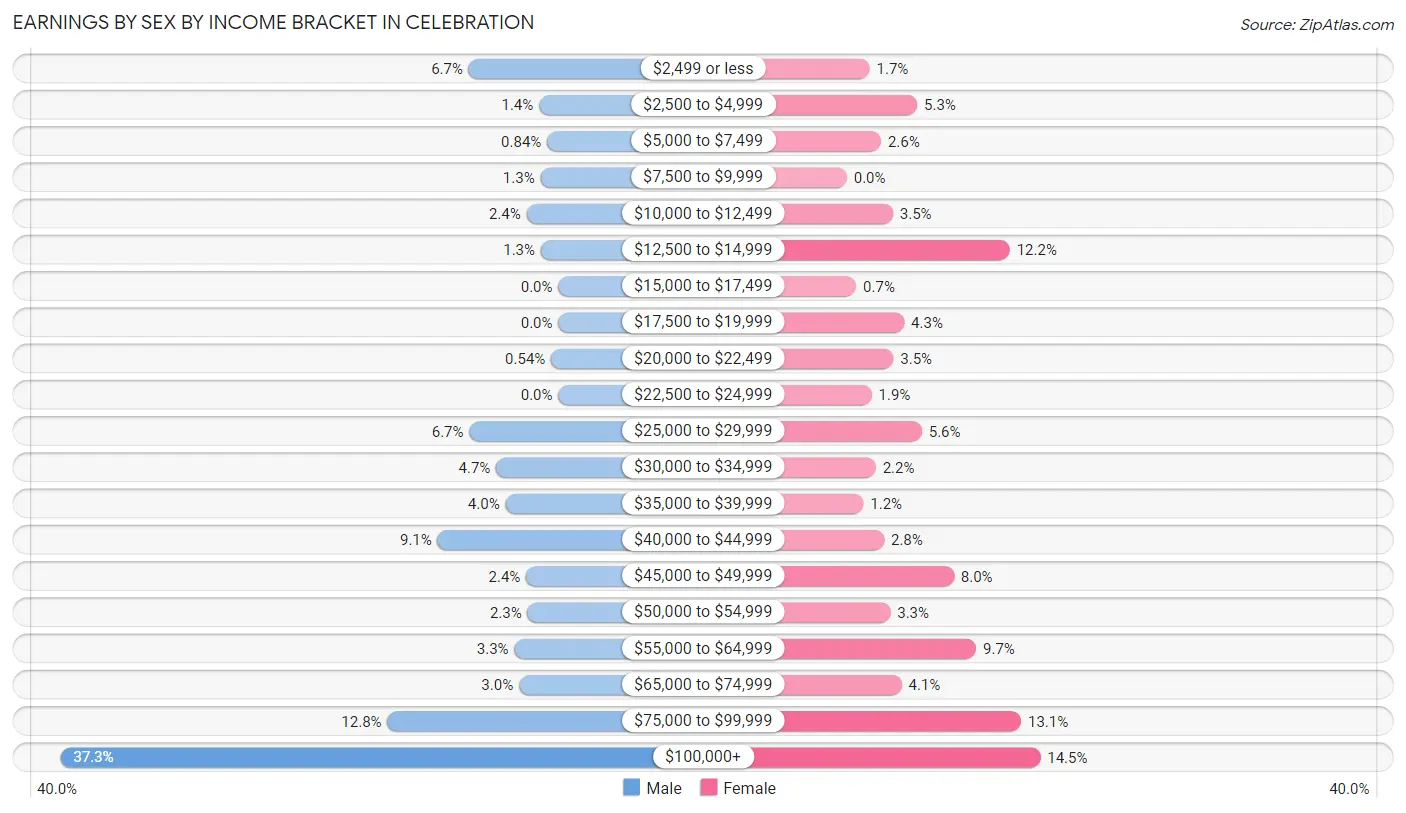
| Income | Male | Female |
| $2,499 or less | 200 (6.7%) | 44 (1.7%) |
| $2,500 to $4,999 | 43 (1.4%) | 136 (5.3%) |
| $5,000 to $7,499 | 25 (0.8%) | 66 (2.6%) |
| $7,500 to $9,999 | 40 (1.3%) | 0 (0.0%) |
| $10,000 to $12,499 | 71 (2.4%) | 89 (3.5%) |
| $12,500 to $14,999 | 39 (1.3%) | 315 (12.2%) |
| $15,000 to $17,499 | 0 (0.0%) | 18 (0.7%) |
| $17,500 to $19,999 | 0 (0.0%) | 111 (4.3%) |
| $20,000 to $22,499 | 16 (0.5%) | 90 (3.5%) |
| $22,500 to $24,999 | 0 (0.0%) | 48 (1.9%) |
| $25,000 to $29,999 | 199 (6.7%) | 145 (5.6%) |
| $30,000 to $34,999 | 139 (4.7%) | 56 (2.2%) |
| $35,000 to $39,999 | 118 (4.0%) | 32 (1.2%) |
| $40,000 to $44,999 | 270 (9.0%) | 72 (2.8%) |
| $45,000 to $49,999 | 72 (2.4%) | 207 (8.0%) |
| $50,000 to $54,999 | 69 (2.3%) | 84 (3.3%) |
| $55,000 to $64,999 | 98 (3.3%) | 250 (9.7%) |
| $65,000 to $74,999 | 88 (2.9%) | 106 (4.1%) |
| $75,000 to $99,999 | 382 (12.8%) | 337 (13.1%) |
| $100,000+ | 1,113 (37.3%) | 374 (14.5%) |
| Total | 2,982 (100.0%) | 2,580 (100.0%) |
Earnings by Sex by Educational Attainment in Celebration
Average earnings in Celebration are $76,523 for men and $49,897 for women, a difference of 34.8%. Men with an educational attainment of graduate degree enjoy the highest average annual earnings of $105,357, while those with high school diploma education earn the least with $40,677. Women with an educational attainment of graduate degree earn the most with the average annual earnings of $51,953, while those with bachelor's degree education have the smallest earnings of $50,909.
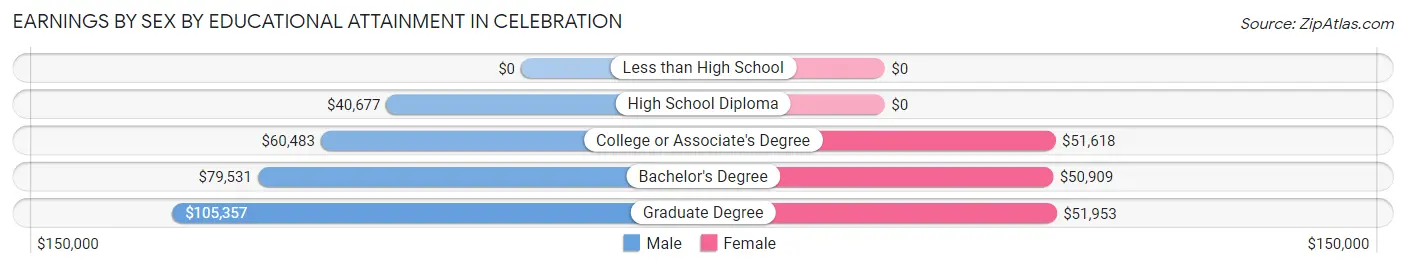
| Educational Attainment | Male Income | Female Income |
| Less than High School | - | - |
| High School Diploma | $40,677 | $0 |
| College or Associate's Degree | $60,483 | $51,618 |
| Bachelor's Degree | $79,531 | $50,909 |
| Graduate Degree | $105,357 | $51,953 |
| Total | $76,523 | $49,897 |
Family Income in Celebration
Family Income Brackets in Celebration
According to the Celebration family income data, there are 663 families falling into the $200,000+ income range, which is the most common income bracket and makes up 23.1% of all families.
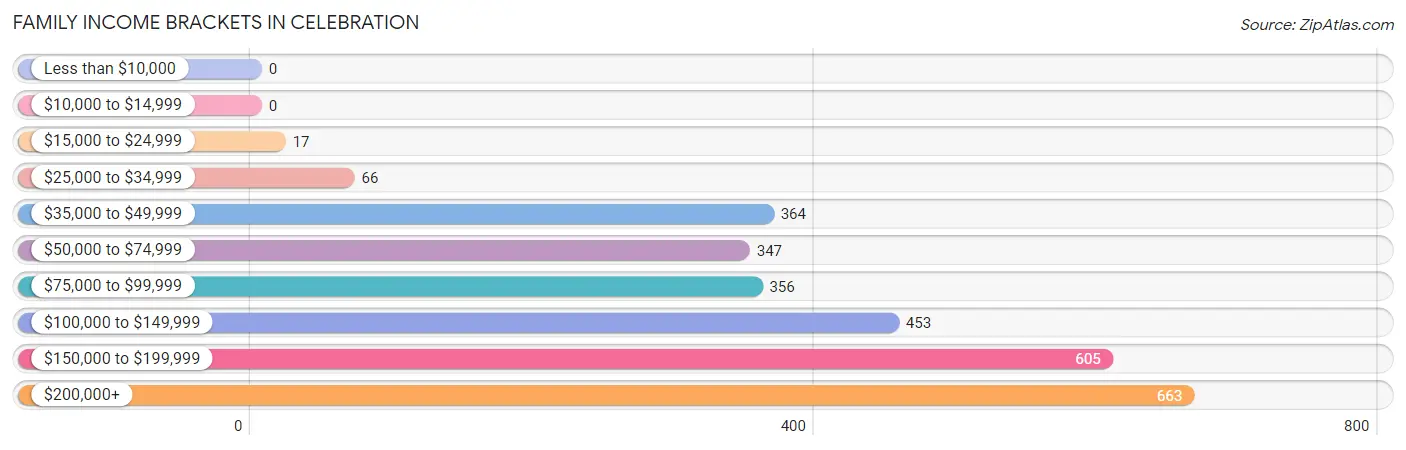
| Income Bracket | # Families | % Families |
| Less than $10,000 | 0 | 0.0% |
| $10,000 to $14,999 | 0 | 0.0% |
| $15,000 to $24,999 | 17 | 0.6% |
| $25,000 to $34,999 | 66 | 2.3% |
| $35,000 to $49,999 | 364 | 12.7% |
| $50,000 to $74,999 | 347 | 12.1% |
| $75,000 to $99,999 | 356 | 12.4% |
| $100,000 to $149,999 | 453 | 15.8% |
| $150,000 to $199,999 | 605 | 21.1% |
| $200,000+ | 663 | 23.1% |
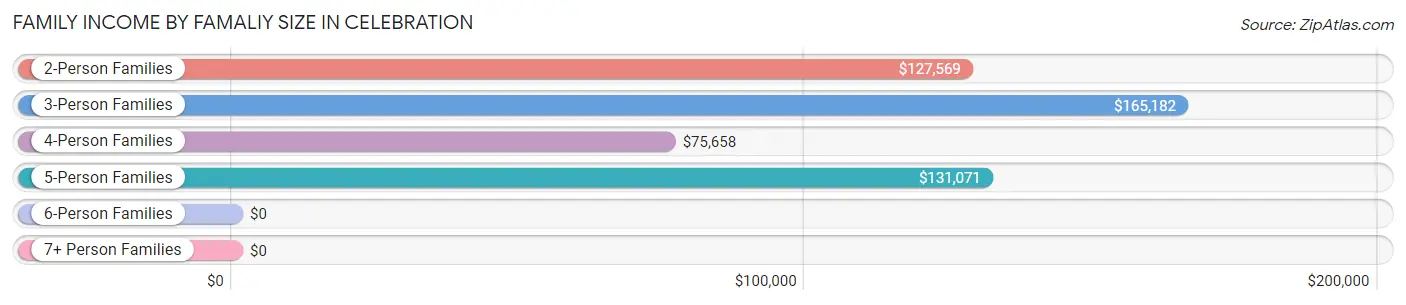
Family Income by Famaliy Size in Celebration
3-person families (702 | 24.5%) account for the highest median family income in Celebration with $165,182 per family, while 2-person families (1,497 | 52.2%) have the highest median income of $63,784 per family member.
| Income Bracket | # Families | Median Income |
| 2-Person Families | 1,497 (52.2%) | $127,569 |
| 3-Person Families | 702 (24.5%) | $165,182 |
| 4-Person Families | 446 (15.5%) | $75,658 |
| 5-Person Families | 198 (6.9%) | $131,071 |
| 6-Person Families | 26 (0.9%) | $0 |
| 7+ Person Families | 0 (0.0%) | $0 |
| Total | 2,869 (100.0%) | $130,787 |
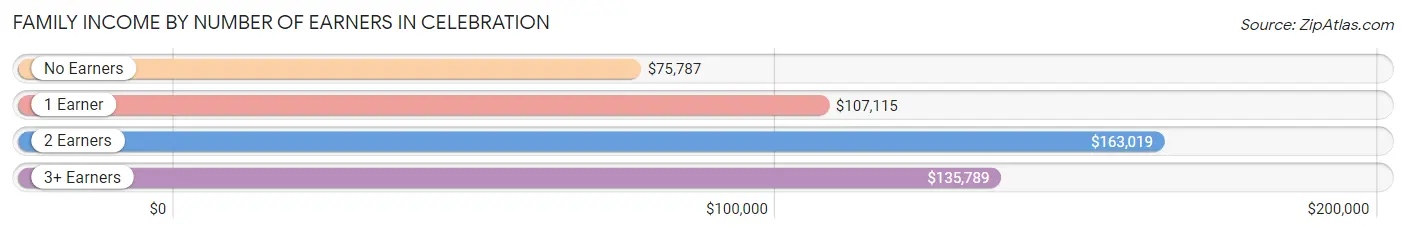
Family Income by Number of Earners in Celebration
The median family income in Celebration is $130,787, with families comprising 2 earners (1,052) having the highest median family income of $163,019, while families with no earners (535) have the lowest median family income of $75,787, accounting for 36.7% and 18.6% of families, respectively.
| Number of Earners | # Families | Median Income |
| No Earners | 535 (18.6%) | $75,787 |
| 1 Earner | 1,144 (39.9%) | $107,115 |
| 2 Earners | 1,052 (36.7%) | $163,019 |
| 3+ Earners | 138 (4.8%) | $135,789 |
| Total | 2,869 (100.0%) | $130,787 |
Household Income in Celebration
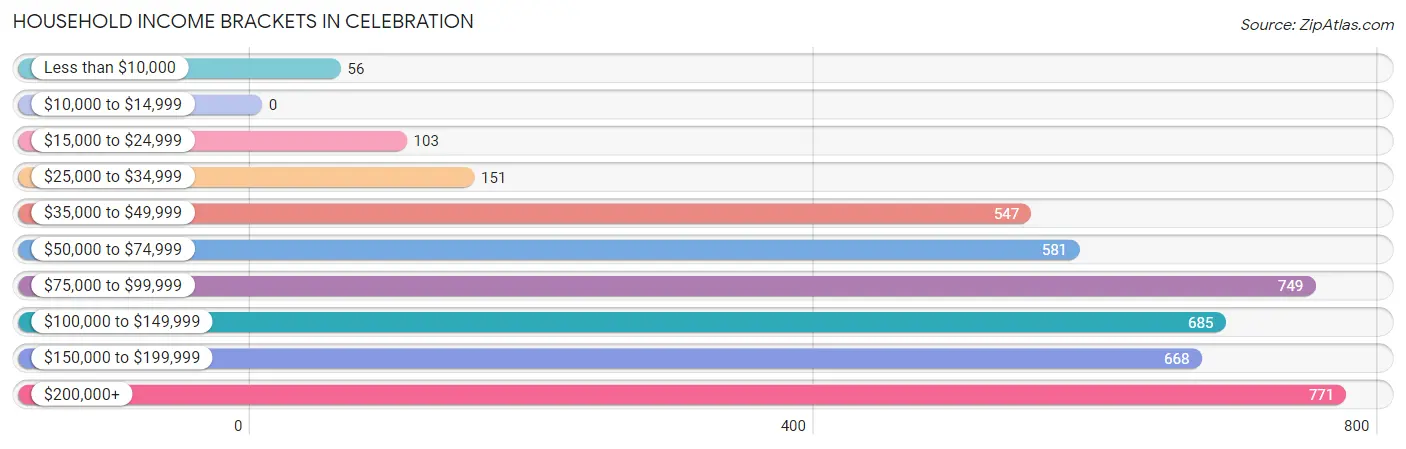
Household Income Brackets in Celebration
With 771 households falling in the category, the $200,000+ income range is the most frequent in Celebration, accounting for 17.9% of all households.
| Income Bracket | # Households | % Households |
| Less than $10,000 | 56 | 1.3% |
| $10,000 to $14,999 | 0 | 0.0% |
| $15,000 to $24,999 | 103 | 2.4% |
| $25,000 to $34,999 | 151 | 3.5% |
| $35,000 to $49,999 | 547 | 12.7% |
| $50,000 to $74,999 | 581 | 13.5% |
| $75,000 to $99,999 | 749 | 17.4% |
| $100,000 to $149,999 | 685 | 15.9% |
| $150,000 to $199,999 | 668 | 15.5% |
| $200,000+ | 771 | 17.9% |
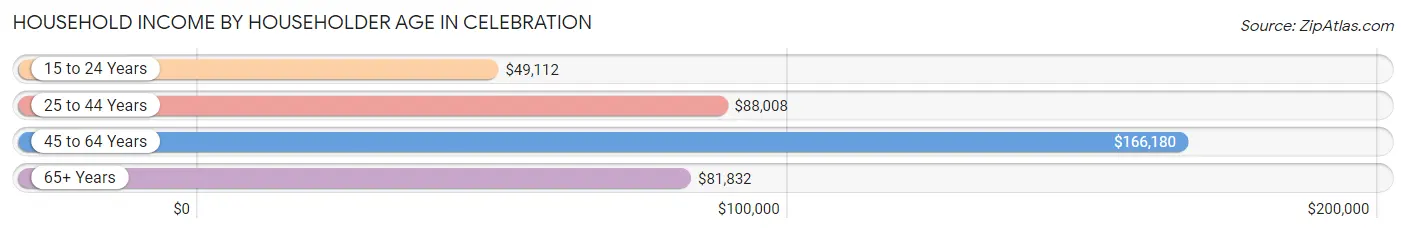
Household Income by Householder Age in Celebration
The median household income in Celebration is $99,642, with the highest median household income of $166,180 found in the 45 to 64 years age bracket for the primary householder. A total of 1,577 households (36.6%) fall into this category. Meanwhile, the 15 to 24 years age bracket for the primary householder has the lowest median household income of $49,112, with 81 households (1.9%) in this group.
| Income Bracket | # Households | Median Income |
| 15 to 24 Years | 81 (1.9%) | $49,112 |
| 25 to 44 Years | 1,312 (30.5%) | $88,008 |
| 45 to 64 Years | 1,577 (36.6%) | $166,180 |
| 65+ Years | 1,337 (31.0%) | $81,832 |
| Total | 4,307 (100.0%) | $99,642 |
Poverty in Celebration
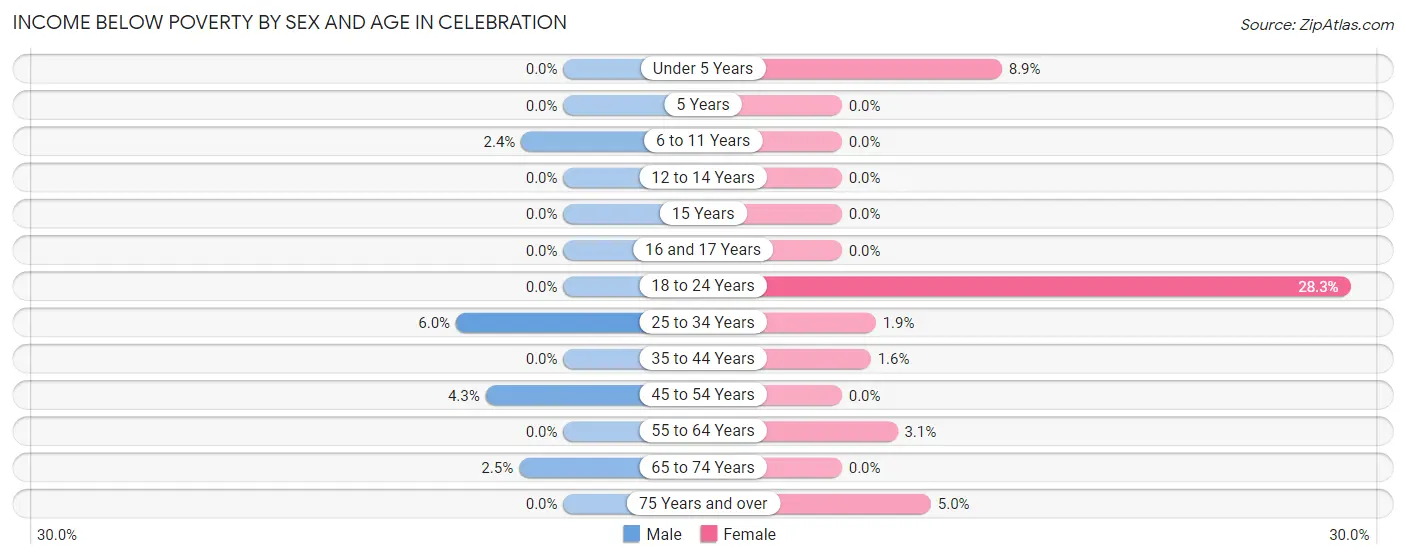
Income Below Poverty by Sex and Age in Celebration
With 1.8% poverty level for males and 3.9% for females among the residents of Celebration, 25 to 34 year old males and 18 to 24 year old females are the most vulnerable to poverty, with 44 males (6.0%) and 143 females (28.3%) in their respective age groups living below the poverty level.
| Age Bracket | Male | Female |
| Under 5 Years | 0 (0.0%) | 22 (8.9%) |
| 5 Years | 0 (0.0%) | 0 (0.0%) |
| 6 to 11 Years | 16 (2.4%) | 0 (0.0%) |
| 12 to 14 Years | 0 (0.0%) | 0 (0.0%) |
| 15 Years | 0 (0.0%) | 0 (0.0%) |
| 16 and 17 Years | 0 (0.0%) | 0 (0.0%) |
| 18 to 24 Years | 0 (0.0%) | 143 (28.3%) |
| 25 to 34 Years | 44 (6.0%) | 14 (1.9%) |
| 35 to 44 Years | 0 (0.0%) | 12 (1.6%) |
| 45 to 54 Years | 28 (4.3%) | 0 (0.0%) |
| 55 to 64 Years | 0 (0.0%) | 24 (3.1%) |
| 65 to 74 Years | 16 (2.5%) | 0 (0.0%) |
| 75 Years and over | 0 (0.0%) | 18 (5.0%) |
| Total | 104 (1.8%) | 233 (3.9%) |
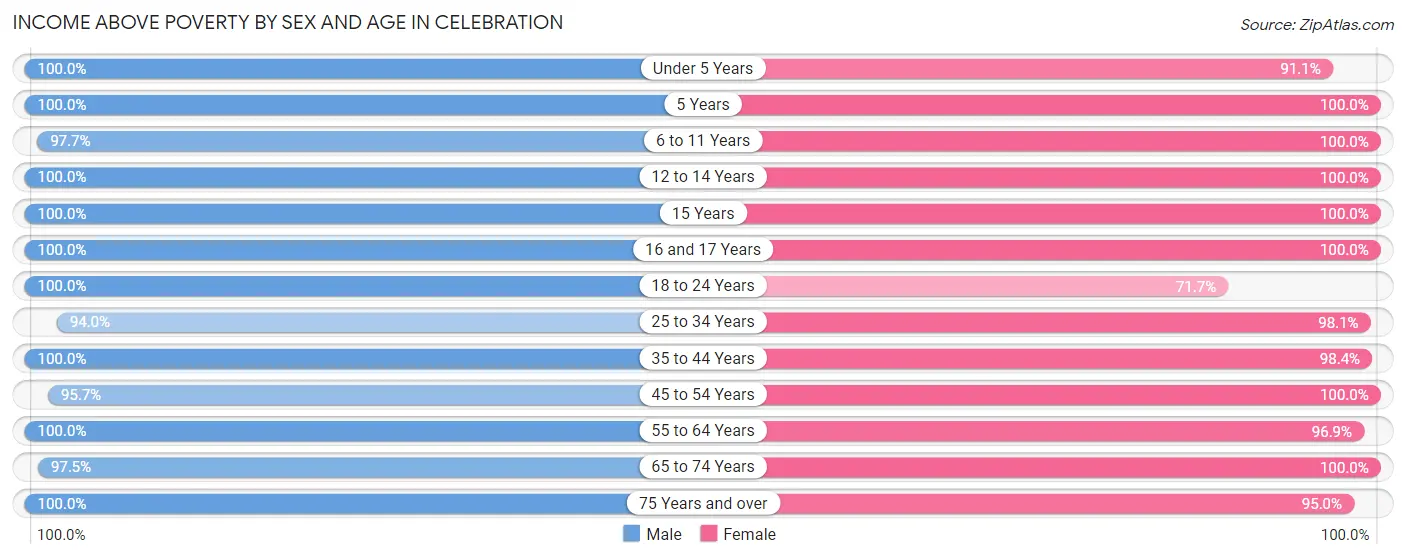
Income Above Poverty by Sex and Age in Celebration
According to the poverty statistics in Celebration, males aged under 5 years and females aged 5 years are the age groups that are most secure financially, with 100.0% of males and 100.0% of females in these age groups living above the poverty line.
| Age Bracket | Male | Female |
| Under 5 Years | 299 (100.0%) | 225 (91.1%) |
| 5 Years | 41 (100.0%) | 57 (100.0%) |
| 6 to 11 Years | 666 (97.7%) | 789 (100.0%) |
| 12 to 14 Years | 360 (100.0%) | 235 (100.0%) |
| 15 Years | 24 (100.0%) | 49 (100.0%) |
| 16 and 17 Years | 138 (100.0%) | 113 (100.0%) |
| 18 to 24 Years | 184 (100.0%) | 362 (71.7%) |
| 25 to 34 Years | 692 (94.0%) | 726 (98.1%) |
| 35 to 44 Years | 673 (100.0%) | 732 (98.4%) |
| 45 to 54 Years | 619 (95.7%) | 654 (100.0%) |
| 55 to 64 Years | 724 (100.0%) | 750 (96.9%) |
| 65 to 74 Years | 633 (97.5%) | 722 (100.0%) |
| 75 Years and over | 508 (100.0%) | 345 (95.0%) |
| Total | 5,561 (98.2%) | 5,759 (96.1%) |
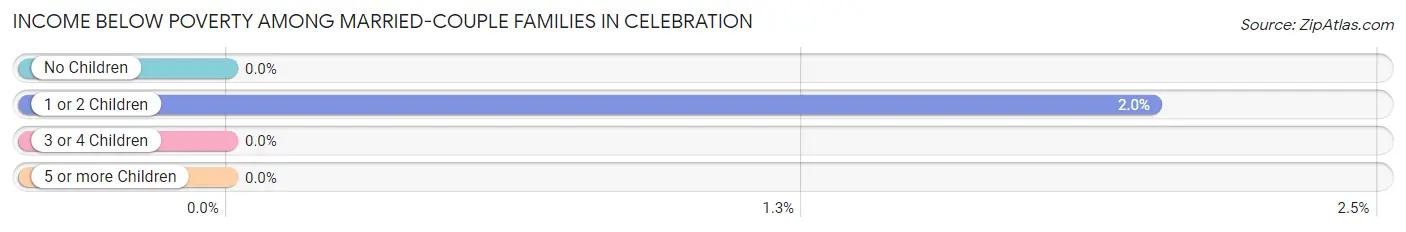
Income Below Poverty Among Married-Couple Families in Celebration
The poverty statistics for married-couple families in Celebration show that 0.7% or 16 of the total 2,337 families live below the poverty line. Families with 1 or 2 children have the highest poverty rate of 2.0%, comprising of 16 families. On the other hand, families with no children have the lowest poverty rate of 0.0%, which includes 0 families.
| Children | Above Poverty | Below Poverty |
| No Children | 1,422 (100.0%) | 0 (0.0%) |
| 1 or 2 Children | 779 (98.0%) | 16 (2.0%) |
| 3 or 4 Children | 120 (100.0%) | 0 (0.0%) |
| 5 or more Children | 0 (0.0%) | 0 (0.0%) |
| Total | 2,321 (99.3%) | 16 (0.7%) |
Income Below Poverty Among Single-Parent Households in Celebration
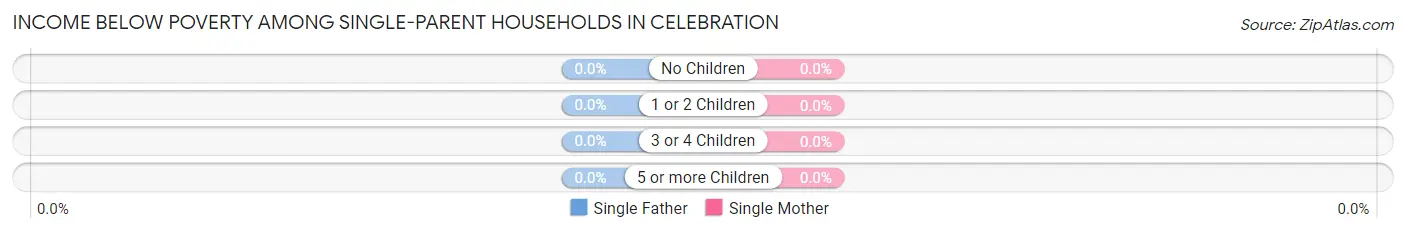
| Children | Single Father | Single Mother |
| No Children | 0 (0.0%) | 0 (0.0%) |
| 1 or 2 Children | 0 (0.0%) | 0 (0.0%) |
| 3 or 4 Children | 0 (0.0%) | 0 (0.0%) |
| 5 or more Children | 0 (0.0%) | 0 (0.0%) |
| Total | 0 (0.0%) | 0 (0.0%) |
Income Below Poverty Among Married-Couple vs Single-Parent Households in Celebration
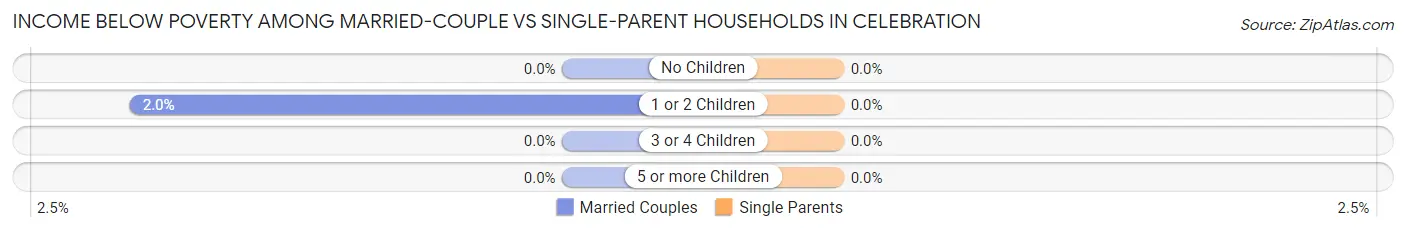
| Children | Married-Couple Families | Single-Parent Households |
| No Children | 0 (0.0%) | 0 (0.0%) |
| 1 or 2 Children | 16 (2.0%) | 0 (0.0%) |
| 3 or 4 Children | 0 (0.0%) | 0 (0.0%) |
| 5 or more Children | 0 (0.0%) | 0 (0.0%) |
| Total | 16 (0.7%) | 0 (0.0%) |
Employment Characteristics in Celebration
Employment by Class of Employer in Celebration
Among the 5,117 employed individuals in Celebration, private company employees (3,433 | 67.1%), self-employed (incorporated) (593 | 11.6%), and self-employed (not incorporated) (414 | 8.1%) make up the most common classes of employment.
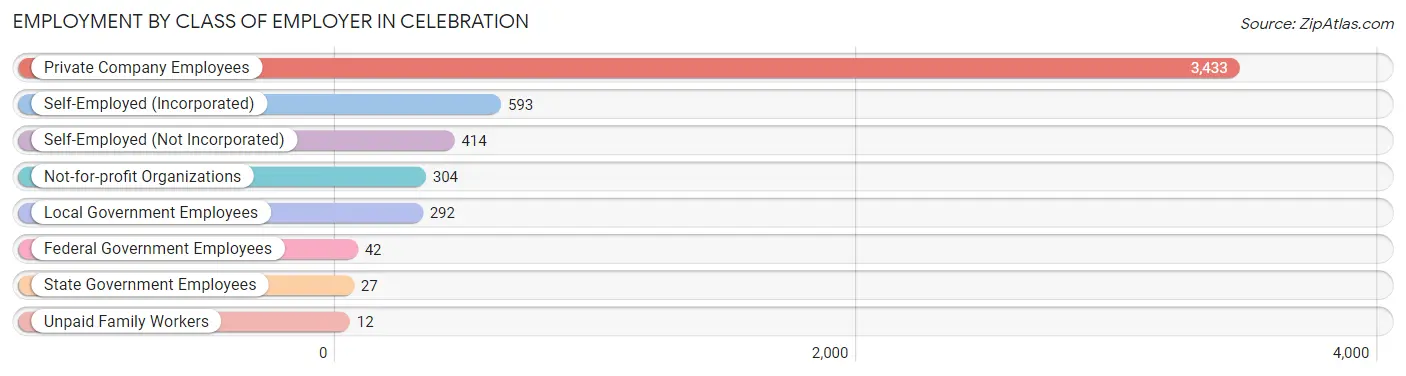
| Employer Class | # Employees | % Employees |
| Private Company Employees | 3,433 | 67.1% |
| Self-Employed (Incorporated) | 593 | 11.6% |
| Self-Employed (Not Incorporated) | 414 | 8.1% |
| Not-for-profit Organizations | 304 | 5.9% |
| Local Government Employees | 292 | 5.7% |
| State Government Employees | 27 | 0.5% |
| Federal Government Employees | 42 | 0.8% |
| Unpaid Family Workers | 12 | 0.2% |
| Total | 5,117 | 100.0% |
Employment Status by Age in Celebration
According to the labor force statistics for Celebration, out of the total population over 16 years of age (8,876), 61.6% or 5,468 individuals are in the labor force, with 4.2% or 230 of them unemployed. The age group with the highest labor force participation rate is 25 to 29 years, with 95.0% or 762 individuals in the labor force. Within the labor force, the 20 to 24 years age range has the highest percentage of unemployed individuals, with 19.6% or 69 of them being unemployed.
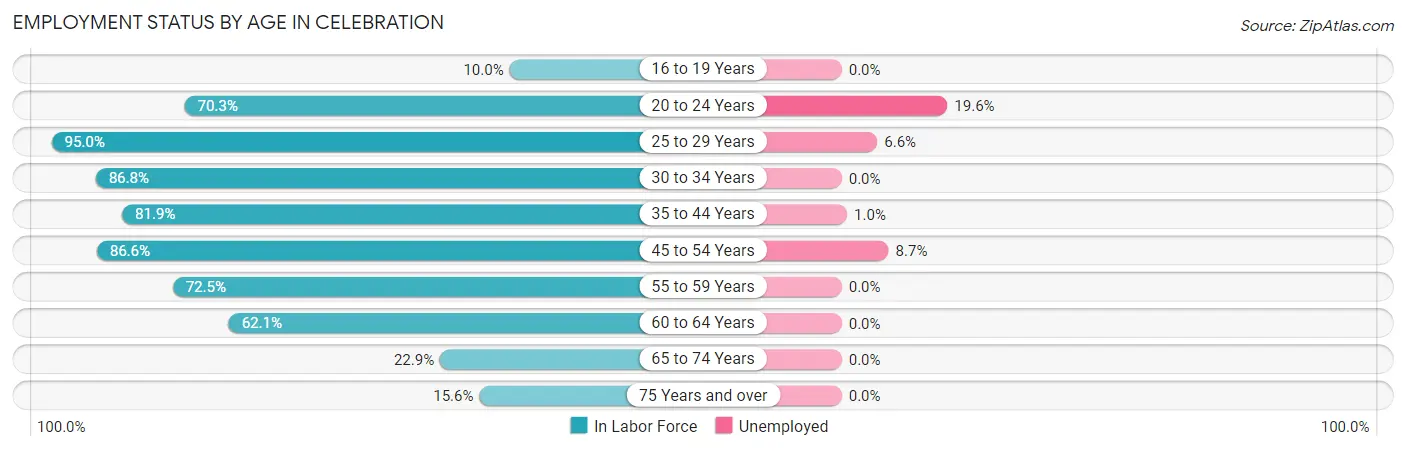
| Age Bracket | In Labor Force | Unemployed |
| 16 to 19 Years | 44 (10.0%) | 0 (0.0%) |
| 20 to 24 Years | 352 (70.3%) | 69 (19.6%) |
| 25 to 29 Years | 762 (95.0%) | 50 (6.6%) |
| 30 to 34 Years | 585 (86.8%) | 0 (0.0%) |
| 35 to 44 Years | 1,161 (81.9%) | 12 (1.0%) |
| 45 to 54 Years | 1,127 (86.6%) | 98 (8.7%) |
| 55 to 59 Years | 429 (72.5%) | 0 (0.0%) |
| 60 to 64 Years | 563 (62.1%) | 0 (0.0%) |
| 65 to 74 Years | 314 (22.9%) | 0 (0.0%) |
| 75 Years and over | 136 (15.6%) | 0 (0.0%) |
| Total | 5,468 (61.6%) | 230 (4.2%) |
Employment Status by Educational Attainment in Celebration
According to labor force statistics for Celebration, 81.3% of individuals (4,628) out of the total population between 25 and 64 years of age (5,692) are in the labor force, with 3.5% or 162 of them being unemployed. The group with the highest labor force participation rate are those with the educational attainment of bachelor's degree or higher, with 85.1% or 2,866 individuals in the labor force. Within the labor force, individuals with bachelor's degree or higher education have the highest percentage of unemployment, with 5.2% or 149 of them being unemployed.
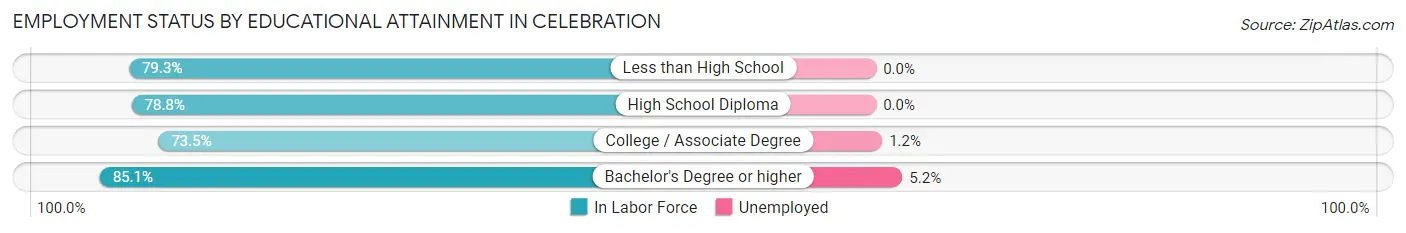
| Educational Attainment | In Labor Force | Unemployed |
| Less than High School | 149 (79.3%) | 0 (0.0%) |
| High School Diploma | 613 (78.8%) | 0 (0.0%) |
| College / Associate Degree | 998 (73.5%) | 16 (1.2%) |
| Bachelor's Degree or higher | 2,866 (85.1%) | 175 (5.2%) |
| Total | 4,628 (81.3%) | 199 (3.5%) |
Employment Occupations by Sex in Celebration
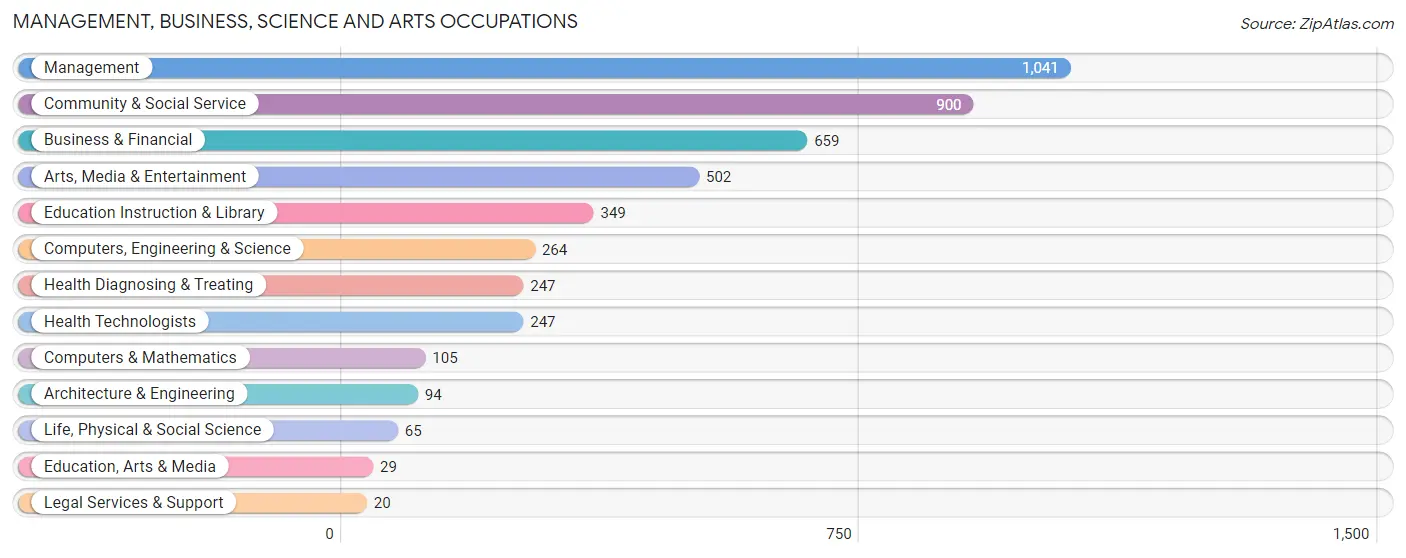
Management, Business, Science and Arts Occupations
The most common Management, Business, Science and Arts occupations in Celebration are Management (1,041 | 19.9%), Community & Social Service (900 | 17.2%), Business & Financial (659 | 12.6%), Arts, Media & Entertainment (502 | 9.6%), and Education Instruction & Library (349 | 6.7%).
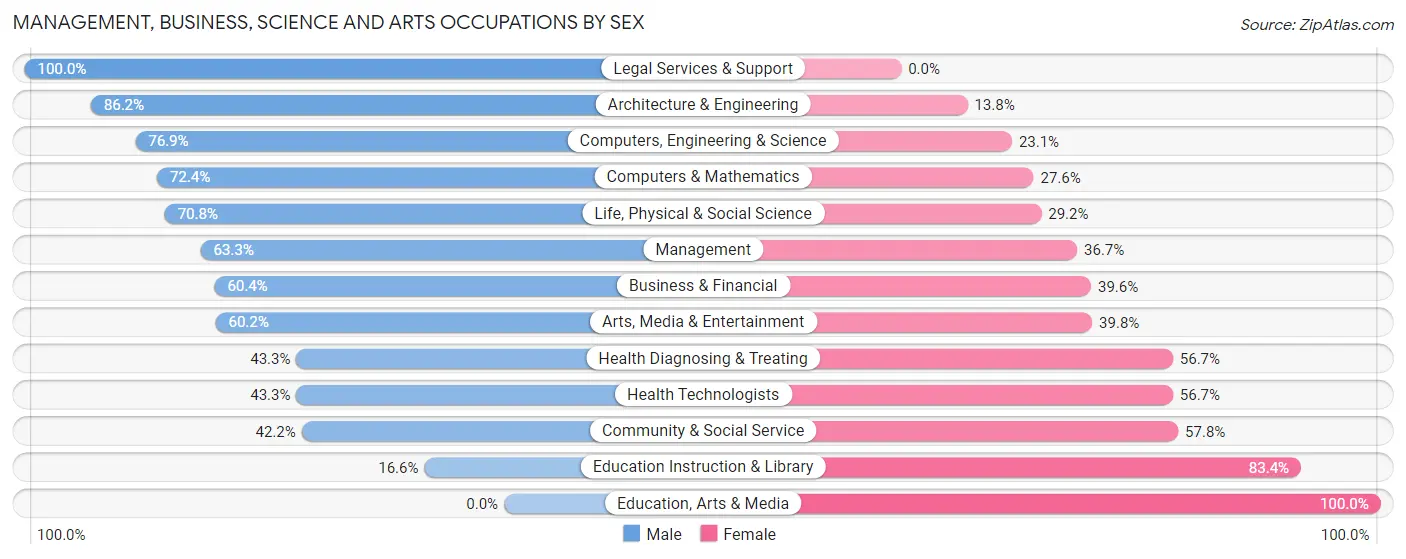
Management, Business, Science and Arts Occupations by Sex
Within the Management, Business, Science and Arts occupations in Celebration, the most male-oriented occupations are Legal Services & Support (100.0%), Architecture & Engineering (86.2%), and Computers, Engineering & Science (76.9%), while the most female-oriented occupations are Education, Arts & Media (100.0%), Education Instruction & Library (83.4%), and Community & Social Service (57.8%).
| Occupation | Male | Female |
| Management | 659 (63.3%) | 382 (36.7%) |
| Business & Financial | 398 (60.4%) | 261 (39.6%) |
| Computers, Engineering & Science | 203 (76.9%) | 61 (23.1%) |
| Computers & Mathematics | 76 (72.4%) | 29 (27.6%) |
| Architecture & Engineering | 81 (86.2%) | 13 (13.8%) |
| Life, Physical & Social Science | 46 (70.8%) | 19 (29.2%) |
| Community & Social Service | 380 (42.2%) | 520 (57.8%) |
| Education, Arts & Media | 0 (0.0%) | 29 (100.0%) |
| Legal Services & Support | 20 (100.0%) | 0 (0.0%) |
| Education Instruction & Library | 58 (16.6%) | 291 (83.4%) |
| Arts, Media & Entertainment | 302 (60.2%) | 200 (39.8%) |
| Health Diagnosing & Treating | 107 (43.3%) | 140 (56.7%) |
| Health Technologists | 107 (43.3%) | 140 (56.7%) |
| Total (Category) | 1,747 (56.2%) | 1,364 (43.8%) |
| Total (Overall) | 2,820 (53.8%) | 2,423 (46.2%) |
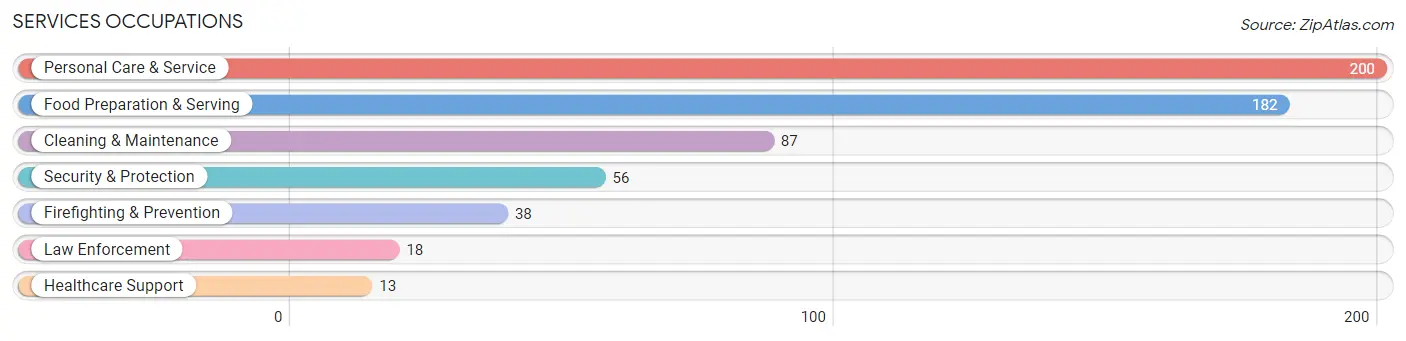
Services Occupations
The most common Services occupations in Celebration are Personal Care & Service (200 | 3.8%), Food Preparation & Serving (182 | 3.5%), Cleaning & Maintenance (87 | 1.7%), Security & Protection (56 | 1.1%), and Firefighting & Prevention (38 | 0.7%).
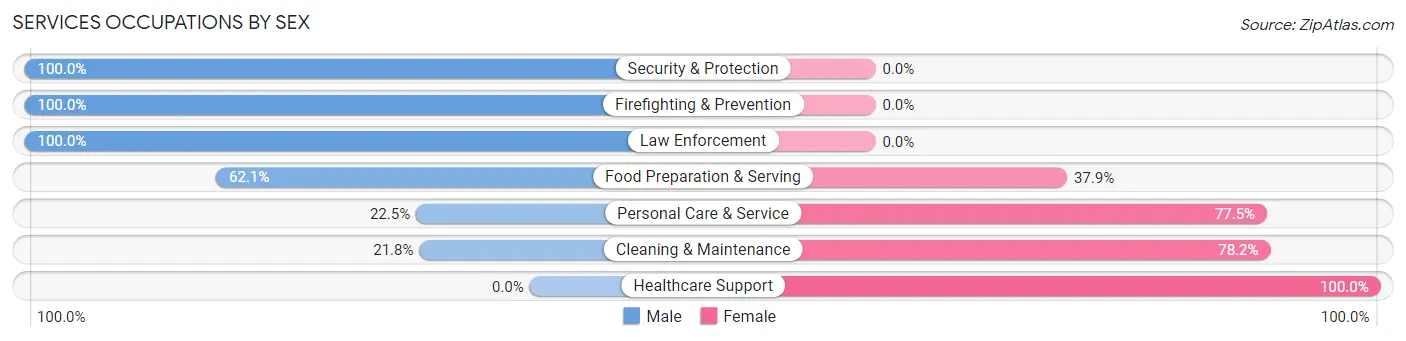
Services Occupations by Sex
Within the Services occupations in Celebration, the most male-oriented occupations are Security & Protection (100.0%), Firefighting & Prevention (100.0%), and Law Enforcement (100.0%), while the most female-oriented occupations are Healthcare Support (100.0%), Cleaning & Maintenance (78.2%), and Personal Care & Service (77.5%).
| Occupation | Male | Female |
| Healthcare Support | 0 (0.0%) | 13 (100.0%) |
| Security & Protection | 56 (100.0%) | 0 (0.0%) |
| Firefighting & Prevention | 38 (100.0%) | 0 (0.0%) |
| Law Enforcement | 18 (100.0%) | 0 (0.0%) |
| Food Preparation & Serving | 113 (62.1%) | 69 (37.9%) |
| Cleaning & Maintenance | 19 (21.8%) | 68 (78.2%) |
| Personal Care & Service | 45 (22.5%) | 155 (77.5%) |
| Total (Category) | 233 (43.3%) | 305 (56.7%) |
| Total (Overall) | 2,820 (53.8%) | 2,423 (46.2%) |
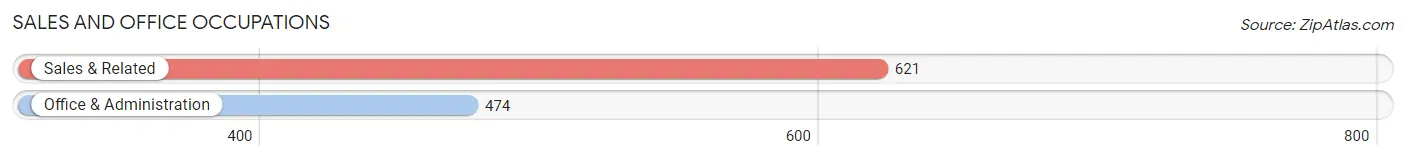
Sales and Office Occupations
The most common Sales and Office occupations in Celebration are Sales & Related (621 | 11.8%), and Office & Administration (474 | 9.0%).
Sales and Office Occupations by Sex
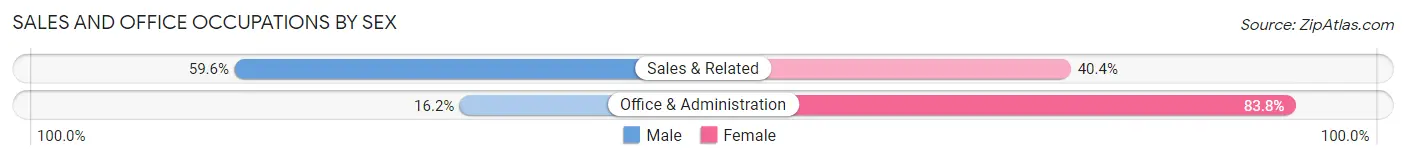
| Occupation | Male | Female |
| Sales & Related | 370 (59.6%) | 251 (40.4%) |
| Office & Administration | 77 (16.2%) | 397 (83.8%) |
| Total (Category) | 447 (40.8%) | 648 (59.2%) |
| Total (Overall) | 2,820 (53.8%) | 2,423 (46.2%) |
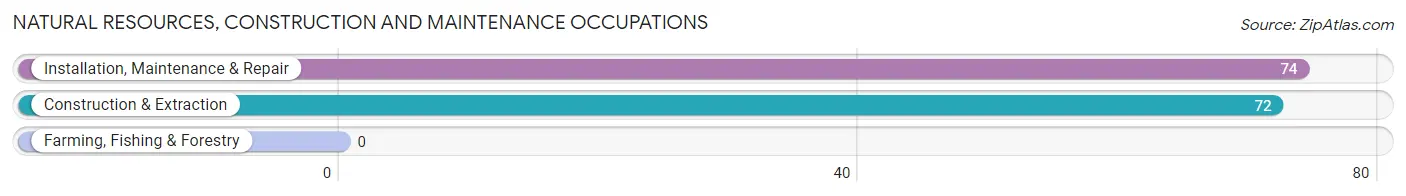
Natural Resources, Construction and Maintenance Occupations
The most common Natural Resources, Construction and Maintenance occupations in Celebration are Installation, Maintenance & Repair (74 | 1.4%), and Construction & Extraction (72 | 1.4%).
Natural Resources, Construction and Maintenance Occupations by Sex
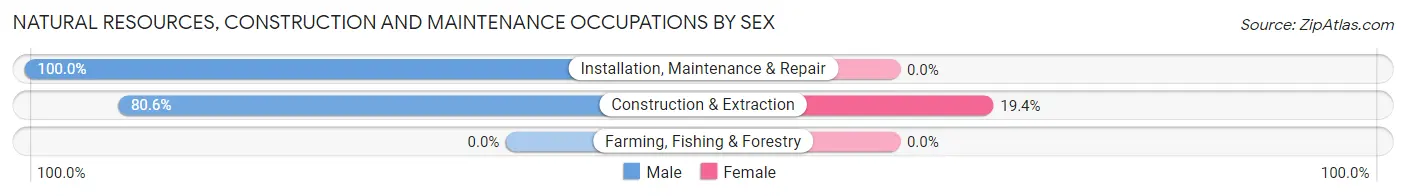
| Occupation | Male | Female |
| Farming, Fishing & Forestry | 0 (0.0%) | 0 (0.0%) |
| Construction & Extraction | 58 (80.6%) | 14 (19.4%) |
| Installation, Maintenance & Repair | 74 (100.0%) | 0 (0.0%) |
| Total (Category) | 132 (90.4%) | 14 (9.6%) |
| Total (Overall) | 2,820 (53.8%) | 2,423 (46.2%) |
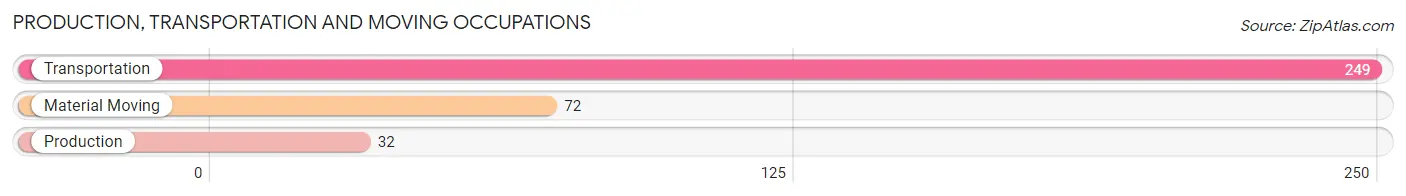
Production, Transportation and Moving Occupations
The most common Production, Transportation and Moving occupations in Celebration are Transportation (249 | 4.8%), Material Moving (72 | 1.4%), and Production (32 | 0.6%).
Production, Transportation and Moving Occupations by Sex
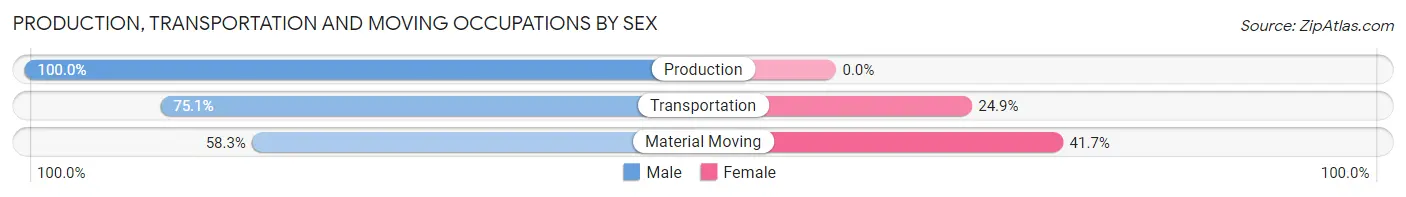
| Occupation | Male | Female |
| Production | 32 (100.0%) | 0 (0.0%) |
| Transportation | 187 (75.1%) | 62 (24.9%) |
| Material Moving | 42 (58.3%) | 30 (41.7%) |
| Total (Category) | 261 (73.9%) | 92 (26.1%) |
| Total (Overall) | 2,820 (53.8%) | 2,423 (46.2%) |
Employment Industries by Sex in Celebration
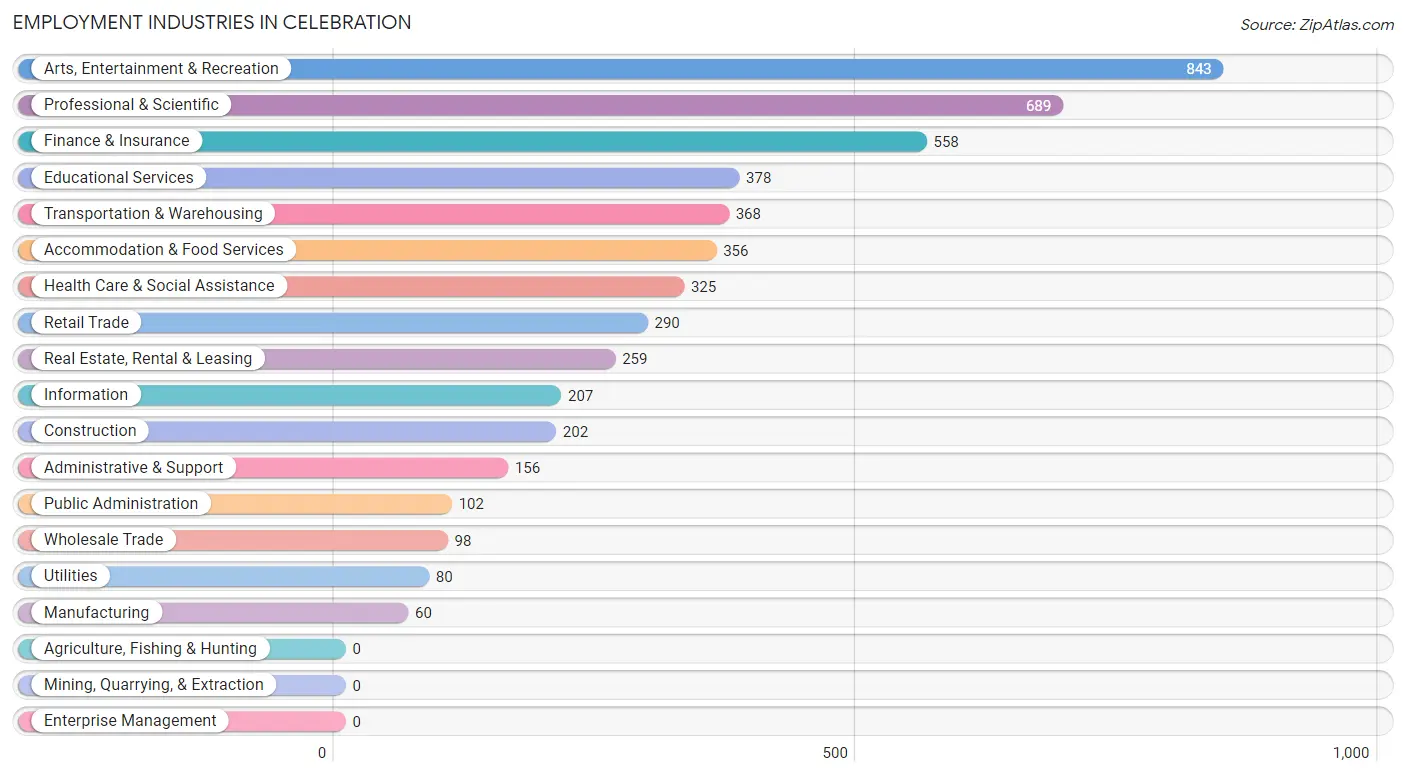
Employment Industries in Celebration
The major employment industries in Celebration include Arts, Entertainment & Recreation (843 | 16.1%), Professional & Scientific (689 | 13.1%), Finance & Insurance (558 | 10.6%), Educational Services (378 | 7.2%), and Transportation & Warehousing (368 | 7.0%).
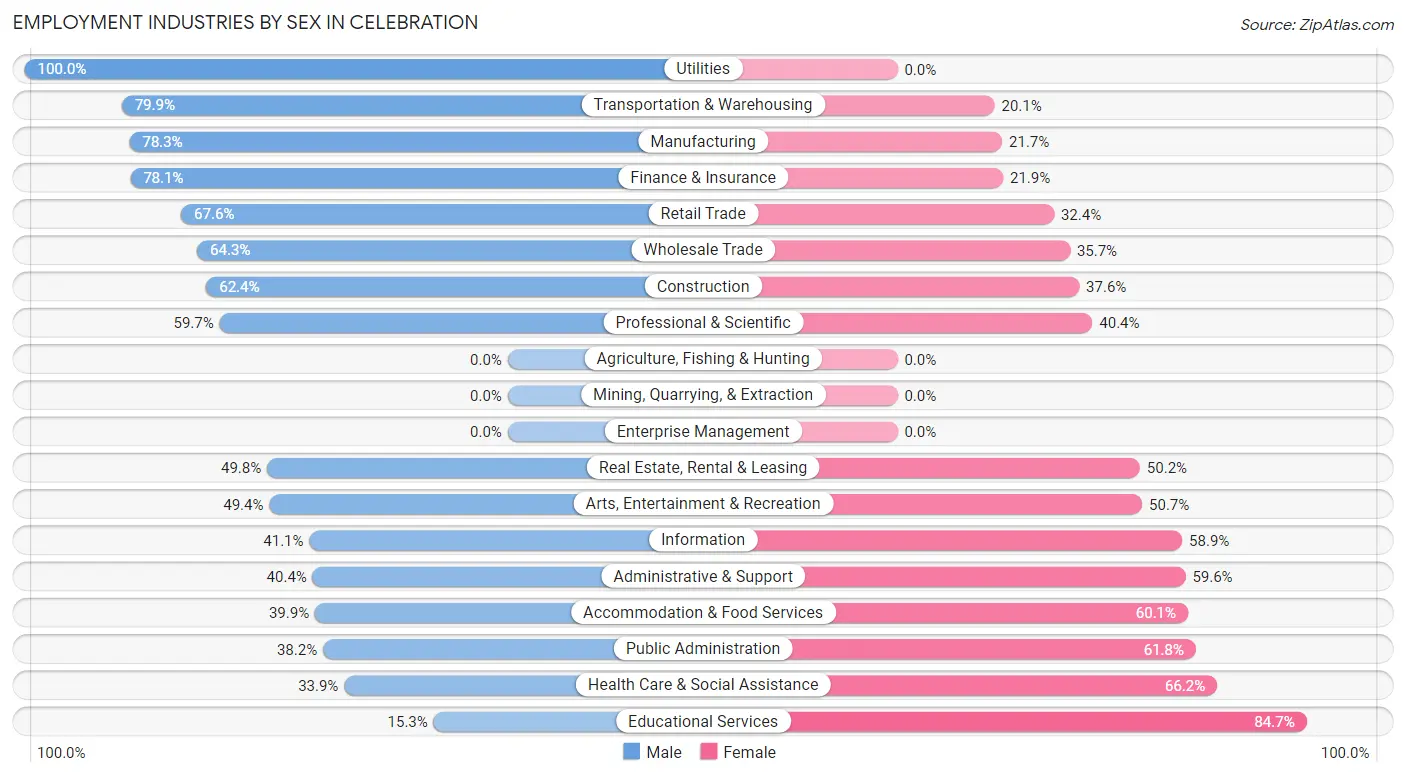
Employment Industries by Sex in Celebration
The Celebration industries that see more men than women are Utilities (100.0%), Transportation & Warehousing (79.9%), and Manufacturing (78.3%), whereas the industries that tend to have a higher number of women are Educational Services (84.7%), Health Care & Social Assistance (66.1%), and Public Administration (61.8%).
| Industry | Male | Female |
| Agriculture, Fishing & Hunting | 0 (0.0%) | 0 (0.0%) |
| Mining, Quarrying, & Extraction | 0 (0.0%) | 0 (0.0%) |
| Construction | 126 (62.4%) | 76 (37.6%) |
| Manufacturing | 47 (78.3%) | 13 (21.7%) |
| Wholesale Trade | 63 (64.3%) | 35 (35.7%) |
| Retail Trade | 196 (67.6%) | 94 (32.4%) |
| Transportation & Warehousing | 294 (79.9%) | 74 (20.1%) |
| Utilities | 80 (100.0%) | 0 (0.0%) |
| Information | 85 (41.1%) | 122 (58.9%) |
| Finance & Insurance | 436 (78.1%) | 122 (21.9%) |
| Real Estate, Rental & Leasing | 129 (49.8%) | 130 (50.2%) |
| Professional & Scientific | 411 (59.7%) | 278 (40.4%) |
| Enterprise Management | 0 (0.0%) | 0 (0.0%) |
| Administrative & Support | 63 (40.4%) | 93 (59.6%) |
| Educational Services | 58 (15.3%) | 320 (84.7%) |
| Health Care & Social Assistance | 110 (33.9%) | 215 (66.1%) |
| Arts, Entertainment & Recreation | 416 (49.3%) | 427 (50.6%) |
| Accommodation & Food Services | 142 (39.9%) | 214 (60.1%) |
| Public Administration | 39 (38.2%) | 63 (61.8%) |
| Total | 2,820 (53.8%) | 2,423 (46.2%) |
Education in Celebration
School Enrollment in Celebration
The most common levels of schooling among the 3,291 students in Celebration are elementary school (905 | 27.5%), middle school (899 | 27.3%), and high school (532 | 16.2%).
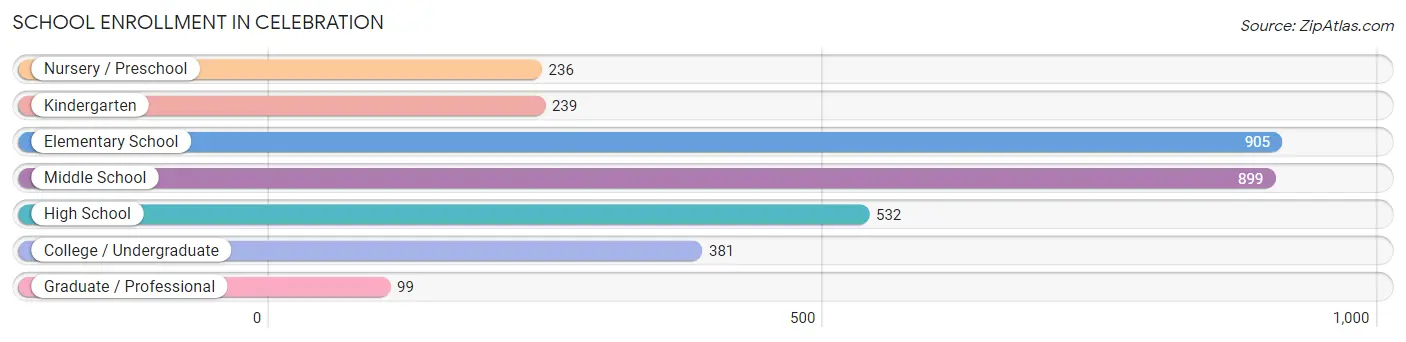
| School Level | # Students | % Students |
| Nursery / Preschool | 236 | 7.2% |
| Kindergarten | 239 | 7.3% |
| Elementary School | 905 | 27.5% |
| Middle School | 899 | 27.3% |
| High School | 532 | 16.2% |
| College / Undergraduate | 381 | 11.6% |
| Graduate / Professional | 99 | 3.0% |
| Total | 3,291 | 100.0% |
School Enrollment by Age by Funding Source in Celebration
Out of a total of 3,291 students who are enrolled in schools in Celebration, 796 (24.2%) attend a private institution, while the remaining 2,495 (75.8%) are enrolled in public schools. The age group of 35 years and over has the highest likelihood of being enrolled in private schools, with 32 (100.0% in the age bracket) enrolled. Conversely, the age group of 10 to 14 year olds has the lowest likelihood of being enrolled in a private school, with 914 (88.2% in the age bracket) attending a public institution.
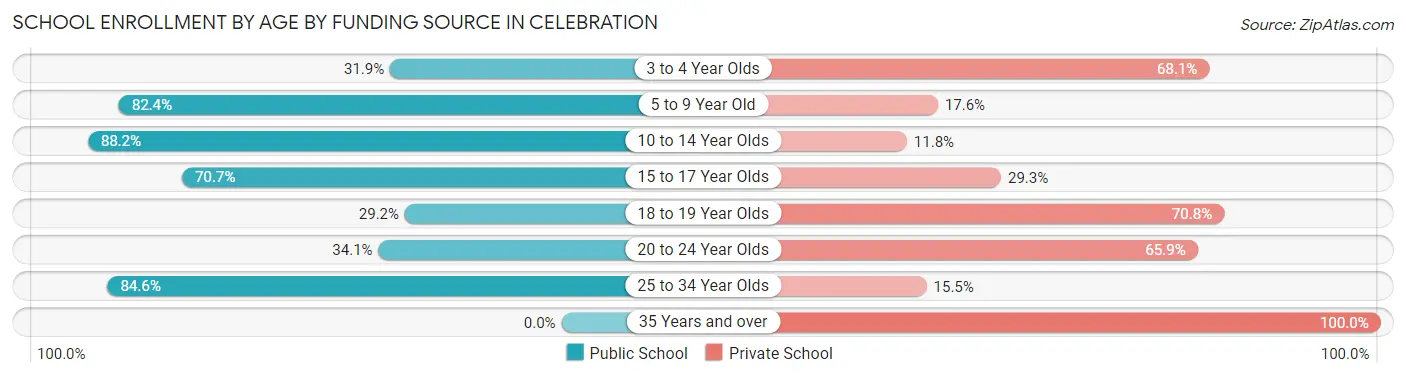
| Age Bracket | Public School | Private School |
| 3 to 4 Year Olds | 38 (31.9%) | 81 (68.1%) |
| 5 to 9 Year Old | 1,014 (82.4%) | 216 (17.6%) |
| 10 to 14 Year Olds | 914 (88.2%) | 122 (11.8%) |
| 15 to 17 Year Olds | 229 (70.7%) | 95 (29.3%) |
| 18 to 19 Year Olds | 42 (29.2%) | 102 (70.8%) |
| 20 to 24 Year Olds | 59 (34.1%) | 114 (65.9%) |
| 25 to 34 Year Olds | 197 (84.6%) | 36 (15.4%) |
| 35 Years and over | 0 (0.0%) | 32 (100.0%) |
| Total | 2,495 (75.8%) | 796 (24.2%) |
Educational Attainment by Field of Study in Celebration
Business (1,495 | 30.5%), education (563 | 11.5%), engineering (383 | 7.8%), psychology (375 | 7.7%), and science & technology (372 | 7.6%) are the most common fields of study among 4,894 individuals in Celebration who have obtained a bachelor's degree or higher.
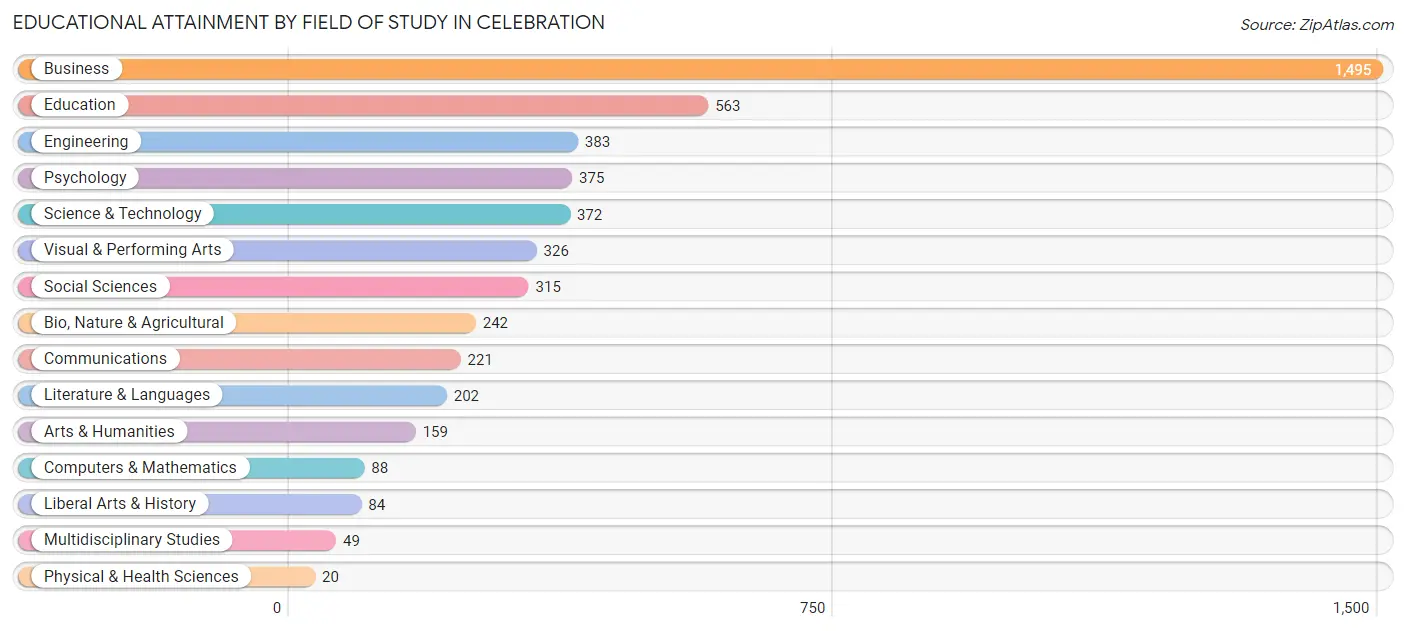
| Field of Study | # Graduates | % Graduates |
| Computers & Mathematics | 88 | 1.8% |
| Bio, Nature & Agricultural | 242 | 4.9% |
| Physical & Health Sciences | 20 | 0.4% |
| Psychology | 375 | 7.7% |
| Social Sciences | 315 | 6.4% |
| Engineering | 383 | 7.8% |
| Multidisciplinary Studies | 49 | 1.0% |
| Science & Technology | 372 | 7.6% |
| Business | 1,495 | 30.5% |
| Education | 563 | 11.5% |
| Literature & Languages | 202 | 4.1% |
| Liberal Arts & History | 84 | 1.7% |
| Visual & Performing Arts | 326 | 6.7% |
| Communications | 221 | 4.5% |
| Arts & Humanities | 159 | 3.3% |
| Total | 4,894 | 100.0% |
Transportation & Commute in Celebration
Vehicle Availability by Sex in Celebration
The most prevalent vehicle ownership categories in Celebration are males with 2 vehicles (1,392, accounting for 50.1%) and females with 2 vehicles (915, making up 59.5%).
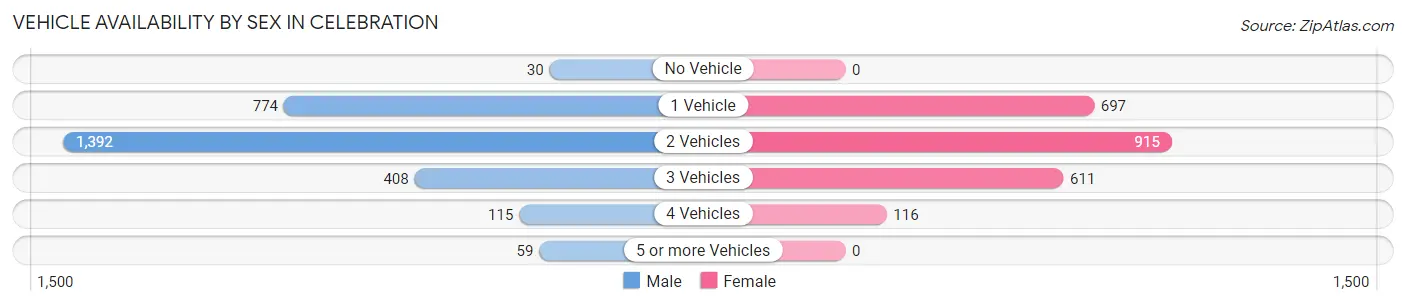
| Vehicles Available | Male | Female |
| No Vehicle | 30 (1.1%) | 0 (0.0%) |
| 1 Vehicle | 774 (27.9%) | 697 (29.8%) |
| 2 Vehicles | 1,392 (50.1%) | 915 (39.1%) |
| 3 Vehicles | 408 (14.7%) | 611 (26.1%) |
| 4 Vehicles | 115 (4.1%) | 116 (5.0%) |
| 5 or more Vehicles | 59 (2.1%) | 0 (0.0%) |
| Total | 2,778 (100.0%) | 2,339 (100.0%) |
Commute Time in Celebration
The most frequently occuring commute durations in Celebration are 15 to 19 minutes (625 commuters, 19.1%), 30 to 34 minutes (592 commuters, 18.1%), and 20 to 24 minutes (378 commuters, 11.5%).
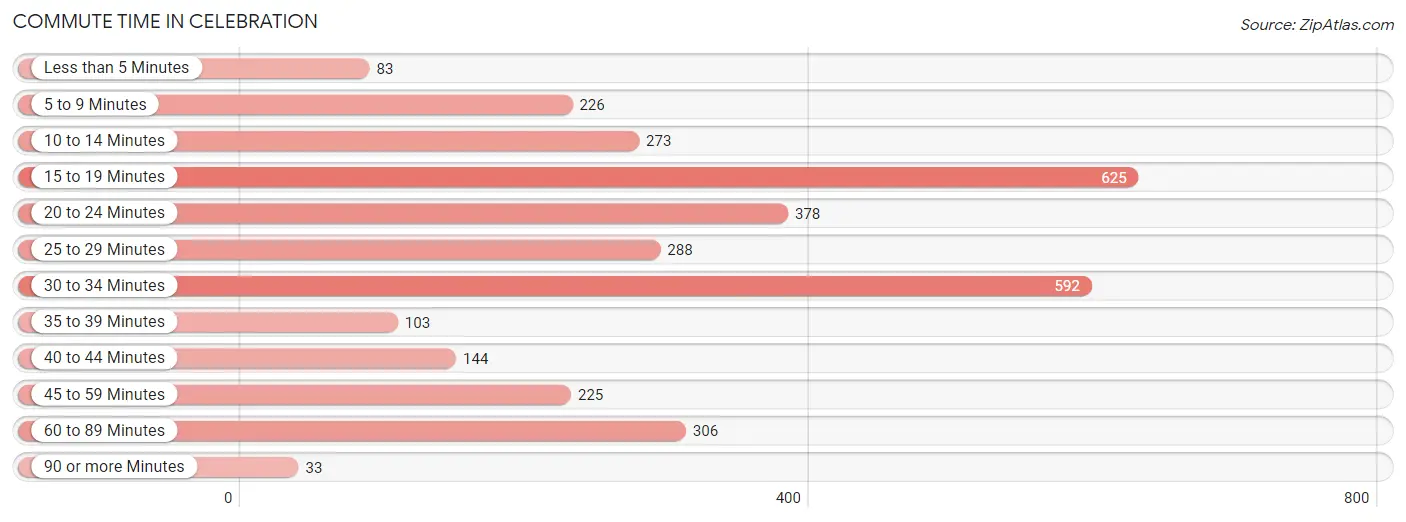
| Commute Time | # Commuters | % Commuters |
| Less than 5 Minutes | 83 | 2.5% |
| 5 to 9 Minutes | 226 | 6.9% |
| 10 to 14 Minutes | 273 | 8.3% |
| 15 to 19 Minutes | 625 | 19.1% |
| 20 to 24 Minutes | 378 | 11.5% |
| 25 to 29 Minutes | 288 | 8.8% |
| 30 to 34 Minutes | 592 | 18.1% |
| 35 to 39 Minutes | 103 | 3.1% |
| 40 to 44 Minutes | 144 | 4.4% |
| 45 to 59 Minutes | 225 | 6.9% |
| 60 to 89 Minutes | 306 | 9.3% |
| 90 or more Minutes | 33 | 1.0% |
Commute Time by Sex in Celebration
The most common commute times in Celebration are 30 to 34 minutes (414 commuters, 25.5%) for males and 15 to 19 minutes (316 commuters, 19.1%) for females.
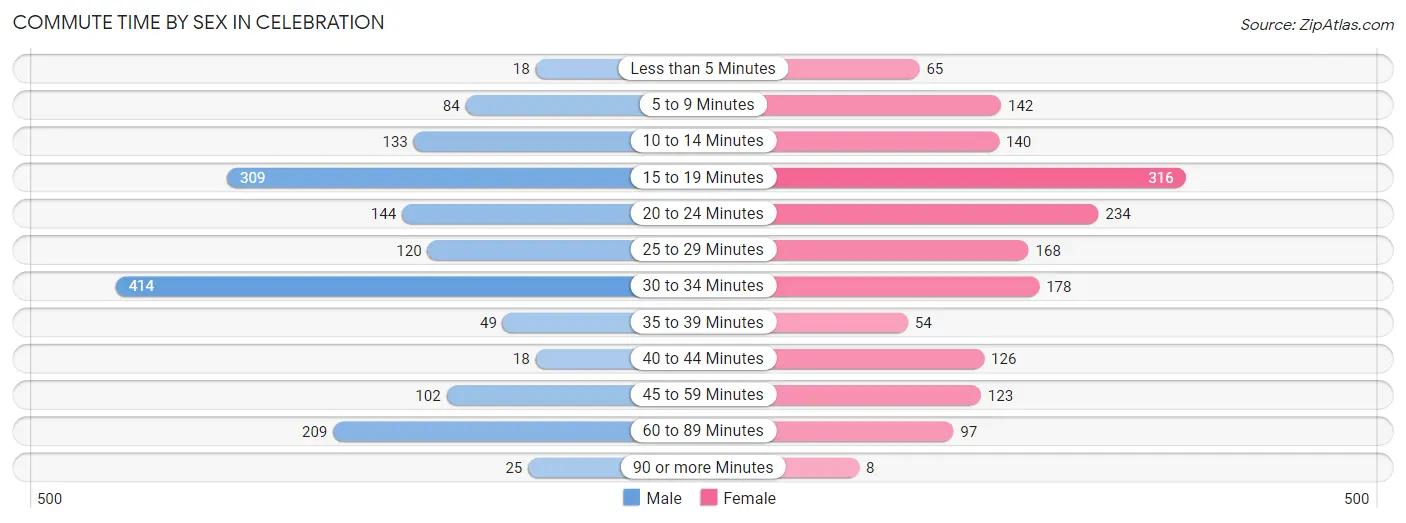
| Commute Time | Male | Female |
| Less than 5 Minutes | 18 (1.1%) | 65 (3.9%) |
| 5 to 9 Minutes | 84 (5.2%) | 142 (8.6%) |
| 10 to 14 Minutes | 133 (8.2%) | 140 (8.5%) |
| 15 to 19 Minutes | 309 (19.0%) | 316 (19.1%) |
| 20 to 24 Minutes | 144 (8.9%) | 234 (14.2%) |
| 25 to 29 Minutes | 120 (7.4%) | 168 (10.2%) |
| 30 to 34 Minutes | 414 (25.5%) | 178 (10.8%) |
| 35 to 39 Minutes | 49 (3.0%) | 54 (3.3%) |
| 40 to 44 Minutes | 18 (1.1%) | 126 (7.6%) |
| 45 to 59 Minutes | 102 (6.3%) | 123 (7.4%) |
| 60 to 89 Minutes | 209 (12.9%) | 97 (5.9%) |
| 90 or more Minutes | 25 (1.5%) | 8 (0.5%) |
Time of Departure to Work by Sex in Celebration
The most frequent times of departure to work in Celebration are 8:00 AM to 8:29 AM (492, 30.3%) for males and 7:30 AM to 7:59 AM (322, 19.5%) for females.
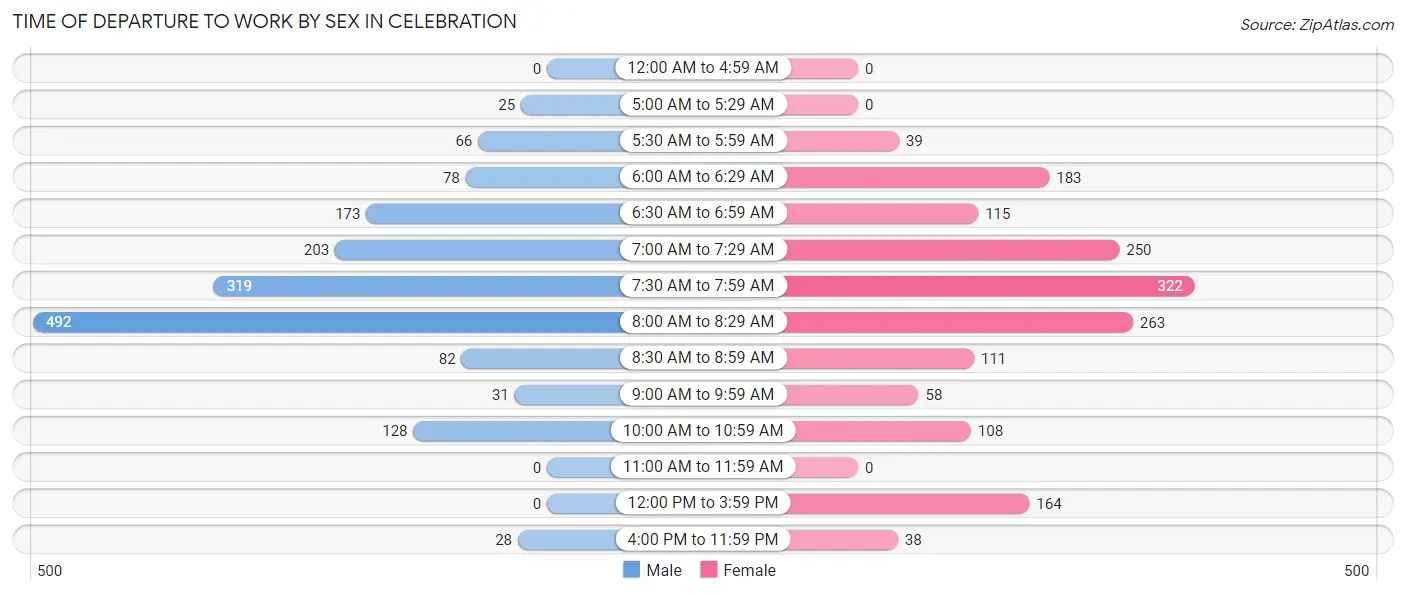
| Time of Departure | Male | Female |
| 12:00 AM to 4:59 AM | 0 (0.0%) | 0 (0.0%) |
| 5:00 AM to 5:29 AM | 25 (1.5%) | 0 (0.0%) |
| 5:30 AM to 5:59 AM | 66 (4.1%) | 39 (2.4%) |
| 6:00 AM to 6:29 AM | 78 (4.8%) | 183 (11.1%) |
| 6:30 AM to 6:59 AM | 173 (10.6%) | 115 (7.0%) |
| 7:00 AM to 7:29 AM | 203 (12.5%) | 250 (15.1%) |
| 7:30 AM to 7:59 AM | 319 (19.6%) | 322 (19.5%) |
| 8:00 AM to 8:29 AM | 492 (30.3%) | 263 (15.9%) |
| 8:30 AM to 8:59 AM | 82 (5.1%) | 111 (6.7%) |
| 9:00 AM to 9:59 AM | 31 (1.9%) | 58 (3.5%) |
| 10:00 AM to 10:59 AM | 128 (7.9%) | 108 (6.5%) |
| 11:00 AM to 11:59 AM | 0 (0.0%) | 0 (0.0%) |
| 12:00 PM to 3:59 PM | 0 (0.0%) | 164 (9.9%) |
| 4:00 PM to 11:59 PM | 28 (1.7%) | 38 (2.3%) |
| Total | 1,625 (100.0%) | 1,651 (100.0%) |
Housing Occupancy in Celebration
Occupancy by Ownership in Celebration
Of the total 4,307 dwellings in Celebration, owner-occupied units account for 2,538 (58.9%), while renter-occupied units make up 1,769 (41.1%).
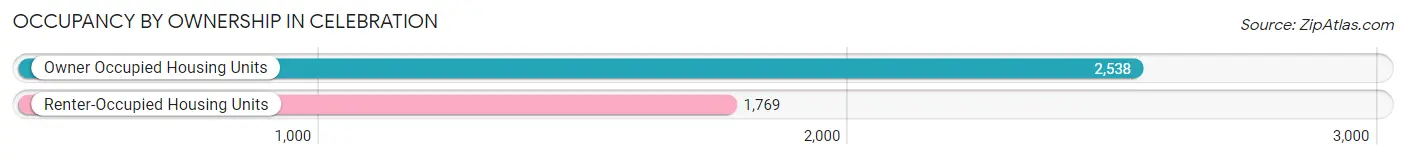
| Occupancy | # Housing Units | % Housing Units |
| Owner Occupied Housing Units | 2,538 | 58.9% |
| Renter-Occupied Housing Units | 1,769 | 41.1% |
| Total Occupied Housing Units | 4,307 | 100.0% |
Occupancy by Household Size in Celebration
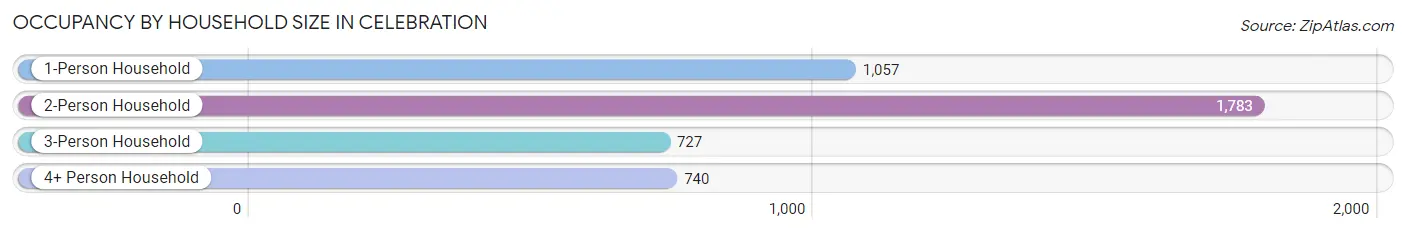
| Household Size | # Housing Units | % Housing Units |
| 1-Person Household | 1,057 | 24.5% |
| 2-Person Household | 1,783 | 41.4% |
| 3-Person Household | 727 | 16.9% |
| 4+ Person Household | 740 | 17.2% |
| Total Housing Units | 4,307 | 100.0% |
Occupancy by Ownership by Household Size in Celebration
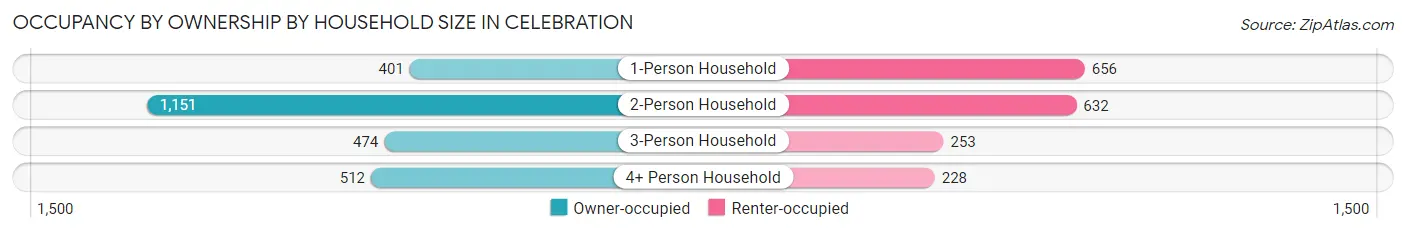
| Household Size | Owner-occupied | Renter-occupied |
| 1-Person Household | 401 (37.9%) | 656 (62.1%) |
| 2-Person Household | 1,151 (64.5%) | 632 (35.4%) |
| 3-Person Household | 474 (65.2%) | 253 (34.8%) |
| 4+ Person Household | 512 (69.2%) | 228 (30.8%) |
| Total Housing Units | 2,538 (58.9%) | 1,769 (41.1%) |
Occupancy by Educational Attainment in Celebration
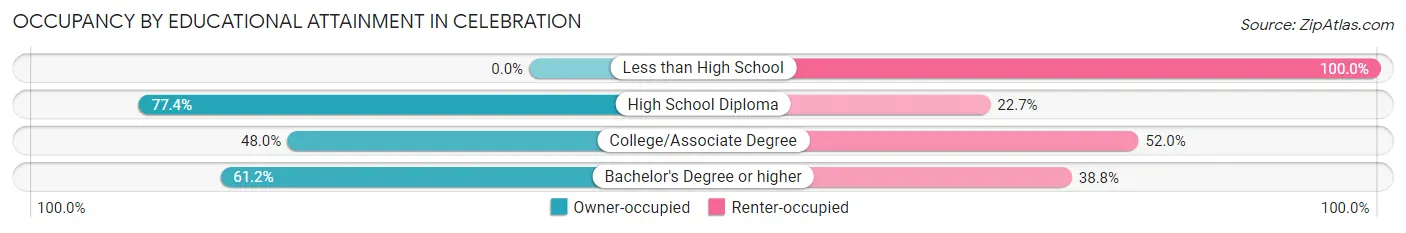
| Household Size | Owner-occupied | Renter-occupied |
| Less than High School | 0 (0.0%) | 46 (100.0%) |
| High School Diploma | 321 (77.3%) | 94 (22.7%) |
| College/Associate Degree | 496 (48.0%) | 538 (52.0%) |
| Bachelor's Degree or higher | 1,721 (61.2%) | 1,091 (38.8%) |
Occupancy by Age of Householder in Celebration
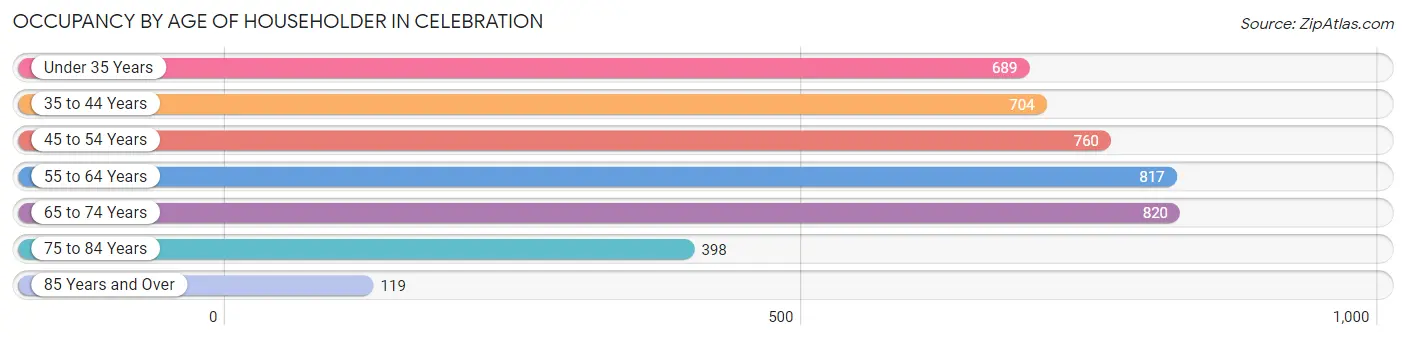
| Age Bracket | # Households | % Households |
| Under 35 Years | 689 | 16.0% |
| 35 to 44 Years | 704 | 16.4% |
| 45 to 54 Years | 760 | 17.6% |
| 55 to 64 Years | 817 | 19.0% |
| 65 to 74 Years | 820 | 19.0% |
| 75 to 84 Years | 398 | 9.2% |
| 85 Years and Over | 119 | 2.8% |
| Total | 4,307 | 100.0% |
Housing Finances in Celebration
Median Income by Occupancy in Celebration
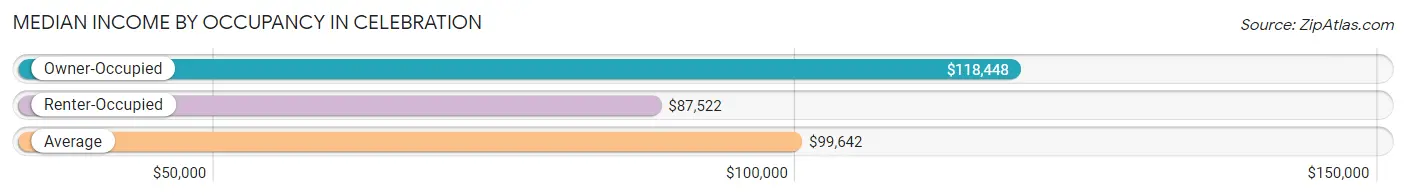
| Occupancy Type | # Households | Median Income |
| Owner-Occupied | 2,538 (58.9%) | $118,448 |
| Renter-Occupied | 1,769 (41.1%) | $87,522 |
| Average | 4,307 (100.0%) | $99,642 |
Occupancy by Householder Income Bracket in Celebration
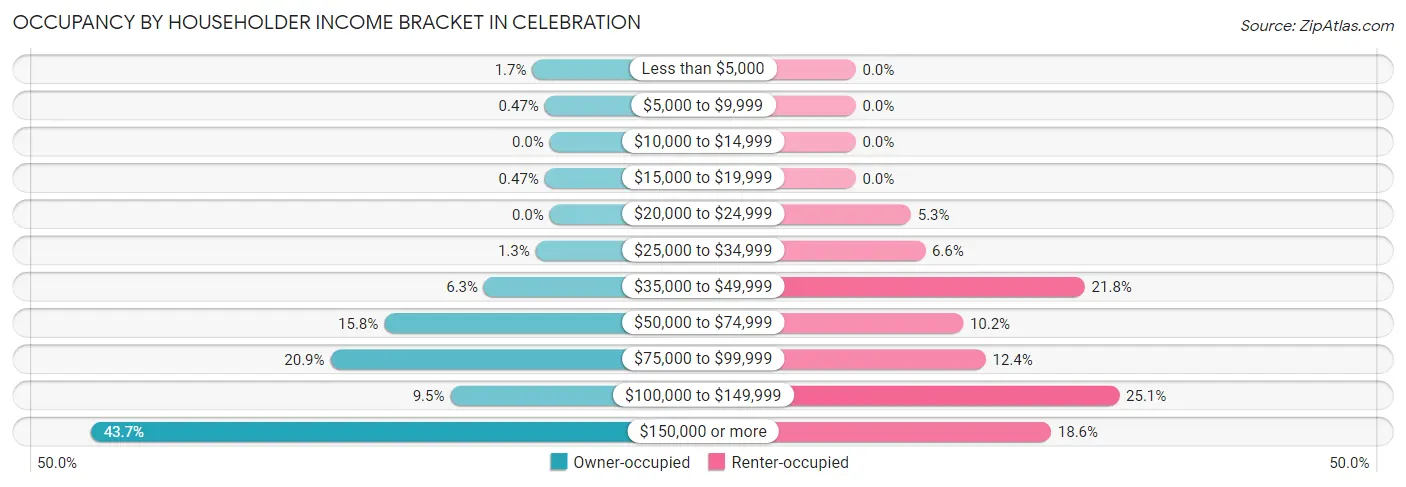
| Income Bracket | Owner-occupied | Renter-occupied |
| Less than $5,000 | 42 (1.7%) | 0 (0.0%) |
| $5,000 to $9,999 | 12 (0.5%) | 0 (0.0%) |
| $10,000 to $14,999 | 0 (0.0%) | 0 (0.0%) |
| $15,000 to $19,999 | 12 (0.5%) | 0 (0.0%) |
| $20,000 to $24,999 | 0 (0.0%) | 93 (5.3%) |
| $25,000 to $34,999 | 34 (1.3%) | 117 (6.6%) |
| $35,000 to $49,999 | 159 (6.3%) | 386 (21.8%) |
| $50,000 to $74,999 | 400 (15.8%) | 181 (10.2%) |
| $75,000 to $99,999 | 530 (20.9%) | 219 (12.4%) |
| $100,000 to $149,999 | 240 (9.5%) | 444 (25.1%) |
| $150,000 or more | 1,109 (43.7%) | 329 (18.6%) |
| Total | 2,538 (100.0%) | 1,769 (100.0%) |
Monthly Housing Cost Tiers in Celebration
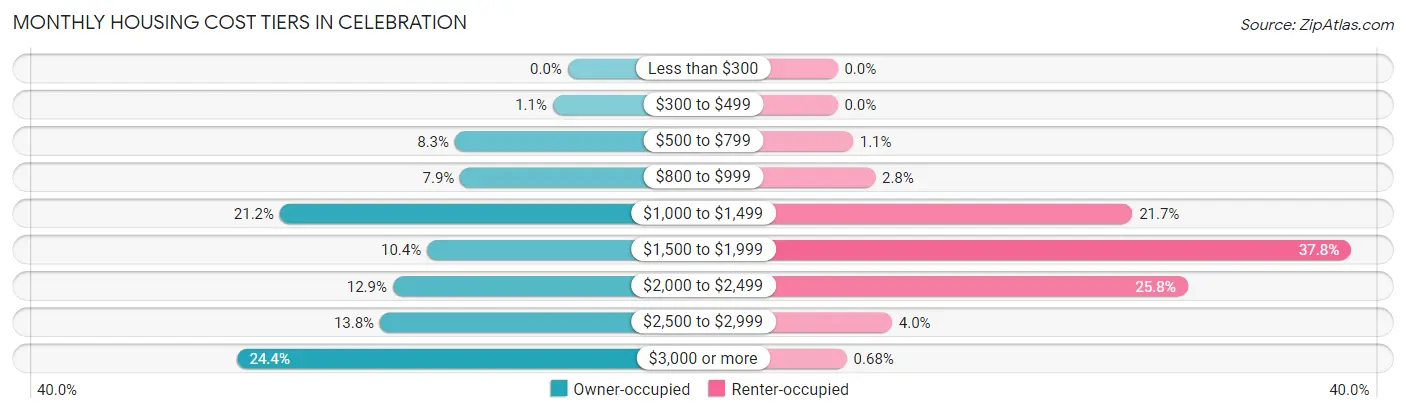
| Monthly Cost | Owner-occupied | Renter-occupied |
| Less than $300 | 0 (0.0%) | 0 (0.0%) |
| $300 to $499 | 28 (1.1%) | 0 (0.0%) |
| $500 to $799 | 211 (8.3%) | 20 (1.1%) |
| $800 to $999 | 201 (7.9%) | 49 (2.8%) |
| $1,000 to $1,499 | 538 (21.2%) | 384 (21.7%) |
| $1,500 to $1,999 | 263 (10.4%) | 669 (37.8%) |
| $2,000 to $2,499 | 327 (12.9%) | 456 (25.8%) |
| $2,500 to $2,999 | 351 (13.8%) | 71 (4.0%) |
| $3,000 or more | 619 (24.4%) | 12 (0.7%) |
| Total | 2,538 (100.0%) | 1,769 (100.0%) |
Physical Housing Characteristics in Celebration
Housing Structures in Celebration
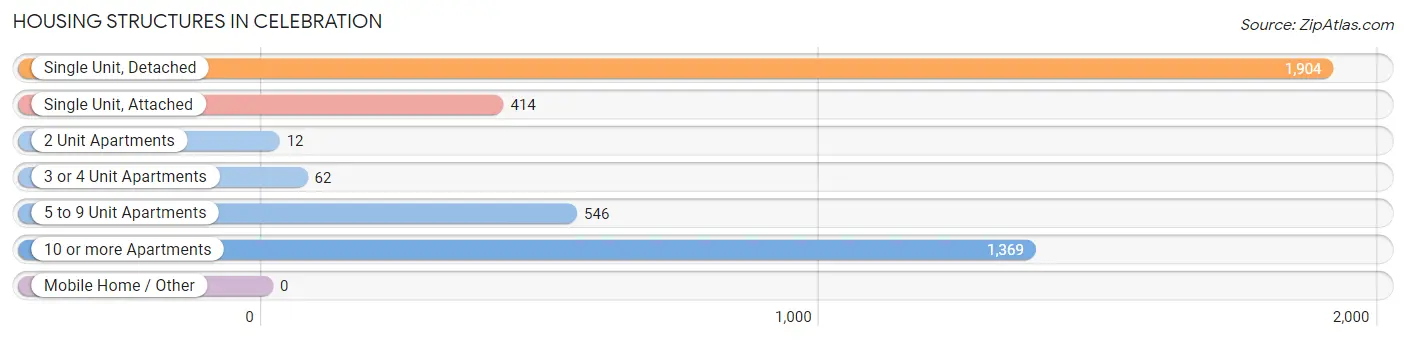
| Structure Type | # Housing Units | % Housing Units |
| Single Unit, Detached | 1,904 | 44.2% |
| Single Unit, Attached | 414 | 9.6% |
| 2 Unit Apartments | 12 | 0.3% |
| 3 or 4 Unit Apartments | 62 | 1.4% |
| 5 to 9 Unit Apartments | 546 | 12.7% |
| 10 or more Apartments | 1,369 | 31.8% |
| Mobile Home / Other | 0 | 0.0% |
| Total | 4,307 | 100.0% |
Housing Structures by Occupancy in Celebration
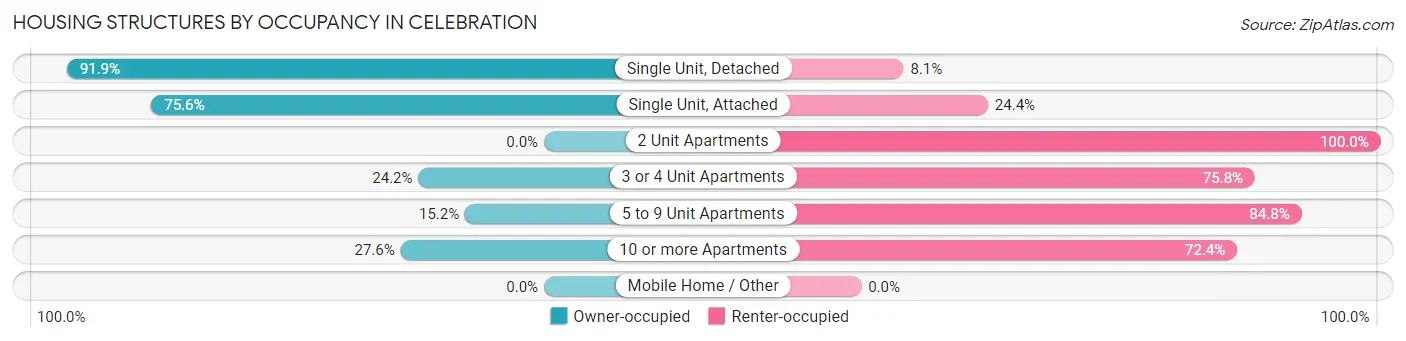
| Structure Type | Owner-occupied | Renter-occupied |
| Single Unit, Detached | 1,749 (91.9%) | 155 (8.1%) |
| Single Unit, Attached | 313 (75.6%) | 101 (24.4%) |
| 2 Unit Apartments | 0 (0.0%) | 12 (100.0%) |
| 3 or 4 Unit Apartments | 15 (24.2%) | 47 (75.8%) |
| 5 to 9 Unit Apartments | 83 (15.2%) | 463 (84.8%) |
| 10 or more Apartments | 378 (27.6%) | 991 (72.4%) |
| Mobile Home / Other | 0 (0.0%) | 0 (0.0%) |
| Total | 2,538 (58.9%) | 1,769 (41.1%) |
Housing Structures by Number of Rooms in Celebration
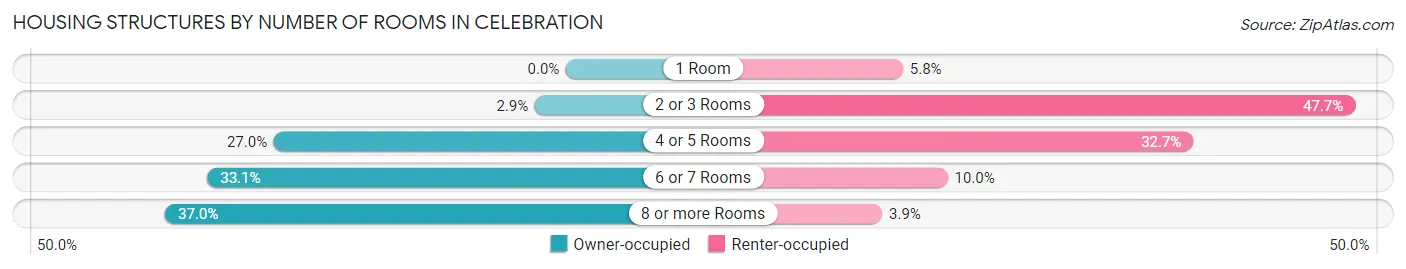
| Number of Rooms | Owner-occupied | Renter-occupied |
| 1 Room | 0 (0.0%) | 103 (5.8%) |
| 2 or 3 Rooms | 73 (2.9%) | 843 (47.6%) |
| 4 or 5 Rooms | 686 (27.0%) | 578 (32.7%) |
| 6 or 7 Rooms | 840 (33.1%) | 176 (10.0%) |
| 8 or more Rooms | 939 (37.0%) | 69 (3.9%) |
| Total | 2,538 (100.0%) | 1,769 (100.0%) |
Housing Structure by Heating Type in Celebration
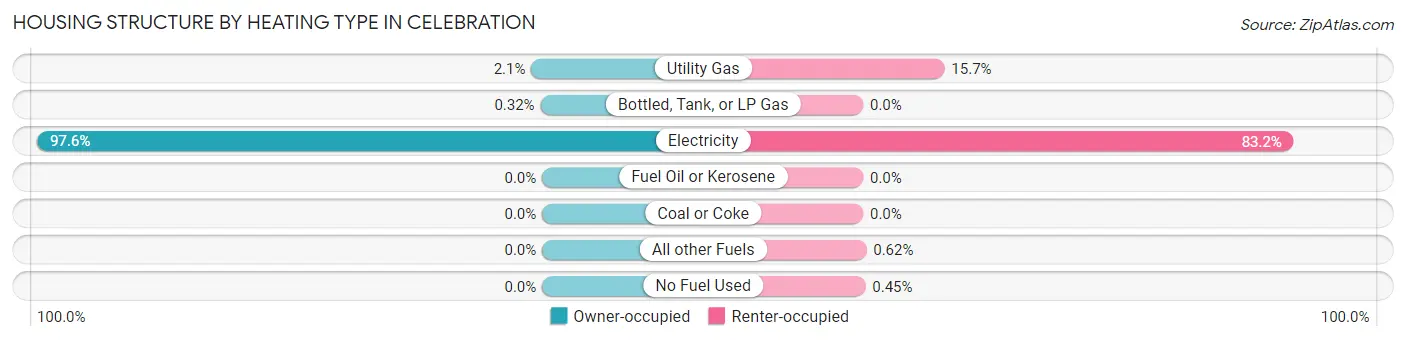
| Heating Type | Owner-occupied | Renter-occupied |
| Utility Gas | 53 (2.1%) | 278 (15.7%) |
| Bottled, Tank, or LP Gas | 8 (0.3%) | 0 (0.0%) |
| Electricity | 2,477 (97.6%) | 1,472 (83.2%) |
| Fuel Oil or Kerosene | 0 (0.0%) | 0 (0.0%) |
| Coal or Coke | 0 (0.0%) | 0 (0.0%) |
| All other Fuels | 0 (0.0%) | 11 (0.6%) |
| No Fuel Used | 0 (0.0%) | 8 (0.4%) |
| Total | 2,538 (100.0%) | 1,769 (100.0%) |
Household Vehicle Usage in Celebration
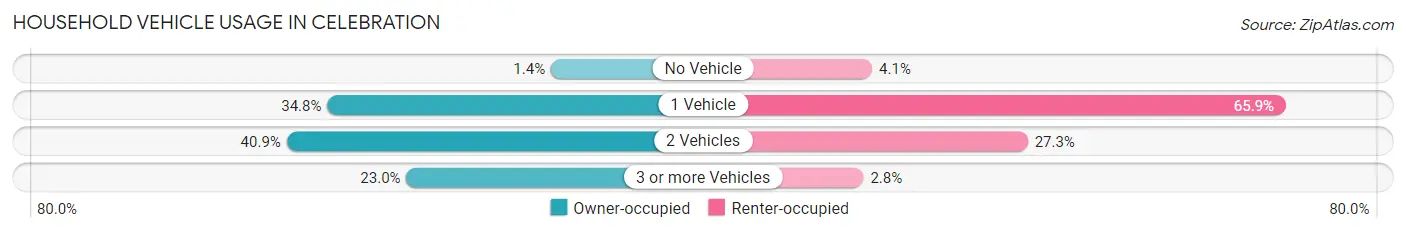
| Vehicles per Household | Owner-occupied | Renter-occupied |
| No Vehicle | 35 (1.4%) | 72 (4.1%) |
| 1 Vehicle | 883 (34.8%) | 1,165 (65.9%) |
| 2 Vehicles | 1,037 (40.9%) | 483 (27.3%) |
| 3 or more Vehicles | 583 (23.0%) | 49 (2.8%) |
| Total | 2,538 (100.0%) | 1,769 (100.0%) |
Real Estate & Mortgages in Celebration
Real Estate and Mortgage Overview in Celebration
| Characteristic | Without Mortgage | With Mortgage |
| Housing Units | 1,095 | 1,443 |
| Median Property Value | $532,700 | $616,200 |
| Median Household Income | $98,617 | $691 |
| Monthly Housing Costs | $1,151 | $601 |
| Real Estate Taxes | $5,941 | $12 |
Property Value by Mortgage Status in Celebration
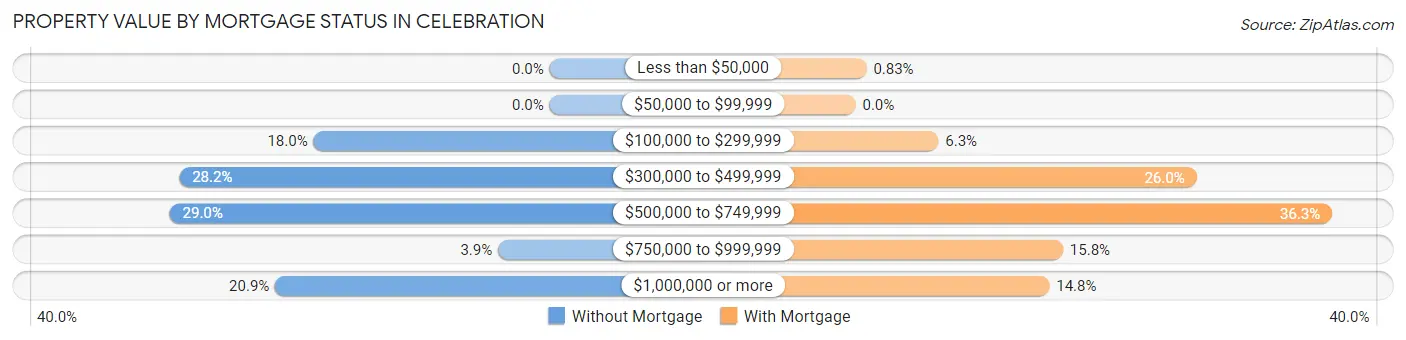
| Property Value | Without Mortgage | With Mortgage |
| Less than $50,000 | 0 (0.0%) | 12 (0.8%) |
| $50,000 to $99,999 | 0 (0.0%) | 0 (0.0%) |
| $100,000 to $299,999 | 197 (18.0%) | 91 (6.3%) |
| $300,000 to $499,999 | 309 (28.2%) | 375 (26.0%) |
| $500,000 to $749,999 | 317 (28.9%) | 524 (36.3%) |
| $750,000 to $999,999 | 43 (3.9%) | 228 (15.8%) |
| $1,000,000 or more | 229 (20.9%) | 213 (14.8%) |
| Total | 1,095 (100.0%) | 1,443 (100.0%) |
Household Income by Mortgage Status in Celebration
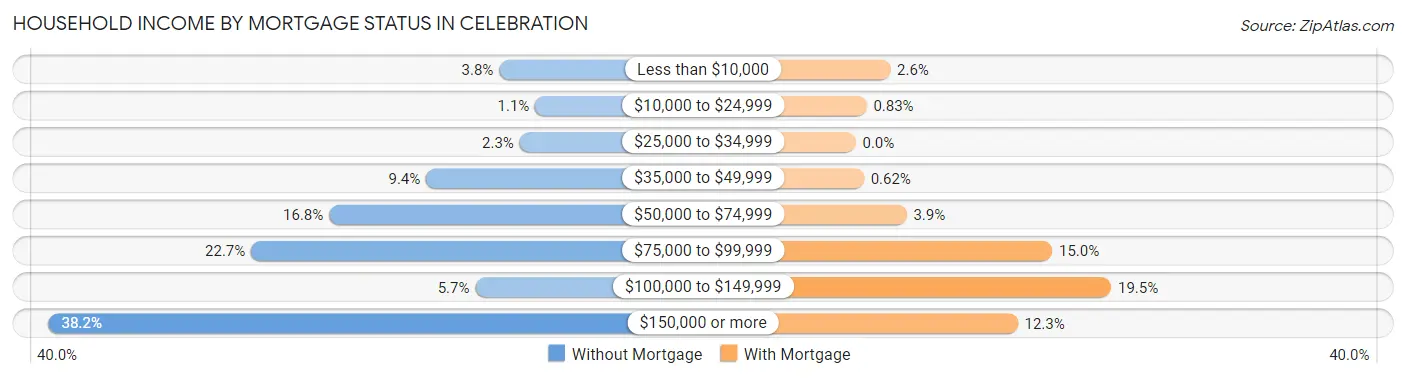
| Household Income | Without Mortgage | With Mortgage |
| Less than $10,000 | 42 (3.8%) | 38 (2.6%) |
| $10,000 to $24,999 | 12 (1.1%) | 12 (0.8%) |
| $25,000 to $34,999 | 25 (2.3%) | 0 (0.0%) |
| $35,000 to $49,999 | 103 (9.4%) | 9 (0.6%) |
| $50,000 to $74,999 | 184 (16.8%) | 56 (3.9%) |
| $75,000 to $99,999 | 249 (22.7%) | 216 (15.0%) |
| $100,000 to $149,999 | 62 (5.7%) | 281 (19.5%) |
| $150,000 or more | 418 (38.2%) | 178 (12.3%) |
| Total | 1,095 (100.0%) | 1,443 (100.0%) |
Property Value to Household Income Ratio in Celebration
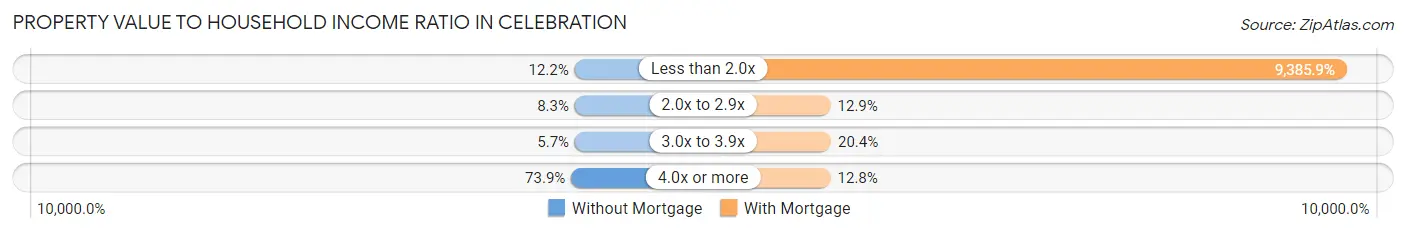
| Value-to-Income Ratio | Without Mortgage | With Mortgage |
| Less than 2.0x | 133 (12.1%) | 135,439 (9,385.9%) |
| 2.0x to 2.9x | 91 (8.3%) | 186 (12.9%) |
| 3.0x to 3.9x | 62 (5.7%) | 295 (20.4%) |
| 4.0x or more | 809 (73.9%) | 185 (12.8%) |
| Total | 1,095 (100.0%) | 1,443 (100.0%) |
Real Estate Taxes by Mortgage Status in Celebration
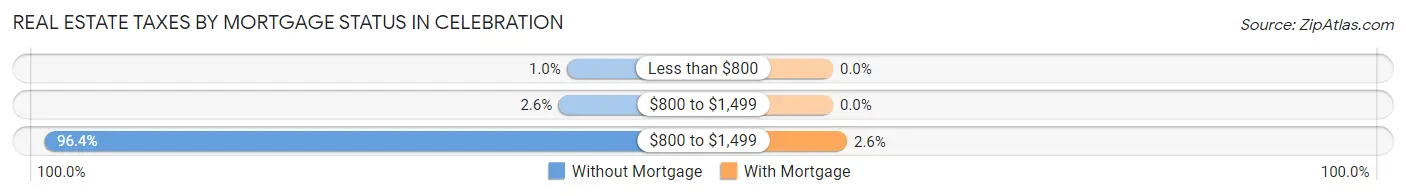
| Property Taxes | Without Mortgage | With Mortgage |
| Less than $800 | 11 (1.0%) | 0 (0.0%) |
| $800 to $1,499 | 28 (2.6%) | 0 (0.0%) |
| $800 to $1,499 | 1,056 (96.4%) | 37 (2.6%) |
| Total | 1,095 (100.0%) | 1,443 (100.0%) |
Health & Disability in Celebration
Health Insurance Coverage by Age in Celebration
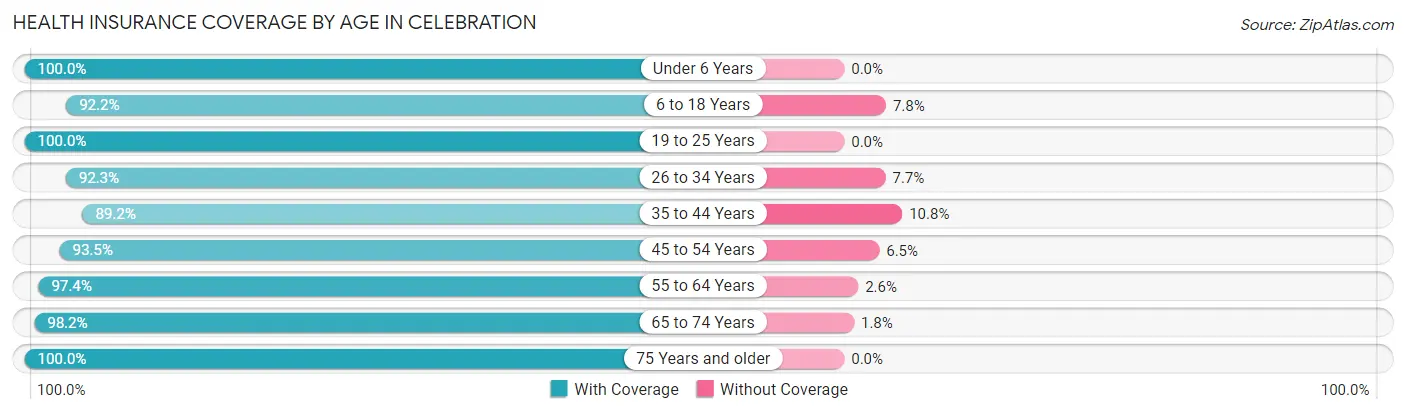
| Age Bracket | With Coverage | Without Coverage |
| Under 6 Years | 938 (100.0%) | 0 (0.0%) |
| 6 to 18 Years | 2,410 (92.2%) | 203 (7.8%) |
| 19 to 25 Years | 757 (100.0%) | 0 (0.0%) |
| 26 to 34 Years | 1,165 (92.3%) | 97 (7.7%) |
| 35 to 44 Years | 1,264 (89.2%) | 153 (10.8%) |
| 45 to 54 Years | 1,216 (93.5%) | 85 (6.5%) |
| 55 to 64 Years | 1,459 (97.4%) | 39 (2.6%) |
| 65 to 74 Years | 1,346 (98.2%) | 25 (1.8%) |
| 75 Years and older | 871 (100.0%) | 0 (0.0%) |
| Total | 11,426 (95.0%) | 602 (5.0%) |
Health Insurance Coverage by Citizenship Status in Celebration
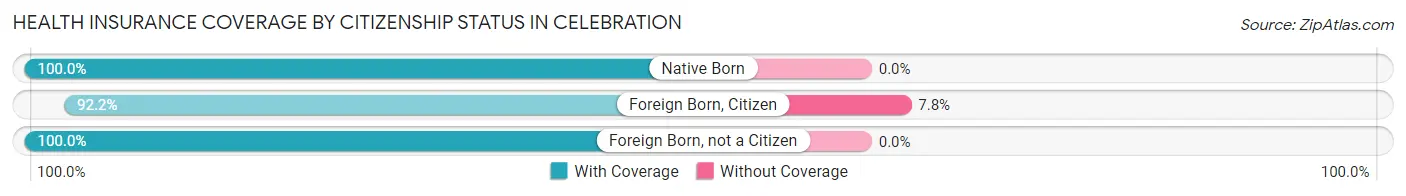
| Citizenship Status | With Coverage | Without Coverage |
| Native Born | 938 (100.0%) | 0 (0.0%) |
| Foreign Born, Citizen | 2,410 (92.2%) | 203 (7.8%) |
| Foreign Born, not a Citizen | 757 (100.0%) | 0 (0.0%) |
Health Insurance Coverage by Household Income in Celebration
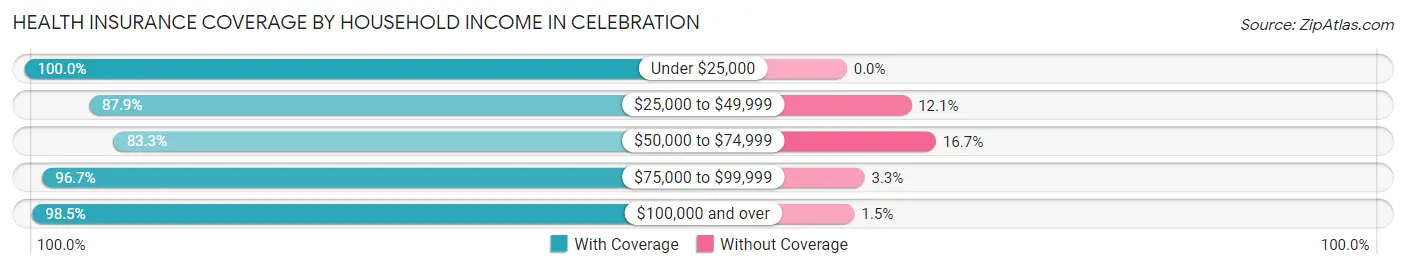
| Household Income | With Coverage | Without Coverage |
| Under $25,000 | 178 (100.0%) | 0 (0.0%) |
| $25,000 to $49,999 | 1,486 (87.9%) | 204 (12.1%) |
| $50,000 to $74,999 | 1,191 (83.3%) | 239 (16.7%) |
| $75,000 to $99,999 | 1,630 (96.7%) | 56 (3.3%) |
| $100,000 and over | 6,941 (98.5%) | 103 (1.5%) |
Public vs Private Health Insurance Coverage by Age in Celebration
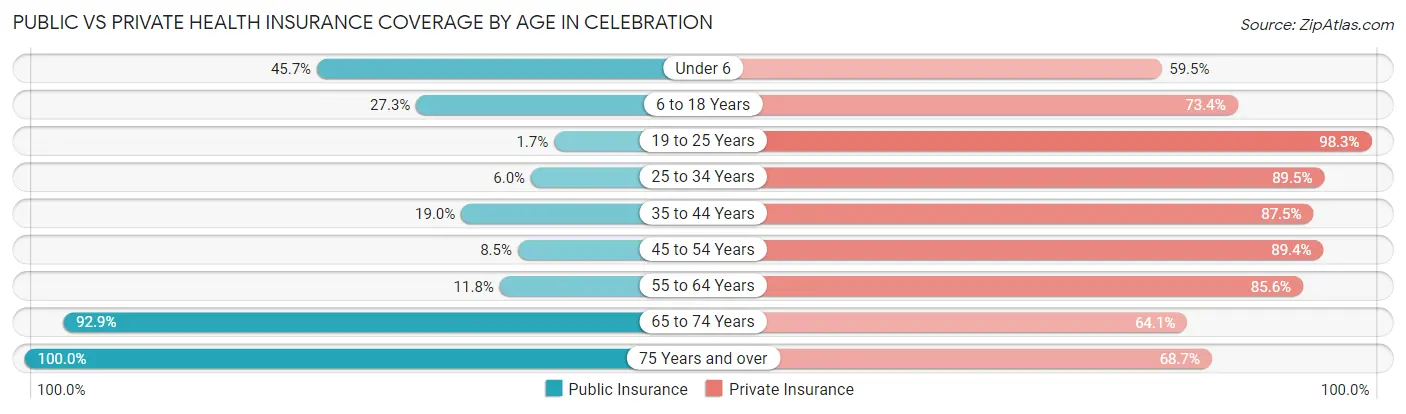
| Age Bracket | Public Insurance | Private Insurance |
| Under 6 | 429 (45.7%) | 558 (59.5%) |
| 6 to 18 Years | 714 (27.3%) | 1,919 (73.4%) |
| 19 to 25 Years | 13 (1.7%) | 744 (98.3%) |
| 25 to 34 Years | 76 (6.0%) | 1,130 (89.5%) |
| 35 to 44 Years | 269 (19.0%) | 1,240 (87.5%) |
| 45 to 54 Years | 110 (8.5%) | 1,163 (89.4%) |
| 55 to 64 Years | 177 (11.8%) | 1,282 (85.6%) |
| 65 to 74 Years | 1,273 (92.8%) | 879 (64.1%) |
| 75 Years and over | 871 (100.0%) | 598 (68.7%) |
| Total | 3,932 (32.7%) | 9,513 (79.1%) |
Disability Status by Sex by Age in Celebration
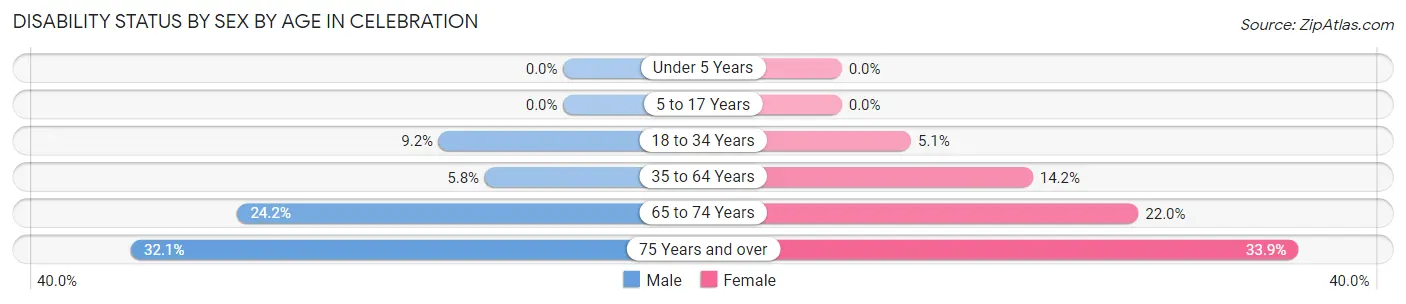
| Age Bracket | Male | Female |
| Under 5 Years | 0 (0.0%) | 0 (0.0%) |
| 5 to 17 Years | 0 (0.0%) | 0 (0.0%) |
| 18 to 34 Years | 85 (9.2%) | 64 (5.1%) |
| 35 to 64 Years | 119 (5.8%) | 308 (14.2%) |
| 65 to 74 Years | 157 (24.2%) | 159 (22.0%) |
| 75 Years and over | 163 (32.1%) | 123 (33.9%) |
Disability Class by Sex by Age in Celebration
Disability Class: Hearing Difficulty
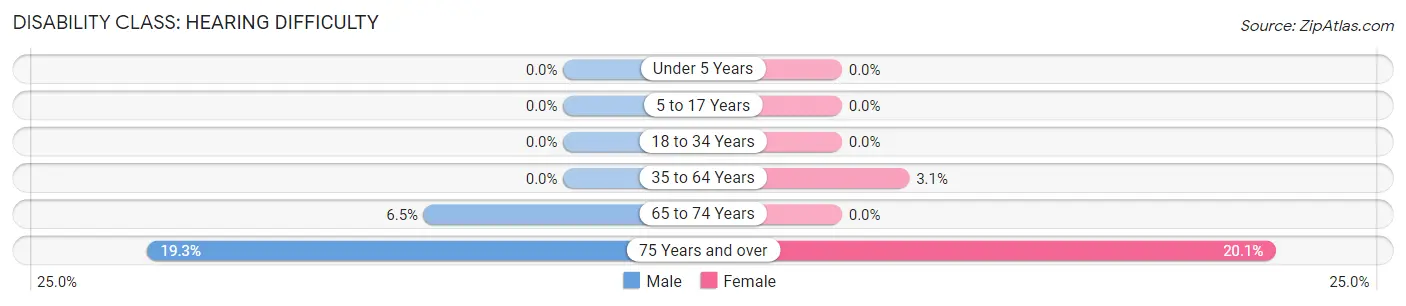
| Age Bracket | Male | Female |
| Under 5 Years | 0 (0.0%) | 0 (0.0%) |
| 5 to 17 Years | 0 (0.0%) | 0 (0.0%) |
| 18 to 34 Years | 0 (0.0%) | 0 (0.0%) |
| 35 to 64 Years | 0 (0.0%) | 68 (3.1%) |
| 65 to 74 Years | 42 (6.5%) | 0 (0.0%) |
| 75 Years and over | 98 (19.3%) | 73 (20.1%) |
Disability Class: Vision Difficulty
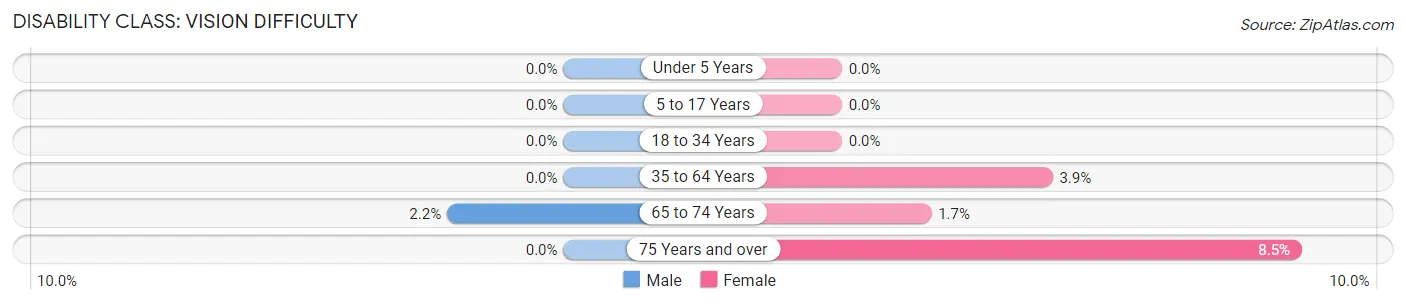
| Age Bracket | Male | Female |
| Under 5 Years | 0 (0.0%) | 0 (0.0%) |
| 5 to 17 Years | 0 (0.0%) | 0 (0.0%) |
| 18 to 34 Years | 0 (0.0%) | 0 (0.0%) |
| 35 to 64 Years | 0 (0.0%) | 85 (3.9%) |
| 65 to 74 Years | 14 (2.2%) | 12 (1.7%) |
| 75 Years and over | 0 (0.0%) | 31 (8.5%) |
Disability Class: Cognitive Difficulty
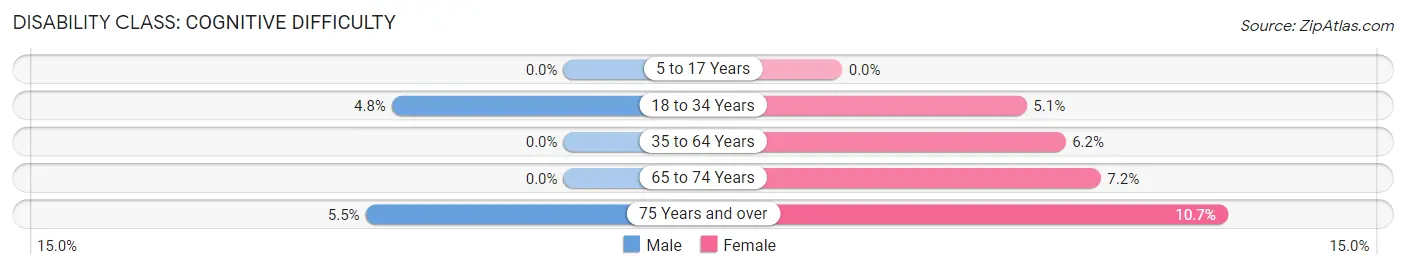
| Age Bracket | Male | Female |
| 5 to 17 Years | 0 (0.0%) | 0 (0.0%) |
| 18 to 34 Years | 44 (4.8%) | 64 (5.1%) |
| 35 to 64 Years | 0 (0.0%) | 135 (6.2%) |
| 65 to 74 Years | 0 (0.0%) | 52 (7.2%) |
| 75 Years and over | 28 (5.5%) | 39 (10.7%) |
Disability Class: Ambulatory Difficulty
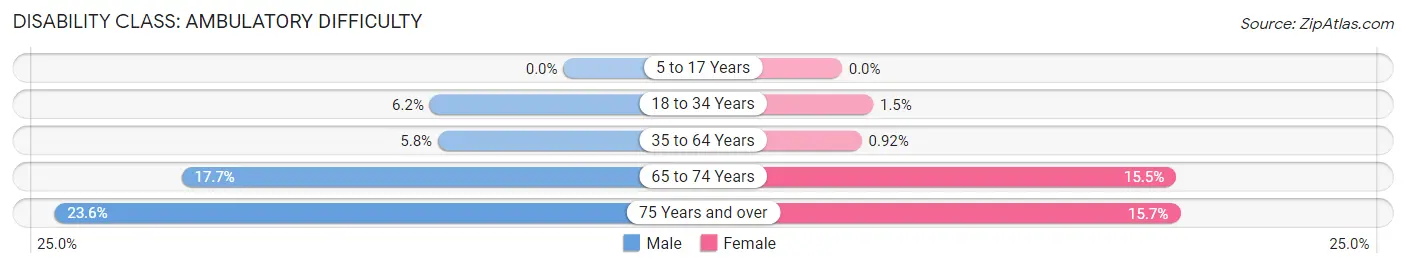
| Age Bracket | Male | Female |
| 5 to 17 Years | 0 (0.0%) | 0 (0.0%) |
| 18 to 34 Years | 57 (6.2%) | 18 (1.5%) |
| 35 to 64 Years | 119 (5.8%) | 20 (0.9%) |
| 65 to 74 Years | 115 (17.7%) | 112 (15.5%) |
| 75 Years and over | 120 (23.6%) | 57 (15.7%) |
Disability Class: Self-Care Difficulty
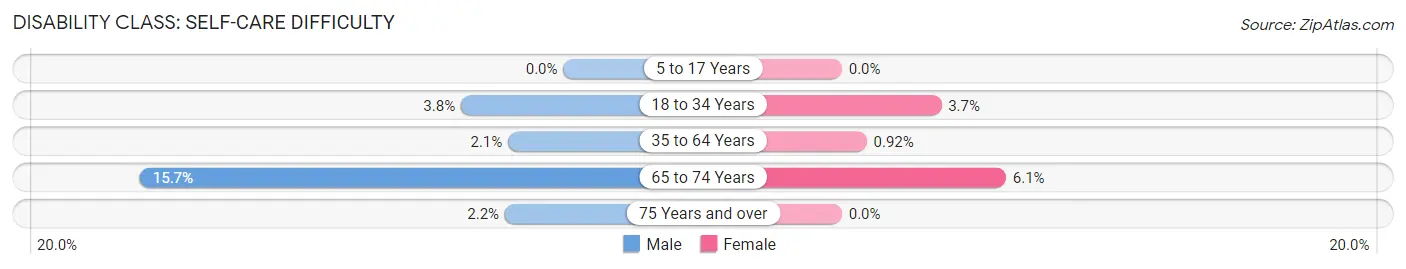
| Age Bracket | Male | Female |
| 5 to 17 Years | 0 (0.0%) | 0 (0.0%) |
| 18 to 34 Years | 35 (3.8%) | 46 (3.7%) |
| 35 to 64 Years | 42 (2.1%) | 20 (0.9%) |
| 65 to 74 Years | 102 (15.7%) | 44 (6.1%) |
| 75 Years and over | 11 (2.2%) | 0 (0.0%) |
Technology Access in Celebration
Computing Device Access in Celebration
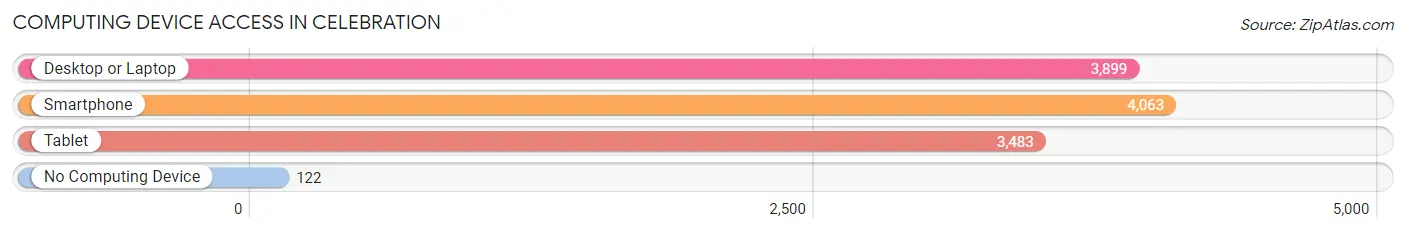
| Device Type | # Households | % Households |
| Desktop or Laptop | 3,899 | 90.5% |
| Smartphone | 4,063 | 94.3% |
| Tablet | 3,483 | 80.9% |
| No Computing Device | 122 | 2.8% |
| Total | 4,307 | 100.0% |
Internet Access in Celebration
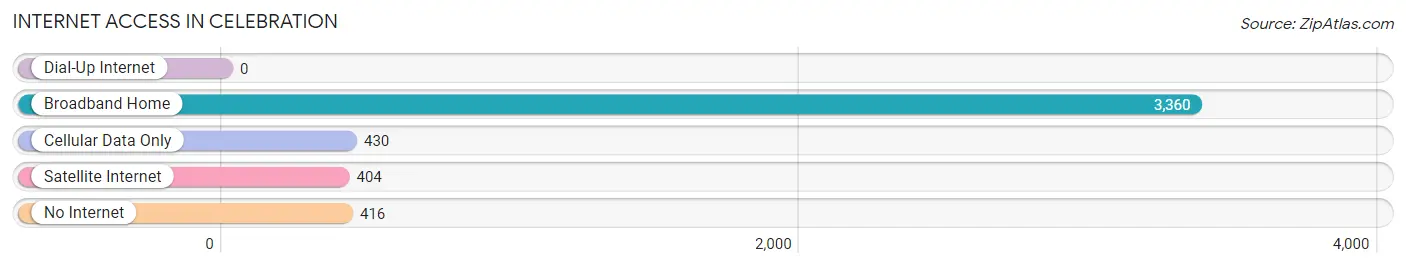
| Internet Type | # Households | % Households |
| Dial-Up Internet | 0 | 0.0% |
| Broadband Home | 3,360 | 78.0% |
| Cellular Data Only | 430 | 10.0% |
| Satellite Internet | 404 | 9.4% |
| No Internet | 416 | 9.7% |
| Total | 4,307 | 100.0% |
Celebration Summary
Celebration, Florida is a census-designated place located in Osceola County, Florida, United States. It is part of the Orlando–Kissimmee–Sanford Metropolitan Statistical Area. The town was developed by The Walt Disney Company in the 1990s and is located near Walt Disney World Resort. As of the 2010 census, the population of Celebration was 7,427.
History
Celebration was developed by The Walt Disney Company in the 1990s. The town was designed to be a traditional American town, with a town center, a school, a post office, and a variety of housing styles. The town was designed to be a self-contained community, with all the amenities of a larger city.
The town was named after the celebration of the opening of the nearby Walt Disney World Resort in 1971. The town was designed to be a model community, with a focus on environmental sustainability and community involvement.
Geography
Celebration is located in Osceola County, Florida, at 28.3°N 81.5°W. It is located in the Orlando–Kissimmee–Sanford Metropolitan Statistical Area. The town is located near Walt Disney World Resort, and is approximately 20 miles south of downtown Orlando.
The town has a total area of 4.2 square miles, of which 4.1 square miles is land and 0.1 square miles is water.
Economy
Celebration is a planned community, and the economy is largely based on tourism. The town is home to a variety of businesses, including restaurants, retail stores, and professional services. The town is also home to a number of corporate offices, including those of The Walt Disney Company.
Demographics
As of the 2010 census, the population of Celebration was 7,427. The racial makeup of the town was 79.2% White, 11.2% African American, 0.3% Native American, 4.2% Asian, 0.1% Pacific Islander, 2.3% from other races, and 2.7% from two or more races. Hispanic or Latino of any race were 8.7% of the population.
The median income for a household in the town was $76,843, and the median income for a family was $90,917. The per capita income for the town was $37,945. About 4.2% of families and 5.3% of the population were below the poverty line, including 6.2% of those under age 18 and 4.2% of those age 65 or over.
Common Questions
What is the Total Population of Celebration?
Total Population of Celebration is 12,030.
What is the Total Male Population of Celebration?
Total Male Population of Celebration is 5,787.
What is the Total Female Population of Celebration?
Total Female Population of Celebration is 6,243.
What is the Ratio of Males per 100 Females in Celebration?
There are 92.70 Males per 100 Females in Celebration.
What is the Ratio of Females per 100 Males in Celebration?
There are 107.88 Females per 100 Males in Celebration.
What is the Median Population Age in Celebration?
Median Population Age in Celebration is 39.7 Years.
What is the Average Family Size in Celebration
Average Family Size in Celebration is 3.3 People.
What is the Average Household Size in Celebration
Average Household Size in Celebration is 2.8 People.
What is Per Capita Income in Celebration?
Per Capita income in Celebration is $58,564.
What is the Median Family Income in Celebration?
Median Family Income in Celebration is $130,787.
What is the Median Household income in Celebration?
Median Household Income in Celebration is $99,642.
What is Income or Wage Gap in Celebration?
Income or Wage Gap in Celebration is 37.4%.
Women in Celebration earn 62.6 cents for every dollar earned by a man.
What is Inequality or Gini Index in Celebration?
Inequality or Gini Index in Celebration is 0.48.
How Large is the Labor Force in Celebration?
There are 5,468 People in the Labor Forcein in Celebration.
What is the Percentage of People in the Labor Force in Celebration?
61.6% of People are in the Labor Force in Celebration.
What is the Unemployment Rate in Celebration?
Unemployment Rate in Celebration is 4.2%.