Hillsboro Beach, FL
Hillsboro Beach Map
Hillsboro Beach Overview
2,225
TOTAL POPULATION
971
MALE POPULATION
1,254
FEMALE POPULATION
77.43
MALES / 100 FEMALES
129.15
FEMALES / 100 MALES
65.9
MEDIAN AGE
2.3
AVG FAMILY SIZE
1.8
AVG HOUSEHOLD SIZE
$92,875
PER CAPITA INCOME
$109,750
AVG FAMILY INCOME
$86,250
AVG HOUSEHOLD INCOME
56.8%
WAGE / INCOME GAP [ % ]
43.2¢/ $1
WAGE / INCOME GAP [ $ ]
0.59
INEQUALITY / GINI INDEX
851
LABOR FORCE [ PEOPLE ]
40.0%
PERCENT IN LABOR FORCE
6.3%
UNEMPLOYMENT RATE
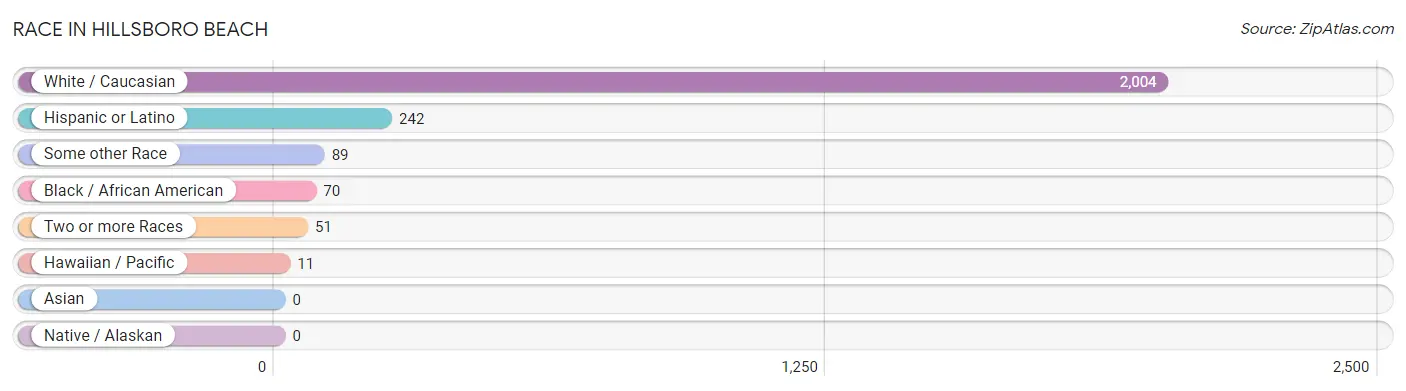
Race in Hillsboro Beach
The most populous races in Hillsboro Beach are White / Caucasian (2,004 | 90.1%), Hispanic or Latino (242 | 10.9%), and Some other Race (89 | 4.0%).
| Race | # Population | % Population |
| Asian | 0 | 0.0% |
| Black / African American | 70 | 3.2% |
| Hawaiian / Pacific | 11 | 0.5% |
| Hispanic or Latino | 242 | 10.9% |
| Native / Alaskan | 0 | 0.0% |
| White / Caucasian | 2,004 | 90.1% |
| Two or more Races | 51 | 2.3% |
| Some other Race | 89 | 4.0% |
| Total | 2,225 | 100.0% |
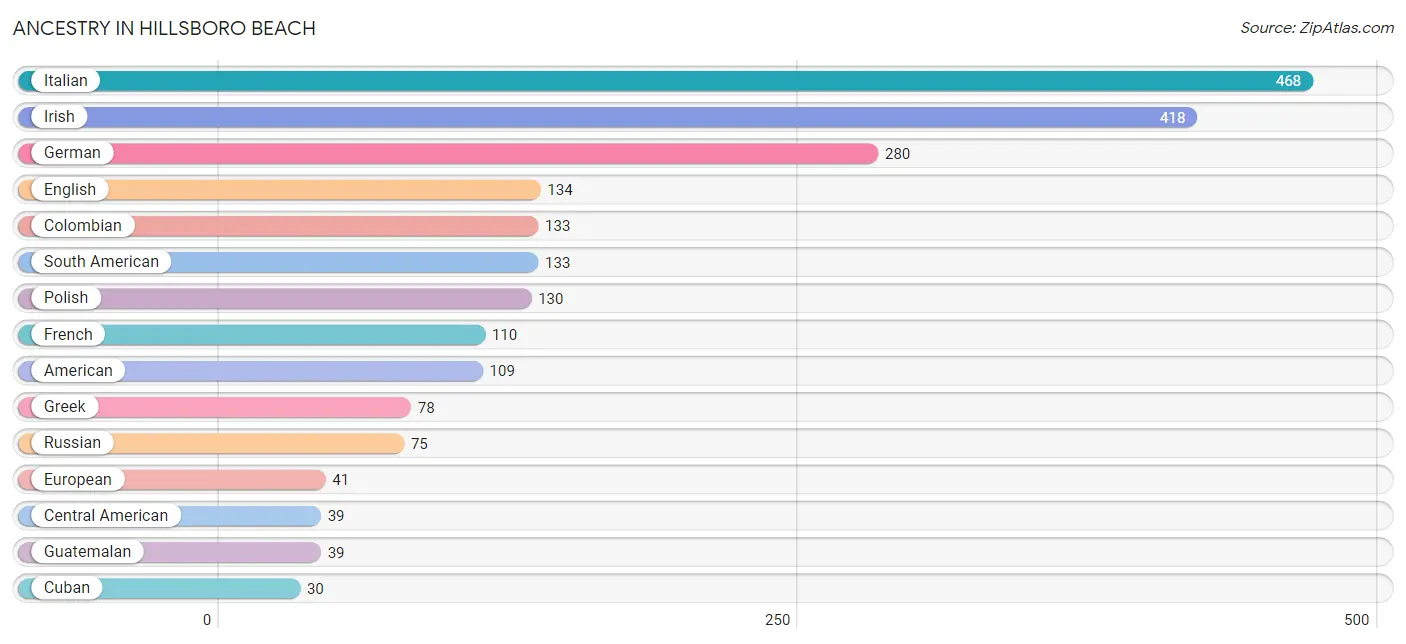
Ancestry in Hillsboro Beach
The most populous ancestries reported in Hillsboro Beach are Italian (468 | 21.0%), Irish (418 | 18.8%), German (280 | 12.6%), English (134 | 6.0%), and Colombian (133 | 6.0%), together accounting for 64.4% of all Hillsboro Beach residents.
| Ancestry | # Population | % Population |
| American | 109 | 4.9% |
| Arab | 14 | 0.6% |
| Armenian | 5 | 0.2% |
| Austrian | 5 | 0.2% |
| Belgian | 23 | 1.0% |
| Brazilian | 5 | 0.2% |
| British | 9 | 0.4% |
| Bulgarian | 5 | 0.2% |
| Canadian | 6 | 0.3% |
| Central American | 39 | 1.8% |
| Colombian | 133 | 6.0% |
| Cuban | 30 | 1.3% |
| Danish | 6 | 0.3% |
| Dutch | 10 | 0.4% |
| Eastern European | 15 | 0.7% |
| English | 134 | 6.0% |
| European | 41 | 1.8% |
| French | 110 | 4.9% |
| French Canadian | 27 | 1.2% |
| German | 280 | 12.6% |
| Greek | 78 | 3.5% |
| Guatemalan | 39 | 1.8% |
| Hungarian | 5 | 0.2% |
| Iranian | 16 | 0.7% |
| Irish | 418 | 18.8% |
| Italian | 468 | 21.0% |
| Lebanese | 8 | 0.4% |
| Lithuanian | 29 | 1.3% |
| Mexican | 12 | 0.5% |
| Native Hawaiian | 11 | 0.5% |
| Norwegian | 19 | 0.9% |
| Polish | 130 | 5.8% |
| Portuguese | 9 | 0.4% |
| Puerto Rican | 28 | 1.3% |
| Russian | 75 | 3.4% |
| Scandinavian | 6 | 0.3% |
| Scotch-Irish | 29 | 1.3% |
| Scottish | 29 | 1.3% |
| Slovak | 12 | 0.5% |
| South American | 133 | 6.0% |
| Subsaharan African | 6 | 0.3% |
| Swedish | 11 | 0.5% |
| Swiss | 23 | 1.0% |
| Syrian | 6 | 0.3% |
| Turkish | 11 | 0.5% |
| Ukrainian | 20 | 0.9% |
| Welsh | 6 | 0.3% | View All 47 Rows |
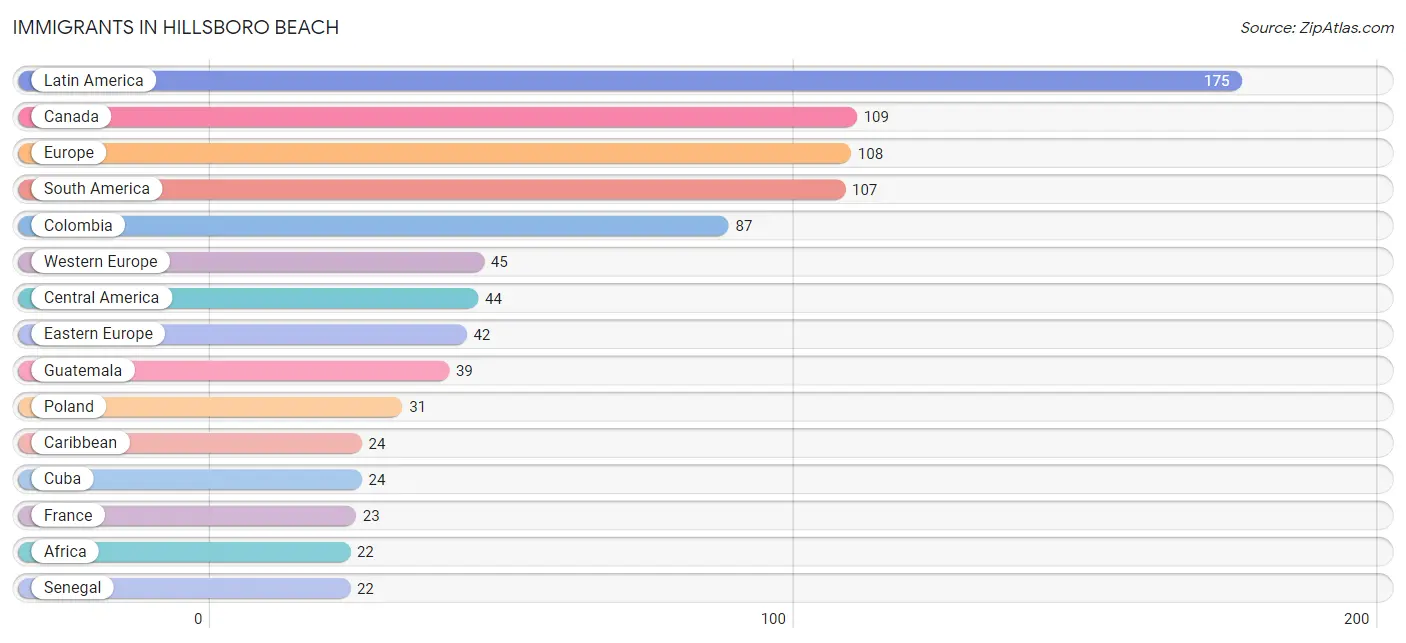
Immigrants in Hillsboro Beach
The most numerous immigrant groups reported in Hillsboro Beach came from Latin America (175 | 7.9%), Canada (109 | 4.9%), Europe (108 | 4.9%), South America (107 | 4.8%), and Colombia (87 | 3.9%), together accounting for 26.3% of all Hillsboro Beach residents.
| Immigration Origin | # Population | % Population |
| Africa | 22 | 1.0% |
| Austria | 5 | 0.2% |
| Brazil | 5 | 0.2% |
| Canada | 109 | 4.9% |
| Caribbean | 24 | 1.1% |
| Central America | 44 | 2.0% |
| Colombia | 87 | 3.9% |
| Cuba | 24 | 1.1% |
| Eastern Europe | 42 | 1.9% |
| Europe | 108 | 4.9% |
| France | 23 | 1.0% |
| Germany | 5 | 0.2% |
| Guatemala | 39 | 1.8% |
| Italy | 12 | 0.5% |
| Latin America | 175 | 7.9% |
| Mexico | 5 | 0.2% |
| Netherlands | 12 | 0.5% |
| Northern Europe | 9 | 0.4% |
| Poland | 31 | 1.4% |
| Russia | 5 | 0.2% |
| Senegal | 22 | 1.0% |
| South America | 107 | 4.8% |
| Southern Europe | 12 | 0.5% |
| Ukraine | 6 | 0.3% |
| Venezuela | 15 | 0.7% |
| Western Africa | 22 | 1.0% |
| Western Europe | 45 | 2.0% | View All 27 Rows |
Sex and Age in Hillsboro Beach
Sex and Age in Hillsboro Beach
The most populous age groups in Hillsboro Beach are 60 to 64 Years (193 | 19.9%) for men and 70 to 74 Years (241 | 19.2%) for women.
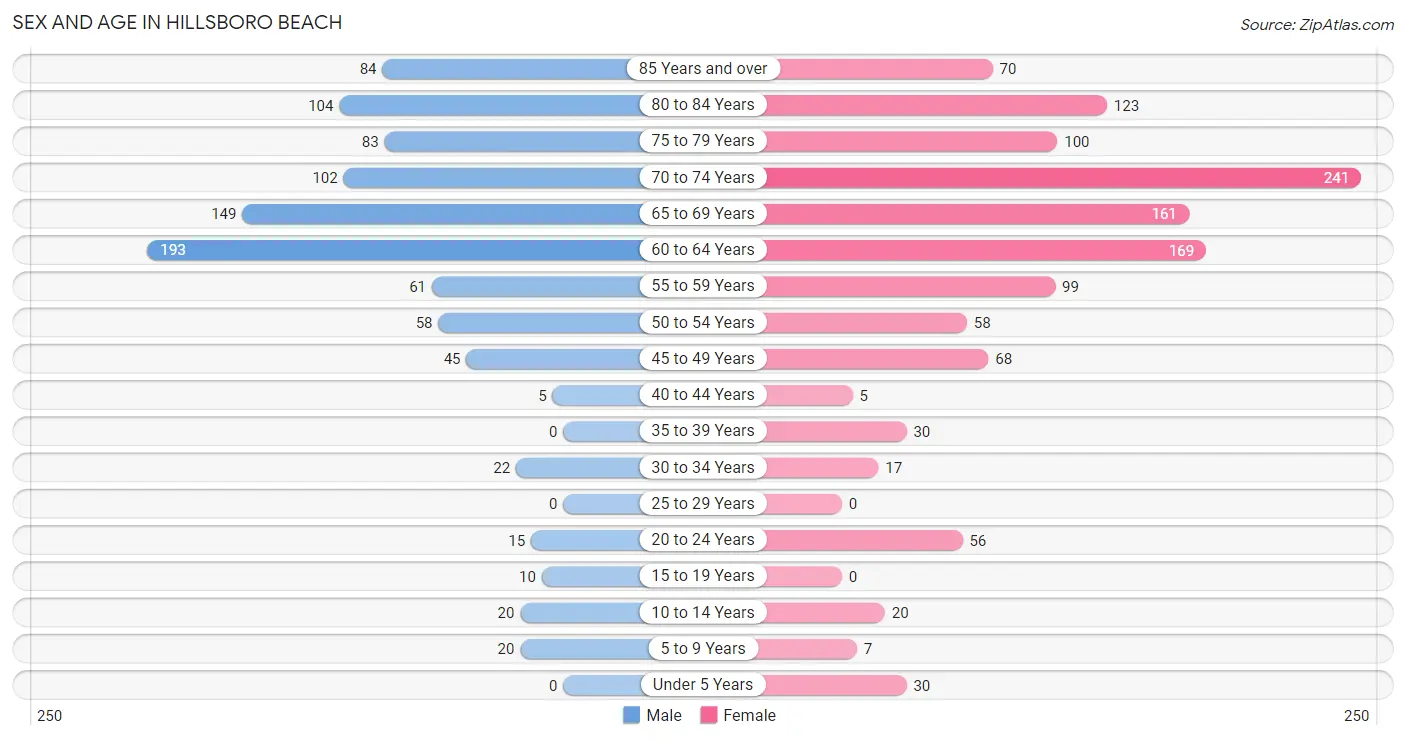
| Age Bracket | Male | Female |
| Under 5 Years | 0 (0.0%) | 30 (2.4%) |
| 5 to 9 Years | 20 (2.1%) | 7 (0.6%) |
| 10 to 14 Years | 20 (2.1%) | 20 (1.6%) |
| 15 to 19 Years | 10 (1.0%) | 0 (0.0%) |
| 20 to 24 Years | 15 (1.5%) | 56 (4.5%) |
| 25 to 29 Years | 0 (0.0%) | 0 (0.0%) |
| 30 to 34 Years | 22 (2.3%) | 17 (1.4%) |
| 35 to 39 Years | 0 (0.0%) | 30 (2.4%) |
| 40 to 44 Years | 5 (0.5%) | 5 (0.4%) |
| 45 to 49 Years | 45 (4.6%) | 68 (5.4%) |
| 50 to 54 Years | 58 (6.0%) | 58 (4.6%) |
| 55 to 59 Years | 61 (6.3%) | 99 (7.9%) |
| 60 to 64 Years | 193 (19.9%) | 169 (13.5%) |
| 65 to 69 Years | 149 (15.3%) | 161 (12.8%) |
| 70 to 74 Years | 102 (10.5%) | 241 (19.2%) |
| 75 to 79 Years | 83 (8.6%) | 100 (8.0%) |
| 80 to 84 Years | 104 (10.7%) | 123 (9.8%) |
| 85 Years and over | 84 (8.6%) | 70 (5.6%) |
| Total | 971 (100.0%) | 1,254 (100.0%) |
Families and Households in Hillsboro Beach
Median Family Size in Hillsboro Beach
The median family size in Hillsboro Beach is 2.32 persons per family, with single female/mother families (43 | 6.7%) accounting for the largest median family size of 2.49 persons per family. On the other hand, single male/father families (32 | 5.0%) represent the smallest median family size with 2.25 persons per family.
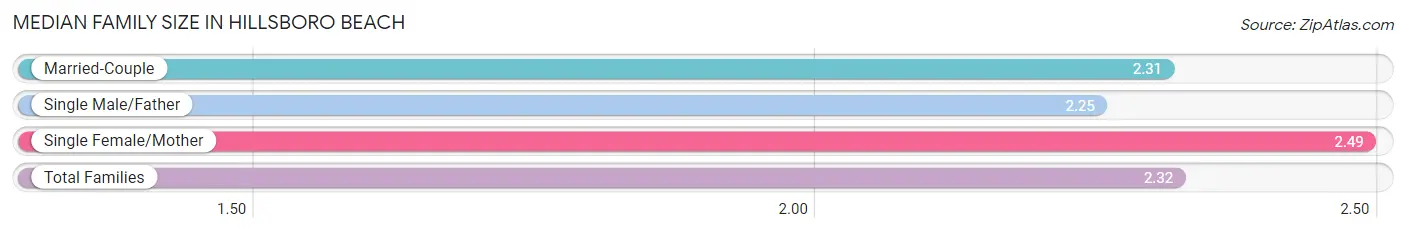
| Family Type | # Families | Family Size |
| Married-Couple | 571 (88.4%) | 2.31 |
| Single Male/Father | 32 (5.0%) | 2.25 |
| Single Female/Mother | 43 (6.7%) | 2.49 |
| Total Families | 646 (100.0%) | 2.32 |
Median Household Size in Hillsboro Beach
The median household size in Hillsboro Beach is 1.75 persons per household, with single female/mother households (43 | 3.4%) accounting for the largest median household size of 2.49 persons per household. non-family households (627 | 49.2%) represent the smallest median household size with 1.14 persons per household.
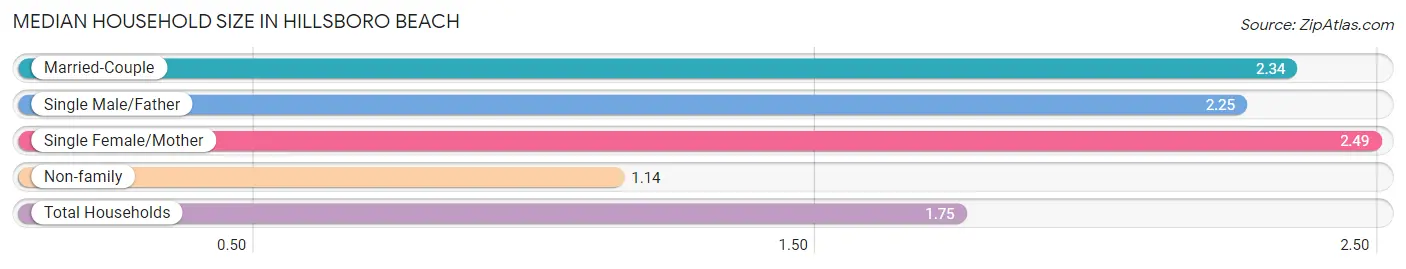
| Household Type | # Households | Household Size |
| Married-Couple | 571 (44.9%) | 2.34 |
| Single Male/Father | 32 (2.5%) | 2.25 |
| Single Female/Mother | 43 (3.4%) | 2.49 |
| Non-family | 627 (49.2%) | 1.14 |
| Total Households | 1,273 (100.0%) | 1.75 |
Household Size by Marriage Status in Hillsboro Beach
Out of a total of 1,273 households in Hillsboro Beach, 646 (50.7%) are family households, while 627 (49.2%) are nonfamily households. The most numerous type of family households are 2-person households, comprising 550, and the most common type of nonfamily households are 1-person households, comprising 550.
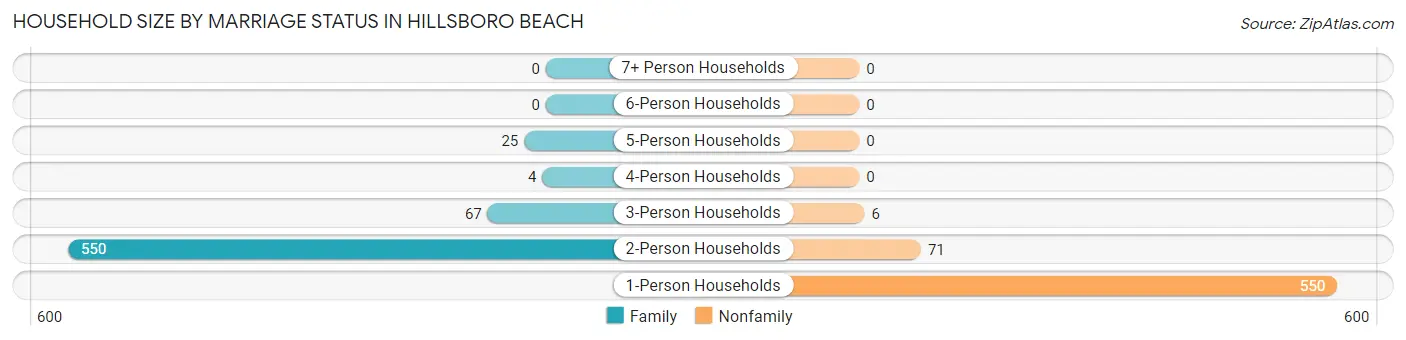
| Household Size | Family Households | Nonfamily Households |
| 1-Person Households | - | 550 (43.2%) |
| 2-Person Households | 550 (43.2%) | 71 (5.6%) |
| 3-Person Households | 67 (5.3%) | 6 (0.5%) |
| 4-Person Households | 4 (0.3%) | 0 (0.0%) |
| 5-Person Households | 25 (2.0%) | 0 (0.0%) |
| 6-Person Households | 0 (0.0%) | 0 (0.0%) |
| 7+ Person Households | 0 (0.0%) | 0 (0.0%) |
| Total | 646 (50.7%) | 627 (49.2%) |
Female Fertility in Hillsboro Beach
Fertility by Age in Hillsboro Beach
| Age Bracket | Women with Births | Births / 1,000 Women |
| 15 to 19 years | 0 (0.0%) | 0.0 |
| 20 to 34 years | 0 (0.0%) | 0.0 |
| 35 to 50 years | 0 (0.0%) | 0.0 |
| Total | 0 (0.0%) | 0.0 |
Fertility by Age by Marriage Status in Hillsboro Beach
| Age Bracket | Married | Unmarried |
| 15 to 19 years | 0 (0.0%) | 0 (0.0%) |
| 20 to 34 years | 0 (0.0%) | 0 (0.0%) |
| 35 to 50 years | 0 (0.0%) | 0 (0.0%) |
| Total | 0 (0.0%) | 0 (0.0%) |
Fertility by Education in Hillsboro Beach
| Educational Attainment | Women with Births | Births / 1,000 Women |
| Less than High School | 0 (0.0%) | 0.0 |
| High School Diploma | 0 (0.0%) | 0.0 |
| College or Associate's Degree | 0 (0.0%) | 0.0 |
| Bachelor's Degree | 0 (0.0%) | 0.0 |
| Graduate Degree | 0 (0.0%) | 0.0 |
| Total | 0 (0.0%) | 0.0 |
Fertility by Education by Marriage Status in Hillsboro Beach
| Educational Attainment | Married | Unmarried |
| Less than High School | 0 (0.0%) | 0 (0.0%) |
| High School Diploma | 0 (0.0%) | 0 (0.0%) |
| College or Associate's Degree | 0 (0.0%) | 0 (0.0%) |
| Bachelor's Degree | 0 (0.0%) | 0 (0.0%) |
| Graduate Degree | 0 (0.0%) | 0 (0.0%) |
| Total | 0 (0.0%) | 0 (0.0%) |
Income in Hillsboro Beach
Income Overview in Hillsboro Beach
Per Capita Income in Hillsboro Beach is $92,875, while median incomes of families and households are $109,750 and $86,250 respectively.
| Characteristic | Number | Measure |
| Per Capita Income | 2,225 | $92,875 |
| Median Family Income | 646 | $109,750 |
| Mean Family Income | 646 | $215,059 |
| Median Household Income | 1,273 | $86,250 |
| Mean Household Income | 1,273 | $158,092 |
| Income Deficit | 646 | $0 |
| Wage / Income Gap (%) | 2,225 | 56.80% |
| Wage / Income Gap ($) | 2,225 | 43.20¢ per $1 |
| Gini / Inequality Index | 2,225 | 0.59 |
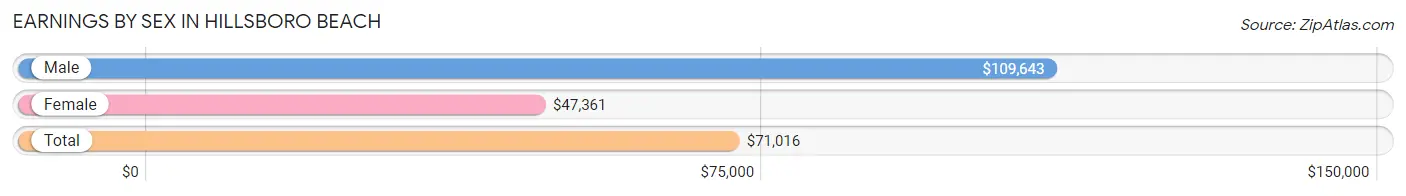
Earnings by Sex in Hillsboro Beach
Average Earnings in Hillsboro Beach are $71,016, $109,643 for men and $47,361 for women, a difference of 56.8%.
| Sex | Number | Average Earnings |
| Male | 424 (48.0%) | $109,643 |
| Female | 459 (52.0%) | $47,361 |
| Total | 883 (100.0%) | $71,016 |
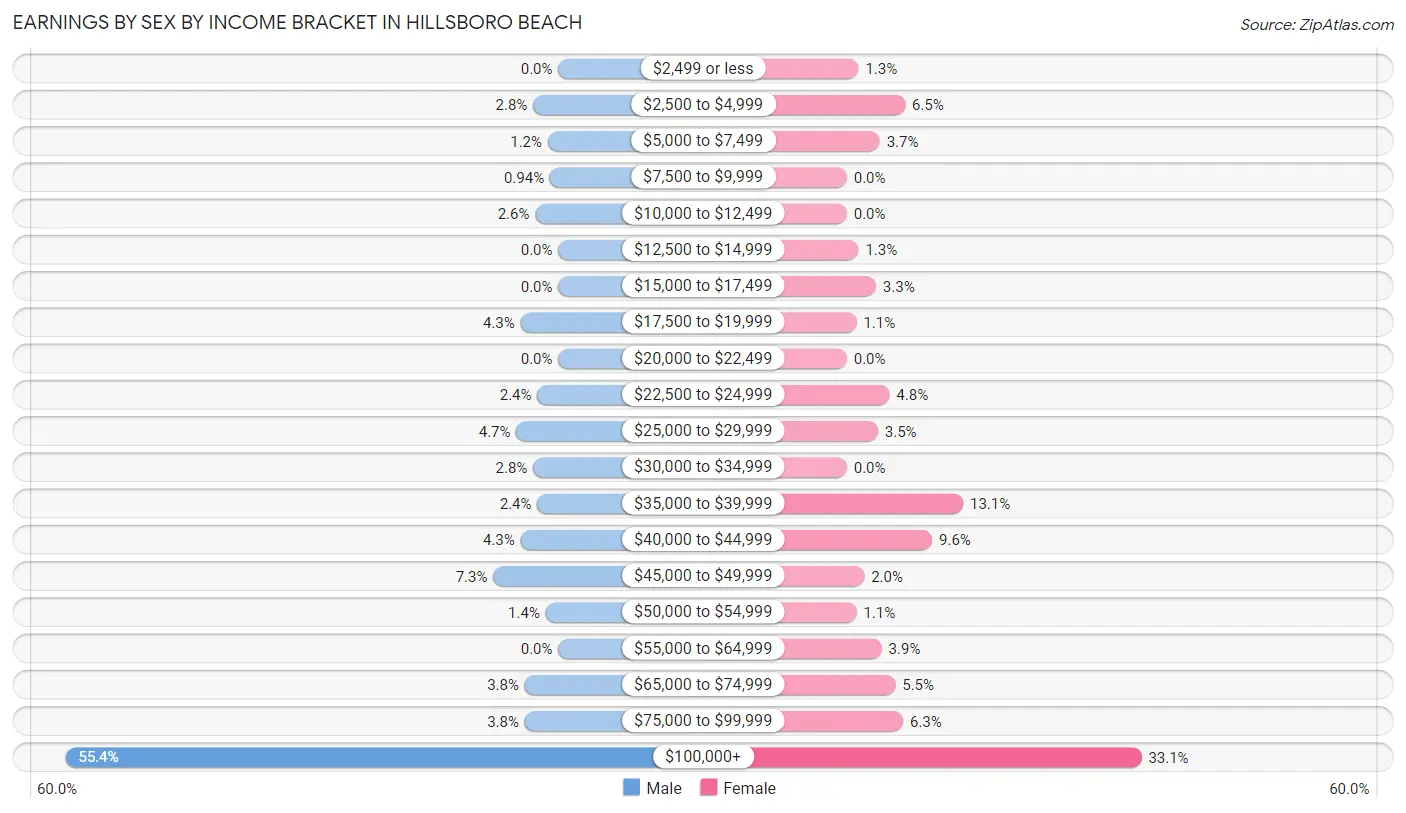
Earnings by Sex by Income Bracket in Hillsboro Beach
The most common earnings brackets in Hillsboro Beach are $100,000+ for men (235 | 55.4%) and $100,000+ for women (152 | 33.1%).
| Income | Male | Female |
| $2,499 or less | 0 (0.0%) | 6 (1.3%) |
| $2,500 to $4,999 | 12 (2.8%) | 30 (6.5%) |
| $5,000 to $7,499 | 5 (1.2%) | 17 (3.7%) |
| $7,500 to $9,999 | 4 (0.9%) | 0 (0.0%) |
| $10,000 to $12,499 | 11 (2.6%) | 0 (0.0%) |
| $12,500 to $14,999 | 0 (0.0%) | 6 (1.3%) |
| $15,000 to $17,499 | 0 (0.0%) | 15 (3.3%) |
| $17,500 to $19,999 | 18 (4.3%) | 5 (1.1%) |
| $20,000 to $22,499 | 0 (0.0%) | 0 (0.0%) |
| $22,500 to $24,999 | 10 (2.4%) | 22 (4.8%) |
| $25,000 to $29,999 | 20 (4.7%) | 16 (3.5%) |
| $30,000 to $34,999 | 12 (2.8%) | 0 (0.0%) |
| $35,000 to $39,999 | 10 (2.4%) | 60 (13.1%) |
| $40,000 to $44,999 | 18 (4.3%) | 44 (9.6%) |
| $45,000 to $49,999 | 31 (7.3%) | 9 (2.0%) |
| $50,000 to $54,999 | 6 (1.4%) | 5 (1.1%) |
| $55,000 to $64,999 | 0 (0.0%) | 18 (3.9%) |
| $65,000 to $74,999 | 16 (3.8%) | 25 (5.4%) |
| $75,000 to $99,999 | 16 (3.8%) | 29 (6.3%) |
| $100,000+ | 235 (55.4%) | 152 (33.1%) |
| Total | 424 (100.0%) | 459 (100.0%) |
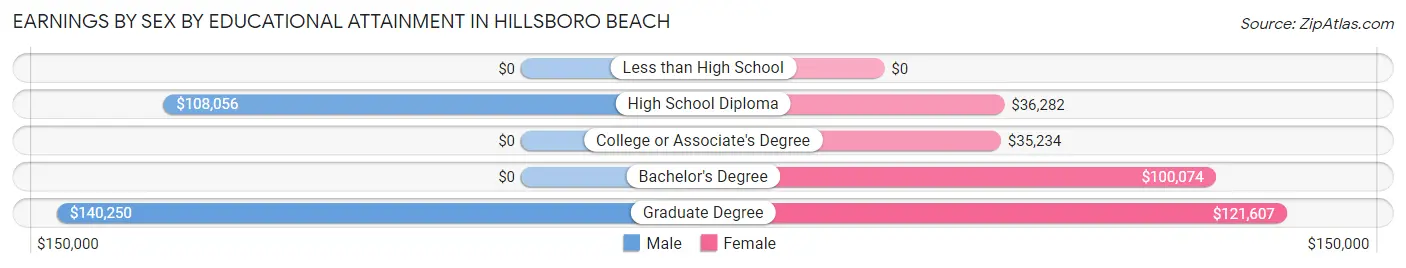
Earnings by Sex by Educational Attainment in Hillsboro Beach
Average earnings in Hillsboro Beach are $112,656 for men and $65,375 for women, a difference of 42.0%. Men with an educational attainment of graduate degree enjoy the highest average annual earnings of $140,250, while those with high school diploma education earn the least with $108,056. Women with an educational attainment of graduate degree earn the most with the average annual earnings of $121,607, while those with college or associate's degree education have the smallest earnings of $35,234.
| Educational Attainment | Male Income | Female Income |
| Less than High School | - | - |
| High School Diploma | $108,056 | $36,282 |
| College or Associate's Degree | - | - |
| Bachelor's Degree | - | - |
| Graduate Degree | $140,250 | $121,607 |
| Total | $112,656 | $65,375 |
Family Income in Hillsboro Beach
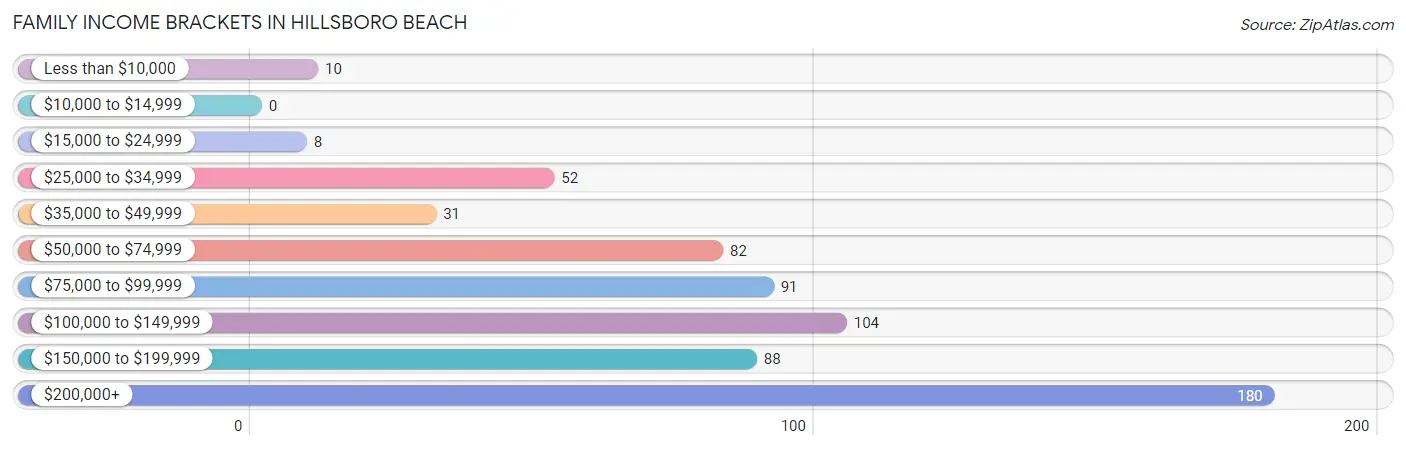
Family Income Brackets in Hillsboro Beach
According to the Hillsboro Beach family income data, there are 180 families falling into the $200,000+ income range, which is the most common income bracket and makes up 27.9% of all families.
| Income Bracket | # Families | % Families |
| Less than $10,000 | 10 | 1.5% |
| $10,000 to $14,999 | 0 | 0.0% |
| $15,000 to $24,999 | 8 | 1.2% |
| $25,000 to $34,999 | 52 | 8.0% |
| $35,000 to $49,999 | 31 | 4.8% |
| $50,000 to $74,999 | 82 | 12.7% |
| $75,000 to $99,999 | 91 | 14.1% |
| $100,000 to $149,999 | 104 | 16.1% |
| $150,000 to $199,999 | 88 | 13.6% |
| $200,000+ | 180 | 27.9% |
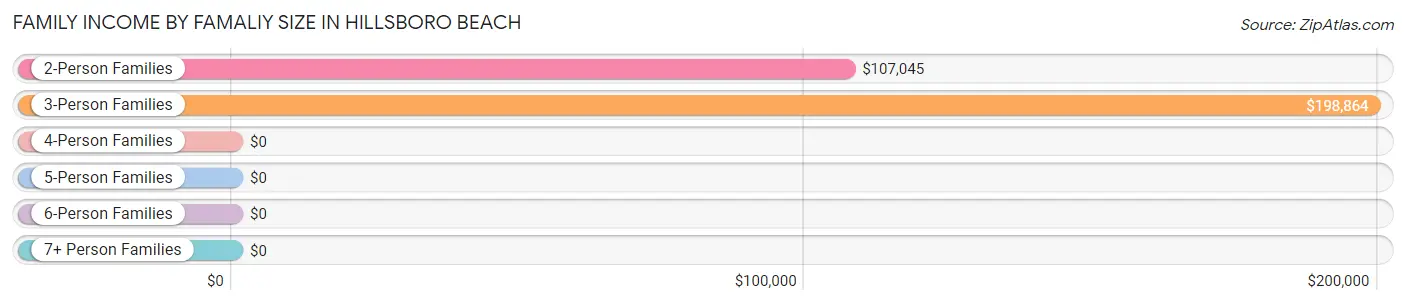
Family Income by Famaliy Size in Hillsboro Beach
3-person families (72 | 11.2%) account for the highest median family income in Hillsboro Beach with $198,864 per family, while 3-person families (72 | 11.2%) have the highest median income of $66,288 per family member.
| Income Bracket | # Families | Median Income |
| 2-Person Families | 550 (85.1%) | $107,045 |
| 3-Person Families | 72 (11.2%) | $198,864 |
| 4-Person Families | 4 (0.6%) | $0 |
| 5-Person Families | 20 (3.1%) | $0 |
| 6-Person Families | 0 (0.0%) | $0 |
| 7+ Person Families | 0 (0.0%) | $0 |
| Total | 646 (100.0%) | $109,750 |
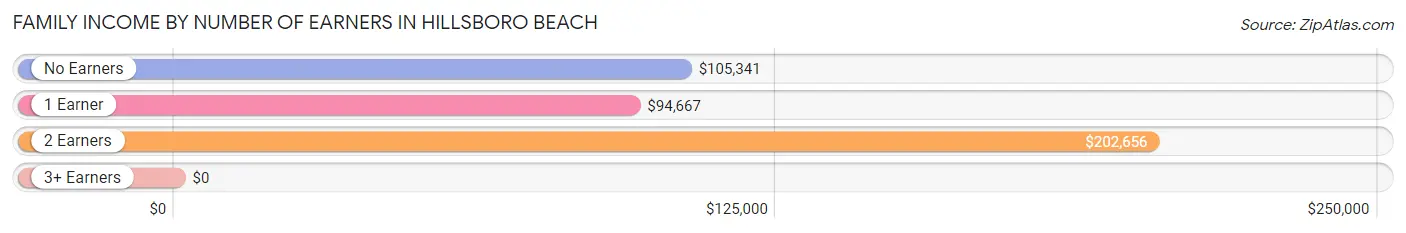
Family Income by Number of Earners in Hillsboro Beach
| Number of Earners | # Families | Median Income |
| No Earners | 275 (42.6%) | $105,341 |
| 1 Earner | 162 (25.1%) | $94,667 |
| 2 Earners | 194 (30.0%) | $202,656 |
| 3+ Earners | 15 (2.3%) | $0 |
| Total | 646 (100.0%) | $109,750 |
Household Income in Hillsboro Beach
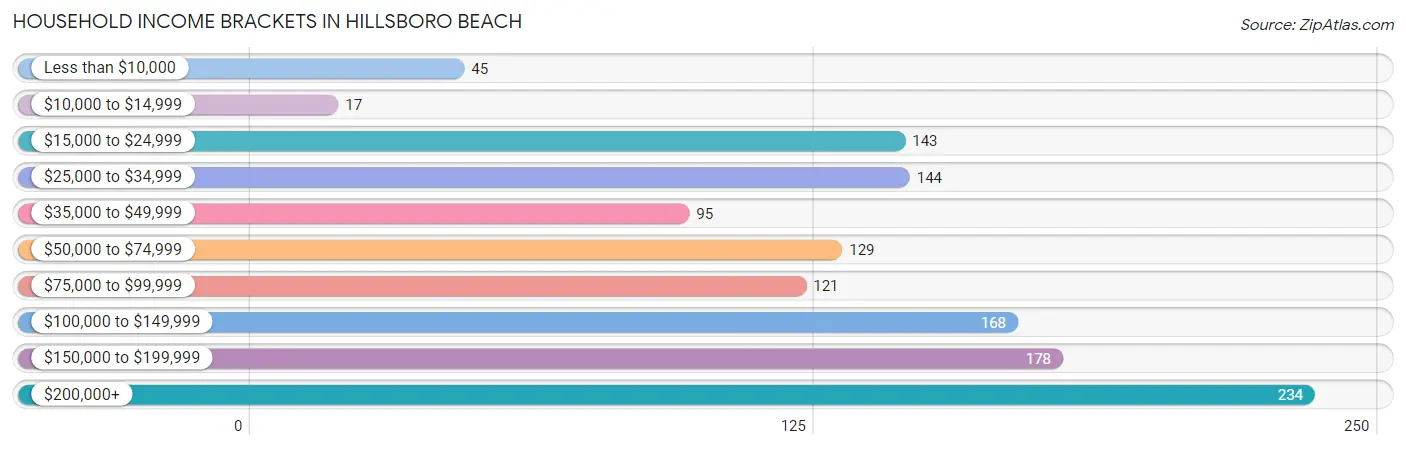
Household Income Brackets in Hillsboro Beach
With 234 households falling in the category, the $200,000+ income range is the most frequent in Hillsboro Beach, accounting for 18.4% of all households. In contrast, only 17 households (1.3%) fall into the $10,000 to $14,999 income bracket, making it the least populous group.
| Income Bracket | # Households | % Households |
| Less than $10,000 | 45 | 3.5% |
| $10,000 to $14,999 | 17 | 1.3% |
| $15,000 to $24,999 | 143 | 11.2% |
| $25,000 to $34,999 | 144 | 11.3% |
| $35,000 to $49,999 | 95 | 7.5% |
| $50,000 to $74,999 | 129 | 10.1% |
| $75,000 to $99,999 | 121 | 9.5% |
| $100,000 to $149,999 | 168 | 13.2% |
| $150,000 to $199,999 | 178 | 14.0% |
| $200,000+ | 234 | 18.4% |
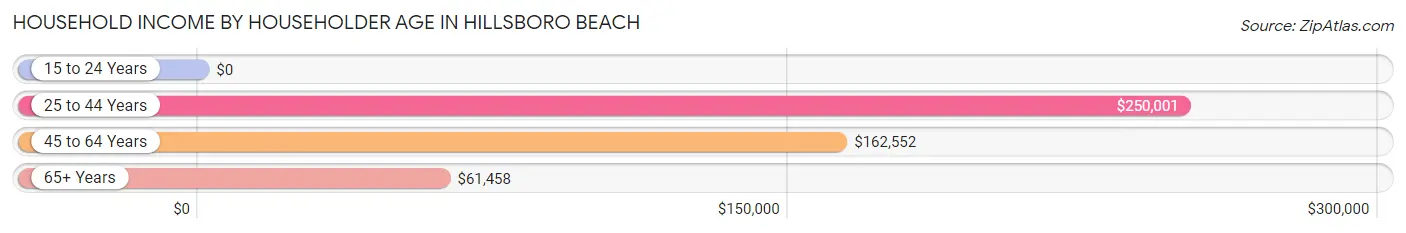
Household Income by Householder Age in Hillsboro Beach
The median household income in Hillsboro Beach is $86,250, with the highest median household income of $250,001 found in the 25 to 44 years age bracket for the primary householder. A total of 16 households (1.3%) fall into this category. Meanwhile, the 15 to 24 years age bracket for the primary householder has the lowest median household income of $0, with 16 households (1.3%) in this group.
| Income Bracket | # Households | Median Income |
| 15 to 24 Years | 16 (1.3%) | $0 |
| 25 to 44 Years | 16 (1.3%) | $250,001 |
| 45 to 64 Years | 409 (32.1%) | $162,552 |
| 65+ Years | 832 (65.4%) | $61,458 |
| Total | 1,273 (100.0%) | $86,250 |
Poverty in Hillsboro Beach
Income Below Poverty by Sex and Age in Hillsboro Beach
With 5.7% poverty level for males and 6.4% for females among the residents of Hillsboro Beach, 6 to 11 year old males and 25 to 34 year old females are the most vulnerable to poverty, with 14 males (53.8%) and 5 females (29.4%) in their respective age groups living below the poverty level.
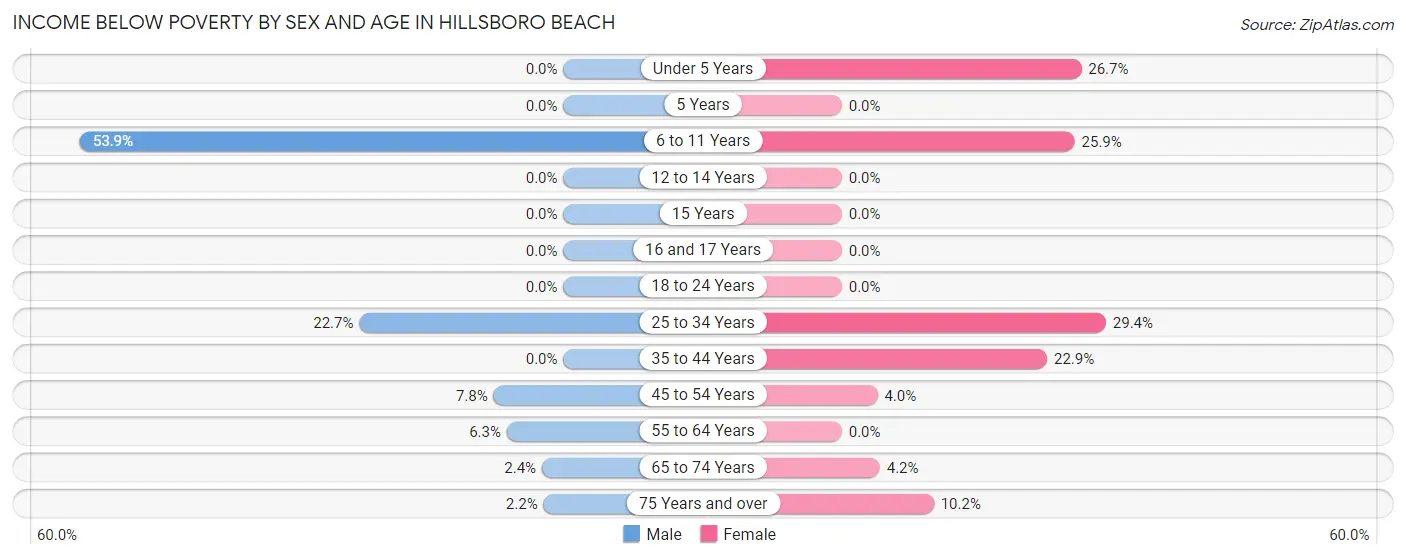
| Age Bracket | Male | Female |
| Under 5 Years | 0 (0.0%) | 8 (26.7%) |
| 5 Years | 0 (0.0%) | 0 (0.0%) |
| 6 to 11 Years | 14 (53.8%) | 7 (25.9%) |
| 12 to 14 Years | 0 (0.0%) | 0 (0.0%) |
| 15 Years | 0 (0.0%) | 0 (0.0%) |
| 16 and 17 Years | 0 (0.0%) | 0 (0.0%) |
| 18 to 24 Years | 0 (0.0%) | 0 (0.0%) |
| 25 to 34 Years | 5 (22.7%) | 5 (29.4%) |
| 35 to 44 Years | 0 (0.0%) | 8 (22.9%) |
| 45 to 54 Years | 8 (7.8%) | 5 (4.0%) |
| 55 to 64 Years | 16 (6.3%) | 0 (0.0%) |
| 65 to 74 Years | 6 (2.4%) | 17 (4.2%) |
| 75 Years and over | 6 (2.2%) | 30 (10.2%) |
| Total | 55 (5.7%) | 80 (6.4%) |
Income Above Poverty by Sex and Age in Hillsboro Beach
According to the poverty statistics in Hillsboro Beach, males aged 12 to 14 years and females aged 18 to 24 years are the age groups that are most secure financially, with 100.0% of males and 100.0% of females in these age groups living above the poverty line.
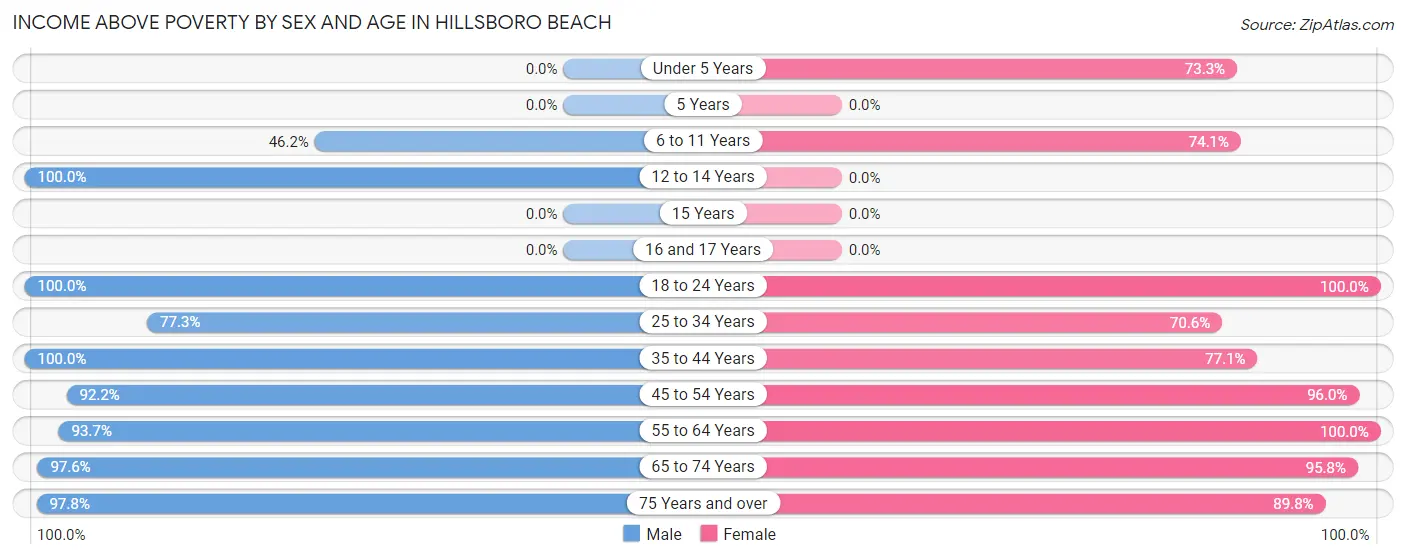
| Age Bracket | Male | Female |
| Under 5 Years | 0 (0.0%) | 22 (73.3%) |
| 5 Years | 0 (0.0%) | 0 (0.0%) |
| 6 to 11 Years | 12 (46.2%) | 20 (74.1%) |
| 12 to 14 Years | 14 (100.0%) | 0 (0.0%) |
| 15 Years | 0 (0.0%) | 0 (0.0%) |
| 16 and 17 Years | 0 (0.0%) | 0 (0.0%) |
| 18 to 24 Years | 25 (100.0%) | 56 (100.0%) |
| 25 to 34 Years | 17 (77.3%) | 12 (70.6%) |
| 35 to 44 Years | 5 (100.0%) | 27 (77.1%) |
| 45 to 54 Years | 95 (92.2%) | 121 (96.0%) |
| 55 to 64 Years | 238 (93.7%) | 268 (100.0%) |
| 65 to 74 Years | 245 (97.6%) | 385 (95.8%) |
| 75 Years and over | 265 (97.8%) | 263 (89.8%) |
| Total | 916 (94.3%) | 1,174 (93.6%) |
Income Below Poverty Among Married-Couple Families in Hillsboro Beach
The poverty statistics for married-couple families in Hillsboro Beach show that 2.3% or 13 of the total 571 families live below the poverty line. Families with 3 or 4 children have the highest poverty rate of 100.0%, comprising of 8 families. On the other hand, families with 1 or 2 children have the lowest poverty rate of 0.0%, which includes 0 families.
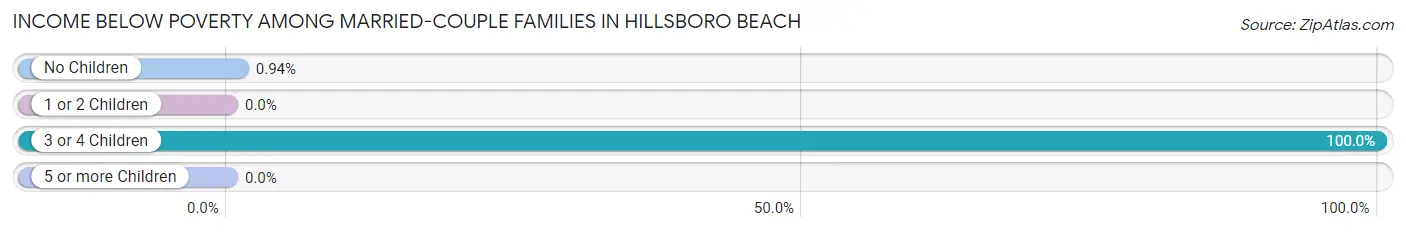
| Children | Above Poverty | Below Poverty |
| No Children | 528 (99.1%) | 5 (0.9%) |
| 1 or 2 Children | 30 (100.0%) | 0 (0.0%) |
| 3 or 4 Children | 0 (0.0%) | 8 (100.0%) |
| 5 or more Children | 0 (0.0%) | 0 (0.0%) |
| Total | 558 (97.7%) | 13 (2.3%) |
Income Below Poverty Among Single-Parent Households in Hillsboro Beach
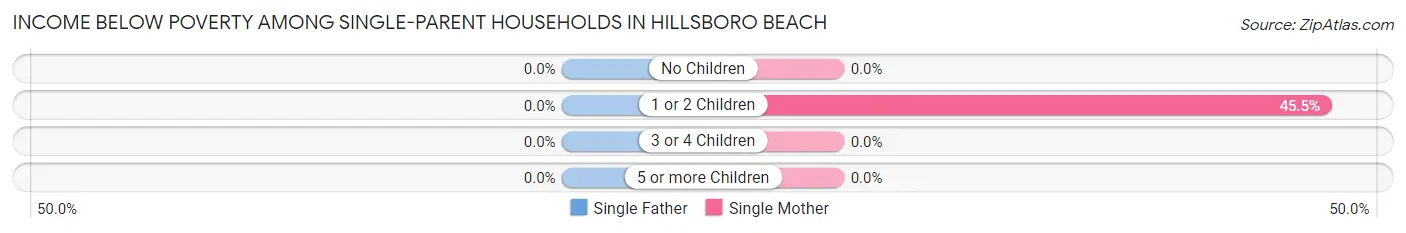
| Children | Single Father | Single Mother |
| No Children | 0 (0.0%) | 0 (0.0%) |
| 1 or 2 Children | 0 (0.0%) | 5 (45.5%) |
| 3 or 4 Children | 0 (0.0%) | 0 (0.0%) |
| 5 or more Children | 0 (0.0%) | 0 (0.0%) |
| Total | 0 (0.0%) | 5 (11.6%) |
Income Below Poverty Among Married-Couple vs Single-Parent Households in Hillsboro Beach
The poverty data for Hillsboro Beach shows that 13 of the married-couple family households (2.3%) and 5 of the single-parent households (6.7%) are living below the poverty level. Within the married-couple family households, those with 3 or 4 children have the highest poverty rate, with 8 households (100.0%) falling below the poverty line. Among the single-parent households, those with 1 or 2 children have the highest poverty rate, with 5 household (29.4%) living below poverty.
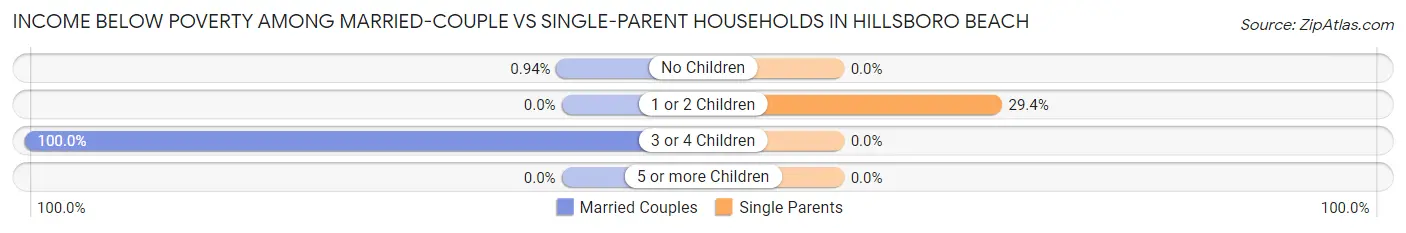
| Children | Married-Couple Families | Single-Parent Households |
| No Children | 5 (0.9%) | 0 (0.0%) |
| 1 or 2 Children | 0 (0.0%) | 5 (29.4%) |
| 3 or 4 Children | 8 (100.0%) | 0 (0.0%) |
| 5 or more Children | 0 (0.0%) | 0 (0.0%) |
| Total | 13 (2.3%) | 5 (6.7%) |
Employment Characteristics in Hillsboro Beach
Employment by Class of Employer in Hillsboro Beach
Among the 786 employed individuals in Hillsboro Beach, private company employees (384 | 48.8%), self-employed (not incorporated) (140 | 17.8%), and not-for-profit organizations (130 | 16.5%) make up the most common classes of employment.
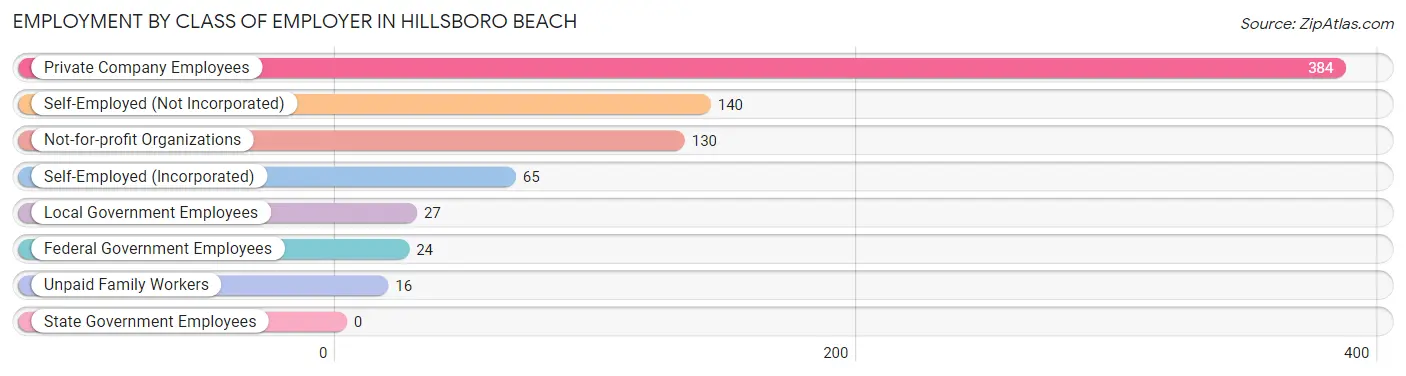
| Employer Class | # Employees | % Employees |
| Private Company Employees | 384 | 48.8% |
| Self-Employed (Incorporated) | 65 | 8.3% |
| Self-Employed (Not Incorporated) | 140 | 17.8% |
| Not-for-profit Organizations | 130 | 16.5% |
| Local Government Employees | 27 | 3.4% |
| State Government Employees | 0 | 0.0% |
| Federal Government Employees | 24 | 3.0% |
| Unpaid Family Workers | 16 | 2.0% |
| Total | 786 | 100.0% |
Employment Status by Age in Hillsboro Beach
According to the labor force statistics for Hillsboro Beach, out of the total population over 16 years of age (2,128), 40.0% or 851 individuals are in the labor force, with 6.3% or 54 of them unemployed. The age group with the highest labor force participation rate is 20 to 24 years, with 100.0% or 71 individuals in the labor force. Within the labor force, the 60 to 64 years age range has the highest percentage of unemployed individuals, with 14.7% or 32 of them being unemployed.
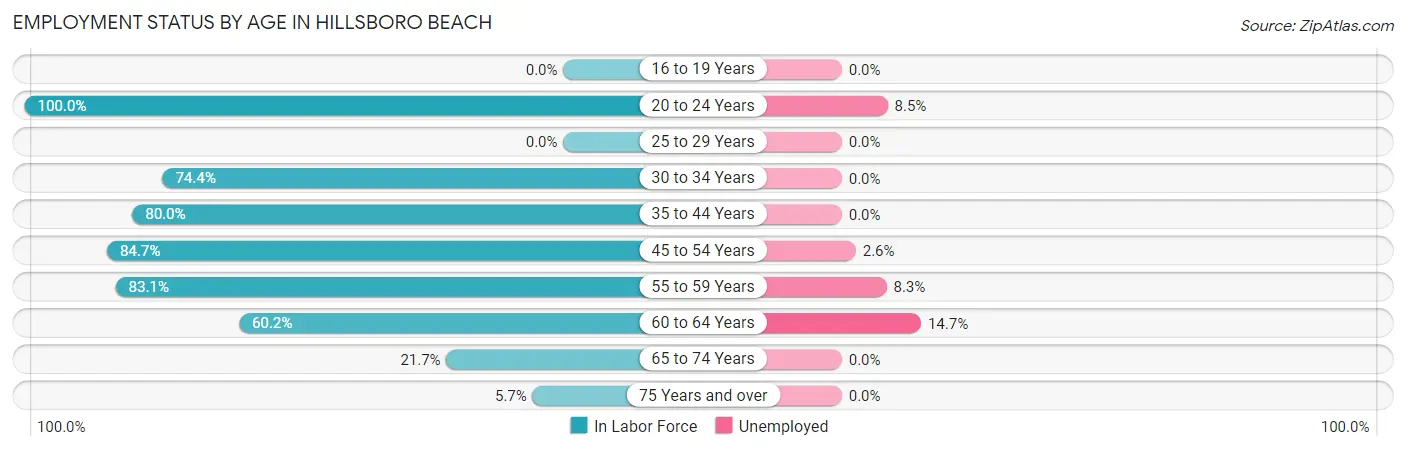
| Age Bracket | In Labor Force | Unemployed |
| 16 to 19 Years | 0 (0.0%) | 0 (0.0%) |
| 20 to 24 Years | 71 (100.0%) | 6 (8.5%) |
| 25 to 29 Years | 0 (0.0%) | 0 (0.0%) |
| 30 to 34 Years | 29 (74.4%) | 0 (0.0%) |
| 35 to 44 Years | 32 (80.0%) | 0 (0.0%) |
| 45 to 54 Years | 194 (84.7%) | 5 (2.6%) |
| 55 to 59 Years | 133 (83.1%) | 11 (8.3%) |
| 60 to 64 Years | 218 (60.2%) | 32 (14.7%) |
| 65 to 74 Years | 142 (21.7%) | 0 (0.0%) |
| 75 Years and over | 32 (5.7%) | 0 (0.0%) |
| Total | 851 (40.0%) | 54 (6.3%) |
Employment Status by Educational Attainment in Hillsboro Beach
According to labor force statistics for Hillsboro Beach, 73.0% of individuals (606) out of the total population between 25 and 64 years of age (830) are in the labor force, with 7.9% or 48 of them being unemployed. The group with the highest labor force participation rate are those with the educational attainment of bachelor's degree or higher, with 79.6% or 399 individuals in the labor force. Within the labor force, individuals with college / associate degree education have the highest percentage of unemployment, with 18.0% or 33 of them being unemployed.
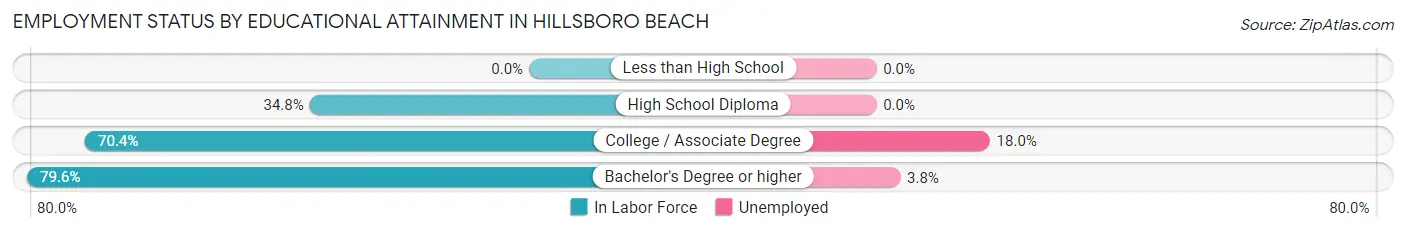
| Educational Attainment | In Labor Force | Unemployed |
| Less than High School | 0 (0.0%) | 0 (0.0%) |
| High School Diploma | 24 (34.8%) | 0 (0.0%) |
| College / Associate Degree | 183 (70.4%) | 47 (18.0%) |
| Bachelor's Degree or higher | 399 (79.6%) | 19 (3.8%) |
| Total | 606 (73.0%) | 66 (7.9%) |
Employment Occupations by Sex in Hillsboro Beach
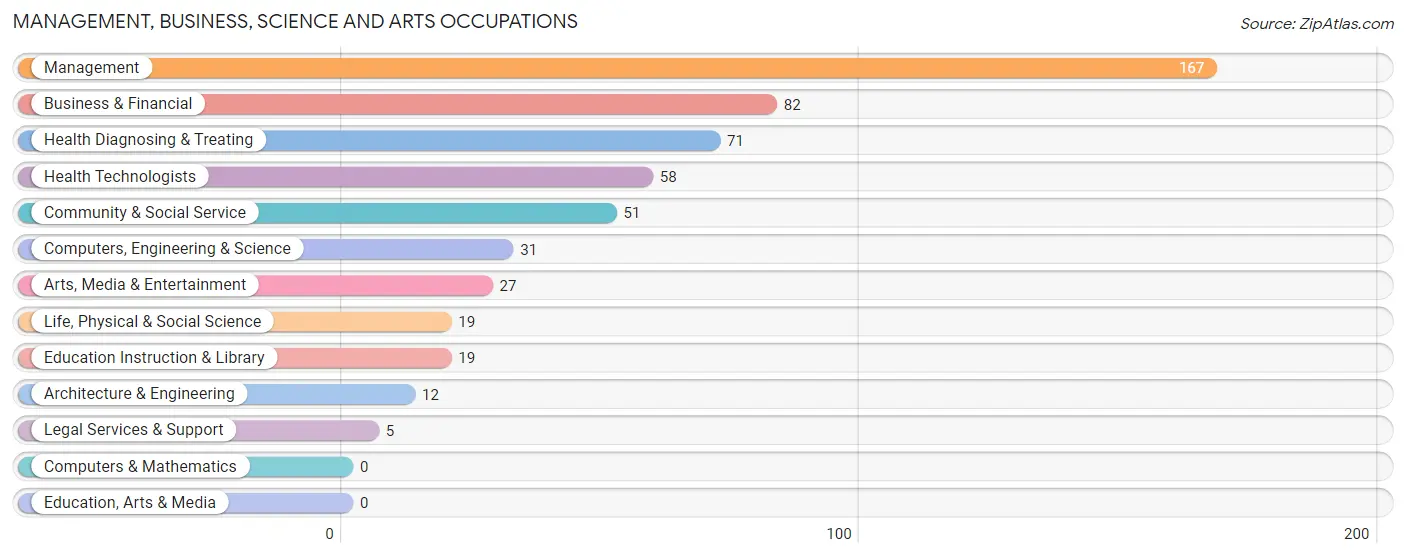
Management, Business, Science and Arts Occupations
The most common Management, Business, Science and Arts occupations in Hillsboro Beach are Management (167 | 20.9%), Business & Financial (82 | 10.3%), Health Diagnosing & Treating (71 | 8.9%), Health Technologists (58 | 7.3%), and Community & Social Service (51 | 6.4%).
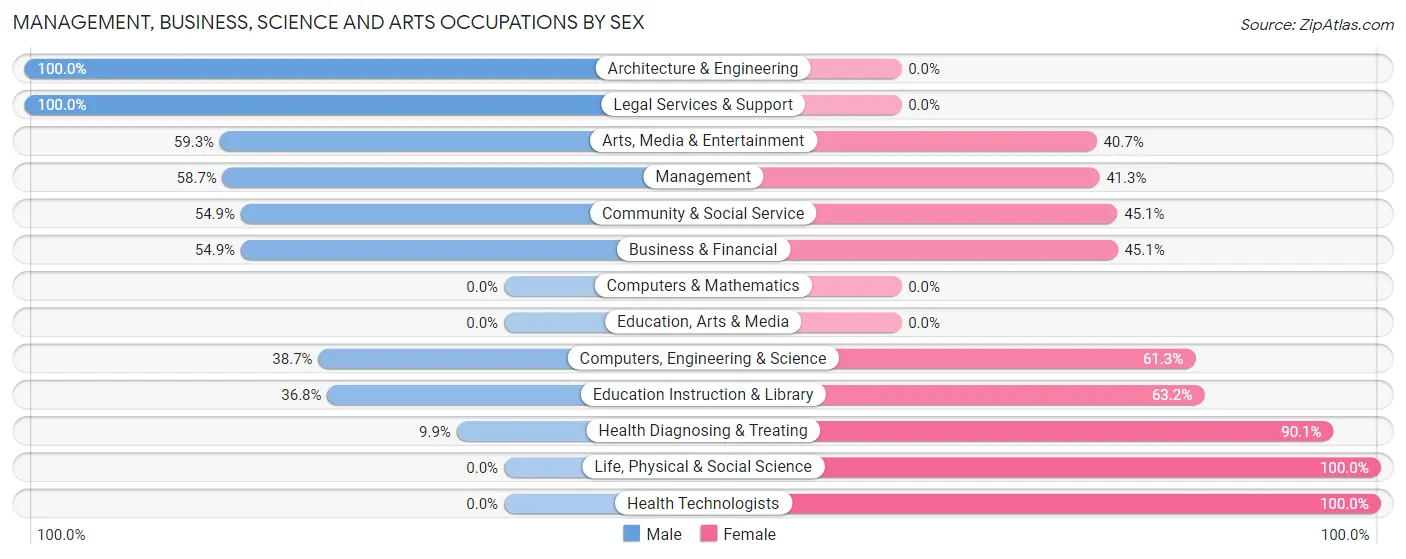
Management, Business, Science and Arts Occupations by Sex
Within the Management, Business, Science and Arts occupations in Hillsboro Beach, the most male-oriented occupations are Architecture & Engineering (100.0%), Legal Services & Support (100.0%), and Arts, Media & Entertainment (59.3%), while the most female-oriented occupations are Life, Physical & Social Science (100.0%), Health Technologists (100.0%), and Health Diagnosing & Treating (90.1%).
| Occupation | Male | Female |
| Management | 98 (58.7%) | 69 (41.3%) |
| Business & Financial | 45 (54.9%) | 37 (45.1%) |
| Computers, Engineering & Science | 12 (38.7%) | 19 (61.3%) |
| Computers & Mathematics | 0 (0.0%) | 0 (0.0%) |
| Architecture & Engineering | 12 (100.0%) | 0 (0.0%) |
| Life, Physical & Social Science | 0 (0.0%) | 19 (100.0%) |
| Community & Social Service | 28 (54.9%) | 23 (45.1%) |
| Education, Arts & Media | 0 (0.0%) | 0 (0.0%) |
| Legal Services & Support | 5 (100.0%) | 0 (0.0%) |
| Education Instruction & Library | 7 (36.8%) | 12 (63.2%) |
| Arts, Media & Entertainment | 16 (59.3%) | 11 (40.7%) |
| Health Diagnosing & Treating | 7 (9.9%) | 64 (90.1%) |
| Health Technologists | 0 (0.0%) | 58 (100.0%) |
| Total (Category) | 190 (47.3%) | 212 (52.7%) |
| Total (Overall) | 379 (47.5%) | 418 (52.4%) |
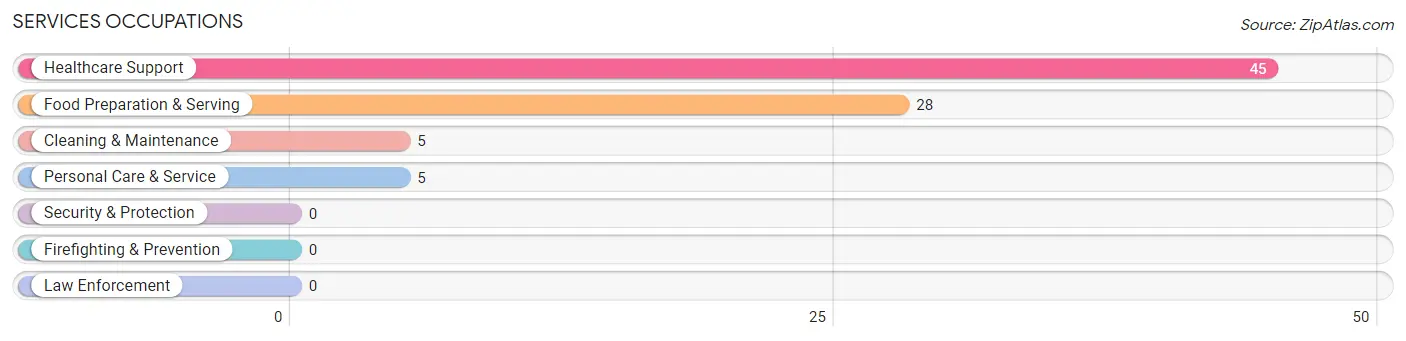
Services Occupations
The most common Services occupations in Hillsboro Beach are Healthcare Support (45 | 5.7%), Food Preparation & Serving (28 | 3.5%), Cleaning & Maintenance (5 | 0.6%), and Personal Care & Service (5 | 0.6%).
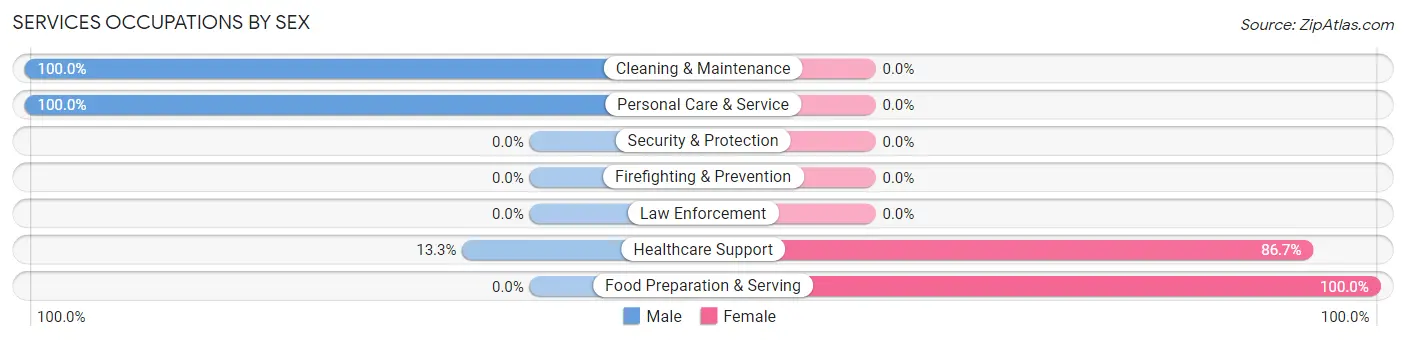
Services Occupations by Sex
Within the Services occupations in Hillsboro Beach, the most male-oriented occupations are Cleaning & Maintenance (100.0%), Personal Care & Service (100.0%), and Healthcare Support (13.3%), while the most female-oriented occupations are Food Preparation & Serving (100.0%), and Healthcare Support (86.7%).
| Occupation | Male | Female |
| Healthcare Support | 6 (13.3%) | 39 (86.7%) |
| Security & Protection | 0 (0.0%) | 0 (0.0%) |
| Firefighting & Prevention | 0 (0.0%) | 0 (0.0%) |
| Law Enforcement | 0 (0.0%) | 0 (0.0%) |
| Food Preparation & Serving | 0 (0.0%) | 28 (100.0%) |
| Cleaning & Maintenance | 5 (100.0%) | 0 (0.0%) |
| Personal Care & Service | 5 (100.0%) | 0 (0.0%) |
| Total (Category) | 16 (19.3%) | 67 (80.7%) |
| Total (Overall) | 379 (47.5%) | 418 (52.4%) |
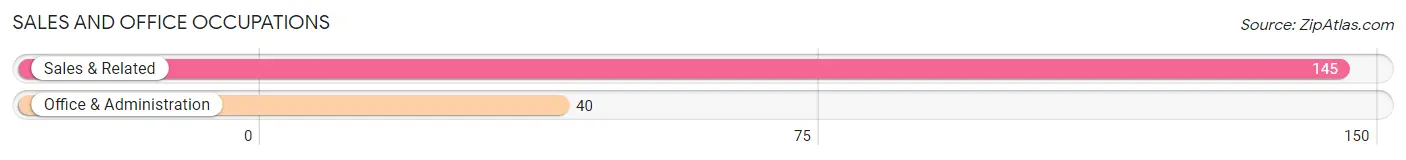
Sales and Office Occupations
The most common Sales and Office occupations in Hillsboro Beach are Sales & Related (145 | 18.2%), and Office & Administration (40 | 5.0%).
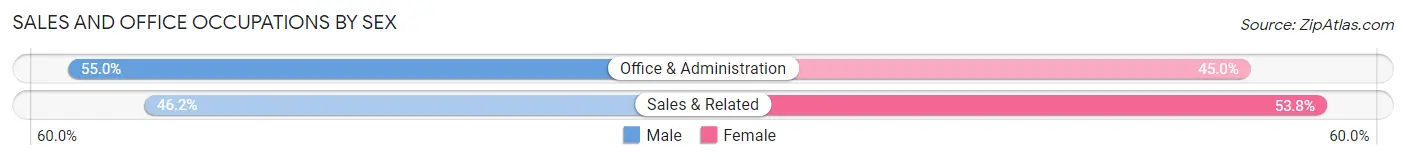
Sales and Office Occupations by Sex
| Occupation | Male | Female |
| Sales & Related | 67 (46.2%) | 78 (53.8%) |
| Office & Administration | 22 (55.0%) | 18 (45.0%) |
| Total (Category) | 89 (48.1%) | 96 (51.9%) |
| Total (Overall) | 379 (47.5%) | 418 (52.4%) |
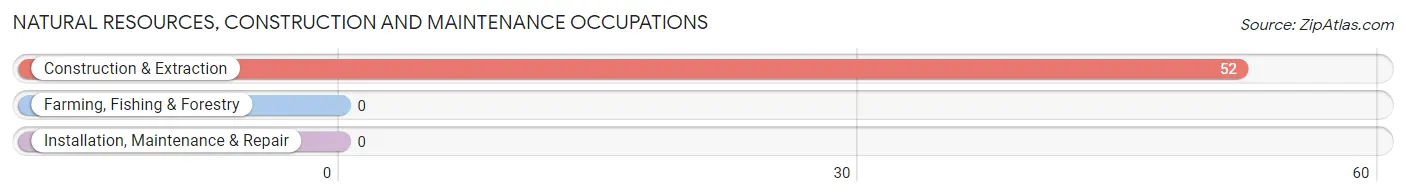
Natural Resources, Construction and Maintenance Occupations
The most common Natural Resources, Construction and Maintenance occupations in Hillsboro Beach are , and Construction & Extraction (52 | 6.5%).
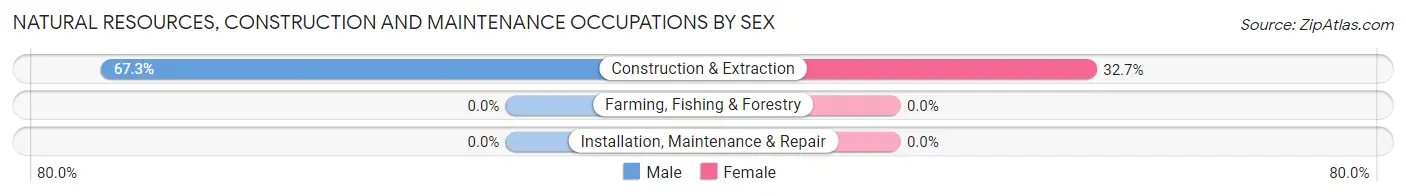
Natural Resources, Construction and Maintenance Occupations by Sex
| Occupation | Male | Female |
| Farming, Fishing & Forestry | 0 (0.0%) | 0 (0.0%) |
| Construction & Extraction | 35 (67.3%) | 17 (32.7%) |
| Installation, Maintenance & Repair | 0 (0.0%) | 0 (0.0%) |
| Total (Category) | 35 (67.3%) | 17 (32.7%) |
| Total (Overall) | 379 (47.5%) | 418 (52.4%) |
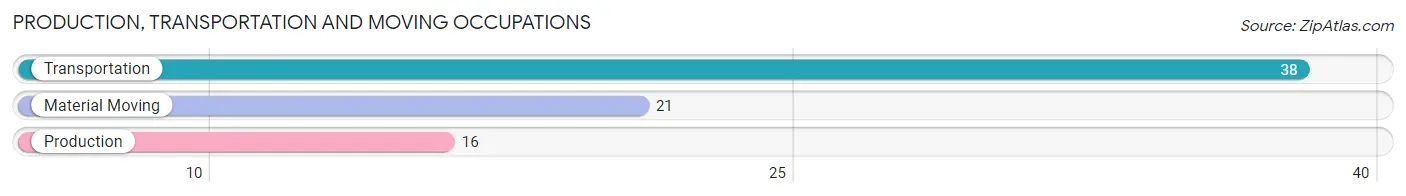
Production, Transportation and Moving Occupations
The most common Production, Transportation and Moving occupations in Hillsboro Beach are Transportation (38 | 4.8%), Material Moving (21 | 2.6%), and Production (16 | 2.0%).
Production, Transportation and Moving Occupations by Sex
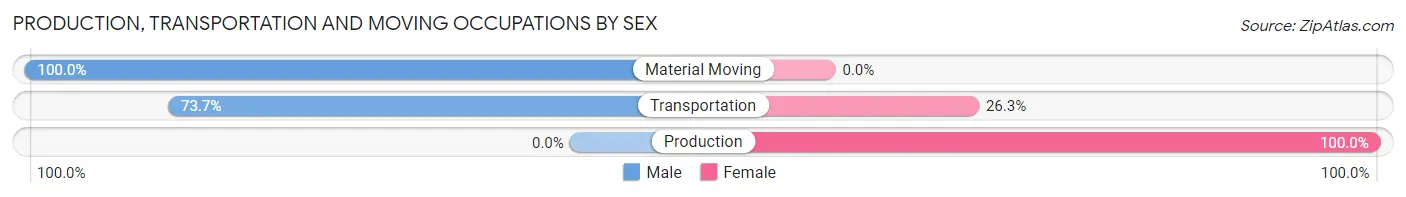
| Occupation | Male | Female |
| Production | 0 (0.0%) | 16 (100.0%) |
| Transportation | 28 (73.7%) | 10 (26.3%) |
| Material Moving | 21 (100.0%) | 0 (0.0%) |
| Total (Category) | 49 (65.3%) | 26 (34.7%) |
| Total (Overall) | 379 (47.5%) | 418 (52.4%) |
Employment Industries by Sex in Hillsboro Beach
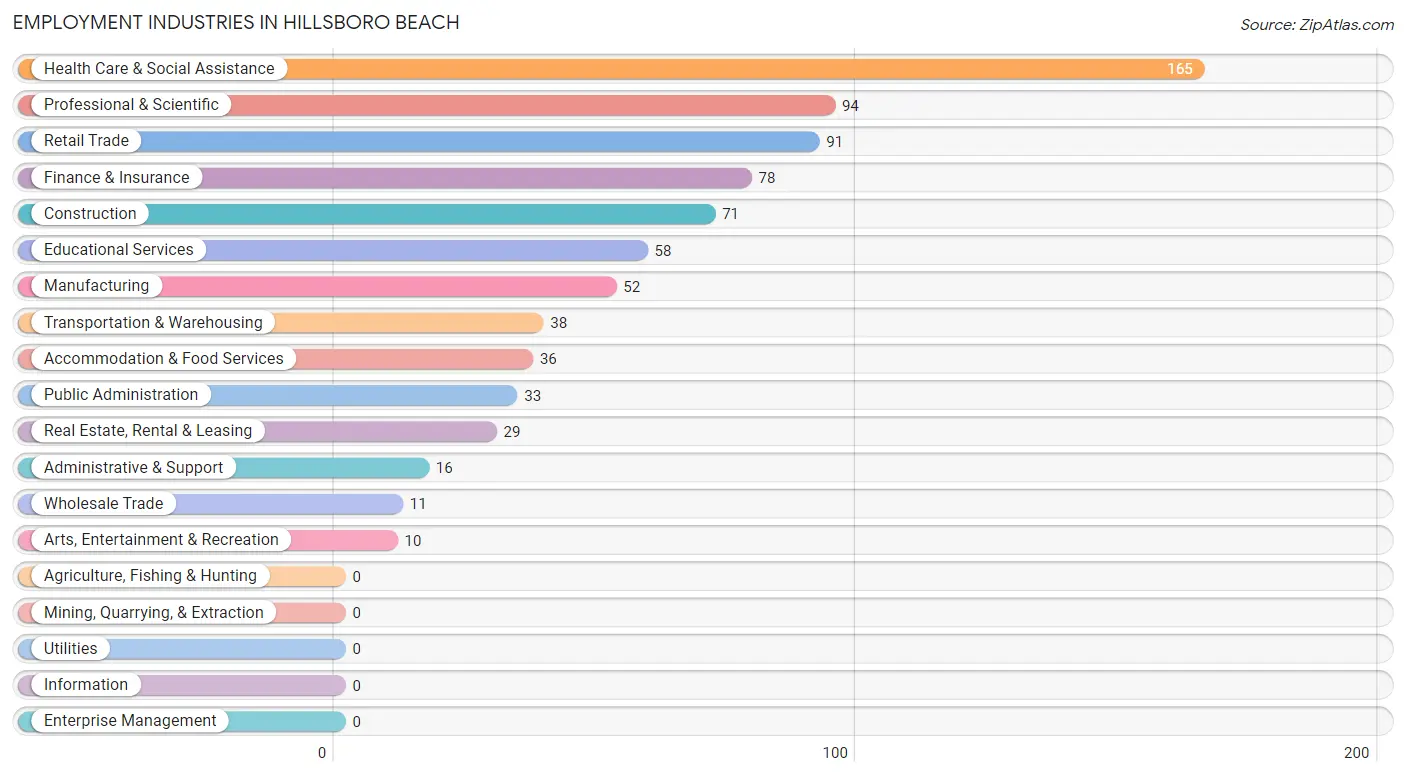
Employment Industries in Hillsboro Beach
The major employment industries in Hillsboro Beach include Health Care & Social Assistance (165 | 20.7%), Professional & Scientific (94 | 11.8%), Retail Trade (91 | 11.4%), Finance & Insurance (78 | 9.8%), and Construction (71 | 8.9%).
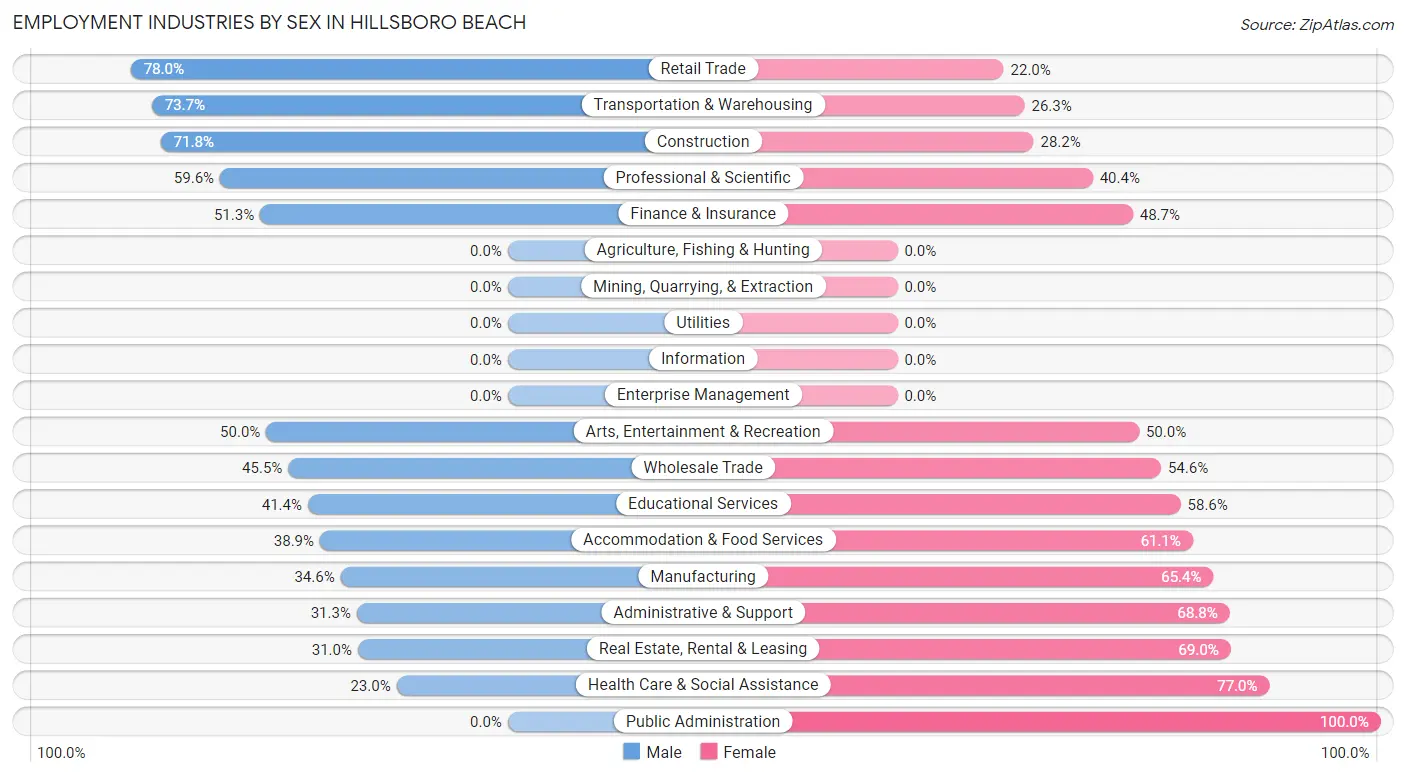
Employment Industries by Sex in Hillsboro Beach
The Hillsboro Beach industries that see more men than women are Retail Trade (78.0%), Transportation & Warehousing (73.7%), and Construction (71.8%), whereas the industries that tend to have a higher number of women are Public Administration (100.0%), Health Care & Social Assistance (77.0%), and Real Estate, Rental & Leasing (69.0%).
| Industry | Male | Female |
| Agriculture, Fishing & Hunting | 0 (0.0%) | 0 (0.0%) |
| Mining, Quarrying, & Extraction | 0 (0.0%) | 0 (0.0%) |
| Construction | 51 (71.8%) | 20 (28.2%) |
| Manufacturing | 18 (34.6%) | 34 (65.4%) |
| Wholesale Trade | 5 (45.5%) | 6 (54.5%) |
| Retail Trade | 71 (78.0%) | 20 (22.0%) |
| Transportation & Warehousing | 28 (73.7%) | 10 (26.3%) |
| Utilities | 0 (0.0%) | 0 (0.0%) |
| Information | 0 (0.0%) | 0 (0.0%) |
| Finance & Insurance | 40 (51.3%) | 38 (48.7%) |
| Real Estate, Rental & Leasing | 9 (31.0%) | 20 (69.0%) |
| Professional & Scientific | 56 (59.6%) | 38 (40.4%) |
| Enterprise Management | 0 (0.0%) | 0 (0.0%) |
| Administrative & Support | 5 (31.2%) | 11 (68.8%) |
| Educational Services | 24 (41.4%) | 34 (58.6%) |
| Health Care & Social Assistance | 38 (23.0%) | 127 (77.0%) |
| Arts, Entertainment & Recreation | 5 (50.0%) | 5 (50.0%) |
| Accommodation & Food Services | 14 (38.9%) | 22 (61.1%) |
| Public Administration | 0 (0.0%) | 33 (100.0%) |
| Total | 379 (47.5%) | 418 (52.4%) |
Education in Hillsboro Beach
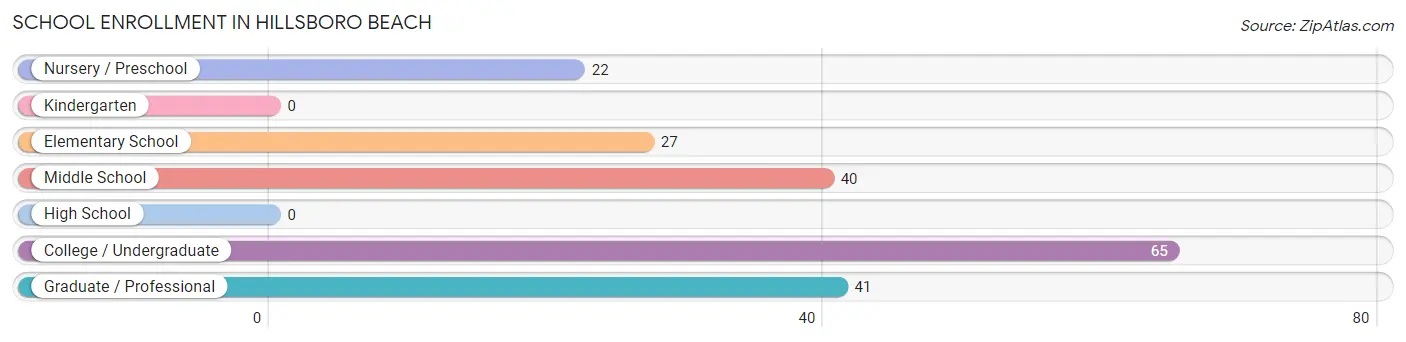
School Enrollment in Hillsboro Beach
The most common levels of schooling among the 195 students in Hillsboro Beach are college / undergraduate (65 | 33.3%), graduate / professional (41 | 21.0%), and middle school (40 | 20.5%).
| School Level | # Students | % Students |
| Nursery / Preschool | 22 | 11.3% |
| Kindergarten | 0 | 0.0% |
| Elementary School | 27 | 13.9% |
| Middle School | 40 | 20.5% |
| High School | 0 | 0.0% |
| College / Undergraduate | 65 | 33.3% |
| Graduate / Professional | 41 | 21.0% |
| Total | 195 | 100.0% |
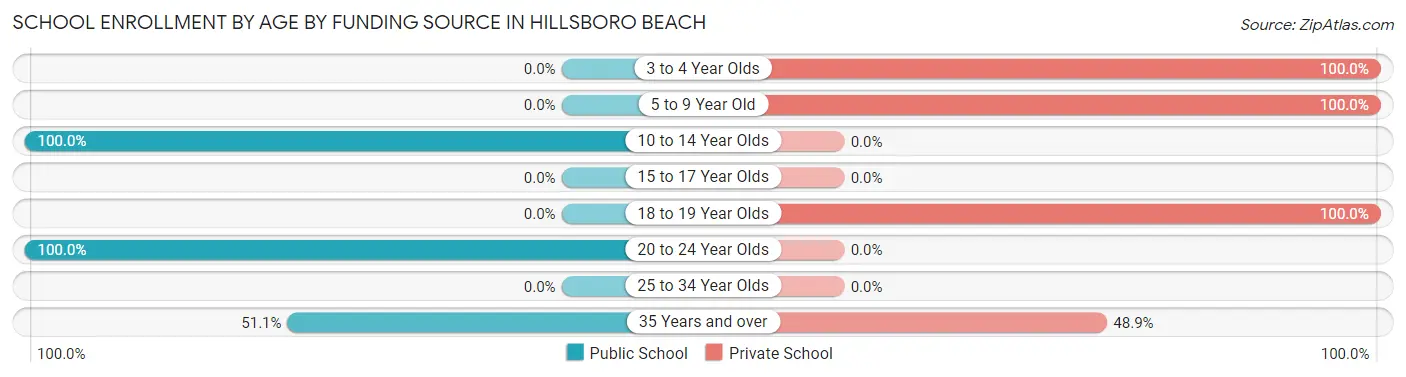
School Enrollment by Age by Funding Source in Hillsboro Beach
Out of a total of 195 students who are enrolled in schools in Hillsboro Beach, 82 (42.1%) attend a private institution, while the remaining 113 (57.9%) are enrolled in public schools. The age group of 3 to 4 year olds has the highest likelihood of being enrolled in private schools, with 22 (100.0% in the age bracket) enrolled. Conversely, the age group of 10 to 14 year olds has the lowest likelihood of being enrolled in a private school, with 40 (100.0% in the age bracket) attending a public institution.
| Age Bracket | Public School | Private School |
| 3 to 4 Year Olds | 0 (0.0%) | 22 (100.0%) |
| 5 to 9 Year Old | 0 (0.0%) | 27 (100.0%) |
| 10 to 14 Year Olds | 40 (100.0%) | 0 (0.0%) |
| 15 to 17 Year Olds | 0 (0.0%) | 0 (0.0%) |
| 18 to 19 Year Olds | 0 (0.0%) | 10 (100.0%) |
| 20 to 24 Year Olds | 49 (100.0%) | 0 (0.0%) |
| 25 to 34 Year Olds | 0 (0.0%) | 0 (0.0%) |
| 35 Years and over | 24 (51.1%) | 23 (48.9%) |
| Total | 113 (57.9%) | 82 (42.1%) |
Educational Attainment by Field of Study in Hillsboro Beach
Business (354 | 31.1%), science & technology (128 | 11.3%), education (127 | 11.2%), psychology (84 | 7.4%), and social sciences (73 | 6.4%) are the most common fields of study among 1,137 individuals in Hillsboro Beach who have obtained a bachelor's degree or higher.
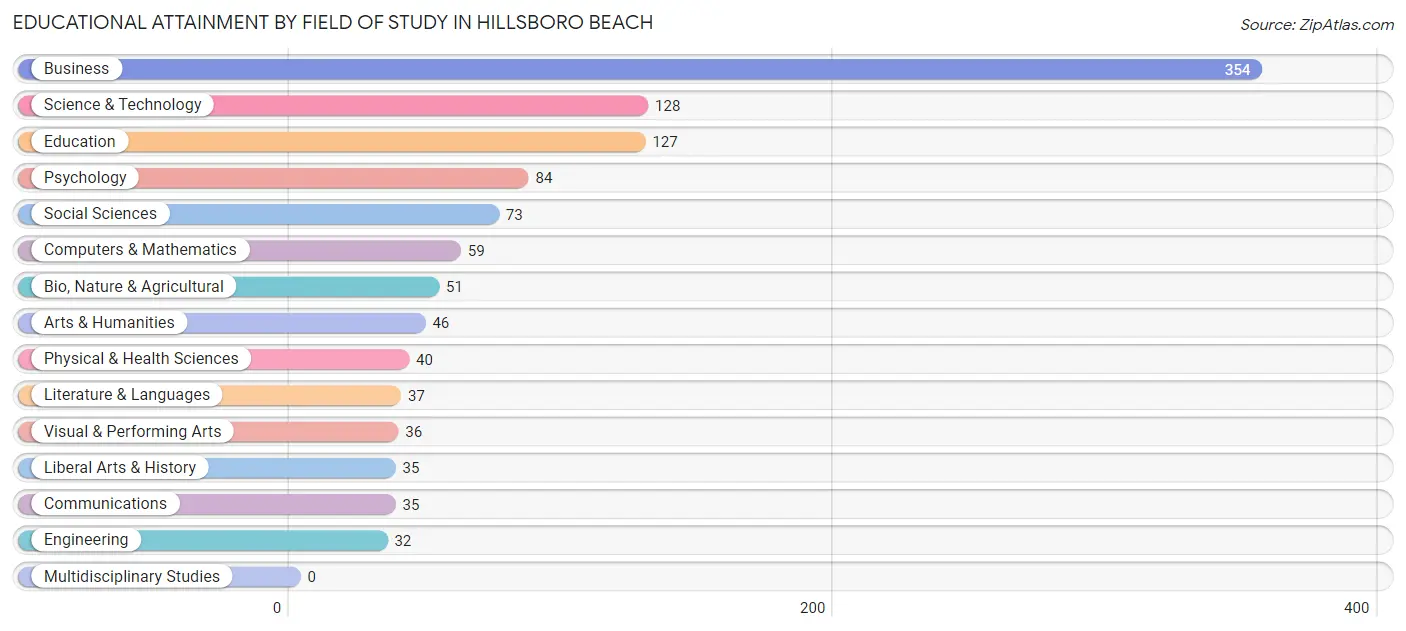
| Field of Study | # Graduates | % Graduates |
| Computers & Mathematics | 59 | 5.2% |
| Bio, Nature & Agricultural | 51 | 4.5% |
| Physical & Health Sciences | 40 | 3.5% |
| Psychology | 84 | 7.4% |
| Social Sciences | 73 | 6.4% |
| Engineering | 32 | 2.8% |
| Multidisciplinary Studies | 0 | 0.0% |
| Science & Technology | 128 | 11.3% |
| Business | 354 | 31.1% |
| Education | 127 | 11.2% |
| Literature & Languages | 37 | 3.3% |
| Liberal Arts & History | 35 | 3.1% |
| Visual & Performing Arts | 36 | 3.2% |
| Communications | 35 | 3.1% |
| Arts & Humanities | 46 | 4.1% |
| Total | 1,137 | 100.0% |
Transportation & Commute in Hillsboro Beach
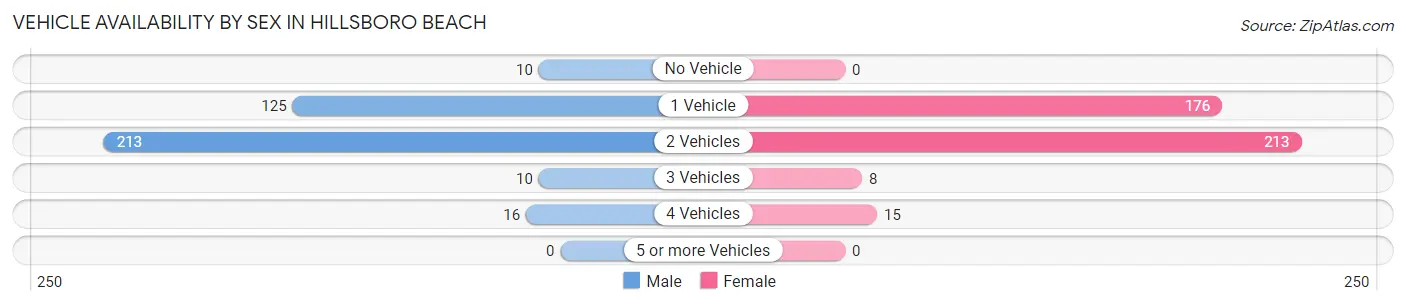
Vehicle Availability by Sex in Hillsboro Beach
The most prevalent vehicle ownership categories in Hillsboro Beach are males with 2 vehicles (213, accounting for 57.0%) and females with 2 vehicles (213, making up 51.7%).
| Vehicles Available | Male | Female |
| No Vehicle | 10 (2.7%) | 0 (0.0%) |
| 1 Vehicle | 125 (33.4%) | 176 (42.7%) |
| 2 Vehicles | 213 (57.0%) | 213 (51.7%) |
| 3 Vehicles | 10 (2.7%) | 8 (1.9%) |
| 4 Vehicles | 16 (4.3%) | 15 (3.6%) |
| 5 or more Vehicles | 0 (0.0%) | 0 (0.0%) |
| Total | 374 (100.0%) | 412 (100.0%) |
Commute Time in Hillsboro Beach
The most frequently occuring commute durations in Hillsboro Beach are 10 to 14 minutes (123 commuters, 21.0%), 5 to 9 minutes (74 commuters, 12.7%), and 20 to 24 minutes (73 commuters, 12.5%).
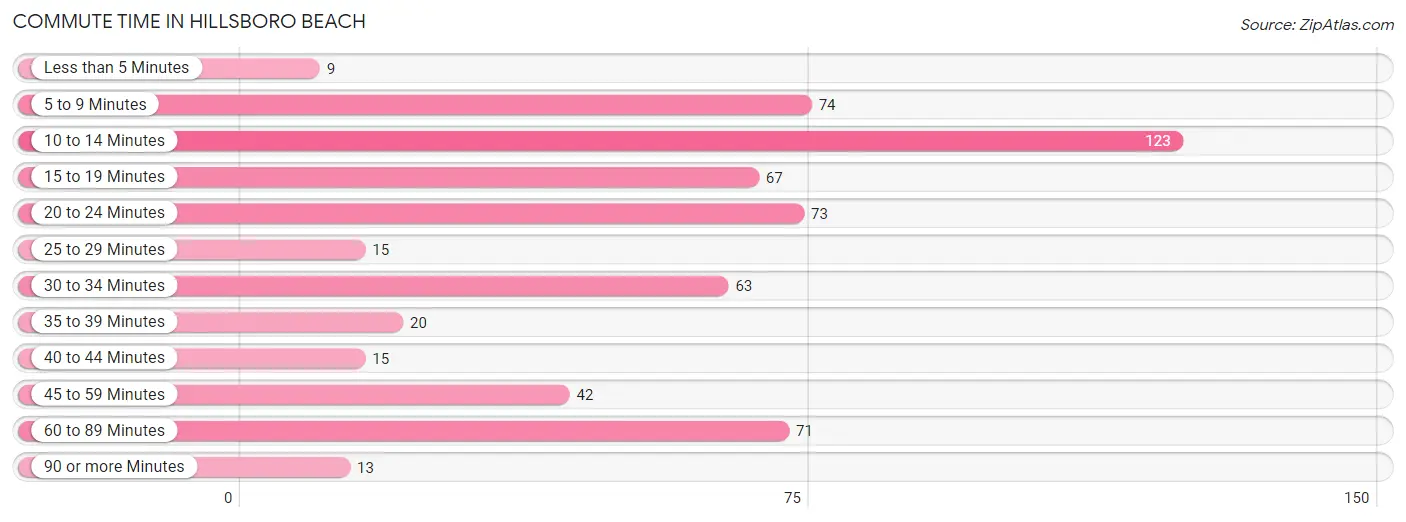
| Commute Time | # Commuters | % Commuters |
| Less than 5 Minutes | 9 | 1.5% |
| 5 to 9 Minutes | 74 | 12.7% |
| 10 to 14 Minutes | 123 | 21.0% |
| 15 to 19 Minutes | 67 | 11.5% |
| 20 to 24 Minutes | 73 | 12.5% |
| 25 to 29 Minutes | 15 | 2.6% |
| 30 to 34 Minutes | 63 | 10.8% |
| 35 to 39 Minutes | 20 | 3.4% |
| 40 to 44 Minutes | 15 | 2.6% |
| 45 to 59 Minutes | 42 | 7.2% |
| 60 to 89 Minutes | 71 | 12.1% |
| 90 or more Minutes | 13 | 2.2% |
Commute Time by Sex in Hillsboro Beach
The most common commute times in Hillsboro Beach are 10 to 14 minutes (73 commuters, 25.2%) for males and 15 to 19 minutes (57 commuters, 19.3%) for females.
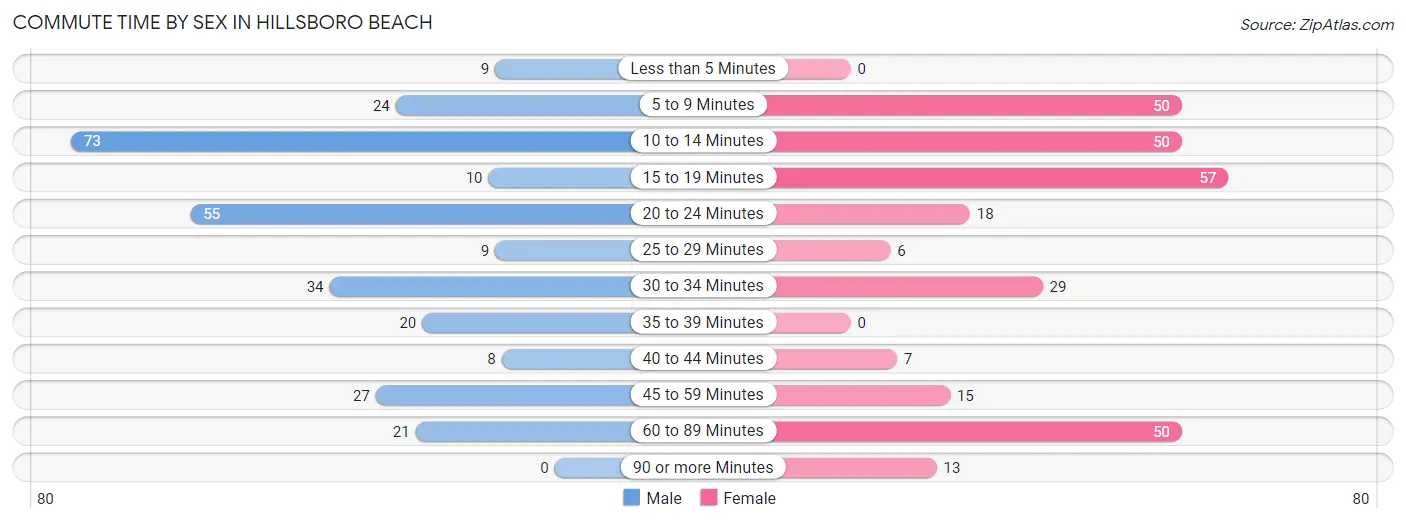
| Commute Time | Male | Female |
| Less than 5 Minutes | 9 (3.1%) | 0 (0.0%) |
| 5 to 9 Minutes | 24 (8.3%) | 50 (17.0%) |
| 10 to 14 Minutes | 73 (25.2%) | 50 (17.0%) |
| 15 to 19 Minutes | 10 (3.5%) | 57 (19.3%) |
| 20 to 24 Minutes | 55 (19.0%) | 18 (6.1%) |
| 25 to 29 Minutes | 9 (3.1%) | 6 (2.0%) |
| 30 to 34 Minutes | 34 (11.7%) | 29 (9.8%) |
| 35 to 39 Minutes | 20 (6.9%) | 0 (0.0%) |
| 40 to 44 Minutes | 8 (2.8%) | 7 (2.4%) |
| 45 to 59 Minutes | 27 (9.3%) | 15 (5.1%) |
| 60 to 89 Minutes | 21 (7.2%) | 50 (17.0%) |
| 90 or more Minutes | 0 (0.0%) | 13 (4.4%) |
Time of Departure to Work by Sex in Hillsboro Beach
The most frequent times of departure to work in Hillsboro Beach are 7:30 AM to 7:59 AM (92, 31.7%) for males and 9:00 AM to 9:59 AM (64, 21.7%) for females.
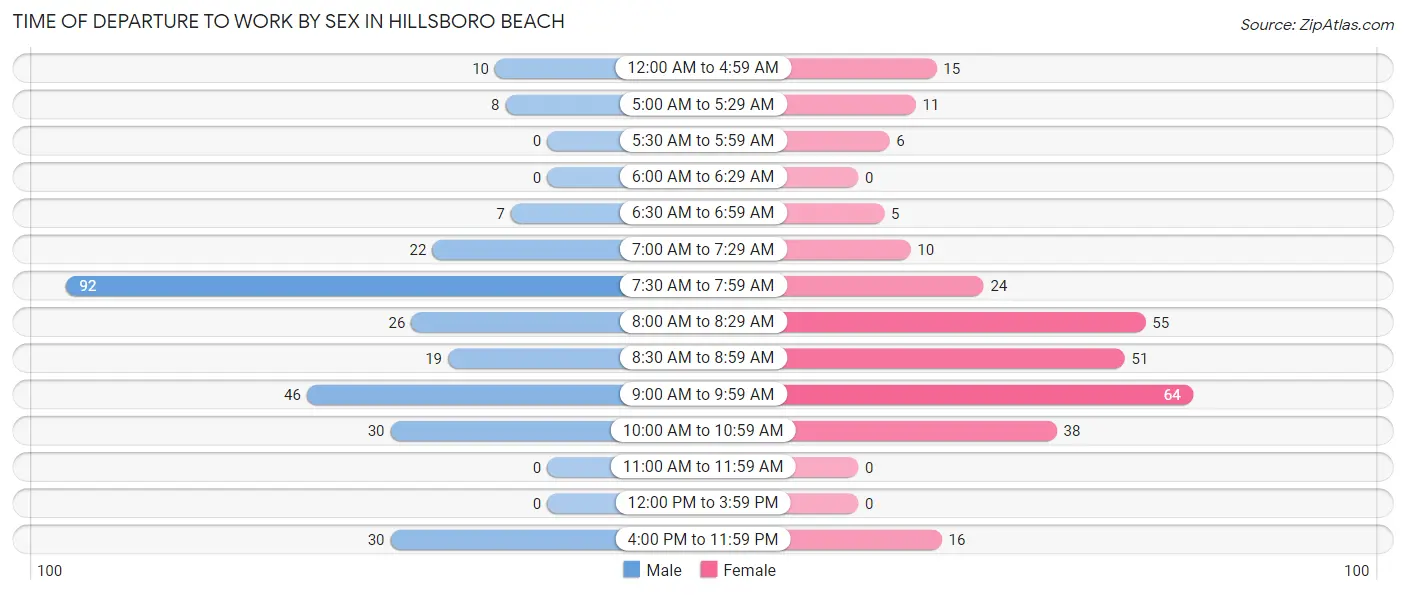
| Time of Departure | Male | Female |
| 12:00 AM to 4:59 AM | 10 (3.5%) | 15 (5.1%) |
| 5:00 AM to 5:29 AM | 8 (2.8%) | 11 (3.7%) |
| 5:30 AM to 5:59 AM | 0 (0.0%) | 6 (2.0%) |
| 6:00 AM to 6:29 AM | 0 (0.0%) | 0 (0.0%) |
| 6:30 AM to 6:59 AM | 7 (2.4%) | 5 (1.7%) |
| 7:00 AM to 7:29 AM | 22 (7.6%) | 10 (3.4%) |
| 7:30 AM to 7:59 AM | 92 (31.7%) | 24 (8.1%) |
| 8:00 AM to 8:29 AM | 26 (9.0%) | 55 (18.6%) |
| 8:30 AM to 8:59 AM | 19 (6.6%) | 51 (17.3%) |
| 9:00 AM to 9:59 AM | 46 (15.9%) | 64 (21.7%) |
| 10:00 AM to 10:59 AM | 30 (10.3%) | 38 (12.9%) |
| 11:00 AM to 11:59 AM | 0 (0.0%) | 0 (0.0%) |
| 12:00 PM to 3:59 PM | 0 (0.0%) | 0 (0.0%) |
| 4:00 PM to 11:59 PM | 30 (10.3%) | 16 (5.4%) |
| Total | 290 (100.0%) | 295 (100.0%) |
Housing Occupancy in Hillsboro Beach
Occupancy by Ownership in Hillsboro Beach
Of the total 1,273 dwellings in Hillsboro Beach, owner-occupied units account for 1,068 (83.9%), while renter-occupied units make up 205 (16.1%).
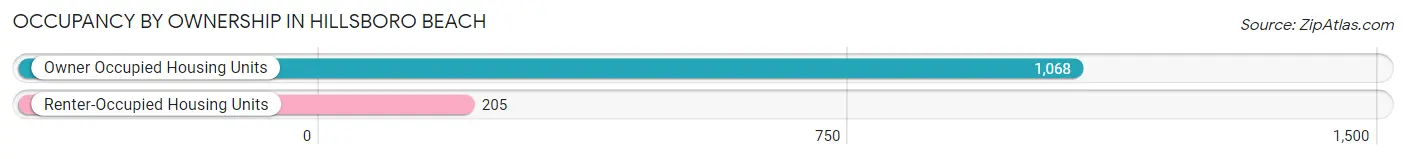
| Occupancy | # Housing Units | % Housing Units |
| Owner Occupied Housing Units | 1,068 | 83.9% |
| Renter-Occupied Housing Units | 205 | 16.1% |
| Total Occupied Housing Units | 1,273 | 100.0% |
Occupancy by Household Size in Hillsboro Beach
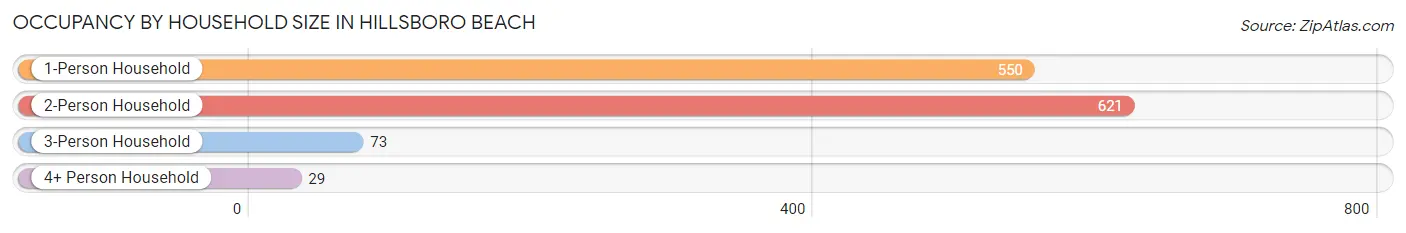
| Household Size | # Housing Units | % Housing Units |
| 1-Person Household | 550 | 43.2% |
| 2-Person Household | 621 | 48.8% |
| 3-Person Household | 73 | 5.7% |
| 4+ Person Household | 29 | 2.3% |
| Total Housing Units | 1,273 | 100.0% |
Occupancy by Ownership by Household Size in Hillsboro Beach
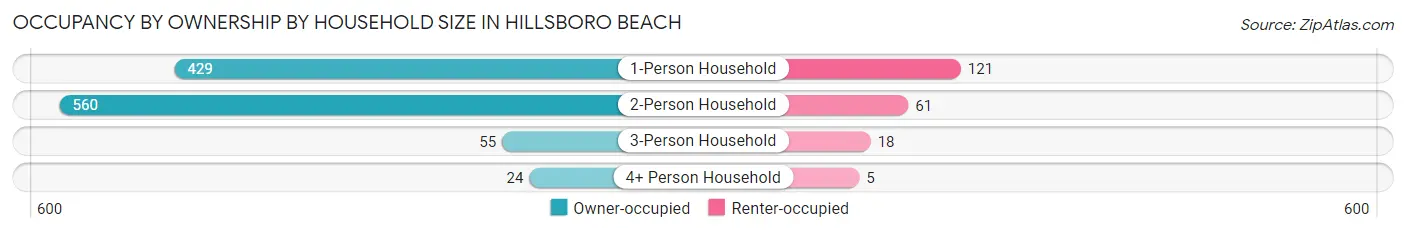
| Household Size | Owner-occupied | Renter-occupied |
| 1-Person Household | 429 (78.0%) | 121 (22.0%) |
| 2-Person Household | 560 (90.2%) | 61 (9.8%) |
| 3-Person Household | 55 (75.3%) | 18 (24.7%) |
| 4+ Person Household | 24 (82.8%) | 5 (17.2%) |
| Total Housing Units | 1,068 (83.9%) | 205 (16.1%) |
Occupancy by Educational Attainment in Hillsboro Beach
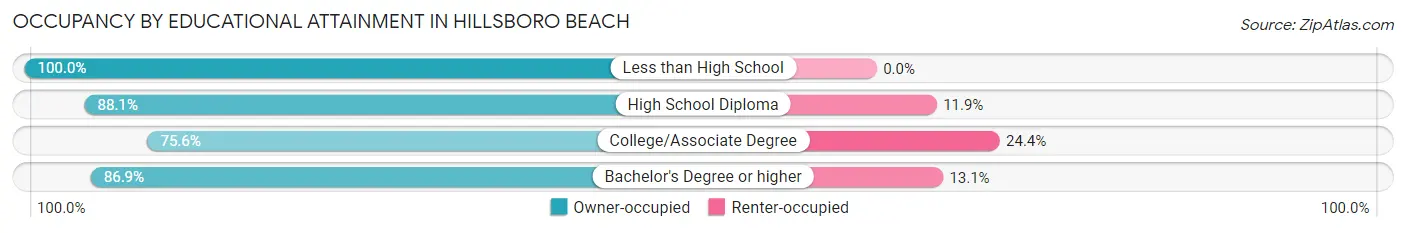
| Household Size | Owner-occupied | Renter-occupied |
| Less than High School | 6 (100.0%) | 0 (0.0%) |
| High School Diploma | 148 (88.1%) | 20 (11.9%) |
| College/Associate Degree | 273 (75.6%) | 88 (24.4%) |
| Bachelor's Degree or higher | 641 (86.9%) | 97 (13.1%) |
Occupancy by Age of Householder in Hillsboro Beach
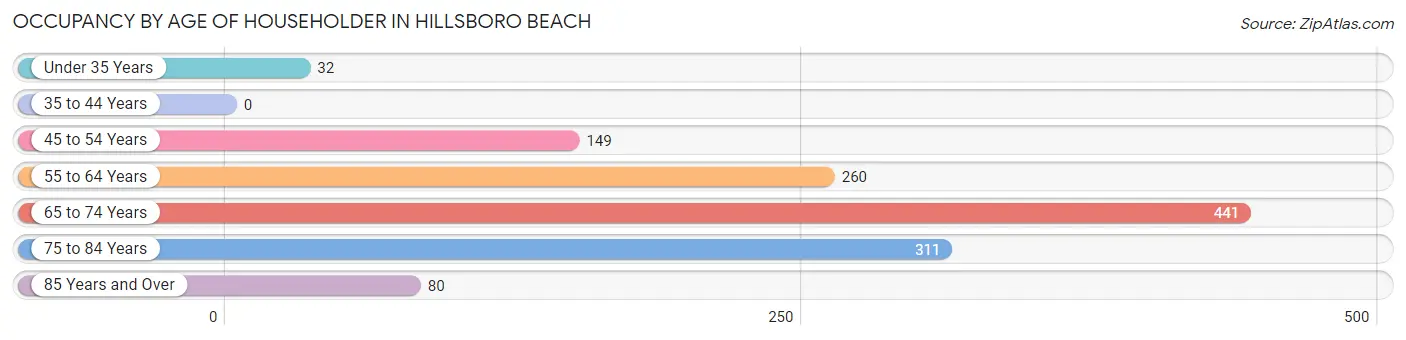
| Age Bracket | # Households | % Households |
| Under 35 Years | 32 | 2.5% |
| 35 to 44 Years | 0 | 0.0% |
| 45 to 54 Years | 149 | 11.7% |
| 55 to 64 Years | 260 | 20.4% |
| 65 to 74 Years | 441 | 34.6% |
| 75 to 84 Years | 311 | 24.4% |
| 85 Years and Over | 80 | 6.3% |
| Total | 1,273 | 100.0% |
Housing Finances in Hillsboro Beach
Median Income by Occupancy in Hillsboro Beach
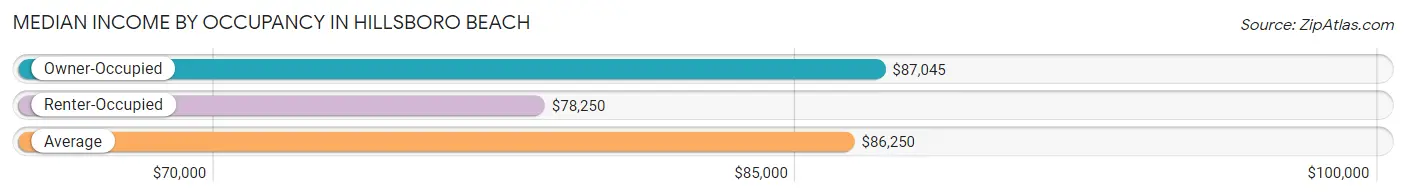
| Occupancy Type | # Households | Median Income |
| Owner-Occupied | 1,068 (83.9%) | $87,045 |
| Renter-Occupied | 205 (16.1%) | $78,250 |
| Average | 1,273 (100.0%) | $86,250 |
Occupancy by Householder Income Bracket in Hillsboro Beach
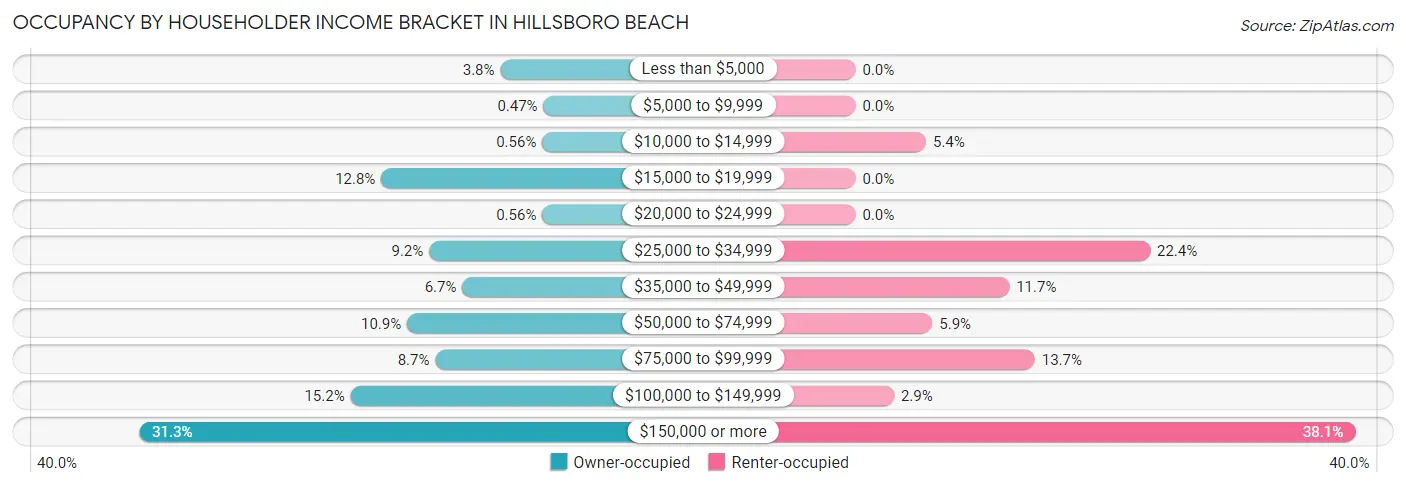
| Income Bracket | Owner-occupied | Renter-occupied |
| Less than $5,000 | 40 (3.7%) | 0 (0.0%) |
| $5,000 to $9,999 | 5 (0.5%) | 0 (0.0%) |
| $10,000 to $14,999 | 6 (0.6%) | 11 (5.4%) |
| $15,000 to $19,999 | 137 (12.8%) | 0 (0.0%) |
| $20,000 to $24,999 | 6 (0.6%) | 0 (0.0%) |
| $25,000 to $34,999 | 98 (9.2%) | 46 (22.4%) |
| $35,000 to $49,999 | 71 (6.7%) | 24 (11.7%) |
| $50,000 to $74,999 | 116 (10.9%) | 12 (5.9%) |
| $75,000 to $99,999 | 93 (8.7%) | 28 (13.7%) |
| $100,000 to $149,999 | 162 (15.2%) | 6 (2.9%) |
| $150,000 or more | 334 (31.3%) | 78 (38.1%) |
| Total | 1,068 (100.0%) | 205 (100.0%) |
Monthly Housing Cost Tiers in Hillsboro Beach
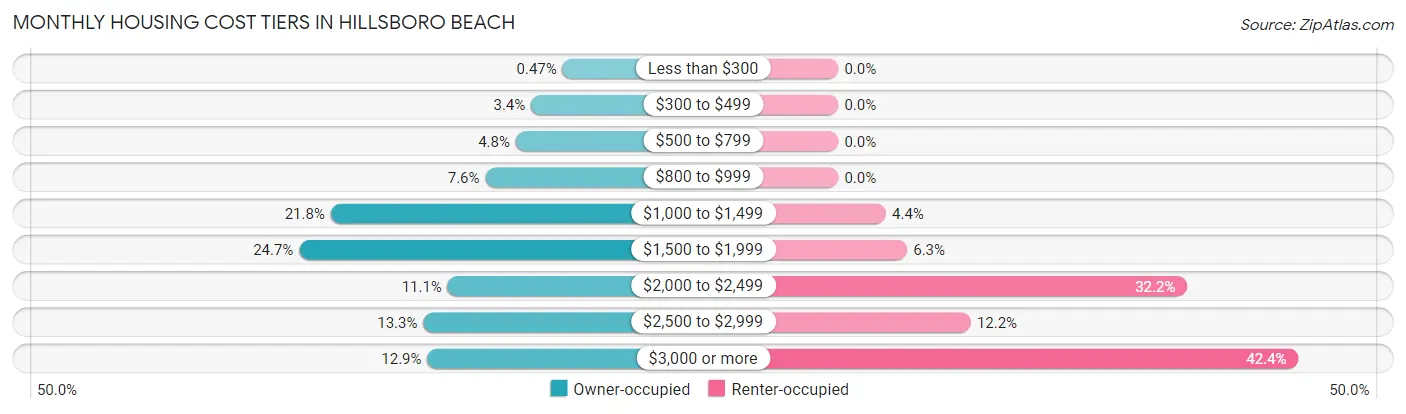
| Monthly Cost | Owner-occupied | Renter-occupied |
| Less than $300 | 5 (0.5%) | 0 (0.0%) |
| $300 to $499 | 36 (3.4%) | 0 (0.0%) |
| $500 to $799 | 51 (4.8%) | 0 (0.0%) |
| $800 to $999 | 81 (7.6%) | 0 (0.0%) |
| $1,000 to $1,499 | 233 (21.8%) | 9 (4.4%) |
| $1,500 to $1,999 | 264 (24.7%) | 13 (6.3%) |
| $2,000 to $2,499 | 118 (11.1%) | 66 (32.2%) |
| $2,500 to $2,999 | 142 (13.3%) | 25 (12.2%) |
| $3,000 or more | 138 (12.9%) | 87 (42.4%) |
| Total | 1,068 (100.0%) | 205 (100.0%) |
Physical Housing Characteristics in Hillsboro Beach
Housing Structures in Hillsboro Beach
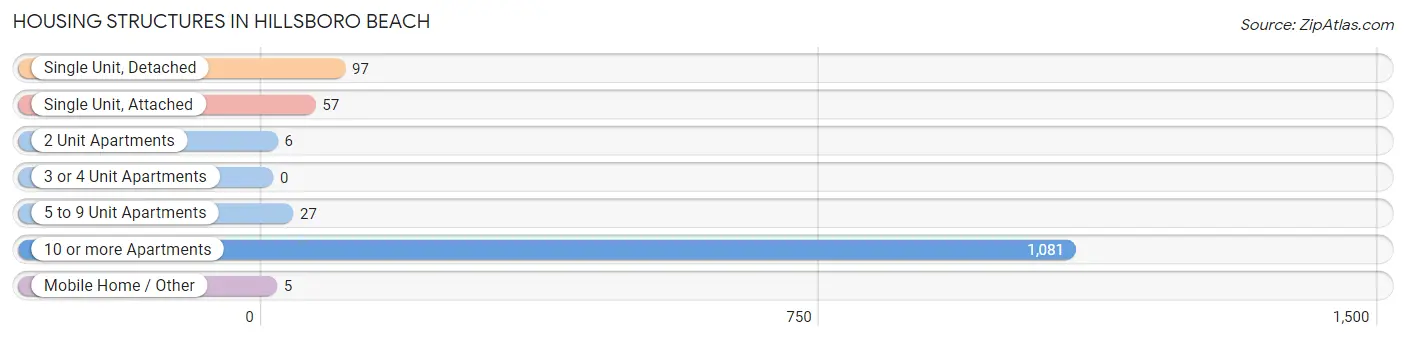
| Structure Type | # Housing Units | % Housing Units |
| Single Unit, Detached | 97 | 7.6% |
| Single Unit, Attached | 57 | 4.5% |
| 2 Unit Apartments | 6 | 0.5% |
| 3 or 4 Unit Apartments | 0 | 0.0% |
| 5 to 9 Unit Apartments | 27 | 2.1% |
| 10 or more Apartments | 1,081 | 84.9% |
| Mobile Home / Other | 5 | 0.4% |
| Total | 1,273 | 100.0% |
Housing Structures by Occupancy in Hillsboro Beach
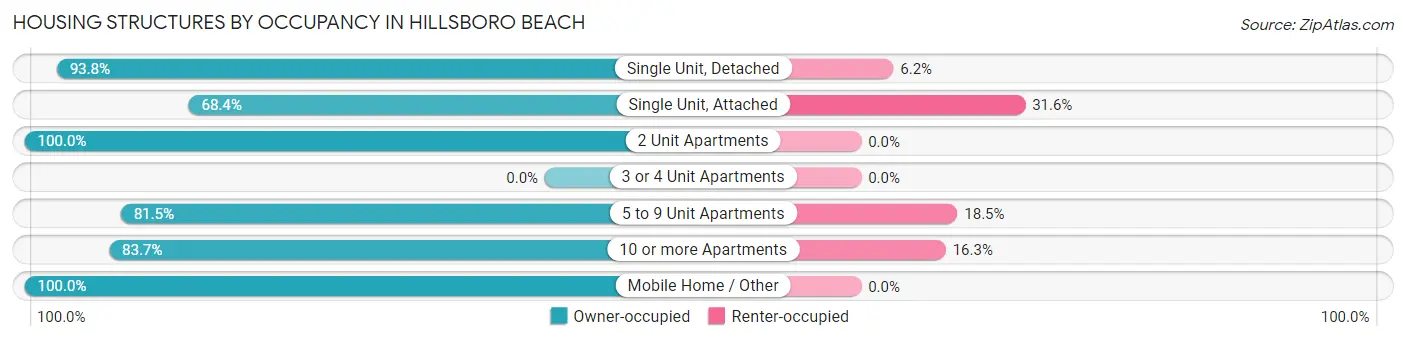
| Structure Type | Owner-occupied | Renter-occupied |
| Single Unit, Detached | 91 (93.8%) | 6 (6.2%) |
| Single Unit, Attached | 39 (68.4%) | 18 (31.6%) |
| 2 Unit Apartments | 6 (100.0%) | 0 (0.0%) |
| 3 or 4 Unit Apartments | 0 (0.0%) | 0 (0.0%) |
| 5 to 9 Unit Apartments | 22 (81.5%) | 5 (18.5%) |
| 10 or more Apartments | 905 (83.7%) | 176 (16.3%) |
| Mobile Home / Other | 5 (100.0%) | 0 (0.0%) |
| Total | 1,068 (83.9%) | 205 (16.1%) |
Housing Structures by Number of Rooms in Hillsboro Beach
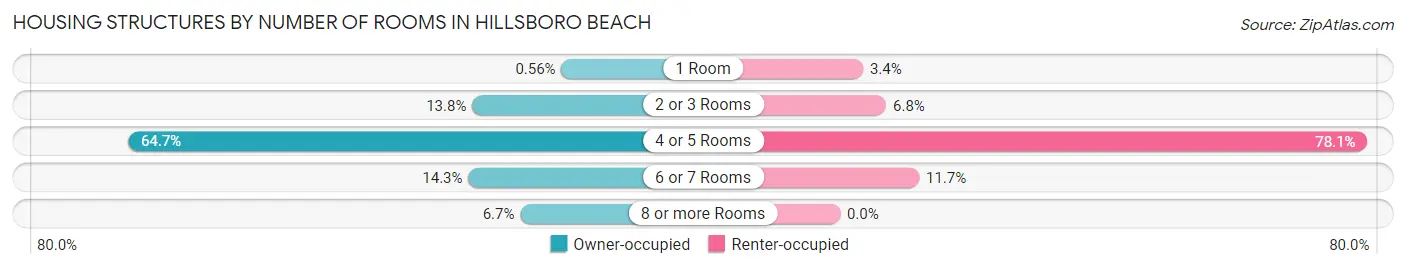
| Number of Rooms | Owner-occupied | Renter-occupied |
| 1 Room | 6 (0.6%) | 7 (3.4%) |
| 2 or 3 Rooms | 147 (13.8%) | 14 (6.8%) |
| 4 or 5 Rooms | 691 (64.7%) | 160 (78.0%) |
| 6 or 7 Rooms | 153 (14.3%) | 24 (11.7%) |
| 8 or more Rooms | 71 (6.7%) | 0 (0.0%) |
| Total | 1,068 (100.0%) | 205 (100.0%) |
Housing Structure by Heating Type in Hillsboro Beach
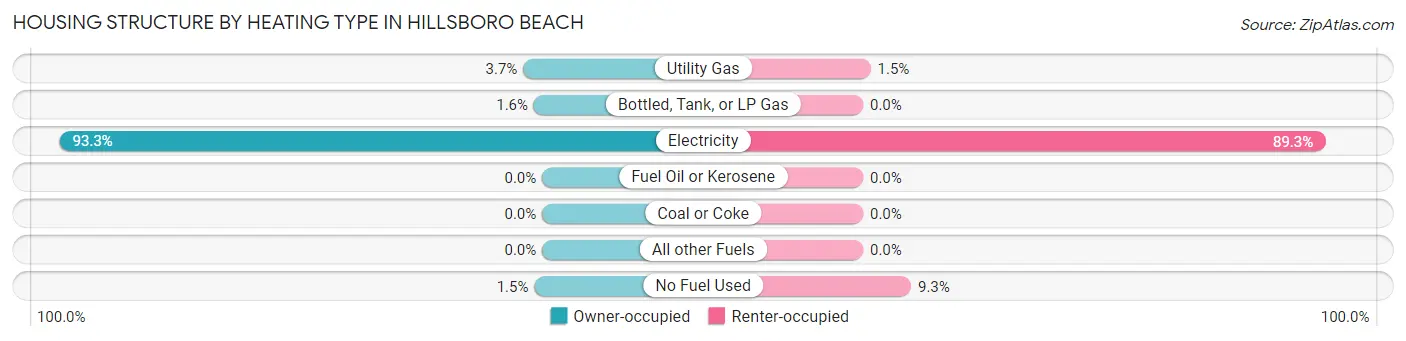
| Heating Type | Owner-occupied | Renter-occupied |
| Utility Gas | 39 (3.6%) | 3 (1.5%) |
| Bottled, Tank, or LP Gas | 17 (1.6%) | 0 (0.0%) |
| Electricity | 996 (93.3%) | 183 (89.3%) |
| Fuel Oil or Kerosene | 0 (0.0%) | 0 (0.0%) |
| Coal or Coke | 0 (0.0%) | 0 (0.0%) |
| All other Fuels | 0 (0.0%) | 0 (0.0%) |
| No Fuel Used | 16 (1.5%) | 19 (9.3%) |
| Total | 1,068 (100.0%) | 205 (100.0%) |
Household Vehicle Usage in Hillsboro Beach
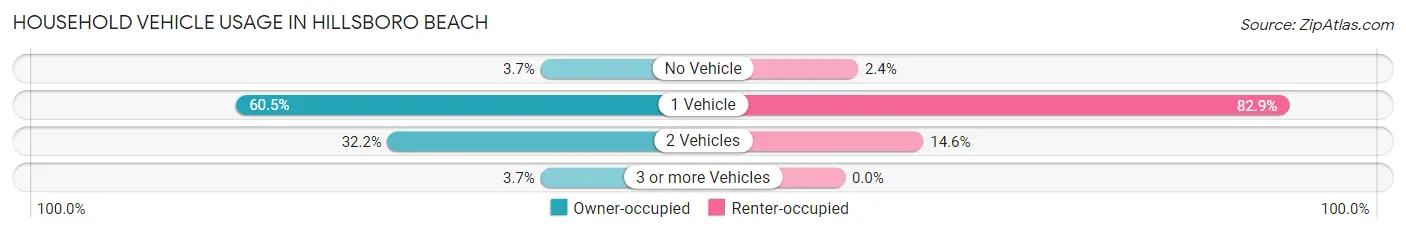
| Vehicles per Household | Owner-occupied | Renter-occupied |
| No Vehicle | 39 (3.6%) | 5 (2.4%) |
| 1 Vehicle | 646 (60.5%) | 170 (82.9%) |
| 2 Vehicles | 344 (32.2%) | 30 (14.6%) |
| 3 or more Vehicles | 39 (3.6%) | 0 (0.0%) |
| Total | 1,068 (100.0%) | 205 (100.0%) |
Real Estate & Mortgages in Hillsboro Beach
Real Estate and Mortgage Overview in Hillsboro Beach
| Characteristic | Without Mortgage | With Mortgage |
| Housing Units | 807 | 261 |
| Median Property Value | $620,300 | $467,500 |
| Median Household Income | $69,943 | $123 |
| Monthly Housing Costs | $1,495 | $76 |
| Real Estate Taxes | $5,865 | $0 |
Property Value by Mortgage Status in Hillsboro Beach
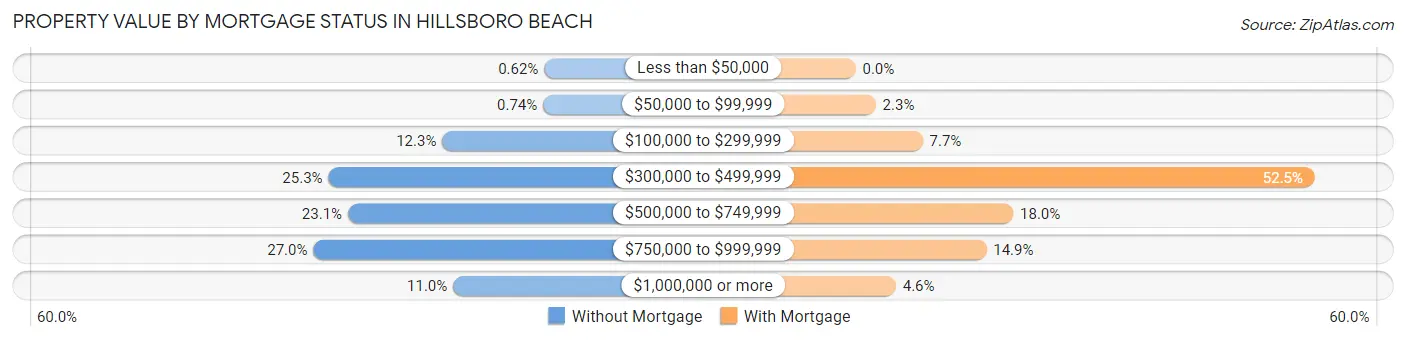
| Property Value | Without Mortgage | With Mortgage |
| Less than $50,000 | 5 (0.6%) | 0 (0.0%) |
| $50,000 to $99,999 | 6 (0.7%) | 6 (2.3%) |
| $100,000 to $299,999 | 99 (12.3%) | 20 (7.7%) |
| $300,000 to $499,999 | 204 (25.3%) | 137 (52.5%) |
| $500,000 to $749,999 | 186 (23.1%) | 47 (18.0%) |
| $750,000 to $999,999 | 218 (27.0%) | 39 (14.9%) |
| $1,000,000 or more | 89 (11.0%) | 12 (4.6%) |
| Total | 807 (100.0%) | 261 (100.0%) |
Household Income by Mortgage Status in Hillsboro Beach
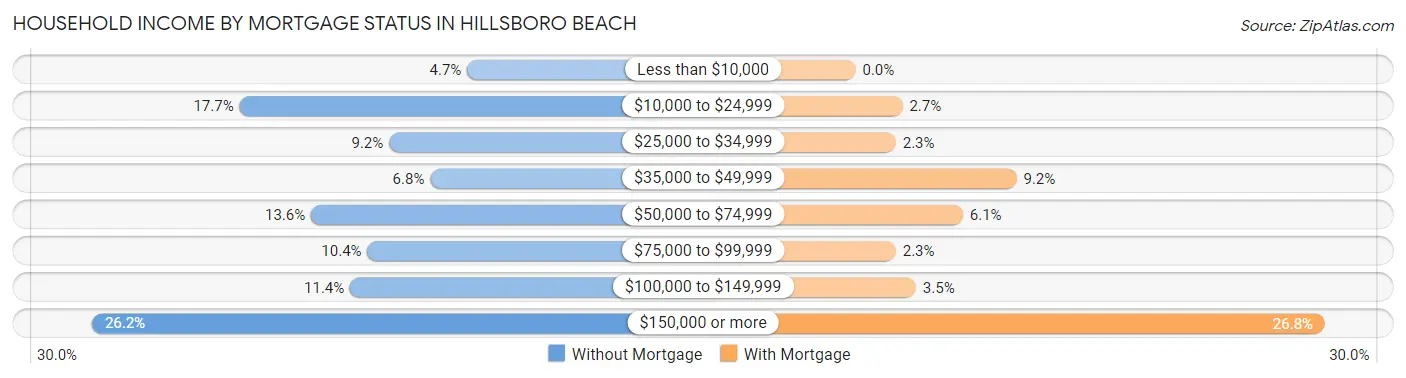
| Household Income | Without Mortgage | With Mortgage |
| Less than $10,000 | 38 (4.7%) | 0 (0.0%) |
| $10,000 to $24,999 | 143 (17.7%) | 7 (2.7%) |
| $25,000 to $34,999 | 74 (9.2%) | 6 (2.3%) |
| $35,000 to $49,999 | 55 (6.8%) | 24 (9.2%) |
| $50,000 to $74,999 | 110 (13.6%) | 16 (6.1%) |
| $75,000 to $99,999 | 84 (10.4%) | 6 (2.3%) |
| $100,000 to $149,999 | 92 (11.4%) | 9 (3.5%) |
| $150,000 or more | 211 (26.2%) | 70 (26.8%) |
| Total | 807 (100.0%) | 261 (100.0%) |
Property Value to Household Income Ratio in Hillsboro Beach
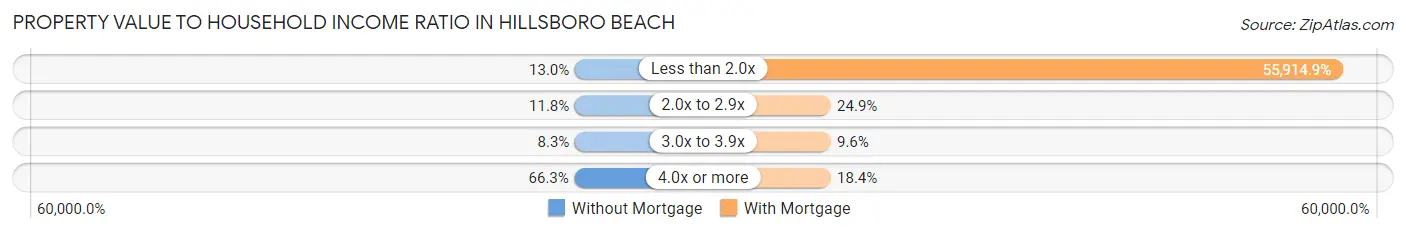
| Value-to-Income Ratio | Without Mortgage | With Mortgage |
| Less than 2.0x | 105 (13.0%) | 145,938 (55,914.9%) |
| 2.0x to 2.9x | 95 (11.8%) | 65 (24.9%) |
| 3.0x to 3.9x | 67 (8.3%) | 25 (9.6%) |
| 4.0x or more | 535 (66.3%) | 48 (18.4%) |
| Total | 807 (100.0%) | 261 (100.0%) |
Real Estate Taxes by Mortgage Status in Hillsboro Beach
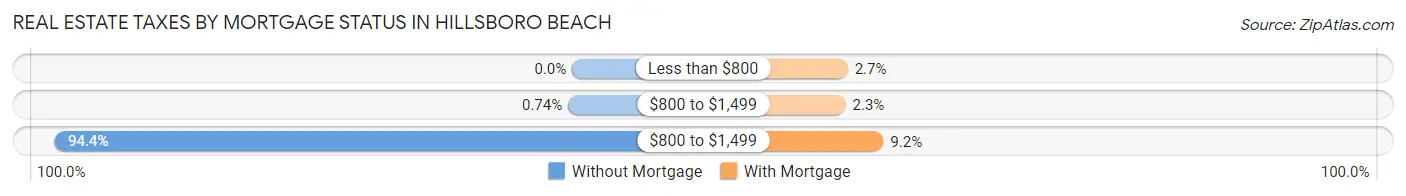
| Property Taxes | Without Mortgage | With Mortgage |
| Less than $800 | 0 (0.0%) | 7 (2.7%) |
| $800 to $1,499 | 6 (0.7%) | 6 (2.3%) |
| $800 to $1,499 | 762 (94.4%) | 24 (9.2%) |
| Total | 807 (100.0%) | 261 (100.0%) |
Health & Disability in Hillsboro Beach
Health Insurance Coverage by Age in Hillsboro Beach
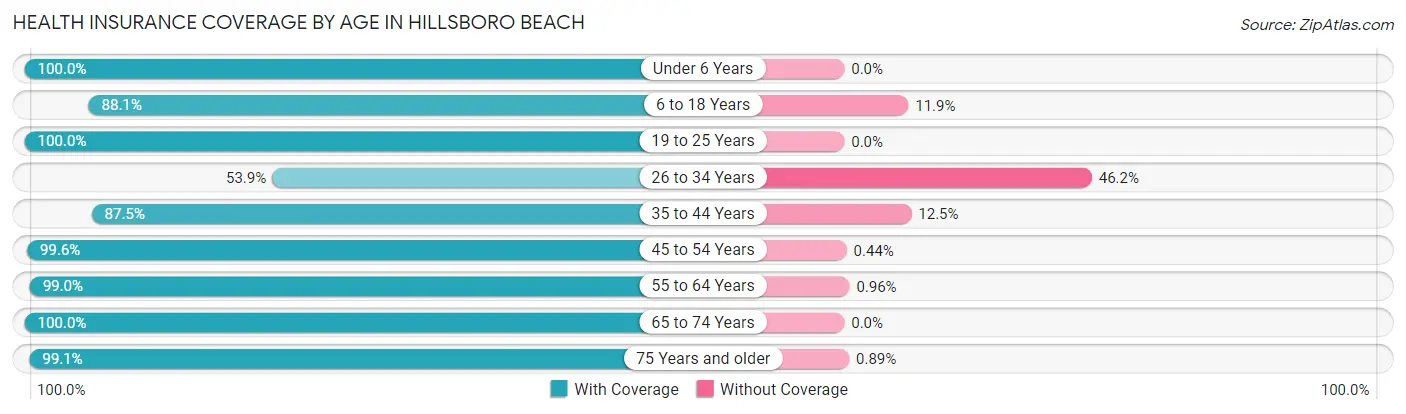
| Age Bracket | With Coverage | Without Coverage |
| Under 6 Years | 30 (100.0%) | 0 (0.0%) |
| 6 to 18 Years | 59 (88.1%) | 8 (11.9%) |
| 19 to 25 Years | 81 (100.0%) | 0 (0.0%) |
| 26 to 34 Years | 21 (53.8%) | 18 (46.2%) |
| 35 to 44 Years | 35 (87.5%) | 5 (12.5%) |
| 45 to 54 Years | 228 (99.6%) | 1 (0.4%) |
| 55 to 64 Years | 517 (99.0%) | 5 (1.0%) |
| 65 to 74 Years | 653 (100.0%) | 0 (0.0%) |
| 75 Years and older | 559 (99.1%) | 5 (0.9%) |
| Total | 2,183 (98.1%) | 42 (1.9%) |
Health Insurance Coverage by Citizenship Status in Hillsboro Beach
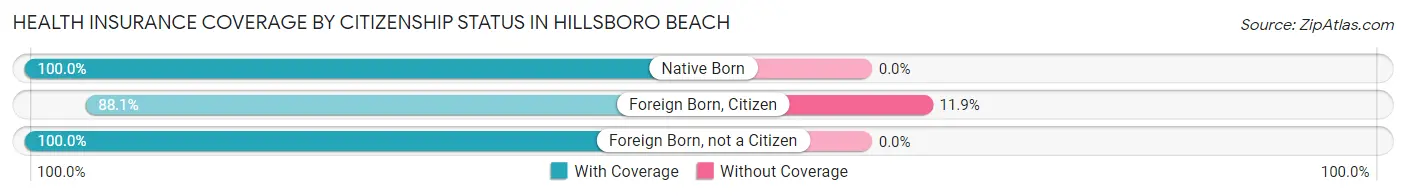
| Citizenship Status | With Coverage | Without Coverage |
| Native Born | 30 (100.0%) | 0 (0.0%) |
| Foreign Born, Citizen | 59 (88.1%) | 8 (11.9%) |
| Foreign Born, not a Citizen | 81 (100.0%) | 0 (0.0%) |
Health Insurance Coverage by Household Income in Hillsboro Beach
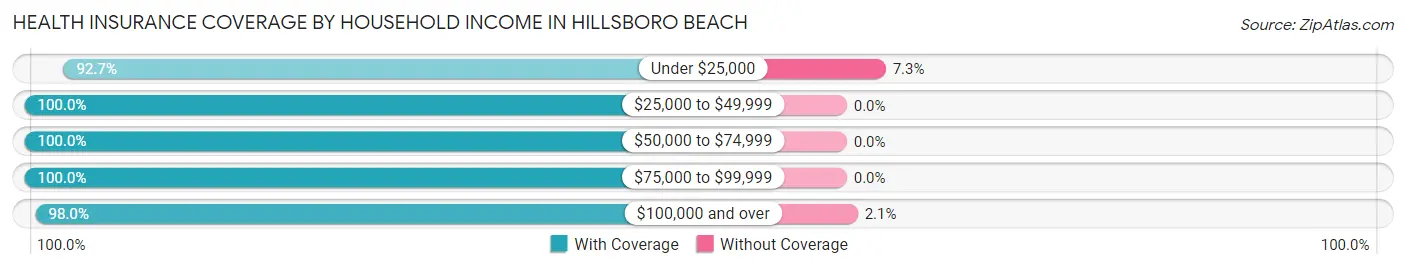
| Household Income | With Coverage | Without Coverage |
| Under $25,000 | 229 (92.7%) | 18 (7.3%) |
| $25,000 to $49,999 | 353 (100.0%) | 0 (0.0%) |
| $50,000 to $74,999 | 224 (100.0%) | 0 (0.0%) |
| $75,000 to $99,999 | 228 (100.0%) | 0 (0.0%) |
| $100,000 and over | 1,149 (98.0%) | 24 (2.1%) |
Public vs Private Health Insurance Coverage by Age in Hillsboro Beach
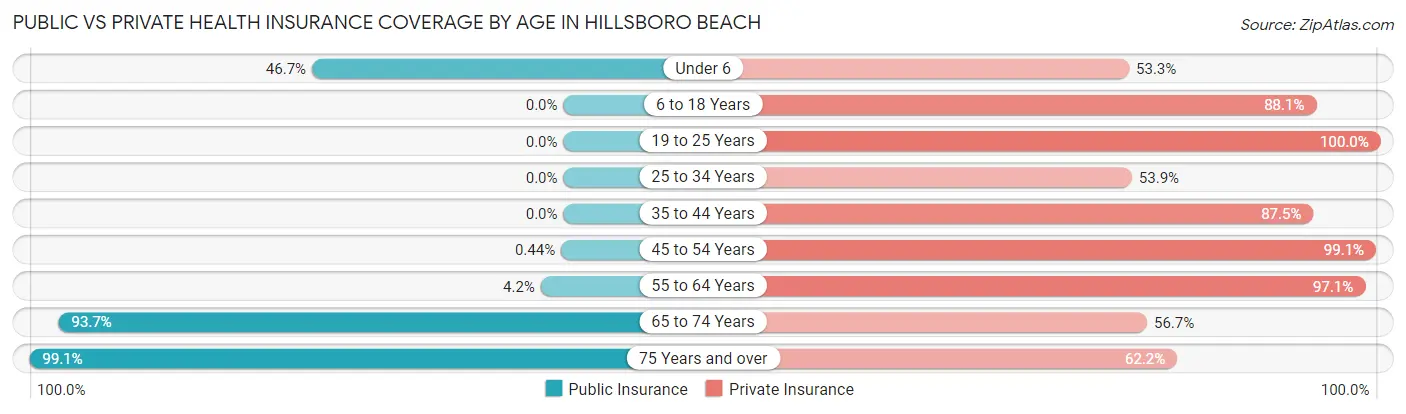
| Age Bracket | Public Insurance | Private Insurance |
| Under 6 | 14 (46.7%) | 16 (53.3%) |
| 6 to 18 Years | 0 (0.0%) | 59 (88.1%) |
| 19 to 25 Years | 0 (0.0%) | 81 (100.0%) |
| 25 to 34 Years | 0 (0.0%) | 21 (53.8%) |
| 35 to 44 Years | 0 (0.0%) | 35 (87.5%) |
| 45 to 54 Years | 1 (0.4%) | 227 (99.1%) |
| 55 to 64 Years | 22 (4.2%) | 507 (97.1%) |
| 65 to 74 Years | 612 (93.7%) | 370 (56.7%) |
| 75 Years and over | 559 (99.1%) | 351 (62.2%) |
| Total | 1,208 (54.3%) | 1,667 (74.9%) |
Disability Status by Sex by Age in Hillsboro Beach
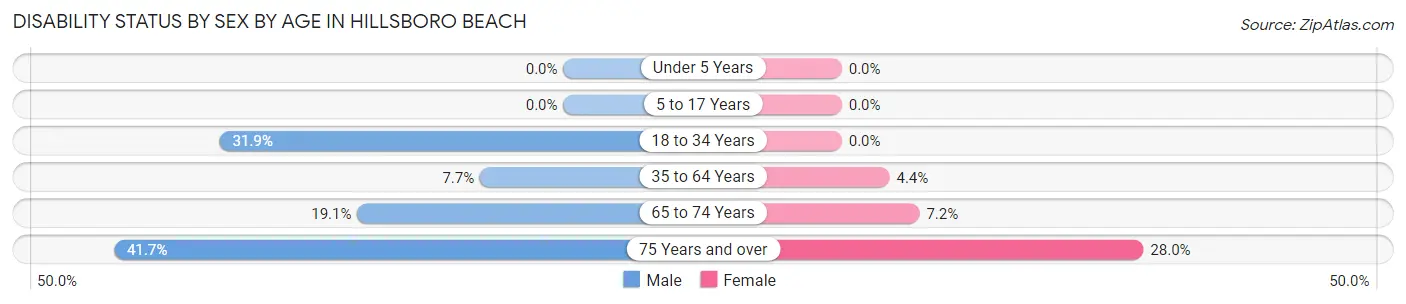
| Age Bracket | Male | Female |
| Under 5 Years | 0 (0.0%) | 0 (0.0%) |
| 5 to 17 Years | 0 (0.0%) | 0 (0.0%) |
| 18 to 34 Years | 15 (31.9%) | 0 (0.0%) |
| 35 to 64 Years | 28 (7.7%) | 19 (4.4%) |
| 65 to 74 Years | 48 (19.1%) | 29 (7.2%) |
| 75 Years and over | 113 (41.7%) | 82 (28.0%) |
Disability Class by Sex by Age in Hillsboro Beach
Disability Class: Hearing Difficulty
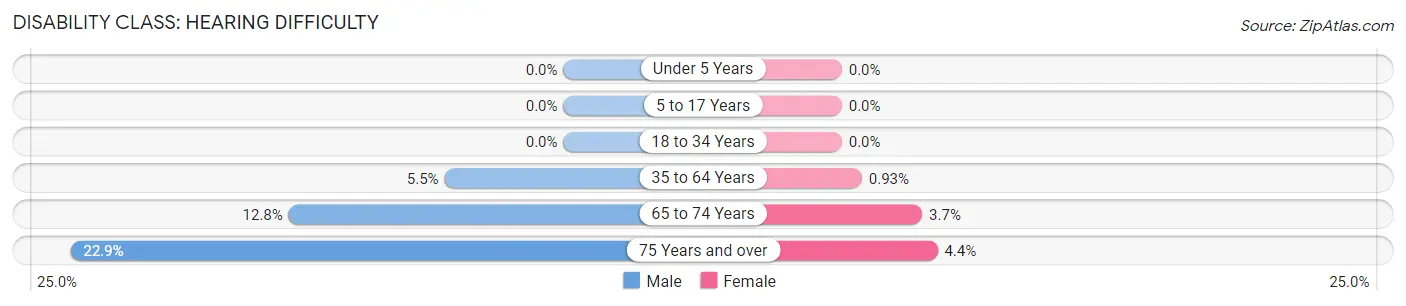
| Age Bracket | Male | Female |
| Under 5 Years | 0 (0.0%) | 0 (0.0%) |
| 5 to 17 Years | 0 (0.0%) | 0 (0.0%) |
| 18 to 34 Years | 0 (0.0%) | 0 (0.0%) |
| 35 to 64 Years | 20 (5.5%) | 4 (0.9%) |
| 65 to 74 Years | 32 (12.8%) | 15 (3.7%) |
| 75 Years and over | 62 (22.9%) | 13 (4.4%) |
Disability Class: Vision Difficulty
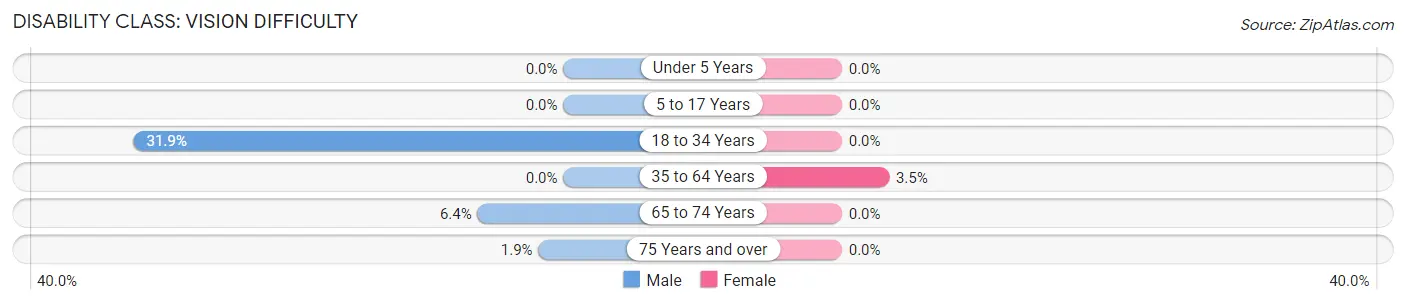
| Age Bracket | Male | Female |
| Under 5 Years | 0 (0.0%) | 0 (0.0%) |
| 5 to 17 Years | 0 (0.0%) | 0 (0.0%) |
| 18 to 34 Years | 15 (31.9%) | 0 (0.0%) |
| 35 to 64 Years | 0 (0.0%) | 15 (3.5%) |
| 65 to 74 Years | 16 (6.4%) | 0 (0.0%) |
| 75 Years and over | 5 (1.8%) | 0 (0.0%) |
Disability Class: Cognitive Difficulty
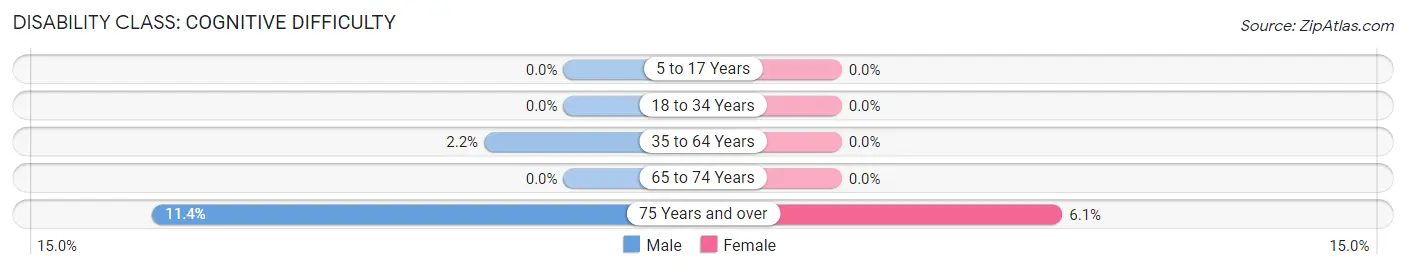
| Age Bracket | Male | Female |
| 5 to 17 Years | 0 (0.0%) | 0 (0.0%) |
| 18 to 34 Years | 0 (0.0%) | 0 (0.0%) |
| 35 to 64 Years | 8 (2.2%) | 0 (0.0%) |
| 65 to 74 Years | 0 (0.0%) | 0 (0.0%) |
| 75 Years and over | 31 (11.4%) | 18 (6.1%) |
Disability Class: Ambulatory Difficulty
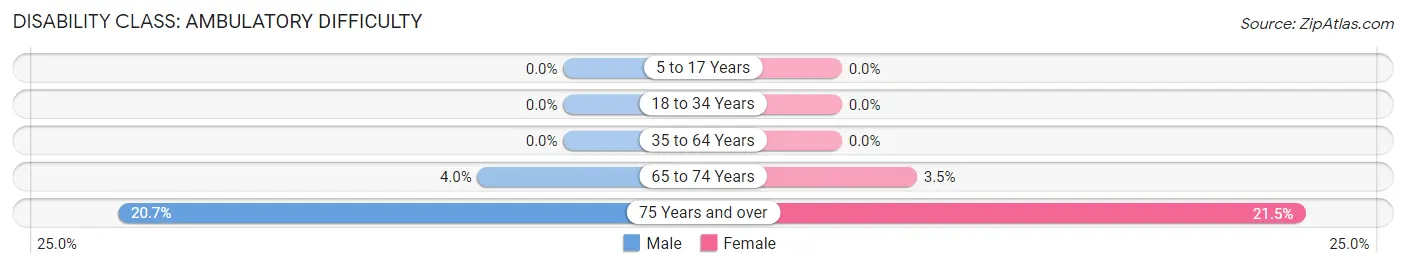
| Age Bracket | Male | Female |
| 5 to 17 Years | 0 (0.0%) | 0 (0.0%) |
| 18 to 34 Years | 0 (0.0%) | 0 (0.0%) |
| 35 to 64 Years | 0 (0.0%) | 0 (0.0%) |
| 65 to 74 Years | 10 (4.0%) | 14 (3.5%) |
| 75 Years and over | 56 (20.7%) | 63 (21.5%) |
Disability Class: Self-Care Difficulty
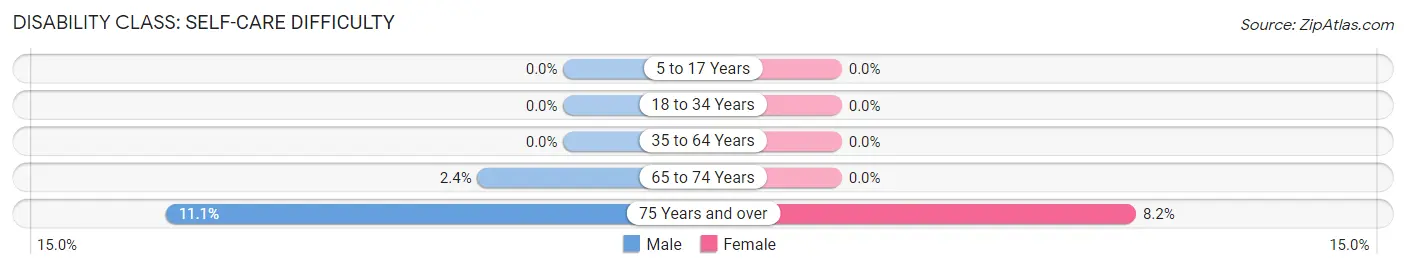
| Age Bracket | Male | Female |
| 5 to 17 Years | 0 (0.0%) | 0 (0.0%) |
| 18 to 34 Years | 0 (0.0%) | 0 (0.0%) |
| 35 to 64 Years | 0 (0.0%) | 0 (0.0%) |
| 65 to 74 Years | 6 (2.4%) | 0 (0.0%) |
| 75 Years and over | 30 (11.1%) | 24 (8.2%) |
Technology Access in Hillsboro Beach
Computing Device Access in Hillsboro Beach
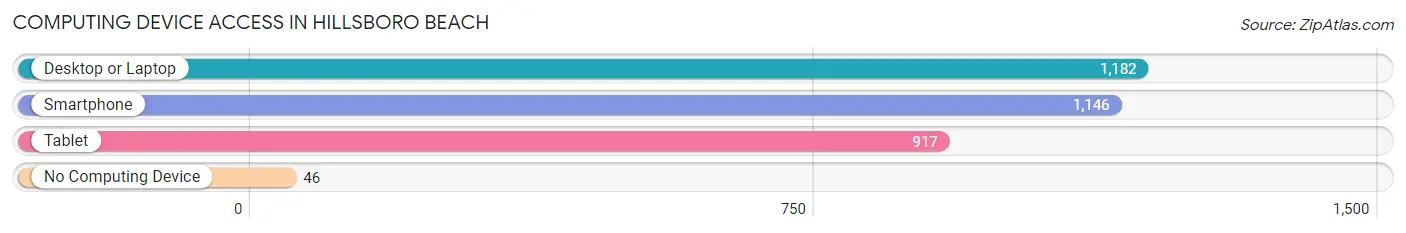
| Device Type | # Households | % Households |
| Desktop or Laptop | 1,182 | 92.8% |
| Smartphone | 1,146 | 90.0% |
| Tablet | 917 | 72.0% |
| No Computing Device | 46 | 3.6% |
| Total | 1,273 | 100.0% |
Internet Access in Hillsboro Beach
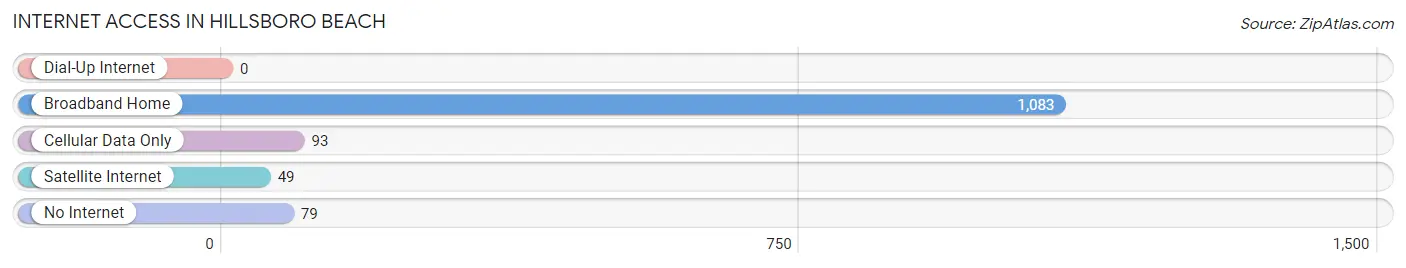
| Internet Type | # Households | % Households |
| Dial-Up Internet | 0 | 0.0% |
| Broadband Home | 1,083 | 85.1% |
| Cellular Data Only | 93 | 7.3% |
| Satellite Internet | 49 | 3.8% |
| No Internet | 79 | 6.2% |
| Total | 1,273 | 100.0% |
Hillsboro Beach Summary
Hillsboro Beach is a town located in Broward County, Florida, United States. It is located on the Atlantic Ocean, just north of Pompano Beach and south of Deerfield Beach. The town is known for its quiet, laid-back atmosphere and its beautiful beaches.
History
Hillsboro Beach was first settled in the late 1800s by a group of settlers from the Bahamas. The settlers named the area “Hillsboro” after the nearby Hillsboro Inlet. The area was mostly used for farming and fishing until the early 1900s when the first hotel was built. The hotel, called the Hillsboro Hotel, was a popular destination for tourists and locals alike.
In the 1920s, the area began to develop as a resort town. The Hillsboro Hotel was expanded and several other hotels were built. The town also began to attract wealthy vacationers from the north. In the 1930s, the town was incorporated as the Town of Hillsboro Beach.
In the 1950s, the town began to develop as a residential community. Several high-rise condominiums were built along the beachfront. The town also began to attract more tourists, and the population began to grow.
In the 1970s, the town began to experience a decline in tourism. The town’s economy shifted to focus more on residential development. In the 1980s, the town began to experience a resurgence in tourism. The town’s population began to grow again, and the town began to attract more visitors.
Geography
Hillsboro Beach is located in southeastern Florida, just north of Pompano Beach and south of Deerfield Beach. The town is located on the Atlantic Ocean and is bordered by the Hillsboro Inlet to the north and the Intracoastal Waterway to the south. The town is approximately 2.5 miles long and 0.5 miles wide.
The town is mostly flat, with an elevation of just 6 feet above sea level. The town is located in a tropical climate, with hot, humid summers and mild, dry winters. The average temperature in the summer is around 85 degrees Fahrenheit, and the average temperature in the winter is around 70 degrees Fahrenheit.
Economy
Hillsboro Beach’s economy is largely based on tourism and real estate. The town is home to several luxury hotels and resorts, as well as a variety of restaurants and shops. The town also has a large number of high-end condominiums and homes.
The town is also home to several marinas, which provide services to boaters and fishermen. The town also has a large fishing fleet, which provides fresh seafood to local restaurants and markets.
Demographics
As of the 2010 census, the population of Hillsboro Beach was 2,813. The population is mostly white (90.2%), with a small percentage of African Americans (3.2%) and Hispanics (2.7%). The median household income is $77,917, and the median home value is $717,000.
The town is home to a large number of retirees, with nearly one-third of the population over the age of 65. The town also has a large number of seasonal residents, with nearly one-third of the population living in the town for less than six months out of the year.
Conclusion
Hillsboro Beach is a small town located in southeastern Florida. The town is known for its quiet, laid-back atmosphere and its beautiful beaches. The town’s economy is largely based on tourism and real estate, and the population is mostly white. The town is home to a large number of retirees and seasonal residents, and is a popular destination for tourists and locals alike.
Common Questions
What is the Total Population of Hillsboro Beach?
Total Population of Hillsboro Beach is 2,225.
What is the Total Male Population of Hillsboro Beach?
Total Male Population of Hillsboro Beach is 971.
What is the Total Female Population of Hillsboro Beach?
Total Female Population of Hillsboro Beach is 1,254.
What is the Ratio of Males per 100 Females in Hillsboro Beach?
There are 77.43 Males per 100 Females in Hillsboro Beach.
What is the Ratio of Females per 100 Males in Hillsboro Beach?
There are 129.15 Females per 100 Males in Hillsboro Beach.
What is the Median Population Age in Hillsboro Beach?
Median Population Age in Hillsboro Beach is 65.9 Years.
What is the Average Family Size in Hillsboro Beach
Average Family Size in Hillsboro Beach is 2.3 People.
What is the Average Household Size in Hillsboro Beach
Average Household Size in Hillsboro Beach is 1.8 People.
What is Per Capita Income in Hillsboro Beach?
Per Capita income in Hillsboro Beach is $92,875.
What is the Median Family Income in Hillsboro Beach?
Median Family Income in Hillsboro Beach is $109,750.
What is the Median Household income in Hillsboro Beach?
Median Household Income in Hillsboro Beach is $86,250.
What is Income or Wage Gap in Hillsboro Beach?
Income or Wage Gap in Hillsboro Beach is 56.8%.
Women in Hillsboro Beach earn 43.2 cents for every dollar earned by a man.
What is Inequality or Gini Index in Hillsboro Beach?
Inequality or Gini Index in Hillsboro Beach is 0.59.
How Large is the Labor Force in Hillsboro Beach?
There are 851 People in the Labor Forcein in Hillsboro Beach.
What is the Percentage of People in the Labor Force in Hillsboro Beach?
40.0% of People are in the Labor Force in Hillsboro Beach.
What is the Unemployment Rate in Hillsboro Beach?
Unemployment Rate in Hillsboro Beach is 6.3%.