Winter Park, FL
Winter Park Map
Winter Park Overview
29,985
TOTAL POPULATION
14,022
MALE POPULATION
15,963
FEMALE POPULATION
87.84
MALES / 100 FEMALES
113.84
FEMALES / 100 MALES
44.3
MEDIAN AGE
2.9
AVG FAMILY SIZE
2.2
AVG HOUSEHOLD SIZE
$75,646
PER CAPITA INCOME
$163,358
AVG FAMILY INCOME
$96,563
AVG HOUSEHOLD INCOME
41.8%
WAGE / INCOME GAP [ % ]
58.2¢/ $1
WAGE / INCOME GAP [ $ ]
$8,229
FAMILY INCOME DEFICIT
0.58
INEQUALITY / GINI INDEX
14,326
LABOR FORCE [ PEOPLE ]
56.1%
PERCENT IN LABOR FORCE
3.9%
UNEMPLOYMENT RATE
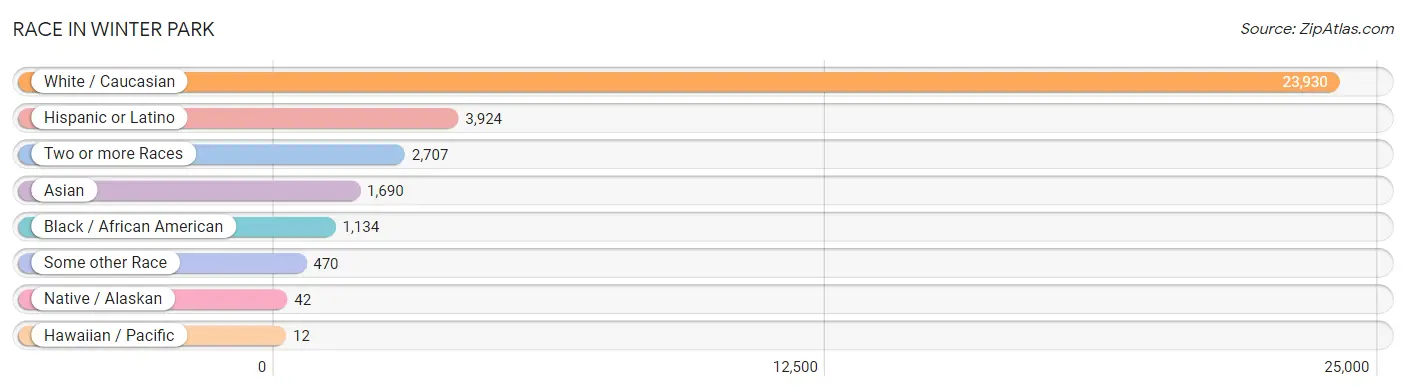
Race in Winter Park
The most populous races in Winter Park are White / Caucasian (23,930 | 79.8%), Hispanic or Latino (3,924 | 13.1%), and Two or more Races (2,707 | 9.0%).
| Race | # Population | % Population |
| Asian | 1,690 | 5.6% |
| Black / African American | 1,134 | 3.8% |
| Hawaiian / Pacific | 12 | 0.0% |
| Hispanic or Latino | 3,924 | 13.1% |
| Native / Alaskan | 42 | 0.1% |
| White / Caucasian | 23,930 | 79.8% |
| Two or more Races | 2,707 | 9.0% |
| Some other Race | 470 | 1.6% |
| Total | 29,985 | 100.0% |
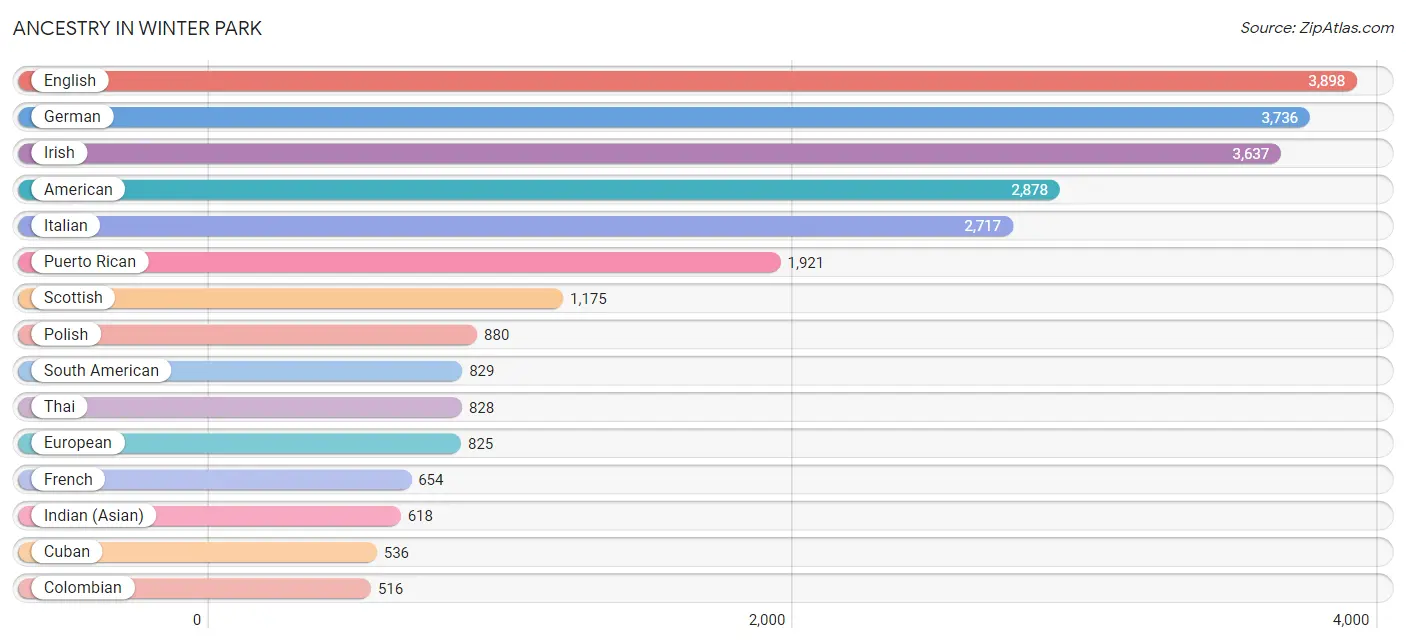
Ancestry in Winter Park
The most populous ancestries reported in Winter Park are English (3,898 | 13.0%), German (3,736 | 12.5%), Irish (3,637 | 12.1%), American (2,878 | 9.6%), and Italian (2,717 | 9.1%), together accounting for 56.2% of all Winter Park residents.
| Ancestry | # Population | % Population |
| African | 55 | 0.2% |
| Albanian | 38 | 0.1% |
| American | 2,878 | 9.6% |
| Arab | 313 | 1.0% |
| Argentinean | 142 | 0.5% |
| Armenian | 35 | 0.1% |
| Australian | 11 | 0.0% |
| Austrian | 109 | 0.4% |
| Belgian | 32 | 0.1% |
| Bhutanese | 33 | 0.1% |
| Blackfeet | 75 | 0.3% |
| Brazilian | 200 | 0.7% |
| British | 366 | 1.2% |
| Burmese | 103 | 0.3% |
| Canadian | 75 | 0.3% |
| Celtic | 16 | 0.1% |
| Central American | 137 | 0.5% |
| Cherokee | 98 | 0.3% |
| Chilean | 7 | 0.0% |
| Chinese | 17 | 0.1% |
| Colombian | 516 | 1.7% |
| Costa Rican | 51 | 0.2% |
| Creek | 7 | 0.0% |
| Croatian | 28 | 0.1% |
| Cuban | 536 | 1.8% |
| Czech | 126 | 0.4% |
| Czechoslovakian | 24 | 0.1% |
| Danish | 124 | 0.4% |
| Dominican | 18 | 0.1% |
| Dutch | 303 | 1.0% |
| Eastern European | 279 | 0.9% |
| Ecuadorian | 8 | 0.0% |
| Egyptian | 155 | 0.5% |
| English | 3,898 | 13.0% |
| European | 825 | 2.8% |
| Filipino | 39 | 0.1% |
| Finnish | 9 | 0.0% |
| French | 654 | 2.2% |
| French Canadian | 81 | 0.3% |
| German | 3,736 | 12.5% |
| Ghanaian | 7 | 0.0% |
| Greek | 224 | 0.7% |
| Hungarian | 123 | 0.4% |
| Icelander | 6 | 0.0% |
| Indian (Asian) | 618 | 2.1% |
| Iranian | 96 | 0.3% |
| Irish | 3,637 | 12.1% |
| Israeli | 10 | 0.0% |
| Italian | 2,717 | 9.1% |
| Jamaican | 42 | 0.1% |
| Korean | 159 | 0.5% |
| Lebanese | 120 | 0.4% |
| Lithuanian | 272 | 0.9% |
| Macedonian | 7 | 0.0% |
| Maltese | 12 | 0.0% |
| Mexican | 210 | 0.7% |
| Nicaraguan | 24 | 0.1% |
| Northern European | 130 | 0.4% |
| Norwegian | 316 | 1.1% |
| Okinawan | 15 | 0.1% |
| Pakistani | 11 | 0.0% |
| Pennsylvania German | 18 | 0.1% |
| Peruvian | 60 | 0.2% |
| Polish | 880 | 2.9% |
| Portuguese | 207 | 0.7% |
| Puerto Rican | 1,921 | 6.4% |
| Romanian | 60 | 0.2% |
| Russian | 197 | 0.7% |
| Salvadoran | 62 | 0.2% |
| Samoan | 8 | 0.0% |
| Scandinavian | 57 | 0.2% |
| Scotch-Irish | 294 | 1.0% |
| Scottish | 1,175 | 3.9% |
| Serbian | 27 | 0.1% |
| Slavic | 16 | 0.1% |
| Slovak | 120 | 0.4% |
| Slovene | 8 | 0.0% |
| South American | 829 | 2.8% |
| Spaniard | 45 | 0.2% |
| Spanish | 60 | 0.2% |
| Sri Lankan | 97 | 0.3% |
| Subsaharan African | 62 | 0.2% |
| Swedish | 325 | 1.1% |
| Swiss | 75 | 0.3% |
| Syrian | 23 | 0.1% |
| Thai | 828 | 2.8% |
| Tongan | 12 | 0.0% |
| Trinidadian and Tobagonian | 9 | 0.0% |
| Turkish | 33 | 0.1% |
| U.S. Virgin Islander | 4 | 0.0% |
| Ukrainian | 111 | 0.4% |
| Uruguayan | 3 | 0.0% |
| Venezuelan | 93 | 0.3% |
| Welsh | 169 | 0.6% |
| West Indian | 51 | 0.2% | View All 95 Rows |
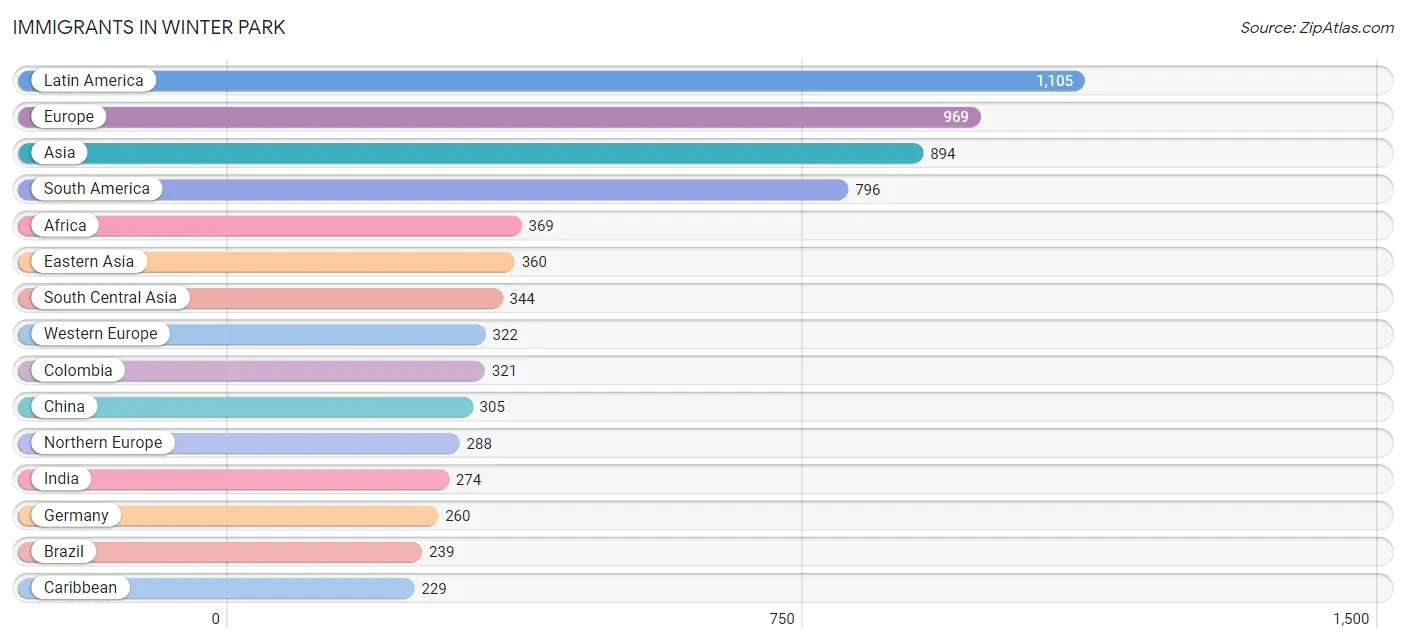
Immigrants in Winter Park
The most numerous immigrant groups reported in Winter Park came from Latin America (1,105 | 3.7%), Europe (969 | 3.2%), Asia (894 | 3.0%), South America (796 | 2.6%), and Africa (369 | 1.2%), together accounting for 13.8% of all Winter Park residents.
| Immigration Origin | # Population | % Population |
| Afghanistan | 8 | 0.0% |
| Africa | 369 | 1.2% |
| Albania | 10 | 0.0% |
| Argentina | 70 | 0.2% |
| Asia | 894 | 3.0% |
| Australia | 7 | 0.0% |
| Austria | 6 | 0.0% |
| Brazil | 239 | 0.8% |
| Canada | 164 | 0.5% |
| Caribbean | 229 | 0.8% |
| Central America | 80 | 0.3% |
| Chile | 30 | 0.1% |
| China | 305 | 1.0% |
| Colombia | 321 | 1.1% |
| Costa Rica | 51 | 0.2% |
| Cuba | 108 | 0.4% |
| Dominican Republic | 29 | 0.1% |
| Eastern Africa | 184 | 0.6% |
| Eastern Asia | 360 | 1.2% |
| Eastern Europe | 196 | 0.6% |
| Ecuador | 29 | 0.1% |
| Egypt | 87 | 0.3% |
| England | 119 | 0.4% |
| Europe | 969 | 3.2% |
| France | 38 | 0.1% |
| Germany | 260 | 0.9% |
| Ghana | 7 | 0.0% |
| Greece | 13 | 0.0% |
| Hong Kong | 24 | 0.1% |
| India | 274 | 0.9% |
| Iran | 62 | 0.2% |
| Ireland | 29 | 0.1% |
| Israel | 4 | 0.0% |
| Italy | 150 | 0.5% |
| Jamaica | 54 | 0.2% |
| Japan | 7 | 0.0% |
| Kenya | 180 | 0.6% |
| Korea | 48 | 0.2% |
| Latin America | 1,105 | 3.7% |
| Lebanon | 52 | 0.2% |
| Lithuania | 60 | 0.2% |
| Mexico | 13 | 0.0% |
| Netherlands | 12 | 0.0% |
| Nicaragua | 16 | 0.1% |
| Northern Africa | 151 | 0.5% |
| Northern Europe | 288 | 1.0% |
| Oceania | 25 | 0.1% |
| Peru | 60 | 0.2% |
| Philippines | 44 | 0.2% |
| Poland | 22 | 0.1% |
| Romania | 48 | 0.2% |
| Russia | 36 | 0.1% |
| Saudi Arabia | 23 | 0.1% |
| South Africa | 27 | 0.1% |
| South America | 796 | 2.6% |
| South Central Asia | 344 | 1.1% |
| South Eastern Asia | 83 | 0.3% |
| Southern Europe | 163 | 0.5% |
| Sudan | 64 | 0.2% |
| Switzerland | 6 | 0.0% |
| Taiwan | 8 | 0.0% |
| Thailand | 5 | 0.0% |
| Trinidad and Tobago | 30 | 0.1% |
| Turkey | 13 | 0.0% |
| Uganda | 4 | 0.0% |
| Ukraine | 13 | 0.0% |
| Uruguay | 3 | 0.0% |
| Venezuela | 44 | 0.2% |
| Vietnam | 34 | 0.1% |
| Western Africa | 7 | 0.0% |
| Western Asia | 107 | 0.4% |
| Western Europe | 322 | 1.1% | View All 72 Rows |
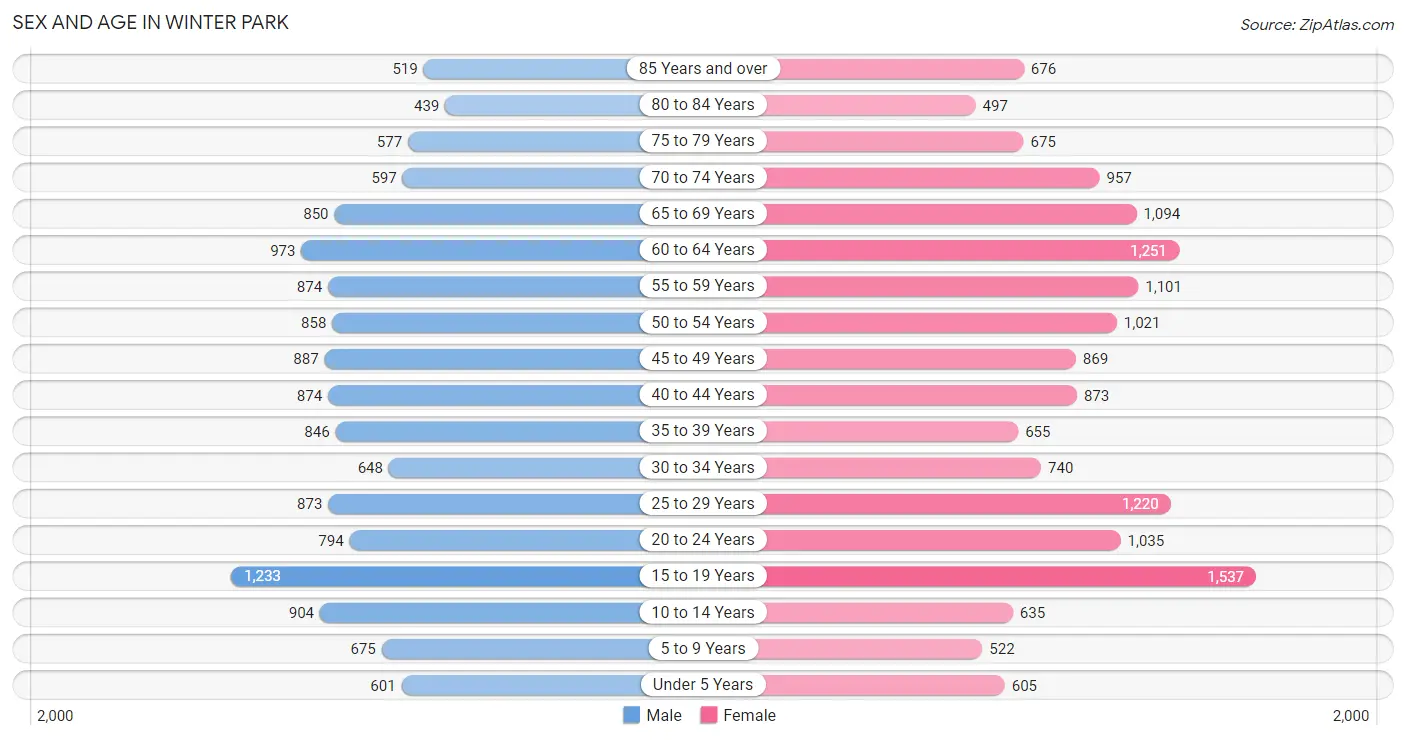
Sex and Age in Winter Park
Sex and Age in Winter Park
The most populous age groups in Winter Park are 15 to 19 Years (1,233 | 8.8%) for men and 15 to 19 Years (1,537 | 9.6%) for women.
| Age Bracket | Male | Female |
| Under 5 Years | 601 (4.3%) | 605 (3.8%) |
| 5 to 9 Years | 675 (4.8%) | 522 (3.3%) |
| 10 to 14 Years | 904 (6.5%) | 635 (4.0%) |
| 15 to 19 Years | 1,233 (8.8%) | 1,537 (9.6%) |
| 20 to 24 Years | 794 (5.7%) | 1,035 (6.5%) |
| 25 to 29 Years | 873 (6.2%) | 1,220 (7.6%) |
| 30 to 34 Years | 648 (4.6%) | 740 (4.6%) |
| 35 to 39 Years | 846 (6.0%) | 655 (4.1%) |
| 40 to 44 Years | 874 (6.2%) | 873 (5.5%) |
| 45 to 49 Years | 887 (6.3%) | 869 (5.4%) |
| 50 to 54 Years | 858 (6.1%) | 1,021 (6.4%) |
| 55 to 59 Years | 874 (6.2%) | 1,101 (6.9%) |
| 60 to 64 Years | 973 (6.9%) | 1,251 (7.8%) |
| 65 to 69 Years | 850 (6.1%) | 1,094 (6.9%) |
| 70 to 74 Years | 597 (4.3%) | 957 (6.0%) |
| 75 to 79 Years | 577 (4.1%) | 675 (4.2%) |
| 80 to 84 Years | 439 (3.1%) | 497 (3.1%) |
| 85 Years and over | 519 (3.7%) | 676 (4.2%) |
| Total | 14,022 (100.0%) | 15,963 (100.0%) |
Families and Households in Winter Park
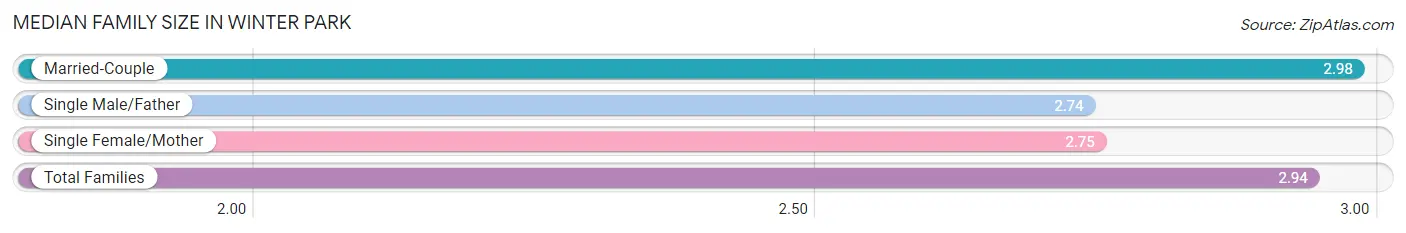
Median Family Size in Winter Park
The median family size in Winter Park is 2.94 persons per family, with married-couple families (5,506 | 81.5%) accounting for the largest median family size of 2.98 persons per family. On the other hand, single male/father families (382 | 5.7%) represent the smallest median family size with 2.74 persons per family.
| Family Type | # Families | Family Size |
| Married-Couple | 5,506 (81.5%) | 2.98 |
| Single Male/Father | 382 (5.7%) | 2.74 |
| Single Female/Mother | 871 (12.9%) | 2.75 |
| Total Families | 6,759 (100.0%) | 2.94 |
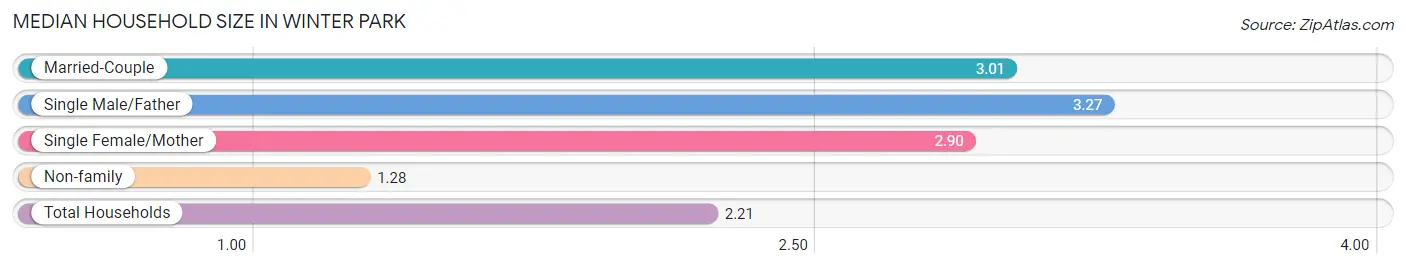
Median Household Size in Winter Park
The median household size in Winter Park is 2.21 persons per household, with single male/father households (382 | 3.0%) accounting for the largest median household size of 3.27 persons per household. non-family households (5,853 | 46.4%) represent the smallest median household size with 1.28 persons per household.
| Household Type | # Households | Household Size |
| Married-Couple | 5,506 (43.7%) | 3.01 |
| Single Male/Father | 382 (3.0%) | 3.27 |
| Single Female/Mother | 871 (6.9%) | 2.90 |
| Non-family | 5,853 (46.4%) | 1.28 |
| Total Households | 12,612 (100.0%) | 2.21 |
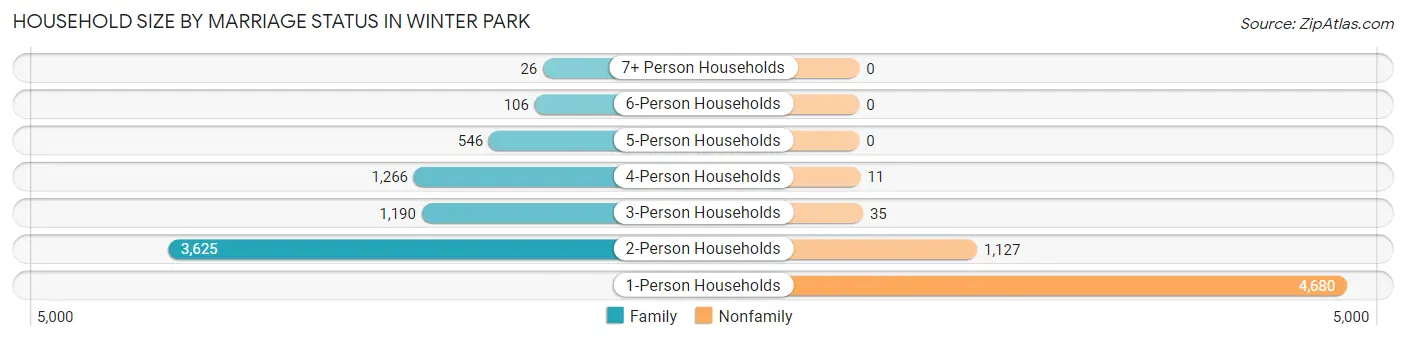
Household Size by Marriage Status in Winter Park
Out of a total of 12,612 households in Winter Park, 6,759 (53.6%) are family households, while 5,853 (46.4%) are nonfamily households. The most numerous type of family households are 2-person households, comprising 3,625, and the most common type of nonfamily households are 1-person households, comprising 4,680.
| Household Size | Family Households | Nonfamily Households |
| 1-Person Households | - | 4,680 (37.1%) |
| 2-Person Households | 3,625 (28.7%) | 1,127 (8.9%) |
| 3-Person Households | 1,190 (9.4%) | 35 (0.3%) |
| 4-Person Households | 1,266 (10.0%) | 11 (0.1%) |
| 5-Person Households | 546 (4.3%) | 0 (0.0%) |
| 6-Person Households | 106 (0.8%) | 0 (0.0%) |
| 7+ Person Households | 26 (0.2%) | 0 (0.0%) |
| Total | 6,759 (53.6%) | 5,853 (46.4%) |
Female Fertility in Winter Park
Fertility by Age in Winter Park
Average fertility rate in Winter Park is 49.0 births per 1,000 women. Women in the age bracket of 35 to 50 years have the highest fertility rate with 79.0 births per 1,000 women. Women in the age bracket of 35 to 50 years acount for 58.3% of all women with births.
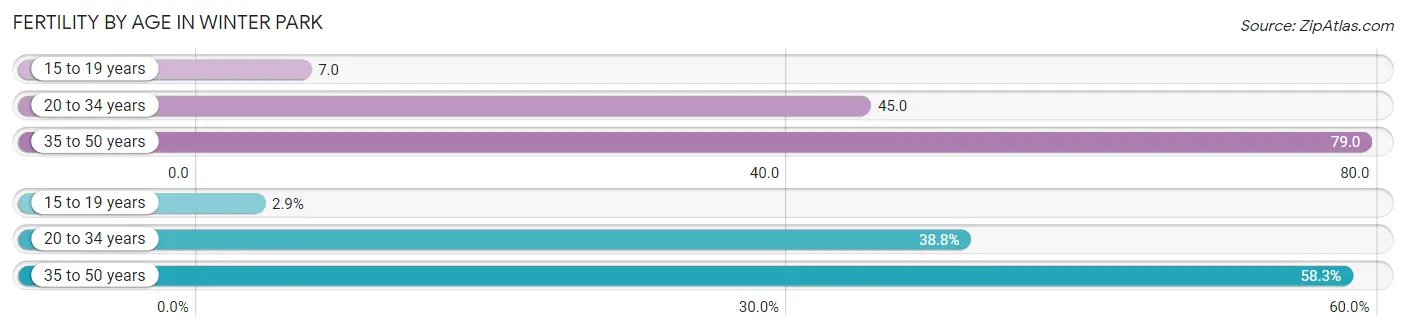
| Age Bracket | Women with Births | Births / 1,000 Women |
| 15 to 19 years | 10 (2.9%) | 7.0 |
| 20 to 34 years | 134 (38.8%) | 45.0 |
| 35 to 50 years | 201 (58.3%) | 79.0 |
| Total | 345 (100.0%) | 49.0 |
Fertility by Age by Marriage Status in Winter Park
70.1% of women with births (345) in Winter Park are married. The highest percentage of unmarried women with births falls into 15 to 19 years age bracket with 100.0% of them unmarried at the time of birth, while the lowest percentage of unmarried women with births belong to 20 to 34 years age bracket with 24.6% of them unmarried.
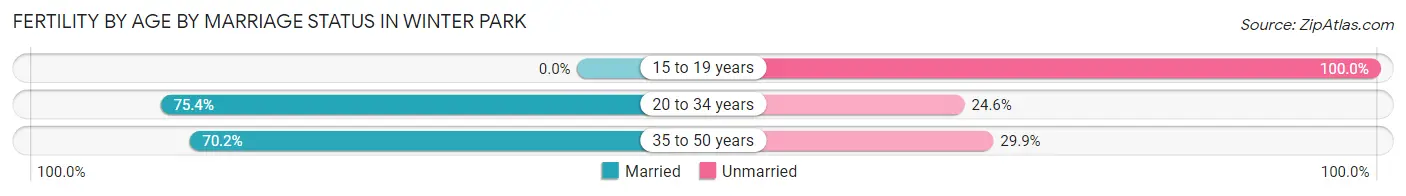
| Age Bracket | Married | Unmarried |
| 15 to 19 years | 0 (0.0%) | 10 (100.0%) |
| 20 to 34 years | 101 (75.4%) | 33 (24.6%) |
| 35 to 50 years | 141 (70.2%) | 60 (29.8%) |
| Total | 242 (70.1%) | 103 (29.9%) |
Fertility by Education in Winter Park
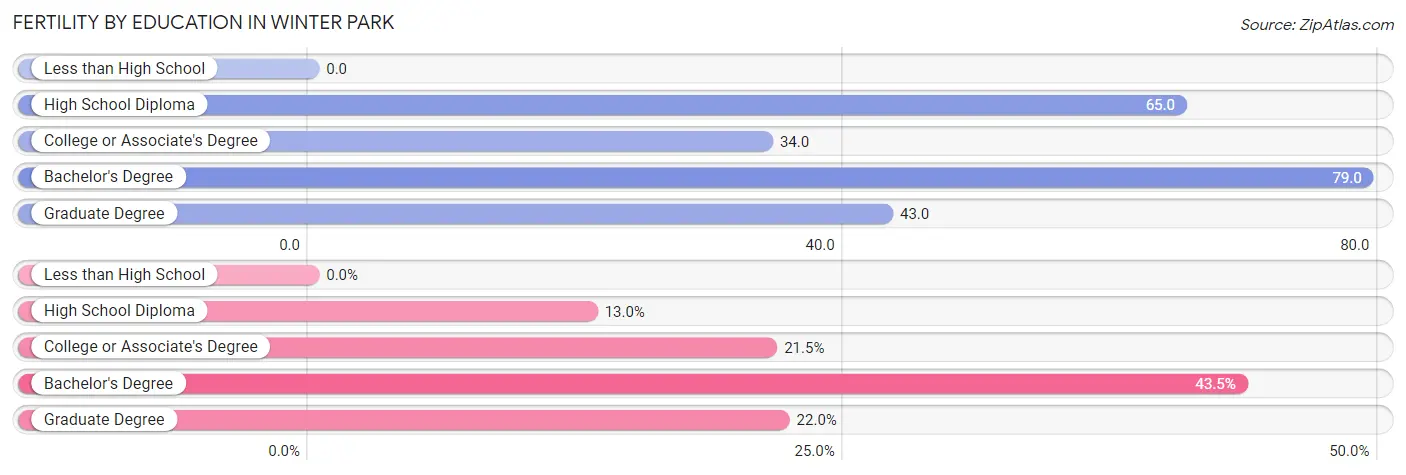
| Educational Attainment | Women with Births | Births / 1,000 Women |
| Less than High School | 0 (0.0%) | 0.0 |
| High School Diploma | 45 (13.0%) | 65.0 |
| College or Associate's Degree | 74 (21.4%) | 34.0 |
| Bachelor's Degree | 150 (43.5%) | 79.0 |
| Graduate Degree | 76 (22.0%) | 43.0 |
| Total | 345 (100.0%) | 49.0 |
Fertility by Education by Marriage Status in Winter Park
29.9% of women with births in Winter Park are unmarried. Women with the educational attainment of graduate degree are most likely to be married with 100.0% of them married at childbirth, while women with the educational attainment of college or associate's degree are least likely to be married with 100.0% of them unmarried at childbirth.
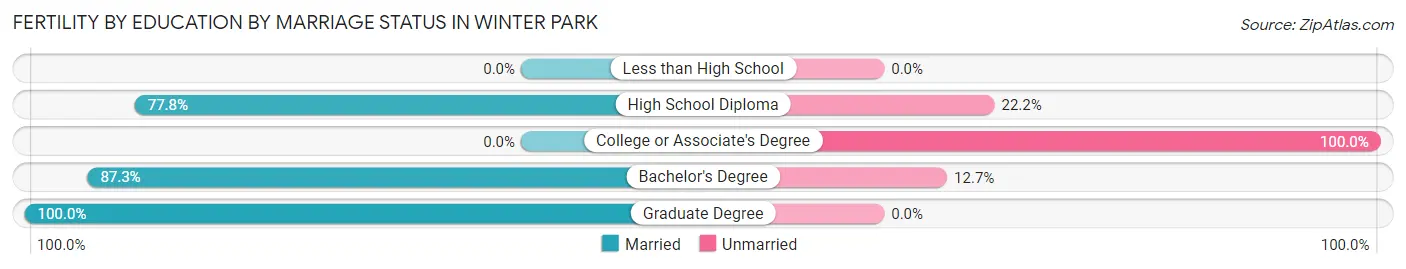
| Educational Attainment | Married | Unmarried |
| Less than High School | 0 (0.0%) | 0 (0.0%) |
| High School Diploma | 35 (77.8%) | 10 (22.2%) |
| College or Associate's Degree | 0 (0.0%) | 74 (100.0%) |
| Bachelor's Degree | 131 (87.3%) | 19 (12.7%) |
| Graduate Degree | 76 (100.0%) | 0 (0.0%) |
| Total | 242 (70.1%) | 103 (29.9%) |
Income in Winter Park
Income Overview in Winter Park
Per Capita Income in Winter Park is $75,646, while median incomes of families and households are $163,358 and $96,563 respectively.
| Characteristic | Number | Measure |
| Per Capita Income | 29,985 | $75,646 |
| Median Family Income | 6,759 | $163,358 |
| Mean Family Income | 6,759 | $255,487 |
| Median Household Income | 12,612 | $96,563 |
| Mean Household Income | 12,612 | $174,972 |
| Income Deficit | 6,759 | $8,229 |
| Wage / Income Gap (%) | 29,985 | 41.80% |
| Wage / Income Gap ($) | 29,985 | 58.20¢ per $1 |
| Gini / Inequality Index | 29,985 | 0.58 |
Earnings by Sex in Winter Park
Average Earnings in Winter Park are $61,409, $81,618 for men and $47,500 for women, a difference of 41.8%.
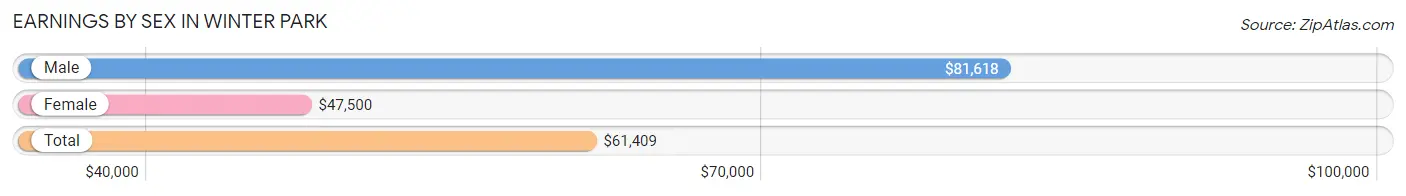
| Sex | Number | Average Earnings |
| Male | 7,723 (52.0%) | $81,618 |
| Female | 7,140 (48.0%) | $47,500 |
| Total | 14,863 (100.0%) | $61,409 |
Earnings by Sex by Income Bracket in Winter Park
The most common earnings brackets in Winter Park are $100,000+ for men (3,235 | 41.9%) and $100,000+ for women (1,412 | 19.8%).
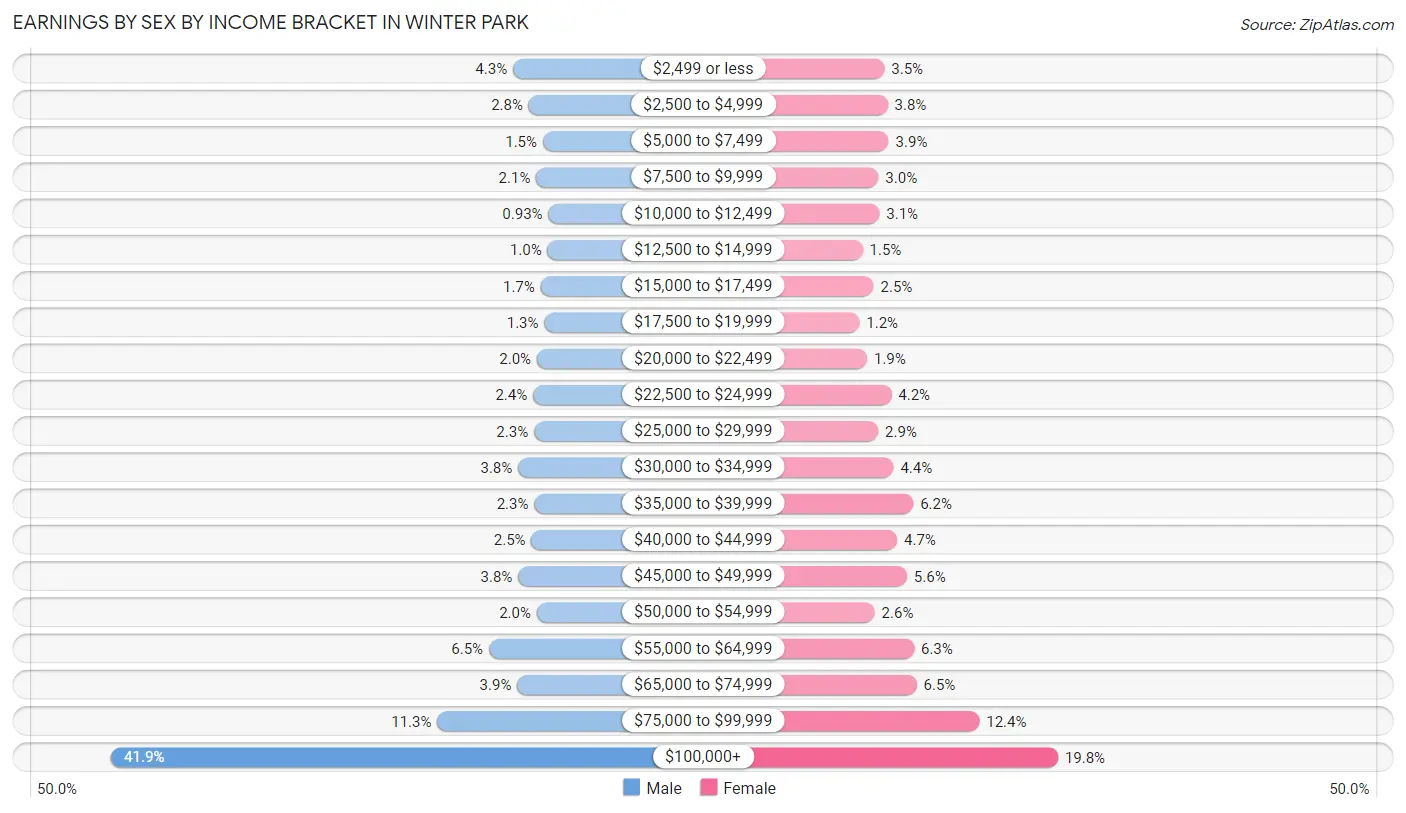
| Income | Male | Female |
| $2,499 or less | 328 (4.3%) | 251 (3.5%) |
| $2,500 to $4,999 | 214 (2.8%) | 273 (3.8%) |
| $5,000 to $7,499 | 112 (1.5%) | 280 (3.9%) |
| $7,500 to $9,999 | 160 (2.1%) | 211 (3.0%) |
| $10,000 to $12,499 | 72 (0.9%) | 218 (3.0%) |
| $12,500 to $14,999 | 78 (1.0%) | 106 (1.5%) |
| $15,000 to $17,499 | 128 (1.7%) | 179 (2.5%) |
| $17,500 to $19,999 | 101 (1.3%) | 84 (1.2%) |
| $20,000 to $22,499 | 155 (2.0%) | 135 (1.9%) |
| $22,500 to $24,999 | 183 (2.4%) | 298 (4.2%) |
| $25,000 to $29,999 | 176 (2.3%) | 210 (2.9%) |
| $30,000 to $34,999 | 291 (3.8%) | 312 (4.4%) |
| $35,000 to $39,999 | 174 (2.2%) | 444 (6.2%) |
| $40,000 to $44,999 | 195 (2.5%) | 336 (4.7%) |
| $45,000 to $49,999 | 290 (3.8%) | 402 (5.6%) |
| $50,000 to $54,999 | 156 (2.0%) | 186 (2.6%) |
| $55,000 to $64,999 | 502 (6.5%) | 450 (6.3%) |
| $65,000 to $74,999 | 297 (3.8%) | 467 (6.5%) |
| $75,000 to $99,999 | 876 (11.3%) | 886 (12.4%) |
| $100,000+ | 3,235 (41.9%) | 1,412 (19.8%) |
| Total | 7,723 (100.0%) | 7,140 (100.0%) |
Earnings by Sex by Educational Attainment in Winter Park
Average earnings in Winter Park are $91,090 for men and $53,287 for women, a difference of 41.5%. Men with an educational attainment of graduate degree enjoy the highest average annual earnings of $154,053, while those with less than high school education earn the least with $33,396. Women with an educational attainment of graduate degree earn the most with the average annual earnings of $82,015, while those with less than high school education have the smallest earnings of $33,365.
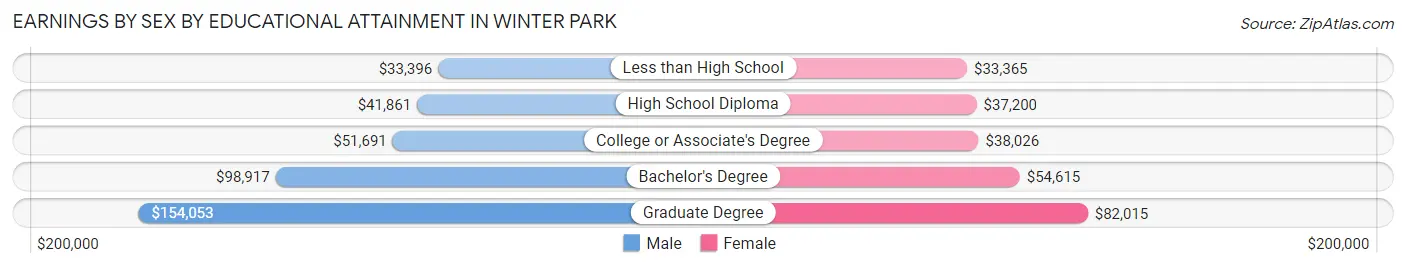
| Educational Attainment | Male Income | Female Income |
| Less than High School | $33,396 | $33,365 |
| High School Diploma | $41,861 | $37,200 |
| College or Associate's Degree | $51,691 | $38,026 |
| Bachelor's Degree | $98,917 | $54,615 |
| Graduate Degree | $154,053 | $82,015 |
| Total | $91,090 | $53,287 |
Family Income in Winter Park
Family Income Brackets in Winter Park
According to the Winter Park family income data, there are 2,744 families falling into the $200,000+ income range, which is the most common income bracket and makes up 40.6% of all families. Conversely, the $10,000 to $14,999 income bracket is the least frequent group with only 27 families (0.4%) belonging to this category.
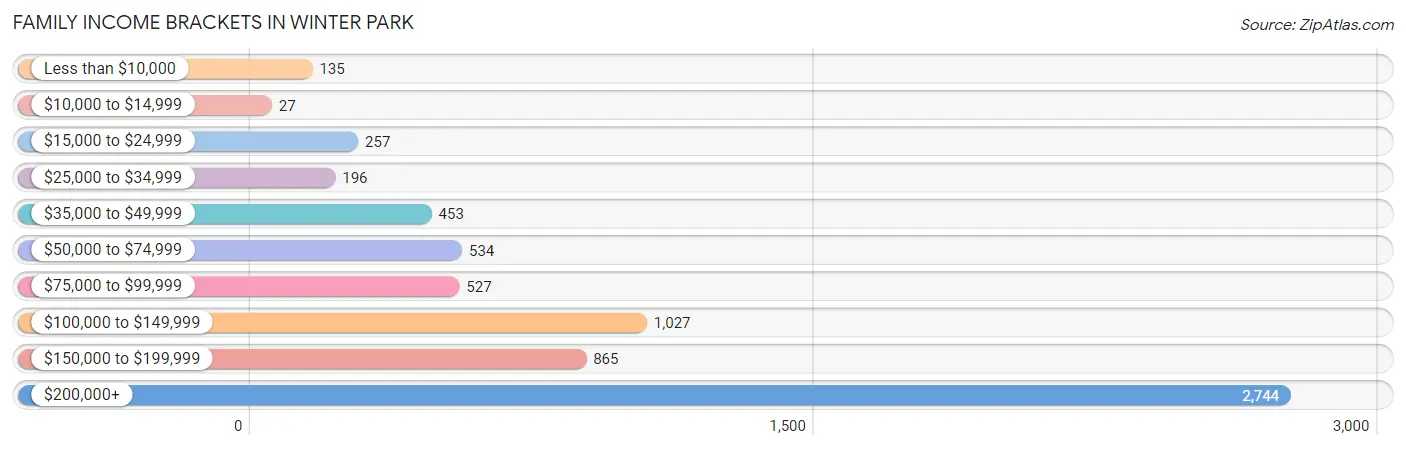
| Income Bracket | # Families | % Families |
| Less than $10,000 | 135 | 2.0% |
| $10,000 to $14,999 | 27 | 0.4% |
| $15,000 to $24,999 | 257 | 3.8% |
| $25,000 to $34,999 | 196 | 2.9% |
| $35,000 to $49,999 | 453 | 6.7% |
| $50,000 to $74,999 | 534 | 7.9% |
| $75,000 to $99,999 | 527 | 7.8% |
| $100,000 to $149,999 | 1,027 | 15.2% |
| $150,000 to $199,999 | 865 | 12.8% |
| $200,000+ | 2,744 | 40.6% |
Family Income by Famaliy Size in Winter Park
4-person families (1,186 | 17.5%) account for the highest median family income in Winter Park with $234,833 per family, while 2-person families (3,743 | 55.4%) have the highest median income of $70,748 per family member.
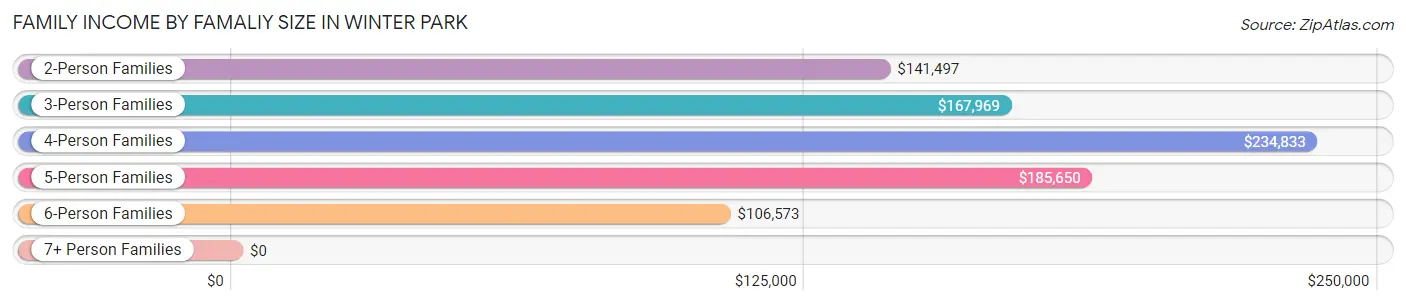
| Income Bracket | # Families | Median Income |
| 2-Person Families | 3,743 (55.4%) | $141,497 |
| 3-Person Families | 1,237 (18.3%) | $167,969 |
| 4-Person Families | 1,186 (17.5%) | $234,833 |
| 5-Person Families | 461 (6.8%) | $185,650 |
| 6-Person Families | 111 (1.6%) | $106,573 |
| 7+ Person Families | 21 (0.3%) | $0 |
| Total | 6,759 (100.0%) | $163,358 |
Family Income by Number of Earners in Winter Park
The median family income in Winter Park is $163,358, with families comprising 2 earners (2,917) having the highest median family income of $191,168, while families with no earners (1,059) have the lowest median family income of $94,145, accounting for 43.2% and 15.7% of families, respectively.
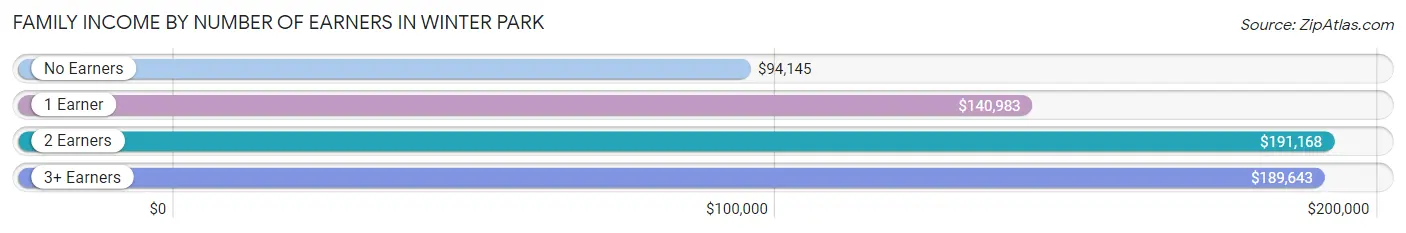
| Number of Earners | # Families | Median Income |
| No Earners | 1,059 (15.7%) | $94,145 |
| 1 Earner | 2,427 (35.9%) | $140,983 |
| 2 Earners | 2,917 (43.2%) | $191,168 |
| 3+ Earners | 356 (5.3%) | $189,643 |
| Total | 6,759 (100.0%) | $163,358 |
Household Income in Winter Park
Household Income Brackets in Winter Park
With 3,115 households falling in the category, the $200,000+ income range is the most frequent in Winter Park, accounting for 24.7% of all households. In contrast, only 366 households (2.9%) fall into the $10,000 to $14,999 income bracket, making it the least populous group.
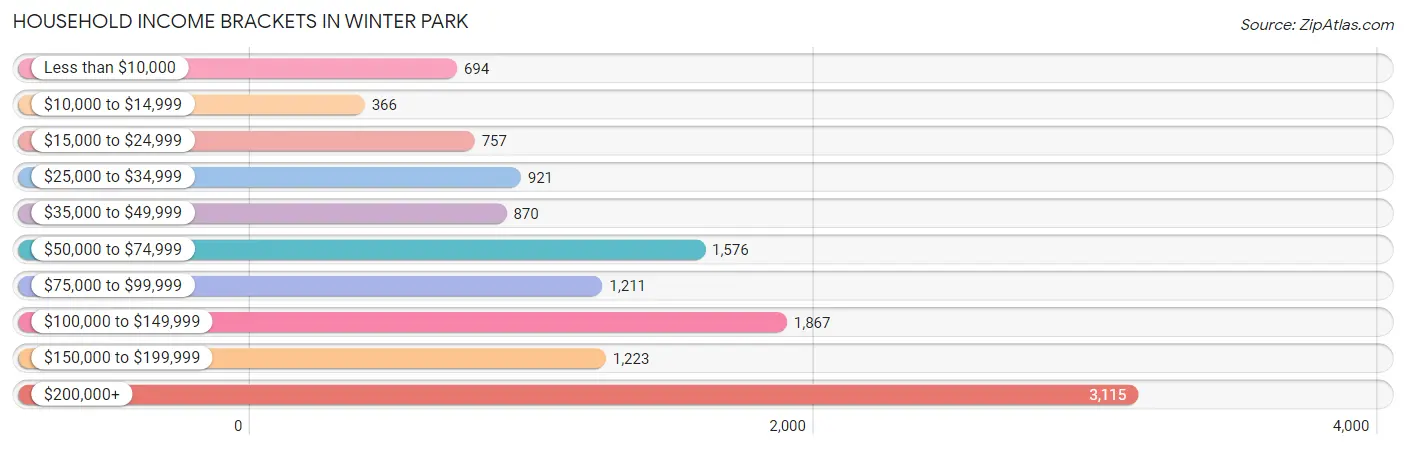
| Income Bracket | # Households | % Households |
| Less than $10,000 | 694 | 5.5% |
| $10,000 to $14,999 | 366 | 2.9% |
| $15,000 to $24,999 | 757 | 6.0% |
| $25,000 to $34,999 | 921 | 7.3% |
| $35,000 to $49,999 | 870 | 6.9% |
| $50,000 to $74,999 | 1,576 | 12.5% |
| $75,000 to $99,999 | 1,211 | 9.6% |
| $100,000 to $149,999 | 1,867 | 14.8% |
| $150,000 to $199,999 | 1,223 | 9.7% |
| $200,000+ | 3,115 | 24.7% |
Household Income by Householder Age in Winter Park
The median household income in Winter Park is $96,563, with the highest median household income of $140,101 found in the 45 to 64 years age bracket for the primary householder. A total of 4,477 households (35.5%) fall into this category. Meanwhile, the 15 to 24 years age bracket for the primary householder has the lowest median household income of $0, with 400 households (3.2%) in this group.
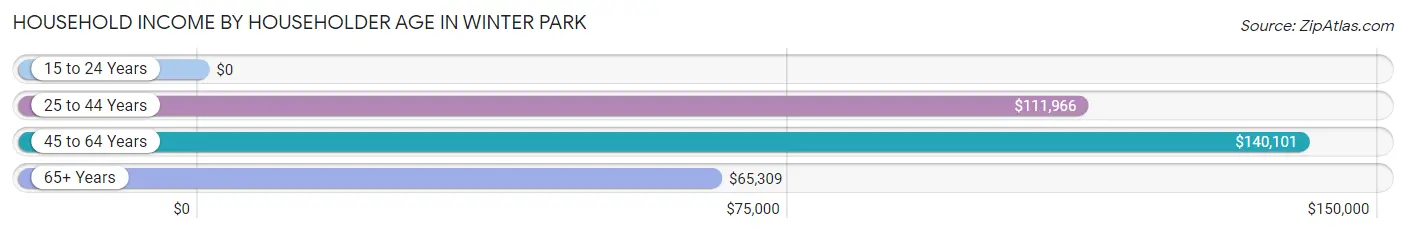
| Income Bracket | # Households | Median Income |
| 15 to 24 Years | 400 (3.2%) | $0 |
| 25 to 44 Years | 3,322 (26.3%) | $111,966 |
| 45 to 64 Years | 4,477 (35.5%) | $140,101 |
| 65+ Years | 4,413 (35.0%) | $65,309 |
| Total | 12,612 (100.0%) | $96,563 |
Poverty in Winter Park
Income Below Poverty by Sex and Age in Winter Park
With 6.5% poverty level for males and 10.5% for females among the residents of Winter Park, 12 to 14 year old males and 15 year old females are the most vulnerable to poverty, with 91 males (18.1%) and 95 females (33.0%) in their respective age groups living below the poverty level.

| Age Bracket | Male | Female |
| Under 5 Years | 36 (6.0%) | 66 (10.9%) |
| 5 Years | 0 (0.0%) | 26 (27.1%) |
| 6 to 11 Years | 12 (1.3%) | 43 (6.2%) |
| 12 to 14 Years | 91 (18.1%) | 0 (0.0%) |
| 15 Years | 6 (2.8%) | 95 (33.0%) |
| 16 and 17 Years | 23 (5.3%) | 0 (0.0%) |
| 18 to 24 Years | 113 (15.5%) | 313 (30.2%) |
| 25 to 34 Years | 65 (4.3%) | 81 (4.1%) |
| 35 to 44 Years | 120 (7.0%) | 195 (12.8%) |
| 45 to 54 Years | 134 (7.7%) | 50 (2.6%) |
| 55 to 64 Years | 83 (4.5%) | 214 (9.2%) |
| 65 to 74 Years | 87 (6.2%) | 196 (9.7%) |
| 75 Years and over | 93 (6.5%) | 255 (15.3%) |
| Total | 863 (6.5%) | 1,534 (10.5%) |
Income Above Poverty by Sex and Age in Winter Park
According to the poverty statistics in Winter Park, males aged 5 years and females aged 12 to 14 years are the age groups that are most secure financially, with 100.0% of males and 100.0% of females in these age groups living above the poverty line.
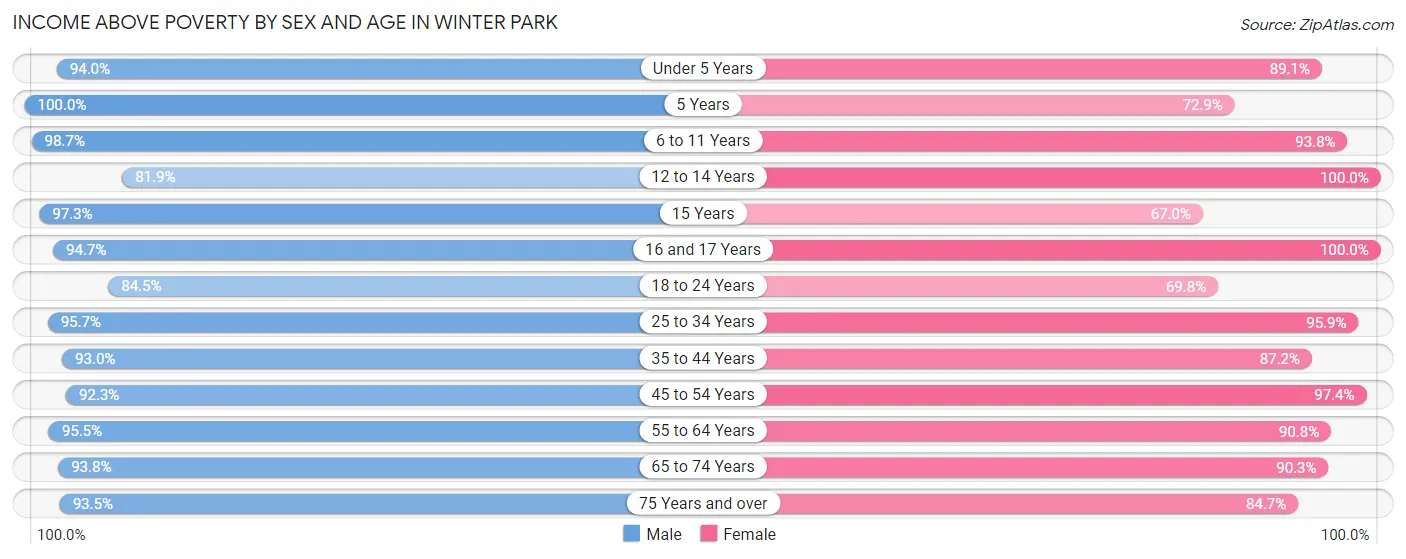
| Age Bracket | Male | Female |
| Under 5 Years | 565 (94.0%) | 539 (89.1%) |
| 5 Years | 134 (100.0%) | 70 (72.9%) |
| 6 to 11 Years | 919 (98.7%) | 655 (93.8%) |
| 12 to 14 Years | 411 (81.9%) | 322 (100.0%) |
| 15 Years | 212 (97.3%) | 193 (67.0%) |
| 16 and 17 Years | 411 (94.7%) | 222 (100.0%) |
| 18 to 24 Years | 614 (84.5%) | 724 (69.8%) |
| 25 to 34 Years | 1,450 (95.7%) | 1,879 (95.9%) |
| 35 to 44 Years | 1,600 (93.0%) | 1,333 (87.2%) |
| 45 to 54 Years | 1,611 (92.3%) | 1,840 (97.4%) |
| 55 to 64 Years | 1,759 (95.5%) | 2,114 (90.8%) |
| 65 to 74 Years | 1,304 (93.8%) | 1,827 (90.3%) |
| 75 Years and over | 1,334 (93.5%) | 1,411 (84.7%) |
| Total | 12,324 (93.5%) | 13,129 (89.5%) |
Income Below Poverty Among Married-Couple Families in Winter Park
The poverty statistics for married-couple families in Winter Park show that 2.2% or 123 of the total 5,506 families live below the poverty line. Families with no children have the highest poverty rate of 2.6%, comprising of 92 families. On the other hand, families with 5 or more children have the lowest poverty rate of 0.0%, which includes 0 families.
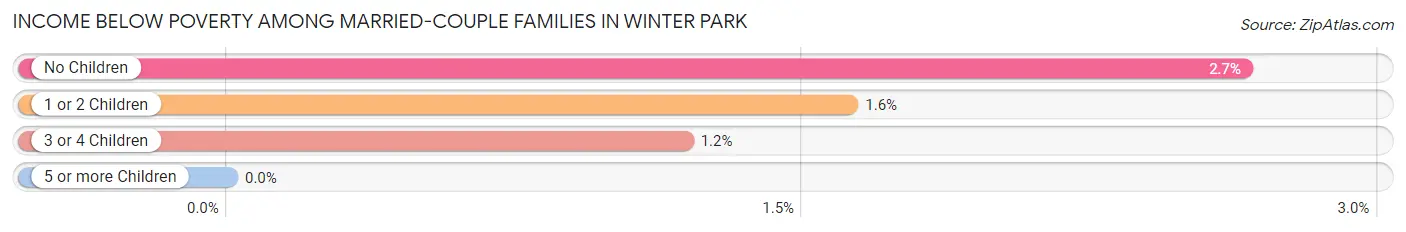
| Children | Above Poverty | Below Poverty |
| No Children | 3,385 (97.4%) | 92 (2.6%) |
| 1 or 2 Children | 1,644 (98.4%) | 27 (1.6%) |
| 3 or 4 Children | 333 (98.8%) | 4 (1.2%) |
| 5 or more Children | 21 (100.0%) | 0 (0.0%) |
| Total | 5,383 (97.8%) | 123 (2.2%) |
Income Below Poverty Among Single-Parent Households in Winter Park
According to the poverty data in Winter Park, 39.3% or 150 single-father households and 6.4% or 56 single-mother households are living below the poverty line. Among single-father households, those with 5 or more children have the highest poverty rate, with 5 households (100.0%) experiencing poverty. Likewise, among single-mother households, those with 1 or 2 children have the highest poverty rate, with 36 households (11.1%) falling below the poverty line.
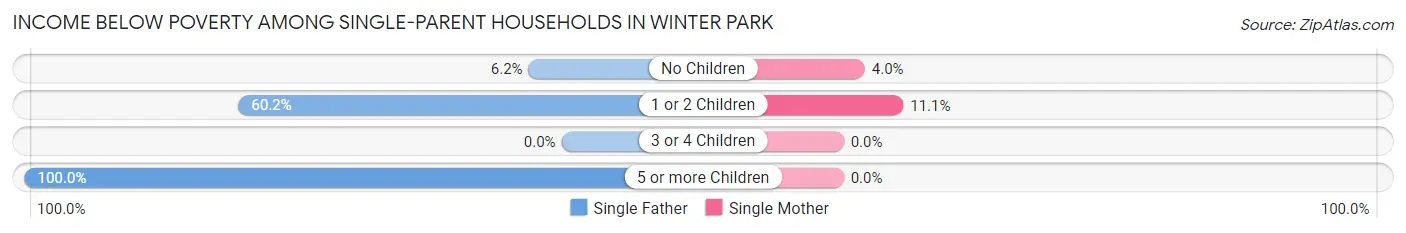
| Children | Single Father | Single Mother |
| No Children | 9 (6.2%) | 20 (4.0%) |
| 1 or 2 Children | 136 (60.2%) | 36 (11.1%) |
| 3 or 4 Children | 0 (0.0%) | 0 (0.0%) |
| 5 or more Children | 5 (100.0%) | 0 (0.0%) |
| Total | 150 (39.3%) | 56 (6.4%) |
Income Below Poverty Among Married-Couple vs Single-Parent Households in Winter Park
The poverty data for Winter Park shows that 123 of the married-couple family households (2.2%) and 206 of the single-parent households (16.4%) are living below the poverty level. Within the married-couple family households, those with no children have the highest poverty rate, with 92 households (2.6%) falling below the poverty line. Among the single-parent households, those with 5 or more children have the highest poverty rate, with 5 household (100.0%) living below poverty.
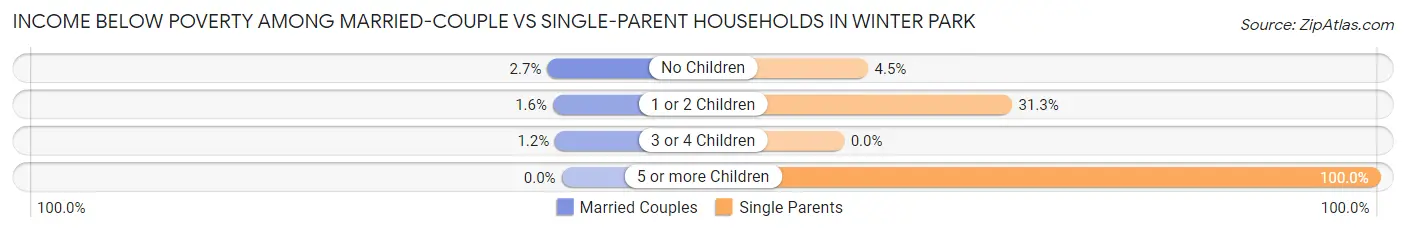
| Children | Married-Couple Families | Single-Parent Households |
| No Children | 92 (2.6%) | 29 (4.4%) |
| 1 or 2 Children | 27 (1.6%) | 172 (31.3%) |
| 3 or 4 Children | 4 (1.2%) | 0 (0.0%) |
| 5 or more Children | 0 (0.0%) | 5 (100.0%) |
| Total | 123 (2.2%) | 206 (16.4%) |
Employment Characteristics in Winter Park
Employment by Class of Employer in Winter Park
Among the 13,647 employed individuals in Winter Park, private company employees (8,609 | 63.1%), self-employed (incorporated) (1,422 | 10.4%), and not-for-profit organizations (1,196 | 8.8%) make up the most common classes of employment.
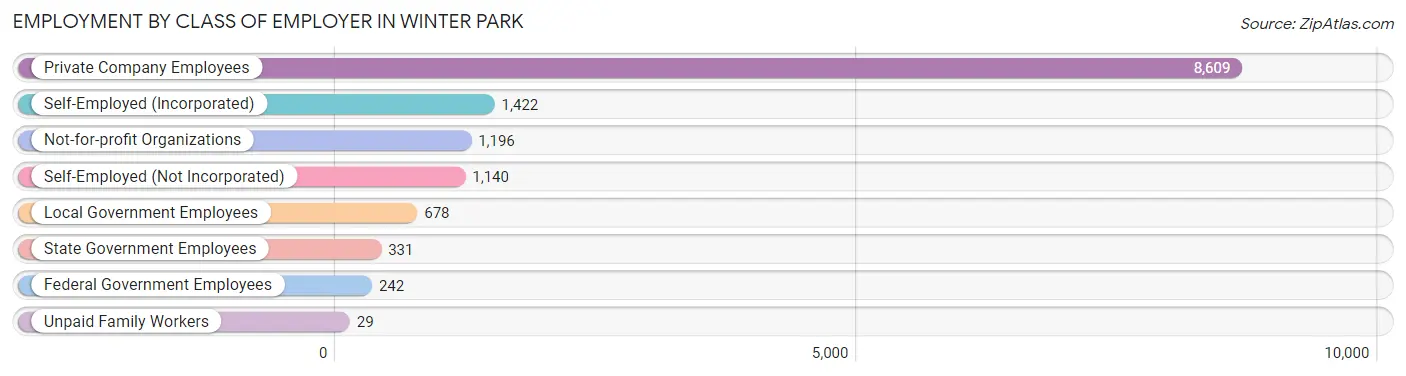
| Employer Class | # Employees | % Employees |
| Private Company Employees | 8,609 | 63.1% |
| Self-Employed (Incorporated) | 1,422 | 10.4% |
| Self-Employed (Not Incorporated) | 1,140 | 8.4% |
| Not-for-profit Organizations | 1,196 | 8.8% |
| Local Government Employees | 678 | 5.0% |
| State Government Employees | 331 | 2.4% |
| Federal Government Employees | 242 | 1.8% |
| Unpaid Family Workers | 29 | 0.2% |
| Total | 13,647 | 100.0% |
Employment Status by Age in Winter Park
According to the labor force statistics for Winter Park, out of the total population over 16 years of age (25,537), 56.1% or 14,326 individuals are in the labor force, with 3.9% or 559 of them unemployed. The age group with the highest labor force participation rate is 25 to 29 years, with 91.9% or 1,923 individuals in the labor force. Within the labor force, the 16 to 19 years age range has the highest percentage of unemployed individuals, with 20.7% or 62 of them being unemployed.
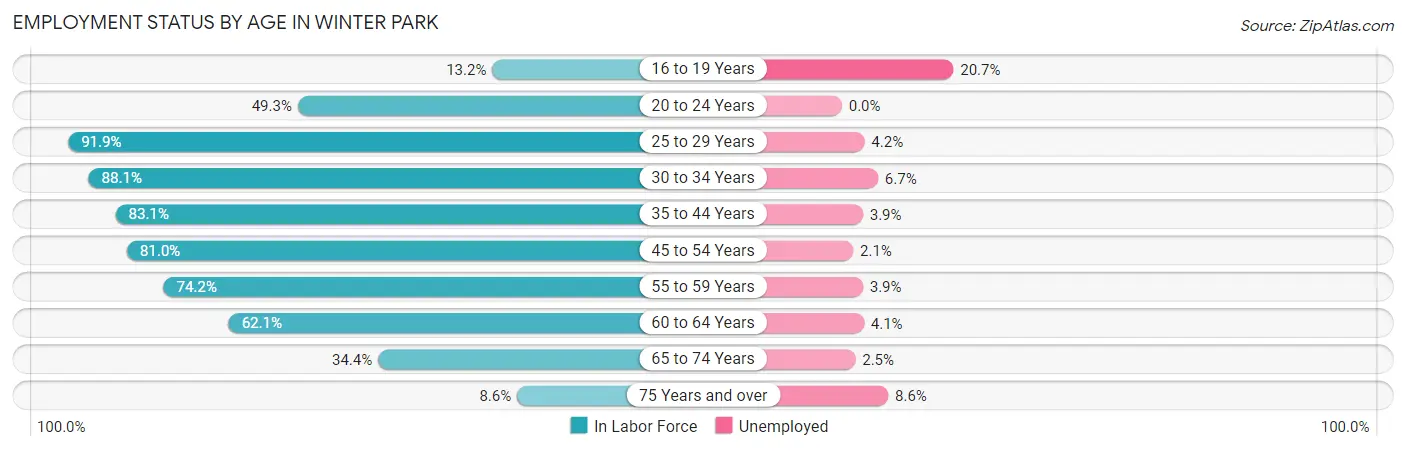
| Age Bracket | In Labor Force | Unemployed |
| 16 to 19 Years | 299 (13.2%) | 62 (20.7%) |
| 20 to 24 Years | 902 (49.3%) | 0 (0.0%) |
| 25 to 29 Years | 1,923 (91.9%) | 81 (4.2%) |
| 30 to 34 Years | 1,223 (88.1%) | 82 (6.7%) |
| 35 to 44 Years | 2,699 (83.1%) | 105 (3.9%) |
| 45 to 54 Years | 2,944 (81.0%) | 62 (2.1%) |
| 55 to 59 Years | 1,465 (74.2%) | 57 (3.9%) |
| 60 to 64 Years | 1,381 (62.1%) | 57 (4.1%) |
| 65 to 74 Years | 1,203 (34.4%) | 30 (2.5%) |
| 75 Years and over | 291 (8.6%) | 25 (8.6%) |
| Total | 14,326 (56.1%) | 559 (3.9%) |
Employment Status by Educational Attainment in Winter Park
According to labor force statistics for Winter Park, 79.9% of individuals (11,636) out of the total population between 25 and 64 years of age (14,563) are in the labor force, with 3.8% or 442 of them being unemployed. The group with the highest labor force participation rate are those with the educational attainment of college / associate degree, with 82.3% or 2,123 individuals in the labor force. Within the labor force, individuals with high school diploma education have the highest percentage of unemployment, with 7.9% or 85 of them being unemployed.
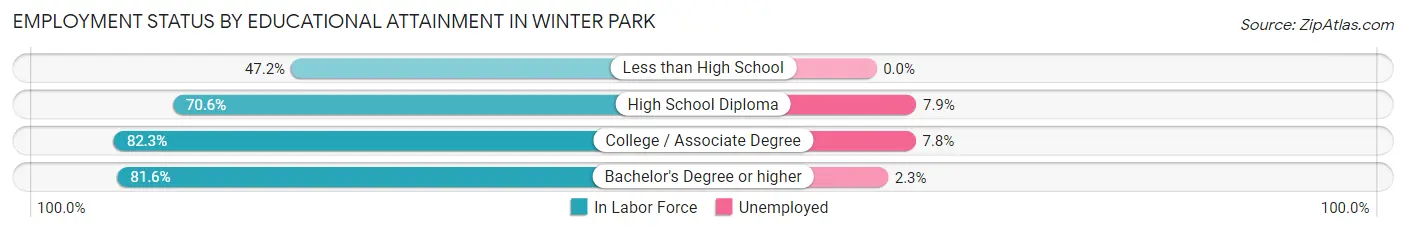
| Educational Attainment | In Labor Force | Unemployed |
| Less than High School | 134 (47.2%) | 0 (0.0%) |
| High School Diploma | 1,077 (70.6%) | 121 (7.9%) |
| College / Associate Degree | 2,123 (82.3%) | 201 (7.8%) |
| Bachelor's Degree or higher | 8,302 (81.6%) | 234 (2.3%) |
| Total | 11,636 (79.9%) | 553 (3.8%) |
Employment Occupations by Sex in Winter Park
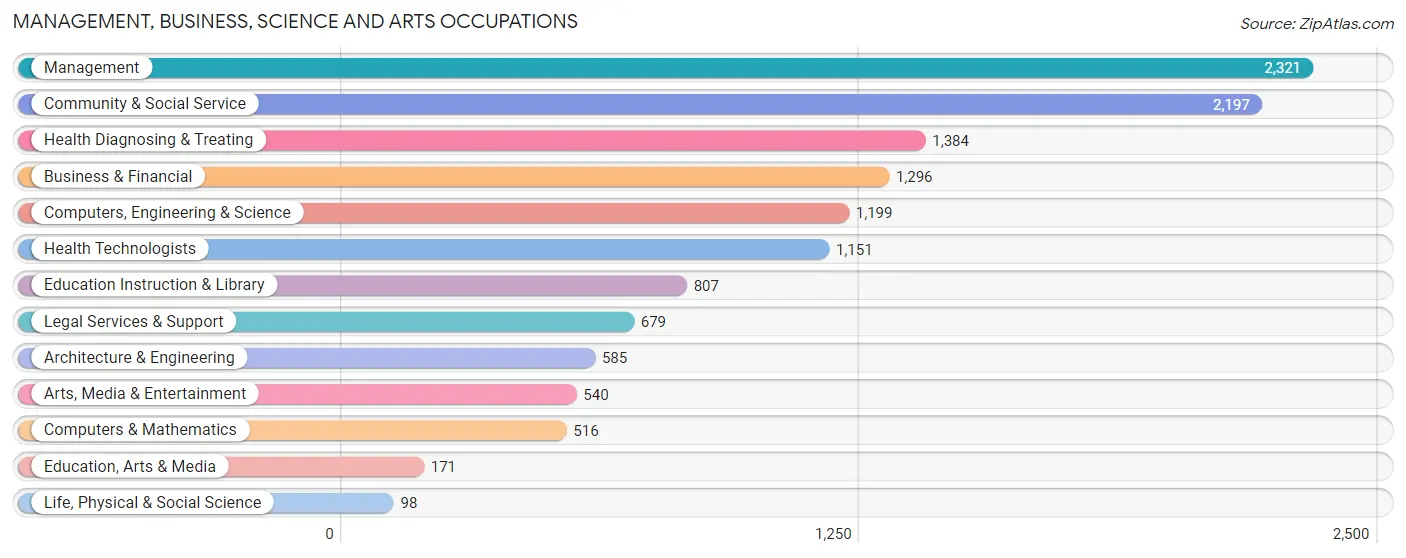
Management, Business, Science and Arts Occupations
The most common Management, Business, Science and Arts occupations in Winter Park are Management (2,321 | 16.9%), Community & Social Service (2,197 | 16.0%), Health Diagnosing & Treating (1,384 | 10.1%), Business & Financial (1,296 | 9.4%), and Computers, Engineering & Science (1,199 | 8.7%).
Management, Business, Science and Arts Occupations by Sex
Within the Management, Business, Science and Arts occupations in Winter Park, the most male-oriented occupations are Computers & Mathematics (72.7%), Computers, Engineering & Science (71.1%), and Architecture & Engineering (70.4%), while the most female-oriented occupations are Education, Arts & Media (83.6%), Education Instruction & Library (72.5%), and Community & Social Service (60.1%).
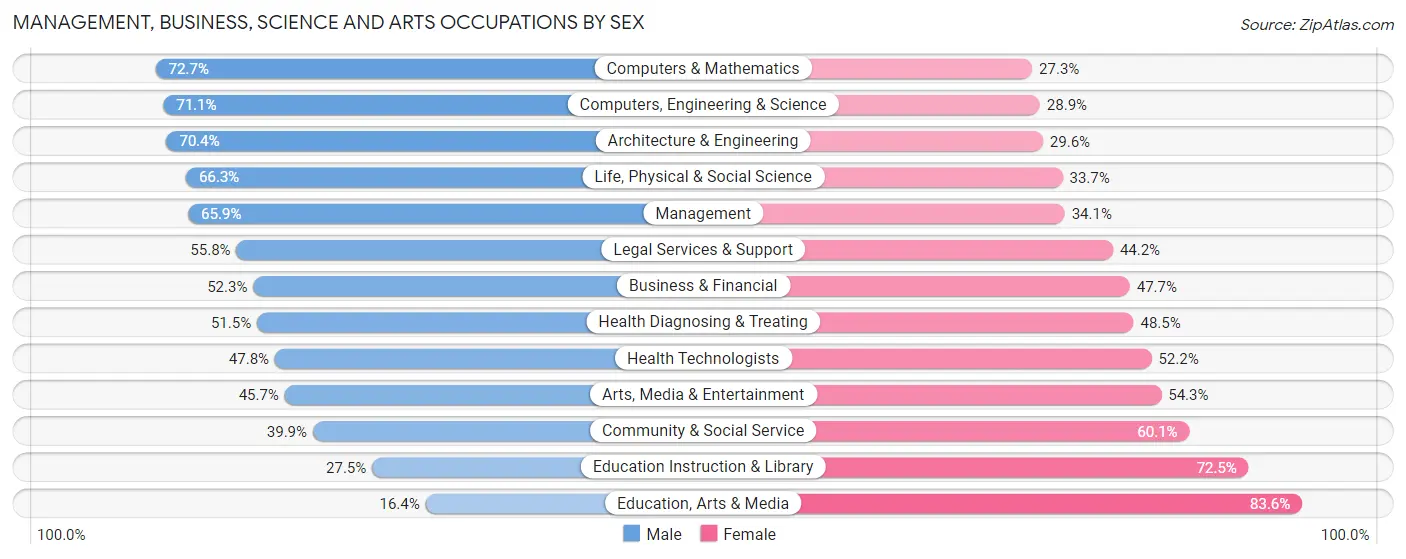
| Occupation | Male | Female |
| Management | 1,529 (65.9%) | 792 (34.1%) |
| Business & Financial | 678 (52.3%) | 618 (47.7%) |
| Computers, Engineering & Science | 852 (71.1%) | 347 (28.9%) |
| Computers & Mathematics | 375 (72.7%) | 141 (27.3%) |
| Architecture & Engineering | 412 (70.4%) | 173 (29.6%) |
| Life, Physical & Social Science | 65 (66.3%) | 33 (33.7%) |
| Community & Social Service | 876 (39.9%) | 1,321 (60.1%) |
| Education, Arts & Media | 28 (16.4%) | 143 (83.6%) |
| Legal Services & Support | 379 (55.8%) | 300 (44.2%) |
| Education Instruction & Library | 222 (27.5%) | 585 (72.5%) |
| Arts, Media & Entertainment | 247 (45.7%) | 293 (54.3%) |
| Health Diagnosing & Treating | 713 (51.5%) | 671 (48.5%) |
| Health Technologists | 550 (47.8%) | 601 (52.2%) |
| Total (Category) | 4,648 (55.3%) | 3,749 (44.7%) |
| Total (Overall) | 7,142 (51.9%) | 6,625 (48.1%) |
Services Occupations
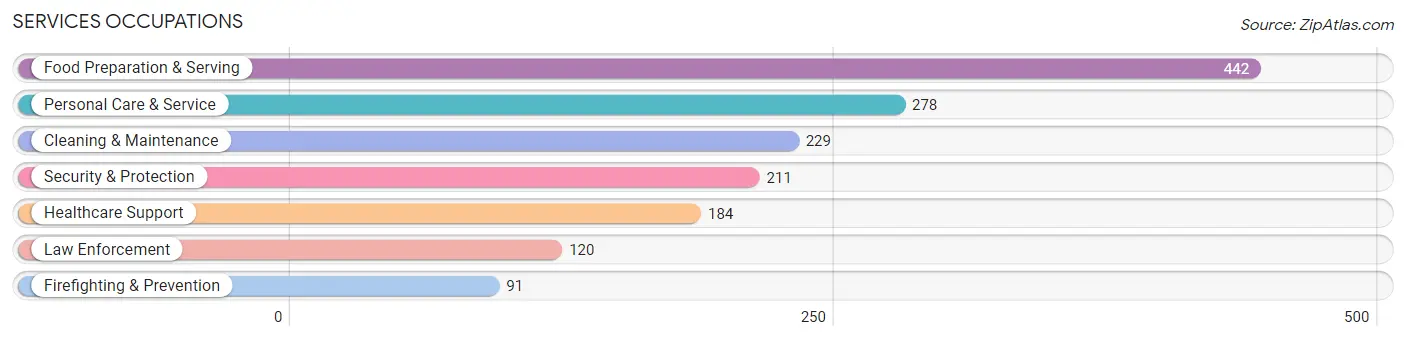
The most common Services occupations in Winter Park are Food Preparation & Serving (442 | 3.2%), Personal Care & Service (278 | 2.0%), Cleaning & Maintenance (229 | 1.7%), Security & Protection (211 | 1.5%), and Healthcare Support (184 | 1.3%).
Services Occupations by Sex
Within the Services occupations in Winter Park, the most male-oriented occupations are Cleaning & Maintenance (79.0%), Law Enforcement (70.8%), and Food Preparation & Serving (48.9%), while the most female-oriented occupations are Healthcare Support (93.5%), Firefighting & Prevention (84.6%), and Personal Care & Service (82.0%).
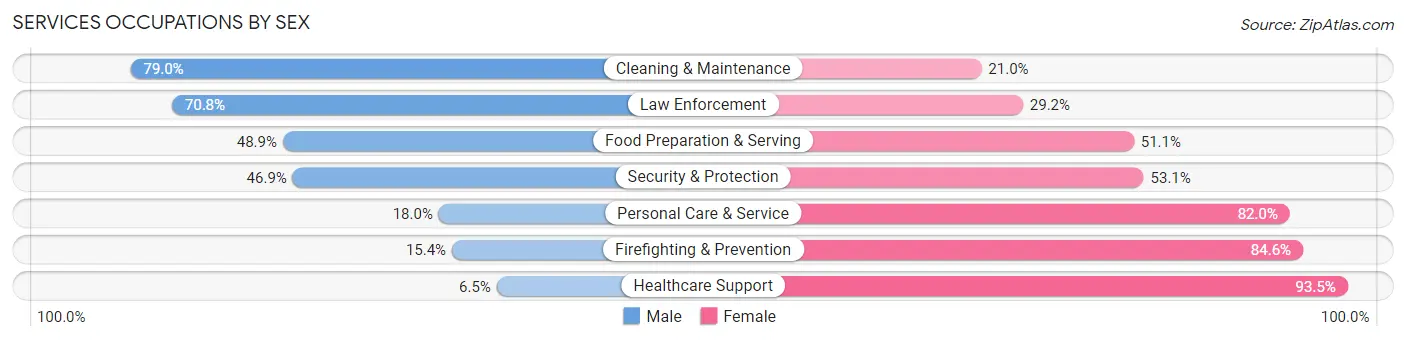
| Occupation | Male | Female |
| Healthcare Support | 12 (6.5%) | 172 (93.5%) |
| Security & Protection | 99 (46.9%) | 112 (53.1%) |
| Firefighting & Prevention | 14 (15.4%) | 77 (84.6%) |
| Law Enforcement | 85 (70.8%) | 35 (29.2%) |
| Food Preparation & Serving | 216 (48.9%) | 226 (51.1%) |
| Cleaning & Maintenance | 181 (79.0%) | 48 (21.0%) |
| Personal Care & Service | 50 (18.0%) | 228 (82.0%) |
| Total (Category) | 558 (41.5%) | 786 (58.5%) |
| Total (Overall) | 7,142 (51.9%) | 6,625 (48.1%) |
Sales and Office Occupations
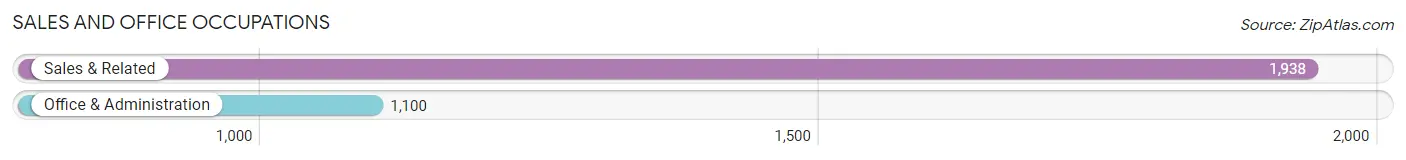
The most common Sales and Office occupations in Winter Park are Sales & Related (1,938 | 14.1%), and Office & Administration (1,100 | 8.0%).
Sales and Office Occupations by Sex
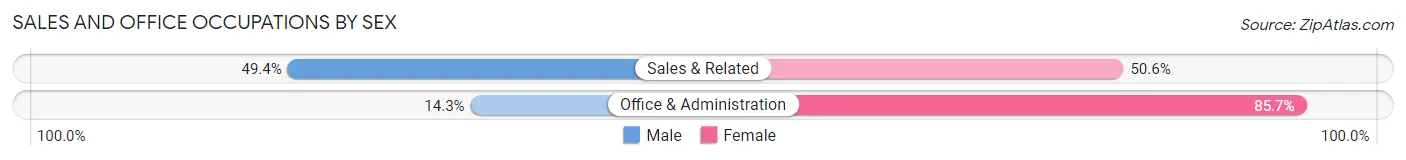
| Occupation | Male | Female |
| Sales & Related | 958 (49.4%) | 980 (50.6%) |
| Office & Administration | 157 (14.3%) | 943 (85.7%) |
| Total (Category) | 1,115 (36.7%) | 1,923 (63.3%) |
| Total (Overall) | 7,142 (51.9%) | 6,625 (48.1%) |
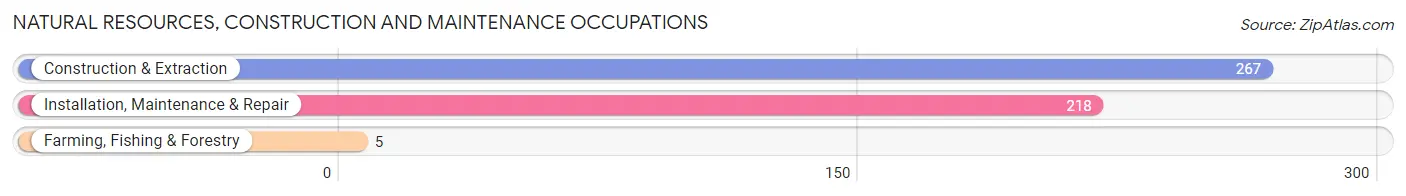
Natural Resources, Construction and Maintenance Occupations
The most common Natural Resources, Construction and Maintenance occupations in Winter Park are Construction & Extraction (267 | 1.9%), Installation, Maintenance & Repair (218 | 1.6%), and Farming, Fishing & Forestry (5 | 0.0%).
Natural Resources, Construction and Maintenance Occupations by Sex
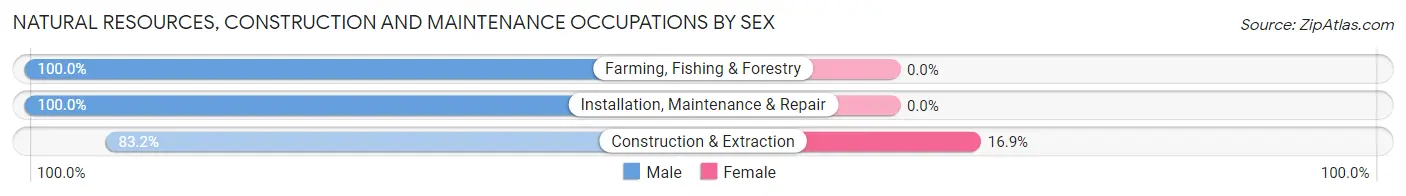
| Occupation | Male | Female |
| Farming, Fishing & Forestry | 5 (100.0%) | 0 (0.0%) |
| Construction & Extraction | 222 (83.2%) | 45 (16.9%) |
| Installation, Maintenance & Repair | 218 (100.0%) | 0 (0.0%) |
| Total (Category) | 445 (90.8%) | 45 (9.2%) |
| Total (Overall) | 7,142 (51.9%) | 6,625 (48.1%) |
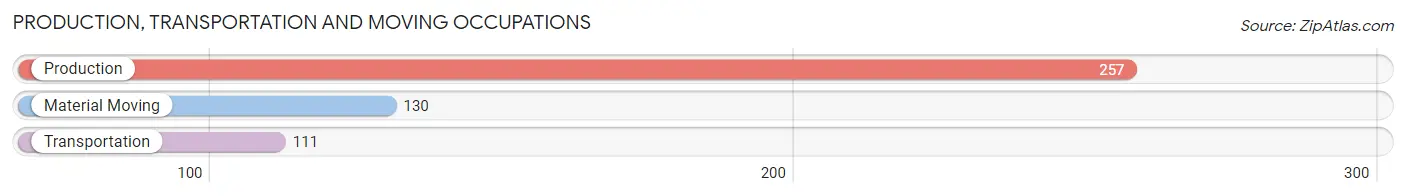
Production, Transportation and Moving Occupations
The most common Production, Transportation and Moving occupations in Winter Park are Production (257 | 1.9%), Material Moving (130 | 0.9%), and Transportation (111 | 0.8%).
Production, Transportation and Moving Occupations by Sex
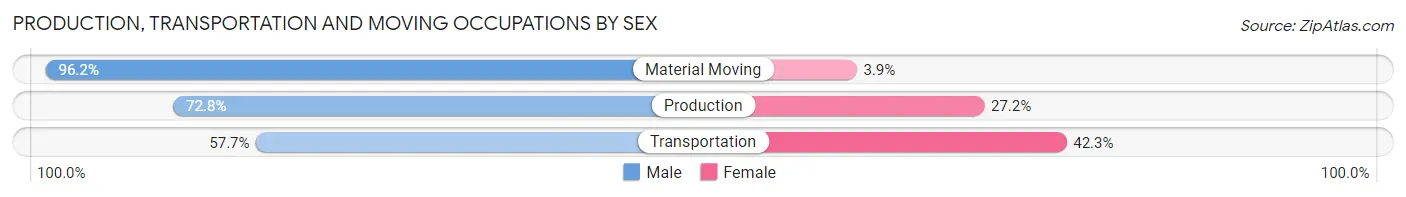
| Occupation | Male | Female |
| Production | 187 (72.8%) | 70 (27.2%) |
| Transportation | 64 (57.7%) | 47 (42.3%) |
| Material Moving | 125 (96.2%) | 5 (3.8%) |
| Total (Category) | 376 (75.5%) | 122 (24.5%) |
| Total (Overall) | 7,142 (51.9%) | 6,625 (48.1%) |
Employment Industries by Sex in Winter Park
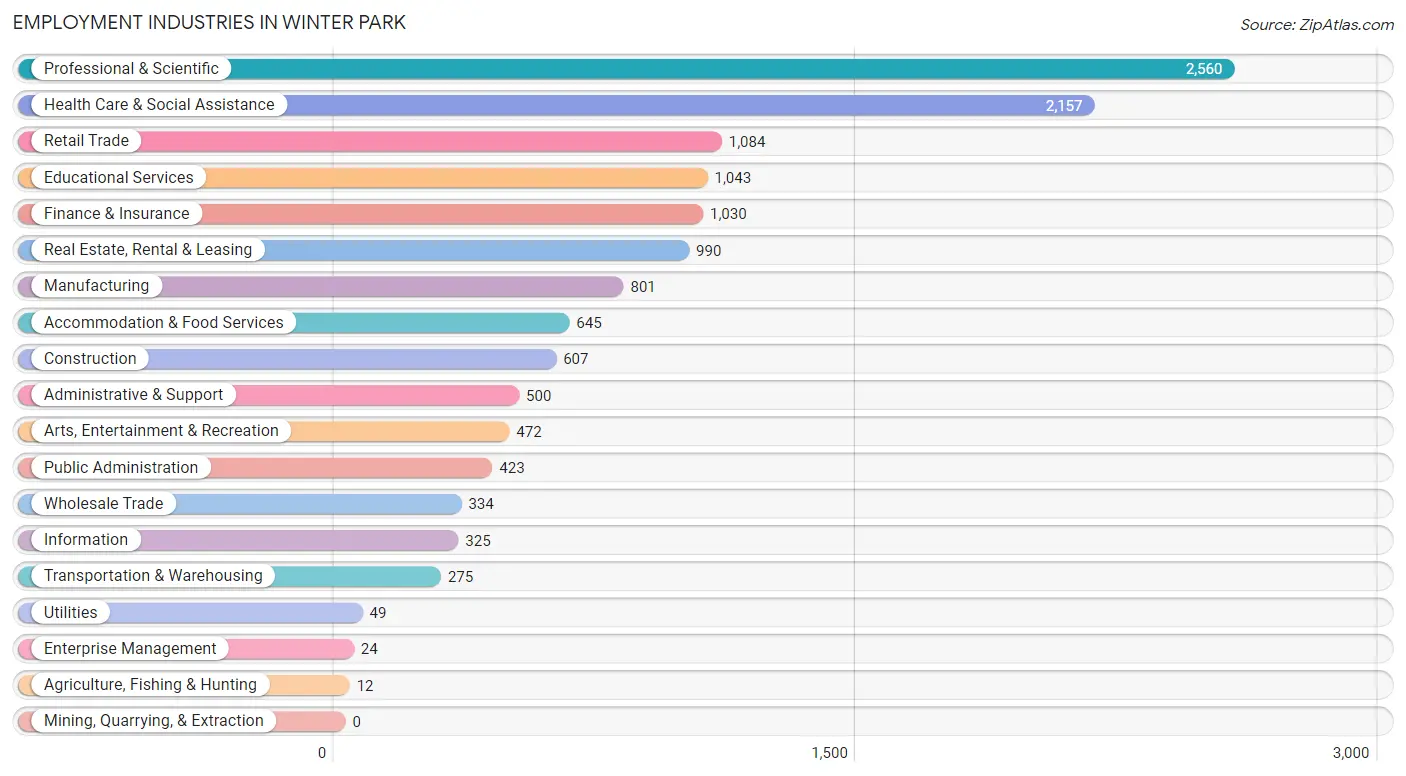
Employment Industries in Winter Park
The major employment industries in Winter Park include Professional & Scientific (2,560 | 18.6%), Health Care & Social Assistance (2,157 | 15.7%), Retail Trade (1,084 | 7.9%), Educational Services (1,043 | 7.6%), and Finance & Insurance (1,030 | 7.5%).
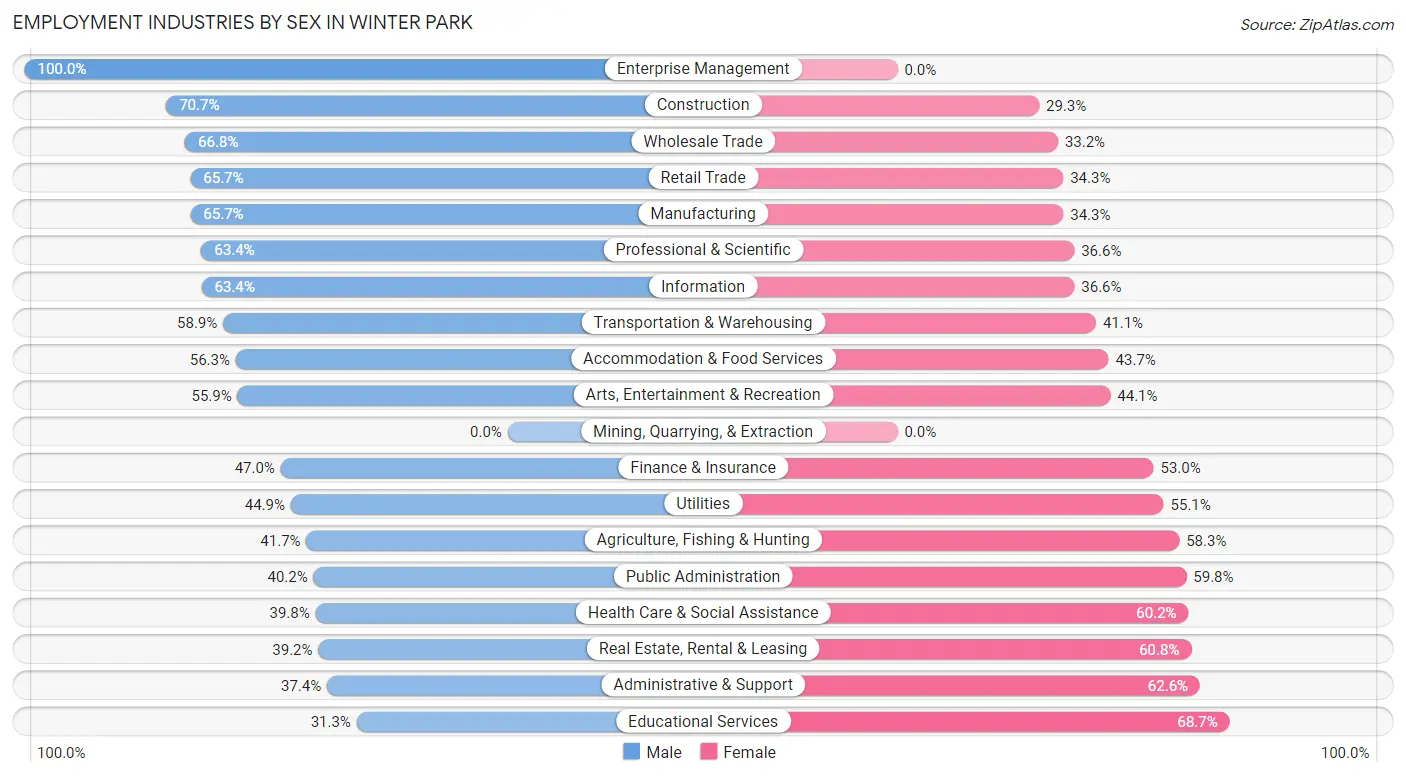
Employment Industries by Sex in Winter Park
The Winter Park industries that see more men than women are Enterprise Management (100.0%), Construction (70.7%), and Wholesale Trade (66.8%), whereas the industries that tend to have a higher number of women are Educational Services (68.7%), Administrative & Support (62.6%), and Real Estate, Rental & Leasing (60.8%).
| Industry | Male | Female |
| Agriculture, Fishing & Hunting | 5 (41.7%) | 7 (58.3%) |
| Mining, Quarrying, & Extraction | 0 (0.0%) | 0 (0.0%) |
| Construction | 429 (70.7%) | 178 (29.3%) |
| Manufacturing | 526 (65.7%) | 275 (34.3%) |
| Wholesale Trade | 223 (66.8%) | 111 (33.2%) |
| Retail Trade | 712 (65.7%) | 372 (34.3%) |
| Transportation & Warehousing | 162 (58.9%) | 113 (41.1%) |
| Utilities | 22 (44.9%) | 27 (55.1%) |
| Information | 206 (63.4%) | 119 (36.6%) |
| Finance & Insurance | 484 (47.0%) | 546 (53.0%) |
| Real Estate, Rental & Leasing | 388 (39.2%) | 602 (60.8%) |
| Professional & Scientific | 1,623 (63.4%) | 937 (36.6%) |
| Enterprise Management | 24 (100.0%) | 0 (0.0%) |
| Administrative & Support | 187 (37.4%) | 313 (62.6%) |
| Educational Services | 326 (31.3%) | 717 (68.7%) |
| Health Care & Social Assistance | 858 (39.8%) | 1,299 (60.2%) |
| Arts, Entertainment & Recreation | 264 (55.9%) | 208 (44.1%) |
| Accommodation & Food Services | 363 (56.3%) | 282 (43.7%) |
| Public Administration | 170 (40.2%) | 253 (59.8%) |
| Total | 7,142 (51.9%) | 6,625 (48.1%) |
Education in Winter Park
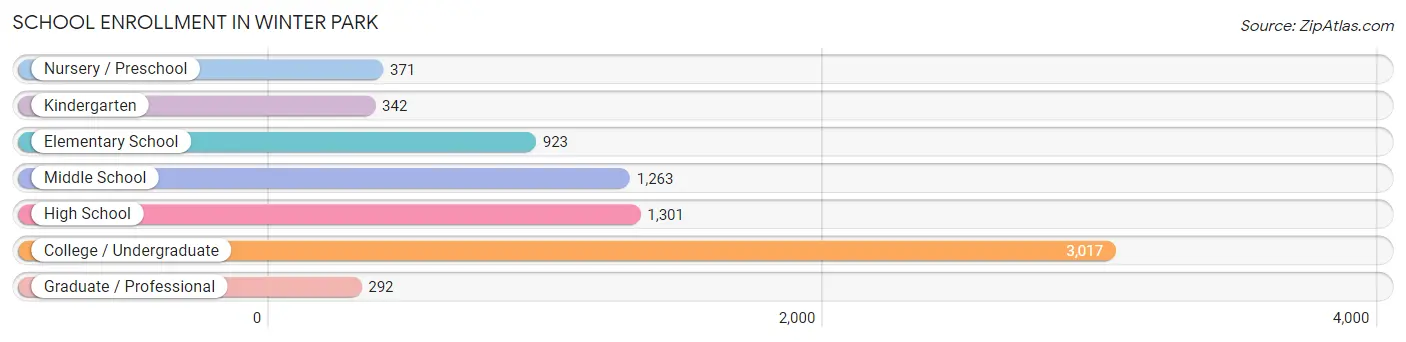
School Enrollment in Winter Park
The most common levels of schooling among the 7,509 students in Winter Park are college / undergraduate (3,017 | 40.2%), high school (1,301 | 17.3%), and middle school (1,263 | 16.8%).
| School Level | # Students | % Students |
| Nursery / Preschool | 371 | 4.9% |
| Kindergarten | 342 | 4.5% |
| Elementary School | 923 | 12.3% |
| Middle School | 1,263 | 16.8% |
| High School | 1,301 | 17.3% |
| College / Undergraduate | 3,017 | 40.2% |
| Graduate / Professional | 292 | 3.9% |
| Total | 7,509 | 100.0% |
School Enrollment by Age by Funding Source in Winter Park
Out of a total of 7,509 students who are enrolled in schools in Winter Park, 3,229 (43.0%) attend a private institution, while the remaining 4,280 (57.0%) are enrolled in public schools. The age group of 3 to 4 year olds has the highest likelihood of being enrolled in private schools, with 232 (85.6% in the age bracket) enrolled. Conversely, the age group of 15 to 17 year olds has the lowest likelihood of being enrolled in a private school, with 927 (75.1% in the age bracket) attending a public institution.
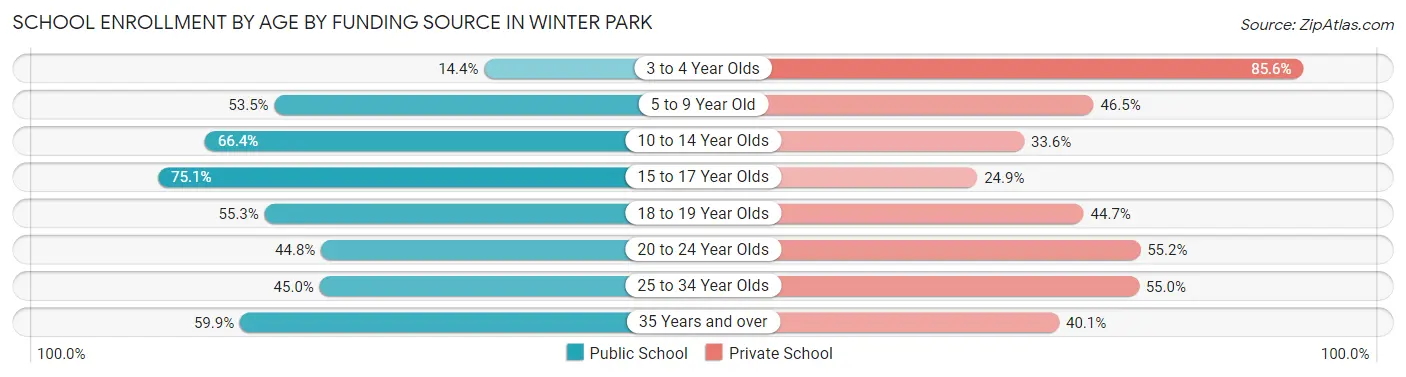
| Age Bracket | Public School | Private School |
| 3 to 4 Year Olds | 39 (14.4%) | 232 (85.6%) |
| 5 to 9 Year Old | 640 (53.5%) | 557 (46.5%) |
| 10 to 14 Year Olds | 1,022 (66.4%) | 517 (33.6%) |
| 15 to 17 Year Olds | 927 (75.1%) | 307 (24.9%) |
| 18 to 19 Year Olds | 845 (55.3%) | 683 (44.7%) |
| 20 to 24 Year Olds | 598 (44.8%) | 738 (55.2%) |
| 25 to 34 Year Olds | 109 (45.0%) | 133 (55.0%) |
| 35 Years and over | 97 (59.9%) | 65 (40.1%) |
| Total | 4,280 (57.0%) | 3,229 (43.0%) |
Educational Attainment by Field of Study in Winter Park
Business (3,031 | 20.4%), social sciences (1,489 | 10.0%), science & technology (1,470 | 9.9%), engineering (1,159 | 7.8%), and visual & performing arts (1,087 | 7.3%) are the most common fields of study among 14,828 individuals in Winter Park who have obtained a bachelor's degree or higher.
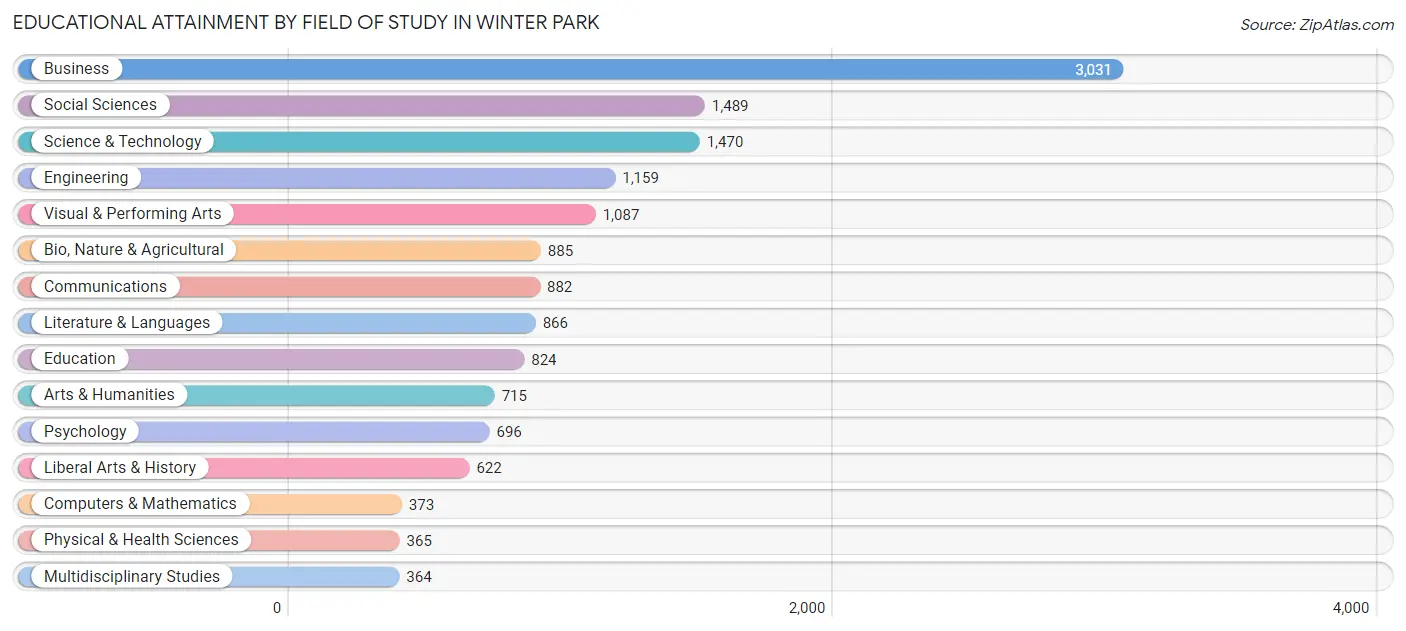
| Field of Study | # Graduates | % Graduates |
| Computers & Mathematics | 373 | 2.5% |
| Bio, Nature & Agricultural | 885 | 6.0% |
| Physical & Health Sciences | 365 | 2.5% |
| Psychology | 696 | 4.7% |
| Social Sciences | 1,489 | 10.0% |
| Engineering | 1,159 | 7.8% |
| Multidisciplinary Studies | 364 | 2.5% |
| Science & Technology | 1,470 | 9.9% |
| Business | 3,031 | 20.4% |
| Education | 824 | 5.6% |
| Literature & Languages | 866 | 5.8% |
| Liberal Arts & History | 622 | 4.2% |
| Visual & Performing Arts | 1,087 | 7.3% |
| Communications | 882 | 5.9% |
| Arts & Humanities | 715 | 4.8% |
| Total | 14,828 | 100.0% |
Transportation & Commute in Winter Park
Vehicle Availability by Sex in Winter Park
The most prevalent vehicle ownership categories in Winter Park are males with 2 vehicles (3,706, accounting for 53.1%) and females with 2 vehicles (3,042, making up 56.9%).
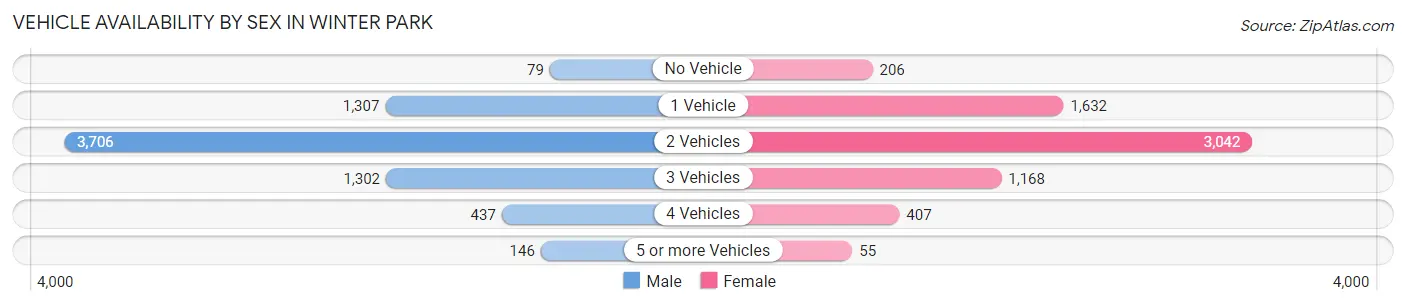
| Vehicles Available | Male | Female |
| No Vehicle | 79 (1.1%) | 206 (3.2%) |
| 1 Vehicle | 1,307 (18.7%) | 1,632 (25.1%) |
| 2 Vehicles | 3,706 (53.1%) | 3,042 (46.7%) |
| 3 Vehicles | 1,302 (18.7%) | 1,168 (17.9%) |
| 4 Vehicles | 437 (6.3%) | 407 (6.2%) |
| 5 or more Vehicles | 146 (2.1%) | 55 (0.8%) |
| Total | 6,977 (100.0%) | 6,510 (100.0%) |
Commute Time in Winter Park
The most frequently occuring commute durations in Winter Park are 15 to 19 minutes (1,937 commuters, 18.4%), 30 to 34 minutes (1,922 commuters, 18.3%), and 20 to 24 minutes (1,536 commuters, 14.6%).
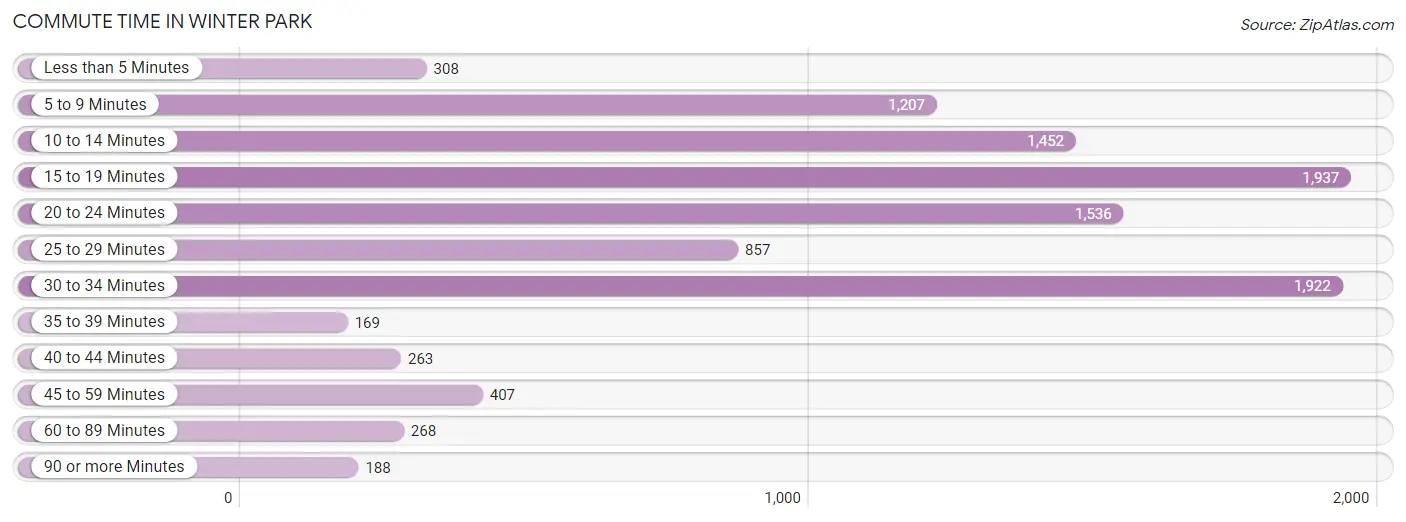
| Commute Time | # Commuters | % Commuters |
| Less than 5 Minutes | 308 | 2.9% |
| 5 to 9 Minutes | 1,207 | 11.5% |
| 10 to 14 Minutes | 1,452 | 13.8% |
| 15 to 19 Minutes | 1,937 | 18.4% |
| 20 to 24 Minutes | 1,536 | 14.6% |
| 25 to 29 Minutes | 857 | 8.2% |
| 30 to 34 Minutes | 1,922 | 18.3% |
| 35 to 39 Minutes | 169 | 1.6% |
| 40 to 44 Minutes | 263 | 2.5% |
| 45 to 59 Minutes | 407 | 3.9% |
| 60 to 89 Minutes | 268 | 2.5% |
| 90 or more Minutes | 188 | 1.8% |
Commute Time by Sex in Winter Park
The most common commute times in Winter Park are 30 to 34 minutes (1,154 commuters, 20.5%) for males and 15 to 19 minutes (908 commuters, 18.6%) for females.
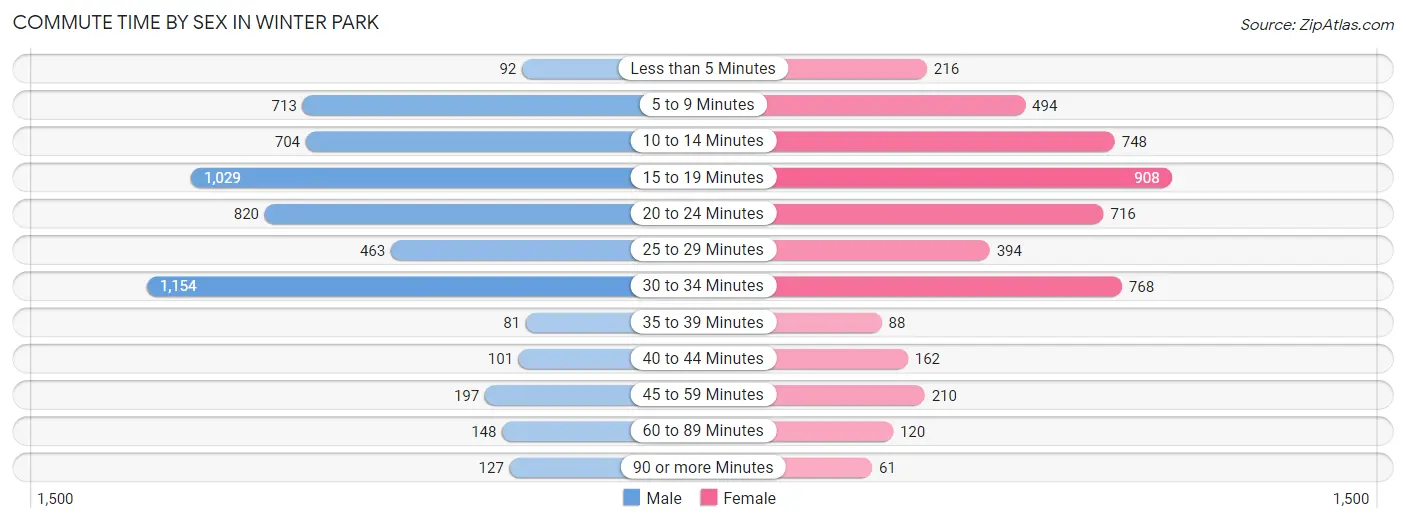
| Commute Time | Male | Female |
| Less than 5 Minutes | 92 (1.6%) | 216 (4.4%) |
| 5 to 9 Minutes | 713 (12.7%) | 494 (10.1%) |
| 10 to 14 Minutes | 704 (12.5%) | 748 (15.3%) |
| 15 to 19 Minutes | 1,029 (18.3%) | 908 (18.6%) |
| 20 to 24 Minutes | 820 (14.6%) | 716 (14.7%) |
| 25 to 29 Minutes | 463 (8.2%) | 394 (8.1%) |
| 30 to 34 Minutes | 1,154 (20.5%) | 768 (15.7%) |
| 35 to 39 Minutes | 81 (1.4%) | 88 (1.8%) |
| 40 to 44 Minutes | 101 (1.8%) | 162 (3.3%) |
| 45 to 59 Minutes | 197 (3.5%) | 210 (4.3%) |
| 60 to 89 Minutes | 148 (2.6%) | 120 (2.5%) |
| 90 or more Minutes | 127 (2.3%) | 61 (1.3%) |
Time of Departure to Work by Sex in Winter Park
The most frequent times of departure to work in Winter Park are 8:00 AM to 8:29 AM (911, 16.2%) for males and 8:00 AM to 8:29 AM (863, 17.7%) for females.
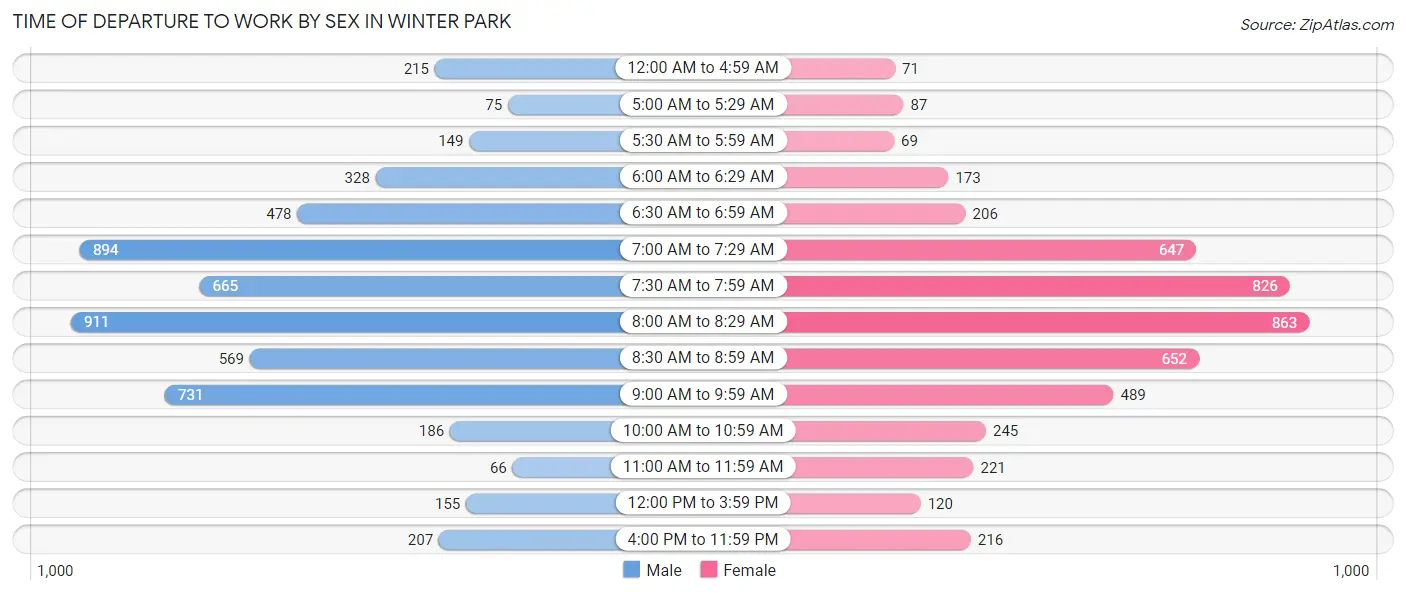
| Time of Departure | Male | Female |
| 12:00 AM to 4:59 AM | 215 (3.8%) | 71 (1.5%) |
| 5:00 AM to 5:29 AM | 75 (1.3%) | 87 (1.8%) |
| 5:30 AM to 5:59 AM | 149 (2.6%) | 69 (1.4%) |
| 6:00 AM to 6:29 AM | 328 (5.8%) | 173 (3.5%) |
| 6:30 AM to 6:59 AM | 478 (8.5%) | 206 (4.2%) |
| 7:00 AM to 7:29 AM | 894 (15.9%) | 647 (13.2%) |
| 7:30 AM to 7:59 AM | 665 (11.8%) | 826 (16.9%) |
| 8:00 AM to 8:29 AM | 911 (16.2%) | 863 (17.7%) |
| 8:30 AM to 8:59 AM | 569 (10.1%) | 652 (13.4%) |
| 9:00 AM to 9:59 AM | 731 (13.0%) | 489 (10.0%) |
| 10:00 AM to 10:59 AM | 186 (3.3%) | 245 (5.0%) |
| 11:00 AM to 11:59 AM | 66 (1.2%) | 221 (4.5%) |
| 12:00 PM to 3:59 PM | 155 (2.8%) | 120 (2.5%) |
| 4:00 PM to 11:59 PM | 207 (3.7%) | 216 (4.4%) |
| Total | 5,629 (100.0%) | 4,885 (100.0%) |
Housing Occupancy in Winter Park
Occupancy by Ownership in Winter Park
Of the total 12,612 dwellings in Winter Park, owner-occupied units account for 8,299 (65.8%), while renter-occupied units make up 4,313 (34.2%).
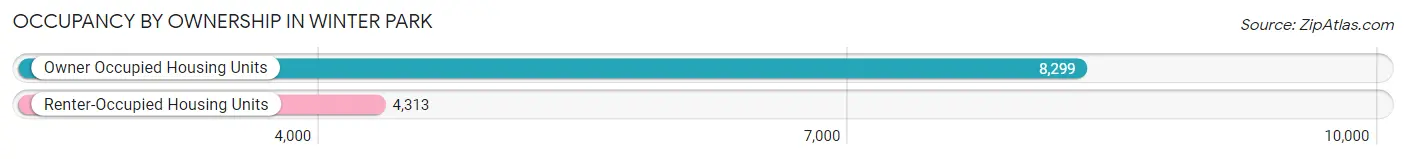
| Occupancy | # Housing Units | % Housing Units |
| Owner Occupied Housing Units | 8,299 | 65.8% |
| Renter-Occupied Housing Units | 4,313 | 34.2% |
| Total Occupied Housing Units | 12,612 | 100.0% |
Occupancy by Household Size in Winter Park
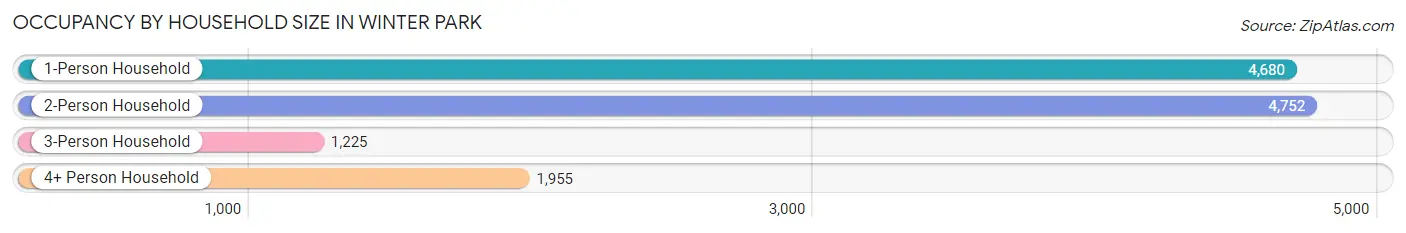
| Household Size | # Housing Units | % Housing Units |
| 1-Person Household | 4,680 | 37.1% |
| 2-Person Household | 4,752 | 37.7% |
| 3-Person Household | 1,225 | 9.7% |
| 4+ Person Household | 1,955 | 15.5% |
| Total Housing Units | 12,612 | 100.0% |
Occupancy by Ownership by Household Size in Winter Park
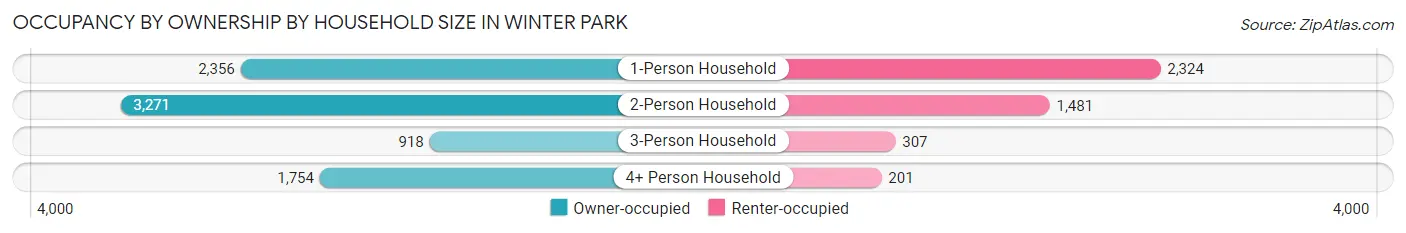
| Household Size | Owner-occupied | Renter-occupied |
| 1-Person Household | 2,356 (50.3%) | 2,324 (49.7%) |
| 2-Person Household | 3,271 (68.8%) | 1,481 (31.2%) |
| 3-Person Household | 918 (74.9%) | 307 (25.1%) |
| 4+ Person Household | 1,754 (89.7%) | 201 (10.3%) |
| Total Housing Units | 8,299 (65.8%) | 4,313 (34.2%) |
Occupancy by Educational Attainment in Winter Park
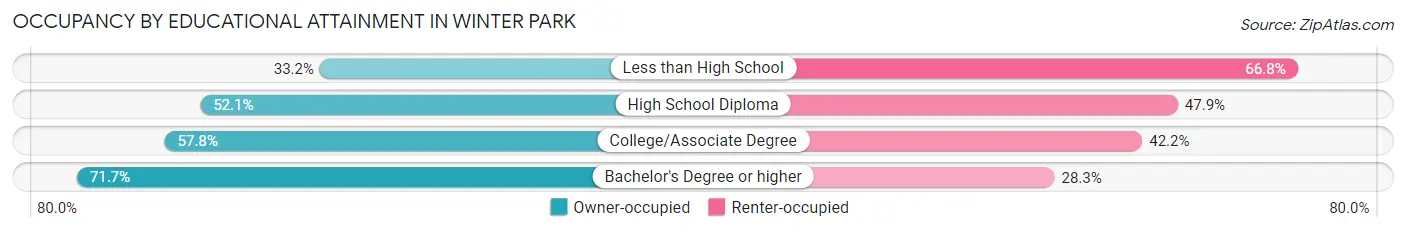
| Household Size | Owner-occupied | Renter-occupied |
| Less than High School | 70 (33.2%) | 141 (66.8%) |
| High School Diploma | 718 (52.1%) | 659 (47.9%) |
| College/Associate Degree | 1,639 (57.8%) | 1,197 (42.2%) |
| Bachelor's Degree or higher | 5,872 (71.7%) | 2,316 (28.3%) |
Occupancy by Age of Householder in Winter Park
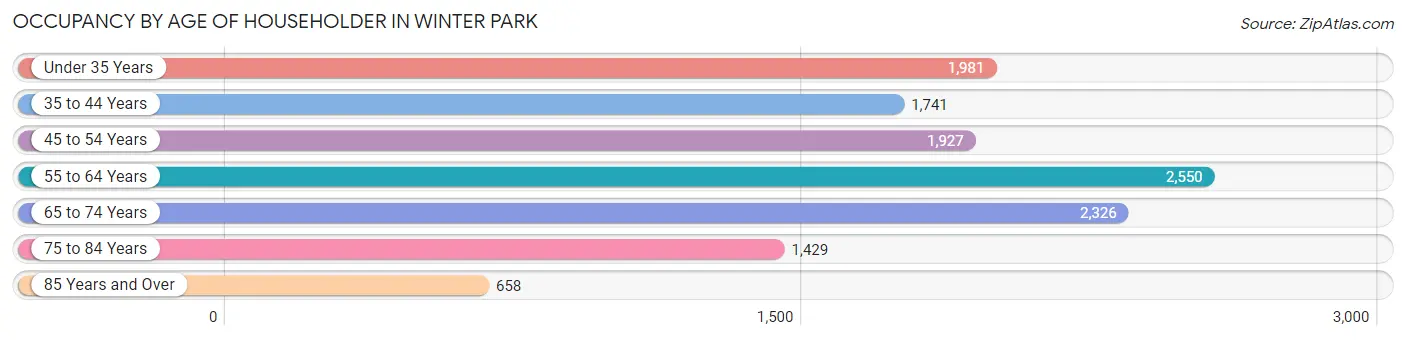
| Age Bracket | # Households | % Households |
| Under 35 Years | 1,981 | 15.7% |
| 35 to 44 Years | 1,741 | 13.8% |
| 45 to 54 Years | 1,927 | 15.3% |
| 55 to 64 Years | 2,550 | 20.2% |
| 65 to 74 Years | 2,326 | 18.4% |
| 75 to 84 Years | 1,429 | 11.3% |
| 85 Years and Over | 658 | 5.2% |
| Total | 12,612 | 100.0% |
Housing Finances in Winter Park
Median Income by Occupancy in Winter Park
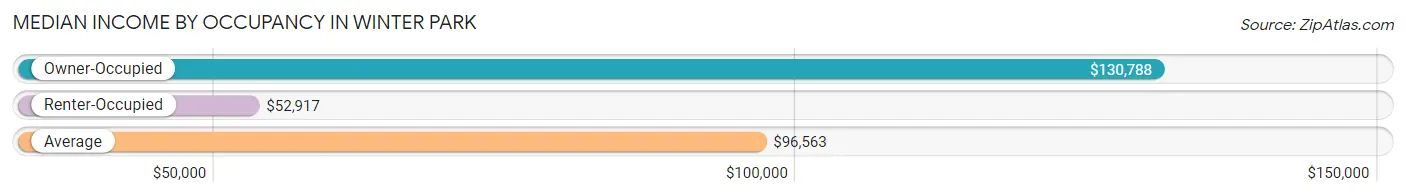
| Occupancy Type | # Households | Median Income |
| Owner-Occupied | 8,299 (65.8%) | $130,788 |
| Renter-Occupied | 4,313 (34.2%) | $52,917 |
| Average | 12,612 (100.0%) | $96,563 |
Occupancy by Householder Income Bracket in Winter Park
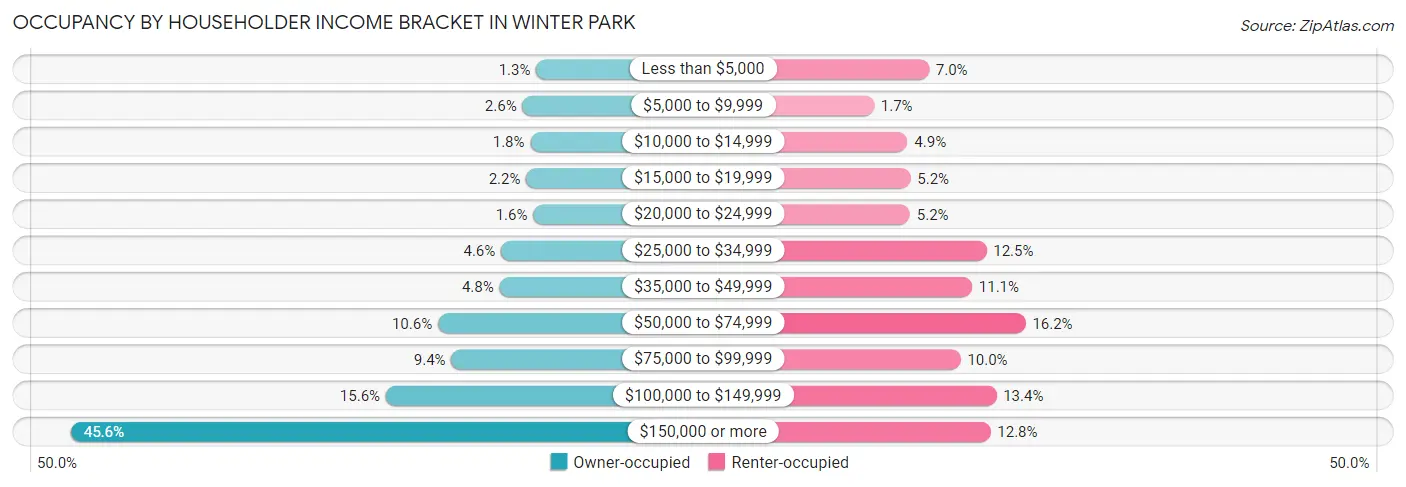
| Income Bracket | Owner-occupied | Renter-occupied |
| Less than $5,000 | 105 (1.3%) | 301 (7.0%) |
| $5,000 to $9,999 | 214 (2.6%) | 75 (1.7%) |
| $10,000 to $14,999 | 152 (1.8%) | 213 (4.9%) |
| $15,000 to $19,999 | 184 (2.2%) | 225 (5.2%) |
| $20,000 to $24,999 | 129 (1.5%) | 223 (5.2%) |
| $25,000 to $34,999 | 383 (4.6%) | 537 (12.4%) |
| $35,000 to $49,999 | 396 (4.8%) | 478 (11.1%) |
| $50,000 to $74,999 | 882 (10.6%) | 698 (16.2%) |
| $75,000 to $99,999 | 776 (9.3%) | 431 (10.0%) |
| $100,000 to $149,999 | 1,294 (15.6%) | 578 (13.4%) |
| $150,000 or more | 3,784 (45.6%) | 554 (12.8%) |
| Total | 8,299 (100.0%) | 4,313 (100.0%) |
Monthly Housing Cost Tiers in Winter Park
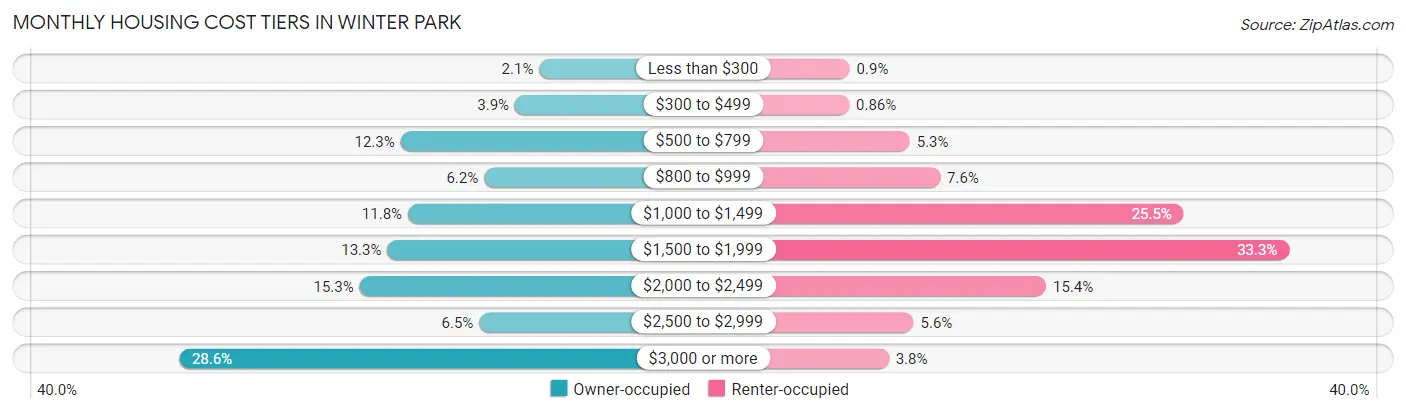
| Monthly Cost | Owner-occupied | Renter-occupied |
| Less than $300 | 174 (2.1%) | 39 (0.9%) |
| $300 to $499 | 323 (3.9%) | 37 (0.9%) |
| $500 to $799 | 1,022 (12.3%) | 230 (5.3%) |
| $800 to $999 | 511 (6.2%) | 326 (7.6%) |
| $1,000 to $1,499 | 977 (11.8%) | 1,100 (25.5%) |
| $1,500 to $1,999 | 1,103 (13.3%) | 1,435 (33.3%) |
| $2,000 to $2,499 | 1,272 (15.3%) | 663 (15.4%) |
| $2,500 to $2,999 | 541 (6.5%) | 242 (5.6%) |
| $3,000 or more | 2,376 (28.6%) | 163 (3.8%) |
| Total | 8,299 (100.0%) | 4,313 (100.0%) |
Physical Housing Characteristics in Winter Park
Housing Structures in Winter Park
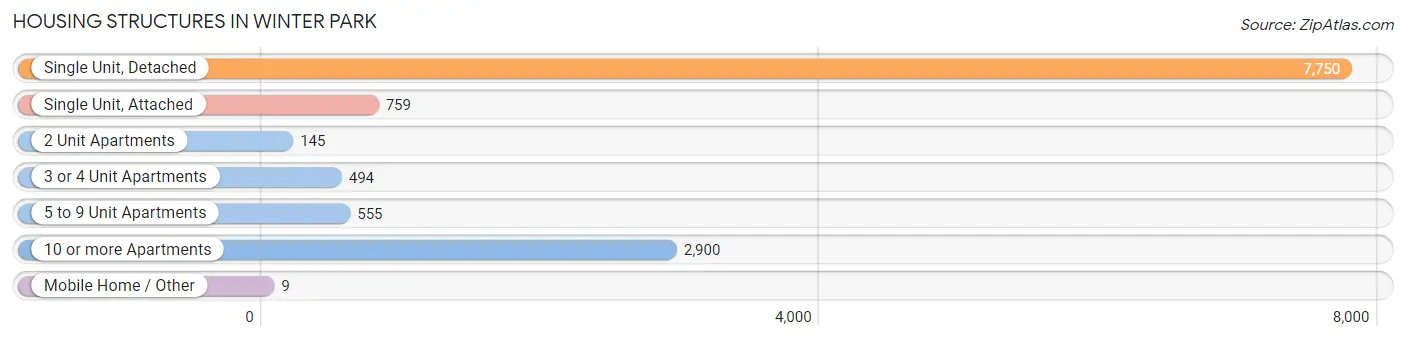
| Structure Type | # Housing Units | % Housing Units |
| Single Unit, Detached | 7,750 | 61.5% |
| Single Unit, Attached | 759 | 6.0% |
| 2 Unit Apartments | 145 | 1.1% |
| 3 or 4 Unit Apartments | 494 | 3.9% |
| 5 to 9 Unit Apartments | 555 | 4.4% |
| 10 or more Apartments | 2,900 | 23.0% |
| Mobile Home / Other | 9 | 0.1% |
| Total | 12,612 | 100.0% |
Housing Structures by Occupancy in Winter Park
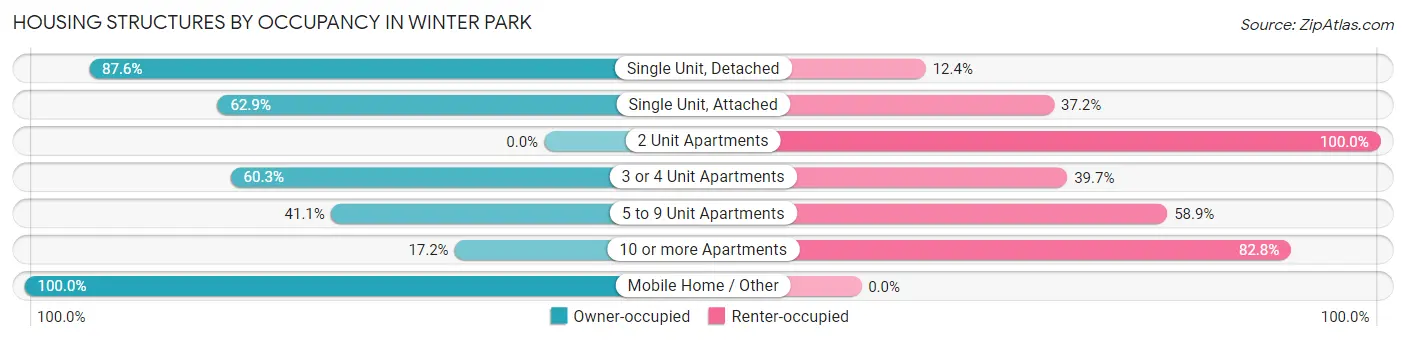
| Structure Type | Owner-occupied | Renter-occupied |
| Single Unit, Detached | 6,787 (87.6%) | 963 (12.4%) |
| Single Unit, Attached | 477 (62.8%) | 282 (37.1%) |
| 2 Unit Apartments | 0 (0.0%) | 145 (100.0%) |
| 3 or 4 Unit Apartments | 298 (60.3%) | 196 (39.7%) |
| 5 to 9 Unit Apartments | 228 (41.1%) | 327 (58.9%) |
| 10 or more Apartments | 500 (17.2%) | 2,400 (82.8%) |
| Mobile Home / Other | 9 (100.0%) | 0 (0.0%) |
| Total | 8,299 (65.8%) | 4,313 (34.2%) |
Housing Structures by Number of Rooms in Winter Park
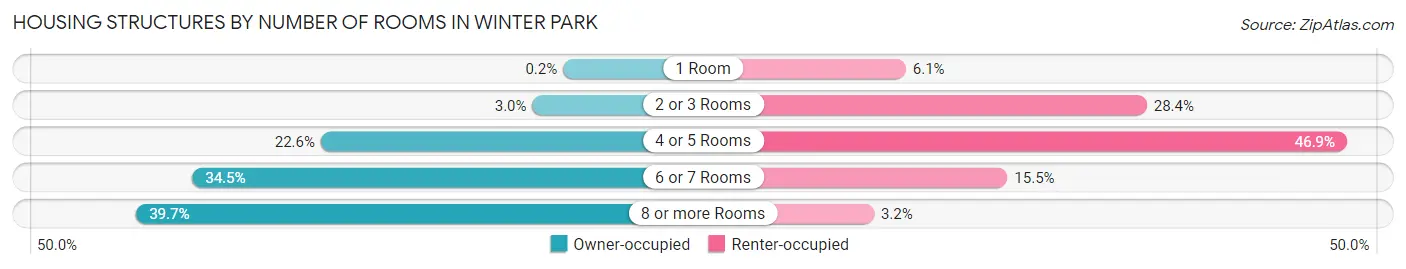
| Number of Rooms | Owner-occupied | Renter-occupied |
| 1 Room | 17 (0.2%) | 263 (6.1%) |
| 2 or 3 Rooms | 252 (3.0%) | 1,224 (28.4%) |
| 4 or 5 Rooms | 1,876 (22.6%) | 2,022 (46.9%) |
| 6 or 7 Rooms | 2,862 (34.5%) | 668 (15.5%) |
| 8 or more Rooms | 3,292 (39.7%) | 136 (3.2%) |
| Total | 8,299 (100.0%) | 4,313 (100.0%) |
Housing Structure by Heating Type in Winter Park
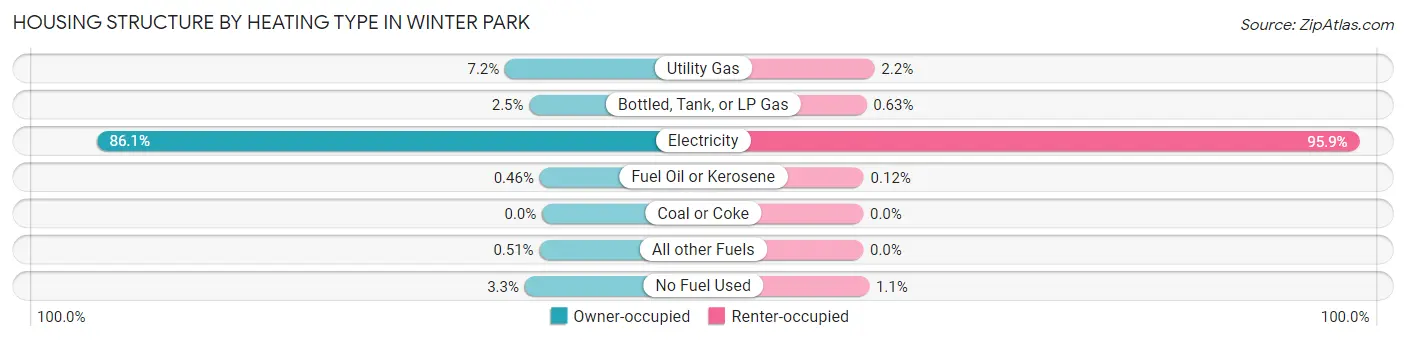
| Heating Type | Owner-occupied | Renter-occupied |
| Utility Gas | 593 (7.1%) | 95 (2.2%) |
| Bottled, Tank, or LP Gas | 204 (2.5%) | 27 (0.6%) |
| Electricity | 7,145 (86.1%) | 4,137 (95.9%) |
| Fuel Oil or Kerosene | 38 (0.5%) | 5 (0.1%) |
| Coal or Coke | 0 (0.0%) | 0 (0.0%) |
| All other Fuels | 42 (0.5%) | 0 (0.0%) |
| No Fuel Used | 277 (3.3%) | 49 (1.1%) |
| Total | 8,299 (100.0%) | 4,313 (100.0%) |
Household Vehicle Usage in Winter Park
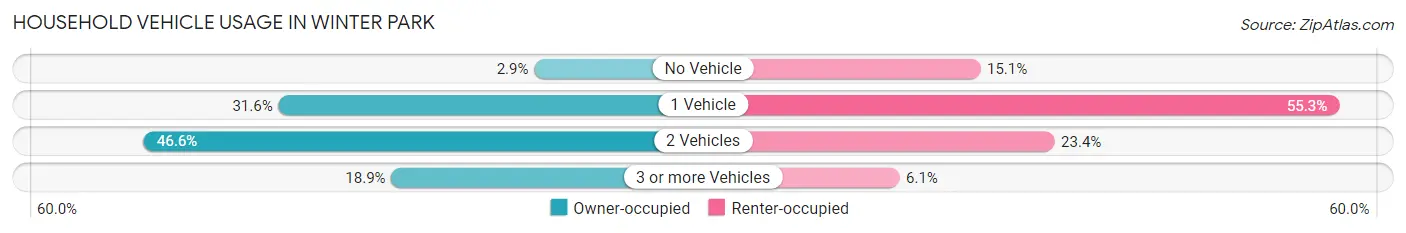
| Vehicles per Household | Owner-occupied | Renter-occupied |
| No Vehicle | 241 (2.9%) | 653 (15.1%) |
| 1 Vehicle | 2,619 (31.6%) | 2,387 (55.3%) |
| 2 Vehicles | 3,870 (46.6%) | 1,011 (23.4%) |
| 3 or more Vehicles | 1,569 (18.9%) | 262 (6.1%) |
| Total | 8,299 (100.0%) | 4,313 (100.0%) |
Real Estate & Mortgages in Winter Park
Real Estate and Mortgage Overview in Winter Park
| Characteristic | Without Mortgage | With Mortgage |
| Housing Units | 3,390 | 4,909 |
| Median Property Value | $551,000 | $608,600 |
| Median Household Income | $112,744 | $2,579 |
| Monthly Housing Costs | $934 | $2,164 |
| Real Estate Taxes | $3,701 | $79 |
Property Value by Mortgage Status in Winter Park
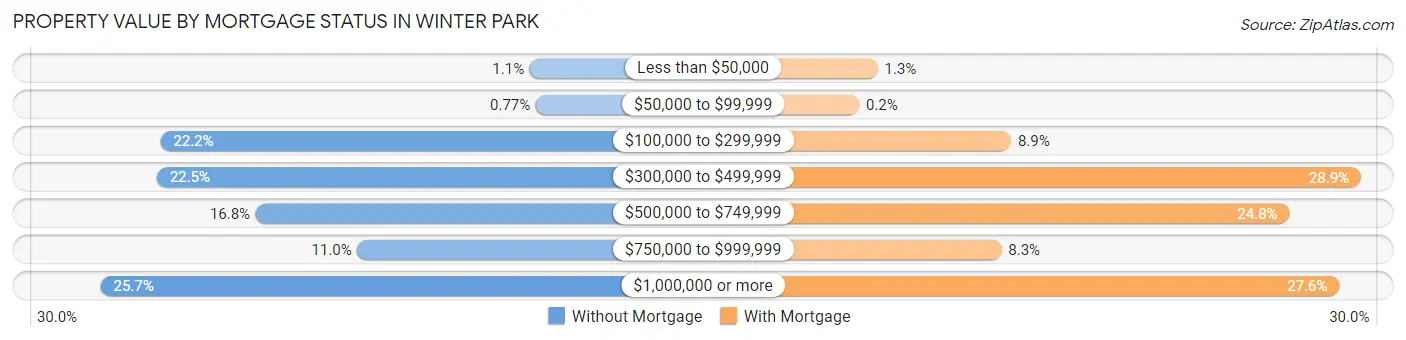
| Property Value | Without Mortgage | With Mortgage |
| Less than $50,000 | 38 (1.1%) | 62 (1.3%) |
| $50,000 to $99,999 | 26 (0.8%) | 10 (0.2%) |
| $100,000 to $299,999 | 754 (22.2%) | 436 (8.9%) |
| $300,000 to $499,999 | 761 (22.5%) | 1,418 (28.9%) |
| $500,000 to $749,999 | 569 (16.8%) | 1,217 (24.8%) |
| $750,000 to $999,999 | 372 (11.0%) | 409 (8.3%) |
| $1,000,000 or more | 870 (25.7%) | 1,357 (27.6%) |
| Total | 3,390 (100.0%) | 4,909 (100.0%) |
Household Income by Mortgage Status in Winter Park
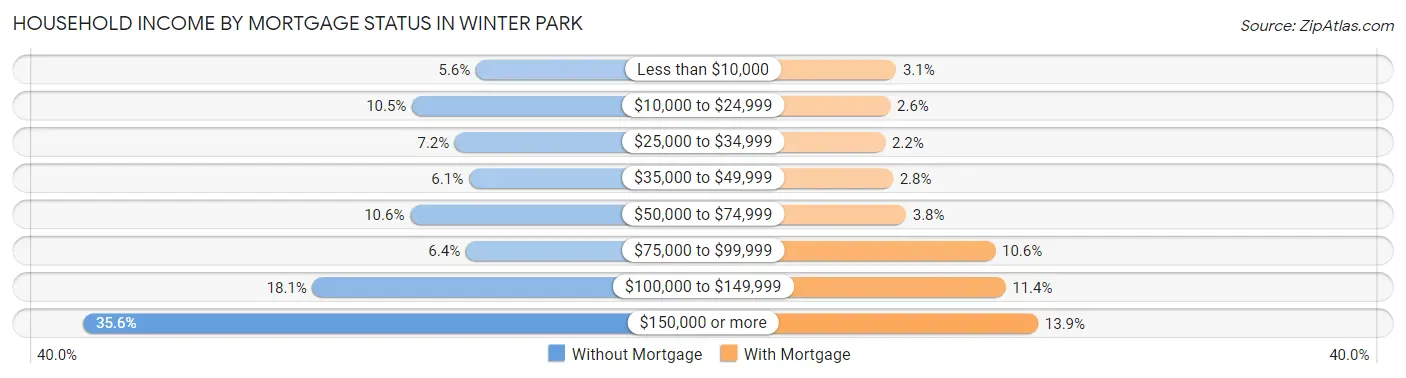
| Household Income | Without Mortgage | With Mortgage |
| Less than $10,000 | 190 (5.6%) | 151 (3.1%) |
| $10,000 to $24,999 | 355 (10.5%) | 129 (2.6%) |
| $25,000 to $34,999 | 244 (7.2%) | 110 (2.2%) |
| $35,000 to $49,999 | 208 (6.1%) | 139 (2.8%) |
| $50,000 to $74,999 | 360 (10.6%) | 188 (3.8%) |
| $75,000 to $99,999 | 216 (6.4%) | 522 (10.6%) |
| $100,000 to $149,999 | 612 (18.0%) | 560 (11.4%) |
| $150,000 or more | 1,205 (35.5%) | 682 (13.9%) |
| Total | 3,390 (100.0%) | 4,909 (100.0%) |
Property Value to Household Income Ratio in Winter Park
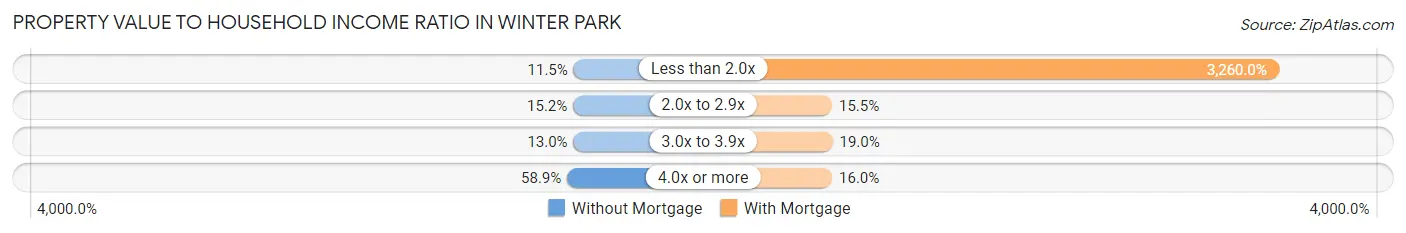
| Value-to-Income Ratio | Without Mortgage | With Mortgage |
| Less than 2.0x | 390 (11.5%) | 160,034 (3,260.0%) |
| 2.0x to 2.9x | 515 (15.2%) | 760 (15.5%) |
| 3.0x to 3.9x | 441 (13.0%) | 931 (19.0%) |
| 4.0x or more | 1,998 (58.9%) | 784 (16.0%) |
| Total | 3,390 (100.0%) | 4,909 (100.0%) |
Real Estate Taxes by Mortgage Status in Winter Park
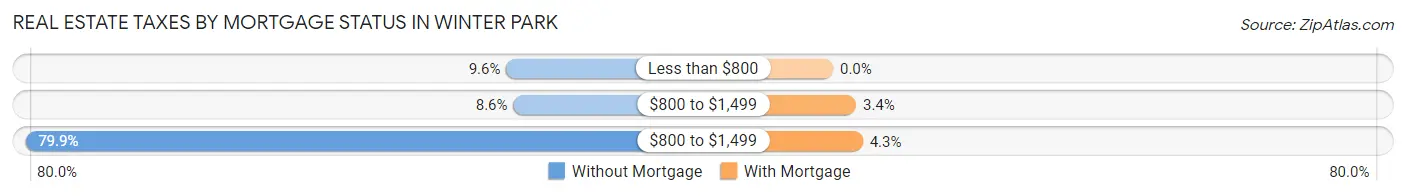
| Property Taxes | Without Mortgage | With Mortgage |
| Less than $800 | 326 (9.6%) | 0 (0.0%) |
| $800 to $1,499 | 291 (8.6%) | 165 (3.4%) |
| $800 to $1,499 | 2,709 (79.9%) | 213 (4.3%) |
| Total | 3,390 (100.0%) | 4,909 (100.0%) |
Health & Disability in Winter Park
Health Insurance Coverage by Age in Winter Park
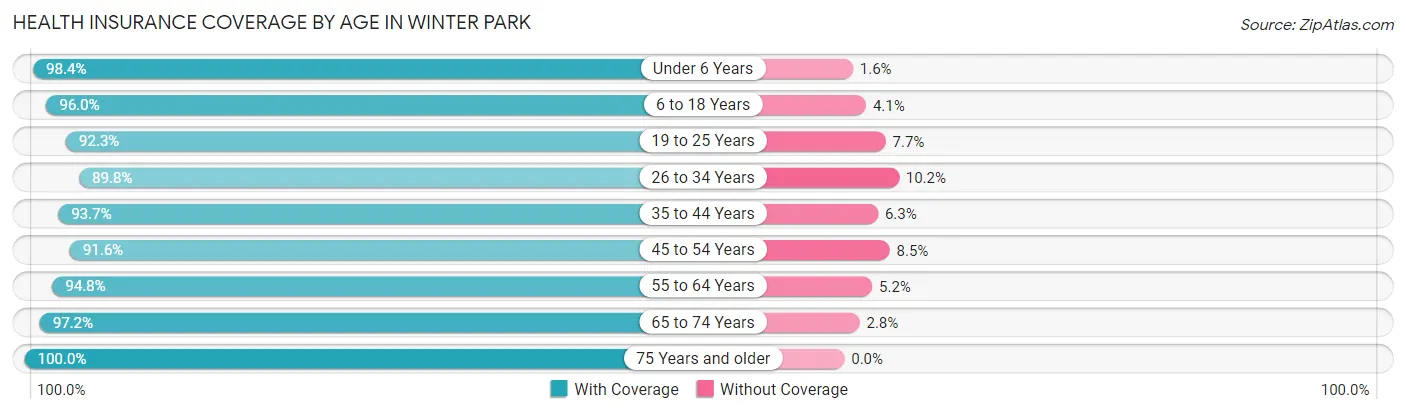
| Age Bracket | With Coverage | Without Coverage |
| Under 6 Years | 1,413 (98.4%) | 23 (1.6%) |
| 6 to 18 Years | 4,450 (96.0%) | 188 (4.1%) |
| 19 to 25 Years | 2,754 (92.3%) | 230 (7.7%) |
| 26 to 34 Years | 2,663 (89.8%) | 301 (10.2%) |
| 35 to 44 Years | 3,044 (93.7%) | 204 (6.3%) |
| 45 to 54 Years | 3,328 (91.5%) | 307 (8.5%) |
| 55 to 64 Years | 3,954 (94.8%) | 216 (5.2%) |
| 65 to 74 Years | 3,317 (97.2%) | 97 (2.8%) |
| 75 Years and older | 3,093 (100.0%) | 0 (0.0%) |
| Total | 28,016 (94.7%) | 1,566 (5.3%) |
Health Insurance Coverage by Citizenship Status in Winter Park
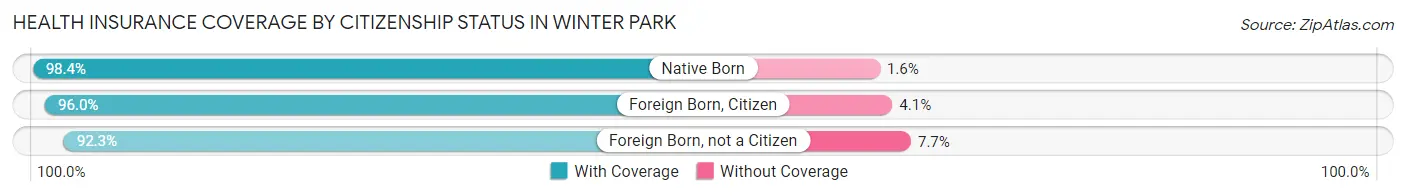
| Citizenship Status | With Coverage | Without Coverage |
| Native Born | 1,413 (98.4%) | 23 (1.6%) |
| Foreign Born, Citizen | 4,450 (96.0%) | 188 (4.1%) |
| Foreign Born, not a Citizen | 2,754 (92.3%) | 230 (7.7%) |
Health Insurance Coverage by Household Income in Winter Park
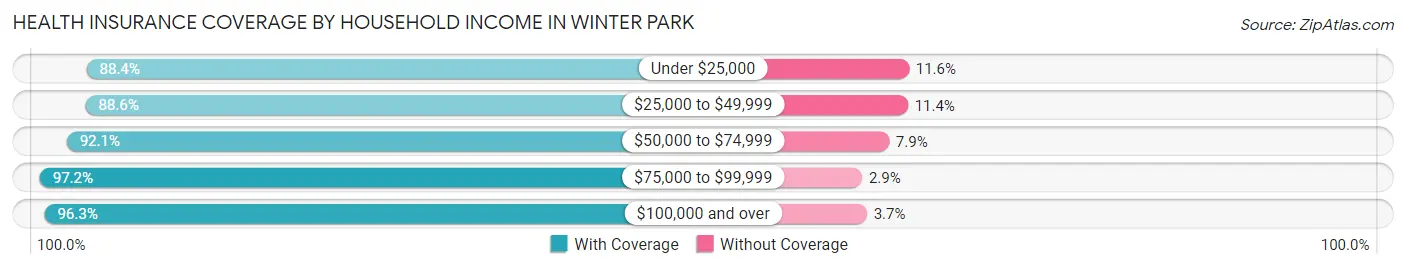
| Household Income | With Coverage | Without Coverage |
| Under $25,000 | 2,334 (88.4%) | 307 (11.6%) |
| $25,000 to $49,999 | 2,579 (88.6%) | 332 (11.4%) |
| $50,000 to $74,999 | 2,429 (92.1%) | 208 (7.9%) |
| $75,000 to $99,999 | 2,253 (97.2%) | 66 (2.9%) |
| $100,000 and over | 16,689 (96.3%) | 647 (3.7%) |
Public vs Private Health Insurance Coverage by Age in Winter Park
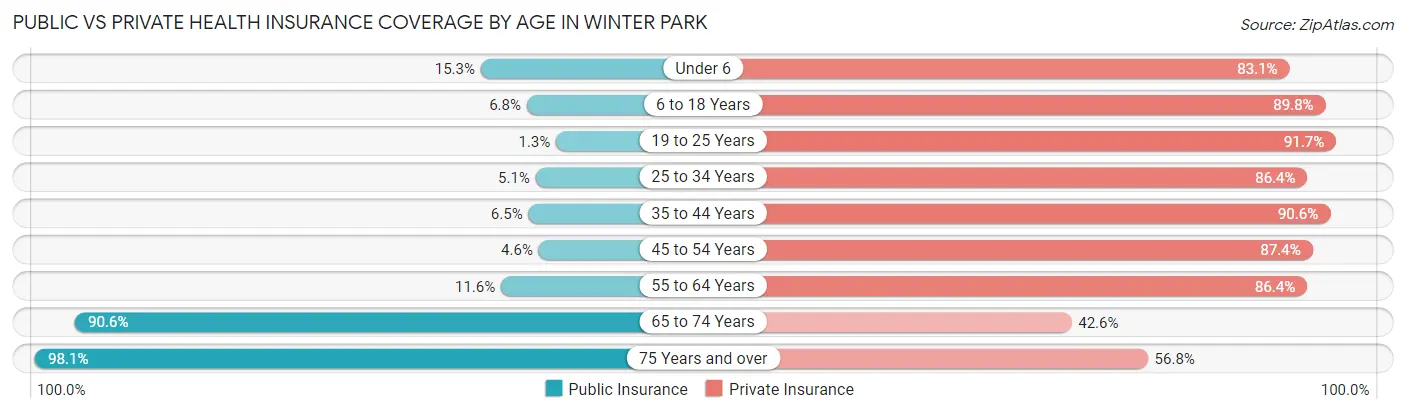
| Age Bracket | Public Insurance | Private Insurance |
| Under 6 | 220 (15.3%) | 1,193 (83.1%) |
| 6 to 18 Years | 315 (6.8%) | 4,163 (89.8%) |
| 19 to 25 Years | 40 (1.3%) | 2,737 (91.7%) |
| 25 to 34 Years | 152 (5.1%) | 2,561 (86.4%) |
| 35 to 44 Years | 210 (6.5%) | 2,943 (90.6%) |
| 45 to 54 Years | 166 (4.6%) | 3,176 (87.4%) |
| 55 to 64 Years | 482 (11.6%) | 3,601 (86.4%) |
| 65 to 74 Years | 3,094 (90.6%) | 1,454 (42.6%) |
| 75 Years and over | 3,033 (98.1%) | 1,756 (56.8%) |
| Total | 7,712 (26.1%) | 23,584 (79.7%) |
Disability Status by Sex by Age in Winter Park
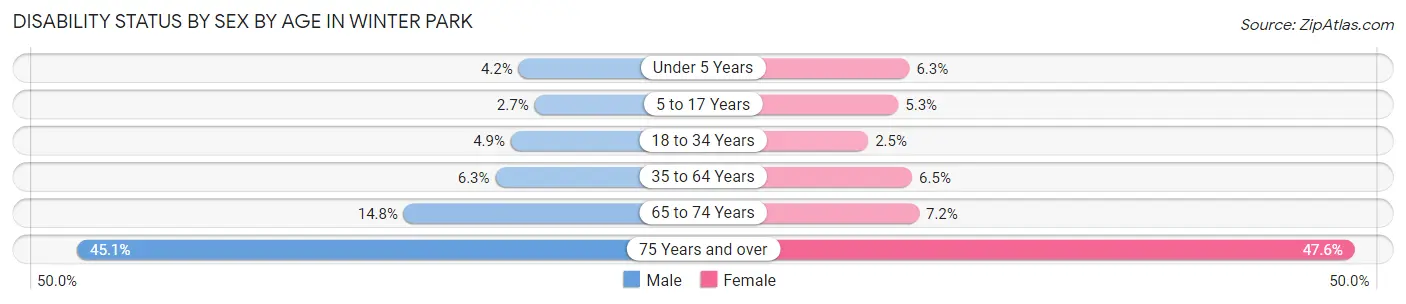
| Age Bracket | Male | Female |
| Under 5 Years | 25 (4.2%) | 38 (6.3%) |
| 5 to 17 Years | 60 (2.7%) | 91 (5.2%) |
| 18 to 34 Years | 141 (4.9%) | 97 (2.5%) |
| 35 to 64 Years | 335 (6.3%) | 375 (6.5%) |
| 65 to 74 Years | 206 (14.8%) | 145 (7.2%) |
| 75 Years and over | 644 (45.1%) | 793 (47.6%) |
Disability Class by Sex by Age in Winter Park
Disability Class: Hearing Difficulty
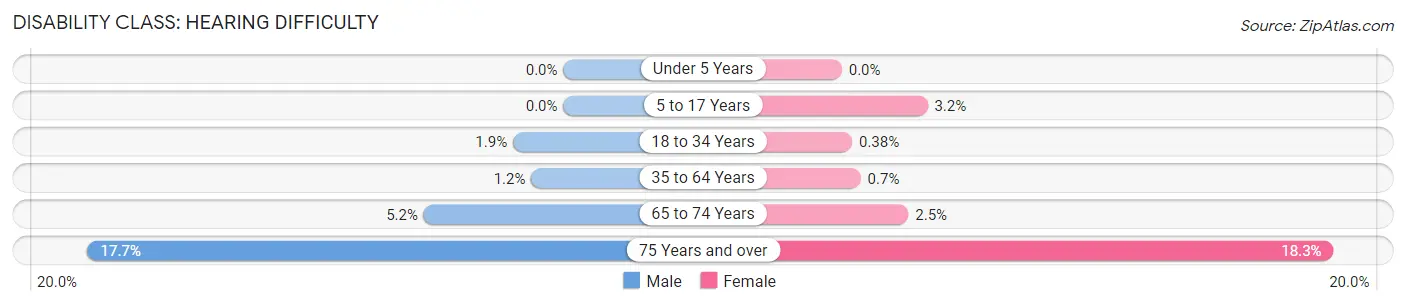
| Age Bracket | Male | Female |
| Under 5 Years | 0 (0.0%) | 0 (0.0%) |
| 5 to 17 Years | 0 (0.0%) | 55 (3.2%) |
| 18 to 34 Years | 54 (1.9%) | 15 (0.4%) |
| 35 to 64 Years | 63 (1.2%) | 40 (0.7%) |
| 65 to 74 Years | 72 (5.2%) | 50 (2.5%) |
| 75 Years and over | 252 (17.7%) | 304 (18.2%) |
Disability Class: Vision Difficulty
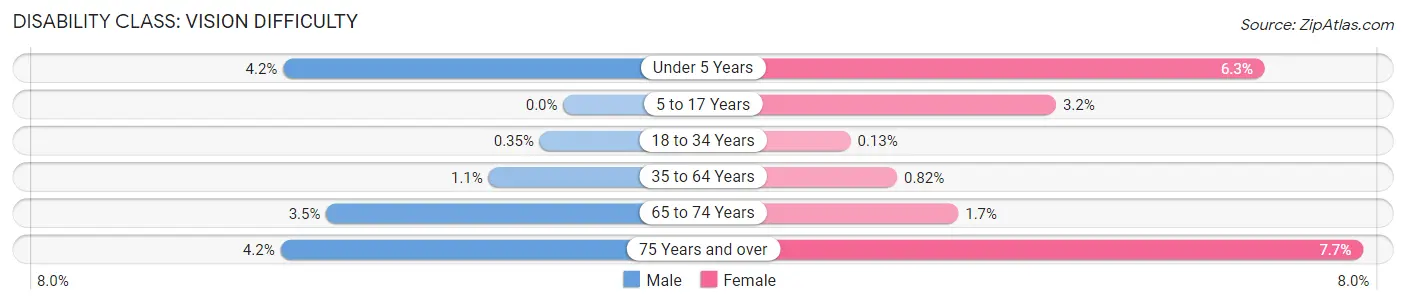
| Age Bracket | Male | Female |
| Under 5 Years | 25 (4.2%) | 38 (6.3%) |
| 5 to 17 Years | 0 (0.0%) | 55 (3.2%) |
| 18 to 34 Years | 10 (0.4%) | 5 (0.1%) |
| 35 to 64 Years | 59 (1.1%) | 47 (0.8%) |
| 65 to 74 Years | 49 (3.5%) | 35 (1.7%) |
| 75 Years and over | 60 (4.2%) | 129 (7.7%) |
Disability Class: Cognitive Difficulty
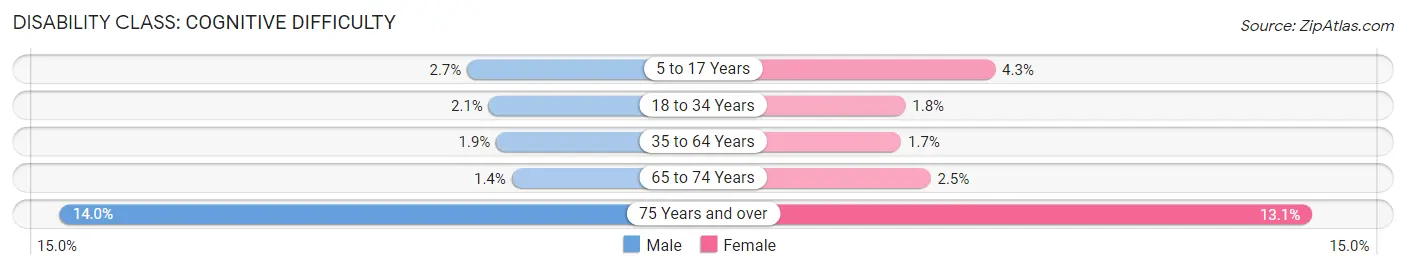
| Age Bracket | Male | Female |
| 5 to 17 Years | 60 (2.7%) | 74 (4.3%) |
| 18 to 34 Years | 60 (2.1%) | 70 (1.8%) |
| 35 to 64 Years | 99 (1.9%) | 95 (1.7%) |
| 65 to 74 Years | 20 (1.4%) | 50 (2.5%) |
| 75 Years and over | 200 (14.0%) | 218 (13.1%) |
Disability Class: Ambulatory Difficulty
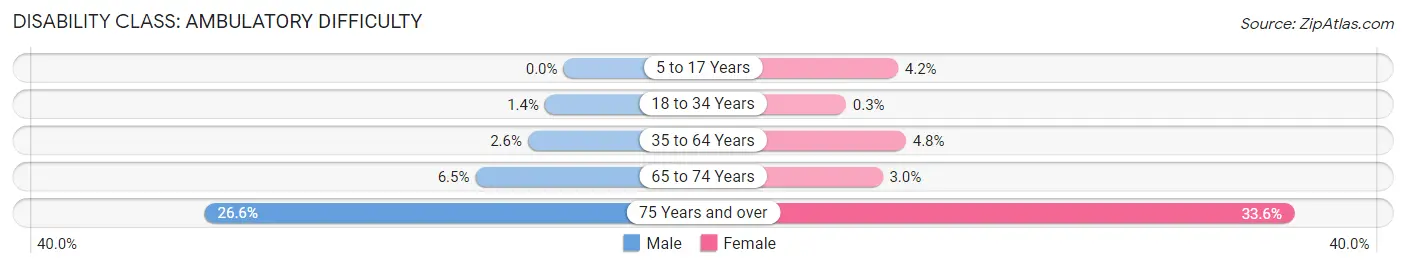
| Age Bracket | Male | Female |
| 5 to 17 Years | 0 (0.0%) | 72 (4.2%) |
| 18 to 34 Years | 40 (1.4%) | 12 (0.3%) |
| 35 to 64 Years | 140 (2.6%) | 273 (4.8%) |
| 65 to 74 Years | 91 (6.5%) | 61 (3.0%) |
| 75 Years and over | 380 (26.6%) | 559 (33.6%) |
Disability Class: Self-Care Difficulty
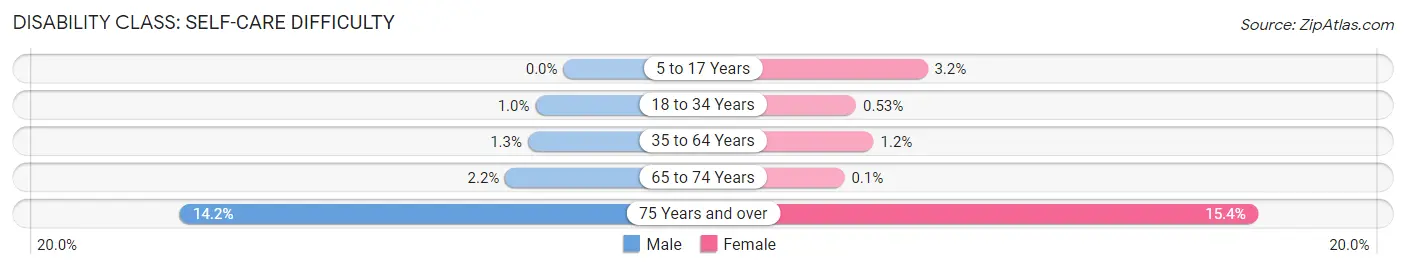
| Age Bracket | Male | Female |
| 5 to 17 Years | 0 (0.0%) | 55 (3.2%) |
| 18 to 34 Years | 30 (1.0%) | 21 (0.5%) |
| 35 to 64 Years | 70 (1.3%) | 68 (1.2%) |
| 65 to 74 Years | 30 (2.2%) | 2 (0.1%) |
| 75 Years and over | 203 (14.2%) | 257 (15.4%) |
Technology Access in Winter Park
Computing Device Access in Winter Park
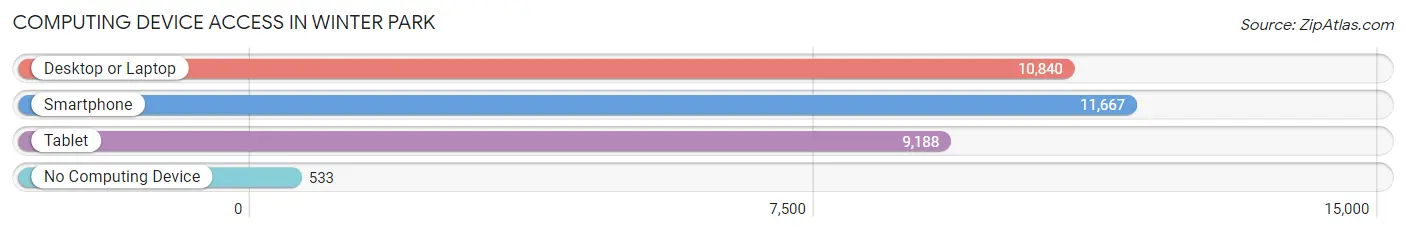
| Device Type | # Households | % Households |
| Desktop or Laptop | 10,840 | 86.0% |
| Smartphone | 11,667 | 92.5% |
| Tablet | 9,188 | 72.9% |
| No Computing Device | 533 | 4.2% |
| Total | 12,612 | 100.0% |
Internet Access in Winter Park
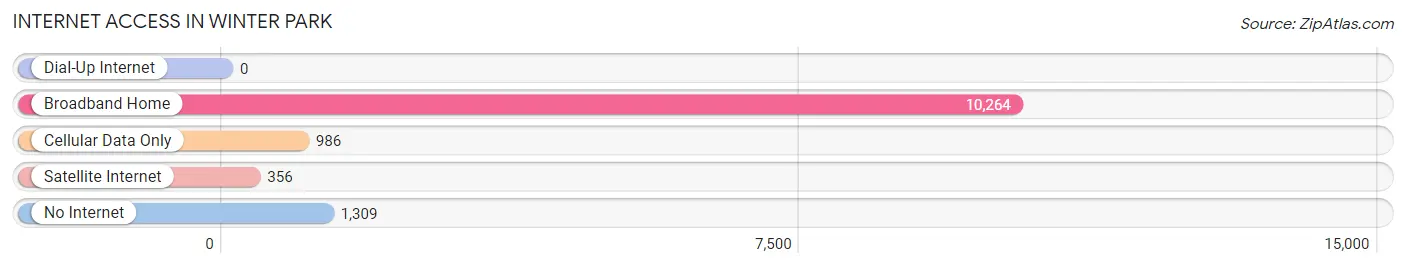
| Internet Type | # Households | % Households |
| Dial-Up Internet | 0 | 0.0% |
| Broadband Home | 10,264 | 81.4% |
| Cellular Data Only | 986 | 7.8% |
| Satellite Internet | 356 | 2.8% |
| No Internet | 1,309 | 10.4% |
| Total | 12,612 | 100.0% |
Winter Park Summary
Winter Park, Florida is a city located in Orange County, Florida, United States. It is part of the Orlando–Kissimmee–Sanford Metropolitan Statistical Area. The population was 28,083 at the 2010 census. Winter Park is known for its tree-lined streets, brick sidewalks, and its historic charm.
History
Winter Park was founded in 1882 by two wealthy New Englanders, Loring A. Chase and Oliver E. Chapman. The two men purchased a large tract of land in the area and began to develop it into a residential community. The city was named after the winter resort of the same name in New Hampshire.
The city was incorporated in 1887 and quickly became a popular destination for wealthy Northerners looking to escape the cold winters of the North. The city was known for its beautiful lakes, lush gardens, and grand homes.
In the early 1900s, Winter Park became a popular destination for wealthy Northerners looking to escape the cold winters of the North. The city was known for its beautiful lakes, lush gardens, and grand homes.
In the 1920s, Winter Park became a popular destination for wealthy Northerners looking to escape the cold winters of the North. The city was known for its beautiful lakes, lush gardens, and grand homes.
In the 1950s, Winter Park became a popular destination for wealthy Northerners looking to escape the cold winters of the North. The city was known for its beautiful lakes, lush gardens, and grand homes.
In the 1960s, Winter Park became a popular destination for wealthy Northerners looking to escape the cold winters of the North. The city was known for its beautiful lakes, lush gardens, and grand homes.
In the 1970s, Winter Park became a popular destination for wealthy Northerners looking to escape the cold winters of the North. The city was known for its beautiful lakes, lush gardens, and grand homes.
In the 1980s, Winter Park became a popular destination for wealthy Northerners looking to escape the cold winters of the North. The city was known for its beautiful lakes, lush gardens, and grand homes.
In the 1990s, Winter Park became a popular destination for wealthy Northerners looking to escape the cold winters of the North. The city was known for its beautiful lakes, lush gardens, and grand homes.
Geography
Winter Park is located in Orange County, Florida, United States. It is part of the Orlando–Kissimmee–Sanford Metropolitan Statistical Area. The city is located in Central Florida, approximately 20 miles north of downtown Orlando.
The city is situated on the western shore of Lake Virginia, a large lake located in the center of the city. The city is also bordered by Lake Maitland to the east and Lake Osceola to the south.
Economy
Winter Park is a major economic center in Central Florida. The city is home to a variety of businesses, including retail stores, restaurants, and professional services. The city is also home to Rollins College, a private liberal arts college, and Full Sail University, a for-profit university.
The city is also home to a number of corporate headquarters, including Darden Restaurants, Inc., Tupperware Brands Corporation, and Wyndham Vacation Ownership.
Demographics
As of the 2010 census, the population of Winter Park was 28,083. The racial makeup of the city was 77.3% White, 11.2% African American, 0.3% Native American, 4.2% Asian, 0.1% Pacific Islander, 4.2% from other races, and 2.9% from two or more races. Hispanic or Latino of any race were 11.3% of the population.
The median income for a household in the city was $50,945, and the median income for a family was $62,945. The per capita income for the city was $31,945. About 8.2% of families and 11.2% of the population were below the poverty line, including 15.2% of those under age 18 and 5.2% of those age 65 or over.
Common Questions
What is the Total Population of Winter Park?
Total Population of Winter Park is 29,985.
What is the Total Male Population of Winter Park?
Total Male Population of Winter Park is 14,022.
What is the Total Female Population of Winter Park?
Total Female Population of Winter Park is 15,963.
What is the Ratio of Males per 100 Females in Winter Park?
There are 87.84 Males per 100 Females in Winter Park.
What is the Ratio of Females per 100 Males in Winter Park?
There are 113.84 Females per 100 Males in Winter Park.
What is the Median Population Age in Winter Park?
Median Population Age in Winter Park is 44.3 Years.
What is the Average Family Size in Winter Park
Average Family Size in Winter Park is 2.9 People.
What is the Average Household Size in Winter Park
Average Household Size in Winter Park is 2.2 People.
What is Per Capita Income in Winter Park?
Per Capita income in Winter Park is $75,646.
What is the Median Family Income in Winter Park?
Median Family Income in Winter Park is $163,358.
What is the Median Household income in Winter Park?
Median Household Income in Winter Park is $96,563.
What is Income or Wage Gap in Winter Park?
Income or Wage Gap in Winter Park is 41.8%.
Women in Winter Park earn 58.2 cents for every dollar earned by a man.
What is Family Income Deficit in Winter Park?
Family Income Deficit in Winter Park is $8,229.
Families that are below poverty line in Winter Park earn $8,229 less on average than the poverty threshold level.
What is Inequality or Gini Index in Winter Park?
Inequality or Gini Index in Winter Park is 0.58.
How Large is the Labor Force in Winter Park?
There are 14,326 People in the Labor Forcein in Winter Park.
What is the Percentage of People in the Labor Force in Winter Park?
56.1% of People are in the Labor Force in Winter Park.
What is the Unemployment Rate in Winter Park?
Unemployment Rate in Winter Park is 3.9%.