Cypress Quarters, FL
Cypress Quarters Map
Cypress Quarters Overview
1,460
TOTAL POPULATION
726
MALE POPULATION
734
FEMALE POPULATION
98.91
MALES / 100 FEMALES
101.10
FEMALES / 100 MALES
33.0
MEDIAN AGE
4.8
AVG FAMILY SIZE
3.6
AVG HOUSEHOLD SIZE
$24,338
PER CAPITA INCOME
$29,375
AVG HOUSEHOLD INCOME
58.7%
WAGE / INCOME GAP [ % ]
41.3¢/ $1
WAGE / INCOME GAP [ $ ]
0.60
INEQUALITY / GINI INDEX
486
LABOR FORCE [ PEOPLE ]
48.3%
PERCENT IN LABOR FORCE
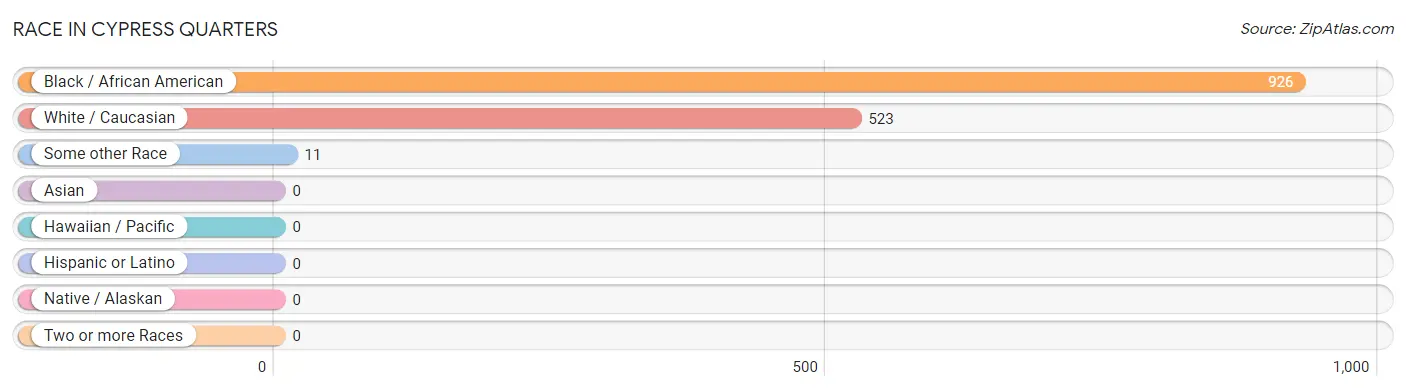
Race in Cypress Quarters
The most populous races in Cypress Quarters are Black / African American (926 | 63.4%), White / Caucasian (523 | 35.8%), and Some other Race (11 | 0.7%).
| Race | # Population | % Population |
| Asian | 0 | 0.0% |
| Black / African American | 926 | 63.4% |
| Hawaiian / Pacific | 0 | 0.0% |
| Hispanic or Latino | 0 | 0.0% |
| Native / Alaskan | 0 | 0.0% |
| White / Caucasian | 523 | 35.8% |
| Two or more Races | 0 | 0.0% |
| Some other Race | 11 | 0.7% |
| Total | 1,460 | 100.0% |
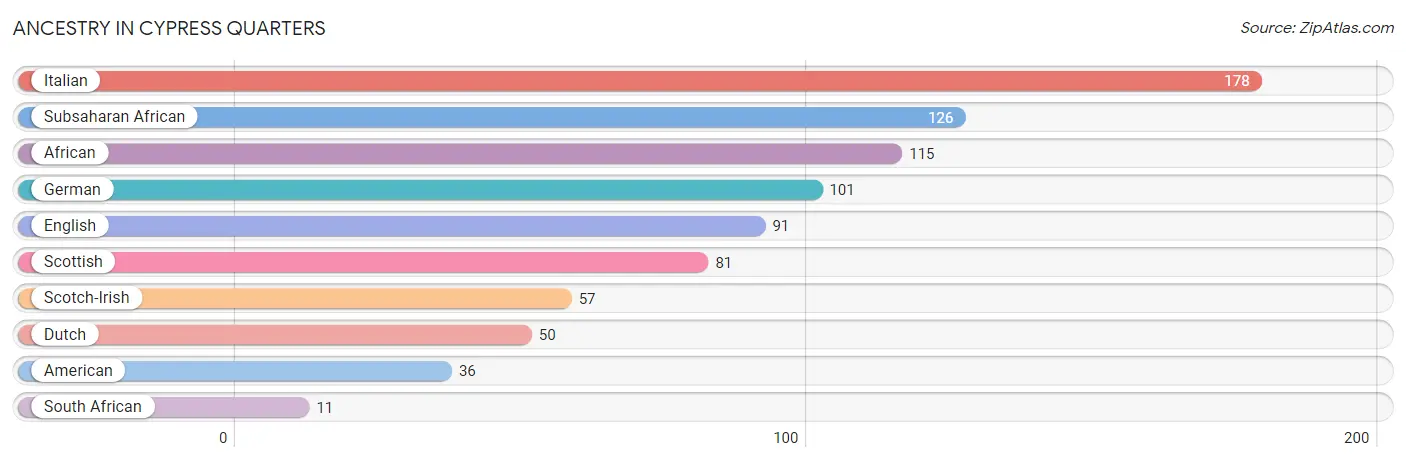
Ancestry in Cypress Quarters
The most populous ancestries reported in Cypress Quarters are Italian (178 | 12.2%), Subsaharan African (126 | 8.6%), African (115 | 7.9%), German (101 | 6.9%), and English (91 | 6.2%), together accounting for 41.8% of all Cypress Quarters residents.
| Ancestry | # Population | % Population |
| African | 115 | 7.9% |
| American | 36 | 2.5% |
| Dutch | 50 | 3.4% |
| English | 91 | 6.2% |
| German | 101 | 6.9% |
| Italian | 178 | 12.2% |
| Scotch-Irish | 57 | 3.9% |
| Scottish | 81 | 5.6% |
| South African | 11 | 0.7% |
| Subsaharan African | 126 | 8.6% | View All 10 Rows |
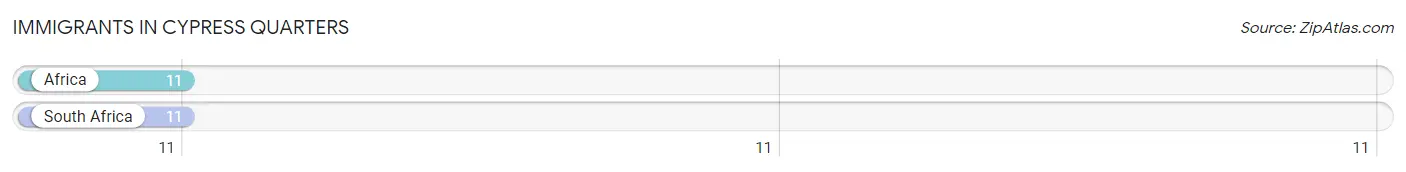
Immigrants in Cypress Quarters
The most numerous immigrant groups reported in Cypress Quarters came from Africa (11 | 0.7%), and South Africa (11 | 0.7%), together accounting for 1.5% of all Cypress Quarters residents.
| Immigration Origin | # Population | % Population |
| Africa | 11 | 0.7% |
| South Africa | 11 | 0.7% | View All 2 Rows |
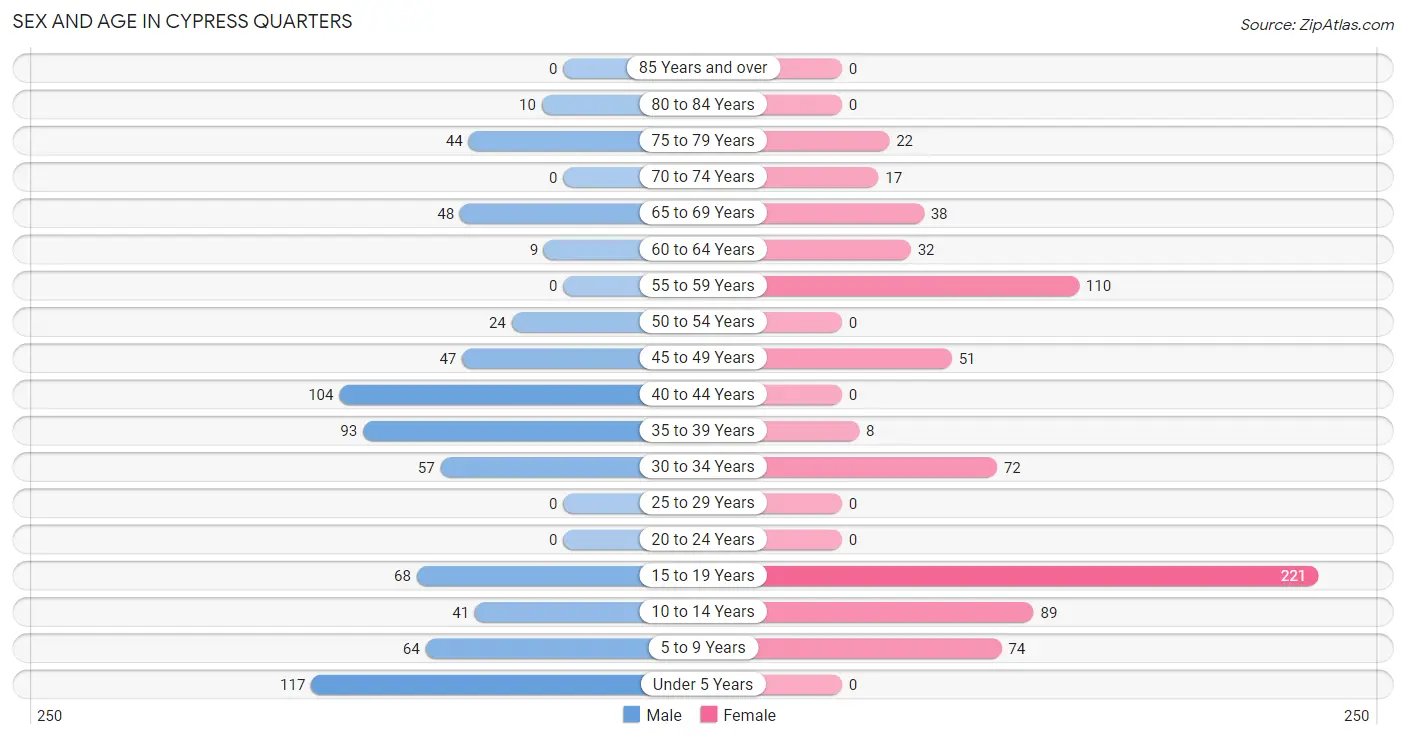
Sex and Age in Cypress Quarters
Sex and Age in Cypress Quarters
The most populous age groups in Cypress Quarters are Under 5 Years (117 | 16.1%) for men and 15 to 19 Years (221 | 30.1%) for women.
| Age Bracket | Male | Female |
| Under 5 Years | 117 (16.1%) | 0 (0.0%) |
| 5 to 9 Years | 64 (8.8%) | 74 (10.1%) |
| 10 to 14 Years | 41 (5.7%) | 89 (12.1%) |
| 15 to 19 Years | 68 (9.4%) | 221 (30.1%) |
| 20 to 24 Years | 0 (0.0%) | 0 (0.0%) |
| 25 to 29 Years | 0 (0.0%) | 0 (0.0%) |
| 30 to 34 Years | 57 (7.9%) | 72 (9.8%) |
| 35 to 39 Years | 93 (12.8%) | 8 (1.1%) |
| 40 to 44 Years | 104 (14.3%) | 0 (0.0%) |
| 45 to 49 Years | 47 (6.5%) | 51 (7.0%) |
| 50 to 54 Years | 24 (3.3%) | 0 (0.0%) |
| 55 to 59 Years | 0 (0.0%) | 110 (15.0%) |
| 60 to 64 Years | 9 (1.2%) | 32 (4.4%) |
| 65 to 69 Years | 48 (6.6%) | 38 (5.2%) |
| 70 to 74 Years | 0 (0.0%) | 17 (2.3%) |
| 75 to 79 Years | 44 (6.1%) | 22 (3.0%) |
| 80 to 84 Years | 10 (1.4%) | 0 (0.0%) |
| 85 Years and over | 0 (0.0%) | 0 (0.0%) |
| Total | 726 (100.0%) | 734 (100.0%) |
Families and Households in Cypress Quarters
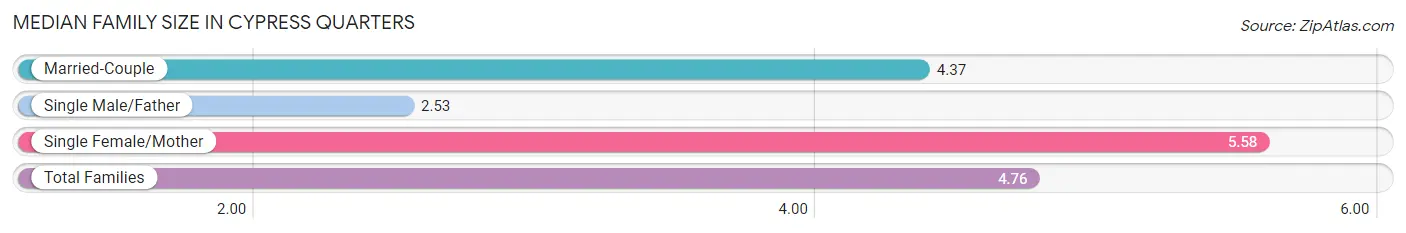
Median Family Size in Cypress Quarters
The median family size in Cypress Quarters is 4.76 persons per family, with single female/mother families (114 | 42.1%) accounting for the largest median family size of 5.58 persons per family. On the other hand, single male/father families (17 | 6.3%) represent the smallest median family size with 2.53 persons per family.
| Family Type | # Families | Family Size |
| Married-Couple | 140 (51.7%) | 4.37 |
| Single Male/Father | 17 (6.3%) | 2.53 |
| Single Female/Mother | 114 (42.1%) | 5.58 |
| Total Families | 271 (100.0%) | 4.76 |
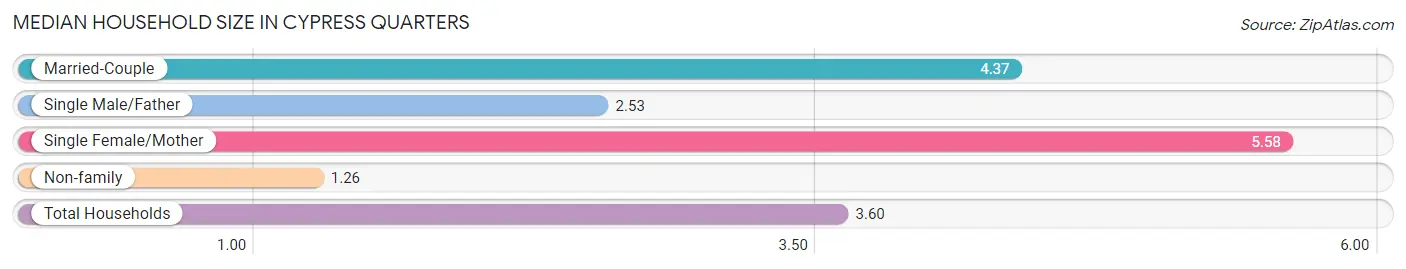
Median Household Size in Cypress Quarters
The median household size in Cypress Quarters is 3.60 persons per household, with single female/mother households (114 | 28.1%) accounting for the largest median household size of 5.58 persons per household. non-family households (134 | 33.1%) represent the smallest median household size with 1.26 persons per household.
| Household Type | # Households | Household Size |
| Married-Couple | 140 (34.6%) | 4.37 |
| Single Male/Father | 17 (4.2%) | 2.53 |
| Single Female/Mother | 114 (28.1%) | 5.58 |
| Non-family | 134 (33.1%) | 1.26 |
| Total Households | 405 (100.0%) | 3.60 |
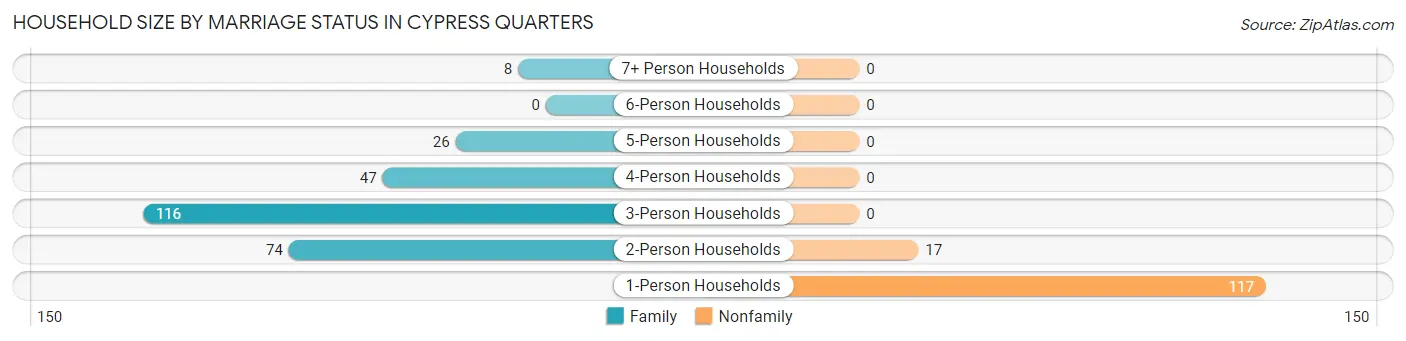
Household Size by Marriage Status in Cypress Quarters
Out of a total of 405 households in Cypress Quarters, 271 (66.9%) are family households, while 134 (33.1%) are nonfamily households. The most numerous type of family households are 3-person households, comprising 116, and the most common type of nonfamily households are 1-person households, comprising 117.
| Household Size | Family Households | Nonfamily Households |
| 1-Person Households | - | 117 (28.9%) |
| 2-Person Households | 74 (18.3%) | 17 (4.2%) |
| 3-Person Households | 116 (28.6%) | 0 (0.0%) |
| 4-Person Households | 47 (11.6%) | 0 (0.0%) |
| 5-Person Households | 26 (6.4%) | 0 (0.0%) |
| 6-Person Households | 0 (0.0%) | 0 (0.0%) |
| 7+ Person Households | 8 (2.0%) | 0 (0.0%) |
| Total | 271 (66.9%) | 134 (33.1%) |
Female Fertility in Cypress Quarters
Fertility by Age in Cypress Quarters
| Age Bracket | Women with Births | Births / 1,000 Women |
| 15 to 19 years | 0 (0.0%) | 0.0 |
| 20 to 34 years | 0 (0.0%) | 0.0 |
| 35 to 50 years | 0 (0.0%) | 0.0 |
| Total | 0 (0.0%) | 0.0 |
Fertility by Age by Marriage Status in Cypress Quarters
| Age Bracket | Married | Unmarried |
| 15 to 19 years | 0 (0.0%) | 0 (0.0%) |
| 20 to 34 years | 0 (0.0%) | 0 (0.0%) |
| 35 to 50 years | 0 (0.0%) | 0 (0.0%) |
| Total | 0 (0.0%) | 0 (0.0%) |
Fertility by Education in Cypress Quarters
| Educational Attainment | Women with Births | Births / 1,000 Women |
| Less than High School | 0 (0.0%) | 0.0 |
| High School Diploma | 0 (0.0%) | 0.0 |
| College or Associate's Degree | 0 (0.0%) | 0.0 |
| Bachelor's Degree | 0 (0.0%) | 0.0 |
| Graduate Degree | 0 (0.0%) | 0.0 |
| Total | 0 (0.0%) | 0.0 |
Fertility by Education by Marriage Status in Cypress Quarters
| Educational Attainment | Married | Unmarried |
| Less than High School | 0 (0.0%) | 0 (0.0%) |
| High School Diploma | 0 (0.0%) | 0 (0.0%) |
| College or Associate's Degree | 0 (0.0%) | 0 (0.0%) |
| Bachelor's Degree | 0 (0.0%) | 0 (0.0%) |
| Graduate Degree | 0 (0.0%) | 0 (0.0%) |
| Total | 0 (0.0%) | 0 (0.0%) |
Income in Cypress Quarters
Income Overview in Cypress Quarters
| Characteristic | Number | Measure |
| Per Capita Income | 1,460 | $24,338 |
| Median Family Income | 271 | $0 |
| Mean Family Income | 271 | $102,320 |
| Median Household Income | 405 | $29,375 |
| Mean Household Income | 405 | $75,773 |
| Income Deficit | 271 | $0 |
| Wage / Income Gap (%) | 1,460 | 58.70% |
| Wage / Income Gap ($) | 1,460 | 41.30¢ per $1 |
| Gini / Inequality Index | 1,460 | 0.60 |
Earnings by Sex in Cypress Quarters
Average Earnings in Cypress Quarters are $28,350, $40,773 for men and $16,840 for women, a difference of 58.7%.
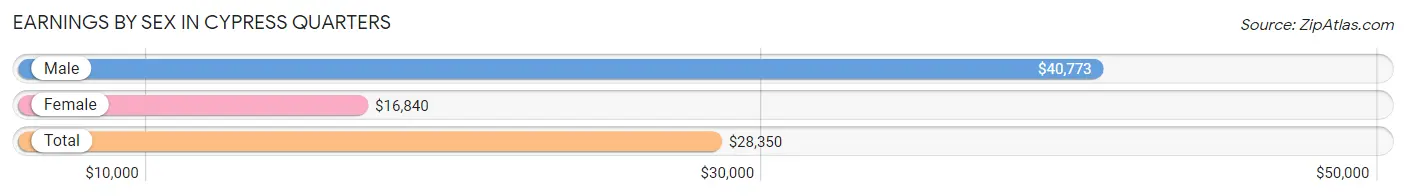
| Sex | Number | Average Earnings |
| Male | 289 (56.3%) | $40,773 |
| Female | 224 (43.7%) | $16,840 |
| Total | 513 (100.0%) | $28,350 |
Earnings by Sex by Income Bracket in Cypress Quarters
The most common earnings brackets in Cypress Quarters are $100,000+ for men (83 | 28.7%) and $15,000 to $17,499 for women (72 | 32.1%).
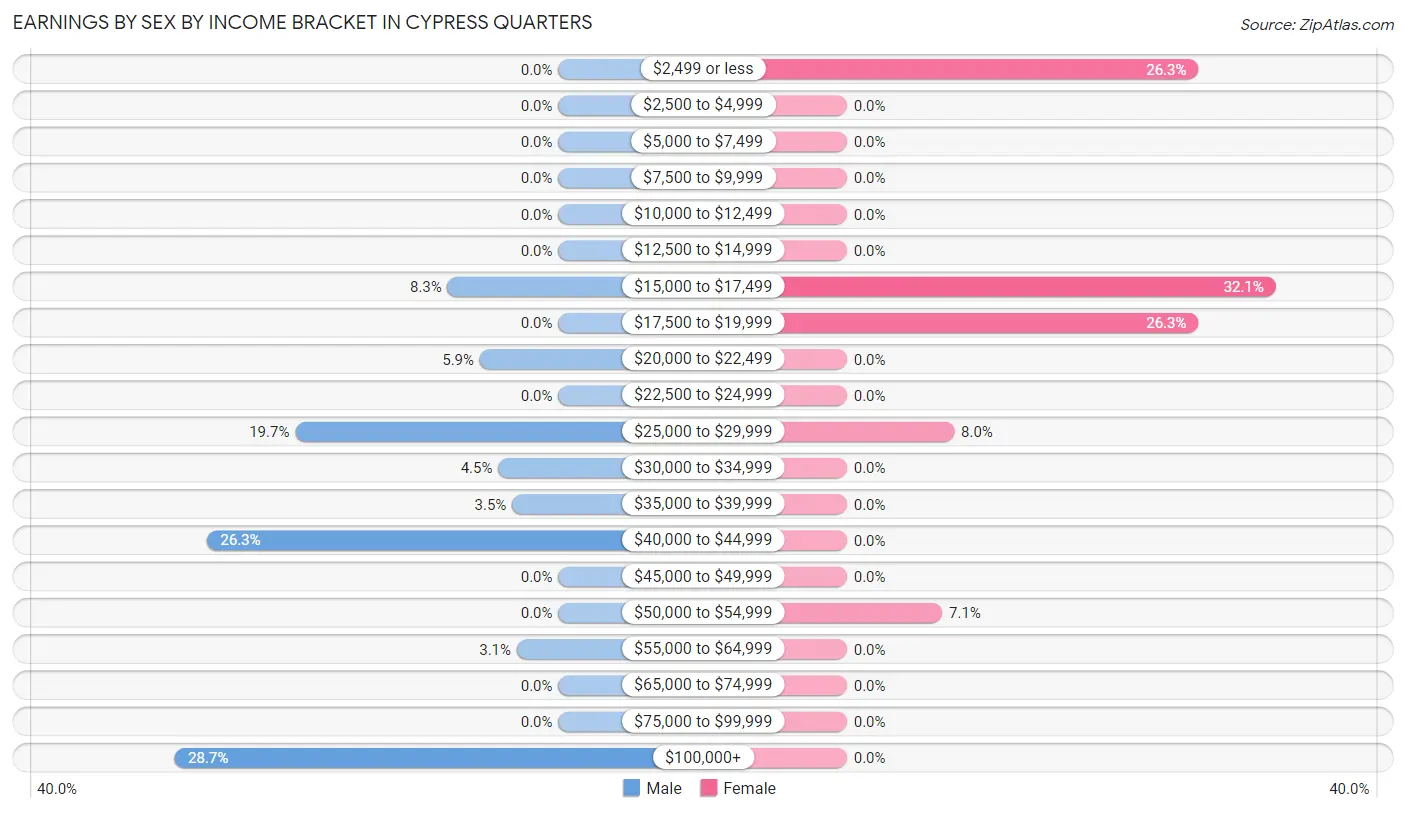
| Income | Male | Female |
| $2,499 or less | 0 (0.0%) | 59 (26.3%) |
| $2,500 to $4,999 | 0 (0.0%) | 0 (0.0%) |
| $5,000 to $7,499 | 0 (0.0%) | 0 (0.0%) |
| $7,500 to $9,999 | 0 (0.0%) | 0 (0.0%) |
| $10,000 to $12,499 | 0 (0.0%) | 0 (0.0%) |
| $12,500 to $14,999 | 0 (0.0%) | 0 (0.0%) |
| $15,000 to $17,499 | 24 (8.3%) | 72 (32.1%) |
| $17,500 to $19,999 | 0 (0.0%) | 59 (26.3%) |
| $20,000 to $22,499 | 17 (5.9%) | 0 (0.0%) |
| $22,500 to $24,999 | 0 (0.0%) | 0 (0.0%) |
| $25,000 to $29,999 | 57 (19.7%) | 18 (8.0%) |
| $30,000 to $34,999 | 13 (4.5%) | 0 (0.0%) |
| $35,000 to $39,999 | 10 (3.5%) | 0 (0.0%) |
| $40,000 to $44,999 | 76 (26.3%) | 0 (0.0%) |
| $45,000 to $49,999 | 0 (0.0%) | 0 (0.0%) |
| $50,000 to $54,999 | 0 (0.0%) | 16 (7.1%) |
| $55,000 to $64,999 | 9 (3.1%) | 0 (0.0%) |
| $65,000 to $74,999 | 0 (0.0%) | 0 (0.0%) |
| $75,000 to $99,999 | 0 (0.0%) | 0 (0.0%) |
| $100,000+ | 83 (28.7%) | 0 (0.0%) |
| Total | 289 (100.0%) | 224 (100.0%) |
Earnings by Sex by Educational Attainment in Cypress Quarters
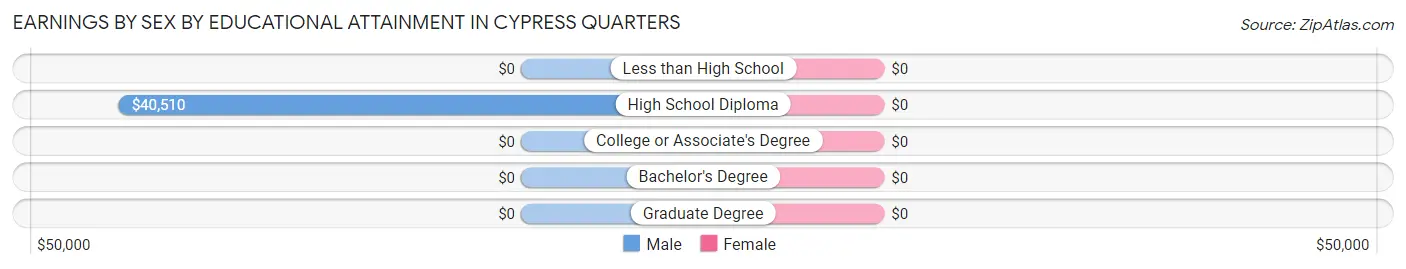
| Educational Attainment | Male Income | Female Income |
| Less than High School | - | - |
| High School Diploma | $40,510 | $0 |
| College or Associate's Degree | - | - |
| Bachelor's Degree | - | - |
| Graduate Degree | - | - |
| Total | $40,773 | $17,945 |
Family Income in Cypress Quarters
Family Income Brackets in Cypress Quarters
According to the Cypress Quarters family income data, there are 77 families falling into the $200,000+ income range, which is the most common income bracket and makes up 28.4% of all families.
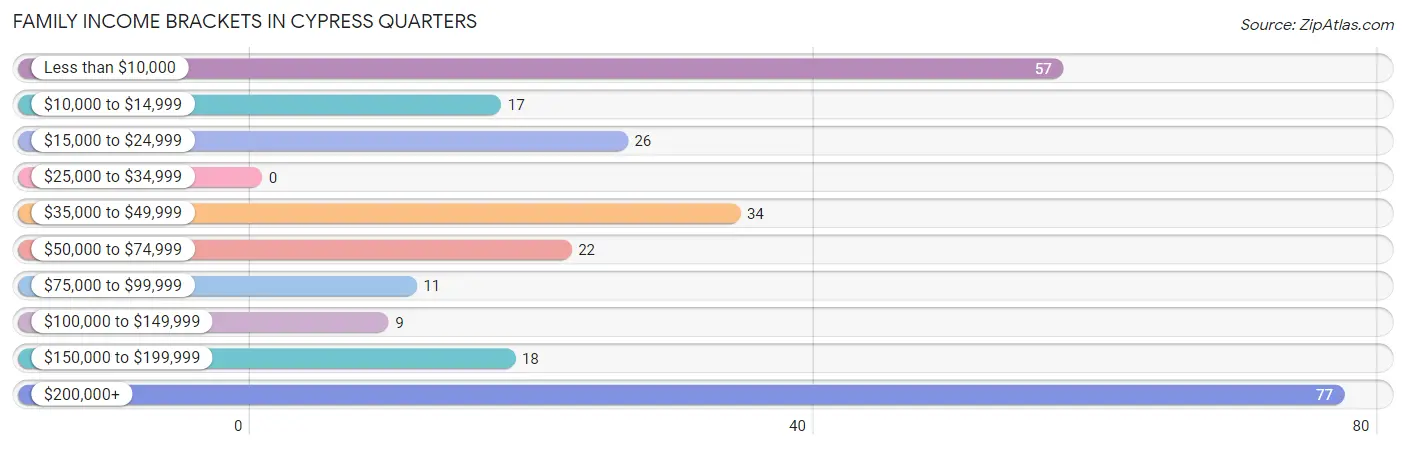
| Income Bracket | # Families | % Families |
| Less than $10,000 | 57 | 21.0% |
| $10,000 to $14,999 | 17 | 6.3% |
| $15,000 to $24,999 | 26 | 9.6% |
| $25,000 to $34,999 | 0 | 0.0% |
| $35,000 to $49,999 | 34 | 12.5% |
| $50,000 to $74,999 | 22 | 8.1% |
| $75,000 to $99,999 | 11 | 4.1% |
| $100,000 to $149,999 | 9 | 3.3% |
| $150,000 to $199,999 | 18 | 6.6% |
| $200,000+ | 77 | 28.4% |
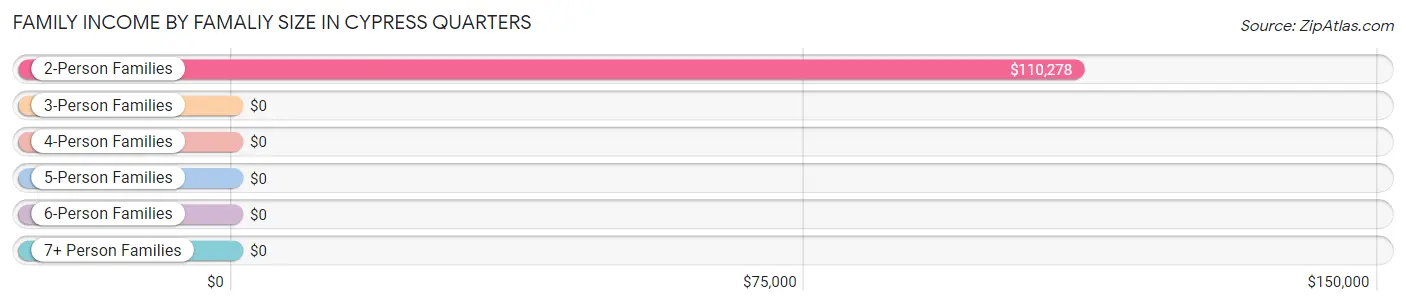
Family Income by Famaliy Size in Cypress Quarters
2-person families (74 | 27.3%) account for the highest median family income in Cypress Quarters with $110,278 per family, while 2-person families (74 | 27.3%) have the highest median income of $55,139 per family member.
| Income Bracket | # Families | Median Income |
| 2-Person Families | 74 (27.3%) | $110,278 |
| 3-Person Families | 116 (42.8%) | $0 |
| 4-Person Families | 47 (17.3%) | $0 |
| 5-Person Families | 26 (9.6%) | $0 |
| 6-Person Families | 0 (0.0%) | $0 |
| 7+ Person Families | 8 (2.9%) | $0 |
| Total | 271 (100.0%) | $0 |
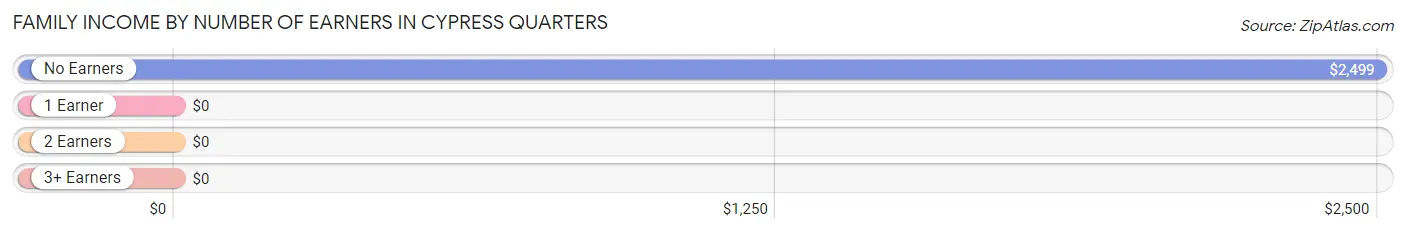
Family Income by Number of Earners in Cypress Quarters
| Number of Earners | # Families | Median Income |
| No Earners | 105 (38.8%) | $2,499 |
| 1 Earner | 92 (34.0%) | $0 |
| 2 Earners | 27 (10.0%) | $0 |
| 3+ Earners | 47 (17.3%) | $0 |
| Total | 271 (100.0%) | $0 |
Household Income in Cypress Quarters
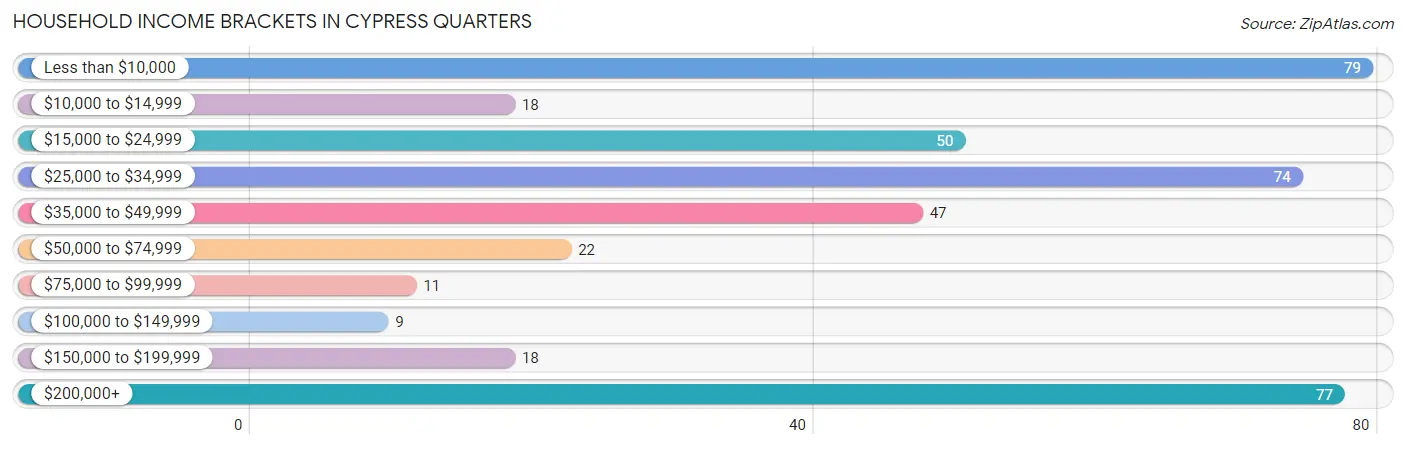
Household Income Brackets in Cypress Quarters
With 79 households falling in the category, the less than $10,000 income range is the most frequent in Cypress Quarters, accounting for 19.5% of all households. In contrast, only 9 households (2.2%) fall into the $100,000 to $149,999 income bracket, making it the least populous group.
| Income Bracket | # Households | % Households |
| Less than $10,000 | 79 | 19.5% |
| $10,000 to $14,999 | 18 | 4.4% |
| $15,000 to $24,999 | 50 | 12.3% |
| $25,000 to $34,999 | 74 | 18.3% |
| $35,000 to $49,999 | 47 | 11.6% |
| $50,000 to $74,999 | 22 | 5.4% |
| $75,000 to $99,999 | 11 | 2.7% |
| $100,000 to $149,999 | 9 | 2.2% |
| $150,000 to $199,999 | 18 | 4.4% |
| $200,000+ | 77 | 19.0% |
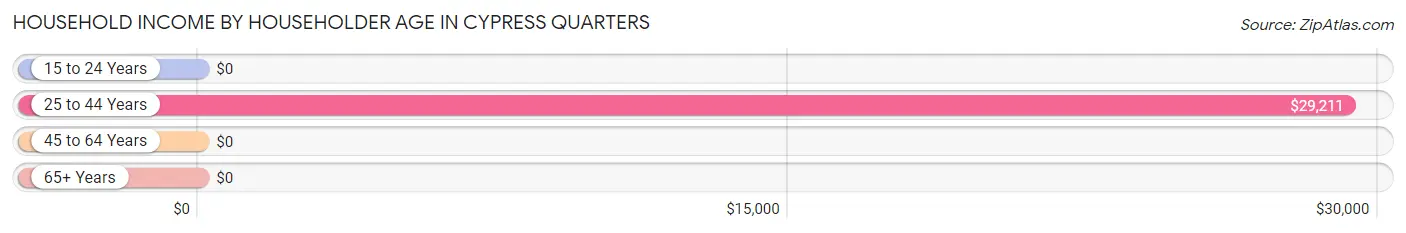
Household Income by Householder Age in Cypress Quarters
The median household income in Cypress Quarters is $29,375, with the highest median household income of $29,211 found in the 25 to 44 years age bracket for the primary householder. A total of 86 households (21.2%) fall into this category.
| Income Bracket | # Households | Median Income |
| 15 to 24 Years | 0 (0.0%) | $0 |
| 25 to 44 Years | 86 (21.2%) | $29,211 |
| 45 to 64 Years | 195 (48.1%) | $0 |
| 65+ Years | 124 (30.6%) | $0 |
| Total | 405 (100.0%) | $29,375 |
Poverty in Cypress Quarters
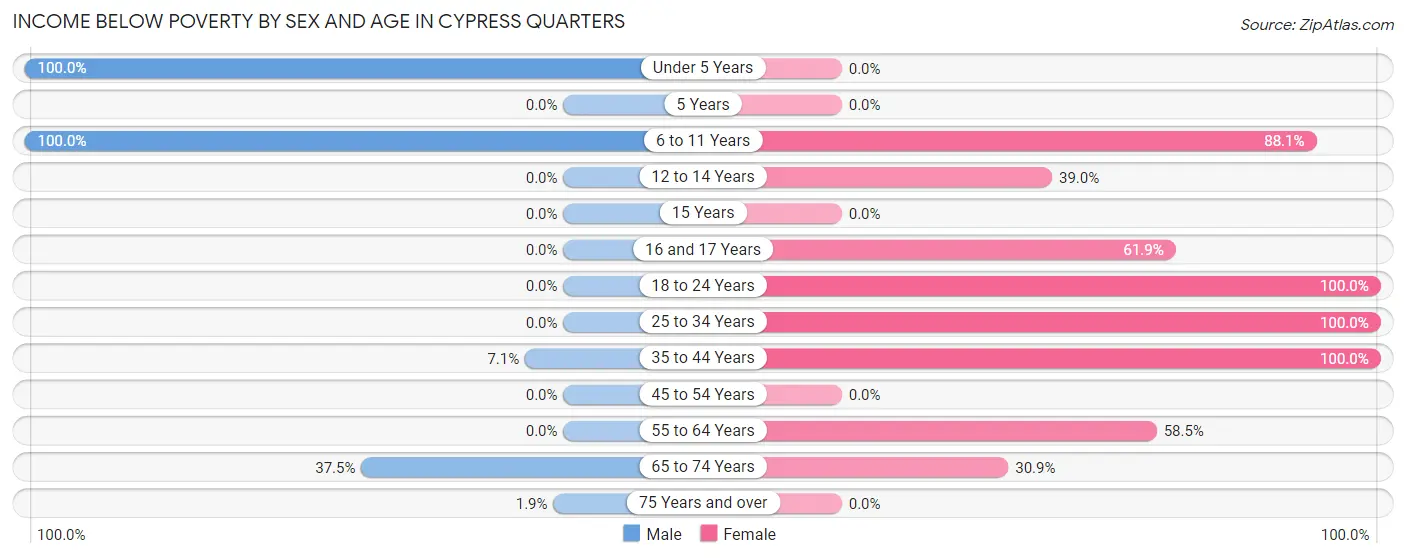
Income Below Poverty by Sex and Age in Cypress Quarters
With 25.9% poverty level for males and 61.9% for females among the residents of Cypress Quarters, under 5 year old males and 18 to 24 year old females are the most vulnerable to poverty, with 82 males (100.0%) and 66 females (100.0%) in their respective age groups living below the poverty level.
| Age Bracket | Male | Female |
| Under 5 Years | 82 (100.0%) | 0 (0.0%) |
| 5 Years | 0 (0.0%) | 0 (0.0%) |
| 6 to 11 Years | 64 (100.0%) | 96 (88.1%) |
| 12 to 14 Years | 0 (0.0%) | 16 (39.0%) |
| 15 Years | 0 (0.0%) | 0 (0.0%) |
| 16 and 17 Years | 0 (0.0%) | 96 (61.9%) |
| 18 to 24 Years | 0 (0.0%) | 66 (100.0%) |
| 25 to 34 Years | 0 (0.0%) | 72 (100.0%) |
| 35 to 44 Years | 14 (7.1%) | 8 (100.0%) |
| 45 to 54 Years | 0 (0.0%) | 0 (0.0%) |
| 55 to 64 Years | 0 (0.0%) | 83 (58.5%) |
| 65 to 74 Years | 18 (37.5%) | 17 (30.9%) |
| 75 Years and over | 1 (1.8%) | 0 (0.0%) |
| Total | 179 (25.9%) | 454 (61.9%) |
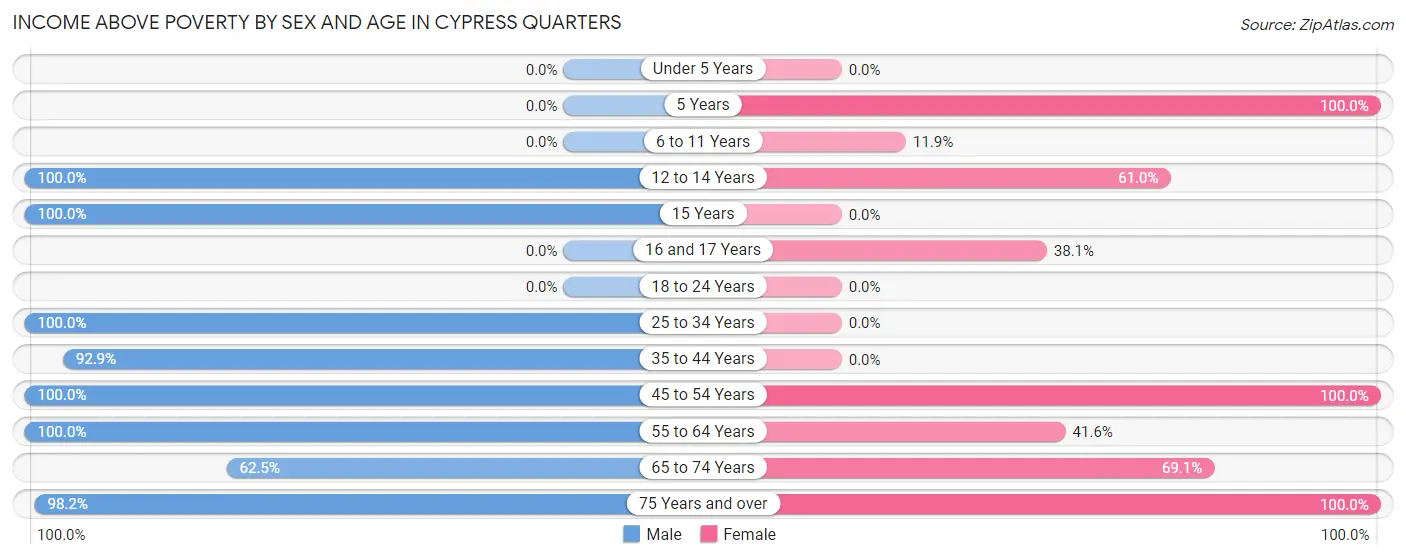
Income Above Poverty by Sex and Age in Cypress Quarters
According to the poverty statistics in Cypress Quarters, males aged 12 to 14 years and females aged 5 years are the age groups that are most secure financially, with 100.0% of males and 100.0% of females in these age groups living above the poverty line.
| Age Bracket | Male | Female |
| Under 5 Years | 0 (0.0%) | 0 (0.0%) |
| 5 Years | 0 (0.0%) | 13 (100.0%) |
| 6 to 11 Years | 0 (0.0%) | 13 (11.9%) |
| 12 to 14 Years | 41 (100.0%) | 25 (61.0%) |
| 15 Years | 68 (100.0%) | 0 (0.0%) |
| 16 and 17 Years | 0 (0.0%) | 59 (38.1%) |
| 18 to 24 Years | 0 (0.0%) | 0 (0.0%) |
| 25 to 34 Years | 57 (100.0%) | 0 (0.0%) |
| 35 to 44 Years | 183 (92.9%) | 0 (0.0%) |
| 45 to 54 Years | 71 (100.0%) | 51 (100.0%) |
| 55 to 64 Years | 9 (100.0%) | 59 (41.5%) |
| 65 to 74 Years | 30 (62.5%) | 38 (69.1%) |
| 75 Years and over | 53 (98.2%) | 22 (100.0%) |
| Total | 512 (74.1%) | 280 (38.2%) |
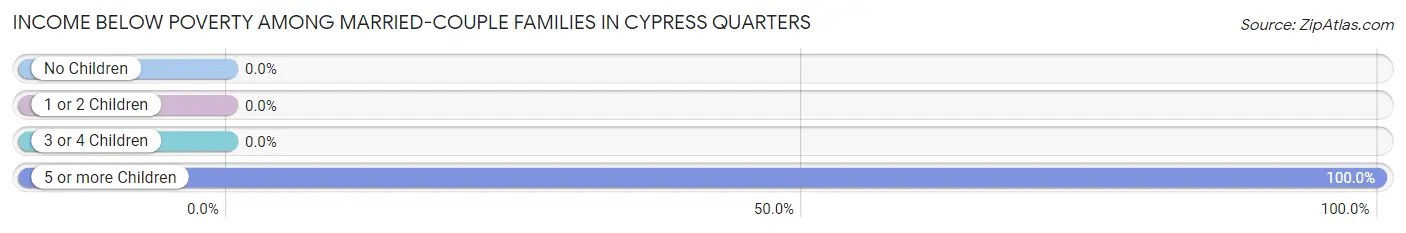
Income Below Poverty Among Married-Couple Families in Cypress Quarters
The poverty statistics for married-couple families in Cypress Quarters show that 5.7% or 8 of the total 140 families live below the poverty line. Families with 5 or more children have the highest poverty rate of 100.0%, comprising of 8 families. On the other hand, families with no children have the lowest poverty rate of 0.0%, which includes 0 families.
| Children | Above Poverty | Below Poverty |
| No Children | 66 (100.0%) | 0 (0.0%) |
| 1 or 2 Children | 66 (100.0%) | 0 (0.0%) |
| 3 or 4 Children | 0 (0.0%) | 0 (0.0%) |
| 5 or more Children | 0 (0.0%) | 8 (100.0%) |
| Total | 132 (94.3%) | 8 (5.7%) |
Income Below Poverty Among Single-Parent Households in Cypress Quarters
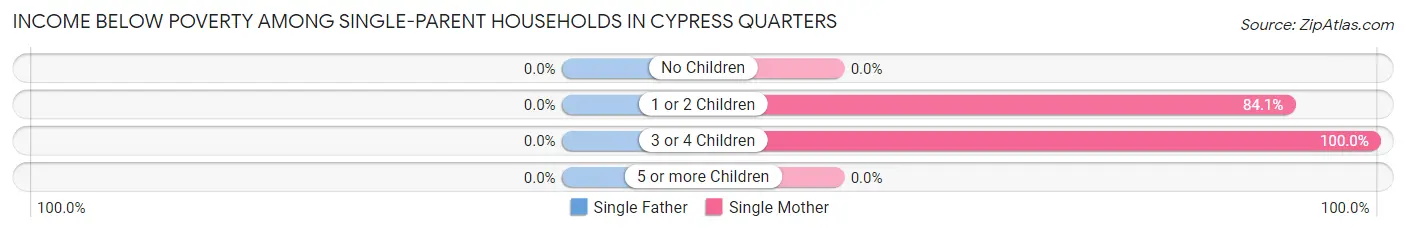
| Children | Single Father | Single Mother |
| No Children | 0 (0.0%) | 0 (0.0%) |
| 1 or 2 Children | 0 (0.0%) | 74 (84.1%) |
| 3 or 4 Children | 0 (0.0%) | 26 (100.0%) |
| 5 or more Children | 0 (0.0%) | 0 (0.0%) |
| Total | 0 (0.0%) | 100 (87.7%) |
Income Below Poverty Among Married-Couple vs Single-Parent Households in Cypress Quarters
The poverty data for Cypress Quarters shows that 8 of the married-couple family households (5.7%) and 100 of the single-parent households (76.3%) are living below the poverty level. Within the married-couple family households, those with 5 or more children have the highest poverty rate, with 8 households (100.0%) falling below the poverty line. Among the single-parent households, those with 3 or 4 children have the highest poverty rate, with 26 household (100.0%) living below poverty.
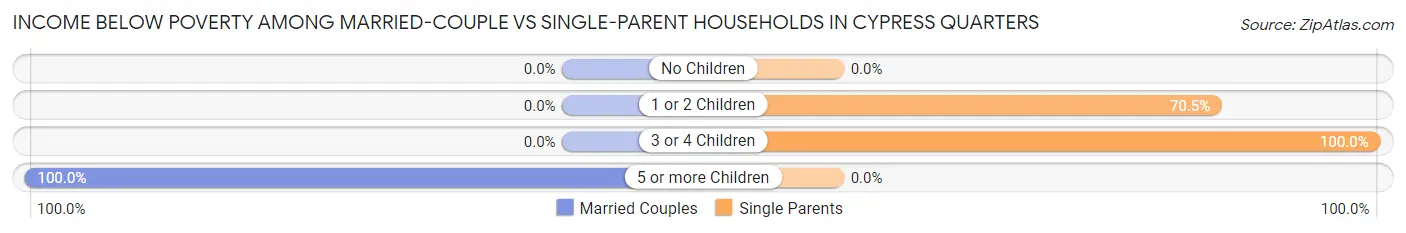
| Children | Married-Couple Families | Single-Parent Households |
| No Children | 0 (0.0%) | 0 (0.0%) |
| 1 or 2 Children | 0 (0.0%) | 74 (70.5%) |
| 3 or 4 Children | 0 (0.0%) | 26 (100.0%) |
| 5 or more Children | 8 (100.0%) | 0 (0.0%) |
| Total | 8 (5.7%) | 100 (76.3%) |
Employment Characteristics in Cypress Quarters
Employment by Class of Employer in Cypress Quarters
Among the 427 employed individuals in Cypress Quarters, private company employees (316 | 74.0%), not-for-profit organizations (70 | 16.4%), and self-employed (not incorporated) (24 | 5.6%) make up the most common classes of employment.
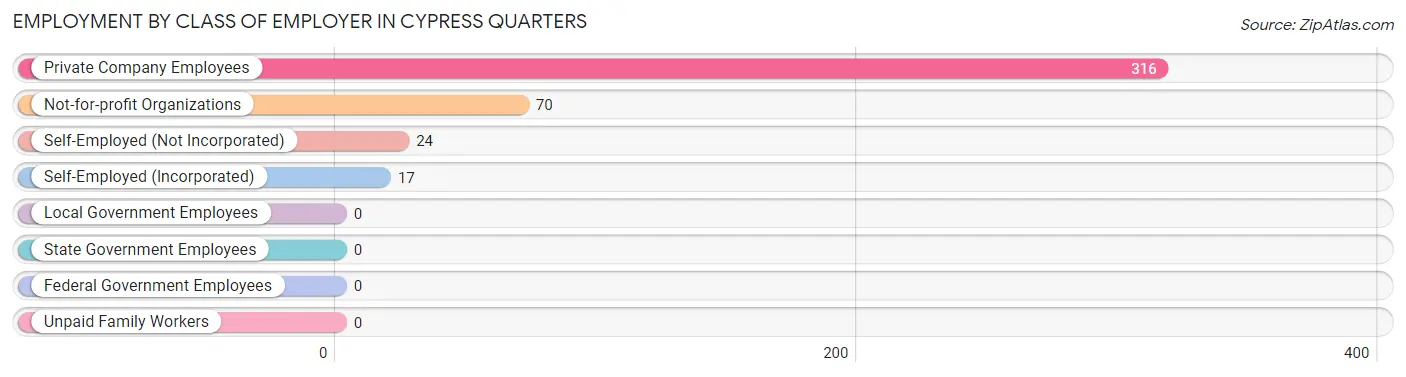
| Employer Class | # Employees | % Employees |
| Private Company Employees | 316 | 74.0% |
| Self-Employed (Incorporated) | 17 | 4.0% |
| Self-Employed (Not Incorporated) | 24 | 5.6% |
| Not-for-profit Organizations | 70 | 16.4% |
| Local Government Employees | 0 | 0.0% |
| State Government Employees | 0 | 0.0% |
| Federal Government Employees | 0 | 0.0% |
| Unpaid Family Workers | 0 | 0.0% |
| Total | 427 | 100.0% |
Employment Status by Age in Cypress Quarters
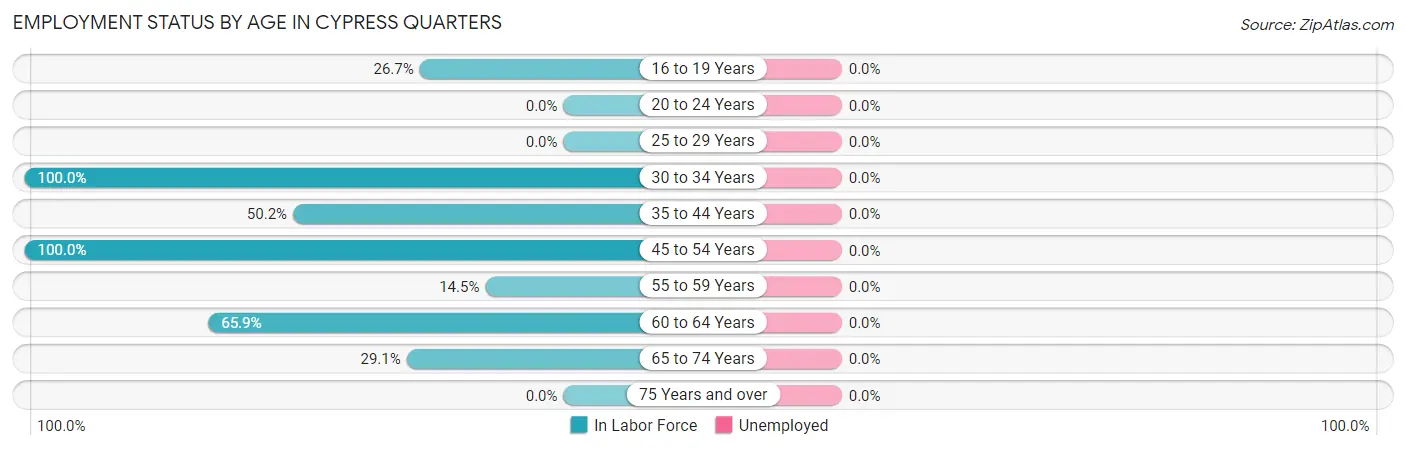
| Age Bracket | In Labor Force | Unemployed |
| 16 to 19 Years | 59 (26.7%) | 0 (0.0%) |
| 20 to 24 Years | 0 (0.0%) | 0 (0.0%) |
| 25 to 29 Years | 0 (0.0%) | 0 (0.0%) |
| 30 to 34 Years | 129 (100.0%) | 0 (0.0%) |
| 35 to 44 Years | 103 (50.2%) | 0 (0.0%) |
| 45 to 54 Years | 122 (100.0%) | 0 (0.0%) |
| 55 to 59 Years | 16 (14.5%) | 0 (0.0%) |
| 60 to 64 Years | 27 (65.9%) | 0 (0.0%) |
| 65 to 74 Years | 30 (29.1%) | 0 (0.0%) |
| 75 Years and over | 0 (0.0%) | 0 (0.0%) |
| Total | 486 (48.3%) | 0 (0.0%) |
Employment Status by Educational Attainment in Cypress Quarters
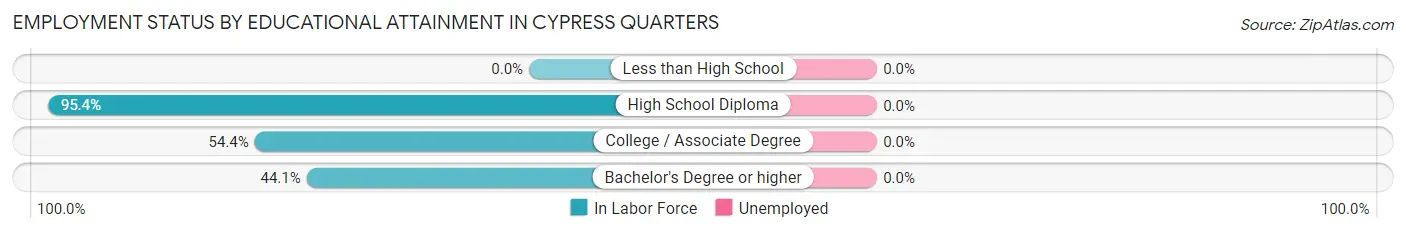
| Educational Attainment | In Labor Force | Unemployed |
| Less than High School | 0 (0.0%) | 0 (0.0%) |
| High School Diploma | 247 (95.4%) | 0 (0.0%) |
| College / Associate Degree | 68 (54.4%) | 0 (0.0%) |
| Bachelor's Degree or higher | 82 (44.1%) | 0 (0.0%) |
| Total | 397 (65.4%) | 0 (0.0%) |
Employment Occupations by Sex in Cypress Quarters
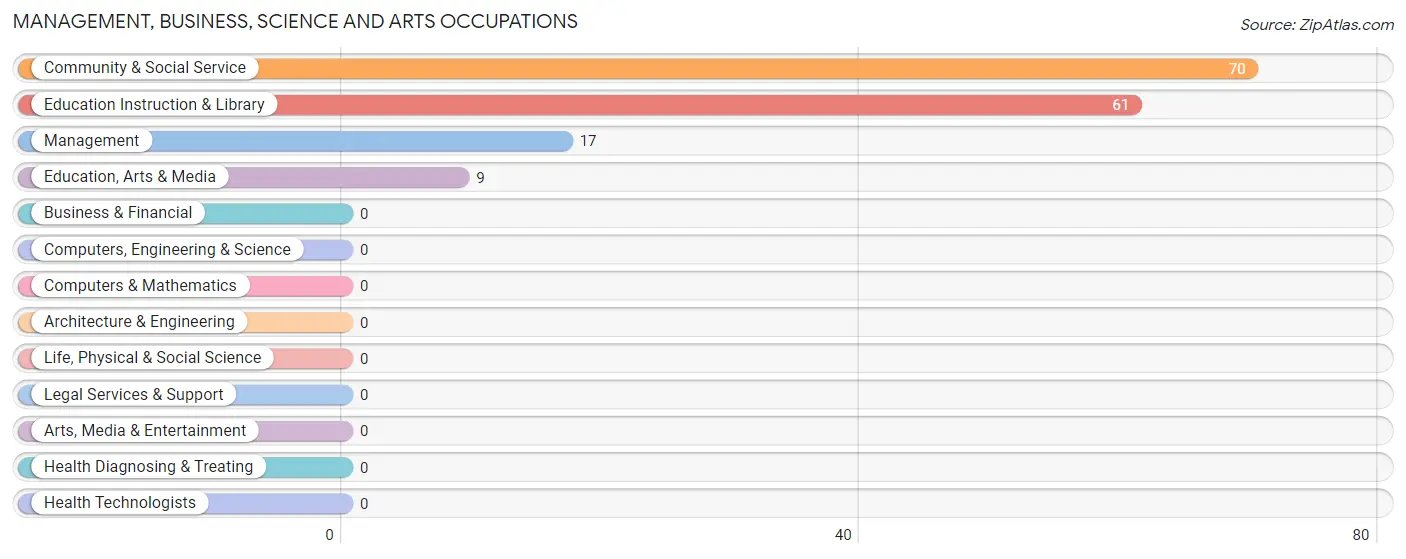
Management, Business, Science and Arts Occupations
The most common Management, Business, Science and Arts occupations in Cypress Quarters are Community & Social Service (70 | 14.4%), Education Instruction & Library (61 | 12.6%), Management (17 | 3.5%), and Education, Arts & Media (9 | 1.8%).
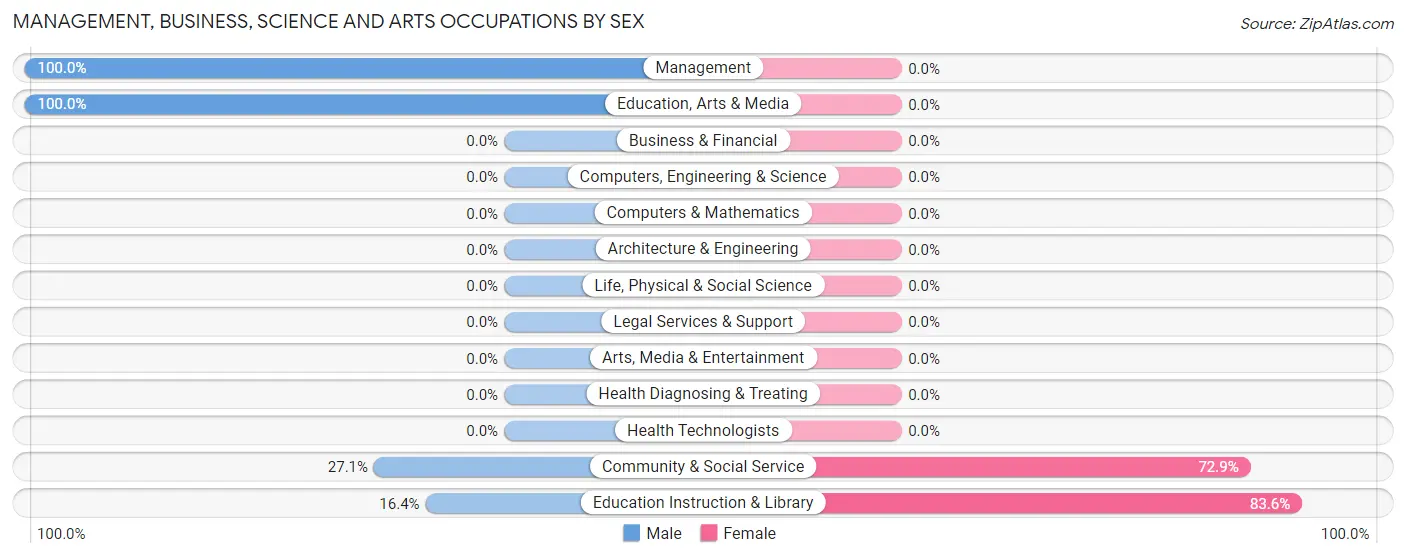
Management, Business, Science and Arts Occupations by Sex
Within the Management, Business, Science and Arts occupations in Cypress Quarters, the most male-oriented occupations are Management (100.0%), Education, Arts & Media (100.0%), and Community & Social Service (27.1%), while the most female-oriented occupations are Education Instruction & Library (83.6%), and Community & Social Service (72.9%).
| Occupation | Male | Female |
| Management | 17 (100.0%) | 0 (0.0%) |
| Business & Financial | 0 (0.0%) | 0 (0.0%) |
| Computers, Engineering & Science | 0 (0.0%) | 0 (0.0%) |
| Computers & Mathematics | 0 (0.0%) | 0 (0.0%) |
| Architecture & Engineering | 0 (0.0%) | 0 (0.0%) |
| Life, Physical & Social Science | 0 (0.0%) | 0 (0.0%) |
| Community & Social Service | 19 (27.1%) | 51 (72.9%) |
| Education, Arts & Media | 9 (100.0%) | 0 (0.0%) |
| Legal Services & Support | 0 (0.0%) | 0 (0.0%) |
| Education Instruction & Library | 10 (16.4%) | 51 (83.6%) |
| Arts, Media & Entertainment | 0 (0.0%) | 0 (0.0%) |
| Health Diagnosing & Treating | 0 (0.0%) | 0 (0.0%) |
| Health Technologists | 0 (0.0%) | 0 (0.0%) |
| Total (Category) | 36 (41.4%) | 51 (58.6%) |
| Total (Overall) | 270 (55.6%) | 216 (44.4%) |
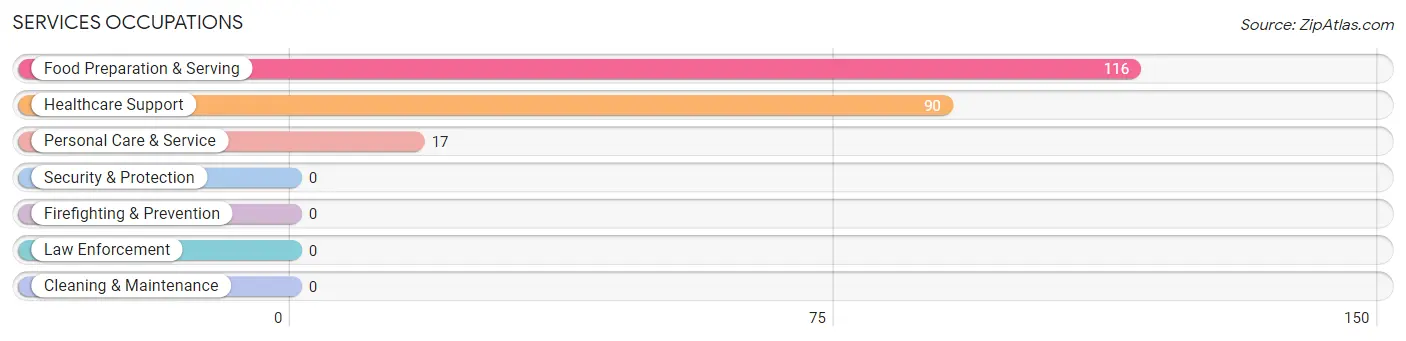
Services Occupations
The most common Services occupations in Cypress Quarters are Food Preparation & Serving (116 | 23.9%), Healthcare Support (90 | 18.5%), and Personal Care & Service (17 | 3.5%).
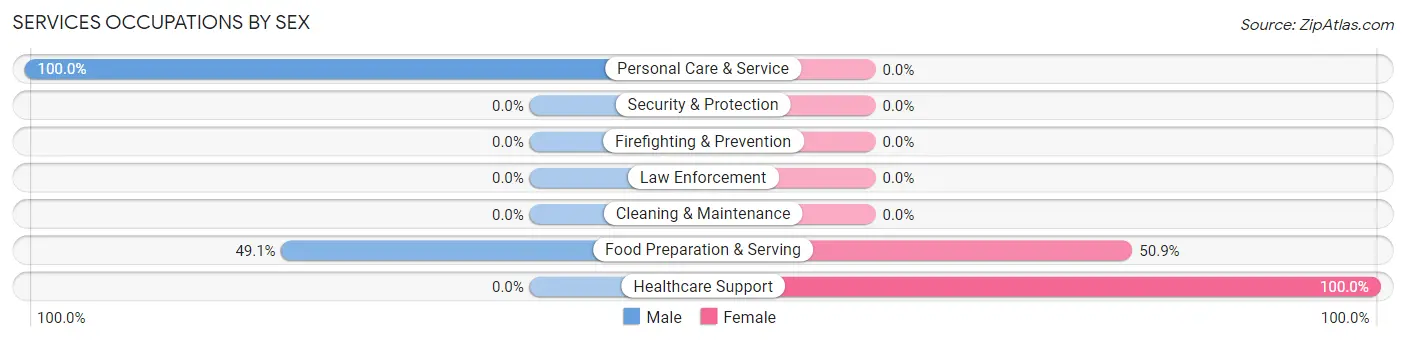
Services Occupations by Sex
Within the Services occupations in Cypress Quarters, the most male-oriented occupations are Personal Care & Service (100.0%), and Food Preparation & Serving (49.1%), while the most female-oriented occupations are Healthcare Support (100.0%), and Food Preparation & Serving (50.9%).
| Occupation | Male | Female |
| Healthcare Support | 0 (0.0%) | 90 (100.0%) |
| Security & Protection | 0 (0.0%) | 0 (0.0%) |
| Firefighting & Prevention | 0 (0.0%) | 0 (0.0%) |
| Law Enforcement | 0 (0.0%) | 0 (0.0%) |
| Food Preparation & Serving | 57 (49.1%) | 59 (50.9%) |
| Cleaning & Maintenance | 0 (0.0%) | 0 (0.0%) |
| Personal Care & Service | 17 (100.0%) | 0 (0.0%) |
| Total (Category) | 74 (33.2%) | 149 (66.8%) |
| Total (Overall) | 270 (55.6%) | 216 (44.4%) |
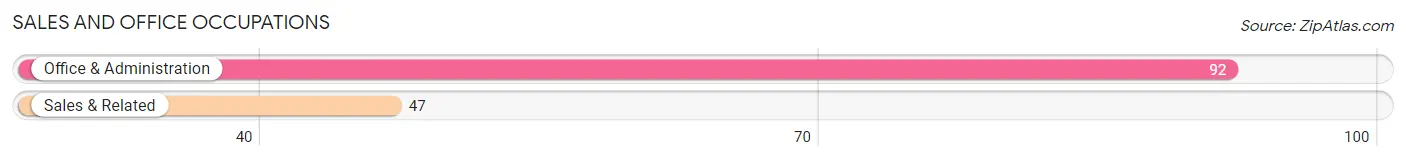
Sales and Office Occupations
The most common Sales and Office occupations in Cypress Quarters are Office & Administration (92 | 18.9%), and Sales & Related (47 | 9.7%).
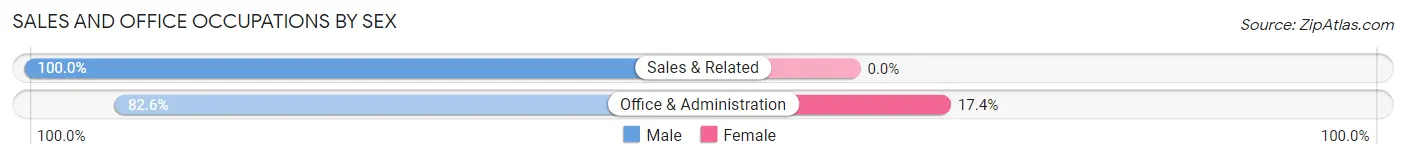
Sales and Office Occupations by Sex
| Occupation | Male | Female |
| Sales & Related | 47 (100.0%) | 0 (0.0%) |
| Office & Administration | 76 (82.6%) | 16 (17.4%) |
| Total (Category) | 123 (88.5%) | 16 (11.5%) |
| Total (Overall) | 270 (55.6%) | 216 (44.4%) |
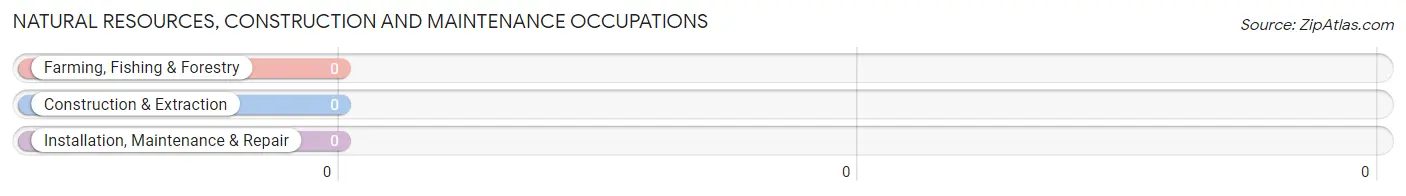
Natural Resources, Construction and Maintenance Occupations
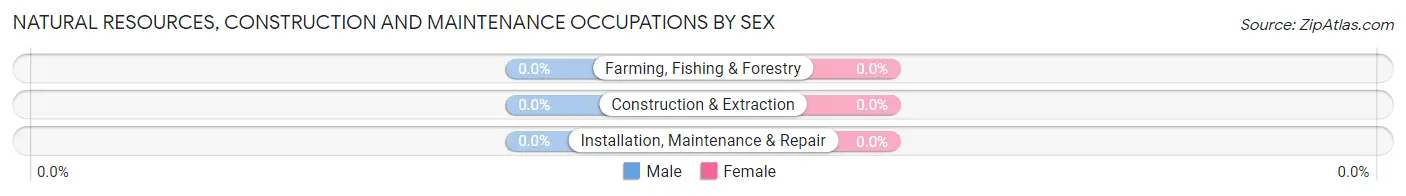
Natural Resources, Construction and Maintenance Occupations by Sex
| Occupation | Male | Female |
| Farming, Fishing & Forestry | 0 (0.0%) | 0 (0.0%) |
| Construction & Extraction | 0 (0.0%) | 0 (0.0%) |
| Installation, Maintenance & Repair | 0 (0.0%) | 0 (0.0%) |
| Total (Category) | 0 (0.0%) | 0 (0.0%) |
| Total (Overall) | 270 (55.6%) | 216 (44.4%) |
Production, Transportation and Moving Occupations
The most common Production, Transportation and Moving occupations in Cypress Quarters are , and Material Moving (37 | 7.6%).
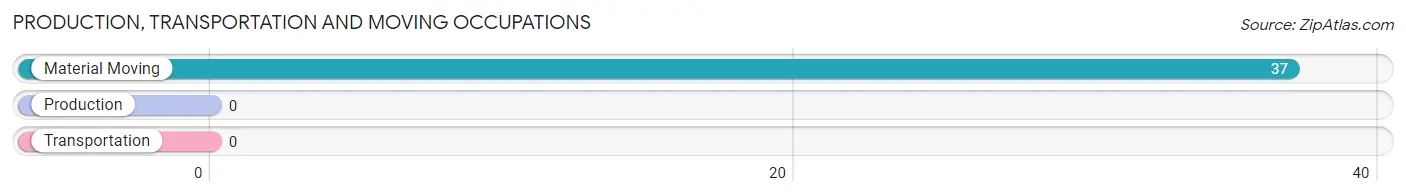
Production, Transportation and Moving Occupations by Sex
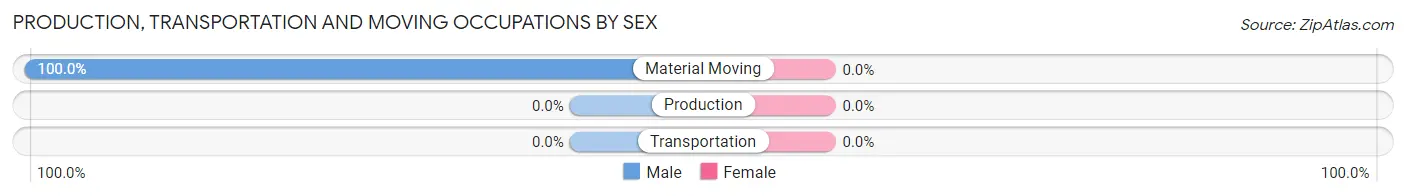
| Occupation | Male | Female |
| Production | 0 (0.0%) | 0 (0.0%) |
| Transportation | 0 (0.0%) | 0 (0.0%) |
| Material Moving | 37 (100.0%) | 0 (0.0%) |
| Total (Category) | 37 (100.0%) | 0 (0.0%) |
| Total (Overall) | 270 (55.6%) | 216 (44.4%) |
Employment Industries by Sex in Cypress Quarters
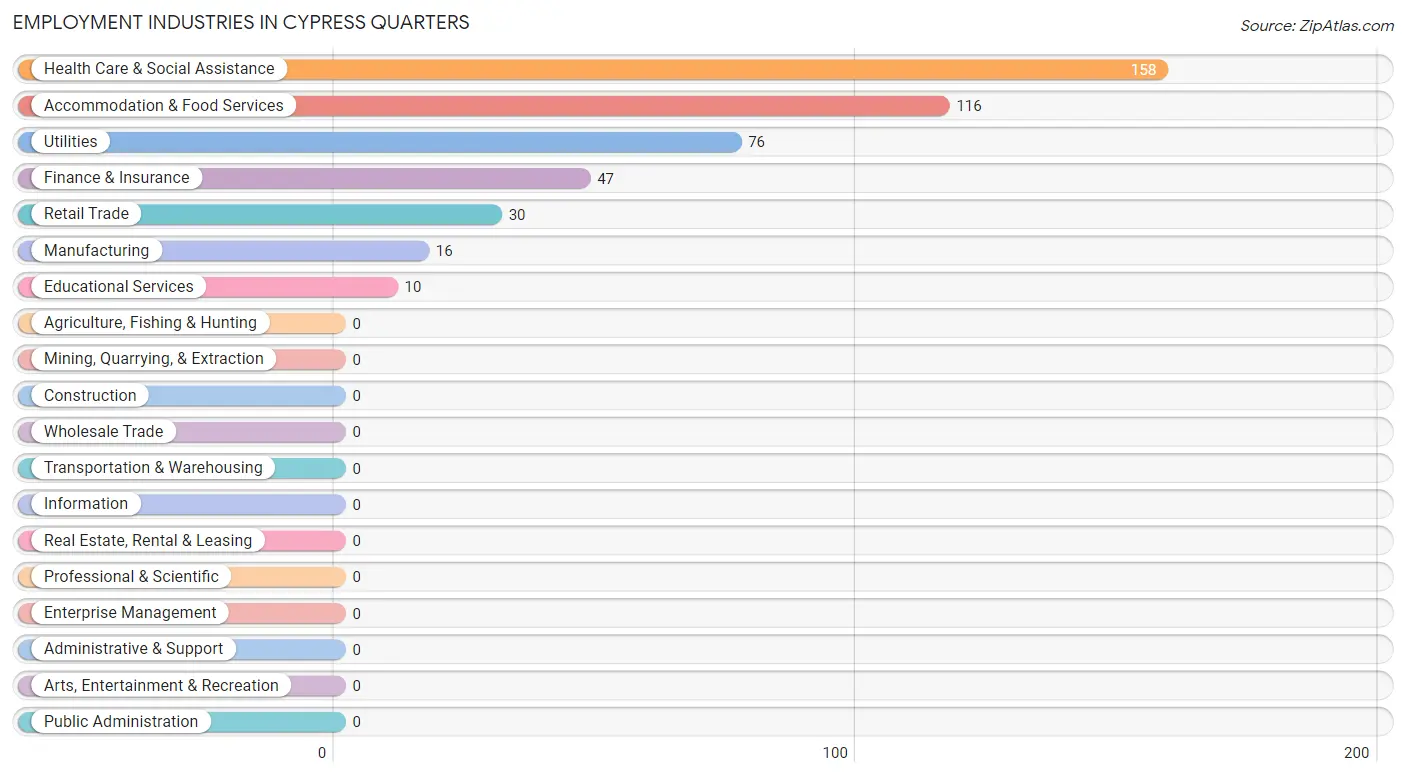
Employment Industries in Cypress Quarters
The major employment industries in Cypress Quarters include Health Care & Social Assistance (158 | 32.5%), Accommodation & Food Services (116 | 23.9%), Utilities (76 | 15.6%), Finance & Insurance (47 | 9.7%), and Retail Trade (30 | 6.2%).
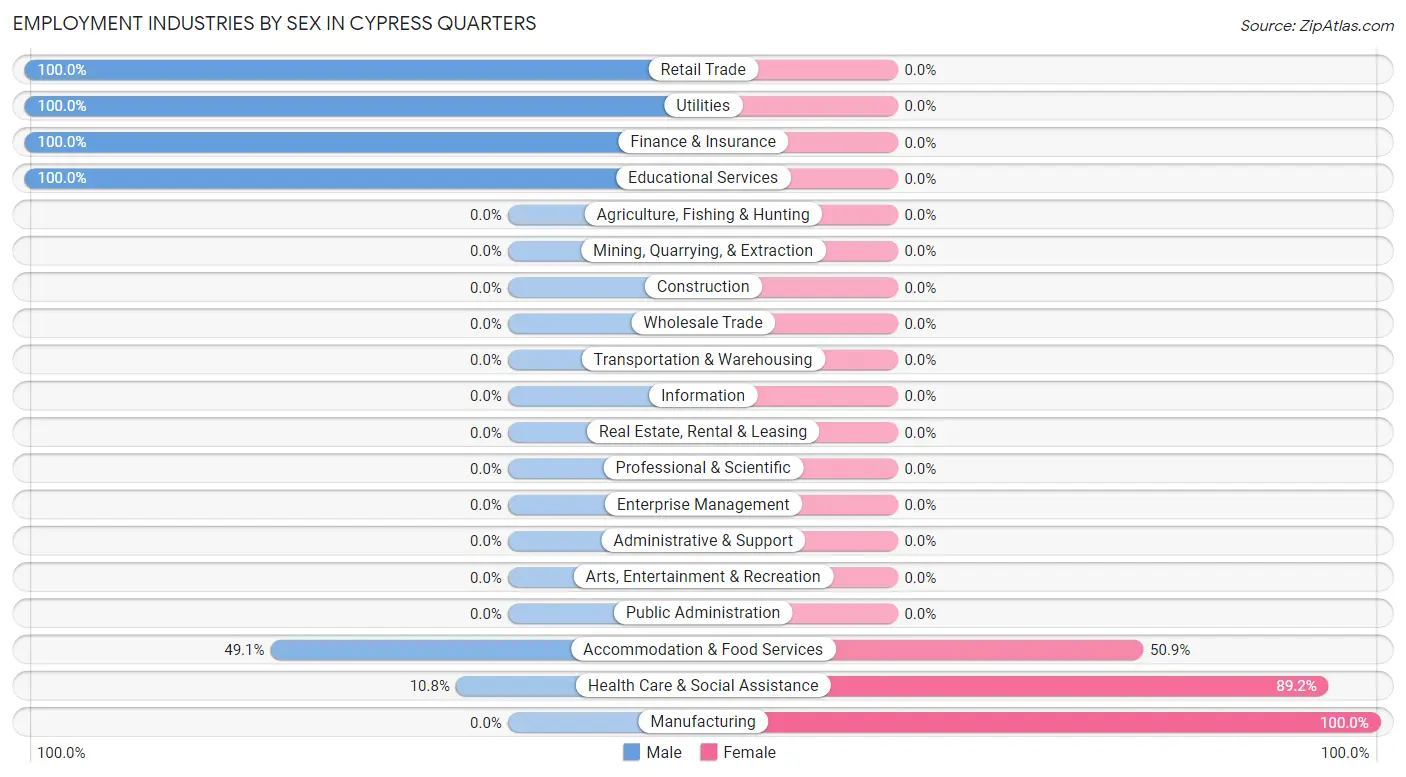
Employment Industries by Sex in Cypress Quarters
The Cypress Quarters industries that see more men than women are Retail Trade (100.0%), Utilities (100.0%), and Finance & Insurance (100.0%), whereas the industries that tend to have a higher number of women are Manufacturing (100.0%), Health Care & Social Assistance (89.2%), and Accommodation & Food Services (50.9%).
| Industry | Male | Female |
| Agriculture, Fishing & Hunting | 0 (0.0%) | 0 (0.0%) |
| Mining, Quarrying, & Extraction | 0 (0.0%) | 0 (0.0%) |
| Construction | 0 (0.0%) | 0 (0.0%) |
| Manufacturing | 0 (0.0%) | 16 (100.0%) |
| Wholesale Trade | 0 (0.0%) | 0 (0.0%) |
| Retail Trade | 30 (100.0%) | 0 (0.0%) |
| Transportation & Warehousing | 0 (0.0%) | 0 (0.0%) |
| Utilities | 76 (100.0%) | 0 (0.0%) |
| Information | 0 (0.0%) | 0 (0.0%) |
| Finance & Insurance | 47 (100.0%) | 0 (0.0%) |
| Real Estate, Rental & Leasing | 0 (0.0%) | 0 (0.0%) |
| Professional & Scientific | 0 (0.0%) | 0 (0.0%) |
| Enterprise Management | 0 (0.0%) | 0 (0.0%) |
| Administrative & Support | 0 (0.0%) | 0 (0.0%) |
| Educational Services | 10 (100.0%) | 0 (0.0%) |
| Health Care & Social Assistance | 17 (10.8%) | 141 (89.2%) |
| Arts, Entertainment & Recreation | 0 (0.0%) | 0 (0.0%) |
| Accommodation & Food Services | 57 (49.1%) | 59 (50.9%) |
| Public Administration | 0 (0.0%) | 0 (0.0%) |
| Total | 270 (55.6%) | 216 (44.4%) |
Education in Cypress Quarters
School Enrollment in Cypress Quarters
The most common levels of schooling among the 515 students in Cypress Quarters are high school (193 | 37.5%), middle school (130 | 25.2%), and elementary school (112 | 21.7%).
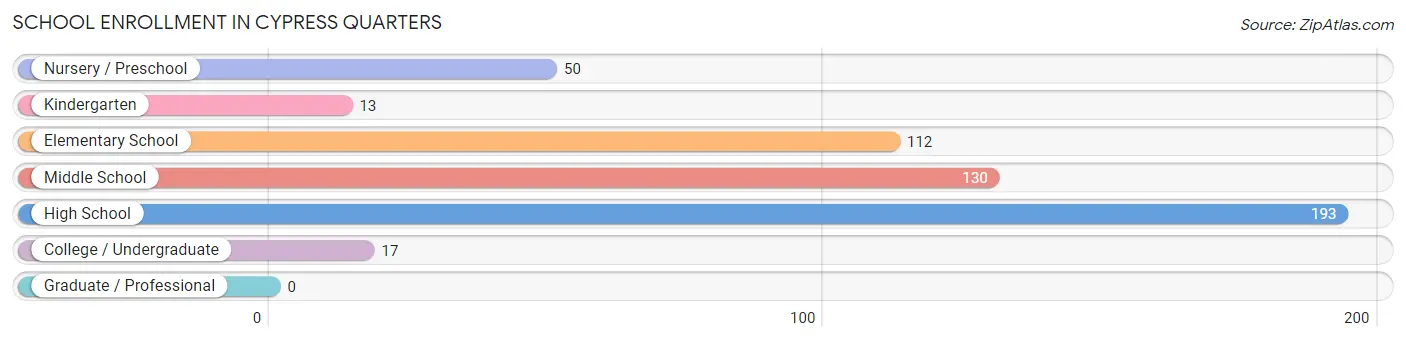
| School Level | # Students | % Students |
| Nursery / Preschool | 50 | 9.7% |
| Kindergarten | 13 | 2.5% |
| Elementary School | 112 | 21.7% |
| Middle School | 130 | 25.2% |
| High School | 193 | 37.5% |
| College / Undergraduate | 17 | 3.3% |
| Graduate / Professional | 0 | 0.0% |
| Total | 515 | 100.0% |
School Enrollment by Age by Funding Source in Cypress Quarters
Out of a total of 515 students who are enrolled in schools in Cypress Quarters, 74 (14.4%) attend a private institution, while the remaining 441 (85.6%) are enrolled in public schools. The age group of 35 years and over has the highest likelihood of being enrolled in private schools, with 17 (100.0% in the age bracket) enrolled. Conversely, the age group of 15 to 17 year olds has the lowest likelihood of being enrolled in a private school, with 127 (100.0% in the age bracket) attending a public institution.
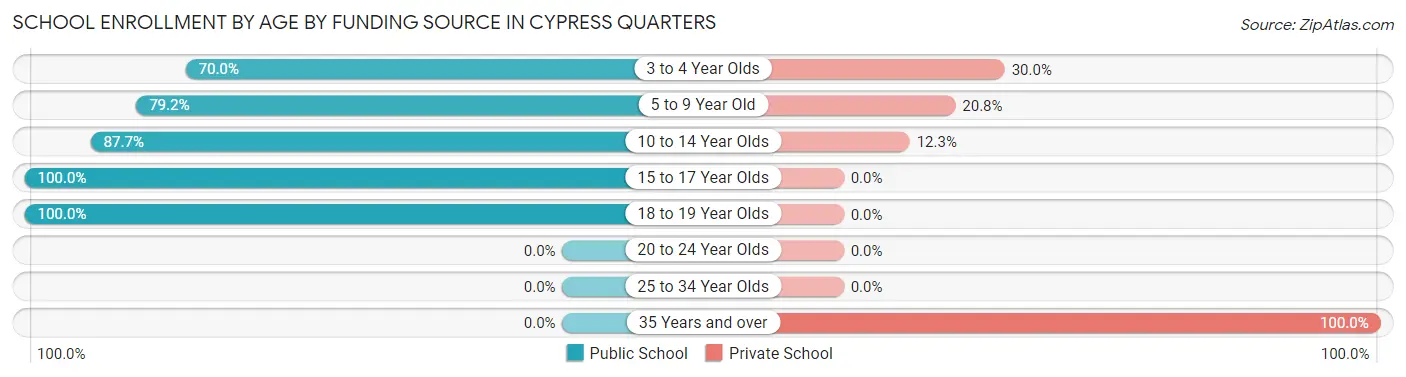
| Age Bracket | Public School | Private School |
| 3 to 4 Year Olds | 35 (70.0%) | 15 (30.0%) |
| 5 to 9 Year Old | 99 (79.2%) | 26 (20.8%) |
| 10 to 14 Year Olds | 114 (87.7%) | 16 (12.3%) |
| 15 to 17 Year Olds | 127 (100.0%) | 0 (0.0%) |
| 18 to 19 Year Olds | 66 (100.0%) | 0 (0.0%) |
| 20 to 24 Year Olds | 0 (0.0%) | 0 (0.0%) |
| 25 to 34 Year Olds | 0 (0.0%) | 0 (0.0%) |
| 35 Years and over | 0 (0.0%) | 17 (100.0%) |
| Total | 441 (85.6%) | 74 (14.4%) |
Educational Attainment by Field of Study in Cypress Quarters
Engineering (90 | 40.5%), business (65 | 29.3%), education (42 | 18.9%), and psychology (25 | 11.3%) are the most common fields of study among 222 individuals in Cypress Quarters who have obtained a bachelor's degree or higher.
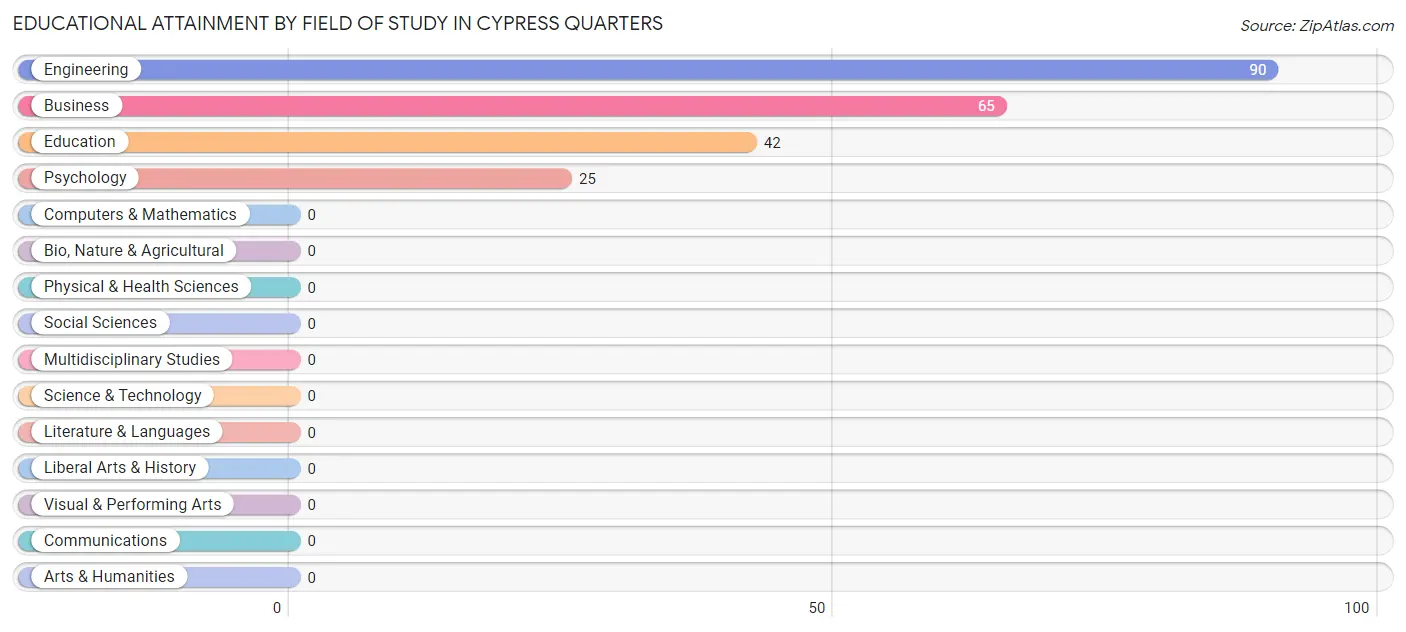
| Field of Study | # Graduates | % Graduates |
| Computers & Mathematics | 0 | 0.0% |
| Bio, Nature & Agricultural | 0 | 0.0% |
| Physical & Health Sciences | 0 | 0.0% |
| Psychology | 25 | 11.3% |
| Social Sciences | 0 | 0.0% |
| Engineering | 90 | 40.5% |
| Multidisciplinary Studies | 0 | 0.0% |
| Science & Technology | 0 | 0.0% |
| Business | 65 | 29.3% |
| Education | 42 | 18.9% |
| Literature & Languages | 0 | 0.0% |
| Liberal Arts & History | 0 | 0.0% |
| Visual & Performing Arts | 0 | 0.0% |
| Communications | 0 | 0.0% |
| Arts & Humanities | 0 | 0.0% |
| Total | 222 | 100.0% |
Transportation & Commute in Cypress Quarters
Vehicle Availability by Sex in Cypress Quarters
The most prevalent vehicle ownership categories in Cypress Quarters are males with 2 vehicles (155, accounting for 57.4%) and females with 2 vehicles (69, making up 98.7%).
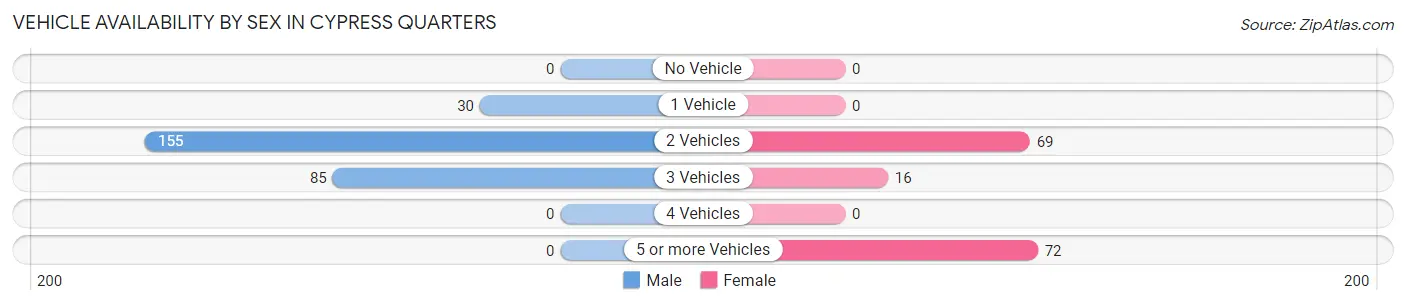
| Vehicles Available | Male | Female |
| No Vehicle | 0 (0.0%) | 0 (0.0%) |
| 1 Vehicle | 30 (11.1%) | 0 (0.0%) |
| 2 Vehicles | 155 (57.4%) | 69 (44.0%) |
| 3 Vehicles | 85 (31.5%) | 16 (10.2%) |
| 4 Vehicles | 0 (0.0%) | 0 (0.0%) |
| 5 or more Vehicles | 0 (0.0%) | 72 (45.9%) |
| Total | 270 (100.0%) | 157 (100.0%) |
Commute Time in Cypress Quarters
The most frequently occuring commute durations in Cypress Quarters are 5 to 9 minutes (120 commuters, 42.2%), 10 to 14 minutes (91 commuters, 32.0%), and 90 or more minutes (60 commuters, 21.1%).
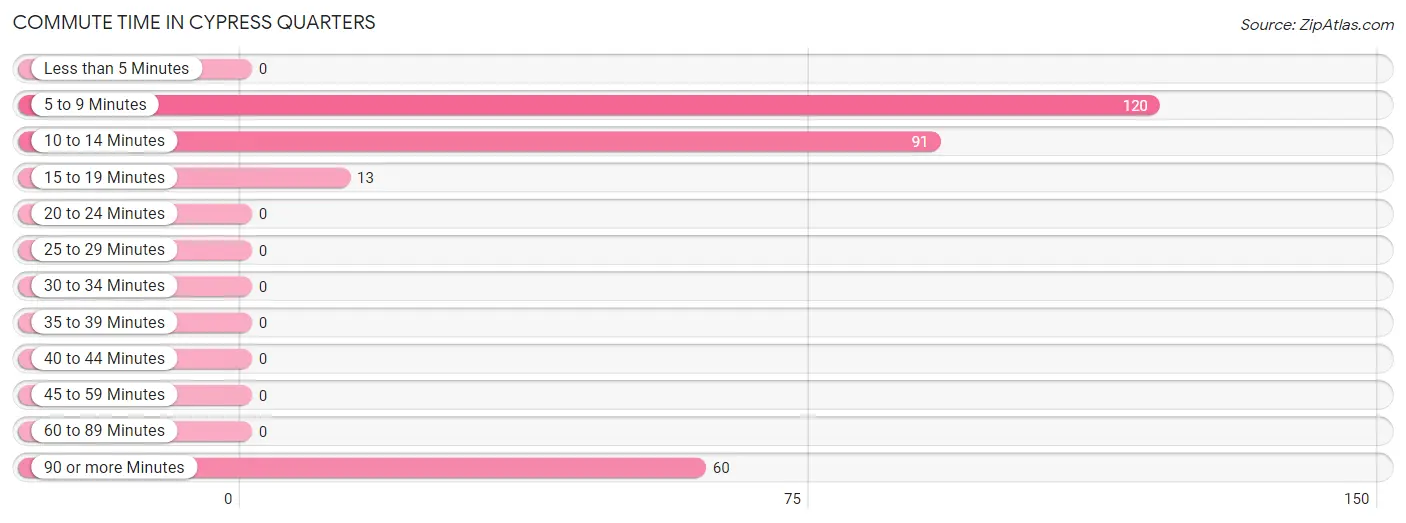
| Commute Time | # Commuters | % Commuters |
| Less than 5 Minutes | 0 | 0.0% |
| 5 to 9 Minutes | 120 | 42.2% |
| 10 to 14 Minutes | 91 | 32.0% |
| 15 to 19 Minutes | 13 | 4.6% |
| 20 to 24 Minutes | 0 | 0.0% |
| 25 to 29 Minutes | 0 | 0.0% |
| 30 to 34 Minutes | 0 | 0.0% |
| 35 to 39 Minutes | 0 | 0.0% |
| 40 to 44 Minutes | 0 | 0.0% |
| 45 to 59 Minutes | 0 | 0.0% |
| 60 to 89 Minutes | 0 | 0.0% |
| 90 or more Minutes | 60 | 21.1% |
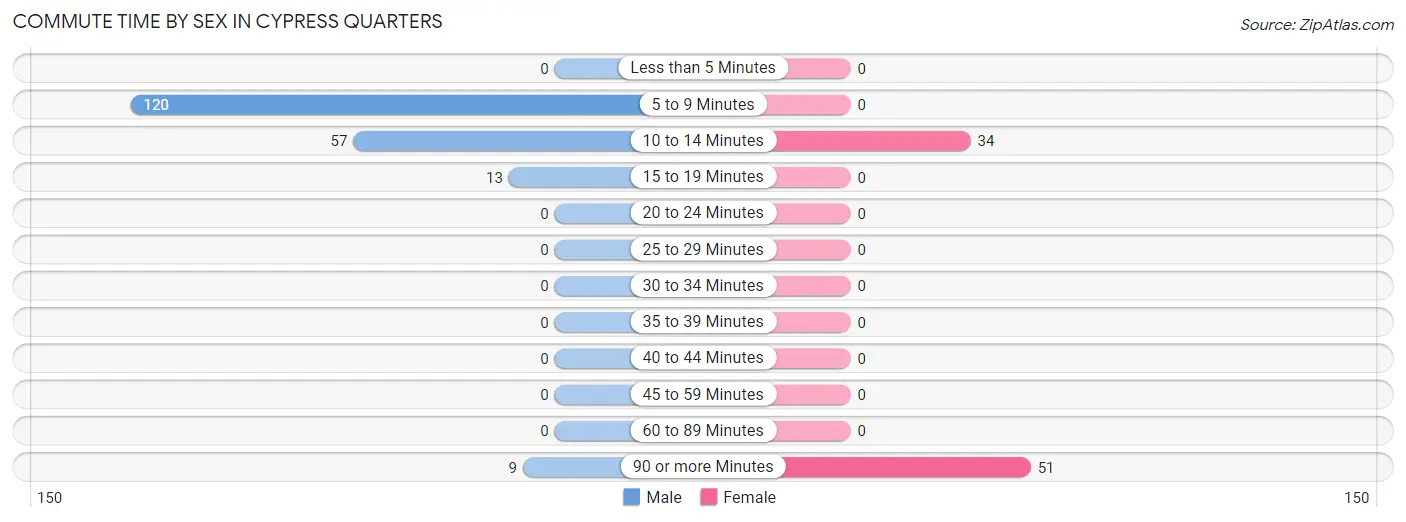
Commute Time by Sex in Cypress Quarters
The most common commute times in Cypress Quarters are 5 to 9 minutes (120 commuters, 60.3%) for males and 90 or more minutes (51 commuters, 60.0%) for females.
| Commute Time | Male | Female |
| Less than 5 Minutes | 0 (0.0%) | 0 (0.0%) |
| 5 to 9 Minutes | 120 (60.3%) | 0 (0.0%) |
| 10 to 14 Minutes | 57 (28.6%) | 34 (40.0%) |
| 15 to 19 Minutes | 13 (6.5%) | 0 (0.0%) |
| 20 to 24 Minutes | 0 (0.0%) | 0 (0.0%) |
| 25 to 29 Minutes | 0 (0.0%) | 0 (0.0%) |
| 30 to 34 Minutes | 0 (0.0%) | 0 (0.0%) |
| 35 to 39 Minutes | 0 (0.0%) | 0 (0.0%) |
| 40 to 44 Minutes | 0 (0.0%) | 0 (0.0%) |
| 45 to 59 Minutes | 0 (0.0%) | 0 (0.0%) |
| 60 to 89 Minutes | 0 (0.0%) | 0 (0.0%) |
| 90 or more Minutes | 9 (4.5%) | 51 (60.0%) |
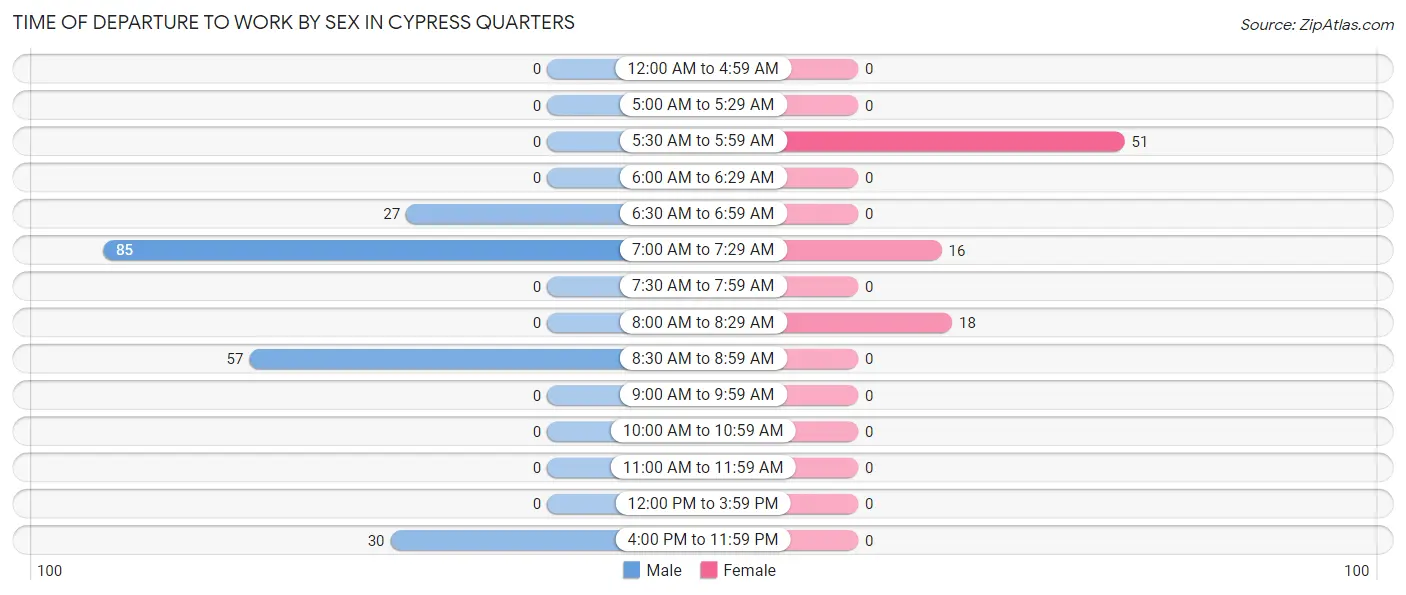
Time of Departure to Work by Sex in Cypress Quarters
The most frequent times of departure to work in Cypress Quarters are 7:00 AM to 7:29 AM (85, 42.7%) for males and 5:30 AM to 5:59 AM (51, 60.0%) for females.
| Time of Departure | Male | Female |
| 12:00 AM to 4:59 AM | 0 (0.0%) | 0 (0.0%) |
| 5:00 AM to 5:29 AM | 0 (0.0%) | 0 (0.0%) |
| 5:30 AM to 5:59 AM | 0 (0.0%) | 51 (60.0%) |
| 6:00 AM to 6:29 AM | 0 (0.0%) | 0 (0.0%) |
| 6:30 AM to 6:59 AM | 27 (13.6%) | 0 (0.0%) |
| 7:00 AM to 7:29 AM | 85 (42.7%) | 16 (18.8%) |
| 7:30 AM to 7:59 AM | 0 (0.0%) | 0 (0.0%) |
| 8:00 AM to 8:29 AM | 0 (0.0%) | 18 (21.2%) |
| 8:30 AM to 8:59 AM | 57 (28.6%) | 0 (0.0%) |
| 9:00 AM to 9:59 AM | 0 (0.0%) | 0 (0.0%) |
| 10:00 AM to 10:59 AM | 0 (0.0%) | 0 (0.0%) |
| 11:00 AM to 11:59 AM | 0 (0.0%) | 0 (0.0%) |
| 12:00 PM to 3:59 PM | 0 (0.0%) | 0 (0.0%) |
| 4:00 PM to 11:59 PM | 30 (15.1%) | 0 (0.0%) |
| Total | 199 (100.0%) | 85 (100.0%) |
Housing Occupancy in Cypress Quarters
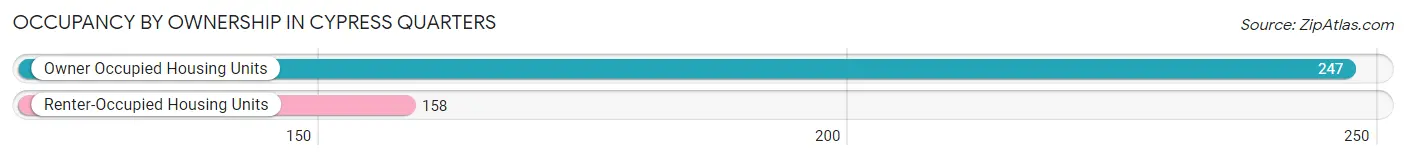
Occupancy by Ownership in Cypress Quarters
Of the total 405 dwellings in Cypress Quarters, owner-occupied units account for 247 (61.0%), while renter-occupied units make up 158 (39.0%).
| Occupancy | # Housing Units | % Housing Units |
| Owner Occupied Housing Units | 247 | 61.0% |
| Renter-Occupied Housing Units | 158 | 39.0% |
| Total Occupied Housing Units | 405 | 100.0% |
Occupancy by Household Size in Cypress Quarters
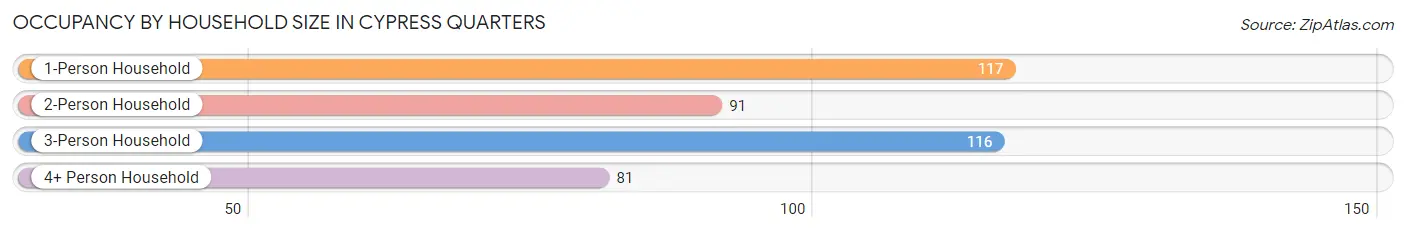
| Household Size | # Housing Units | % Housing Units |
| 1-Person Household | 117 | 28.9% |
| 2-Person Household | 91 | 22.5% |
| 3-Person Household | 116 | 28.6% |
| 4+ Person Household | 81 | 20.0% |
| Total Housing Units | 405 | 100.0% |
Occupancy by Ownership by Household Size in Cypress Quarters
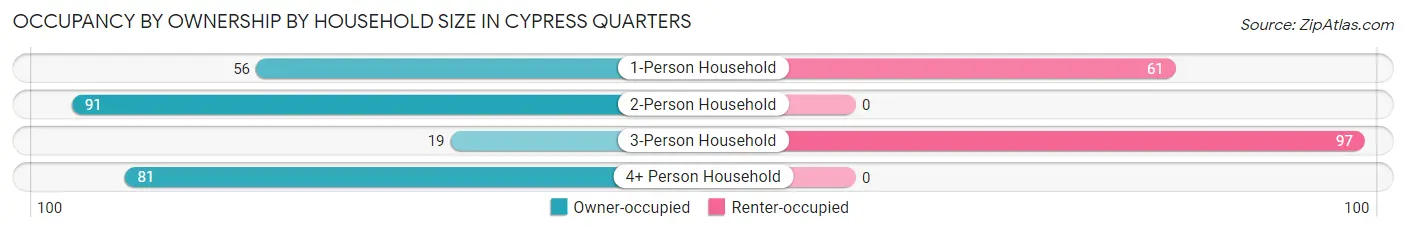
| Household Size | Owner-occupied | Renter-occupied |
| 1-Person Household | 56 (47.9%) | 61 (52.1%) |
| 2-Person Household | 91 (100.0%) | 0 (0.0%) |
| 3-Person Household | 19 (16.4%) | 97 (83.6%) |
| 4+ Person Household | 81 (100.0%) | 0 (0.0%) |
| Total Housing Units | 247 (61.0%) | 158 (39.0%) |
Occupancy by Educational Attainment in Cypress Quarters
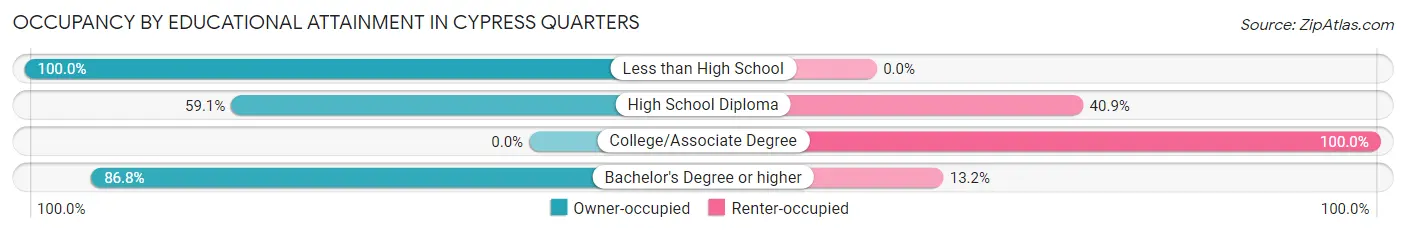
| Household Size | Owner-occupied | Renter-occupied |
| Less than High School | 67 (100.0%) | 0 (0.0%) |
| High School Diploma | 88 (59.1%) | 61 (40.9%) |
| College/Associate Degree | 0 (0.0%) | 83 (100.0%) |
| Bachelor's Degree or higher | 92 (86.8%) | 14 (13.2%) |
Occupancy by Age of Householder in Cypress Quarters
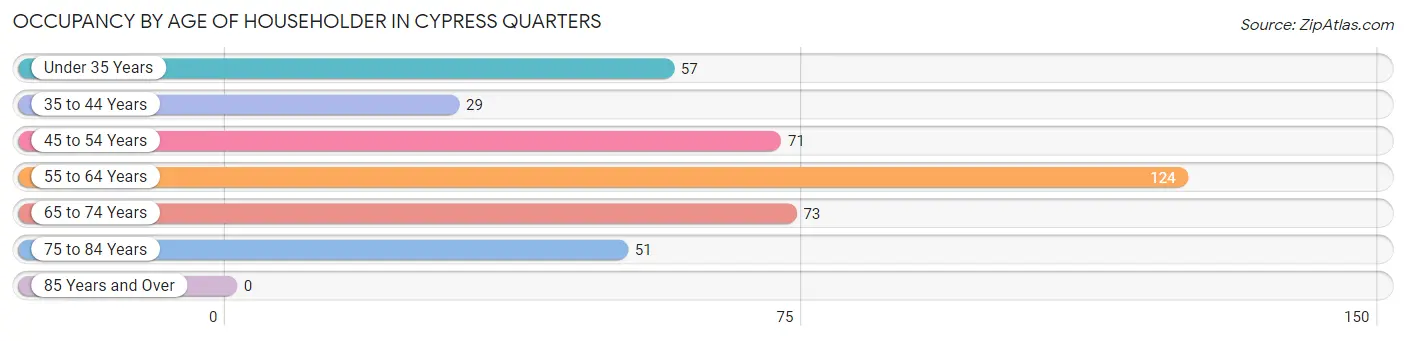
| Age Bracket | # Households | % Households |
| Under 35 Years | 57 | 14.1% |
| 35 to 44 Years | 29 | 7.2% |
| 45 to 54 Years | 71 | 17.5% |
| 55 to 64 Years | 124 | 30.6% |
| 65 to 74 Years | 73 | 18.0% |
| 75 to 84 Years | 51 | 12.6% |
| 85 Years and Over | 0 | 0.0% |
| Total | 405 | 100.0% |
Housing Finances in Cypress Quarters
Median Income by Occupancy in Cypress Quarters
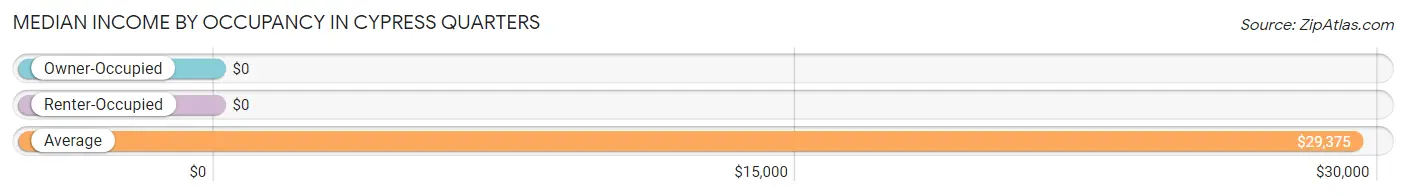
| Occupancy Type | # Households | Median Income |
| Owner-Occupied | 247 (61.0%) | $0 |
| Renter-Occupied | 158 (39.0%) | $0 |
| Average | 405 (100.0%) | $29,375 |
Occupancy by Householder Income Bracket in Cypress Quarters
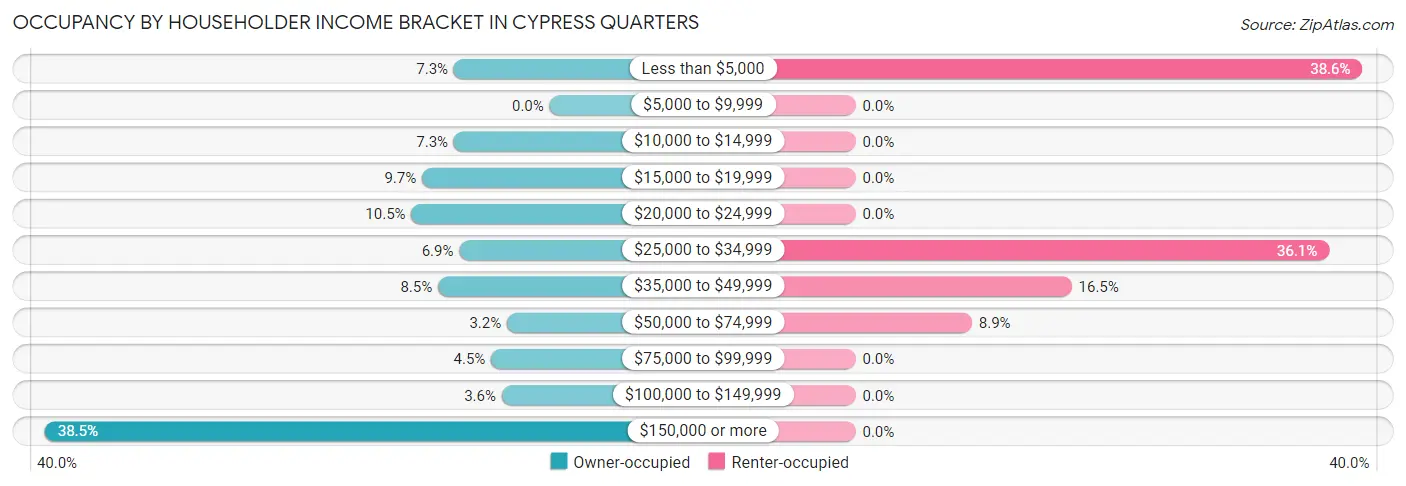
| Income Bracket | Owner-occupied | Renter-occupied |
| Less than $5,000 | 18 (7.3%) | 61 (38.6%) |
| $5,000 to $9,999 | 0 (0.0%) | 0 (0.0%) |
| $10,000 to $14,999 | 18 (7.3%) | 0 (0.0%) |
| $15,000 to $19,999 | 24 (9.7%) | 0 (0.0%) |
| $20,000 to $24,999 | 26 (10.5%) | 0 (0.0%) |
| $25,000 to $34,999 | 17 (6.9%) | 57 (36.1%) |
| $35,000 to $49,999 | 21 (8.5%) | 26 (16.5%) |
| $50,000 to $74,999 | 8 (3.2%) | 14 (8.9%) |
| $75,000 to $99,999 | 11 (4.4%) | 0 (0.0%) |
| $100,000 to $149,999 | 9 (3.6%) | 0 (0.0%) |
| $150,000 or more | 95 (38.5%) | 0 (0.0%) |
| Total | 247 (100.0%) | 158 (100.0%) |
Monthly Housing Cost Tiers in Cypress Quarters
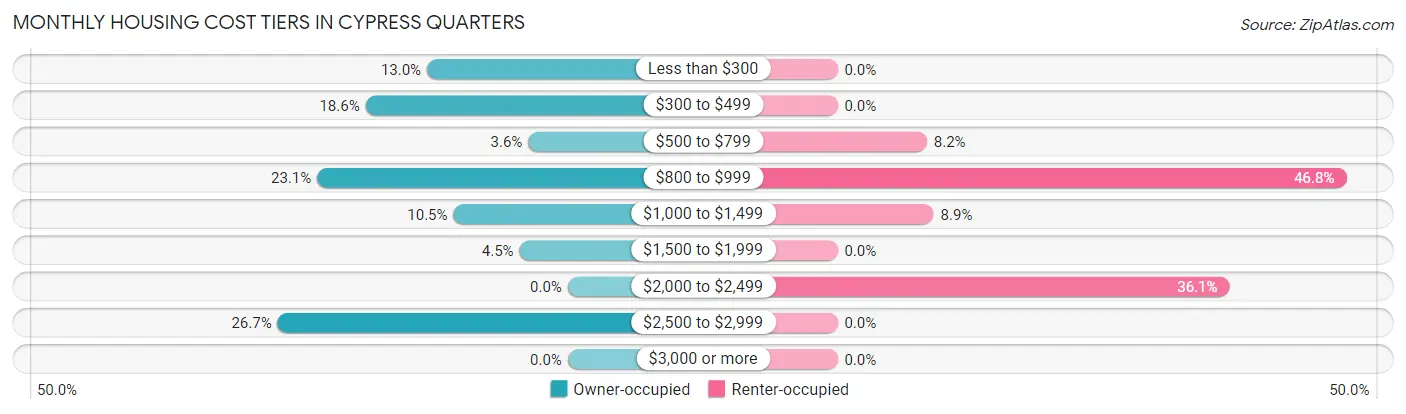
| Monthly Cost | Owner-occupied | Renter-occupied |
| Less than $300 | 32 (13.0%) | 0 (0.0%) |
| $300 to $499 | 46 (18.6%) | 0 (0.0%) |
| $500 to $799 | 9 (3.6%) | 13 (8.2%) |
| $800 to $999 | 57 (23.1%) | 74 (46.8%) |
| $1,000 to $1,499 | 26 (10.5%) | 14 (8.9%) |
| $1,500 to $1,999 | 11 (4.4%) | 0 (0.0%) |
| $2,000 to $2,499 | 0 (0.0%) | 57 (36.1%) |
| $2,500 to $2,999 | 66 (26.7%) | 0 (0.0%) |
| $3,000 or more | 0 (0.0%) | 0 (0.0%) |
| Total | 247 (100.0%) | 158 (100.0%) |
Physical Housing Characteristics in Cypress Quarters
Housing Structures in Cypress Quarters
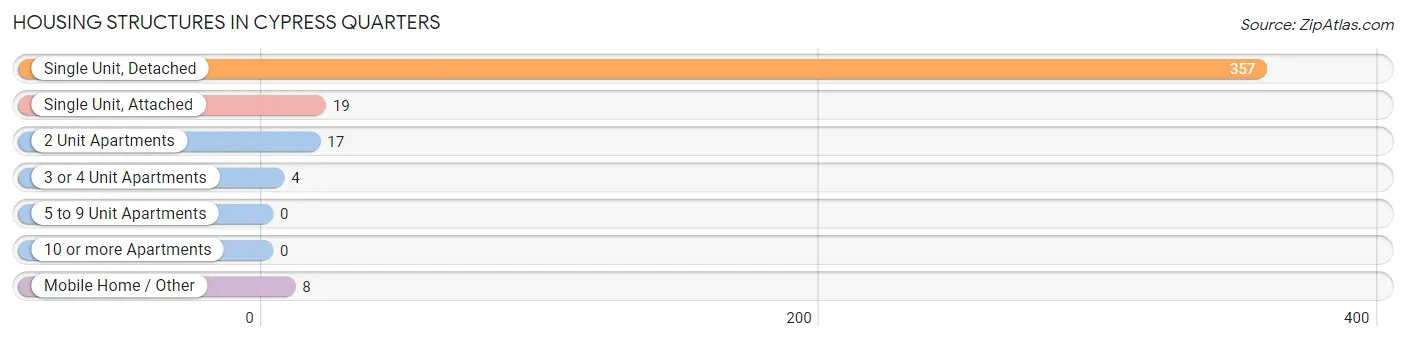
| Structure Type | # Housing Units | % Housing Units |
| Single Unit, Detached | 357 | 88.1% |
| Single Unit, Attached | 19 | 4.7% |
| 2 Unit Apartments | 17 | 4.2% |
| 3 or 4 Unit Apartments | 4 | 1.0% |
| 5 to 9 Unit Apartments | 0 | 0.0% |
| 10 or more Apartments | 0 | 0.0% |
| Mobile Home / Other | 8 | 2.0% |
| Total | 405 | 100.0% |
Housing Structures by Occupancy in Cypress Quarters
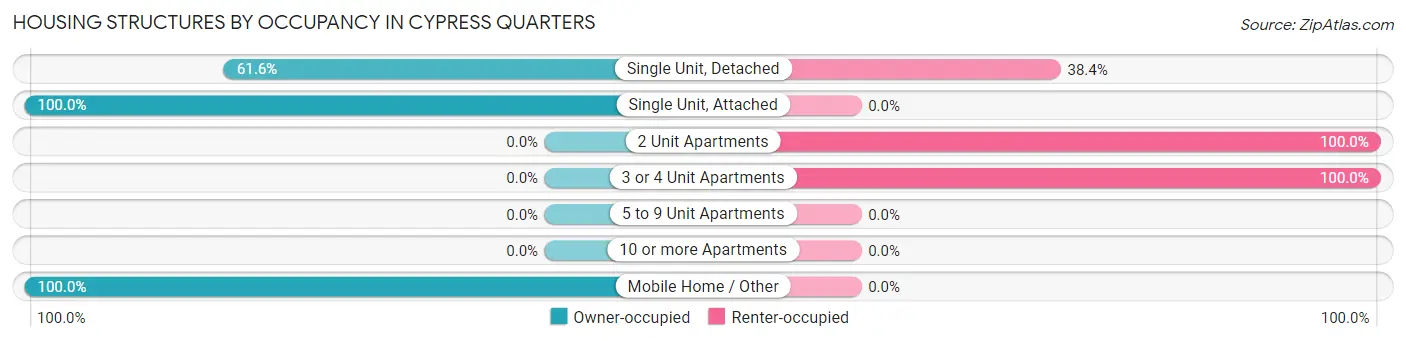
| Structure Type | Owner-occupied | Renter-occupied |
| Single Unit, Detached | 220 (61.6%) | 137 (38.4%) |
| Single Unit, Attached | 19 (100.0%) | 0 (0.0%) |
| 2 Unit Apartments | 0 (0.0%) | 17 (100.0%) |
| 3 or 4 Unit Apartments | 0 (0.0%) | 4 (100.0%) |
| 5 to 9 Unit Apartments | 0 (0.0%) | 0 (0.0%) |
| 10 or more Apartments | 0 (0.0%) | 0 (0.0%) |
| Mobile Home / Other | 8 (100.0%) | 0 (0.0%) |
| Total | 247 (61.0%) | 158 (39.0%) |
Housing Structures by Number of Rooms in Cypress Quarters
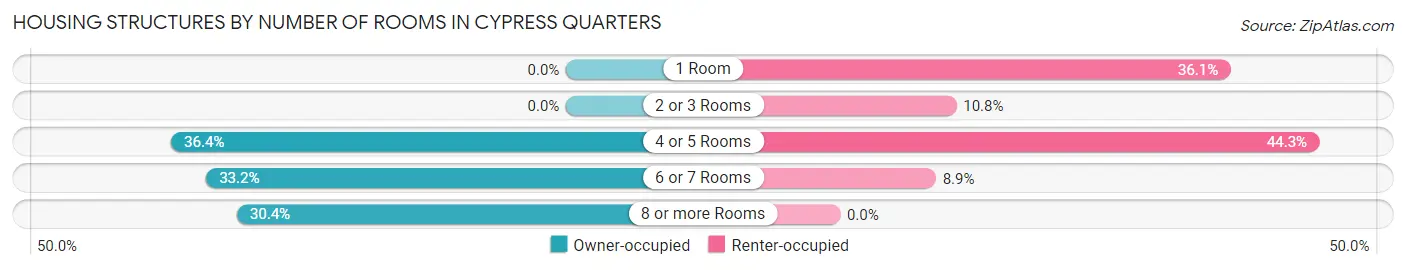
| Number of Rooms | Owner-occupied | Renter-occupied |
| 1 Room | 0 (0.0%) | 57 (36.1%) |
| 2 or 3 Rooms | 0 (0.0%) | 17 (10.8%) |
| 4 or 5 Rooms | 90 (36.4%) | 70 (44.3%) |
| 6 or 7 Rooms | 82 (33.2%) | 14 (8.9%) |
| 8 or more Rooms | 75 (30.4%) | 0 (0.0%) |
| Total | 247 (100.0%) | 158 (100.0%) |
Housing Structure by Heating Type in Cypress Quarters
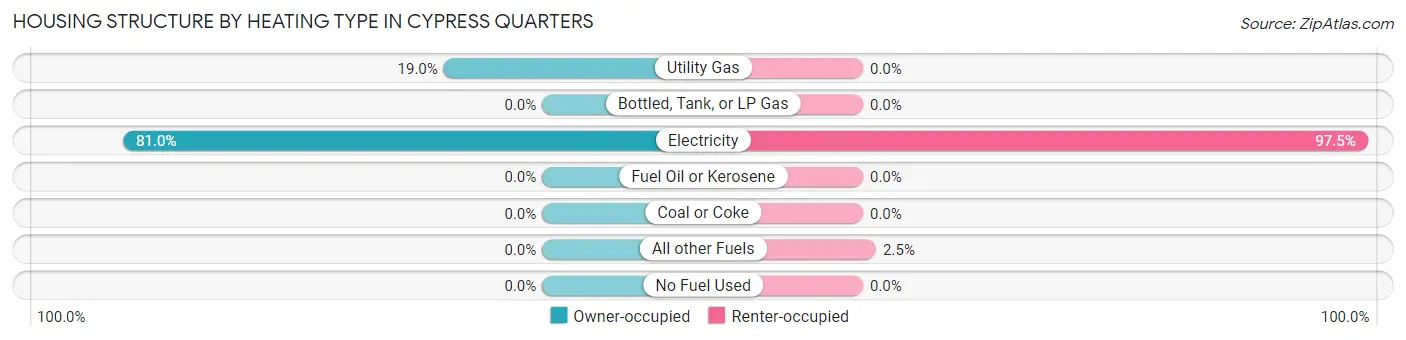
| Heating Type | Owner-occupied | Renter-occupied |
| Utility Gas | 47 (19.0%) | 0 (0.0%) |
| Bottled, Tank, or LP Gas | 0 (0.0%) | 0 (0.0%) |
| Electricity | 200 (81.0%) | 154 (97.5%) |
| Fuel Oil or Kerosene | 0 (0.0%) | 0 (0.0%) |
| Coal or Coke | 0 (0.0%) | 0 (0.0%) |
| All other Fuels | 0 (0.0%) | 4 (2.5%) |
| No Fuel Used | 0 (0.0%) | 0 (0.0%) |
| Total | 247 (100.0%) | 158 (100.0%) |
Household Vehicle Usage in Cypress Quarters
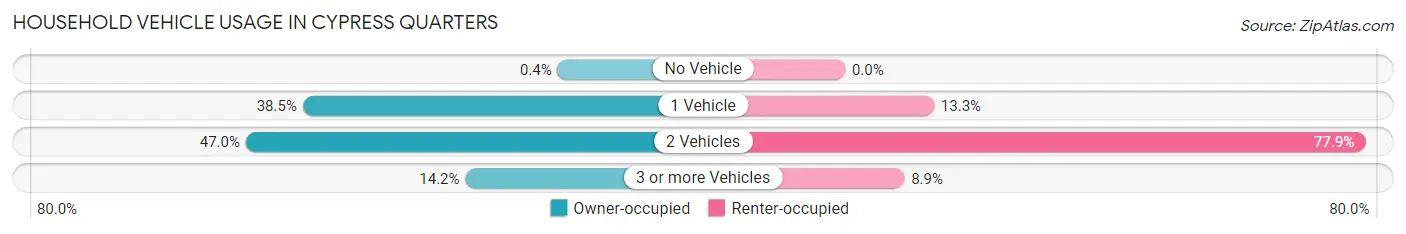
| Vehicles per Household | Owner-occupied | Renter-occupied |
| No Vehicle | 1 (0.4%) | 0 (0.0%) |
| 1 Vehicle | 95 (38.5%) | 21 (13.3%) |
| 2 Vehicles | 116 (47.0%) | 123 (77.8%) |
| 3 or more Vehicles | 35 (14.2%) | 14 (8.9%) |
| Total | 247 (100.0%) | 158 (100.0%) |
Real Estate & Mortgages in Cypress Quarters
Real Estate and Mortgage Overview in Cypress Quarters
| Characteristic | Without Mortgage | With Mortgage |
| Housing Units | 70 | 177 |
| Median Property Value | $38,800 | $0 |
| Median Household Income | - | - |
| Monthly Housing Costs | - | - |
| Real Estate Taxes | $709 | $0 |
Property Value by Mortgage Status in Cypress Quarters
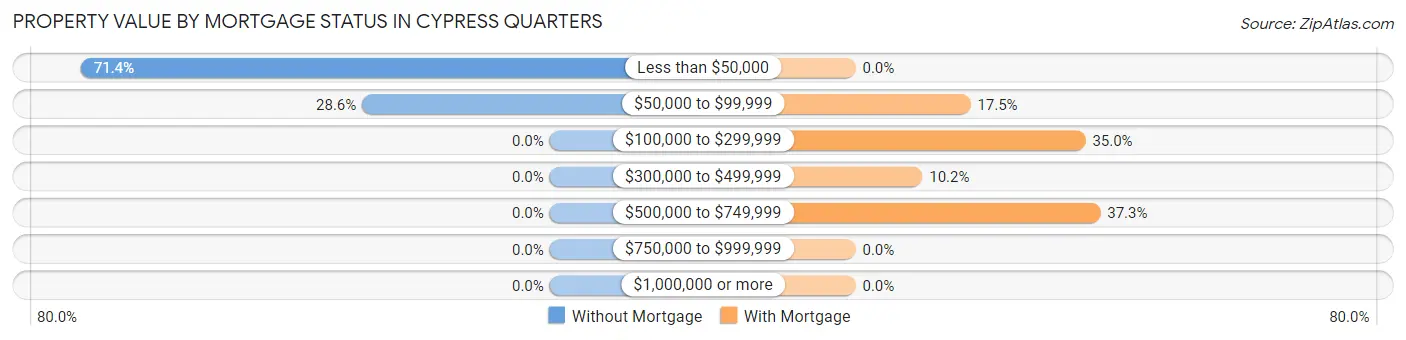
| Property Value | Without Mortgage | With Mortgage |
| Less than $50,000 | 50 (71.4%) | 0 (0.0%) |
| $50,000 to $99,999 | 20 (28.6%) | 31 (17.5%) |
| $100,000 to $299,999 | 0 (0.0%) | 62 (35.0%) |
| $300,000 to $499,999 | 0 (0.0%) | 18 (10.2%) |
| $500,000 to $749,999 | 0 (0.0%) | 66 (37.3%) |
| $750,000 to $999,999 | 0 (0.0%) | 0 (0.0%) |
| $1,000,000 or more | 0 (0.0%) | 0 (0.0%) |
| Total | 70 (100.0%) | 177 (100.0%) |
Household Income by Mortgage Status in Cypress Quarters
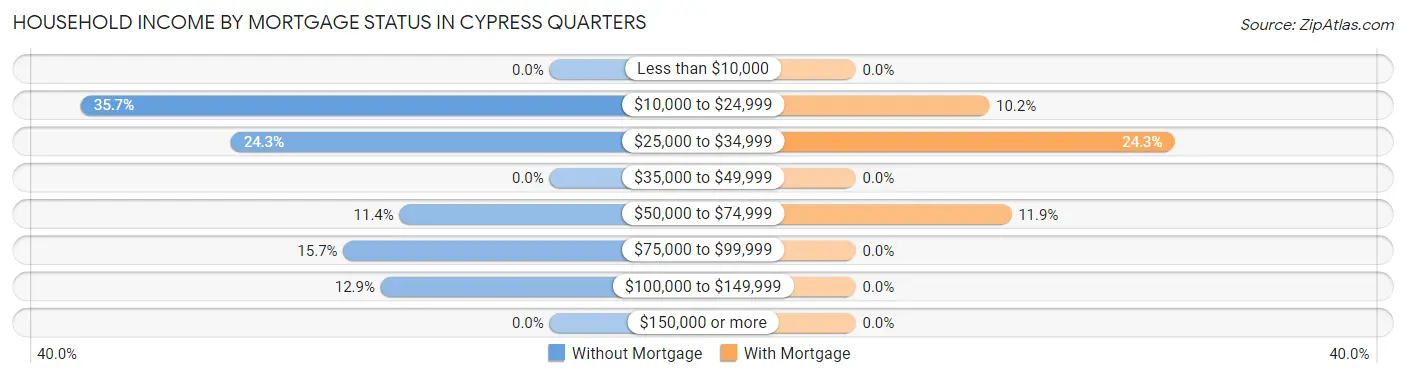
| Household Income | Without Mortgage | With Mortgage |
| Less than $10,000 | 0 (0.0%) | 0 (0.0%) |
| $10,000 to $24,999 | 25 (35.7%) | 18 (10.2%) |
| $25,000 to $34,999 | 17 (24.3%) | 43 (24.3%) |
| $35,000 to $49,999 | 0 (0.0%) | 0 (0.0%) |
| $50,000 to $74,999 | 8 (11.4%) | 21 (11.9%) |
| $75,000 to $99,999 | 11 (15.7%) | 0 (0.0%) |
| $100,000 to $149,999 | 9 (12.9%) | 0 (0.0%) |
| $150,000 or more | 0 (0.0%) | 0 (0.0%) |
| Total | 70 (100.0%) | 177 (100.0%) |
Property Value to Household Income Ratio in Cypress Quarters
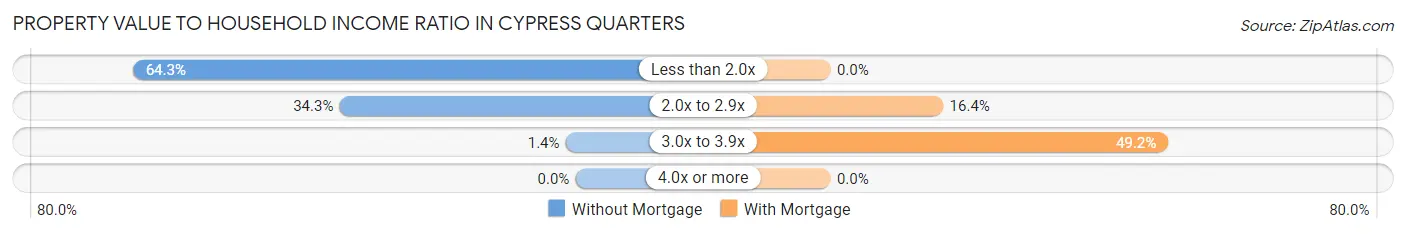
| Value-to-Income Ratio | Without Mortgage | With Mortgage |
| Less than 2.0x | 45 (64.3%) | 0 (0.0%) |
| 2.0x to 2.9x | 24 (34.3%) | 29 (16.4%) |
| 3.0x to 3.9x | 1 (1.4%) | 87 (49.1%) |
| 4.0x or more | 0 (0.0%) | 0 (0.0%) |
| Total | 70 (100.0%) | 177 (100.0%) |
Real Estate Taxes by Mortgage Status in Cypress Quarters
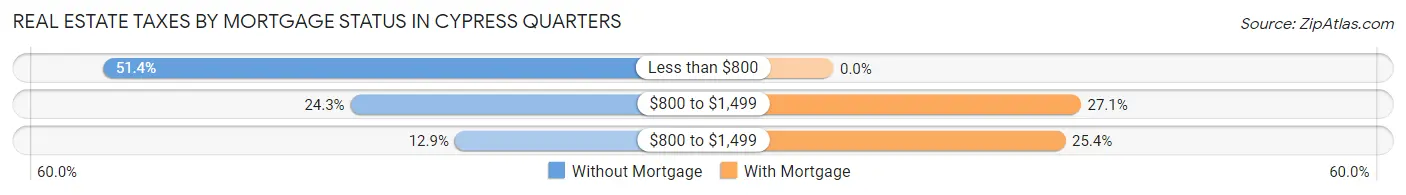
| Property Taxes | Without Mortgage | With Mortgage |
| Less than $800 | 36 (51.4%) | 0 (0.0%) |
| $800 to $1,499 | 17 (24.3%) | 48 (27.1%) |
| $800 to $1,499 | 9 (12.9%) | 45 (25.4%) |
| Total | 70 (100.0%) | 177 (100.0%) |
Health & Disability in Cypress Quarters
Health Insurance Coverage by Age in Cypress Quarters
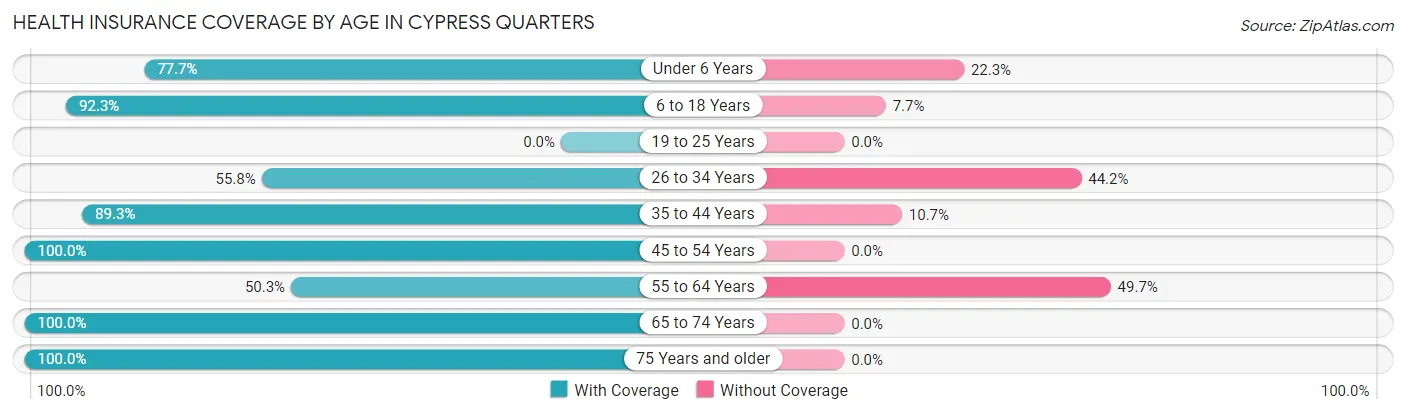
| Age Bracket | With Coverage | Without Coverage |
| Under 6 Years | 101 (77.7%) | 29 (22.3%) |
| 6 to 18 Years | 502 (92.3%) | 42 (7.7%) |
| 19 to 25 Years | 0 (0.0%) | 0 (0.0%) |
| 26 to 34 Years | 72 (55.8%) | 57 (44.2%) |
| 35 to 44 Years | 183 (89.3%) | 22 (10.7%) |
| 45 to 54 Years | 122 (100.0%) | 0 (0.0%) |
| 55 to 64 Years | 76 (50.3%) | 75 (49.7%) |
| 65 to 74 Years | 103 (100.0%) | 0 (0.0%) |
| 75 Years and older | 76 (100.0%) | 0 (0.0%) |
| Total | 1,235 (84.6%) | 225 (15.4%) |
Health Insurance Coverage by Citizenship Status in Cypress Quarters
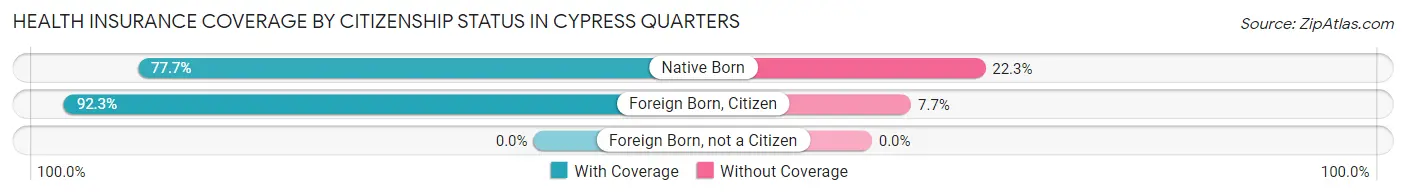
| Citizenship Status | With Coverage | Without Coverage |
| Native Born | 101 (77.7%) | 29 (22.3%) |
| Foreign Born, Citizen | 502 (92.3%) | 42 (7.7%) |
| Foreign Born, not a Citizen | 0 (0.0%) | 0 (0.0%) |
Health Insurance Coverage by Household Income in Cypress Quarters
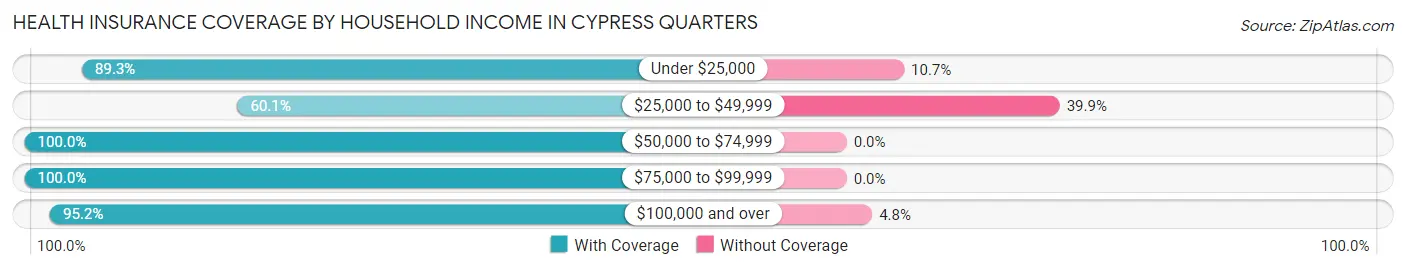
| Household Income | With Coverage | Without Coverage |
| Under $25,000 | 507 (89.3%) | 61 (10.7%) |
| $25,000 to $49,999 | 220 (60.1%) | 146 (39.9%) |
| $50,000 to $74,999 | 132 (100.0%) | 0 (0.0%) |
| $75,000 to $99,999 | 17 (100.0%) | 0 (0.0%) |
| $100,000 and over | 359 (95.2%) | 18 (4.8%) |
Public vs Private Health Insurance Coverage by Age in Cypress Quarters
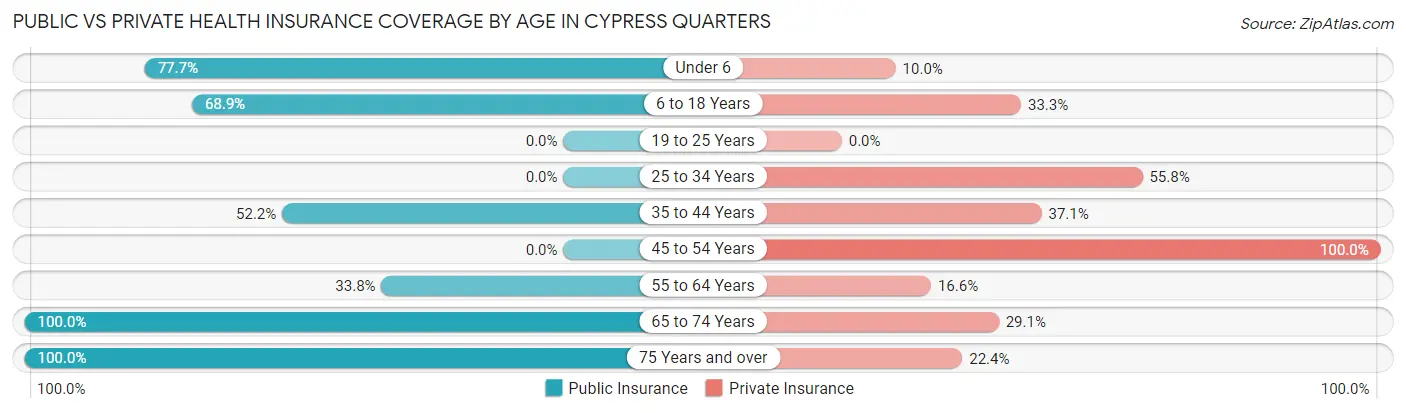
| Age Bracket | Public Insurance | Private Insurance |
| Under 6 | 101 (77.7%) | 13 (10.0%) |
| 6 to 18 Years | 375 (68.9%) | 181 (33.3%) |
| 19 to 25 Years | 0 (0.0%) | 0 (0.0%) |
| 25 to 34 Years | 0 (0.0%) | 72 (55.8%) |
| 35 to 44 Years | 107 (52.2%) | 76 (37.1%) |
| 45 to 54 Years | 0 (0.0%) | 122 (100.0%) |
| 55 to 64 Years | 51 (33.8%) | 25 (16.6%) |
| 65 to 74 Years | 103 (100.0%) | 30 (29.1%) |
| 75 Years and over | 76 (100.0%) | 17 (22.4%) |
| Total | 813 (55.7%) | 536 (36.7%) |
Disability Status by Sex by Age in Cypress Quarters
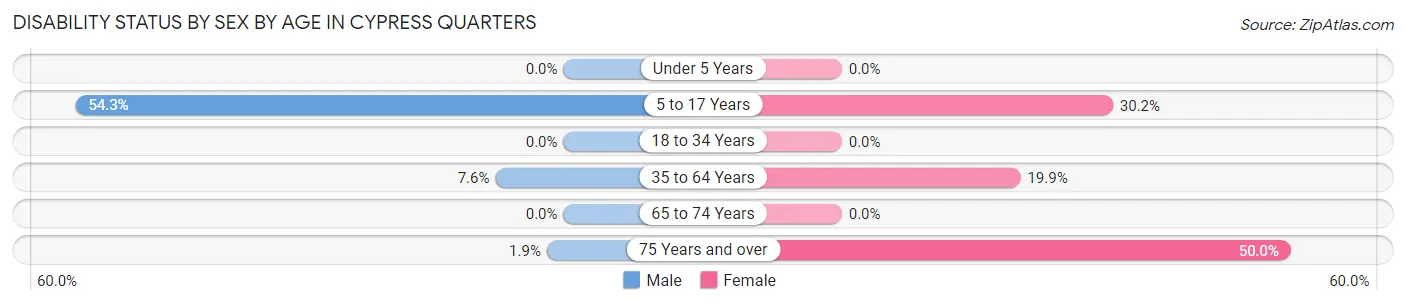
| Age Bracket | Male | Female |
| Under 5 Years | 0 (0.0%) | 0 (0.0%) |
| 5 to 17 Years | 94 (54.3%) | 96 (30.2%) |
| 18 to 34 Years | 0 (0.0%) | 0 (0.0%) |
| 35 to 64 Years | 21 (7.6%) | 40 (19.9%) |
| 65 to 74 Years | 0 (0.0%) | 0 (0.0%) |
| 75 Years and over | 1 (1.8%) | 11 (50.0%) |
Disability Class by Sex by Age in Cypress Quarters
Disability Class: Hearing Difficulty
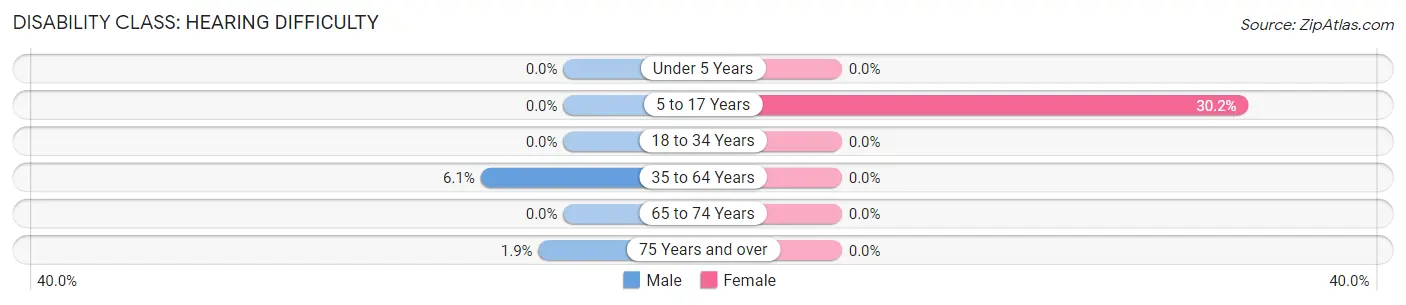
| Age Bracket | Male | Female |
| Under 5 Years | 0 (0.0%) | 0 (0.0%) |
| 5 to 17 Years | 0 (0.0%) | 96 (30.2%) |
| 18 to 34 Years | 0 (0.0%) | 0 (0.0%) |
| 35 to 64 Years | 17 (6.1%) | 0 (0.0%) |
| 65 to 74 Years | 0 (0.0%) | 0 (0.0%) |
| 75 Years and over | 1 (1.8%) | 0 (0.0%) |
Disability Class: Vision Difficulty
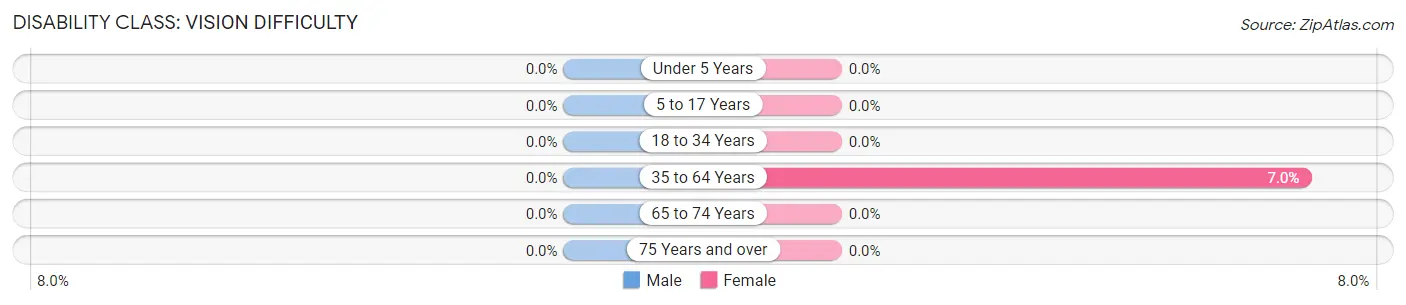
| Age Bracket | Male | Female |
| Under 5 Years | 0 (0.0%) | 0 (0.0%) |
| 5 to 17 Years | 0 (0.0%) | 0 (0.0%) |
| 18 to 34 Years | 0 (0.0%) | 0 (0.0%) |
| 35 to 64 Years | 0 (0.0%) | 14 (7.0%) |
| 65 to 74 Years | 0 (0.0%) | 0 (0.0%) |
| 75 Years and over | 0 (0.0%) | 0 (0.0%) |
Disability Class: Cognitive Difficulty
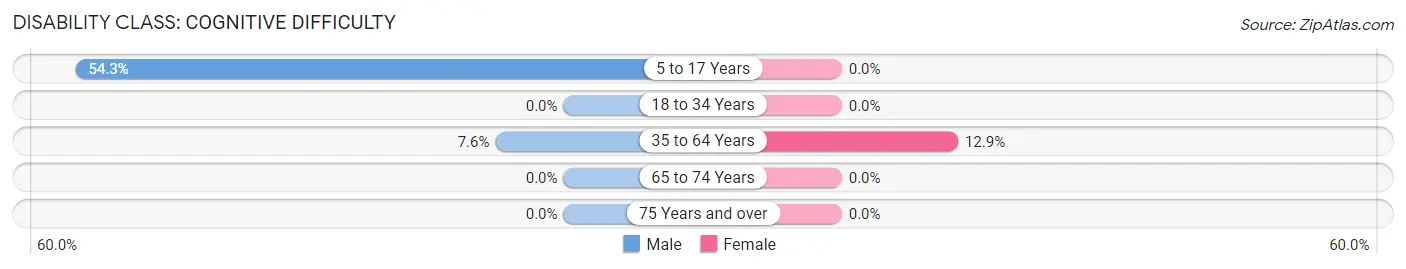
| Age Bracket | Male | Female |
| 5 to 17 Years | 94 (54.3%) | 0 (0.0%) |
| 18 to 34 Years | 0 (0.0%) | 0 (0.0%) |
| 35 to 64 Years | 21 (7.6%) | 26 (12.9%) |
| 65 to 74 Years | 0 (0.0%) | 0 (0.0%) |
| 75 Years and over | 0 (0.0%) | 0 (0.0%) |
Disability Class: Ambulatory Difficulty
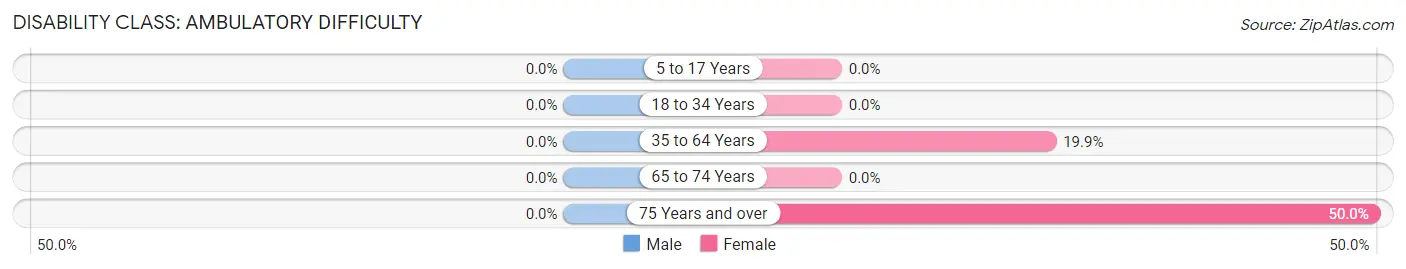
| Age Bracket | Male | Female |
| 5 to 17 Years | 0 (0.0%) | 0 (0.0%) |
| 18 to 34 Years | 0 (0.0%) | 0 (0.0%) |
| 35 to 64 Years | 0 (0.0%) | 40 (19.9%) |
| 65 to 74 Years | 0 (0.0%) | 0 (0.0%) |
| 75 Years and over | 0 (0.0%) | 11 (50.0%) |
Disability Class: Self-Care Difficulty
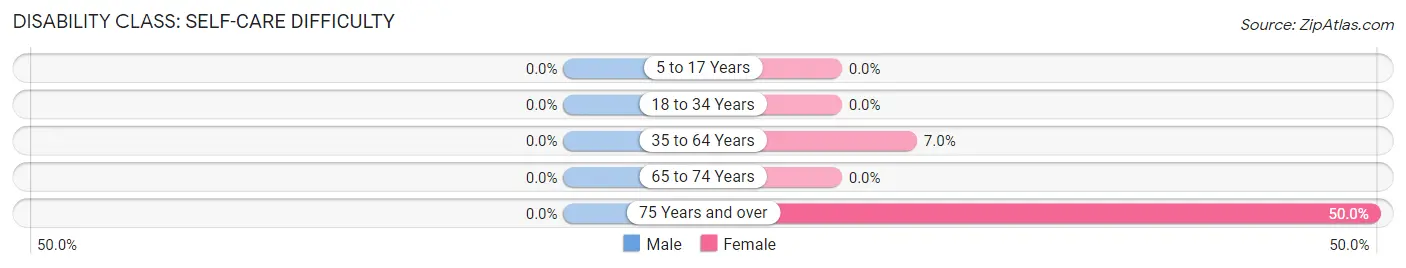
| Age Bracket | Male | Female |
| 5 to 17 Years | 0 (0.0%) | 0 (0.0%) |
| 18 to 34 Years | 0 (0.0%) | 0 (0.0%) |
| 35 to 64 Years | 0 (0.0%) | 14 (7.0%) |
| 65 to 74 Years | 0 (0.0%) | 0 (0.0%) |
| 75 Years and over | 0 (0.0%) | 11 (50.0%) |
Technology Access in Cypress Quarters
Computing Device Access in Cypress Quarters
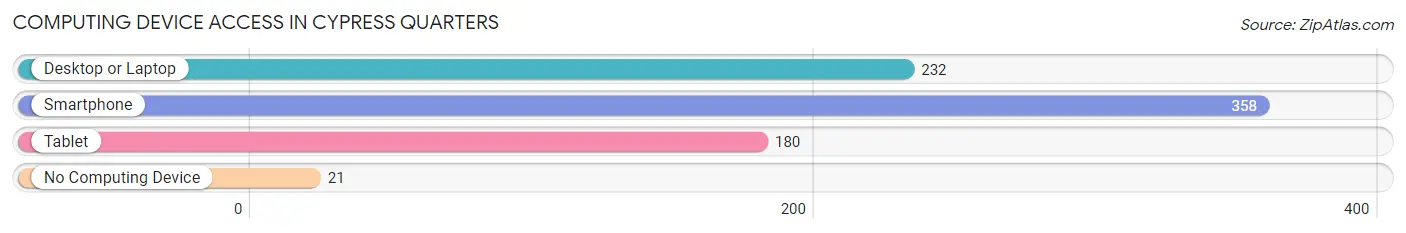
| Device Type | # Households | % Households |
| Desktop or Laptop | 232 | 57.3% |
| Smartphone | 358 | 88.4% |
| Tablet | 180 | 44.4% |
| No Computing Device | 21 | 5.2% |
| Total | 405 | 100.0% |
Internet Access in Cypress Quarters
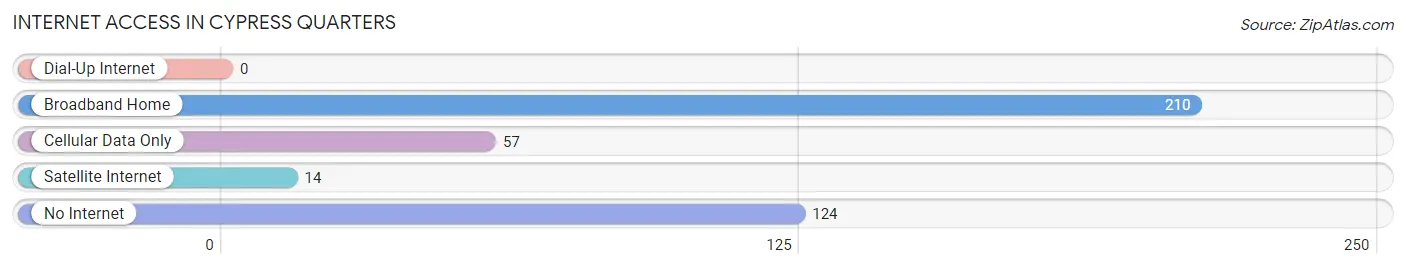
| Internet Type | # Households | % Households |
| Dial-Up Internet | 0 | 0.0% |
| Broadband Home | 210 | 51.8% |
| Cellular Data Only | 57 | 14.1% |
| Satellite Internet | 14 | 3.5% |
| No Internet | 124 | 30.6% |
| Total | 405 | 100.0% |
Cypress Quarters Summary
Cypress Quarters is a small unincorporated community located in the state of Florida, United States. It is situated in the northern part of the state, in the county of Santa Rosa. The community is located on the banks of the Blackwater River, and is bordered by the towns of Milton and Pace.
History
The area that is now known as Cypress Quarters was first settled in the early 1800s by a group of settlers from the nearby town of Milton. The settlers were looking for a place to settle and farm, and the area around the Blackwater River provided them with the perfect opportunity. The settlers named the area Cypress Quarters, after the abundance of cypress trees in the area.
The community grew slowly over the years, and by the early 1900s, it had become a thriving agricultural community. The main crops grown in the area were cotton, corn, and peanuts. The community also had a small sawmill, which provided lumber for the local farmers.
In the 1950s, the area began to experience a population boom, as people from all over the country moved to the area to take advantage of the booming economy. This influx of people led to the development of new businesses and industries, and the population of Cypress Quarters continued to grow.
Geography
Cypress Quarters is located in the northern part of the state of Florida, in the county of Santa Rosa. It is situated on the banks of the Blackwater River, and is bordered by the towns of Milton and Pace. The community is located in a rural area, and is surrounded by forests and wetlands.
The climate in Cypress Quarters is subtropical, with hot and humid summers and mild winters. The average temperature in the summer is around 90 degrees Fahrenheit, and the average temperature in the winter is around 60 degrees Fahrenheit.
Economy
The economy of Cypress Quarters is largely based on agriculture. The main crops grown in the area are cotton, corn, and peanuts. The community also has a small sawmill, which provides lumber for the local farmers.
In addition to agriculture, Cypress Quarters also has a few small businesses, such as a gas station, a grocery store, and a few restaurants. The community also has a few small manufacturing companies, which produce a variety of products, such as furniture and clothing.
Demographics
As of the 2010 census, the population of Cypress Quarters was 1,845. The population is mostly white, with a small percentage of African Americans and Hispanics. The median household income in the community is $37,000, and the median home value is $125,000. The unemployment rate in the community is around 8%, which is slightly higher than the national average.
Common Questions
What is the Total Population of Cypress Quarters?
Total Population of Cypress Quarters is 1,460.
What is the Total Male Population of Cypress Quarters?
Total Male Population of Cypress Quarters is 726.
What is the Total Female Population of Cypress Quarters?
Total Female Population of Cypress Quarters is 734.
What is the Ratio of Males per 100 Females in Cypress Quarters?
There are 98.91 Males per 100 Females in Cypress Quarters.
What is the Ratio of Females per 100 Males in Cypress Quarters?
There are 101.10 Females per 100 Males in Cypress Quarters.
What is the Median Population Age in Cypress Quarters?
Median Population Age in Cypress Quarters is 33.0 Years.
What is the Average Family Size in Cypress Quarters
Average Family Size in Cypress Quarters is 4.8 People.
What is the Average Household Size in Cypress Quarters
Average Household Size in Cypress Quarters is 3.6 People.
What is Per Capita Income in Cypress Quarters?
Per Capita income in Cypress Quarters is $24,338.
What is the Median Household income in Cypress Quarters?
Median Household Income in Cypress Quarters is $29,375.
What is Income or Wage Gap in Cypress Quarters?
Income or Wage Gap in Cypress Quarters is 58.7%.
Women in Cypress Quarters earn 41.3 cents for every dollar earned by a man.
What is Inequality or Gini Index in Cypress Quarters?
Inequality or Gini Index in Cypress Quarters is 0.60.
How Large is the Labor Force in Cypress Quarters?
There are 486 People in the Labor Forcein in Cypress Quarters.
What is the Percentage of People in the Labor Force in Cypress Quarters?
48.3% of People are in the Labor Force in Cypress Quarters.