Southgate, FL
Southgate Map
Southgate Overview
6,183
TOTAL POPULATION
2,952
MALE POPULATION
3,231
FEMALE POPULATION
91.36
MALES / 100 FEMALES
109.45
FEMALES / 100 MALES
49.7
MEDIAN AGE
2.6
AVG FAMILY SIZE
2.1
AVG HOUSEHOLD SIZE
$45,773
PER CAPITA INCOME
$78,271
AVG FAMILY INCOME
$71,711
AVG HOUSEHOLD INCOME
10.6%
WAGE / INCOME GAP [ % ]
89.4¢/ $1
WAGE / INCOME GAP [ $ ]
0.46
INEQUALITY / GINI INDEX
3,204
LABOR FORCE [ PEOPLE ]
60.4%
PERCENT IN LABOR FORCE
6.4%
UNEMPLOYMENT RATE
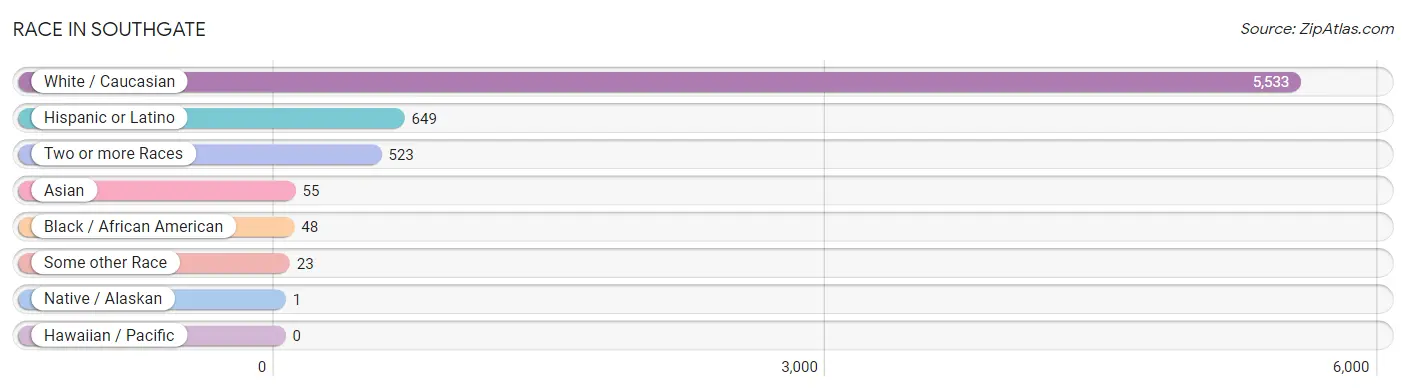
Race in Southgate
The most populous races in Southgate are White / Caucasian (5,533 | 89.5%), Hispanic or Latino (649 | 10.5%), and Two or more Races (523 | 8.5%).
| Race | # Population | % Population |
| Asian | 55 | 0.9% |
| Black / African American | 48 | 0.8% |
| Hawaiian / Pacific | 0 | 0.0% |
| Hispanic or Latino | 649 | 10.5% |
| Native / Alaskan | 1 | 0.0% |
| White / Caucasian | 5,533 | 89.5% |
| Two or more Races | 523 | 8.5% |
| Some other Race | 23 | 0.4% |
| Total | 6,183 | 100.0% |
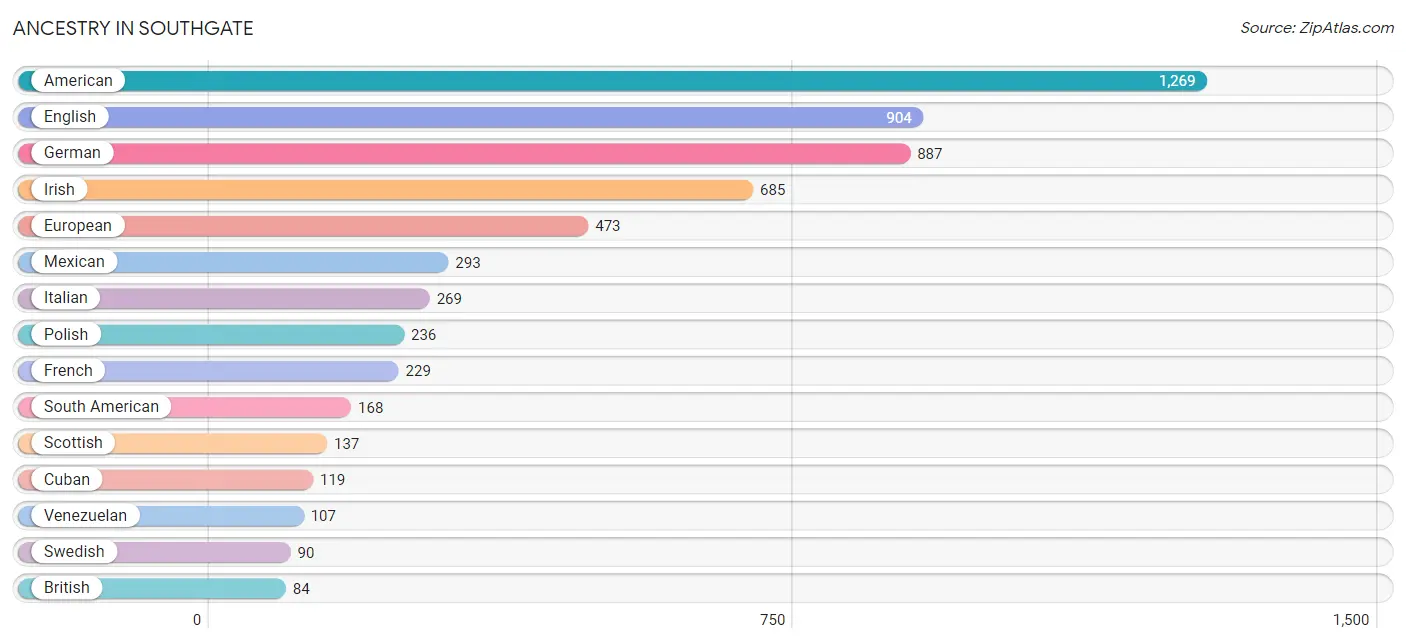
Ancestry in Southgate
The most populous ancestries reported in Southgate are American (1,269 | 20.5%), English (904 | 14.6%), German (887 | 14.3%), Irish (685 | 11.1%), and European (473 | 7.6%), together accounting for 68.2% of all Southgate residents.
| Ancestry | # Population | % Population |
| African | 23 | 0.4% |
| American | 1,269 | 20.5% |
| Arab | 10 | 0.2% |
| Austrian | 15 | 0.2% |
| Bhutanese | 11 | 0.2% |
| Blackfeet | 4 | 0.1% |
| British | 84 | 1.4% |
| Bulgarian | 16 | 0.3% |
| Burmese | 5 | 0.1% |
| Canadian | 22 | 0.4% |
| Central American | 12 | 0.2% |
| Cherokee | 57 | 0.9% |
| Colombian | 49 | 0.8% |
| Cree | 6 | 0.1% |
| Croatian | 7 | 0.1% |
| Cuban | 119 | 1.9% |
| Czech | 8 | 0.1% |
| Delaware | 1 | 0.0% |
| Dutch | 37 | 0.6% |
| Eastern European | 63 | 1.0% |
| Ecuadorian | 7 | 0.1% |
| English | 904 | 14.6% |
| European | 473 | 7.6% |
| Filipino | 22 | 0.4% |
| Finnish | 28 | 0.4% |
| French | 229 | 3.7% |
| French Canadian | 15 | 0.2% |
| German | 887 | 14.3% |
| Haitian | 1 | 0.0% |
| Hungarian | 23 | 0.4% |
| Indian (Asian) | 43 | 0.7% |
| Iranian | 13 | 0.2% |
| Irish | 685 | 11.1% |
| Iroquois | 20 | 0.3% |
| Italian | 269 | 4.3% |
| Jamaican | 18 | 0.3% |
| Korean | 10 | 0.2% |
| Lebanese | 10 | 0.2% |
| Mexican | 293 | 4.7% |
| Native Hawaiian | 7 | 0.1% |
| Nicaraguan | 12 | 0.2% |
| Osage | 1 | 0.0% |
| Peruvian | 5 | 0.1% |
| Polish | 236 | 3.8% |
| Portuguese | 13 | 0.2% |
| Puerto Rican | 28 | 0.4% |
| Russian | 60 | 1.0% |
| Scandinavian | 7 | 0.1% |
| Scotch-Irish | 61 | 1.0% |
| Scottish | 137 | 2.2% |
| Slovak | 37 | 0.6% |
| Slovene | 33 | 0.5% |
| South American | 168 | 2.7% |
| Spanish | 24 | 0.4% |
| Sri Lankan | 12 | 0.2% |
| Subsaharan African | 23 | 0.4% |
| Swedish | 90 | 1.5% |
| Swiss | 29 | 0.5% |
| Ukrainian | 75 | 1.2% |
| Venezuelan | 107 | 1.7% |
| Welsh | 16 | 0.3% | View All 61 Rows |
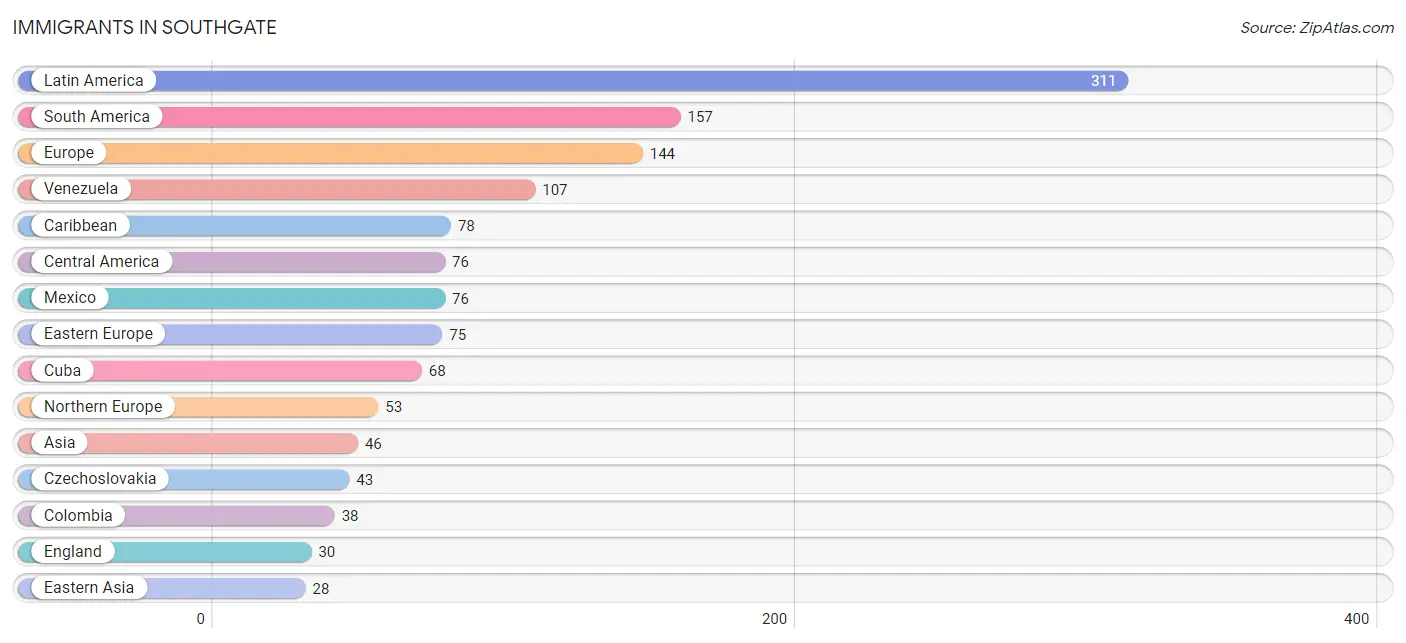
Immigrants in Southgate
The most numerous immigrant groups reported in Southgate came from Latin America (311 | 5.0%), South America (157 | 2.5%), Europe (144 | 2.3%), Venezuela (107 | 1.7%), and Caribbean (78 | 1.3%), together accounting for 12.9% of all Southgate residents.
| Immigration Origin | # Population | % Population |
| Africa | 25 | 0.4% |
| Asia | 46 | 0.7% |
| Bulgaria | 16 | 0.3% |
| Canada | 23 | 0.4% |
| Caribbean | 78 | 1.3% |
| Central America | 76 | 1.2% |
| China | 17 | 0.3% |
| Colombia | 38 | 0.6% |
| Cuba | 68 | 1.1% |
| Czechoslovakia | 43 | 0.7% |
| Eastern Africa | 18 | 0.3% |
| Eastern Asia | 28 | 0.4% |
| Eastern Europe | 75 | 1.2% |
| Ecuador | 7 | 0.1% |
| Egypt | 7 | 0.1% |
| England | 30 | 0.5% |
| Europe | 144 | 2.3% |
| Germany | 16 | 0.3% |
| Haiti | 1 | 0.0% |
| Jamaica | 9 | 0.2% |
| Japan | 11 | 0.2% |
| Kenya | 18 | 0.3% |
| Latin America | 311 | 5.0% |
| Mexico | 76 | 1.2% |
| Northern Africa | 7 | 0.1% |
| Northern Europe | 53 | 0.9% |
| Peru | 5 | 0.1% |
| Philippines | 10 | 0.2% |
| Poland | 16 | 0.3% |
| South America | 157 | 2.5% |
| South Eastern Asia | 18 | 0.3% |
| Taiwan | 7 | 0.1% |
| Venezuela | 107 | 1.7% |
| Vietnam | 8 | 0.1% |
| Western Europe | 16 | 0.3% | View All 35 Rows |
Sex and Age in Southgate
Sex and Age in Southgate
The most populous age groups in Southgate are 55 to 59 Years (269 | 9.1%) for men and 60 to 64 Years (383 | 11.8%) for women.
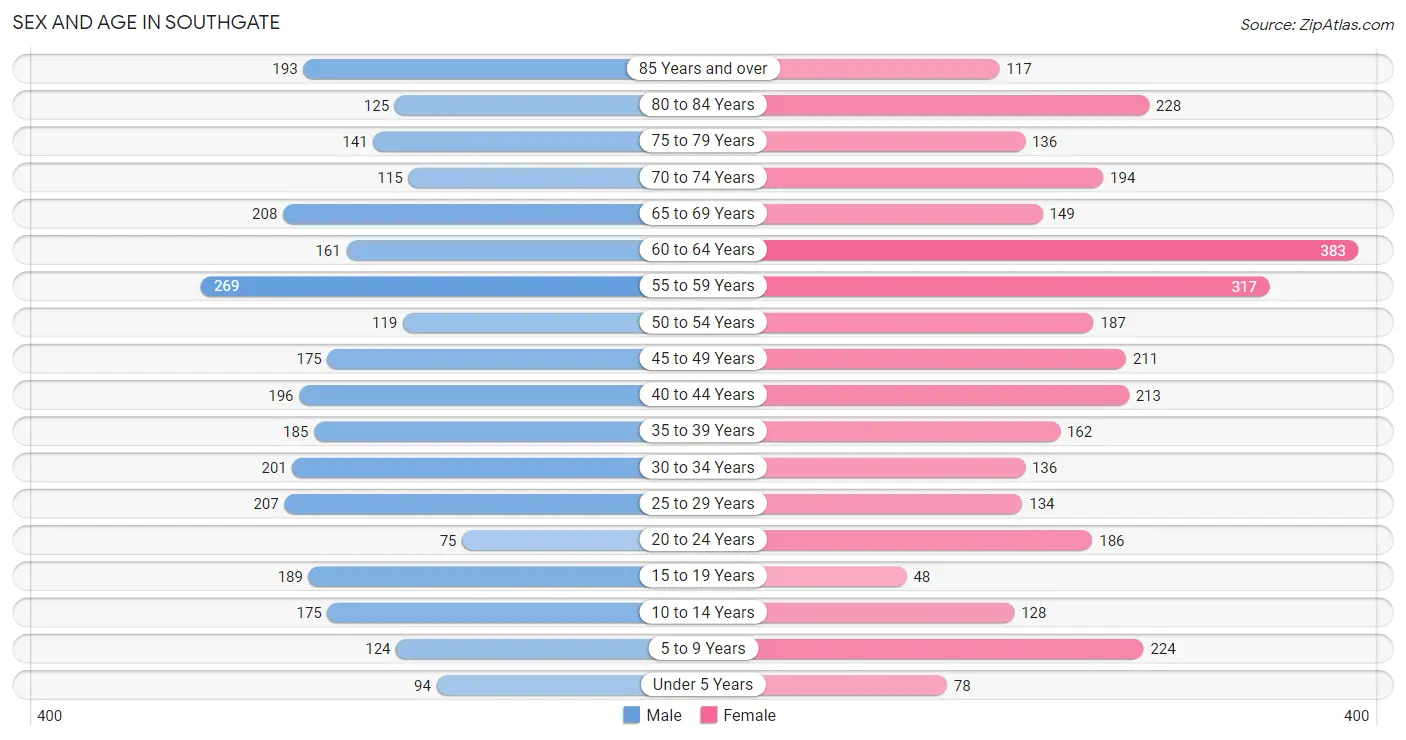
| Age Bracket | Male | Female |
| Under 5 Years | 94 (3.2%) | 78 (2.4%) |
| 5 to 9 Years | 124 (4.2%) | 224 (6.9%) |
| 10 to 14 Years | 175 (5.9%) | 128 (4.0%) |
| 15 to 19 Years | 189 (6.4%) | 48 (1.5%) |
| 20 to 24 Years | 75 (2.5%) | 186 (5.8%) |
| 25 to 29 Years | 207 (7.0%) | 134 (4.2%) |
| 30 to 34 Years | 201 (6.8%) | 136 (4.2%) |
| 35 to 39 Years | 185 (6.3%) | 162 (5.0%) |
| 40 to 44 Years | 196 (6.6%) | 213 (6.6%) |
| 45 to 49 Years | 175 (5.9%) | 211 (6.5%) |
| 50 to 54 Years | 119 (4.0%) | 187 (5.8%) |
| 55 to 59 Years | 269 (9.1%) | 317 (9.8%) |
| 60 to 64 Years | 161 (5.4%) | 383 (11.8%) |
| 65 to 69 Years | 208 (7.0%) | 149 (4.6%) |
| 70 to 74 Years | 115 (3.9%) | 194 (6.0%) |
| 75 to 79 Years | 141 (4.8%) | 136 (4.2%) |
| 80 to 84 Years | 125 (4.2%) | 228 (7.1%) |
| 85 Years and over | 193 (6.5%) | 117 (3.6%) |
| Total | 2,952 (100.0%) | 3,231 (100.0%) |
Families and Households in Southgate
Median Family Size in Southgate
The median family size in Southgate is 2.56 persons per family, with single male/father families (133 | 7.3%) accounting for the largest median family size of 3.13 persons per family. On the other hand, single female/mother families (395 | 21.6%) represent the smallest median family size with 1.99 persons per family.
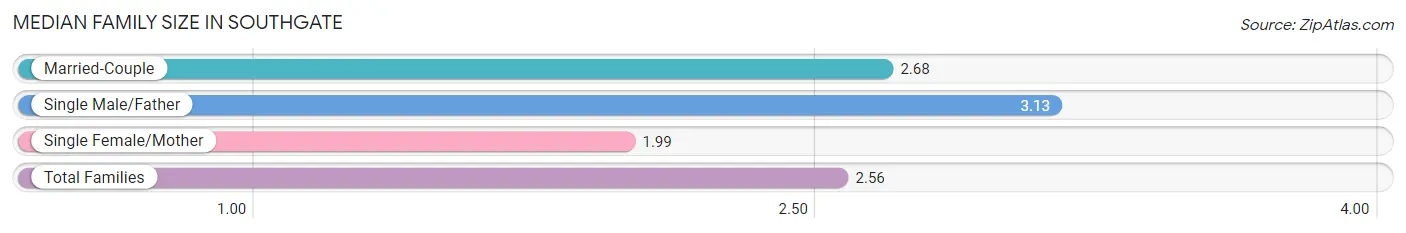
| Family Type | # Families | Family Size |
| Married-Couple | 1,299 (71.1%) | 2.68 |
| Single Male/Father | 133 (7.3%) | 3.13 |
| Single Female/Mother | 395 (21.6%) | 1.99 |
| Total Families | 1,827 (100.0%) | 2.56 |
Median Household Size in Southgate
The median household size in Southgate is 2.15 persons per household, with single male/father households (133 | 4.7%) accounting for the largest median household size of 3.4 persons per household. non-family households (1,015 | 35.7%) represent the smallest median household size with 1.31 persons per household.
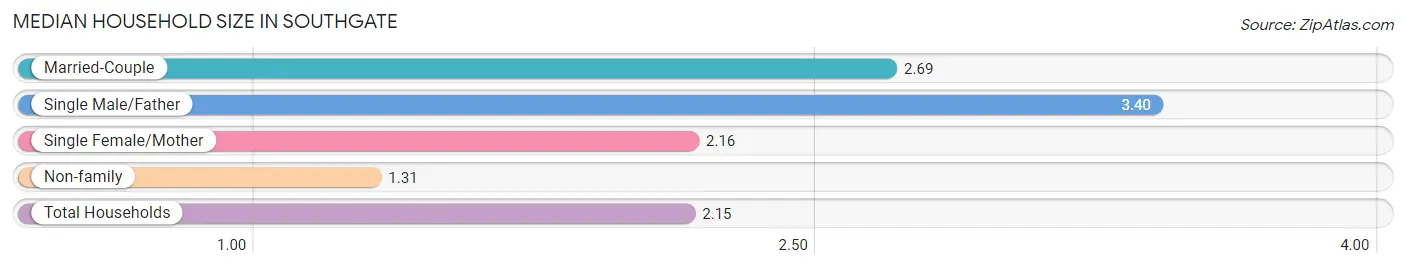
| Household Type | # Households | Household Size |
| Married-Couple | 1,299 (45.7%) | 2.69 |
| Single Male/Father | 133 (4.7%) | 3.40 |
| Single Female/Mother | 395 (13.9%) | 2.16 |
| Non-family | 1,015 (35.7%) | 1.31 |
| Total Households | 2,842 (100.0%) | 2.15 |
Household Size by Marriage Status in Southgate
Out of a total of 2,842 households in Southgate, 1,827 (64.3%) are family households, while 1,015 (35.7%) are nonfamily households. The most numerous type of family households are 2-person households, comprising 1,083, and the most common type of nonfamily households are 1-person households, comprising 740.
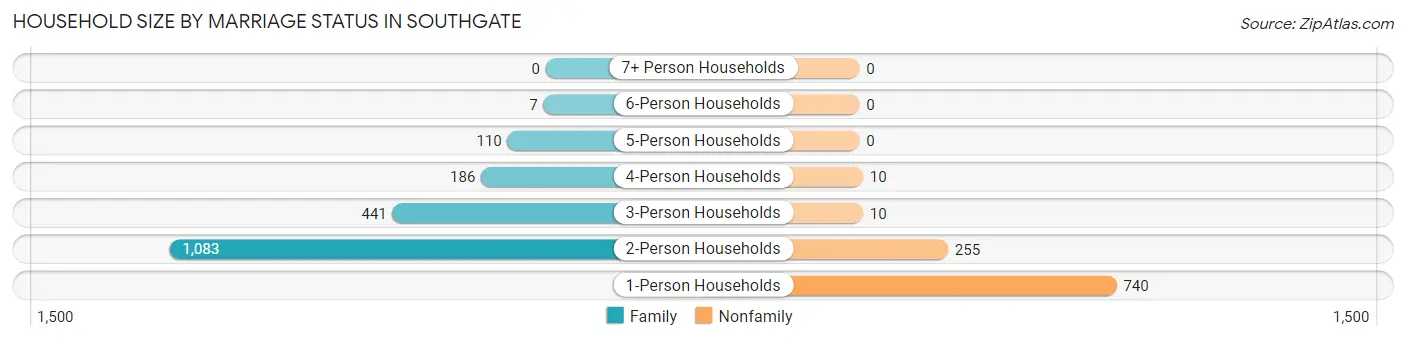
| Household Size | Family Households | Nonfamily Households |
| 1-Person Households | - | 740 (26.0%) |
| 2-Person Households | 1,083 (38.1%) | 255 (9.0%) |
| 3-Person Households | 441 (15.5%) | 10 (0.4%) |
| 4-Person Households | 186 (6.5%) | 10 (0.4%) |
| 5-Person Households | 110 (3.9%) | 0 (0.0%) |
| 6-Person Households | 7 (0.3%) | 0 (0.0%) |
| 7+ Person Households | 0 (0.0%) | 0 (0.0%) |
| Total | 1,827 (64.3%) | 1,015 (35.7%) |
Female Fertility in Southgate
Fertility by Age in Southgate
Average fertility rate in Southgate is 70.0 births per 1,000 women. Women in the age bracket of 20 to 34 years have the highest fertility rate with 107.0 births per 1,000 women. Women in the age bracket of 20 to 34 years acount for 62.0% of all women with births.
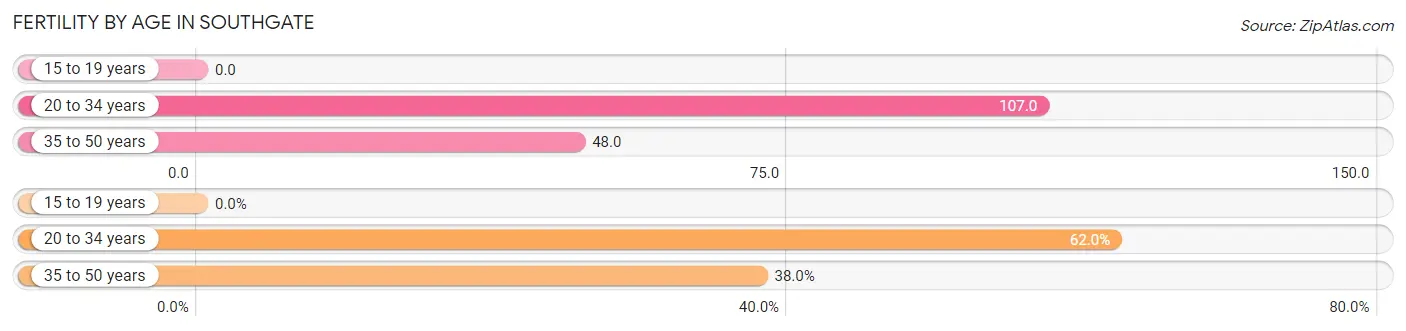
| Age Bracket | Women with Births | Births / 1,000 Women |
| 15 to 19 years | 0 (0.0%) | 0.0 |
| 20 to 34 years | 49 (62.0%) | 107.0 |
| 35 to 50 years | 30 (38.0%) | 48.0 |
| Total | 79 (100.0%) | 70.0 |
Fertility by Age by Marriage Status in Southgate
38.0% of women with births (79) in Southgate are married. The highest percentage of unmarried women with births falls into 20 to 34 years age bracket with 100.0% of them unmarried at the time of birth, while the lowest percentage of unmarried women with births belong to 35 to 50 years age bracket with 0.0% of them unmarried.
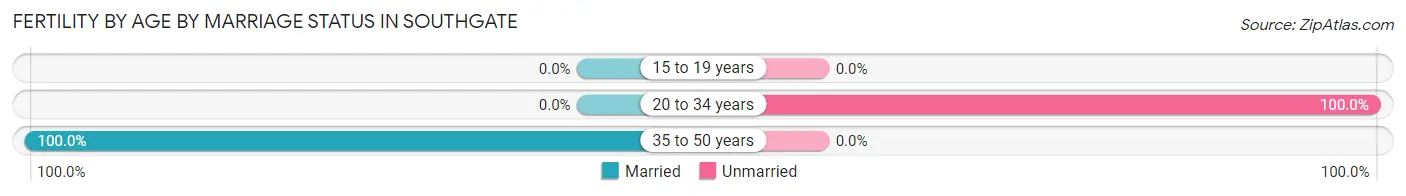
| Age Bracket | Married | Unmarried |
| 15 to 19 years | 0 (0.0%) | 0 (0.0%) |
| 20 to 34 years | 0 (0.0%) | 49 (100.0%) |
| 35 to 50 years | 30 (100.0%) | 0 (0.0%) |
| Total | 30 (38.0%) | 49 (62.0%) |
Fertility by Education in Southgate
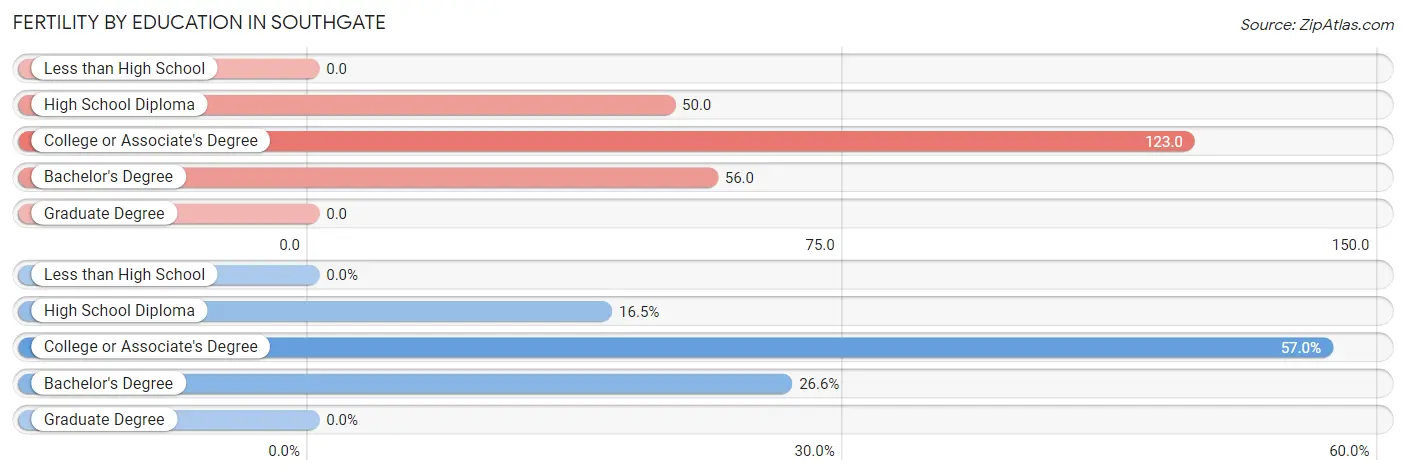
| Educational Attainment | Women with Births | Births / 1,000 Women |
| Less than High School | 0 (0.0%) | 0.0 |
| High School Diploma | 13 (16.5%) | 50.0 |
| College or Associate's Degree | 45 (57.0%) | 123.0 |
| Bachelor's Degree | 21 (26.6%) | 56.0 |
| Graduate Degree | 0 (0.0%) | 0.0 |
| Total | 79 (100.0%) | 70.0 |
Fertility by Education by Marriage Status in Southgate
62.0% of women with births in Southgate are unmarried. Women with the educational attainment of bachelor's degree are most likely to be married with 100.0% of them married at childbirth, while women with the educational attainment of high school diploma are least likely to be married with 100.0% of them unmarried at childbirth.
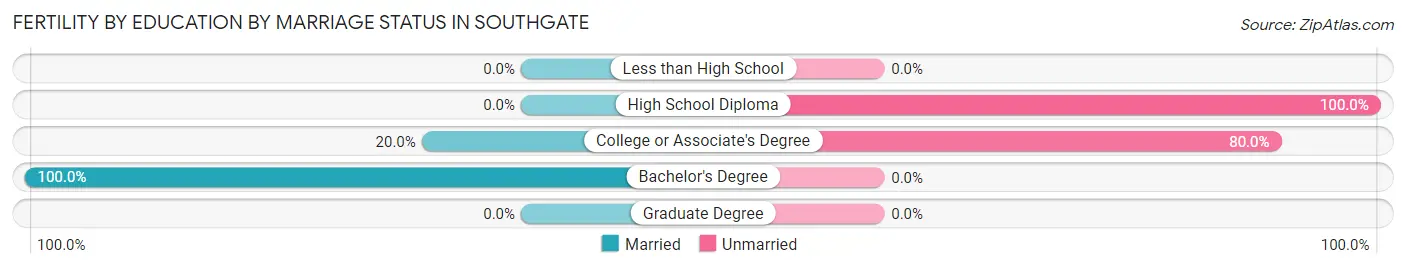
| Educational Attainment | Married | Unmarried |
| Less than High School | 0 (0.0%) | 0 (0.0%) |
| High School Diploma | 0 (0.0%) | 13 (100.0%) |
| College or Associate's Degree | 9 (20.0%) | 36 (80.0%) |
| Bachelor's Degree | 21 (100.0%) | 0 (0.0%) |
| Graduate Degree | 0 (0.0%) | 0 (0.0%) |
| Total | 30 (38.0%) | 49 (62.0%) |
Income in Southgate
Income Overview in Southgate
Per Capita Income in Southgate is $45,773, while median incomes of families and households are $78,271 and $71,711 respectively.
| Characteristic | Number | Measure |
| Per Capita Income | 6,183 | $45,773 |
| Median Family Income | 1,827 | $78,271 |
| Mean Family Income | 1,827 | $104,687 |
| Median Household Income | 2,842 | $71,711 |
| Mean Household Income | 2,842 | $98,230 |
| Income Deficit | 1,827 | $0 |
| Wage / Income Gap (%) | 6,183 | 10.64% |
| Wage / Income Gap ($) | 6,183 | 89.36¢ per $1 |
| Gini / Inequality Index | 6,183 | 0.46 |
Earnings by Sex in Southgate
Average Earnings in Southgate are $41,673, $44,904 for men and $40,125 for women, a difference of 10.6%.
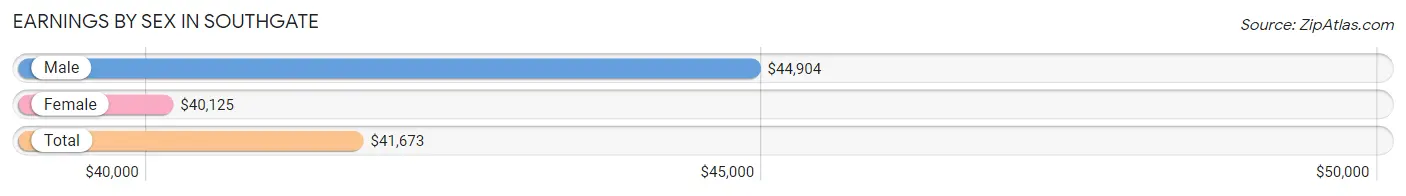
| Sex | Number | Average Earnings |
| Male | 1,684 (49.9%) | $44,904 |
| Female | 1,691 (50.1%) | $40,125 |
| Total | 3,375 (100.0%) | $41,673 |
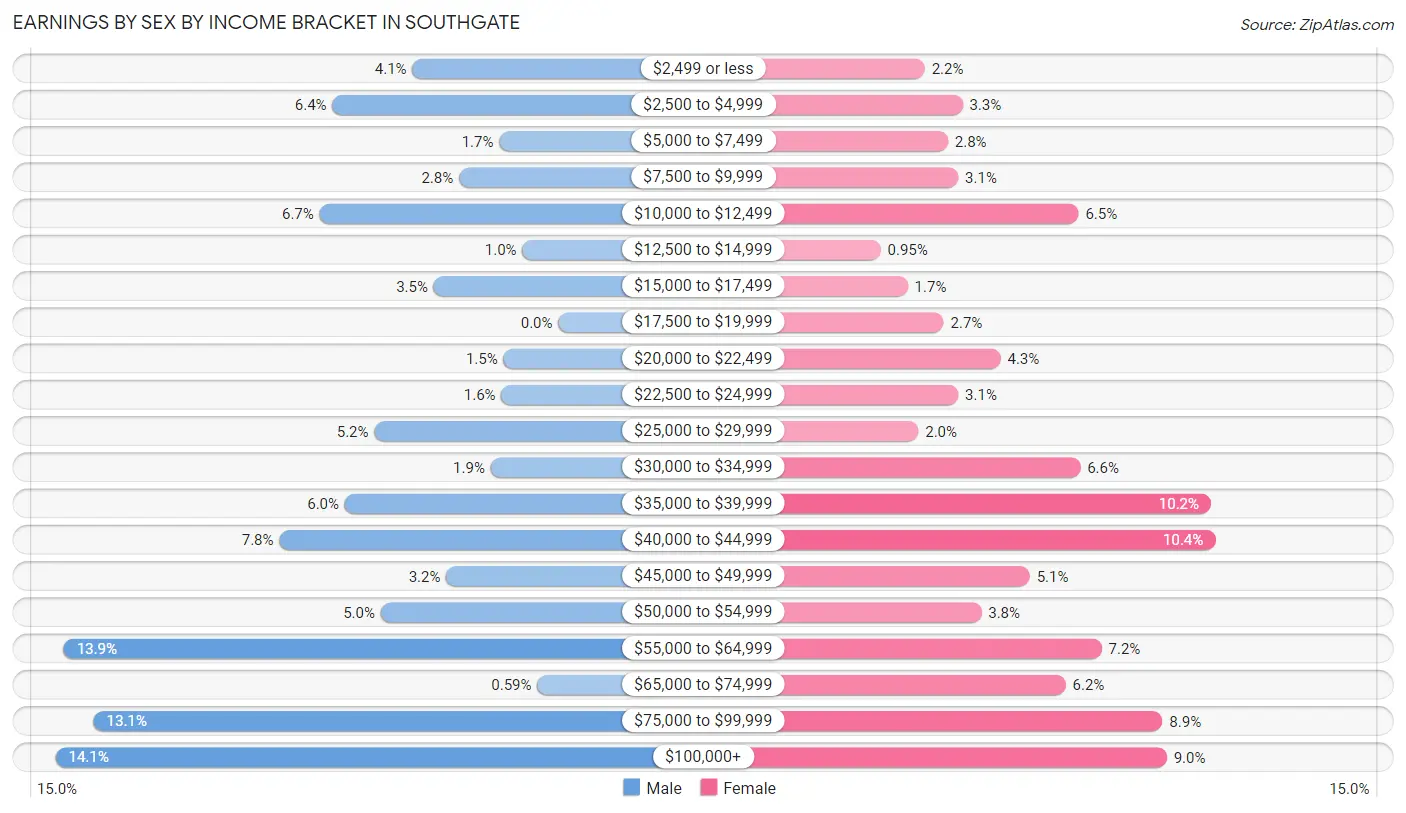
Earnings by Sex by Income Bracket in Southgate
The most common earnings brackets in Southgate are $100,000+ for men (238 | 14.1%) and $40,000 to $44,999 for women (175 | 10.3%).
| Income | Male | Female |
| $2,499 or less | 69 (4.1%) | 37 (2.2%) |
| $2,500 to $4,999 | 107 (6.4%) | 55 (3.3%) |
| $5,000 to $7,499 | 28 (1.7%) | 48 (2.8%) |
| $7,500 to $9,999 | 47 (2.8%) | 53 (3.1%) |
| $10,000 to $12,499 | 113 (6.7%) | 110 (6.5%) |
| $12,500 to $14,999 | 17 (1.0%) | 16 (0.9%) |
| $15,000 to $17,499 | 59 (3.5%) | 29 (1.7%) |
| $17,500 to $19,999 | 0 (0.0%) | 46 (2.7%) |
| $20,000 to $22,499 | 26 (1.5%) | 73 (4.3%) |
| $22,500 to $24,999 | 27 (1.6%) | 53 (3.1%) |
| $25,000 to $29,999 | 87 (5.2%) | 34 (2.0%) |
| $30,000 to $34,999 | 32 (1.9%) | 111 (6.6%) |
| $35,000 to $39,999 | 101 (6.0%) | 173 (10.2%) |
| $40,000 to $44,999 | 132 (7.8%) | 175 (10.3%) |
| $45,000 to $49,999 | 53 (3.2%) | 87 (5.1%) |
| $50,000 to $54,999 | 84 (5.0%) | 64 (3.8%) |
| $55,000 to $64,999 | 234 (13.9%) | 121 (7.2%) |
| $65,000 to $74,999 | 10 (0.6%) | 104 (6.1%) |
| $75,000 to $99,999 | 220 (13.1%) | 150 (8.9%) |
| $100,000+ | 238 (14.1%) | 152 (9.0%) |
| Total | 1,684 (100.0%) | 1,691 (100.0%) |
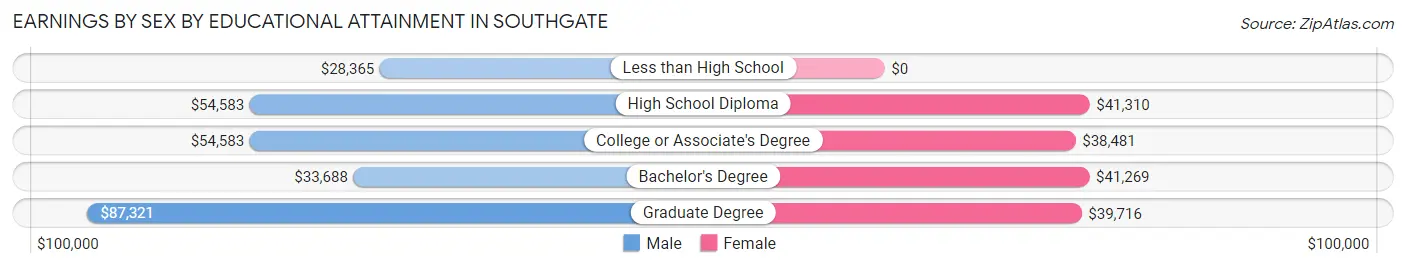
Earnings by Sex by Educational Attainment in Southgate
Average earnings in Southgate are $52,727 for men and $40,517 for women, a difference of 23.2%. Men with an educational attainment of graduate degree enjoy the highest average annual earnings of $87,321, while those with less than high school education earn the least with $28,365. Women with an educational attainment of high school diploma earn the most with the average annual earnings of $41,310, while those with college or associate's degree education have the smallest earnings of $38,481.
| Educational Attainment | Male Income | Female Income |
| Less than High School | $28,365 | $0 |
| High School Diploma | $54,583 | $41,310 |
| College or Associate's Degree | $54,583 | $38,481 |
| Bachelor's Degree | $33,688 | $41,269 |
| Graduate Degree | $87,321 | $39,716 |
| Total | $52,727 | $40,517 |
Family Income in Southgate
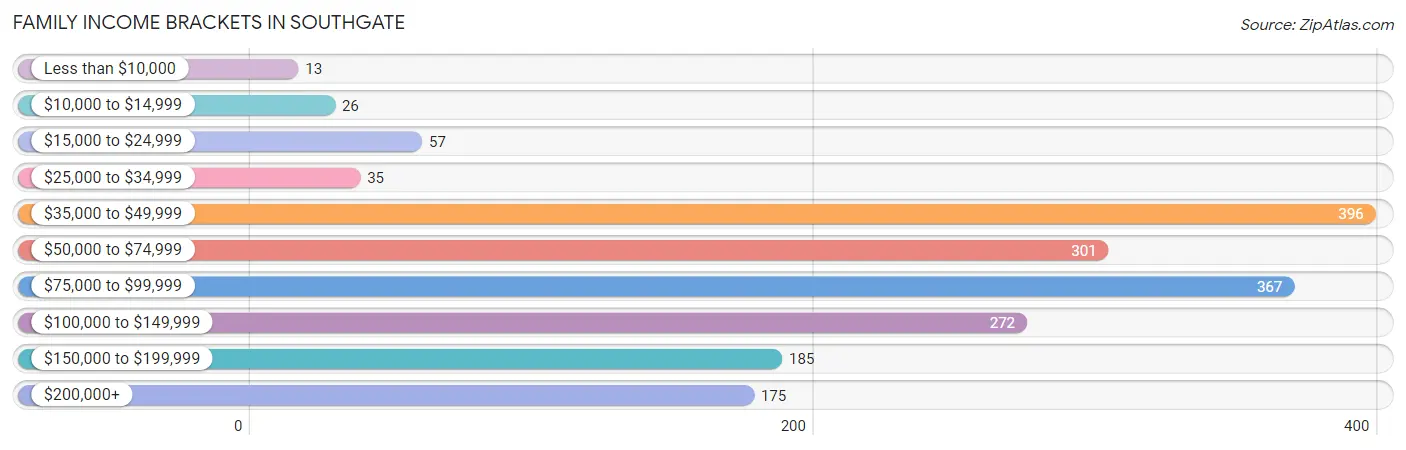
Family Income Brackets in Southgate
According to the Southgate family income data, there are 396 families falling into the $35,000 to $49,999 income range, which is the most common income bracket and makes up 21.7% of all families. Conversely, the less than $10,000 income bracket is the least frequent group with only 13 families (0.7%) belonging to this category.
| Income Bracket | # Families | % Families |
| Less than $10,000 | 13 | 0.7% |
| $10,000 to $14,999 | 26 | 1.4% |
| $15,000 to $24,999 | 57 | 3.1% |
| $25,000 to $34,999 | 35 | 1.9% |
| $35,000 to $49,999 | 396 | 21.7% |
| $50,000 to $74,999 | 301 | 16.5% |
| $75,000 to $99,999 | 367 | 20.1% |
| $100,000 to $149,999 | 272 | 14.9% |
| $150,000 to $199,999 | 185 | 10.1% |
| $200,000+ | 175 | 9.6% |
Family Income by Famaliy Size in Southgate
4-person families (195 | 10.7%) account for the highest median family income in Southgate with $132,542 per family, while 2-person families (1,232 | 67.4%) have the highest median income of $37,988 per family member.
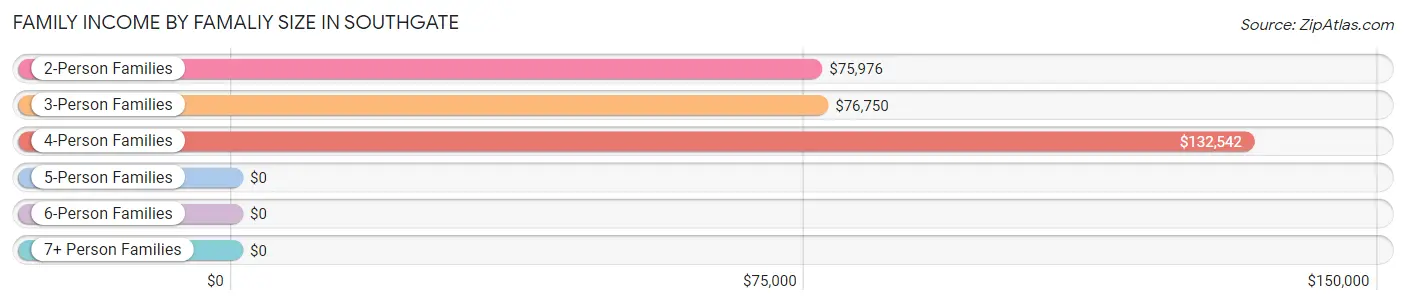
| Income Bracket | # Families | Median Income |
| 2-Person Families | 1,232 (67.4%) | $75,976 |
| 3-Person Families | 314 (17.2%) | $76,750 |
| 4-Person Families | 195 (10.7%) | $132,542 |
| 5-Person Families | 79 (4.3%) | $0 |
| 6-Person Families | 7 (0.4%) | $0 |
| 7+ Person Families | 0 (0.0%) | $0 |
| Total | 1,827 (100.0%) | $78,271 |
Family Income by Number of Earners in Southgate
The median family income in Southgate is $78,271, with families comprising 2 earners (767) having the highest median family income of $102,188, while families with no earners (399) have the lowest median family income of $46,010, accounting for 42.0% and 21.8% of families, respectively.
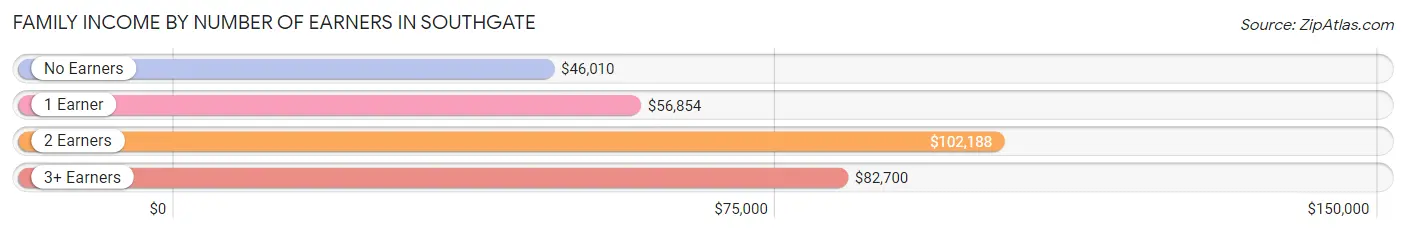
| Number of Earners | # Families | Median Income |
| No Earners | 399 (21.8%) | $46,010 |
| 1 Earner | 541 (29.6%) | $56,854 |
| 2 Earners | 767 (42.0%) | $102,188 |
| 3+ Earners | 120 (6.6%) | $82,700 |
| Total | 1,827 (100.0%) | $78,271 |
Household Income in Southgate
Household Income Brackets in Southgate
With 514 households falling in the category, the $35,000 to $49,999 income range is the most frequent in Southgate, accounting for 18.1% of all households. In contrast, only 99 households (3.5%) fall into the $25,000 to $34,999 income bracket, making it the least populous group.
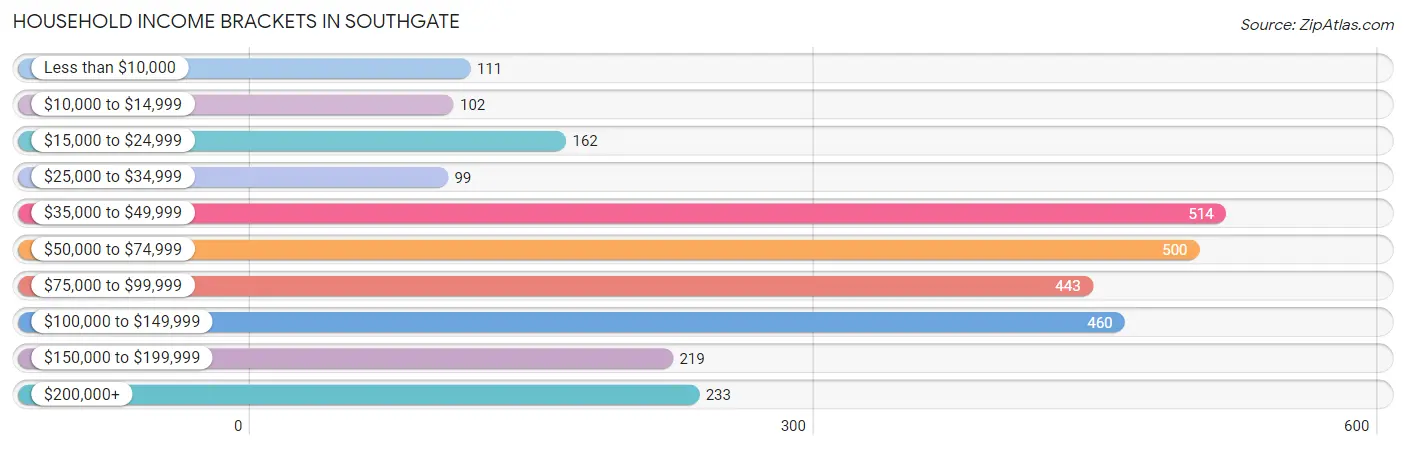
| Income Bracket | # Households | % Households |
| Less than $10,000 | 111 | 3.9% |
| $10,000 to $14,999 | 102 | 3.6% |
| $15,000 to $24,999 | 162 | 5.7% |
| $25,000 to $34,999 | 99 | 3.5% |
| $35,000 to $49,999 | 514 | 18.1% |
| $50,000 to $74,999 | 500 | 17.6% |
| $75,000 to $99,999 | 443 | 15.6% |
| $100,000 to $149,999 | 460 | 16.2% |
| $150,000 to $199,999 | 219 | 7.7% |
| $200,000+ | 233 | 8.2% |
Household Income by Householder Age in Southgate
The median household income in Southgate is $71,711, with the highest median household income of $134,000 found in the 15 to 24 years age bracket for the primary householder. A total of 92 households (3.2%) fall into this category. Meanwhile, the 65+ years age bracket for the primary householder has the lowest median household income of $53,085, with 914 households (32.2%) in this group.
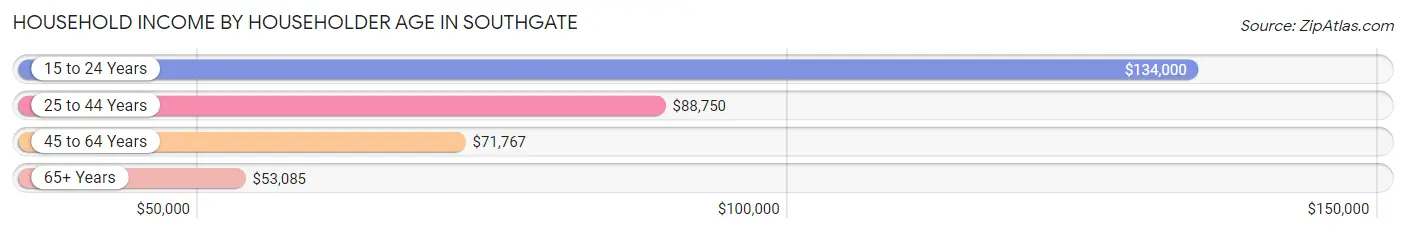
| Income Bracket | # Households | Median Income |
| 15 to 24 Years | 92 (3.2%) | $134,000 |
| 25 to 44 Years | 710 (25.0%) | $88,750 |
| 45 to 64 Years | 1,126 (39.6%) | $71,767 |
| 65+ Years | 914 (32.2%) | $53,085 |
| Total | 2,842 (100.0%) | $71,711 |
Poverty in Southgate
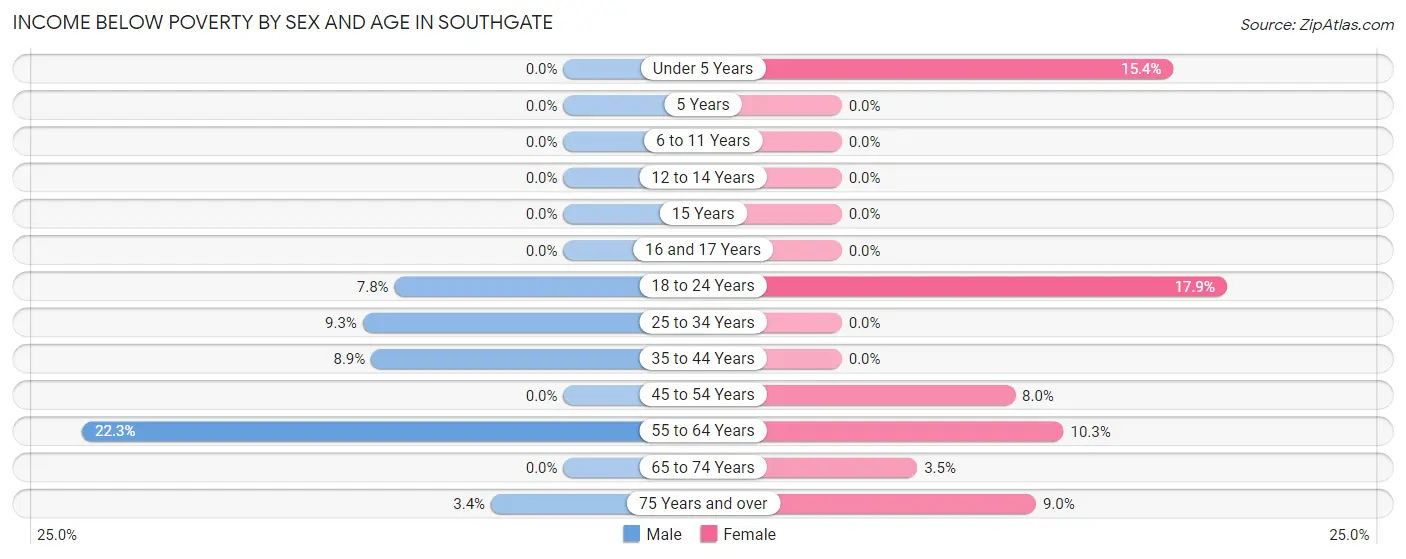
Income Below Poverty by Sex and Age in Southgate
With 6.7% poverty level for males and 6.4% for females among the residents of Southgate, 55 to 64 year old males and 18 to 24 year old females are the most vulnerable to poverty, with 96 males (22.3%) and 35 females (17.9%) in their respective age groups living below the poverty level.
| Age Bracket | Male | Female |
| Under 5 Years | 0 (0.0%) | 12 (15.4%) |
| 5 Years | 0 (0.0%) | 0 (0.0%) |
| 6 to 11 Years | 0 (0.0%) | 0 (0.0%) |
| 12 to 14 Years | 0 (0.0%) | 0 (0.0%) |
| 15 Years | 0 (0.0%) | 0 (0.0%) |
| 16 and 17 Years | 0 (0.0%) | 0 (0.0%) |
| 18 to 24 Years | 12 (7.8%) | 35 (17.9%) |
| 25 to 34 Years | 38 (9.3%) | 0 (0.0%) |
| 35 to 44 Years | 34 (8.9%) | 0 (0.0%) |
| 45 to 54 Years | 0 (0.0%) | 32 (8.0%) |
| 55 to 64 Years | 96 (22.3%) | 72 (10.3%) |
| 65 to 74 Years | 0 (0.0%) | 12 (3.5%) |
| 75 Years and over | 14 (3.4%) | 42 (9.0%) |
| Total | 194 (6.7%) | 205 (6.4%) |
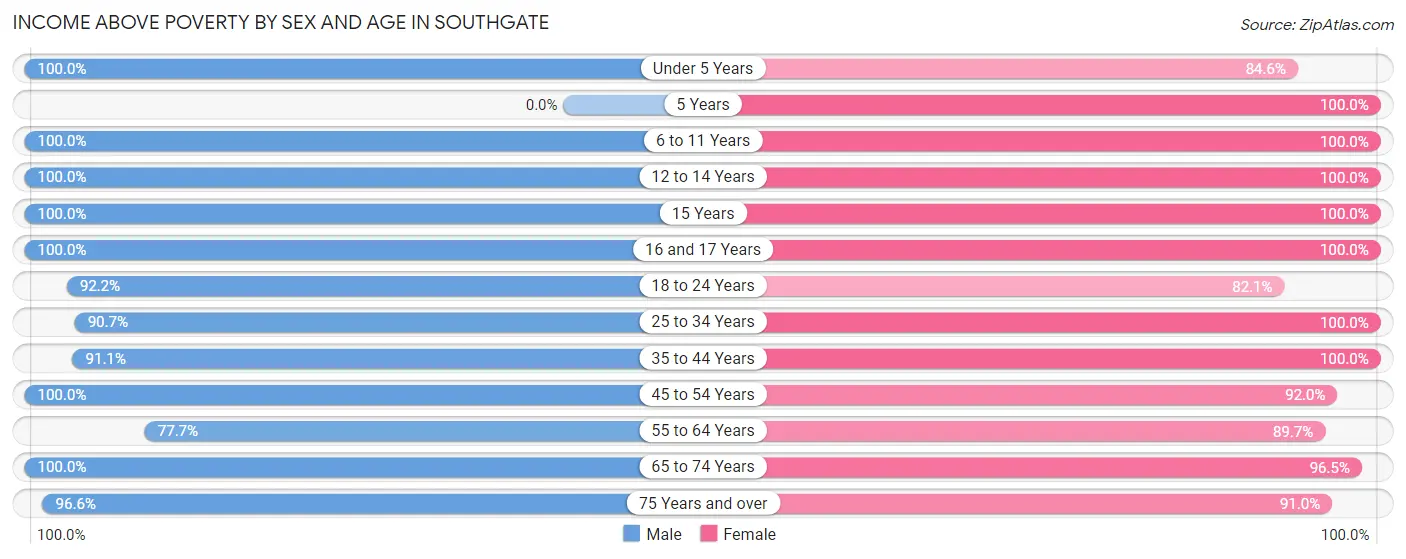
Income Above Poverty by Sex and Age in Southgate
According to the poverty statistics in Southgate, males aged under 5 years and females aged 5 years are the age groups that are most secure financially, with 100.0% of males and 100.0% of females in these age groups living above the poverty line.
| Age Bracket | Male | Female |
| Under 5 Years | 94 (100.0%) | 66 (84.6%) |
| 5 Years | 0 (0.0%) | 64 (100.0%) |
| 6 to 11 Years | 170 (100.0%) | 216 (100.0%) |
| 12 to 14 Years | 129 (100.0%) | 72 (100.0%) |
| 15 Years | 46 (100.0%) | 10 (100.0%) |
| 16 and 17 Years | 65 (100.0%) | 28 (100.0%) |
| 18 to 24 Years | 141 (92.2%) | 161 (82.1%) |
| 25 to 34 Years | 370 (90.7%) | 270 (100.0%) |
| 35 to 44 Years | 347 (91.1%) | 375 (100.0%) |
| 45 to 54 Years | 294 (100.0%) | 366 (92.0%) |
| 55 to 64 Years | 334 (77.7%) | 628 (89.7%) |
| 65 to 74 Years | 323 (100.0%) | 331 (96.5%) |
| 75 Years and over | 403 (96.6%) | 424 (91.0%) |
| Total | 2,716 (93.3%) | 3,011 (93.6%) |
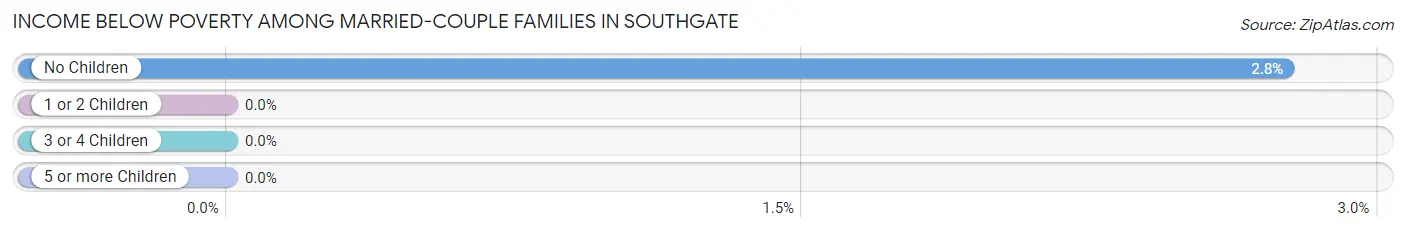
Income Below Poverty Among Married-Couple Families in Southgate
The poverty statistics for married-couple families in Southgate show that 1.9% or 25 of the total 1,299 families live below the poverty line. Families with no children have the highest poverty rate of 2.8%, comprising of 25 families. On the other hand, families with 1 or 2 children have the lowest poverty rate of 0.0%, which includes 0 families.
| Children | Above Poverty | Below Poverty |
| No Children | 882 (97.2%) | 25 (2.8%) |
| 1 or 2 Children | 319 (100.0%) | 0 (0.0%) |
| 3 or 4 Children | 73 (100.0%) | 0 (0.0%) |
| 5 or more Children | 0 (0.0%) | 0 (0.0%) |
| Total | 1,274 (98.1%) | 25 (1.9%) |
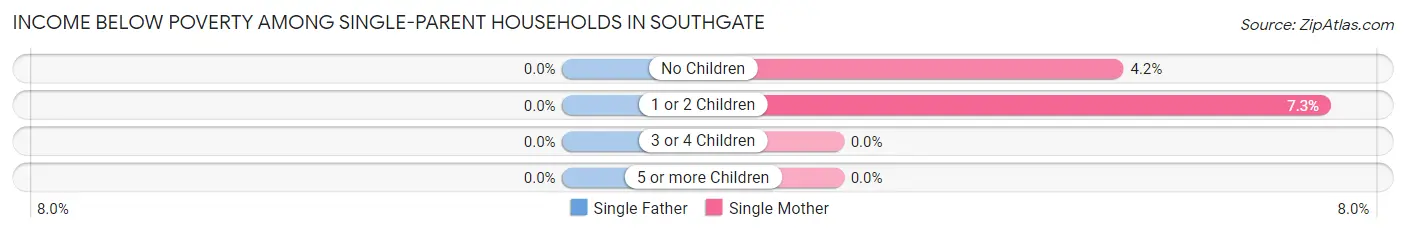
Income Below Poverty Among Single-Parent Households in Southgate
| Children | Single Father | Single Mother |
| No Children | 0 (0.0%) | 9 (4.2%) |
| 1 or 2 Children | 0 (0.0%) | 13 (7.3%) |
| 3 or 4 Children | 0 (0.0%) | 0 (0.0%) |
| 5 or more Children | 0 (0.0%) | 0 (0.0%) |
| Total | 0 (0.0%) | 22 (5.6%) |
Income Below Poverty Among Married-Couple vs Single-Parent Households in Southgate
The poverty data for Southgate shows that 25 of the married-couple family households (1.9%) and 22 of the single-parent households (4.2%) are living below the poverty level. Within the married-couple family households, those with no children have the highest poverty rate, with 25 households (2.8%) falling below the poverty line. Among the single-parent households, those with 1 or 2 children have the highest poverty rate, with 13 household (5.7%) living below poverty.
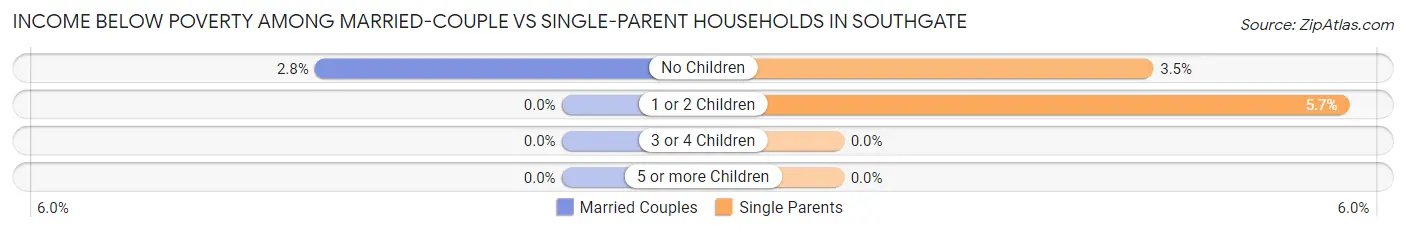
| Children | Married-Couple Families | Single-Parent Households |
| No Children | 25 (2.8%) | 9 (3.5%) |
| 1 or 2 Children | 0 (0.0%) | 13 (5.7%) |
| 3 or 4 Children | 0 (0.0%) | 0 (0.0%) |
| 5 or more Children | 0 (0.0%) | 0 (0.0%) |
| Total | 25 (1.9%) | 22 (4.2%) |
Employment Characteristics in Southgate
Employment by Class of Employer in Southgate
Among the 2,974 employed individuals in Southgate, private company employees (1,950 | 65.6%), self-employed (incorporated) (358 | 12.0%), and not-for-profit organizations (230 | 7.7%) make up the most common classes of employment.
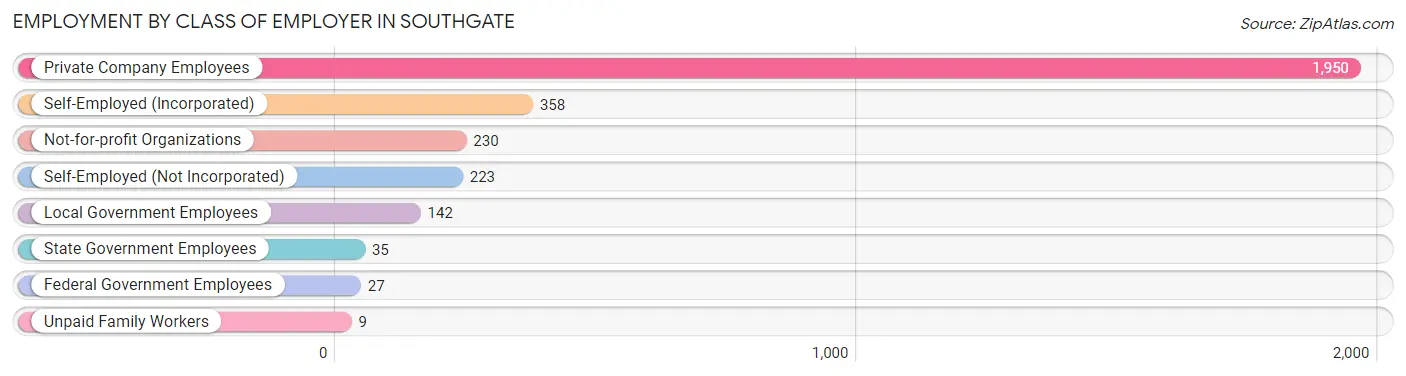
| Employer Class | # Employees | % Employees |
| Private Company Employees | 1,950 | 65.6% |
| Self-Employed (Incorporated) | 358 | 12.0% |
| Self-Employed (Not Incorporated) | 223 | 7.5% |
| Not-for-profit Organizations | 230 | 7.7% |
| Local Government Employees | 142 | 4.8% |
| State Government Employees | 35 | 1.2% |
| Federal Government Employees | 27 | 0.9% |
| Unpaid Family Workers | 9 | 0.3% |
| Total | 2,974 | 100.0% |
Employment Status by Age in Southgate
According to the labor force statistics for Southgate, out of the total population over 16 years of age (5,304), 60.4% or 3,204 individuals are in the labor force, with 6.4% or 205 of them unemployed. The age group with the highest labor force participation rate is 25 to 29 years, with 100.0% or 341 individuals in the labor force. Within the labor force, the 16 to 19 years age range has the highest percentage of unemployed individuals, with 34.3% or 36 of them being unemployed.
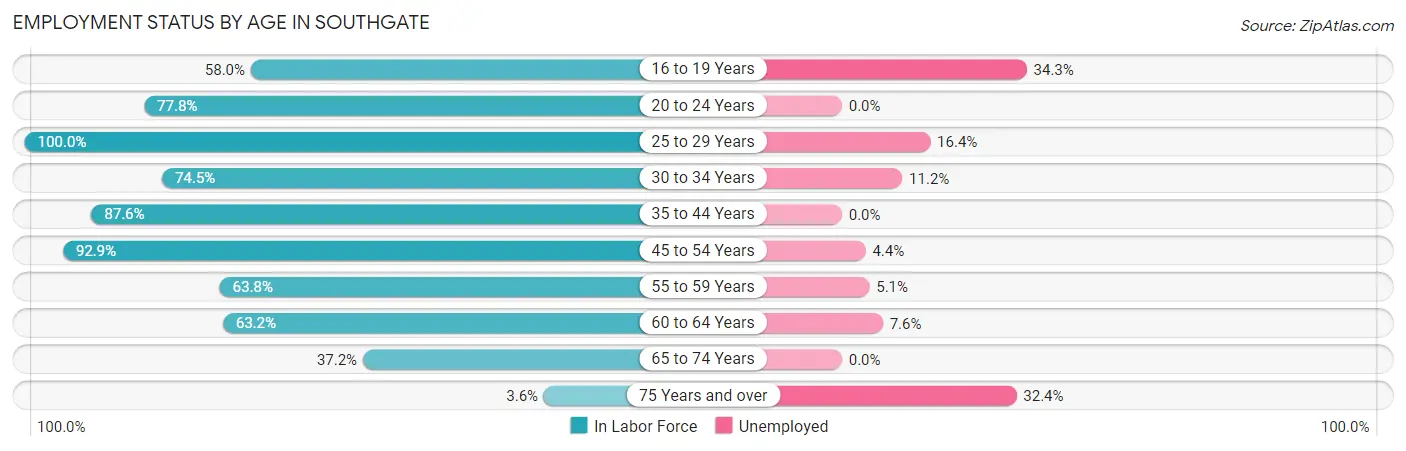
| Age Bracket | In Labor Force | Unemployed |
| 16 to 19 Years | 105 (58.0%) | 36 (34.3%) |
| 20 to 24 Years | 203 (77.8%) | 0 (0.0%) |
| 25 to 29 Years | 341 (100.0%) | 56 (16.4%) |
| 30 to 34 Years | 251 (74.5%) | 28 (11.2%) |
| 35 to 44 Years | 662 (87.6%) | 0 (0.0%) |
| 45 to 54 Years | 643 (92.9%) | 28 (4.4%) |
| 55 to 59 Years | 374 (63.8%) | 19 (5.1%) |
| 60 to 64 Years | 344 (63.2%) | 26 (7.6%) |
| 65 to 74 Years | 248 (37.2%) | 0 (0.0%) |
| 75 Years and over | 34 (3.6%) | 11 (32.4%) |
| Total | 3,204 (60.4%) | 205 (6.4%) |
Employment Status by Educational Attainment in Southgate
According to labor force statistics for Southgate, 80.3% of individuals (2,615) out of the total population between 25 and 64 years of age (3,256) are in the labor force, with 6.1% or 160 of them being unemployed. The group with the highest labor force participation rate are those with the educational attainment of college / associate degree, with 85.2% or 1,005 individuals in the labor force. Within the labor force, individuals with college / associate degree education have the highest percentage of unemployment, with 11.4% or 115 of them being unemployed.
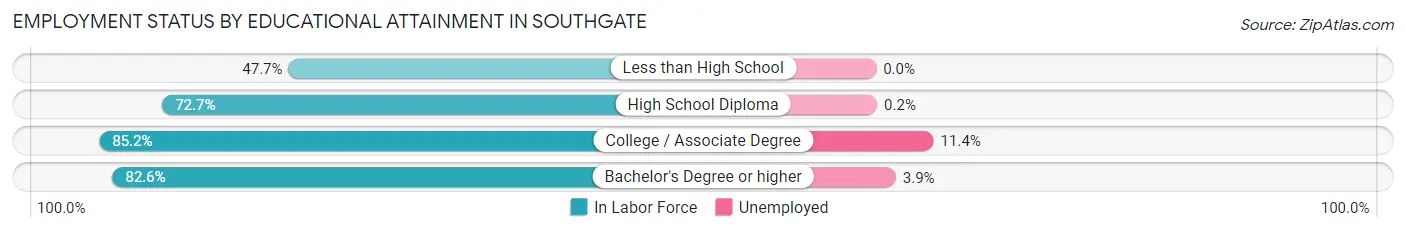
| Educational Attainment | In Labor Force | Unemployed |
| Less than High School | 51 (47.7%) | 0 (0.0%) |
| High School Diploma | 495 (72.7%) | 1 (0.2%) |
| College / Associate Degree | 1,005 (85.2%) | 134 (11.4%) |
| Bachelor's Degree or higher | 1,065 (82.6%) | 50 (3.9%) |
| Total | 2,615 (80.3%) | 199 (6.1%) |
Employment Occupations by Sex in Southgate
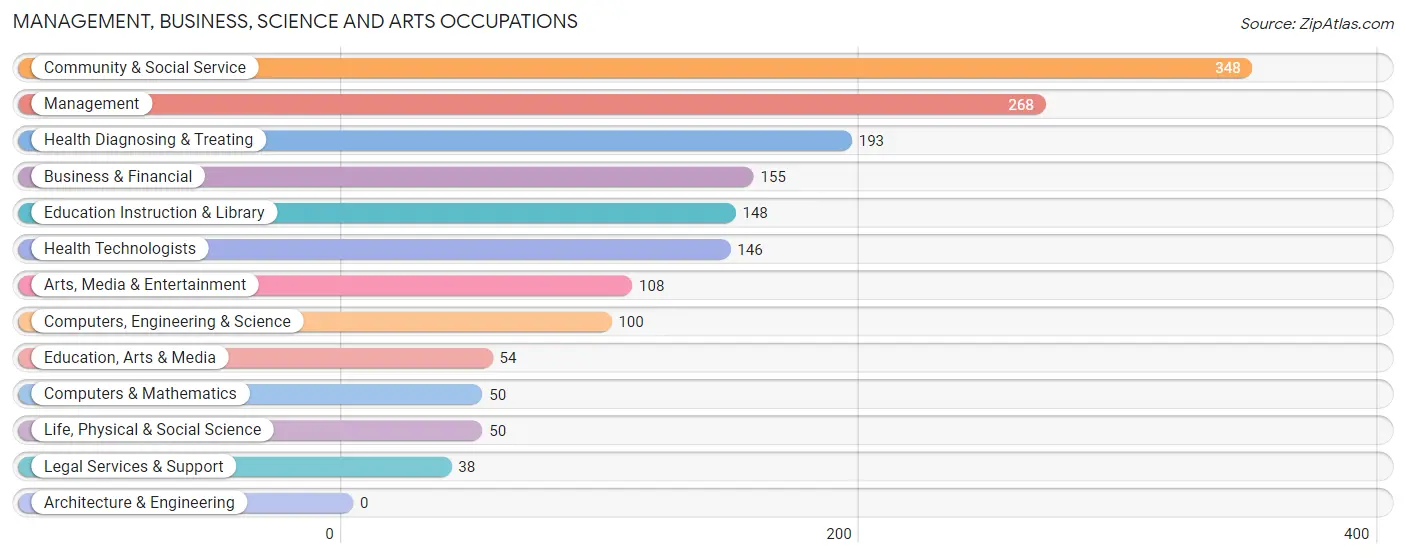
Management, Business, Science and Arts Occupations
The most common Management, Business, Science and Arts occupations in Southgate are Community & Social Service (348 | 11.7%), Management (268 | 9.0%), Health Diagnosing & Treating (193 | 6.5%), Business & Financial (155 | 5.2%), and Education Instruction & Library (148 | 5.0%).
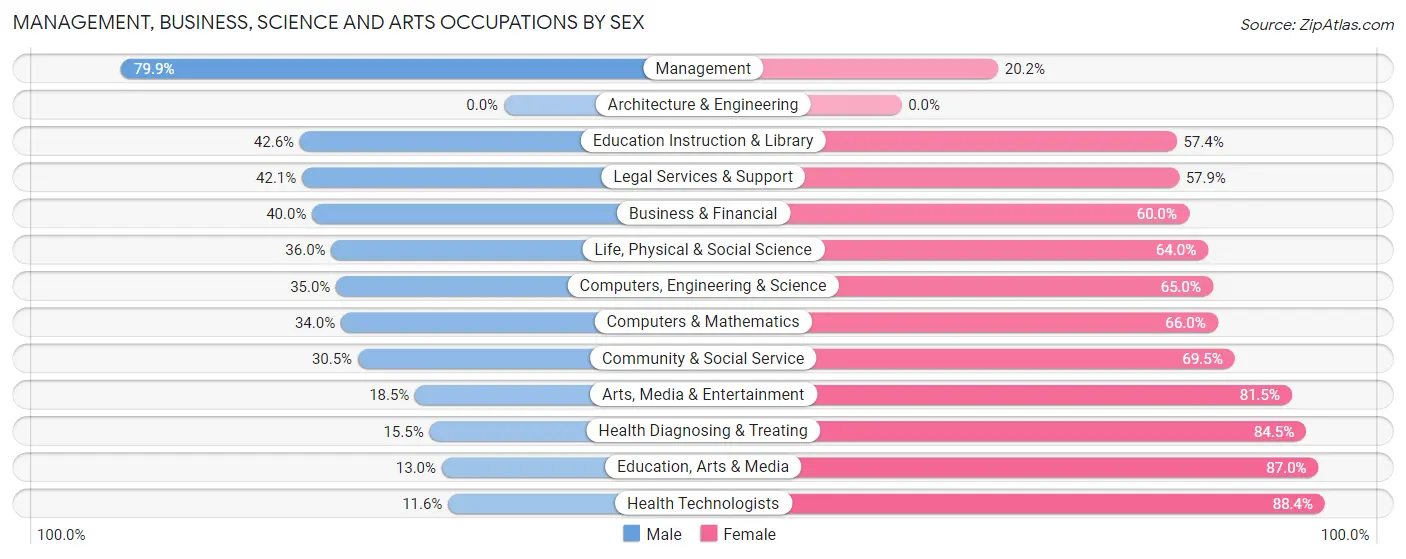
Management, Business, Science and Arts Occupations by Sex
Within the Management, Business, Science and Arts occupations in Southgate, the most male-oriented occupations are Management (79.8%), Education Instruction & Library (42.6%), and Legal Services & Support (42.1%), while the most female-oriented occupations are Health Technologists (88.4%), Education, Arts & Media (87.0%), and Health Diagnosing & Treating (84.5%).
| Occupation | Male | Female |
| Management | 214 (79.8%) | 54 (20.2%) |
| Business & Financial | 62 (40.0%) | 93 (60.0%) |
| Computers, Engineering & Science | 35 (35.0%) | 65 (65.0%) |
| Computers & Mathematics | 17 (34.0%) | 33 (66.0%) |
| Architecture & Engineering | 0 (0.0%) | 0 (0.0%) |
| Life, Physical & Social Science | 18 (36.0%) | 32 (64.0%) |
| Community & Social Service | 106 (30.5%) | 242 (69.5%) |
| Education, Arts & Media | 7 (13.0%) | 47 (87.0%) |
| Legal Services & Support | 16 (42.1%) | 22 (57.9%) |
| Education Instruction & Library | 63 (42.6%) | 85 (57.4%) |
| Arts, Media & Entertainment | 20 (18.5%) | 88 (81.5%) |
| Health Diagnosing & Treating | 30 (15.5%) | 163 (84.5%) |
| Health Technologists | 17 (11.6%) | 129 (88.4%) |
| Total (Category) | 447 (42.0%) | 617 (58.0%) |
| Total (Overall) | 1,467 (49.3%) | 1,508 (50.7%) |
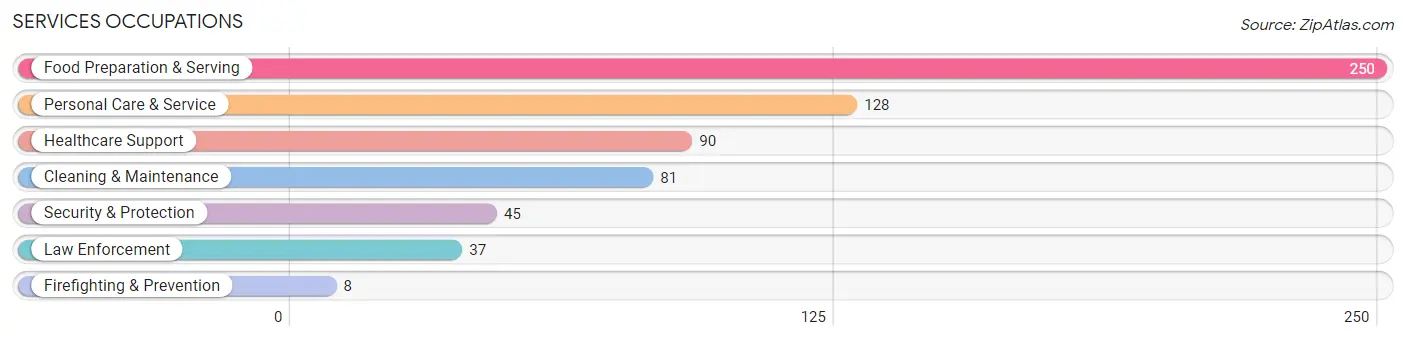
Services Occupations
The most common Services occupations in Southgate are Food Preparation & Serving (250 | 8.4%), Personal Care & Service (128 | 4.3%), Healthcare Support (90 | 3.0%), Cleaning & Maintenance (81 | 2.7%), and Security & Protection (45 | 1.5%).
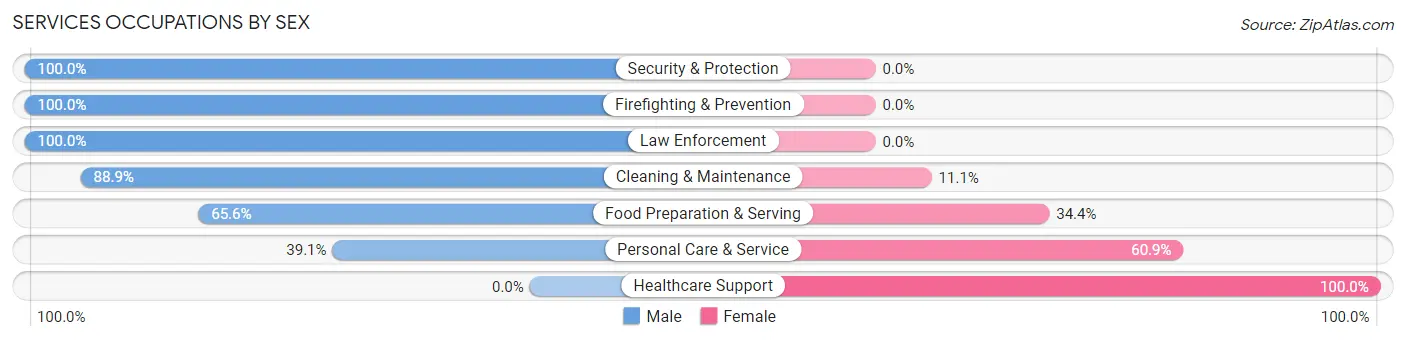
Services Occupations by Sex
Within the Services occupations in Southgate, the most male-oriented occupations are Security & Protection (100.0%), Firefighting & Prevention (100.0%), and Law Enforcement (100.0%), while the most female-oriented occupations are Healthcare Support (100.0%), Personal Care & Service (60.9%), and Food Preparation & Serving (34.4%).
| Occupation | Male | Female |
| Healthcare Support | 0 (0.0%) | 90 (100.0%) |
| Security & Protection | 45 (100.0%) | 0 (0.0%) |
| Firefighting & Prevention | 8 (100.0%) | 0 (0.0%) |
| Law Enforcement | 37 (100.0%) | 0 (0.0%) |
| Food Preparation & Serving | 164 (65.6%) | 86 (34.4%) |
| Cleaning & Maintenance | 72 (88.9%) | 9 (11.1%) |
| Personal Care & Service | 50 (39.1%) | 78 (60.9%) |
| Total (Category) | 331 (55.7%) | 263 (44.3%) |
| Total (Overall) | 1,467 (49.3%) | 1,508 (50.7%) |
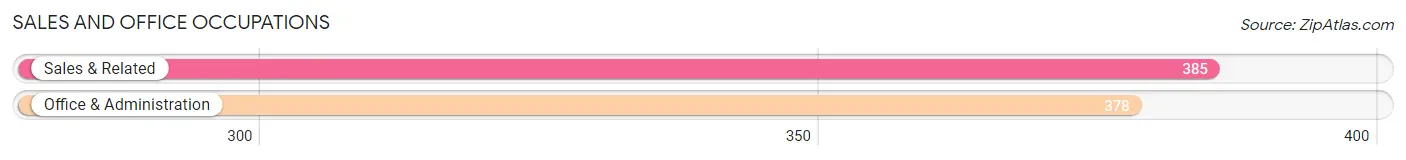
Sales and Office Occupations
The most common Sales and Office occupations in Southgate are Sales & Related (385 | 12.9%), and Office & Administration (378 | 12.7%).
Sales and Office Occupations by Sex
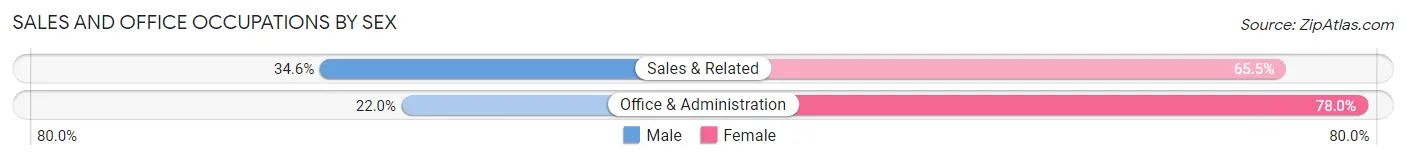
| Occupation | Male | Female |
| Sales & Related | 133 (34.5%) | 252 (65.4%) |
| Office & Administration | 83 (22.0%) | 295 (78.0%) |
| Total (Category) | 216 (28.3%) | 547 (71.7%) |
| Total (Overall) | 1,467 (49.3%) | 1,508 (50.7%) |
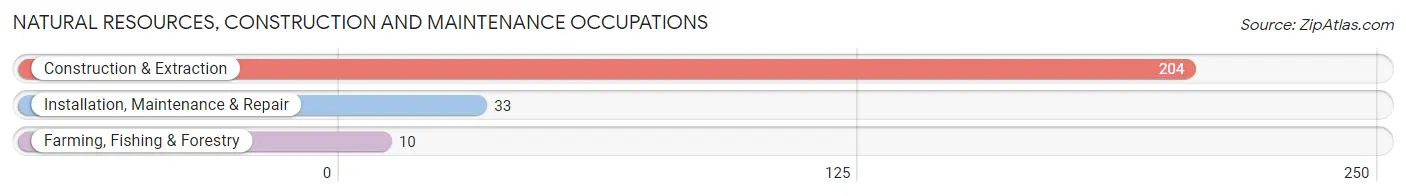
Natural Resources, Construction and Maintenance Occupations
The most common Natural Resources, Construction and Maintenance occupations in Southgate are Construction & Extraction (204 | 6.9%), Installation, Maintenance & Repair (33 | 1.1%), and Farming, Fishing & Forestry (10 | 0.3%).
Natural Resources, Construction and Maintenance Occupations by Sex
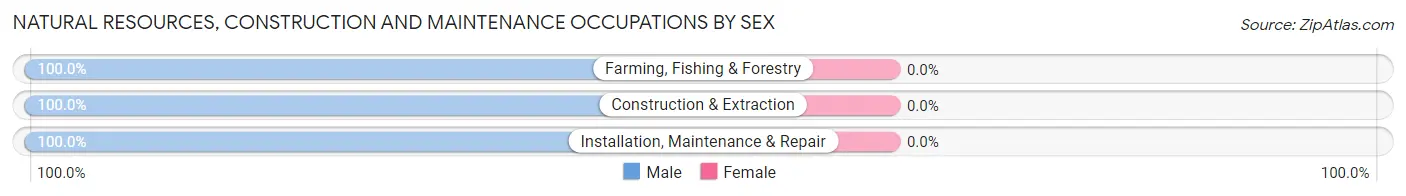
| Occupation | Male | Female |
| Farming, Fishing & Forestry | 10 (100.0%) | 0 (0.0%) |
| Construction & Extraction | 204 (100.0%) | 0 (0.0%) |
| Installation, Maintenance & Repair | 33 (100.0%) | 0 (0.0%) |
| Total (Category) | 247 (100.0%) | 0 (0.0%) |
| Total (Overall) | 1,467 (49.3%) | 1,508 (50.7%) |
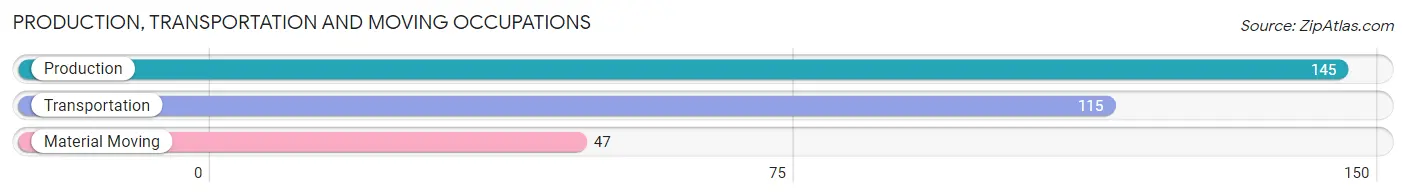
Production, Transportation and Moving Occupations
The most common Production, Transportation and Moving occupations in Southgate are Production (145 | 4.9%), Transportation (115 | 3.9%), and Material Moving (47 | 1.6%).
Production, Transportation and Moving Occupations by Sex
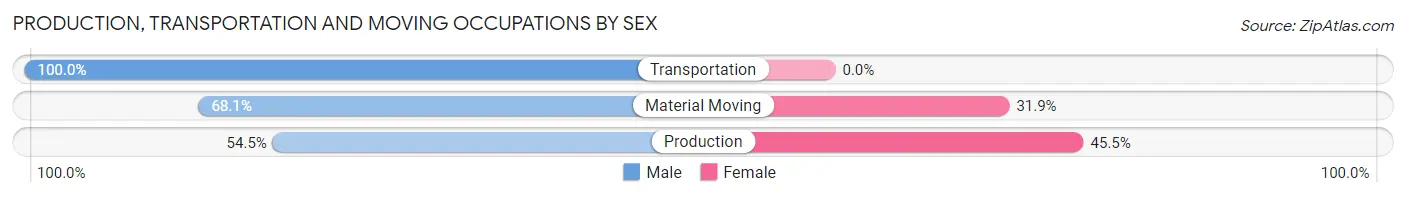
| Occupation | Male | Female |
| Production | 79 (54.5%) | 66 (45.5%) |
| Transportation | 115 (100.0%) | 0 (0.0%) |
| Material Moving | 32 (68.1%) | 15 (31.9%) |
| Total (Category) | 226 (73.6%) | 81 (26.4%) |
| Total (Overall) | 1,467 (49.3%) | 1,508 (50.7%) |
Employment Industries by Sex in Southgate
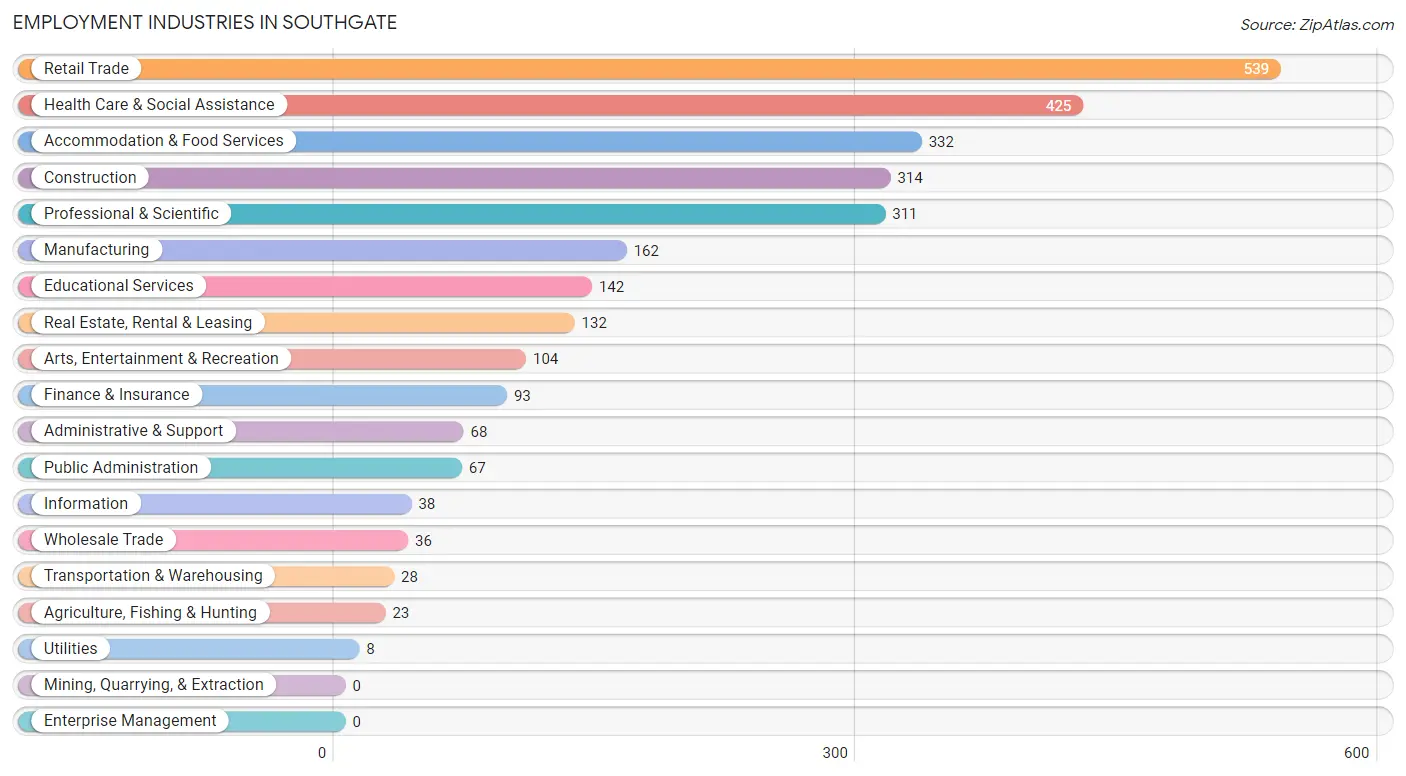
Employment Industries in Southgate
The major employment industries in Southgate include Retail Trade (539 | 18.1%), Health Care & Social Assistance (425 | 14.3%), Accommodation & Food Services (332 | 11.2%), Construction (314 | 10.5%), and Professional & Scientific (311 | 10.4%).
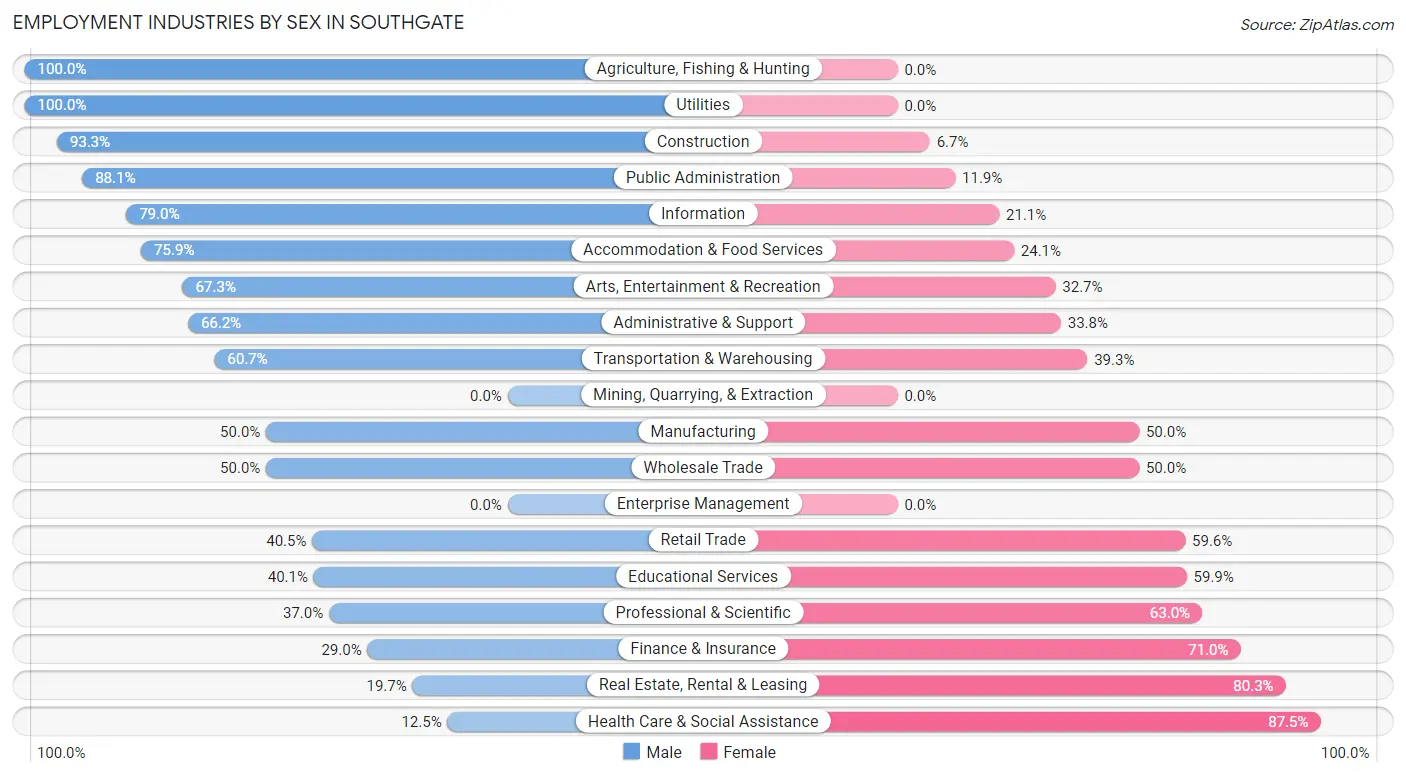
Employment Industries by Sex in Southgate
The Southgate industries that see more men than women are Agriculture, Fishing & Hunting (100.0%), Utilities (100.0%), and Construction (93.3%), whereas the industries that tend to have a higher number of women are Health Care & Social Assistance (87.5%), Real Estate, Rental & Leasing (80.3%), and Finance & Insurance (71.0%).
| Industry | Male | Female |
| Agriculture, Fishing & Hunting | 23 (100.0%) | 0 (0.0%) |
| Mining, Quarrying, & Extraction | 0 (0.0%) | 0 (0.0%) |
| Construction | 293 (93.3%) | 21 (6.7%) |
| Manufacturing | 81 (50.0%) | 81 (50.0%) |
| Wholesale Trade | 18 (50.0%) | 18 (50.0%) |
| Retail Trade | 218 (40.5%) | 321 (59.6%) |
| Transportation & Warehousing | 17 (60.7%) | 11 (39.3%) |
| Utilities | 8 (100.0%) | 0 (0.0%) |
| Information | 30 (78.9%) | 8 (21.0%) |
| Finance & Insurance | 27 (29.0%) | 66 (71.0%) |
| Real Estate, Rental & Leasing | 26 (19.7%) | 106 (80.3%) |
| Professional & Scientific | 115 (37.0%) | 196 (63.0%) |
| Enterprise Management | 0 (0.0%) | 0 (0.0%) |
| Administrative & Support | 45 (66.2%) | 23 (33.8%) |
| Educational Services | 57 (40.1%) | 85 (59.9%) |
| Health Care & Social Assistance | 53 (12.5%) | 372 (87.5%) |
| Arts, Entertainment & Recreation | 70 (67.3%) | 34 (32.7%) |
| Accommodation & Food Services | 252 (75.9%) | 80 (24.1%) |
| Public Administration | 59 (88.1%) | 8 (11.9%) |
| Total | 1,467 (49.3%) | 1,508 (50.7%) |
Education in Southgate
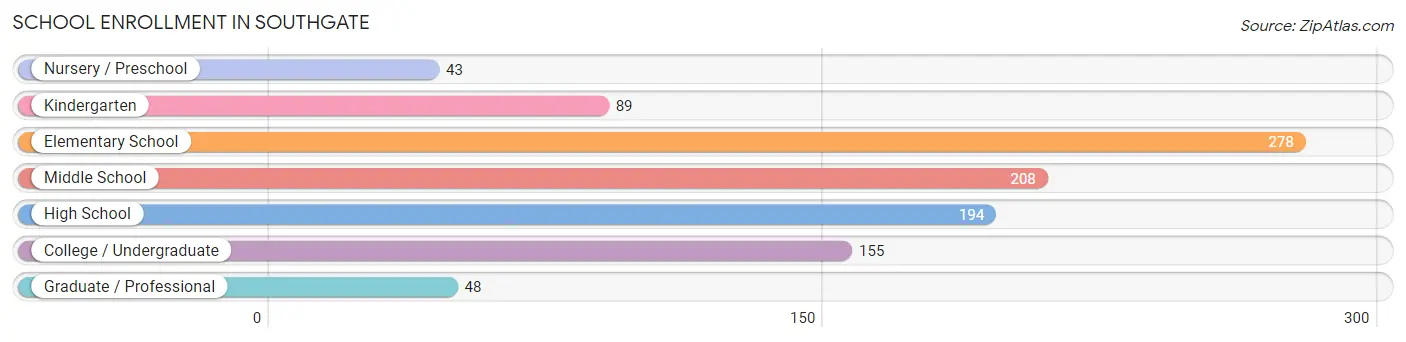
School Enrollment in Southgate
The most common levels of schooling among the 1,015 students in Southgate are elementary school (278 | 27.4%), middle school (208 | 20.5%), and high school (194 | 19.1%).
| School Level | # Students | % Students |
| Nursery / Preschool | 43 | 4.2% |
| Kindergarten | 89 | 8.8% |
| Elementary School | 278 | 27.4% |
| Middle School | 208 | 20.5% |
| High School | 194 | 19.1% |
| College / Undergraduate | 155 | 15.3% |
| Graduate / Professional | 48 | 4.7% |
| Total | 1,015 | 100.0% |
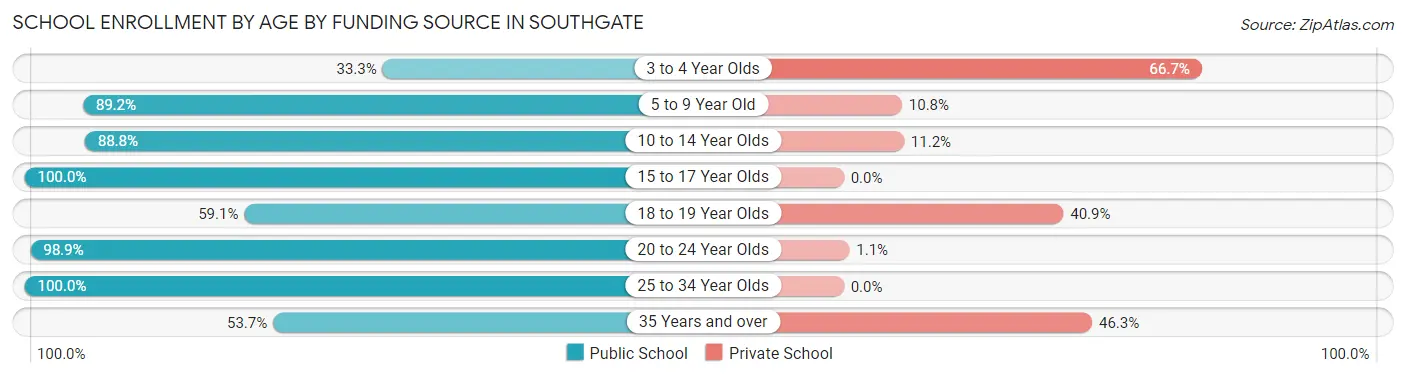
School Enrollment by Age by Funding Source in Southgate
Out of a total of 1,015 students who are enrolled in schools in Southgate, 119 (11.7%) attend a private institution, while the remaining 896 (88.3%) are enrolled in public schools. The age group of 3 to 4 year olds has the highest likelihood of being enrolled in private schools, with 8 (66.7% in the age bracket) enrolled. Conversely, the age group of 15 to 17 year olds has the lowest likelihood of being enrolled in a private school, with 149 (100.0% in the age bracket) attending a public institution.
| Age Bracket | Public School | Private School |
| 3 to 4 Year Olds | 4 (33.3%) | 8 (66.7%) |
| 5 to 9 Year Old | 296 (89.2%) | 36 (10.8%) |
| 10 to 14 Year Olds | 269 (88.8%) | 34 (11.2%) |
| 15 to 17 Year Olds | 149 (100.0%) | 0 (0.0%) |
| 18 to 19 Year Olds | 13 (59.1%) | 9 (40.9%) |
| 20 to 24 Year Olds | 93 (98.9%) | 1 (1.1%) |
| 25 to 34 Year Olds | 36 (100.0%) | 0 (0.0%) |
| 35 Years and over | 36 (53.7%) | 31 (46.3%) |
| Total | 896 (88.3%) | 119 (11.7%) |
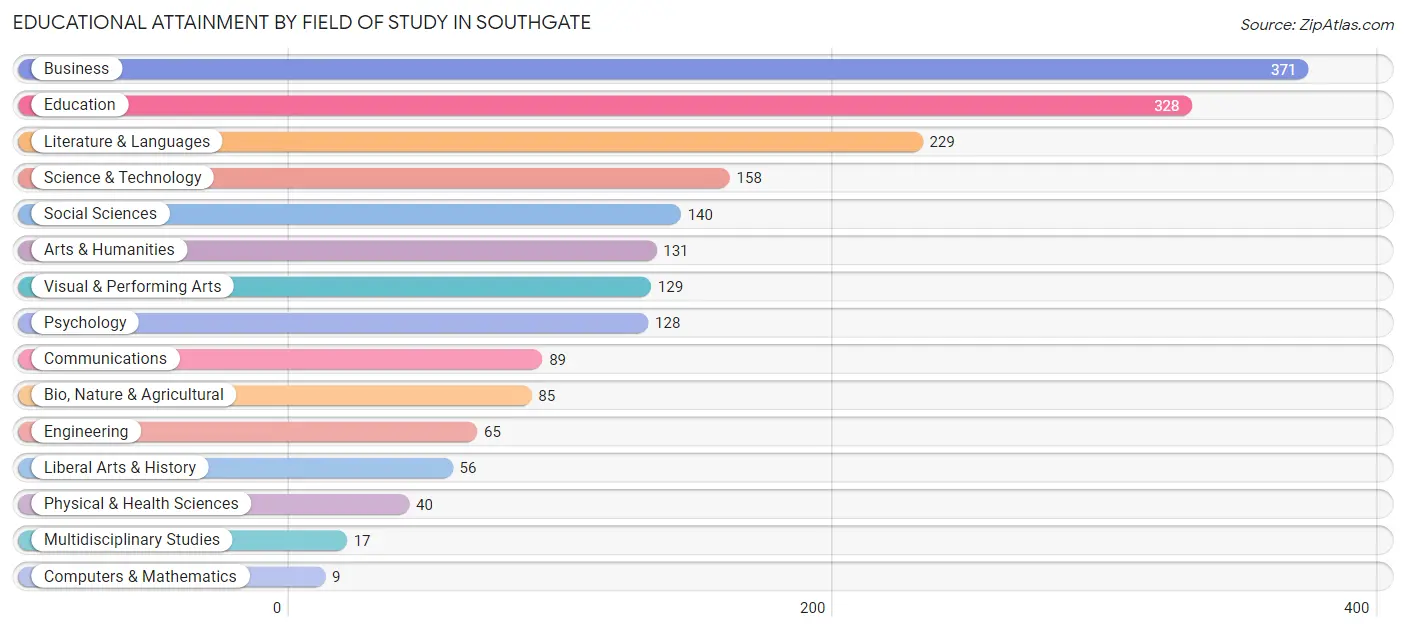
Educational Attainment by Field of Study in Southgate
Business (371 | 18.8%), education (328 | 16.6%), literature & languages (229 | 11.6%), science & technology (158 | 8.0%), and social sciences (140 | 7.1%) are the most common fields of study among 1,975 individuals in Southgate who have obtained a bachelor's degree or higher.
| Field of Study | # Graduates | % Graduates |
| Computers & Mathematics | 9 | 0.5% |
| Bio, Nature & Agricultural | 85 | 4.3% |
| Physical & Health Sciences | 40 | 2.0% |
| Psychology | 128 | 6.5% |
| Social Sciences | 140 | 7.1% |
| Engineering | 65 | 3.3% |
| Multidisciplinary Studies | 17 | 0.9% |
| Science & Technology | 158 | 8.0% |
| Business | 371 | 18.8% |
| Education | 328 | 16.6% |
| Literature & Languages | 229 | 11.6% |
| Liberal Arts & History | 56 | 2.8% |
| Visual & Performing Arts | 129 | 6.5% |
| Communications | 89 | 4.5% |
| Arts & Humanities | 131 | 6.6% |
| Total | 1,975 | 100.0% |
Transportation & Commute in Southgate
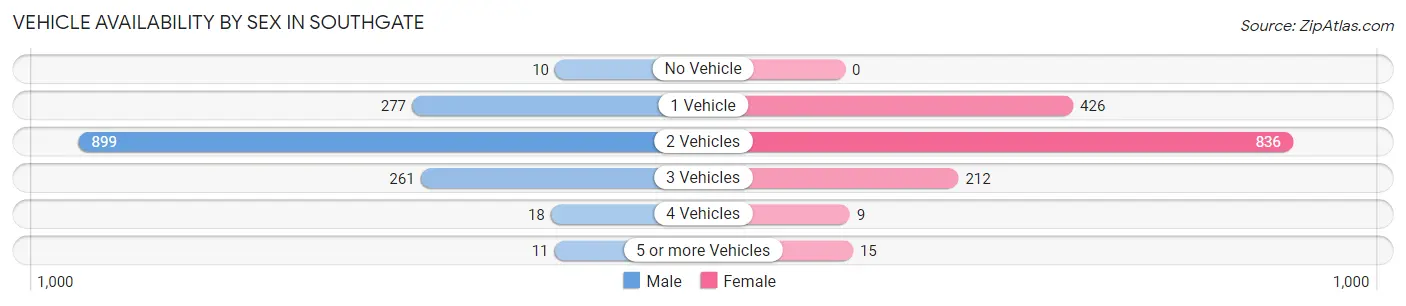
Vehicle Availability by Sex in Southgate
The most prevalent vehicle ownership categories in Southgate are males with 2 vehicles (899, accounting for 60.9%) and females with 2 vehicles (836, making up 60.0%).
| Vehicles Available | Male | Female |
| No Vehicle | 10 (0.7%) | 0 (0.0%) |
| 1 Vehicle | 277 (18.8%) | 426 (28.4%) |
| 2 Vehicles | 899 (60.9%) | 836 (55.8%) |
| 3 Vehicles | 261 (17.7%) | 212 (14.1%) |
| 4 Vehicles | 18 (1.2%) | 9 (0.6%) |
| 5 or more Vehicles | 11 (0.7%) | 15 (1.0%) |
| Total | 1,476 (100.0%) | 1,498 (100.0%) |
Commute Time in Southgate
The most frequently occuring commute durations in Southgate are 20 to 24 minutes (558 commuters, 20.7%), 15 to 19 minutes (439 commuters, 16.3%), and 10 to 14 minutes (419 commuters, 15.6%).
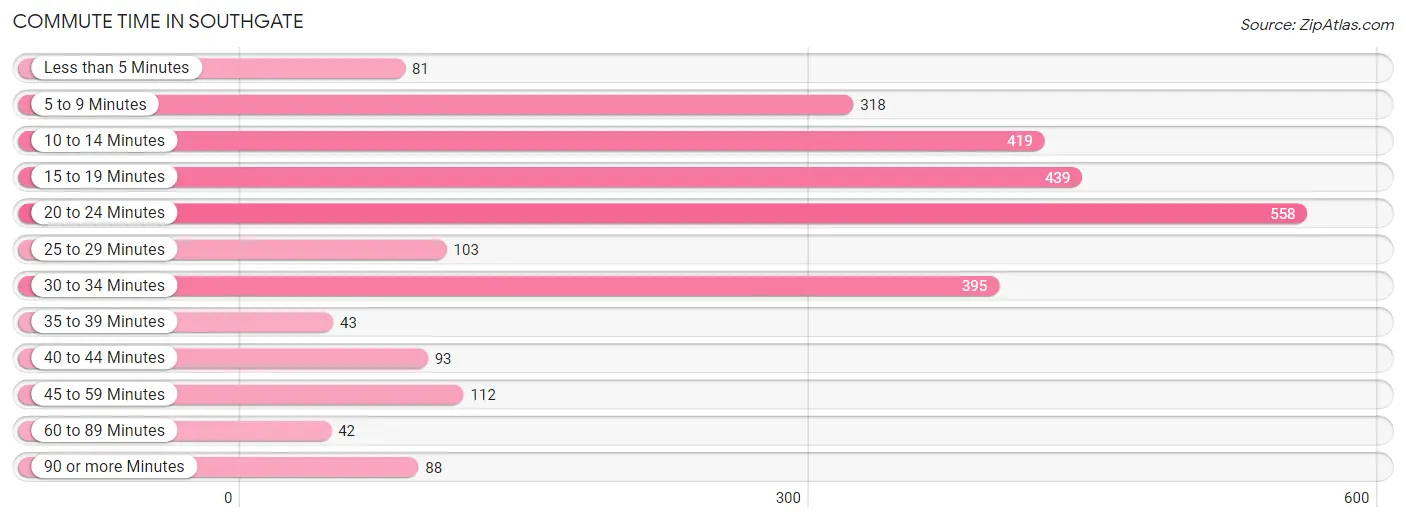
| Commute Time | # Commuters | % Commuters |
| Less than 5 Minutes | 81 | 3.0% |
| 5 to 9 Minutes | 318 | 11.8% |
| 10 to 14 Minutes | 419 | 15.6% |
| 15 to 19 Minutes | 439 | 16.3% |
| 20 to 24 Minutes | 558 | 20.7% |
| 25 to 29 Minutes | 103 | 3.8% |
| 30 to 34 Minutes | 395 | 14.7% |
| 35 to 39 Minutes | 43 | 1.6% |
| 40 to 44 Minutes | 93 | 3.5% |
| 45 to 59 Minutes | 112 | 4.2% |
| 60 to 89 Minutes | 42 | 1.6% |
| 90 or more Minutes | 88 | 3.3% |
Commute Time by Sex in Southgate
The most common commute times in Southgate are 20 to 24 minutes (266 commuters, 19.9%) for males and 20 to 24 minutes (292 commuters, 21.6%) for females.
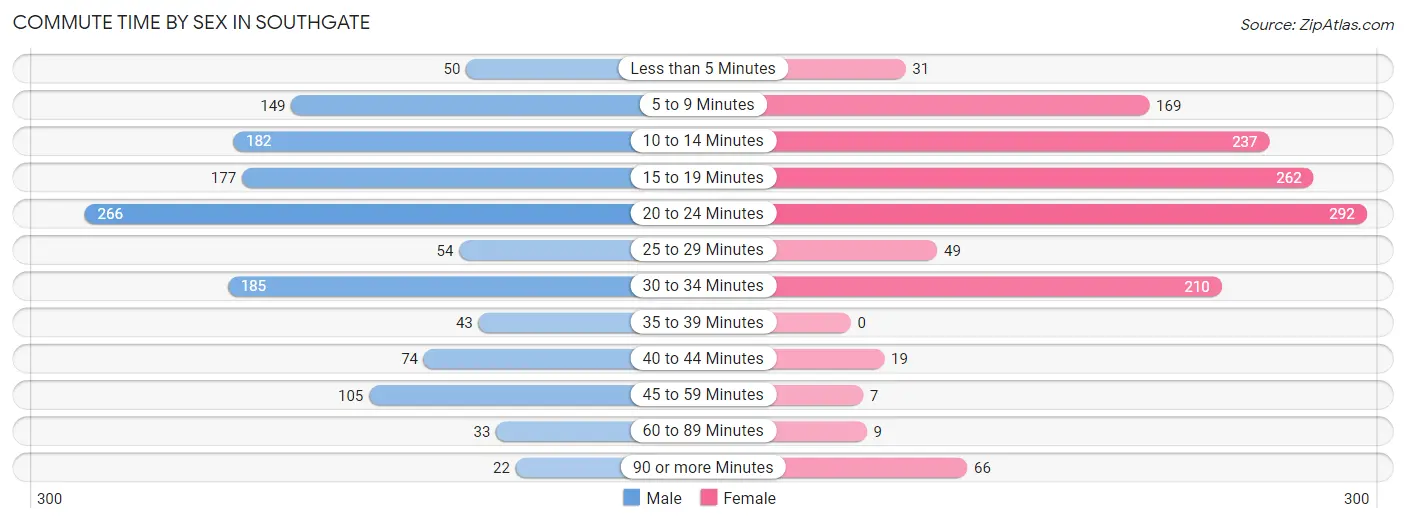
| Commute Time | Male | Female |
| Less than 5 Minutes | 50 (3.7%) | 31 (2.3%) |
| 5 to 9 Minutes | 149 (11.1%) | 169 (12.5%) |
| 10 to 14 Minutes | 182 (13.6%) | 237 (17.5%) |
| 15 to 19 Minutes | 177 (13.2%) | 262 (19.4%) |
| 20 to 24 Minutes | 266 (19.9%) | 292 (21.6%) |
| 25 to 29 Minutes | 54 (4.0%) | 49 (3.6%) |
| 30 to 34 Minutes | 185 (13.8%) | 210 (15.5%) |
| 35 to 39 Minutes | 43 (3.2%) | 0 (0.0%) |
| 40 to 44 Minutes | 74 (5.5%) | 19 (1.4%) |
| 45 to 59 Minutes | 105 (7.8%) | 7 (0.5%) |
| 60 to 89 Minutes | 33 (2.5%) | 9 (0.7%) |
| 90 or more Minutes | 22 (1.6%) | 66 (4.9%) |
Time of Departure to Work by Sex in Southgate
The most frequent times of departure to work in Southgate are 8:00 AM to 8:29 AM (236, 17.6%) for males and 8:00 AM to 8:29 AM (220, 16.3%) for females.
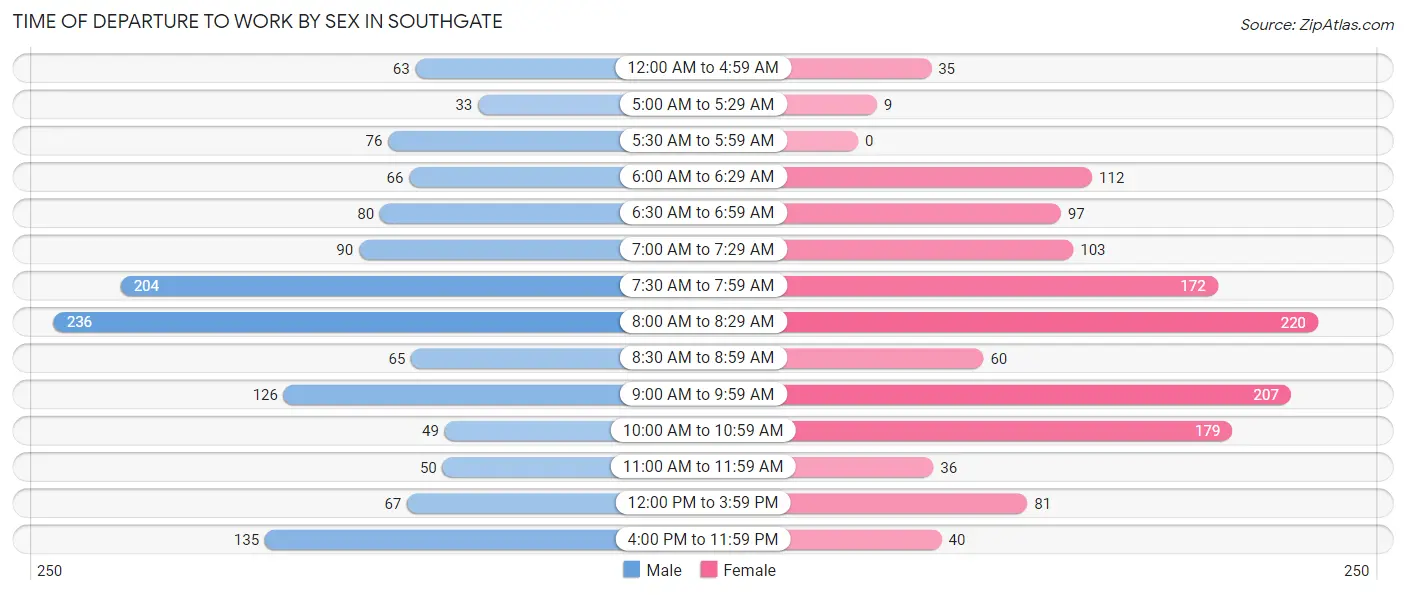
| Time of Departure | Male | Female |
| 12:00 AM to 4:59 AM | 63 (4.7%) | 35 (2.6%) |
| 5:00 AM to 5:29 AM | 33 (2.5%) | 9 (0.7%) |
| 5:30 AM to 5:59 AM | 76 (5.7%) | 0 (0.0%) |
| 6:00 AM to 6:29 AM | 66 (4.9%) | 112 (8.3%) |
| 6:30 AM to 6:59 AM | 80 (6.0%) | 97 (7.2%) |
| 7:00 AM to 7:29 AM | 90 (6.7%) | 103 (7.6%) |
| 7:30 AM to 7:59 AM | 204 (15.2%) | 172 (12.7%) |
| 8:00 AM to 8:29 AM | 236 (17.6%) | 220 (16.3%) |
| 8:30 AM to 8:59 AM | 65 (4.9%) | 60 (4.4%) |
| 9:00 AM to 9:59 AM | 126 (9.4%) | 207 (15.3%) |
| 10:00 AM to 10:59 AM | 49 (3.7%) | 179 (13.3%) |
| 11:00 AM to 11:59 AM | 50 (3.7%) | 36 (2.7%) |
| 12:00 PM to 3:59 PM | 67 (5.0%) | 81 (6.0%) |
| 4:00 PM to 11:59 PM | 135 (10.1%) | 40 (3.0%) |
| Total | 1,340 (100.0%) | 1,351 (100.0%) |
Housing Occupancy in Southgate
Occupancy by Ownership in Southgate
Of the total 2,842 dwellings in Southgate, owner-occupied units account for 2,015 (70.9%), while renter-occupied units make up 827 (29.1%).
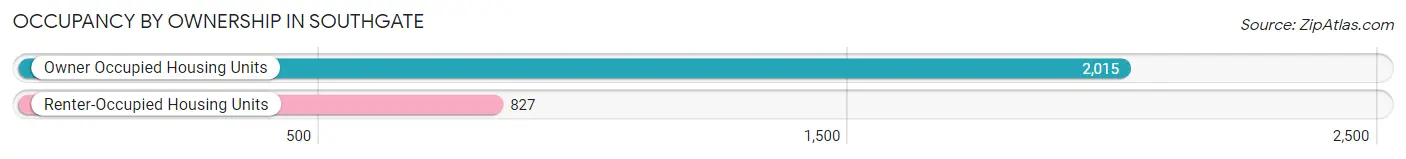
| Occupancy | # Housing Units | % Housing Units |
| Owner Occupied Housing Units | 2,015 | 70.9% |
| Renter-Occupied Housing Units | 827 | 29.1% |
| Total Occupied Housing Units | 2,842 | 100.0% |
Occupancy by Household Size in Southgate
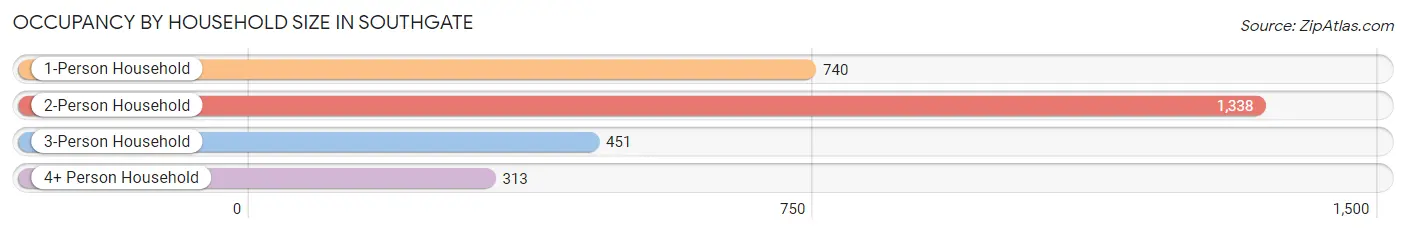
| Household Size | # Housing Units | % Housing Units |
| 1-Person Household | 740 | 26.0% |
| 2-Person Household | 1,338 | 47.1% |
| 3-Person Household | 451 | 15.9% |
| 4+ Person Household | 313 | 11.0% |
| Total Housing Units | 2,842 | 100.0% |
Occupancy by Ownership by Household Size in Southgate
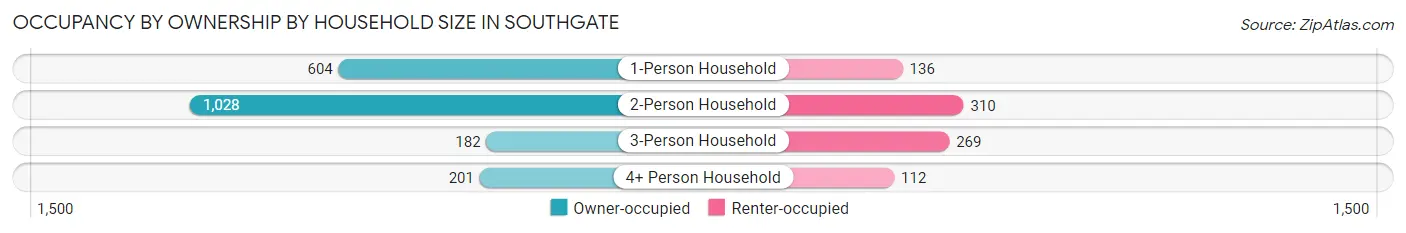
| Household Size | Owner-occupied | Renter-occupied |
| 1-Person Household | 604 (81.6%) | 136 (18.4%) |
| 2-Person Household | 1,028 (76.8%) | 310 (23.2%) |
| 3-Person Household | 182 (40.4%) | 269 (59.7%) |
| 4+ Person Household | 201 (64.2%) | 112 (35.8%) |
| Total Housing Units | 2,015 (70.9%) | 827 (29.1%) |
Occupancy by Educational Attainment in Southgate
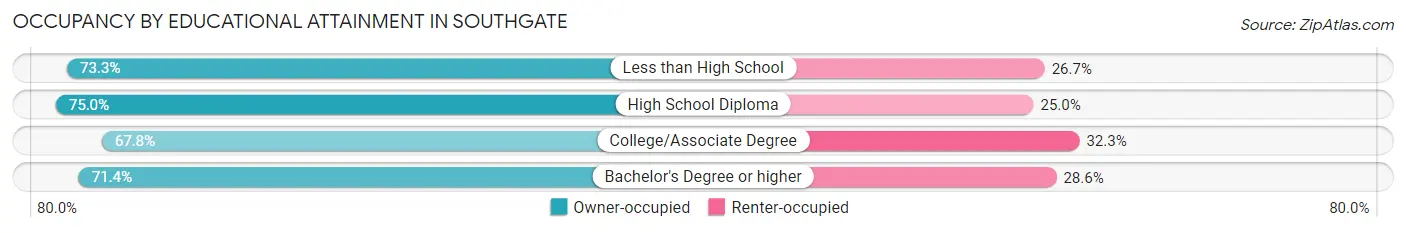
| Household Size | Owner-occupied | Renter-occupied |
| Less than High School | 63 (73.3%) | 23 (26.7%) |
| High School Diploma | 418 (75.0%) | 139 (25.0%) |
| College/Associate Degree | 670 (67.7%) | 319 (32.3%) |
| Bachelor's Degree or higher | 864 (71.4%) | 346 (28.6%) |
Occupancy by Age of Householder in Southgate
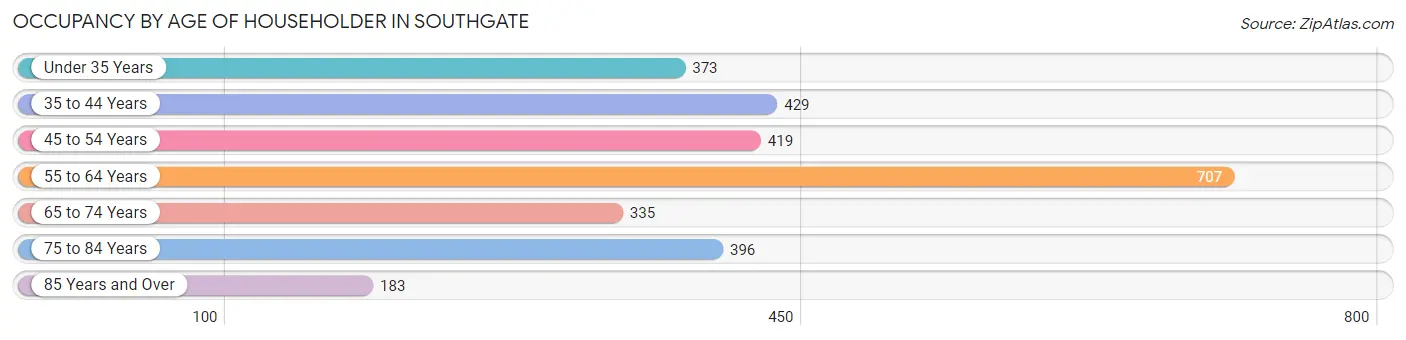
| Age Bracket | # Households | % Households |
| Under 35 Years | 373 | 13.1% |
| 35 to 44 Years | 429 | 15.1% |
| 45 to 54 Years | 419 | 14.7% |
| 55 to 64 Years | 707 | 24.9% |
| 65 to 74 Years | 335 | 11.8% |
| 75 to 84 Years | 396 | 13.9% |
| 85 Years and Over | 183 | 6.4% |
| Total | 2,842 | 100.0% |
Housing Finances in Southgate
Median Income by Occupancy in Southgate
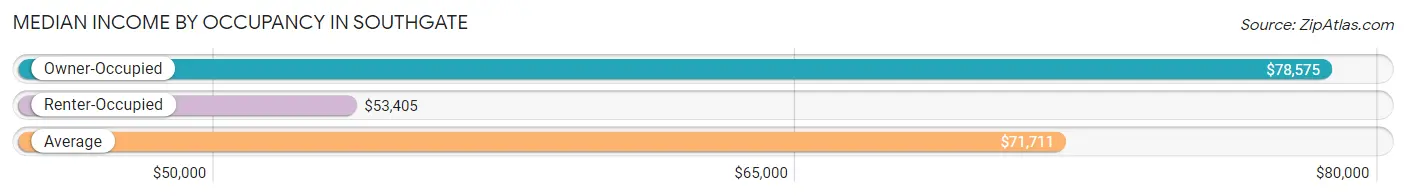
| Occupancy Type | # Households | Median Income |
| Owner-Occupied | 2,015 (70.9%) | $78,575 |
| Renter-Occupied | 827 (29.1%) | $53,405 |
| Average | 2,842 (100.0%) | $71,711 |
Occupancy by Householder Income Bracket in Southgate
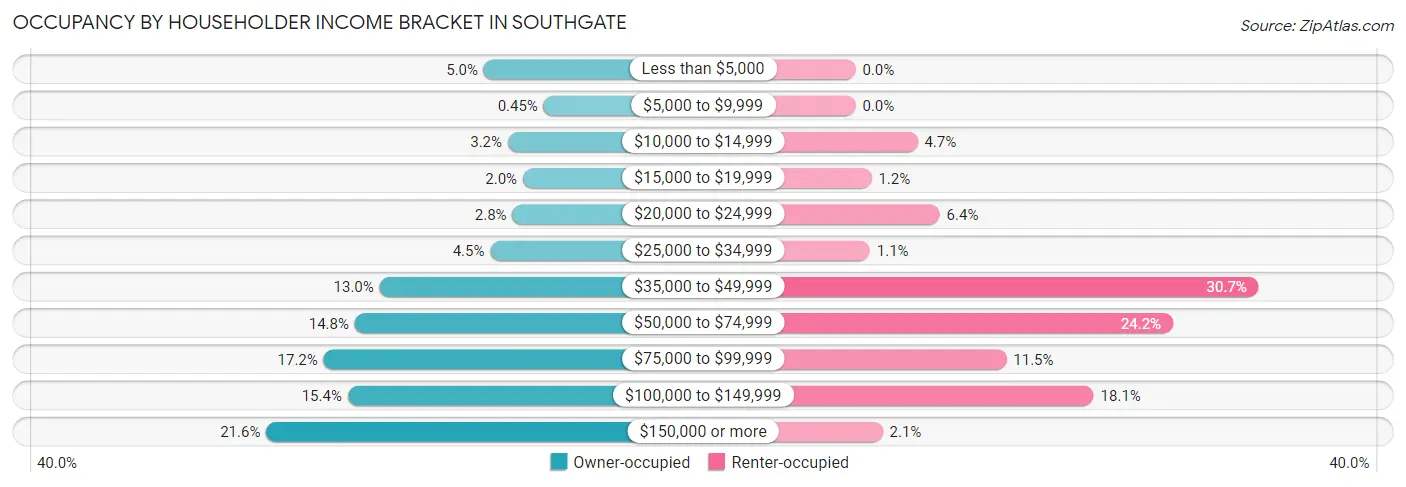
| Income Bracket | Owner-occupied | Renter-occupied |
| Less than $5,000 | 101 (5.0%) | 0 (0.0%) |
| $5,000 to $9,999 | 9 (0.4%) | 0 (0.0%) |
| $10,000 to $14,999 | 64 (3.2%) | 39 (4.7%) |
| $15,000 to $19,999 | 41 (2.0%) | 10 (1.2%) |
| $20,000 to $24,999 | 57 (2.8%) | 53 (6.4%) |
| $25,000 to $34,999 | 91 (4.5%) | 9 (1.1%) |
| $35,000 to $49,999 | 261 (13.0%) | 254 (30.7%) |
| $50,000 to $74,999 | 299 (14.8%) | 200 (24.2%) |
| $75,000 to $99,999 | 347 (17.2%) | 95 (11.5%) |
| $100,000 to $149,999 | 310 (15.4%) | 150 (18.1%) |
| $150,000 or more | 435 (21.6%) | 17 (2.1%) |
| Total | 2,015 (100.0%) | 827 (100.0%) |
Monthly Housing Cost Tiers in Southgate
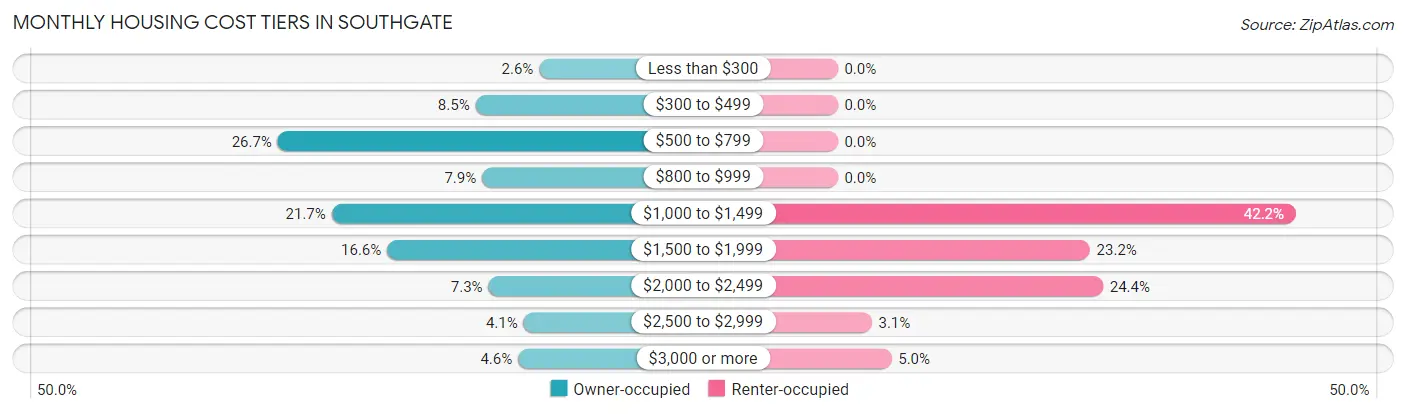
| Monthly Cost | Owner-occupied | Renter-occupied |
| Less than $300 | 53 (2.6%) | 0 (0.0%) |
| $300 to $499 | 171 (8.5%) | 0 (0.0%) |
| $500 to $799 | 538 (26.7%) | 0 (0.0%) |
| $800 to $999 | 159 (7.9%) | 0 (0.0%) |
| $1,000 to $1,499 | 438 (21.7%) | 349 (42.2%) |
| $1,500 to $1,999 | 335 (16.6%) | 192 (23.2%) |
| $2,000 to $2,499 | 147 (7.3%) | 202 (24.4%) |
| $2,500 to $2,999 | 82 (4.1%) | 26 (3.1%) |
| $3,000 or more | 92 (4.6%) | 41 (5.0%) |
| Total | 2,015 (100.0%) | 827 (100.0%) |
Physical Housing Characteristics in Southgate
Housing Structures in Southgate
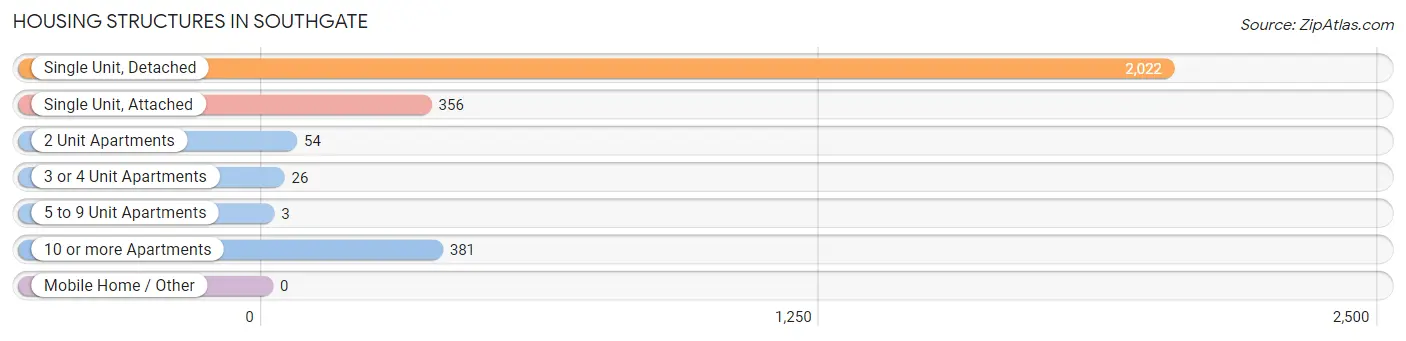
| Structure Type | # Housing Units | % Housing Units |
| Single Unit, Detached | 2,022 | 71.2% |
| Single Unit, Attached | 356 | 12.5% |
| 2 Unit Apartments | 54 | 1.9% |
| 3 or 4 Unit Apartments | 26 | 0.9% |
| 5 to 9 Unit Apartments | 3 | 0.1% |
| 10 or more Apartments | 381 | 13.4% |
| Mobile Home / Other | 0 | 0.0% |
| Total | 2,842 | 100.0% |
Housing Structures by Occupancy in Southgate
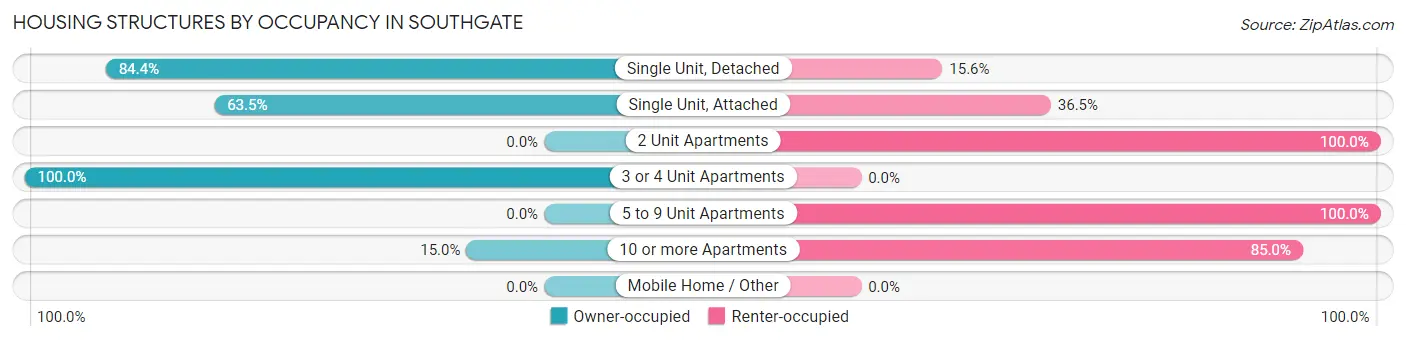
| Structure Type | Owner-occupied | Renter-occupied |
| Single Unit, Detached | 1,706 (84.4%) | 316 (15.6%) |
| Single Unit, Attached | 226 (63.5%) | 130 (36.5%) |
| 2 Unit Apartments | 0 (0.0%) | 54 (100.0%) |
| 3 or 4 Unit Apartments | 26 (100.0%) | 0 (0.0%) |
| 5 to 9 Unit Apartments | 0 (0.0%) | 3 (100.0%) |
| 10 or more Apartments | 57 (15.0%) | 324 (85.0%) |
| Mobile Home / Other | 0 (0.0%) | 0 (0.0%) |
| Total | 2,015 (70.9%) | 827 (29.1%) |
Housing Structures by Number of Rooms in Southgate
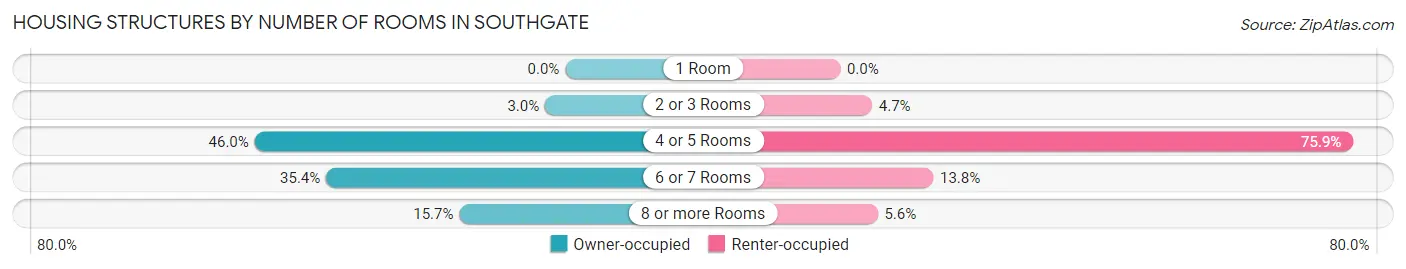
| Number of Rooms | Owner-occupied | Renter-occupied |
| 1 Room | 0 (0.0%) | 0 (0.0%) |
| 2 or 3 Rooms | 60 (3.0%) | 39 (4.7%) |
| 4 or 5 Rooms | 926 (46.0%) | 628 (75.9%) |
| 6 or 7 Rooms | 713 (35.4%) | 114 (13.8%) |
| 8 or more Rooms | 316 (15.7%) | 46 (5.6%) |
| Total | 2,015 (100.0%) | 827 (100.0%) |
Housing Structure by Heating Type in Southgate
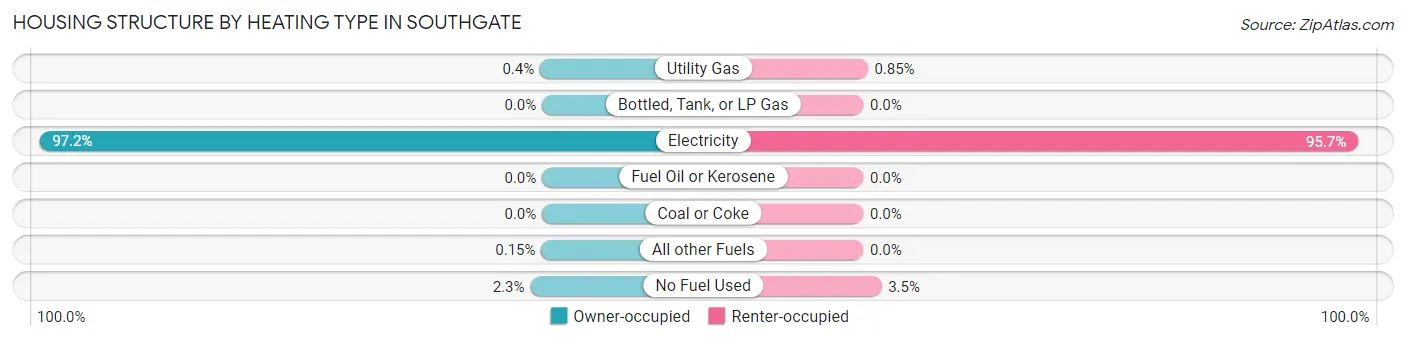
| Heating Type | Owner-occupied | Renter-occupied |
| Utility Gas | 8 (0.4%) | 7 (0.9%) |
| Bottled, Tank, or LP Gas | 0 (0.0%) | 0 (0.0%) |
| Electricity | 1,958 (97.2%) | 791 (95.7%) |
| Fuel Oil or Kerosene | 0 (0.0%) | 0 (0.0%) |
| Coal or Coke | 0 (0.0%) | 0 (0.0%) |
| All other Fuels | 3 (0.2%) | 0 (0.0%) |
| No Fuel Used | 46 (2.3%) | 29 (3.5%) |
| Total | 2,015 (100.0%) | 827 (100.0%) |
Household Vehicle Usage in Southgate
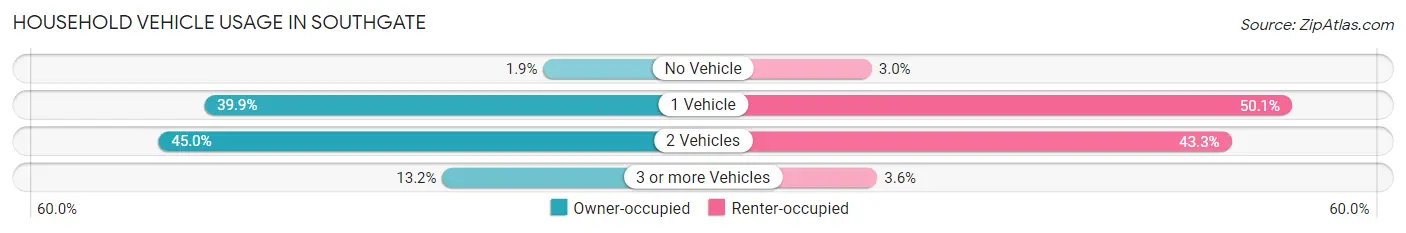
| Vehicles per Household | Owner-occupied | Renter-occupied |
| No Vehicle | 38 (1.9%) | 25 (3.0%) |
| 1 Vehicle | 804 (39.9%) | 414 (50.1%) |
| 2 Vehicles | 907 (45.0%) | 358 (43.3%) |
| 3 or more Vehicles | 266 (13.2%) | 30 (3.6%) |
| Total | 2,015 (100.0%) | 827 (100.0%) |
Real Estate & Mortgages in Southgate
Real Estate and Mortgage Overview in Southgate
| Characteristic | Without Mortgage | With Mortgage |
| Housing Units | 903 | 1,112 |
| Median Property Value | $314,300 | $358,700 |
| Median Household Income | $55,893 | $294 |
| Monthly Housing Costs | $593 | $92 |
| Real Estate Taxes | $2,288 | $0 |
Property Value by Mortgage Status in Southgate
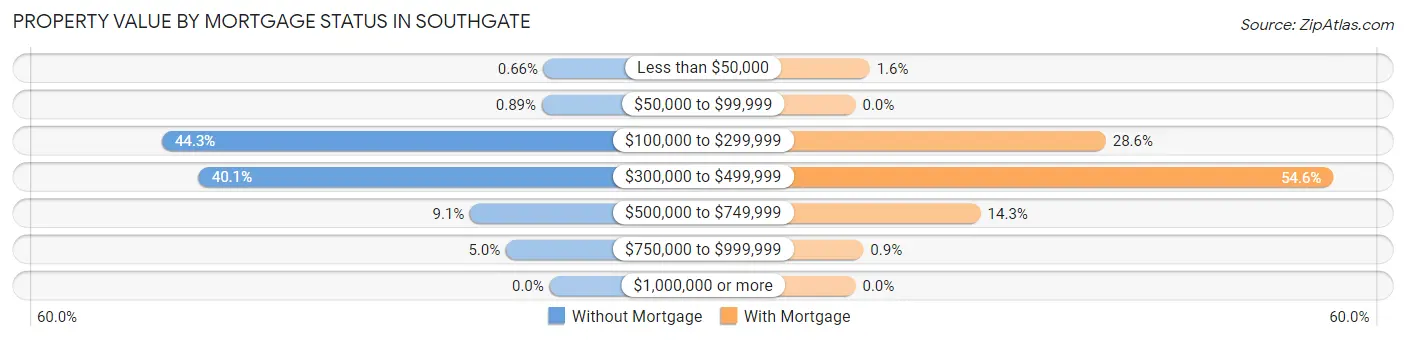
| Property Value | Without Mortgage | With Mortgage |
| Less than $50,000 | 6 (0.7%) | 18 (1.6%) |
| $50,000 to $99,999 | 8 (0.9%) | 0 (0.0%) |
| $100,000 to $299,999 | 400 (44.3%) | 318 (28.6%) |
| $300,000 to $499,999 | 362 (40.1%) | 607 (54.6%) |
| $500,000 to $749,999 | 82 (9.1%) | 159 (14.3%) |
| $750,000 to $999,999 | 45 (5.0%) | 10 (0.9%) |
| $1,000,000 or more | 0 (0.0%) | 0 (0.0%) |
| Total | 903 (100.0%) | 1,112 (100.0%) |
Household Income by Mortgage Status in Southgate
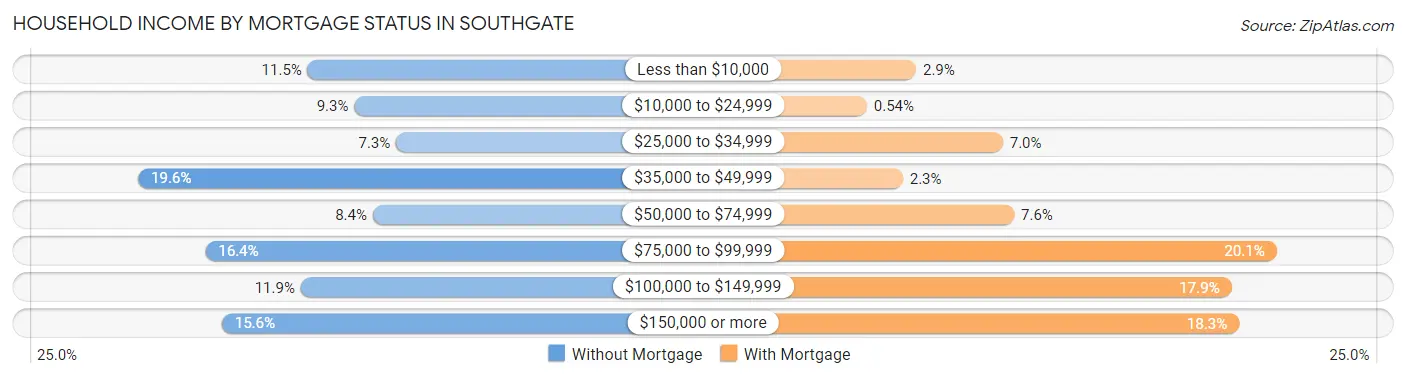
| Household Income | Without Mortgage | With Mortgage |
| Less than $10,000 | 104 (11.5%) | 32 (2.9%) |
| $10,000 to $24,999 | 84 (9.3%) | 6 (0.5%) |
| $25,000 to $34,999 | 66 (7.3%) | 78 (7.0%) |
| $35,000 to $49,999 | 177 (19.6%) | 25 (2.2%) |
| $50,000 to $74,999 | 76 (8.4%) | 84 (7.5%) |
| $75,000 to $99,999 | 148 (16.4%) | 223 (20.1%) |
| $100,000 to $149,999 | 107 (11.8%) | 199 (17.9%) |
| $150,000 or more | 141 (15.6%) | 203 (18.3%) |
| Total | 903 (100.0%) | 1,112 (100.0%) |
Property Value to Household Income Ratio in Southgate
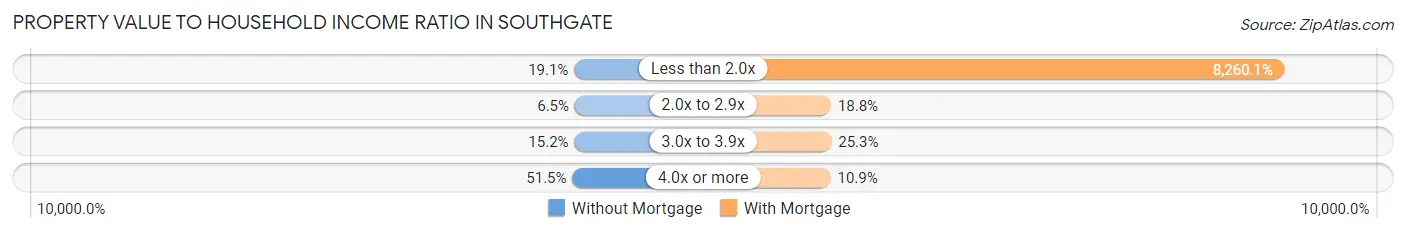
| Value-to-Income Ratio | Without Mortgage | With Mortgage |
| Less than 2.0x | 172 (19.1%) | 91,852 (8,260.1%) |
| 2.0x to 2.9x | 59 (6.5%) | 209 (18.8%) |
| 3.0x to 3.9x | 137 (15.2%) | 281 (25.3%) |
| 4.0x or more | 465 (51.5%) | 121 (10.9%) |
| Total | 903 (100.0%) | 1,112 (100.0%) |
Real Estate Taxes by Mortgage Status in Southgate
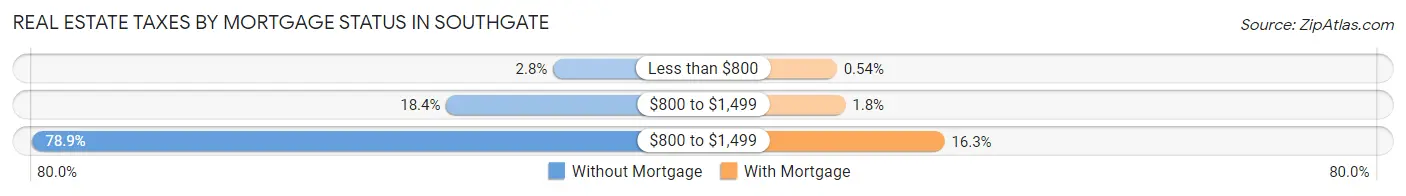
| Property Taxes | Without Mortgage | With Mortgage |
| Less than $800 | 25 (2.8%) | 6 (0.5%) |
| $800 to $1,499 | 166 (18.4%) | 20 (1.8%) |
| $800 to $1,499 | 712 (78.8%) | 181 (16.3%) |
| Total | 903 (100.0%) | 1,112 (100.0%) |
Health & Disability in Southgate
Health Insurance Coverage by Age in Southgate
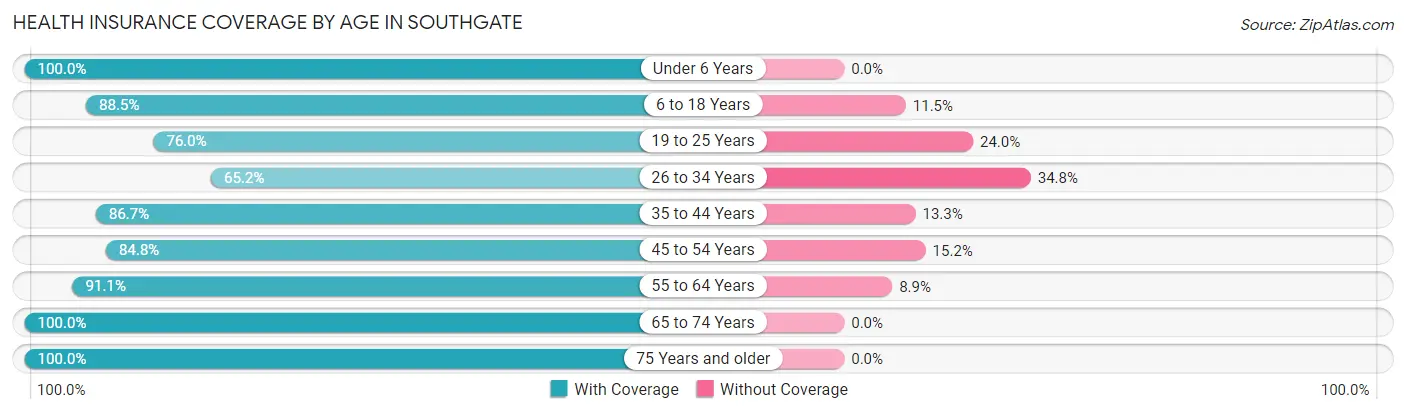
| Age Bracket | With Coverage | Without Coverage |
| Under 6 Years | 236 (100.0%) | 0 (0.0%) |
| 6 to 18 Years | 694 (88.5%) | 90 (11.5%) |
| 19 to 25 Years | 307 (76.0%) | 97 (24.0%) |
| 26 to 34 Years | 375 (65.2%) | 200 (34.8%) |
| 35 to 44 Years | 633 (86.7%) | 97 (13.3%) |
| 45 to 54 Years | 587 (84.8%) | 105 (15.2%) |
| 55 to 64 Years | 1,029 (91.1%) | 101 (8.9%) |
| 65 to 74 Years | 666 (100.0%) | 0 (0.0%) |
| 75 Years and older | 883 (100.0%) | 0 (0.0%) |
| Total | 5,410 (88.7%) | 690 (11.3%) |
Health Insurance Coverage by Citizenship Status in Southgate
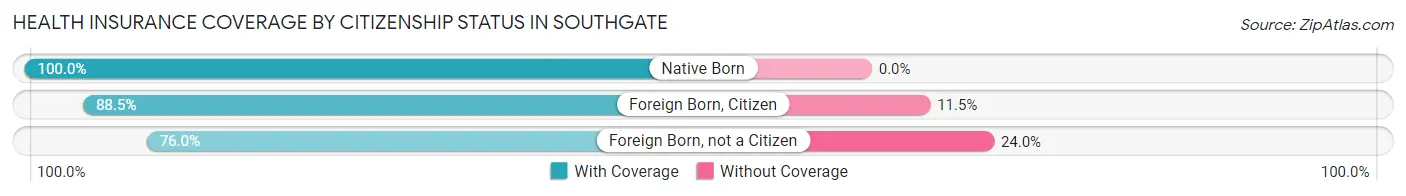
| Citizenship Status | With Coverage | Without Coverage |
| Native Born | 236 (100.0%) | 0 (0.0%) |
| Foreign Born, Citizen | 694 (88.5%) | 90 (11.5%) |
| Foreign Born, not a Citizen | 307 (76.0%) | 97 (24.0%) |
Health Insurance Coverage by Household Income in Southgate
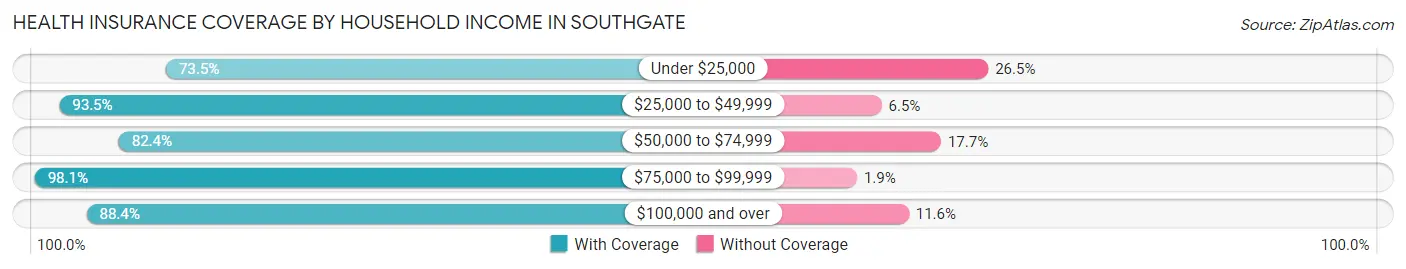
| Household Income | With Coverage | Without Coverage |
| Under $25,000 | 344 (73.5%) | 124 (26.5%) |
| $25,000 to $49,999 | 1,076 (93.5%) | 75 (6.5%) |
| $50,000 to $74,999 | 980 (82.4%) | 210 (17.6%) |
| $75,000 to $99,999 | 1,027 (98.1%) | 20 (1.9%) |
| $100,000 and over | 1,980 (88.4%) | 260 (11.6%) |
Public vs Private Health Insurance Coverage by Age in Southgate
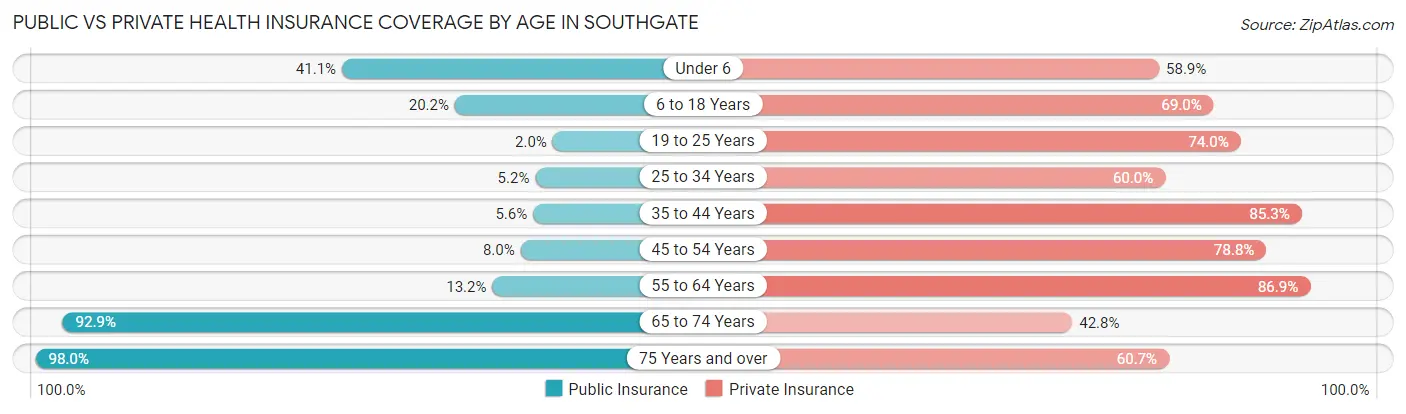
| Age Bracket | Public Insurance | Private Insurance |
| Under 6 | 97 (41.1%) | 139 (58.9%) |
| 6 to 18 Years | 158 (20.2%) | 541 (69.0%) |
| 19 to 25 Years | 8 (2.0%) | 299 (74.0%) |
| 25 to 34 Years | 30 (5.2%) | 345 (60.0%) |
| 35 to 44 Years | 41 (5.6%) | 623 (85.3%) |
| 45 to 54 Years | 55 (8.0%) | 545 (78.8%) |
| 55 to 64 Years | 149 (13.2%) | 982 (86.9%) |
| 65 to 74 Years | 619 (92.9%) | 285 (42.8%) |
| 75 Years and over | 865 (98.0%) | 536 (60.7%) |
| Total | 2,022 (33.2%) | 4,295 (70.4%) |
Disability Status by Sex by Age in Southgate
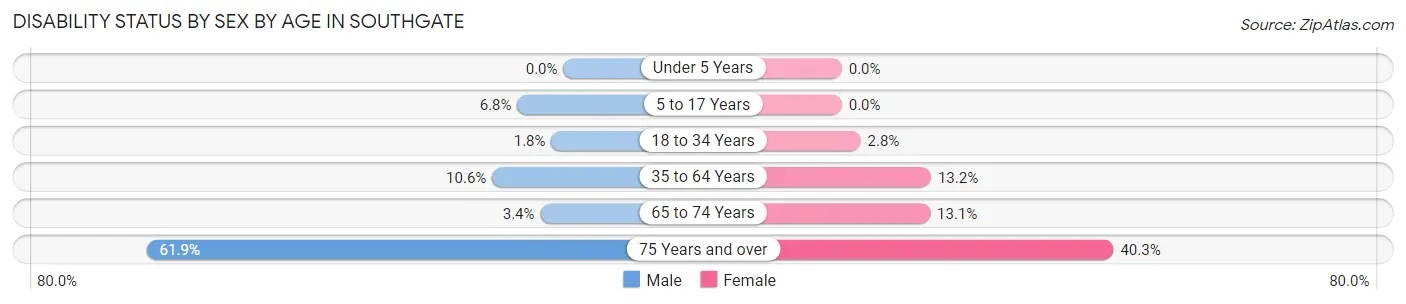
| Age Bracket | Male | Female |
| Under 5 Years | 0 (0.0%) | 0 (0.0%) |
| 5 to 17 Years | 28 (6.8%) | 0 (0.0%) |
| 18 to 34 Years | 10 (1.8%) | 13 (2.8%) |
| 35 to 64 Years | 114 (10.6%) | 195 (13.2%) |
| 65 to 74 Years | 11 (3.4%) | 45 (13.1%) |
| 75 Years and over | 258 (61.9%) | 188 (40.3%) |
Disability Class by Sex by Age in Southgate
Disability Class: Hearing Difficulty
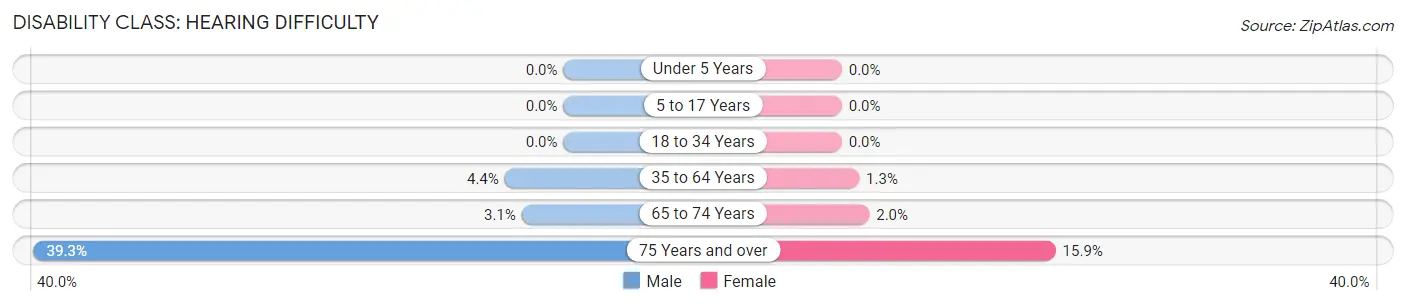
| Age Bracket | Male | Female |
| Under 5 Years | 0 (0.0%) | 0 (0.0%) |
| 5 to 17 Years | 0 (0.0%) | 0 (0.0%) |
| 18 to 34 Years | 0 (0.0%) | 0 (0.0%) |
| 35 to 64 Years | 47 (4.4%) | 19 (1.3%) |
| 65 to 74 Years | 10 (3.1%) | 7 (2.0%) |
| 75 Years and over | 164 (39.3%) | 74 (15.9%) |
Disability Class: Vision Difficulty
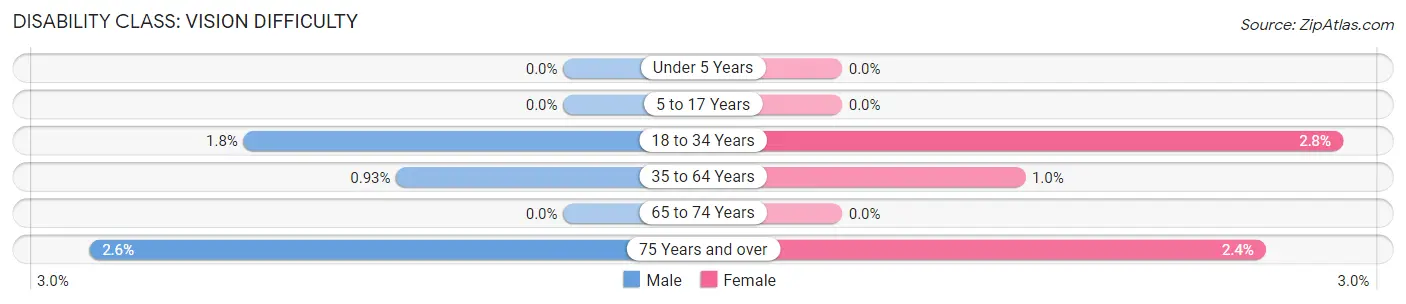
| Age Bracket | Male | Female |
| Under 5 Years | 0 (0.0%) | 0 (0.0%) |
| 5 to 17 Years | 0 (0.0%) | 0 (0.0%) |
| 18 to 34 Years | 10 (1.8%) | 13 (2.8%) |
| 35 to 64 Years | 10 (0.9%) | 15 (1.0%) |
| 65 to 74 Years | 0 (0.0%) | 0 (0.0%) |
| 75 Years and over | 11 (2.6%) | 11 (2.4%) |
Disability Class: Cognitive Difficulty
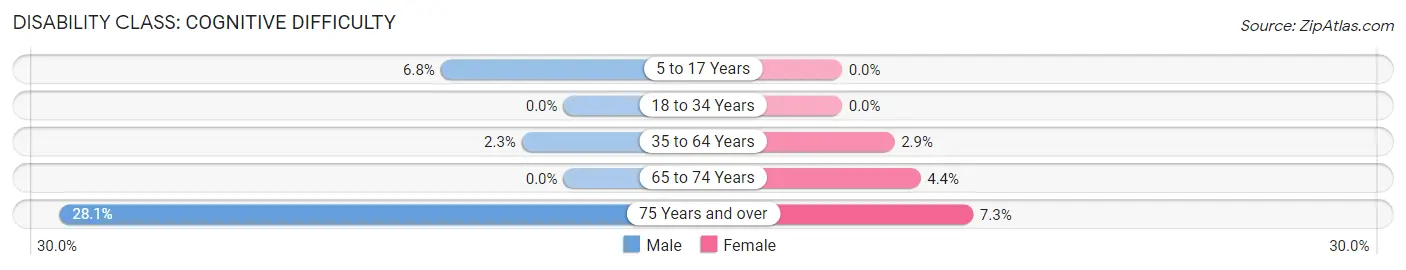
| Age Bracket | Male | Female |
| 5 to 17 Years | 28 (6.8%) | 0 (0.0%) |
| 18 to 34 Years | 0 (0.0%) | 0 (0.0%) |
| 35 to 64 Years | 25 (2.3%) | 43 (2.9%) |
| 65 to 74 Years | 0 (0.0%) | 15 (4.4%) |
| 75 Years and over | 117 (28.1%) | 34 (7.3%) |
Disability Class: Ambulatory Difficulty
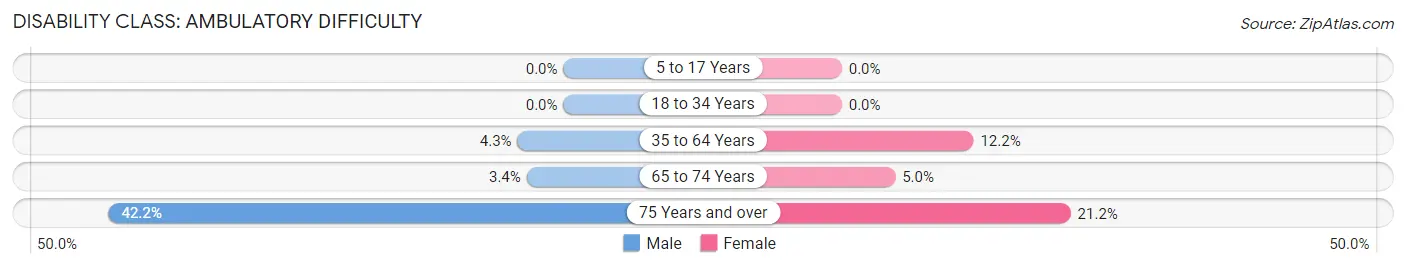
| Age Bracket | Male | Female |
| 5 to 17 Years | 0 (0.0%) | 0 (0.0%) |
| 18 to 34 Years | 0 (0.0%) | 0 (0.0%) |
| 35 to 64 Years | 46 (4.3%) | 180 (12.2%) |
| 65 to 74 Years | 11 (3.4%) | 17 (5.0%) |
| 75 Years and over | 176 (42.2%) | 99 (21.2%) |
Disability Class: Self-Care Difficulty
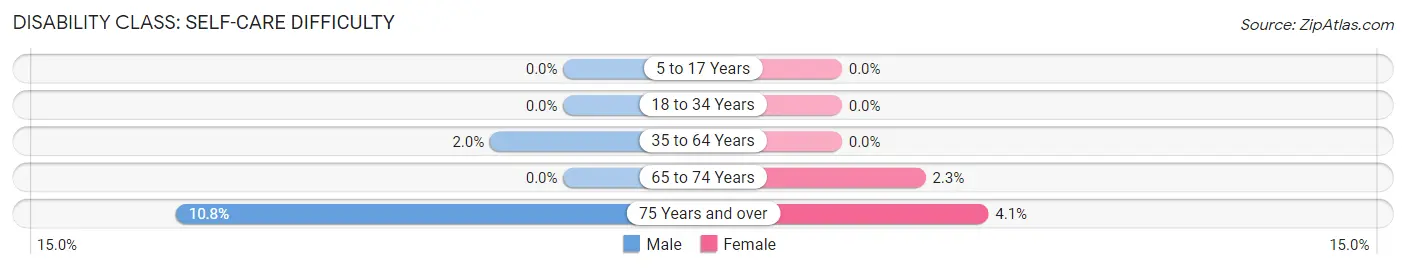
| Age Bracket | Male | Female |
| 5 to 17 Years | 0 (0.0%) | 0 (0.0%) |
| 18 to 34 Years | 0 (0.0%) | 0 (0.0%) |
| 35 to 64 Years | 22 (2.0%) | 0 (0.0%) |
| 65 to 74 Years | 0 (0.0%) | 8 (2.3%) |
| 75 Years and over | 45 (10.8%) | 19 (4.1%) |
Technology Access in Southgate
Computing Device Access in Southgate
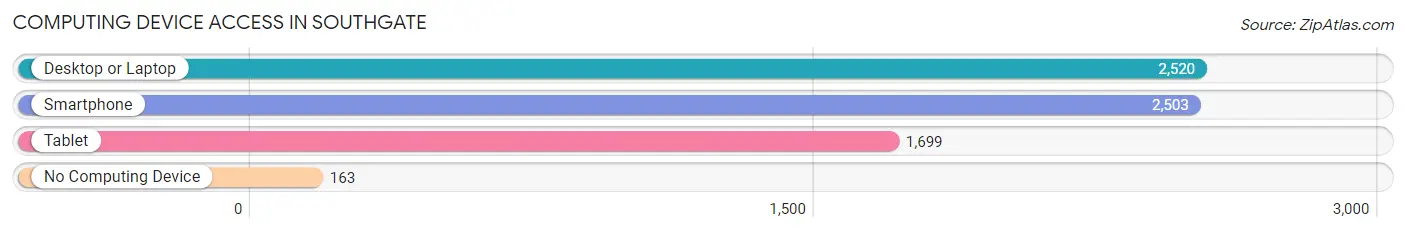
| Device Type | # Households | % Households |
| Desktop or Laptop | 2,520 | 88.7% |
| Smartphone | 2,503 | 88.1% |
| Tablet | 1,699 | 59.8% |
| No Computing Device | 163 | 5.7% |
| Total | 2,842 | 100.0% |
Internet Access in Southgate
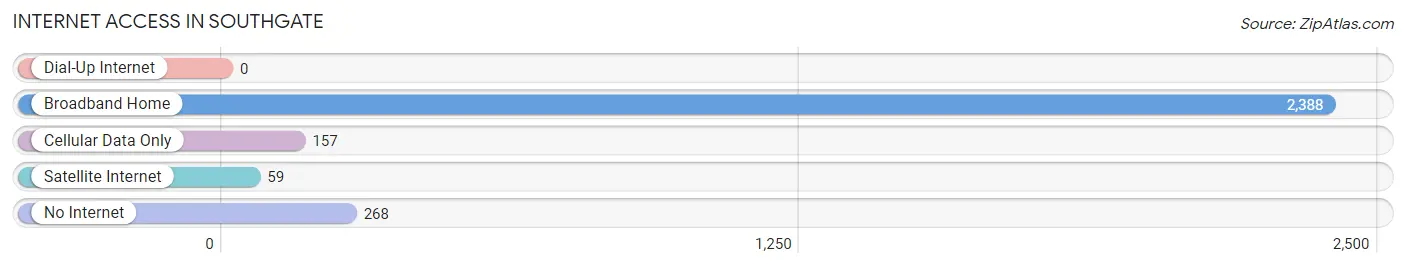
| Internet Type | # Households | % Households |
| Dial-Up Internet | 0 | 0.0% |
| Broadband Home | 2,388 | 84.0% |
| Cellular Data Only | 157 | 5.5% |
| Satellite Internet | 59 | 2.1% |
| No Internet | 268 | 9.4% |
| Total | 2,842 | 100.0% |
Southgate Summary
History
Southgate is a small unincorporated community located in Hillsborough County, Florida. It is located just south of Tampa and is part of the Tampa-St. Petersburg-Clearwater Metropolitan Statistical Area. The area was first settled in the late 19th century by settlers from the nearby town of Tampa. The area was originally known as “South Gate” due to its location south of the city of Tampa. The name was later shortened to Southgate.
The area was largely rural until the 1950s when it began to experience rapid growth due to its proximity to Tampa. The area was annexed by the city of Tampa in 1957 and became part of the city’s South Tampa neighborhood. The area experienced further growth in the 1960s and 1970s as the population of Tampa increased.
Geography
Southgate is located in Hillsborough County, Florida. It is located just south of Tampa and is part of the Tampa-St. Petersburg-Clearwater Metropolitan Statistical Area. The area is mostly flat and is located on the Gulf Coastal Plain. The area is bordered by the Hillsborough River to the east and the Tampa Bay to the west.
The climate in Southgate is classified as humid subtropical. The area experiences hot and humid summers and mild winters. The average temperature in the summer is around 90°F and the average temperature in the winter is around 60°F. The area receives an average of 54 inches of rain per year.
Economy
Southgate’s economy is largely based on tourism and service industries. The area is home to several hotels, restaurants, and retail stores. The area is also home to several corporate offices, including those of the Tampa Bay Buccaneers and the Tampa Bay Rays.
The area is also home to several educational institutions, including the University of South Florida, Hillsborough Community College, and the University of Tampa. The area is also home to several medical facilities, including Tampa General Hospital and St. Joseph’s Hospital.
Demographics
As of the 2010 census, Southgate had a population of 8,945. The racial makeup of the area was 79.3% White, 11.2% African American, 0.7% Native American, 2.2% Asian, 0.1% Pacific Islander, 4.2% from other races, and 2.5% from two or more races. Hispanic or Latino of any race were 11.7% of the population.
The median household income in Southgate was $41,945 and the median family income was $50,945. The per capita income for the area was $22,945. About 11.2% of families and 14.2% of the population were below the poverty line, including 19.2% of those under age 18 and 8.2% of those age 65 or over.
Common Questions
What is the Total Population of Southgate?
Total Population of Southgate is 6,183.
What is the Total Male Population of Southgate?
Total Male Population of Southgate is 2,952.
What is the Total Female Population of Southgate?
Total Female Population of Southgate is 3,231.
What is the Ratio of Males per 100 Females in Southgate?
There are 91.36 Males per 100 Females in Southgate.
What is the Ratio of Females per 100 Males in Southgate?
There are 109.45 Females per 100 Males in Southgate.
What is the Median Population Age in Southgate?
Median Population Age in Southgate is 49.7 Years.
What is the Average Family Size in Southgate
Average Family Size in Southgate is 2.6 People.
What is the Average Household Size in Southgate
Average Household Size in Southgate is 2.1 People.
What is Per Capita Income in Southgate?
Per Capita income in Southgate is $45,773.
What is the Median Family Income in Southgate?
Median Family Income in Southgate is $78,271.
What is the Median Household income in Southgate?
Median Household Income in Southgate is $71,711.
What is Income or Wage Gap in Southgate?
Income or Wage Gap in Southgate is 10.6%.
Women in Southgate earn 89.4 cents for every dollar earned by a man.
What is Inequality or Gini Index in Southgate?
Inequality or Gini Index in Southgate is 0.46.
How Large is the Labor Force in Southgate?
There are 3,204 People in the Labor Forcein in Southgate.
What is the Percentage of People in the Labor Force in Southgate?
60.4% of People are in the Labor Force in Southgate.
What is the Unemployment Rate in Southgate?
Unemployment Rate in Southgate is 6.4%.