Zip Codes with the Lowest Poverty Level Among Children Under the Age of 5 in Pensacola, FL

RELATED REPORTS & OPTIONS

Lowest Poverty | Child 0-5
Population
Families and Households
Female Fertility
Female Fertility (Unmarried)
Race (Community Size)
Race (Percentage)
Ancestry (Community Size)
AfricanAlbanianAmericanApacheArabArgentineanArmenianAustralianAustrianBahamianBangladeshiBarbadianBelgianBelizeanBhutaneseBlackfeetBrazilianBritishBurmeseCajunCanadianCelticCentral AmericanCentral American IndianCherokeeChileanChippewaChoctawColombianCosta RicanCreeCreekCroatianCubanCzechCzechoslovakianDanishDominicanDutchEastern EuropeanEcuadorianEnglishEstonianEuropeanFinnishFrenchFrench American IndianFrench CanadianGermanGerman RussianGreekGuamanian / ChamorroGuatemalanGuyaneseHaitianHonduranHoumaHungarianIcelanderIndian (Asian)IranianIrishIroquoisItalianJamaicanJapaneseJordanianKenyanKoreanLaotianLatvianLebaneseLithuanianMacedonianMalaysianMalteseMexicanMexican American IndianMoroccanNative HawaiianNavajoNicaraguanNigerianNorthern EuropeanNorwegianOsagePakistaniPanamanianParaguayanPennsylvania GermanPeruvianPolishPortuguesePuebloPuerto RicanRomanianRussianSalvadoranSamoanScandinavianScotch-IrishScottishSeminoleSerbianSiouxSlavicSlovakSloveneSouth AfricanSouth AmericanSouth American IndianSpaniardSpanishSri LankanSubsaharan AfricanSwedishSwissSyrianThaiTurkishUkrainianVenezuelanVietnameseWelshWest IndianYaquiYugoslavian
Ancestry (Percentage)
AfricanAlbanianAmericanApacheArabArgentineanArmenianAustralianAustrianBahamianBangladeshiBarbadianBelgianBelizeanBhutaneseBlackfeetBrazilianBritishBurmeseCajunCanadianCelticCentral AmericanCentral American IndianCherokeeChileanChippewaChoctawColombianCosta RicanCreeCreekCroatianCubanCzechCzechoslovakianDanishDominicanDutchEastern EuropeanEcuadorianEnglishEstonianEuropeanFinnishFrenchFrench American IndianFrench CanadianGermanGerman RussianGreekGuamanian / ChamorroGuatemalanGuyaneseHaitianHonduranHoumaHungarianIcelanderIndian (Asian)IranianIrishIroquoisItalianJamaicanJapaneseJordanianKenyanKoreanLaotianLatvianLebaneseLithuanianMacedonianMalaysianMalteseMexicanMexican American IndianMoroccanNative HawaiianNavajoNicaraguanNigerianNorthern EuropeanNorwegianOsagePakistaniPanamanianParaguayanPennsylvania GermanPeruvianPolishPortuguesePuebloPuerto RicanRomanianRussianSalvadoranSamoanScandinavianScotch-IrishScottishSeminoleSerbianSiouxSlavicSlovakSloveneSouth AfricanSouth AmericanSouth American IndianSpaniardSpanishSri LankanSubsaharan AfricanSwedishSwissSyrianThaiTurkishUkrainianVenezuelanVietnameseWelshWest IndianYaquiYugoslavian
Immigrant Origin (Total)
Immigrant Origin (Percentage)
Income
Income (Families)
Income (Households)
Poverty
Poverty (Families)
Unemployment
Employment Occupations
Employment Industries
Employer Class
Commute Time
Commute Means
School Enrollment
Education by Degree Field
Occupancy
Finances
Physical Characteristics
Pensacola
States
Florida Cities
Altamonte SpringsApopkaArcadiaBoca RatonBoynton BeachBradentonBrandonBrooksvilleCape CoralCasselberryClearwaterClermontCocoaCoral SpringsCrestviewCrystal RiverDade CityDavenportDaytona BeachDeerfield BeachDefuniak SpringsDelandDelray BeachDeltonaDunnellonEdgewaterEnglewoodEustisFort LauderdaleFort MyersFort PierceFort Walton BeachGainesvilleGulf BreezeHialeahHolidayHollywoodHomesteadHomosassaHudsonInvernessJacksonvilleJupiterKissimmeeLake CityLake WalesLake WorthLakelandLand O LakesLargoLeesburgLehigh AcresLive OakLongwoodLutzMariannaMelbourneMerritt IslandMiamiMiami BeachMiltonNaplesNew Port RicheyNew Smyrna BeachNorth Fort MyersNorth PortOcalaOkeechobeeOpa LockaOrange ParkOrlandoOrmond BeachOviedoPalm BayPalm Beach GardensPalm CoastPalm HarborPanama CityPanama City BeachPensacolaPerryPinellas ParkPlant CityPompano BeachPort CharlottePort OrangePort Saint LuciePunta GordaQuincyRiverviewSaint AugustineSaint CloudSaint PetersburgSanfordSarasotaSebringSeminoleSpring HillStuartTallahasseeTampaTitusvilleValricoVeniceVero BeachWesley ChapelWest Palm BeachWewahitchkaWinter HavenWinter ParkZephyrhills
Compare Zip Codes
Comparison Subject

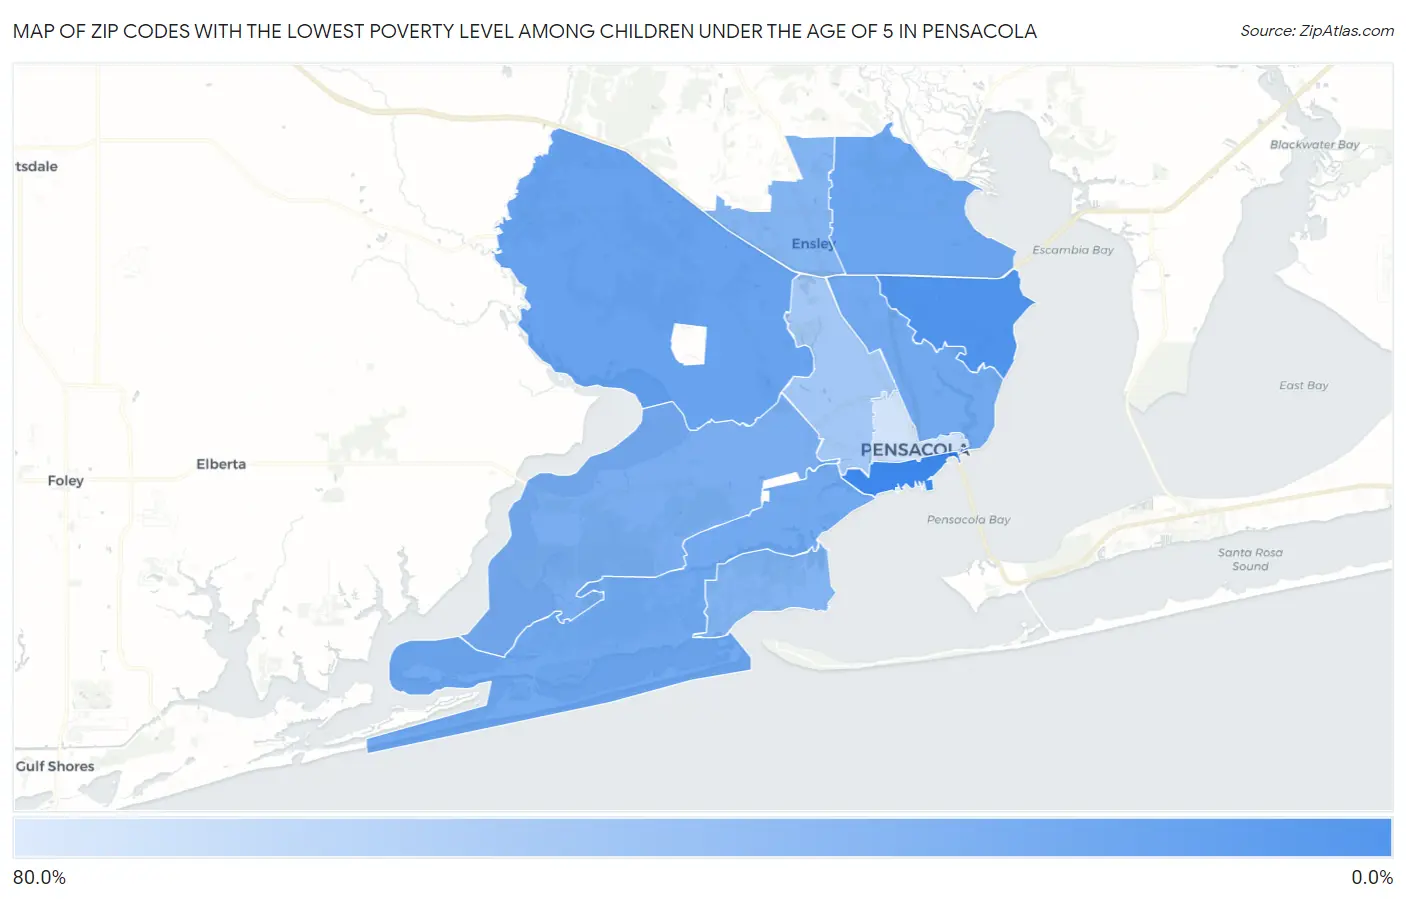
Map of Zip Codes with the Lowest Poverty Level Among Children Under the Age of 5 in Pensacola

80.0%
0.0%
Zip Codes with the Lowest Poverty Level Among Children Under the Age of 5 in Pensacola Map

Zip Codes with the Lowest Poverty Level Among Children Under the Age of 5 in Pensacola, FL

Zip Code Child Poverty vs State vs National
1.325023.9%19.3%(-15.3)#5818.1%(-14.1)#2,126
2.3250410.3%19.3%(-8.98)#21118.1%(-7.79)#6,423
3.3252618.5%19.3%(-0.736)#41518.1%(+0.456)#10,945
4.3251419.8%19.3%(+0.515)#45418.1%(+1.71)#11,522
5.3250322.3%19.3%(+3.08)#49918.1%(+4.27)#12,641
6.3250722.3%19.3%(+3.08)#50018.1%(+4.28)#12,643
7.3250624.9%19.3%(+5.67)#54918.1%(+6.86)#13,617
8.3250827.9%19.3%(+8.61)#58518.1%(+9.80)#14,672
9.3253429.0%19.3%(+9.78)#60018.1%(+11.0)#15,040
10.3250541.3%19.3%(+22.0)#71318.1%(+23.2)#17,887
11.3250162.7%19.3%(+43.4)#79318.1%(+44.6)#20,158

Common Questions

What are the Top 10 Zip Codes with the Lowest Poverty Level Among Children Under the Age of 5 in Pensacola, FL?
Top 10 Zip Codes with the Lowest Poverty Level Among Children Under the Age of 5 in Pensacola, FL are:
#1
3.9%
#2
10.3%
#3
18.5%
#4
19.8%
#5
22.3%
#6
22.3%
#7
24.9%
#8
27.9%
#9
29.0%
#10
41.3%
What zip code has the Lowest Poverty Level Among Children Under the Age of 5 in Pensacola, FL?
32502 has the Lowest Poverty Level Among Children Under the Age of 5 in Pensacola, FL with 3.9%.
What is the Poverty Level Among Children Under the Age of 5 in Pensacola, FL?
Poverty Level Among Children Under the Age of 5 in Pensacola is 20.8%.
What is the Poverty Level Among Children Under the Age of 5 in Florida?
Poverty Level Among Children Under the Age of 5 in Florida is 19.3%.
What is the Poverty Level Among Children Under the Age of 5 in the United States?
Poverty Level Among Children Under the Age of 5 in the United States is 18.1%.