Jacksonville Beach, FL
Jacksonville Beach Map
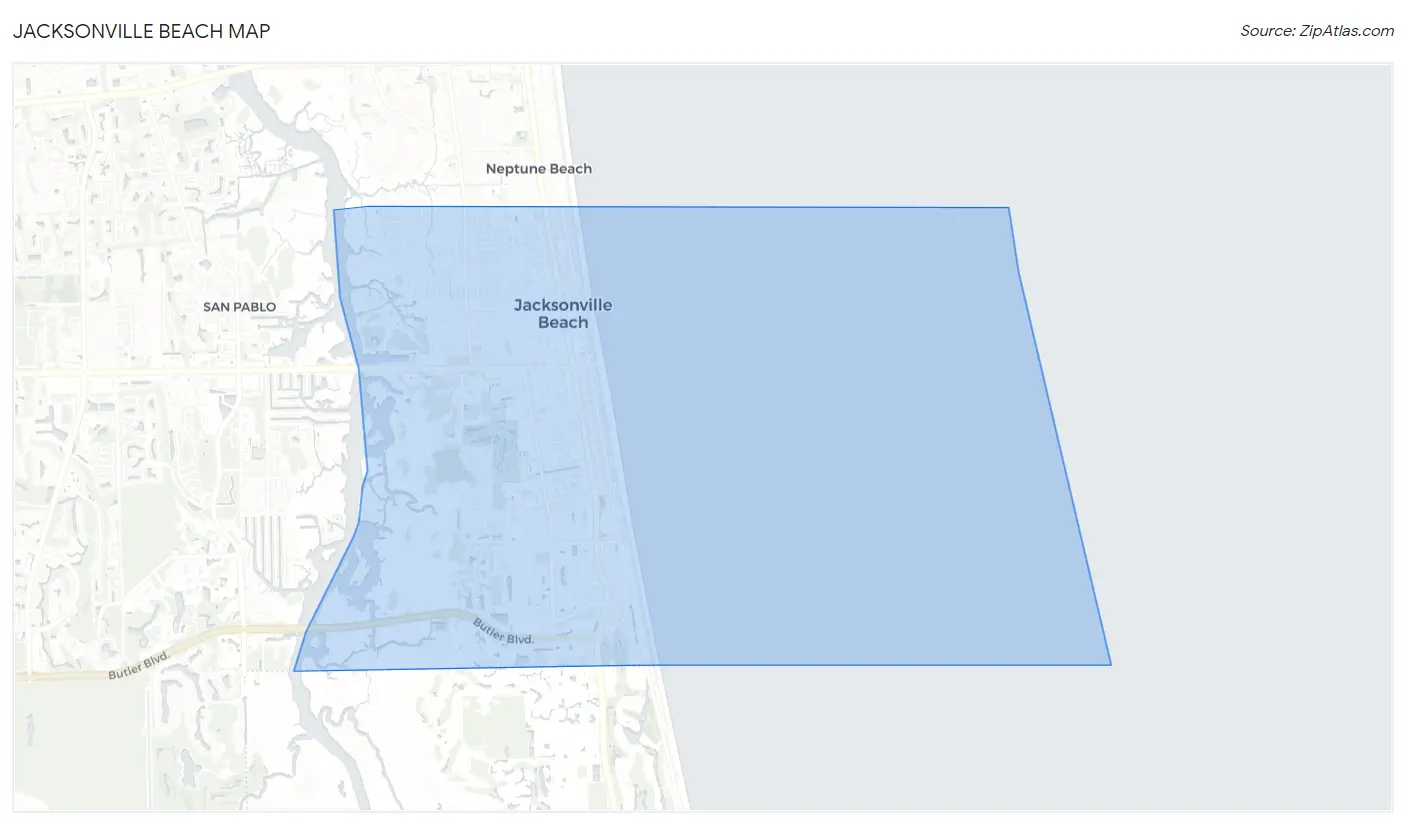
Jacksonville Beach Overview
23,583
TOTAL POPULATION
12,275
MALE POPULATION
11,308
FEMALE POPULATION
108.55
MALES / 100 FEMALES
92.12
FEMALES / 100 MALES
43.3
MEDIAN AGE
2.7
AVG FAMILY SIZE
2.2
AVG HOUSEHOLD SIZE
$72,826
PER CAPITA INCOME
$134,643
AVG FAMILY INCOME
$109,649
AVG HOUSEHOLD INCOME
23.4%
WAGE / INCOME GAP [ % ]
76.6¢/ $1
WAGE / INCOME GAP [ $ ]
$10,490
FAMILY INCOME DEFICIT
0.48
INEQUALITY / GINI INDEX
14,042
LABOR FORCE [ PEOPLE ]
69.2%
PERCENT IN LABOR FORCE
2.1%
UNEMPLOYMENT RATE
Jacksonville Beach Zip Codes
Jacksonville Beach Area Codes
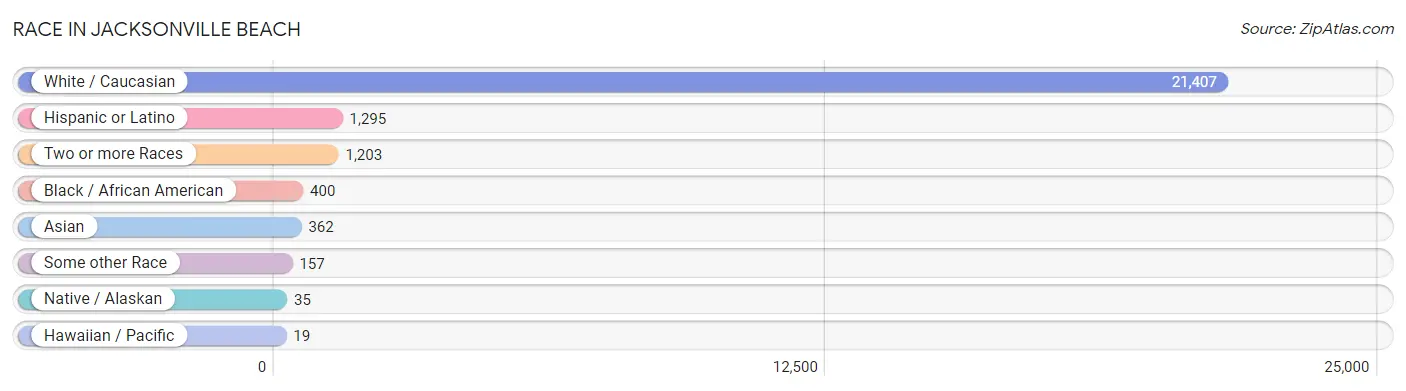
Race in Jacksonville Beach
The most populous races in Jacksonville Beach are White / Caucasian (21,407 | 90.8%), Hispanic or Latino (1,295 | 5.5%), and Two or more Races (1,203 | 5.1%).
| Race | # Population | % Population |
| Asian | 362 | 1.5% |
| Black / African American | 400 | 1.7% |
| Hawaiian / Pacific | 19 | 0.1% |
| Hispanic or Latino | 1,295 | 5.5% |
| Native / Alaskan | 35 | 0.2% |
| White / Caucasian | 21,407 | 90.8% |
| Two or more Races | 1,203 | 5.1% |
| Some other Race | 157 | 0.7% |
| Total | 23,583 | 100.0% |
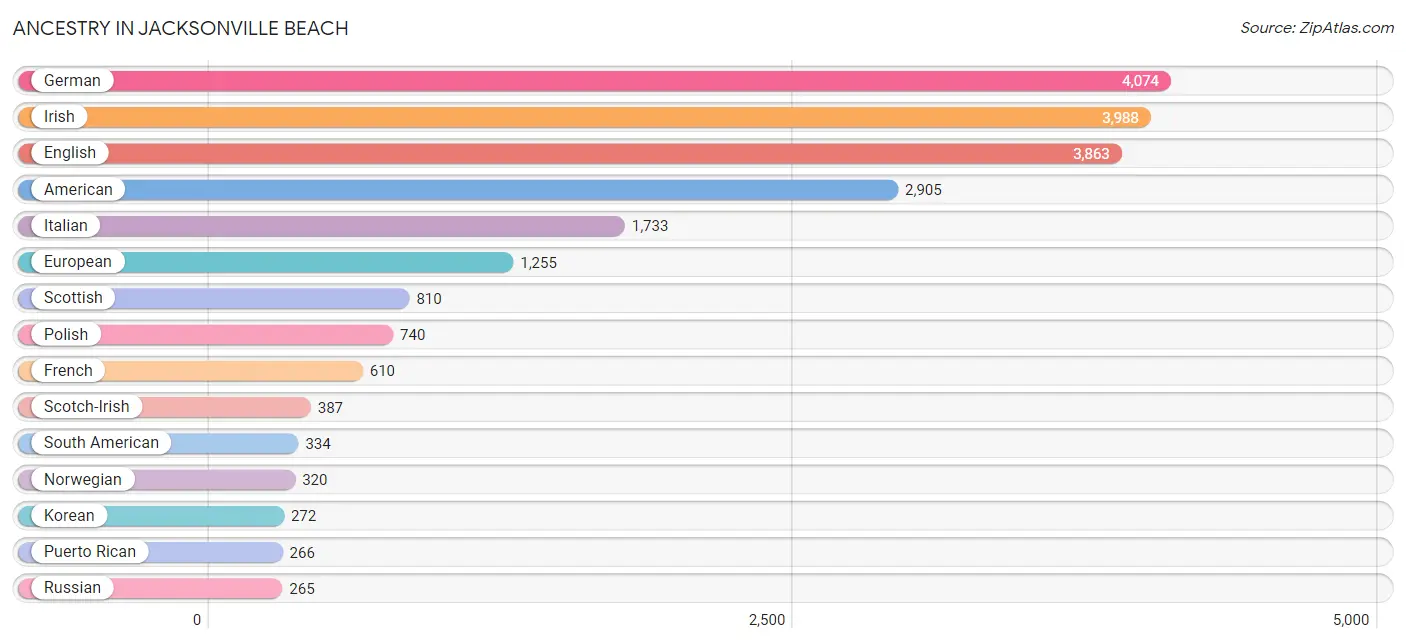
Ancestry in Jacksonville Beach
The most populous ancestries reported in Jacksonville Beach are German (4,074 | 17.3%), Irish (3,988 | 16.9%), English (3,863 | 16.4%), American (2,905 | 12.3%), and Italian (1,733 | 7.3%), together accounting for 70.2% of all Jacksonville Beach residents.
| Ancestry | # Population | % Population |
| African | 26 | 0.1% |
| Albanian | 108 | 0.5% |
| Aleut | 26 | 0.1% |
| American | 2,905 | 12.3% |
| Arab | 149 | 0.6% |
| Argentinean | 16 | 0.1% |
| Austrian | 93 | 0.4% |
| Bahamian | 12 | 0.1% |
| Basque | 20 | 0.1% |
| Belgian | 57 | 0.2% |
| Bhutanese | 24 | 0.1% |
| British | 235 | 1.0% |
| Burmese | 41 | 0.2% |
| Canadian | 18 | 0.1% |
| Cape Verdean | 15 | 0.1% |
| Central American | 129 | 0.5% |
| Cherokee | 45 | 0.2% |
| Choctaw | 9 | 0.0% |
| Colombian | 143 | 0.6% |
| Cuban | 148 | 0.6% |
| Czech | 147 | 0.6% |
| Czechoslovakian | 25 | 0.1% |
| Dominican | 73 | 0.3% |
| Dutch | 226 | 1.0% |
| Eastern European | 120 | 0.5% |
| Ecuadorian | 18 | 0.1% |
| English | 3,863 | 16.4% |
| European | 1,255 | 5.3% |
| Finnish | 47 | 0.2% |
| French | 610 | 2.6% |
| French Canadian | 40 | 0.2% |
| German | 4,074 | 17.3% |
| Greek | 164 | 0.7% |
| Guatemalan | 55 | 0.2% |
| Hungarian | 127 | 0.5% |
| Indian (Asian) | 82 | 0.4% |
| Iranian | 23 | 0.1% |
| Iraqi | 59 | 0.3% |
| Irish | 3,988 | 16.9% |
| Italian | 1,733 | 7.3% |
| Jamaican | 39 | 0.2% |
| Korean | 272 | 1.1% |
| Lebanese | 53 | 0.2% |
| Lithuanian | 42 | 0.2% |
| Mexican | 197 | 0.8% |
| Northern European | 16 | 0.1% |
| Norwegian | 320 | 1.4% |
| Pakistani | 12 | 0.1% |
| Panamanian | 74 | 0.3% |
| Peruvian | 32 | 0.1% |
| Polish | 740 | 3.1% |
| Portuguese | 168 | 0.7% |
| Puerto Rican | 266 | 1.1% |
| Romanian | 23 | 0.1% |
| Russian | 265 | 1.1% |
| Samoan | 9 | 0.0% |
| Scandinavian | 10 | 0.0% |
| Scotch-Irish | 387 | 1.6% |
| Scottish | 810 | 3.4% |
| Serbian | 52 | 0.2% |
| Sioux | 4 | 0.0% |
| Slavic | 12 | 0.1% |
| Slovak | 21 | 0.1% |
| Slovene | 39 | 0.2% |
| South African | 14 | 0.1% |
| South American | 334 | 1.4% |
| Spaniard | 36 | 0.2% |
| Spanish | 43 | 0.2% |
| Sri Lankan | 53 | 0.2% |
| Subsaharan African | 55 | 0.2% |
| Swedish | 118 | 0.5% |
| Swiss | 94 | 0.4% |
| Thai | 224 | 0.9% |
| Trinidadian and Tobagonian | 11 | 0.1% |
| Ukrainian | 72 | 0.3% |
| Uruguayan | 26 | 0.1% |
| Venezuelan | 99 | 0.4% |
| Welsh | 93 | 0.4% |
| Yugoslavian | 57 | 0.2% | View All 79 Rows |
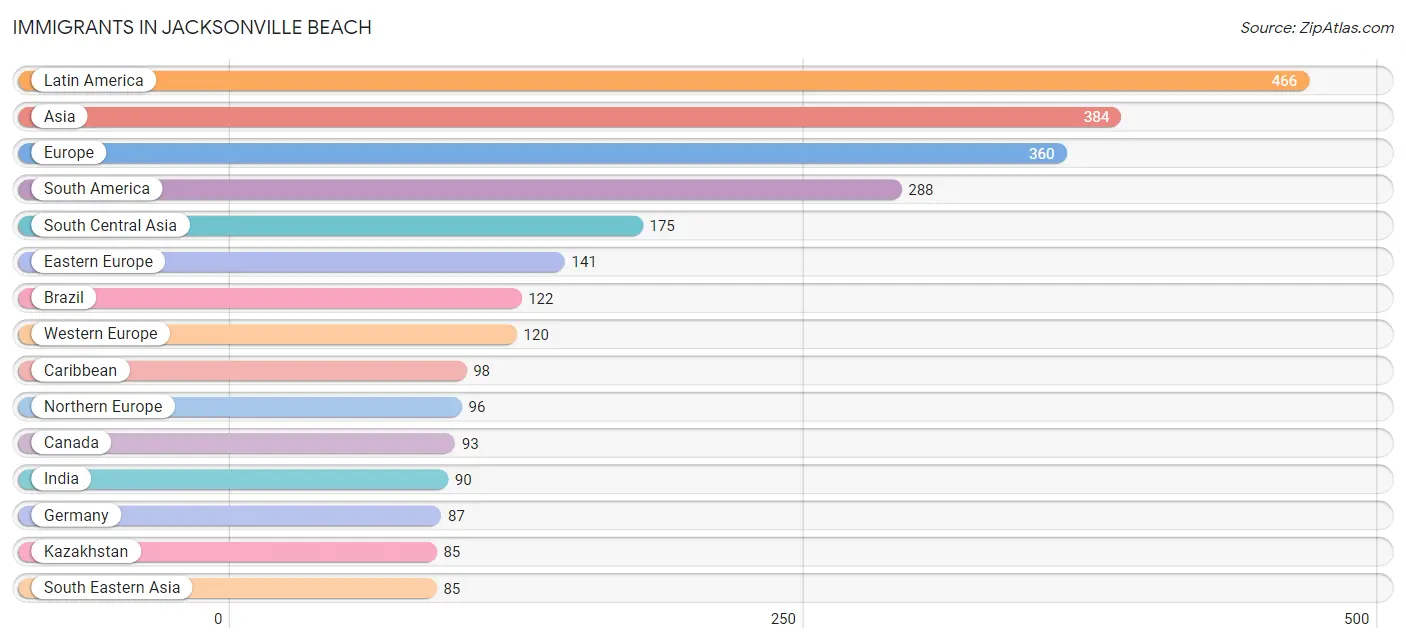
Immigrants in Jacksonville Beach
The most numerous immigrant groups reported in Jacksonville Beach came from Latin America (466 | 2.0%), Asia (384 | 1.6%), Europe (360 | 1.5%), South America (288 | 1.2%), and South Central Asia (175 | 0.7%), together accounting for 7.1% of all Jacksonville Beach residents.
| Immigration Origin | # Population | % Population |
| Africa | 34 | 0.1% |
| Argentina | 16 | 0.1% |
| Asia | 384 | 1.6% |
| Bosnia and Herzegovina | 20 | 0.1% |
| Brazil | 122 | 0.5% |
| Canada | 93 | 0.4% |
| Caribbean | 98 | 0.4% |
| Central America | 80 | 0.3% |
| China | 65 | 0.3% |
| Colombia | 57 | 0.2% |
| Czechoslovakia | 48 | 0.2% |
| Dominican Republic | 48 | 0.2% |
| Eastern Asia | 65 | 0.3% |
| Eastern Europe | 141 | 0.6% |
| England | 69 | 0.3% |
| Europe | 360 | 1.5% |
| France | 15 | 0.1% |
| Germany | 87 | 0.4% |
| India | 90 | 0.4% |
| Iraq | 59 | 0.3% |
| Ireland | 21 | 0.1% |
| Italy | 3 | 0.0% |
| Jamaica | 39 | 0.2% |
| Kazakhstan | 85 | 0.4% |
| Latin America | 466 | 2.0% |
| Mexico | 80 | 0.3% |
| Netherlands | 18 | 0.1% |
| Northern Europe | 96 | 0.4% |
| Peru | 32 | 0.1% |
| Philippines | 75 | 0.3% |
| Romania | 23 | 0.1% |
| Russia | 16 | 0.1% |
| Serbia | 34 | 0.1% |
| South Africa | 34 | 0.1% |
| South America | 288 | 1.2% |
| South Central Asia | 175 | 0.7% |
| South Eastern Asia | 85 | 0.4% |
| Southern Europe | 3 | 0.0% |
| Trinidad and Tobago | 11 | 0.1% |
| Uruguay | 17 | 0.1% |
| Venezuela | 44 | 0.2% |
| Vietnam | 10 | 0.0% |
| Western Asia | 59 | 0.3% |
| Western Europe | 120 | 0.5% | View All 44 Rows |
Sex and Age in Jacksonville Beach
Sex and Age in Jacksonville Beach
The most populous age groups in Jacksonville Beach are 30 to 34 Years (1,006 | 8.2%) for men and 60 to 64 Years (957 | 8.5%) for women.
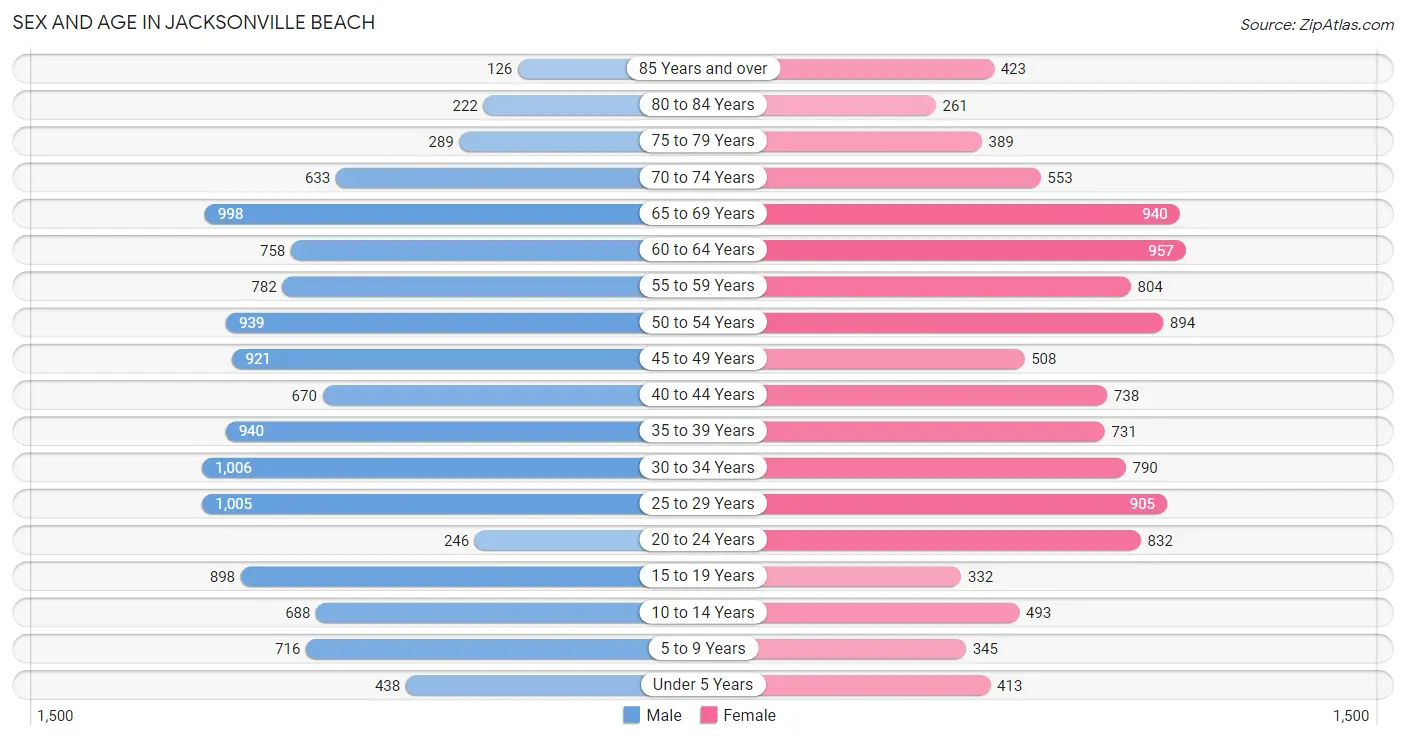
| Age Bracket | Male | Female |
| Under 5 Years | 438 (3.6%) | 413 (3.6%) |
| 5 to 9 Years | 716 (5.8%) | 345 (3.0%) |
| 10 to 14 Years | 688 (5.6%) | 493 (4.4%) |
| 15 to 19 Years | 898 (7.3%) | 332 (2.9%) |
| 20 to 24 Years | 246 (2.0%) | 832 (7.4%) |
| 25 to 29 Years | 1,005 (8.2%) | 905 (8.0%) |
| 30 to 34 Years | 1,006 (8.2%) | 790 (7.0%) |
| 35 to 39 Years | 940 (7.7%) | 731 (6.5%) |
| 40 to 44 Years | 670 (5.5%) | 738 (6.5%) |
| 45 to 49 Years | 921 (7.5%) | 508 (4.5%) |
| 50 to 54 Years | 939 (7.6%) | 894 (7.9%) |
| 55 to 59 Years | 782 (6.4%) | 804 (7.1%) |
| 60 to 64 Years | 758 (6.2%) | 957 (8.5%) |
| 65 to 69 Years | 998 (8.1%) | 940 (8.3%) |
| 70 to 74 Years | 633 (5.2%) | 553 (4.9%) |
| 75 to 79 Years | 289 (2.4%) | 389 (3.4%) |
| 80 to 84 Years | 222 (1.8%) | 261 (2.3%) |
| 85 Years and over | 126 (1.0%) | 423 (3.7%) |
| Total | 12,275 (100.0%) | 11,308 (100.0%) |
Families and Households in Jacksonville Beach
Median Family Size in Jacksonville Beach
The median family size in Jacksonville Beach is 2.74 persons per family, with married-couple families (4,752 | 78.8%) accounting for the largest median family size of 2.8 persons per family. On the other hand, single male/father families (369 | 6.1%) represent the smallest median family size with 2.18 persons per family.
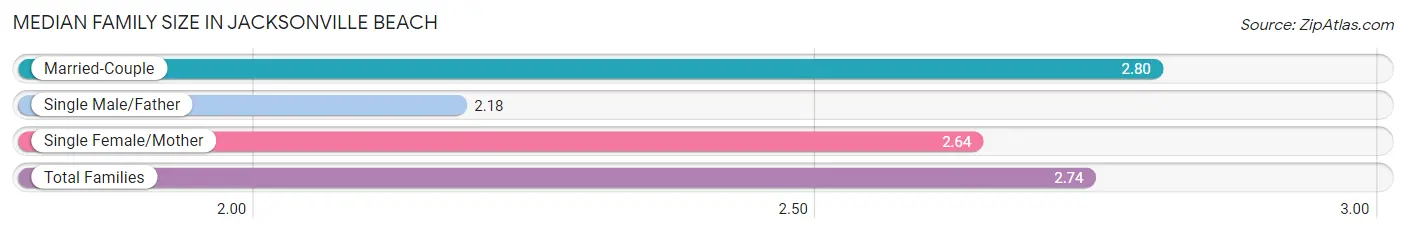
| Family Type | # Families | Family Size |
| Married-Couple | 4,752 (78.8%) | 2.80 |
| Single Male/Father | 369 (6.1%) | 2.18 |
| Single Female/Mother | 911 (15.1%) | 2.64 |
| Total Families | 6,032 (100.0%) | 2.74 |
Median Household Size in Jacksonville Beach
The median household size in Jacksonville Beach is 2.16 persons per household, with single female/mother households (911 | 8.4%) accounting for the largest median household size of 3.05 persons per household. non-family households (4,790 | 44.3%) represent the smallest median household size with 1.32 persons per household.
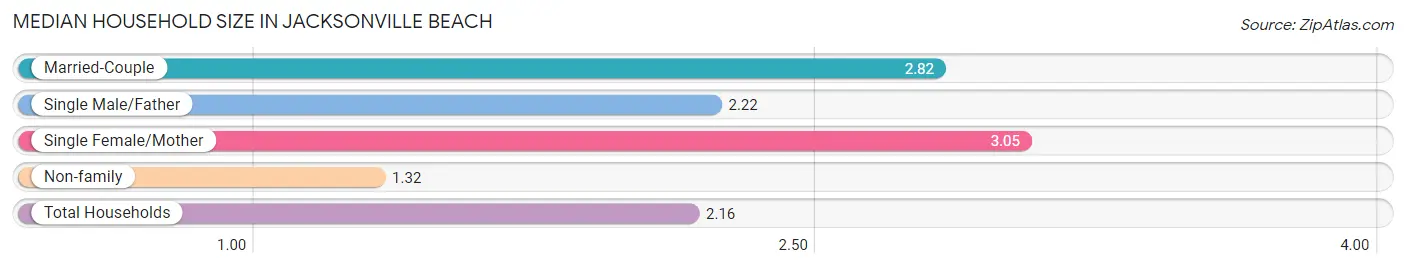
| Household Type | # Households | Household Size |
| Married-Couple | 4,752 (43.9%) | 2.82 |
| Single Male/Father | 369 (3.4%) | 2.22 |
| Single Female/Mother | 911 (8.4%) | 3.05 |
| Non-family | 4,790 (44.3%) | 1.32 |
| Total Households | 10,822 (100.0%) | 2.16 |
Household Size by Marriage Status in Jacksonville Beach
Out of a total of 10,822 households in Jacksonville Beach, 6,032 (55.7%) are family households, while 4,790 (44.3%) are nonfamily households. The most numerous type of family households are 2-person households, comprising 3,420, and the most common type of nonfamily households are 1-person households, comprising 3,616.
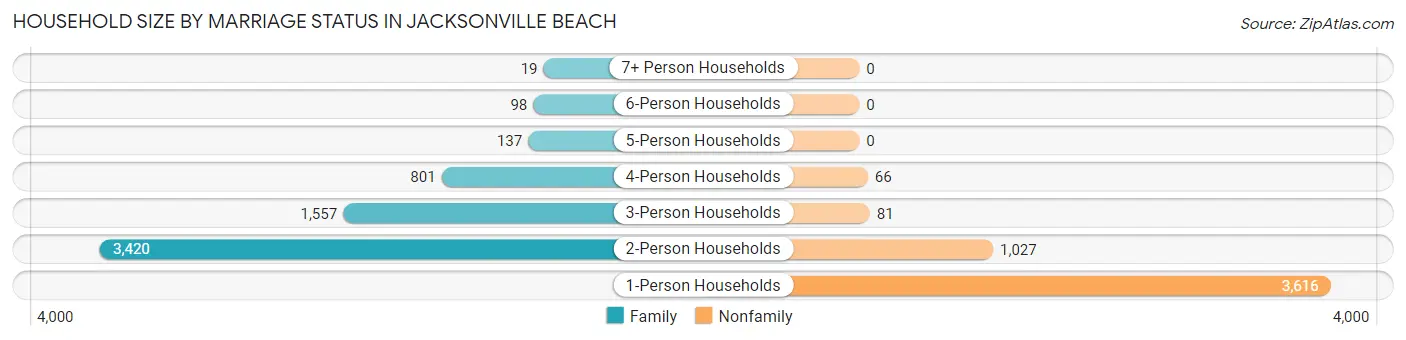
| Household Size | Family Households | Nonfamily Households |
| 1-Person Households | - | 3,616 (33.4%) |
| 2-Person Households | 3,420 (31.6%) | 1,027 (9.5%) |
| 3-Person Households | 1,557 (14.4%) | 81 (0.7%) |
| 4-Person Households | 801 (7.4%) | 66 (0.6%) |
| 5-Person Households | 137 (1.3%) | 0 (0.0%) |
| 6-Person Households | 98 (0.9%) | 0 (0.0%) |
| 7+ Person Households | 19 (0.2%) | 0 (0.0%) |
| Total | 6,032 (55.7%) | 4,790 (44.3%) |
Female Fertility in Jacksonville Beach
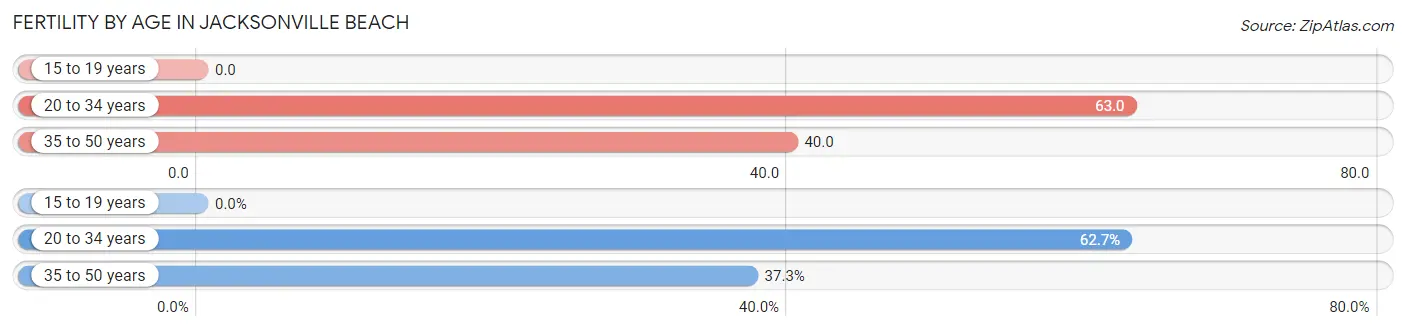
Fertility by Age in Jacksonville Beach
Average fertility rate in Jacksonville Beach is 48.0 births per 1,000 women. Women in the age bracket of 20 to 34 years have the highest fertility rate with 63.0 births per 1,000 women. Women in the age bracket of 20 to 34 years acount for 62.7% of all women with births.
| Age Bracket | Women with Births | Births / 1,000 Women |
| 15 to 19 years | 0 (0.0%) | 0.0 |
| 20 to 34 years | 158 (62.7%) | 63.0 |
| 35 to 50 years | 94 (37.3%) | 40.0 |
| Total | 252 (100.0%) | 48.0 |
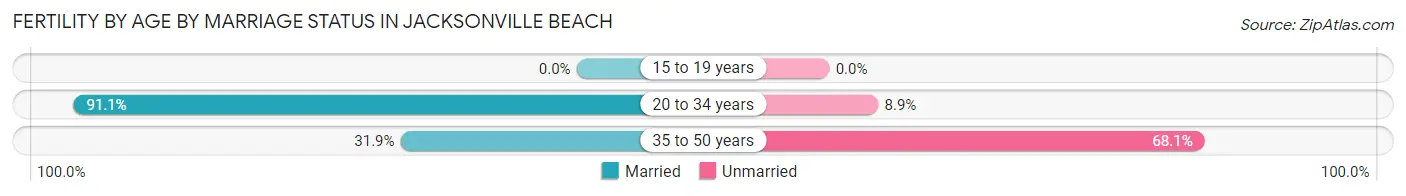
Fertility by Age by Marriage Status in Jacksonville Beach
69.0% of women with births (252) in Jacksonville Beach are married. The highest percentage of unmarried women with births falls into 35 to 50 years age bracket with 68.1% of them unmarried at the time of birth, while the lowest percentage of unmarried women with births belong to 20 to 34 years age bracket with 8.9% of them unmarried.
| Age Bracket | Married | Unmarried |
| 15 to 19 years | 0 (0.0%) | 0 (0.0%) |
| 20 to 34 years | 144 (91.1%) | 14 (8.9%) |
| 35 to 50 years | 30 (31.9%) | 64 (68.1%) |
| Total | 174 (69.1%) | 78 (30.9%) |
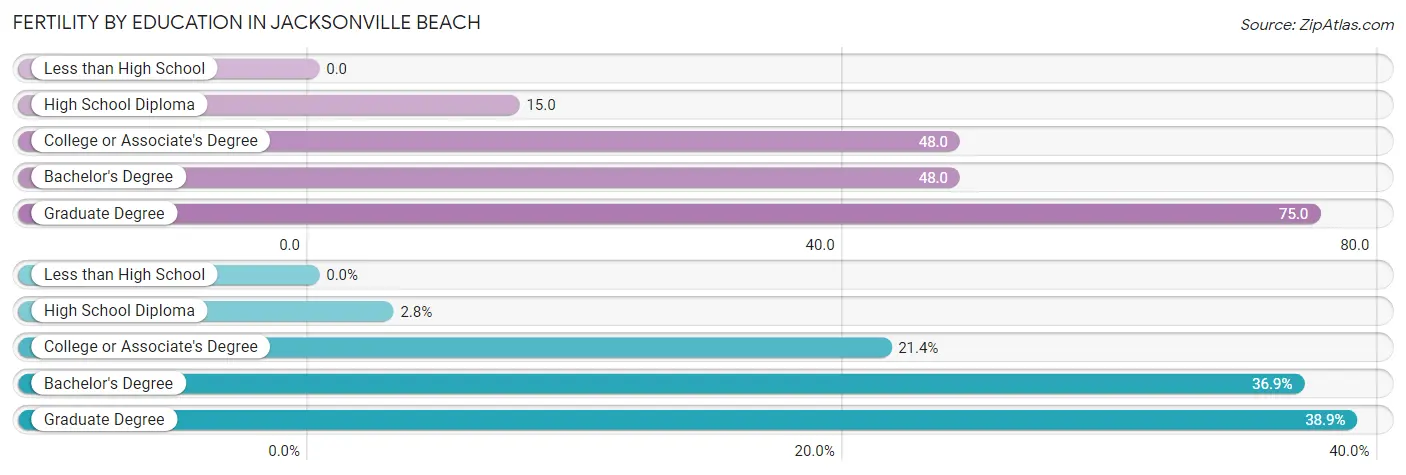
Fertility by Education in Jacksonville Beach
| Educational Attainment | Women with Births | Births / 1,000 Women |
| Less than High School | 0 (0.0%) | 0.0 |
| High School Diploma | 7 (2.8%) | 15.0 |
| College or Associate's Degree | 54 (21.4%) | 48.0 |
| Bachelor's Degree | 93 (36.9%) | 48.0 |
| Graduate Degree | 98 (38.9%) | 75.0 |
| Total | 252 (100.0%) | 48.0 |
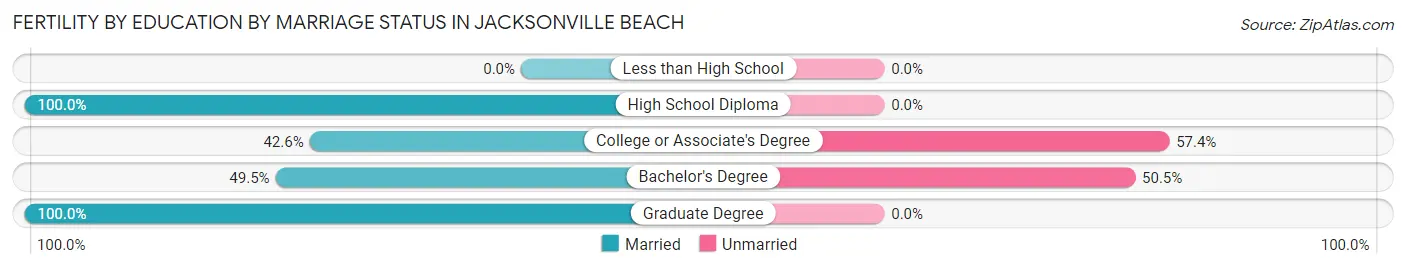
Fertility by Education by Marriage Status in Jacksonville Beach
30.9% of women with births in Jacksonville Beach are unmarried. Women with the educational attainment of high school diploma are most likely to be married with 100.0% of them married at childbirth, while women with the educational attainment of college or associate's degree are least likely to be married with 57.4% of them unmarried at childbirth.
| Educational Attainment | Married | Unmarried |
| Less than High School | 0 (0.0%) | 0 (0.0%) |
| High School Diploma | 7 (100.0%) | 0 (0.0%) |
| College or Associate's Degree | 23 (42.6%) | 31 (57.4%) |
| Bachelor's Degree | 46 (49.5%) | 47 (50.5%) |
| Graduate Degree | 98 (100.0%) | 0 (0.0%) |
| Total | 174 (69.1%) | 78 (30.9%) |
Income in Jacksonville Beach
Income Overview in Jacksonville Beach
Per Capita Income in Jacksonville Beach is $72,826, while median incomes of families and households are $134,643 and $109,649 respectively.
| Characteristic | Number | Measure |
| Per Capita Income | 23,583 | $72,826 |
| Median Family Income | 6,032 | $134,643 |
| Mean Family Income | 6,032 | $192,594 |
| Median Household Income | 10,822 | $109,649 |
| Mean Household Income | 10,822 | $156,395 |
| Income Deficit | 6,032 | $10,490 |
| Wage / Income Gap (%) | 23,583 | 23.37% |
| Wage / Income Gap ($) | 23,583 | 76.63¢ per $1 |
| Gini / Inequality Index | 23,583 | 0.48 |
Earnings by Sex in Jacksonville Beach
Average Earnings in Jacksonville Beach are $58,370, $70,077 for men and $53,702 for women, a difference of 23.4%.
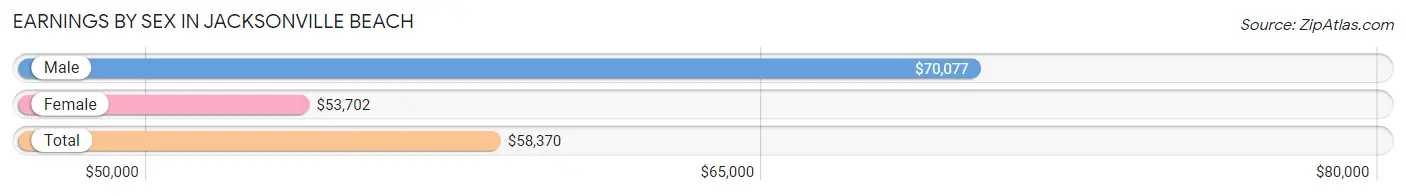
| Sex | Number | Average Earnings |
| Male | 8,205 (55.9%) | $70,077 |
| Female | 6,473 (44.1%) | $53,702 |
| Total | 14,678 (100.0%) | $58,370 |
Earnings by Sex by Income Bracket in Jacksonville Beach
The most common earnings brackets in Jacksonville Beach are $100,000+ for men (3,026 | 36.9%) and $100,000+ for women (1,375 | 21.2%).
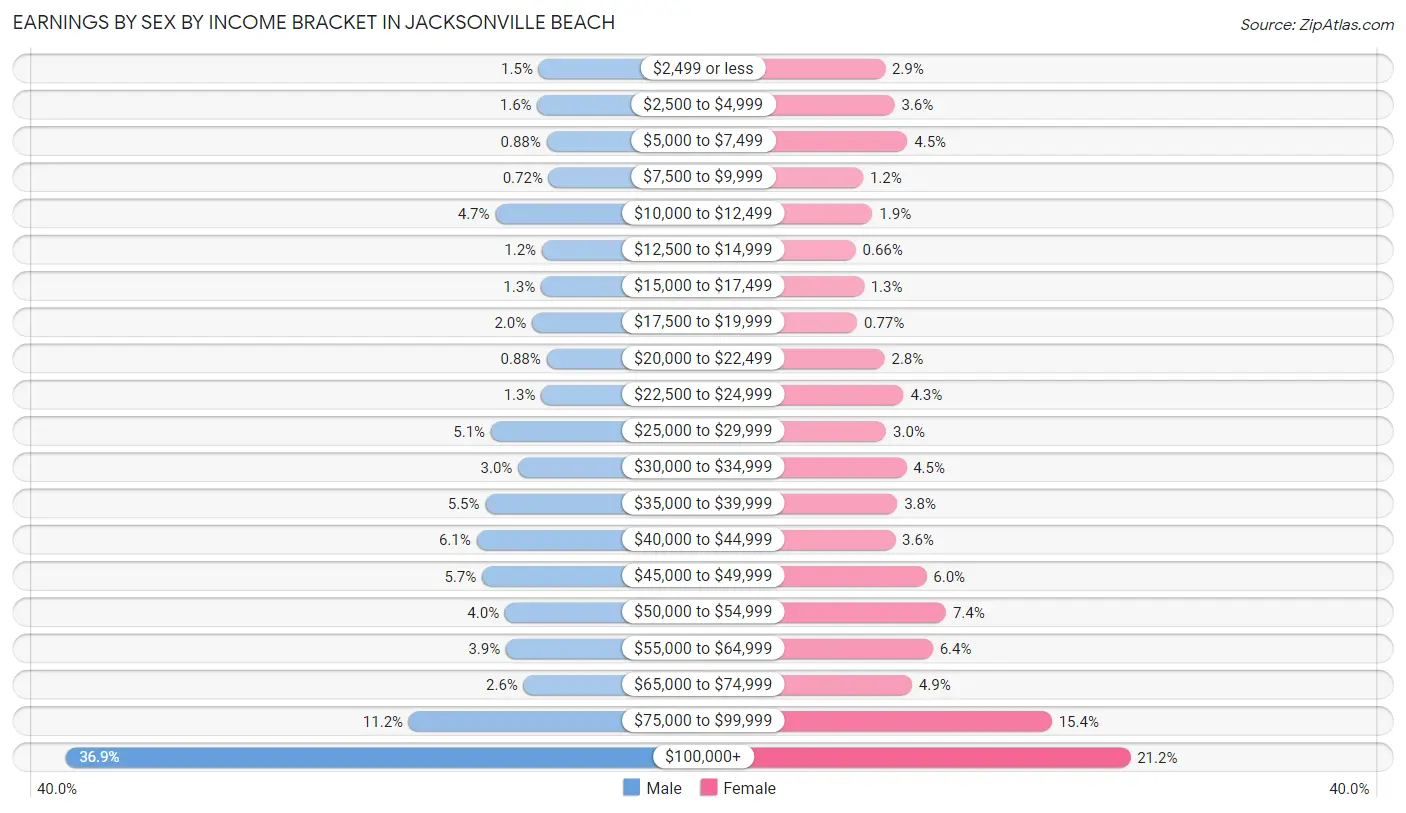
| Income | Male | Female |
| $2,499 or less | 121 (1.5%) | 185 (2.9%) |
| $2,500 to $4,999 | 129 (1.6%) | 232 (3.6%) |
| $5,000 to $7,499 | 72 (0.9%) | 294 (4.5%) |
| $7,500 to $9,999 | 59 (0.7%) | 78 (1.2%) |
| $10,000 to $12,499 | 387 (4.7%) | 124 (1.9%) |
| $12,500 to $14,999 | 101 (1.2%) | 43 (0.7%) |
| $15,000 to $17,499 | 107 (1.3%) | 82 (1.3%) |
| $17,500 to $19,999 | 162 (2.0%) | 50 (0.8%) |
| $20,000 to $22,499 | 72 (0.9%) | 183 (2.8%) |
| $22,500 to $24,999 | 105 (1.3%) | 275 (4.3%) |
| $25,000 to $29,999 | 414 (5.1%) | 191 (2.9%) |
| $30,000 to $34,999 | 247 (3.0%) | 288 (4.4%) |
| $35,000 to $39,999 | 449 (5.5%) | 245 (3.8%) |
| $40,000 to $44,999 | 503 (6.1%) | 234 (3.6%) |
| $45,000 to $49,999 | 469 (5.7%) | 386 (6.0%) |
| $50,000 to $54,999 | 328 (4.0%) | 481 (7.4%) |
| $55,000 to $64,999 | 322 (3.9%) | 417 (6.4%) |
| $65,000 to $74,999 | 213 (2.6%) | 316 (4.9%) |
| $75,000 to $99,999 | 919 (11.2%) | 994 (15.4%) |
| $100,000+ | 3,026 (36.9%) | 1,375 (21.2%) |
| Total | 8,205 (100.0%) | 6,473 (100.0%) |
Earnings by Sex by Educational Attainment in Jacksonville Beach
Average earnings in Jacksonville Beach are $77,320 for men and $59,208 for women, a difference of 23.4%. Men with an educational attainment of graduate degree enjoy the highest average annual earnings of $119,107, while those with less than high school education earn the least with $36,286. Women with an educational attainment of graduate degree earn the most with the average annual earnings of $89,421, while those with less than high school education have the smallest earnings of $31,316.
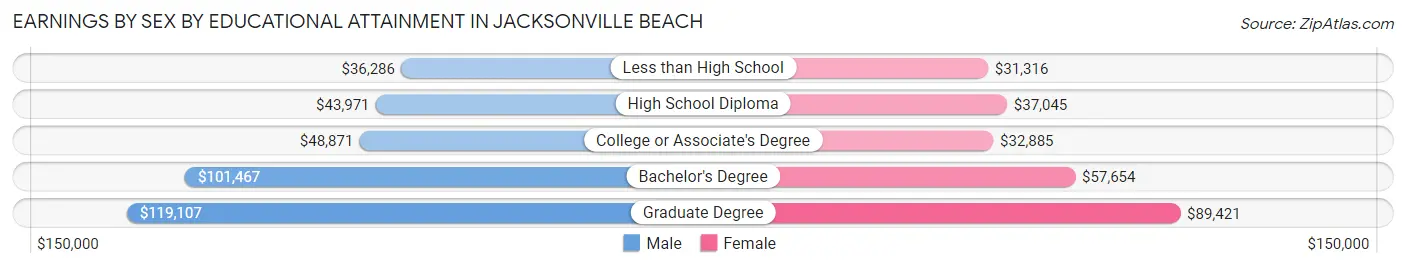
| Educational Attainment | Male Income | Female Income |
| Less than High School | $36,286 | $31,316 |
| High School Diploma | $43,971 | $37,045 |
| College or Associate's Degree | $48,871 | $32,885 |
| Bachelor's Degree | $101,467 | $57,654 |
| Graduate Degree | $119,107 | $89,421 |
| Total | $77,320 | $59,208 |
Family Income in Jacksonville Beach
Family Income Brackets in Jacksonville Beach
According to the Jacksonville Beach family income data, there are 1,798 families falling into the $200,000+ income range, which is the most common income bracket and makes up 29.8% of all families. Conversely, the $10,000 to $14,999 income bracket is the least frequent group with only 42 families (0.7%) belonging to this category.
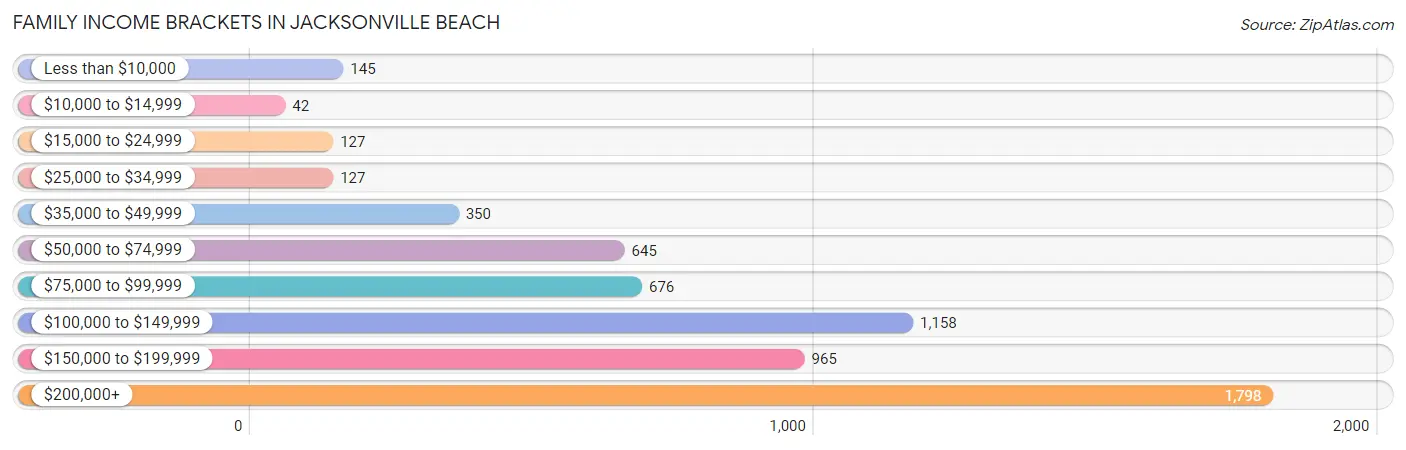
| Income Bracket | # Families | % Families |
| Less than $10,000 | 145 | 2.4% |
| $10,000 to $14,999 | 42 | 0.7% |
| $15,000 to $24,999 | 127 | 2.1% |
| $25,000 to $34,999 | 127 | 2.1% |
| $35,000 to $49,999 | 350 | 5.8% |
| $50,000 to $74,999 | 645 | 10.7% |
| $75,000 to $99,999 | 676 | 11.2% |
| $100,000 to $149,999 | 1,158 | 19.2% |
| $150,000 to $199,999 | 965 | 16.0% |
| $200,000+ | 1,798 | 29.8% |
Family Income by Famaliy Size in Jacksonville Beach
6-person families (98 | 1.6%) account for the highest median family income in Jacksonville Beach with $234,659 per family, while 2-person families (3,766 | 62.4%) have the highest median income of $59,200 per family member.
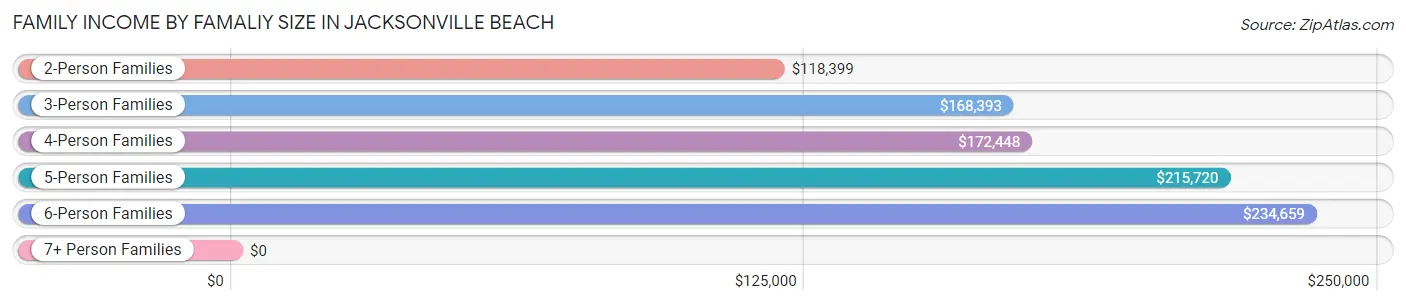
| Income Bracket | # Families | Median Income |
| 2-Person Families | 3,766 (62.4%) | $118,399 |
| 3-Person Families | 1,261 (20.9%) | $168,393 |
| 4-Person Families | 751 (12.4%) | $172,448 |
| 5-Person Families | 137 (2.3%) | $215,720 |
| 6-Person Families | 98 (1.6%) | $234,659 |
| 7+ Person Families | 19 (0.3%) | $0 |
| Total | 6,032 (100.0%) | $134,643 |
Family Income by Number of Earners in Jacksonville Beach
The median family income in Jacksonville Beach is $134,643, with families comprising 3+ earners (332) having the highest median family income of $206,250, while families with no earners (748) have the lowest median family income of $88,750, accounting for 5.5% and 12.4% of families, respectively.
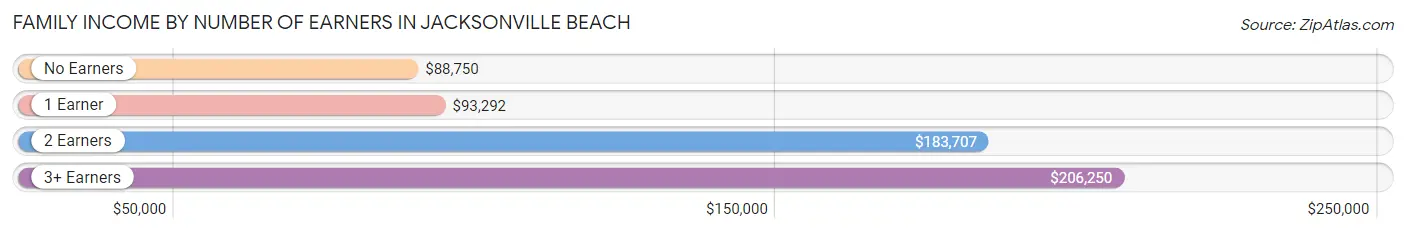
| Number of Earners | # Families | Median Income |
| No Earners | 748 (12.4%) | $88,750 |
| 1 Earner | 1,905 (31.6%) | $93,292 |
| 2 Earners | 3,047 (50.5%) | $183,707 |
| 3+ Earners | 332 (5.5%) | $206,250 |
| Total | 6,032 (100.0%) | $134,643 |
Household Income in Jacksonville Beach
Household Income Brackets in Jacksonville Beach
With 2,392 households falling in the category, the $200,000+ income range is the most frequent in Jacksonville Beach, accounting for 22.1% of all households. In contrast, only 195 households (1.8%) fall into the $10,000 to $14,999 income bracket, making it the least populous group.
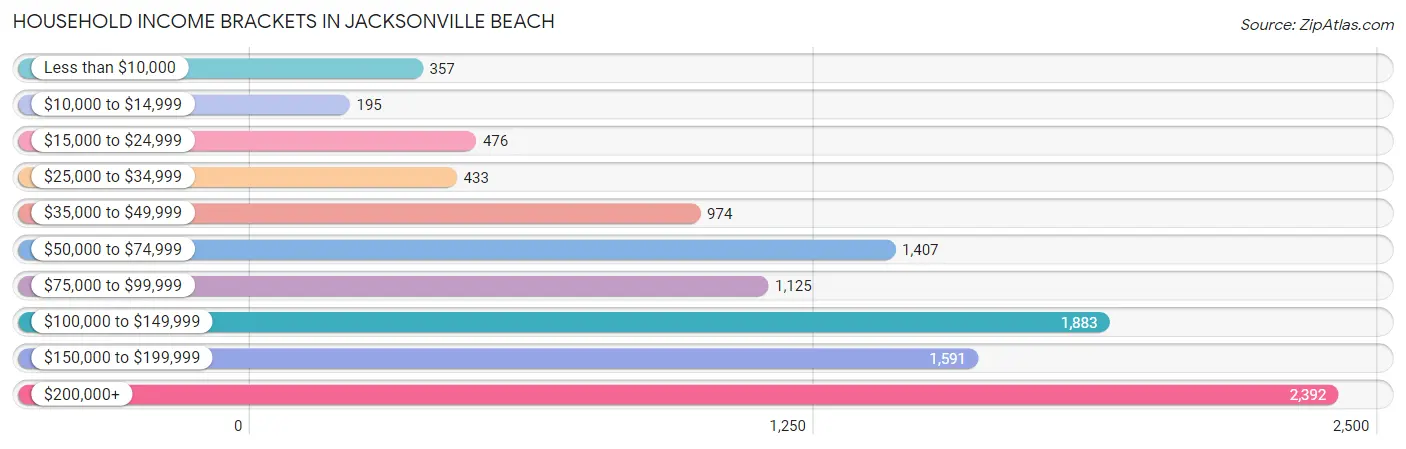
| Income Bracket | # Households | % Households |
| Less than $10,000 | 357 | 3.3% |
| $10,000 to $14,999 | 195 | 1.8% |
| $15,000 to $24,999 | 476 | 4.4% |
| $25,000 to $34,999 | 433 | 4.0% |
| $35,000 to $49,999 | 974 | 9.0% |
| $50,000 to $74,999 | 1,407 | 13.0% |
| $75,000 to $99,999 | 1,125 | 10.4% |
| $100,000 to $149,999 | 1,883 | 17.4% |
| $150,000 to $199,999 | 1,591 | 14.7% |
| $200,000+ | 2,392 | 22.1% |
Household Income by Householder Age in Jacksonville Beach
The median household income in Jacksonville Beach is $109,649, with the highest median household income of $155,563 found in the 45 to 64 years age bracket for the primary householder. A total of 3,874 households (35.8%) fall into this category. Meanwhile, the 15 to 24 years age bracket for the primary householder has the lowest median household income of $58,875, with 209 households (1.9%) in this group.
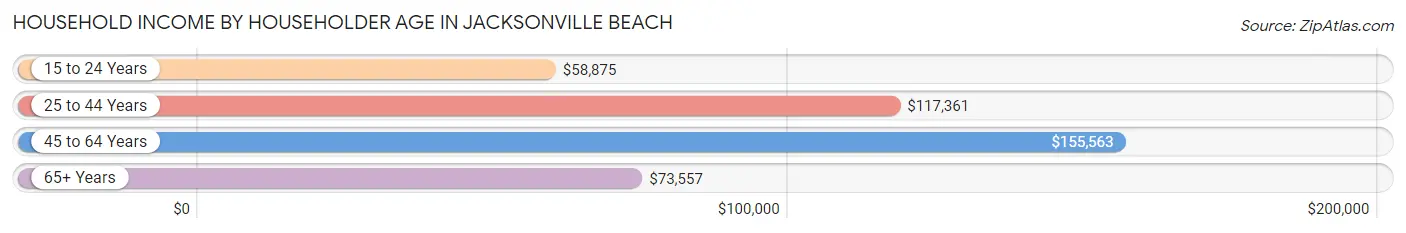
| Income Bracket | # Households | Median Income |
| 15 to 24 Years | 209 (1.9%) | $58,875 |
| 25 to 44 Years | 3,828 (35.4%) | $117,361 |
| 45 to 64 Years | 3,874 (35.8%) | $155,563 |
| 65+ Years | 2,911 (26.9%) | $73,557 |
| Total | 10,822 (100.0%) | $109,649 |
Poverty in Jacksonville Beach
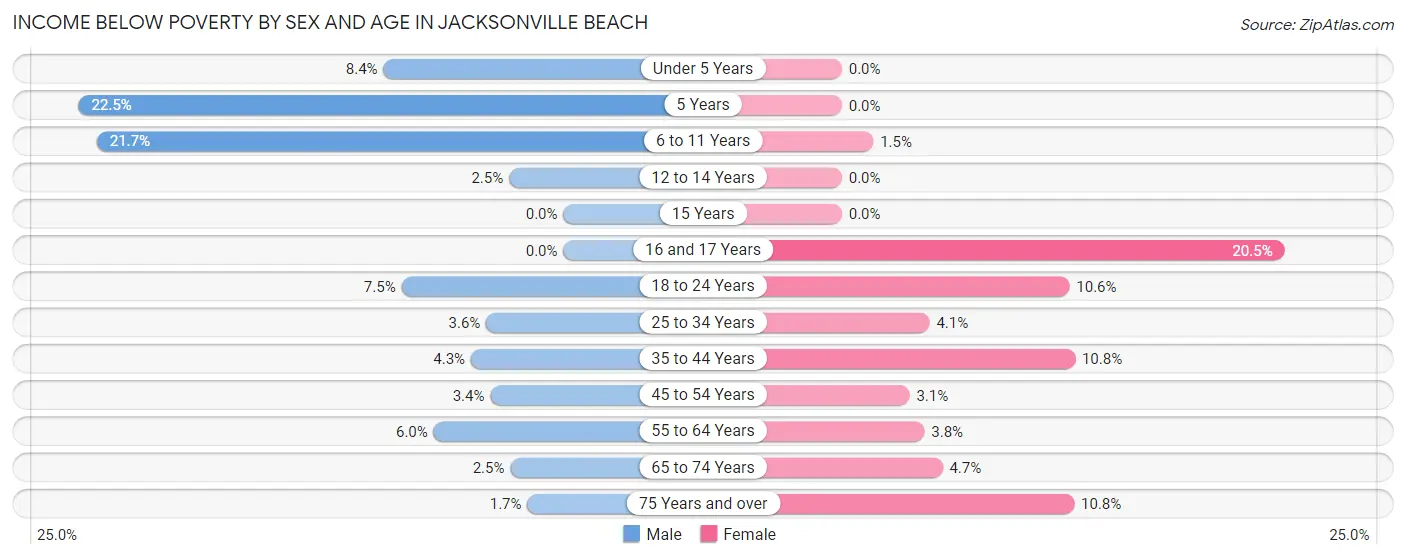
Income Below Poverty by Sex and Age in Jacksonville Beach
With 5.2% poverty level for males and 6.0% for females among the residents of Jacksonville Beach, 5 year old males and 16 and 17 year old females are the most vulnerable to poverty, with 27 males (22.5%) and 46 females (20.5%) in their respective age groups living below the poverty level.
| Age Bracket | Male | Female |
| Under 5 Years | 35 (8.4%) | 0 (0.0%) |
| 5 Years | 27 (22.5%) | 0 (0.0%) |
| 6 to 11 Years | 192 (21.6%) | 9 (1.5%) |
| 12 to 14 Years | 10 (2.5%) | 0 (0.0%) |
| 15 Years | 0 (0.0%) | 0 (0.0%) |
| 16 and 17 Years | 0 (0.0%) | 46 (20.5%) |
| 18 to 24 Years | 29 (7.5%) | 98 (10.6%) |
| 25 to 34 Years | 72 (3.6%) | 69 (4.1%) |
| 35 to 44 Years | 69 (4.3%) | 159 (10.8%) |
| 45 to 54 Years | 63 (3.4%) | 44 (3.1%) |
| 55 to 64 Years | 91 (6.0%) | 67 (3.8%) |
| 65 to 74 Years | 40 (2.5%) | 68 (4.7%) |
| 75 Years and over | 10 (1.7%) | 106 (10.8%) |
| Total | 638 (5.2%) | 666 (6.0%) |
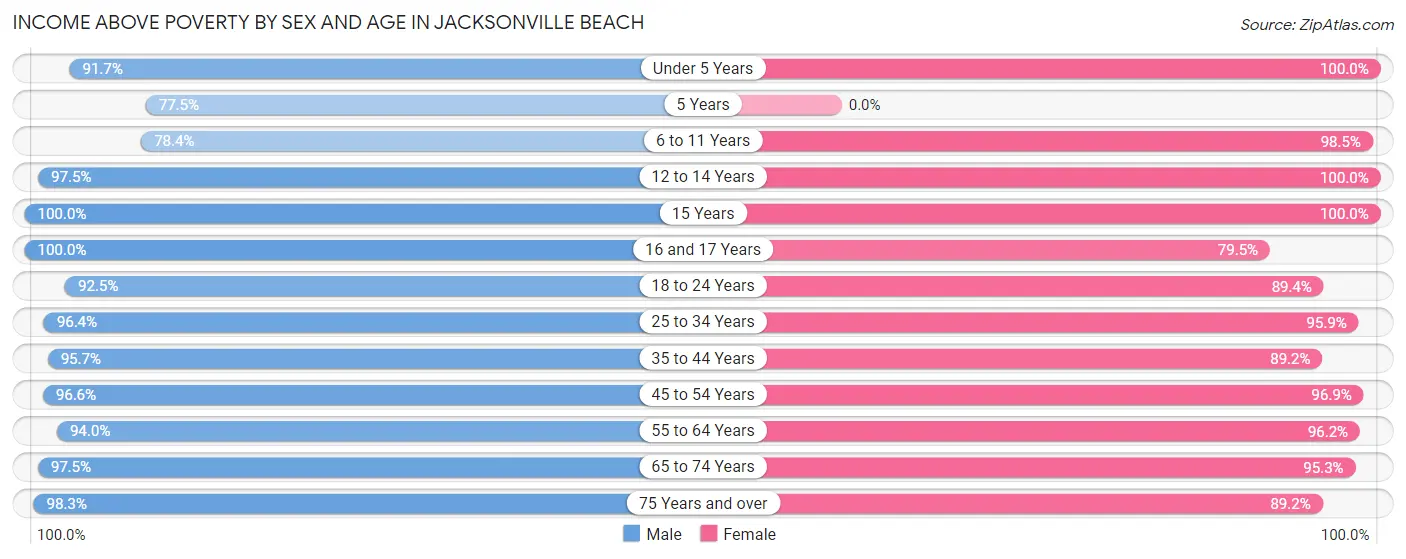
Income Above Poverty by Sex and Age in Jacksonville Beach
According to the poverty statistics in Jacksonville Beach, males aged 15 years and females aged under 5 years are the age groups that are most secure financially, with 100.0% of males and 100.0% of females in these age groups living above the poverty line.
| Age Bracket | Male | Female |
| Under 5 Years | 384 (91.6%) | 413 (100.0%) |
| 5 Years | 93 (77.5%) | 0 (0.0%) |
| 6 to 11 Years | 695 (78.3%) | 607 (98.5%) |
| 12 to 14 Years | 387 (97.5%) | 222 (100.0%) |
| 15 Years | 186 (100.0%) | 12 (100.0%) |
| 16 and 17 Years | 572 (100.0%) | 178 (79.5%) |
| 18 to 24 Years | 357 (92.5%) | 830 (89.4%) |
| 25 to 34 Years | 1,939 (96.4%) | 1,626 (95.9%) |
| 35 to 44 Years | 1,541 (95.7%) | 1,310 (89.2%) |
| 45 to 54 Years | 1,797 (96.6%) | 1,358 (96.9%) |
| 55 to 64 Years | 1,420 (94.0%) | 1,681 (96.2%) |
| 65 to 74 Years | 1,585 (97.5%) | 1,389 (95.3%) |
| 75 Years and over | 589 (98.3%) | 877 (89.2%) |
| Total | 11,545 (94.8%) | 10,503 (94.0%) |
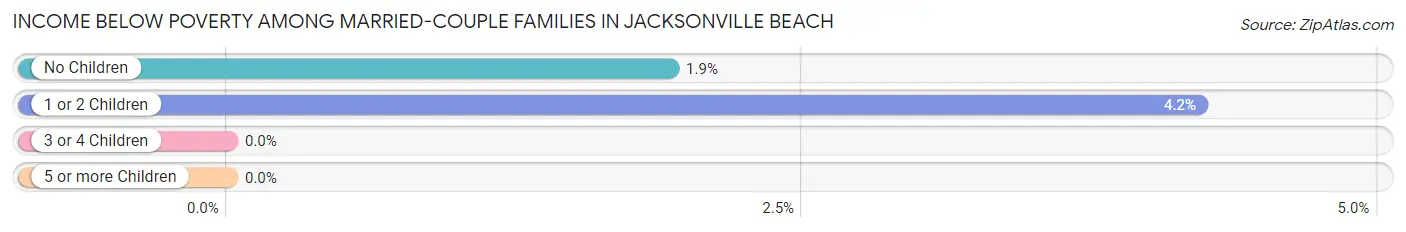
Income Below Poverty Among Married-Couple Families in Jacksonville Beach
The poverty statistics for married-couple families in Jacksonville Beach show that 2.5% or 119 of the total 4,752 families live below the poverty line. Families with 1 or 2 children have the highest poverty rate of 4.2%, comprising of 57 families. On the other hand, families with 3 or 4 children have the lowest poverty rate of 0.0%, which includes 0 families.
| Children | Above Poverty | Below Poverty |
| No Children | 3,162 (98.1%) | 62 (1.9%) |
| 1 or 2 Children | 1,294 (95.8%) | 57 (4.2%) |
| 3 or 4 Children | 177 (100.0%) | 0 (0.0%) |
| 5 or more Children | 0 (0.0%) | 0 (0.0%) |
| Total | 4,633 (97.5%) | 119 (2.5%) |
Income Below Poverty Among Single-Parent Households in Jacksonville Beach
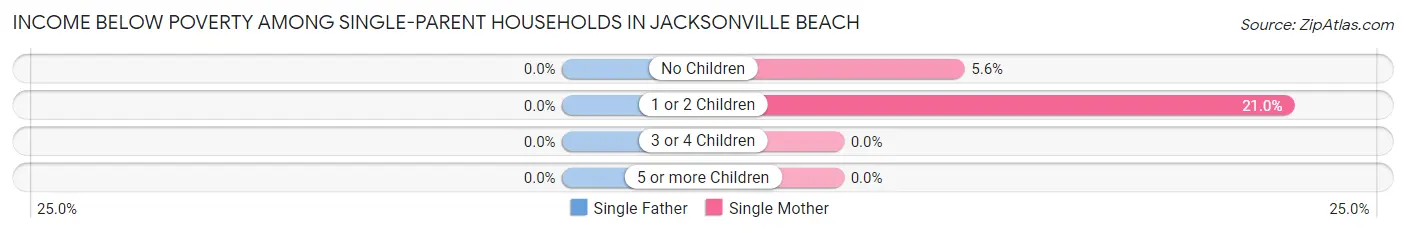
| Children | Single Father | Single Mother |
| No Children | 0 (0.0%) | 19 (5.6%) |
| 1 or 2 Children | 0 (0.0%) | 120 (21.0%) |
| 3 or 4 Children | 0 (0.0%) | 0 (0.0%) |
| 5 or more Children | 0 (0.0%) | 0 (0.0%) |
| Total | 0 (0.0%) | 139 (15.3%) |
Income Below Poverty Among Married-Couple vs Single-Parent Households in Jacksonville Beach
The poverty data for Jacksonville Beach shows that 119 of the married-couple family households (2.5%) and 139 of the single-parent households (10.9%) are living below the poverty level. Within the married-couple family households, those with 1 or 2 children have the highest poverty rate, with 57 households (4.2%) falling below the poverty line. Among the single-parent households, those with 1 or 2 children have the highest poverty rate, with 120 household (16.4%) living below poverty.
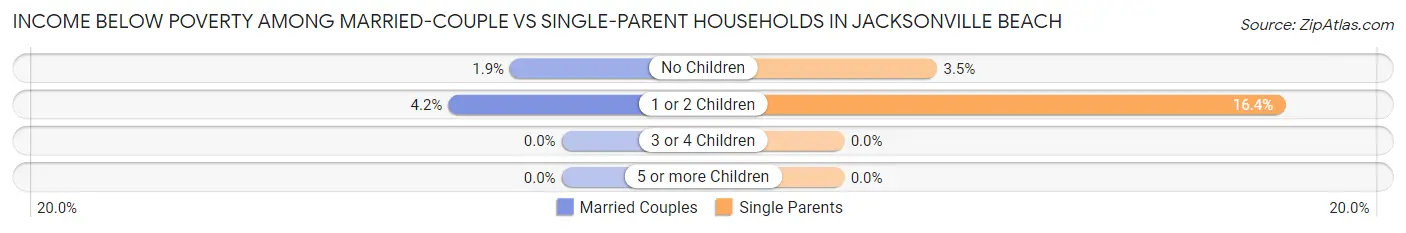
| Children | Married-Couple Families | Single-Parent Households |
| No Children | 62 (1.9%) | 19 (3.5%) |
| 1 or 2 Children | 57 (4.2%) | 120 (16.4%) |
| 3 or 4 Children | 0 (0.0%) | 0 (0.0%) |
| 5 or more Children | 0 (0.0%) | 0 (0.0%) |
| Total | 119 (2.5%) | 139 (10.9%) |
Employment Characteristics in Jacksonville Beach
Employment by Class of Employer in Jacksonville Beach
Among the 13,661 employed individuals in Jacksonville Beach, private company employees (8,587 | 62.9%), not-for-profit organizations (1,832 | 13.4%), and self-employed (incorporated) (1,008 | 7.4%) make up the most common classes of employment.
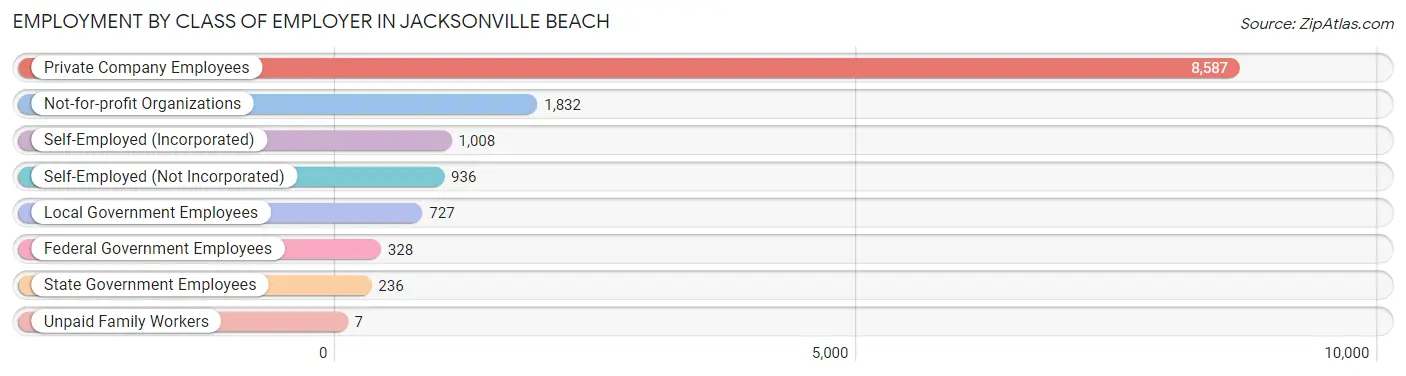
| Employer Class | # Employees | % Employees |
| Private Company Employees | 8,587 | 62.9% |
| Self-Employed (Incorporated) | 1,008 | 7.4% |
| Self-Employed (Not Incorporated) | 936 | 6.9% |
| Not-for-profit Organizations | 1,832 | 13.4% |
| Local Government Employees | 727 | 5.3% |
| State Government Employees | 236 | 1.7% |
| Federal Government Employees | 328 | 2.4% |
| Unpaid Family Workers | 7 | 0.1% |
| Total | 13,661 | 100.0% |
Employment Status by Age in Jacksonville Beach
According to the labor force statistics for Jacksonville Beach, out of the total population over 16 years of age (20,292), 69.2% or 14,042 individuals are in the labor force, with 2.1% or 295 of them unemployed. The age group with the highest labor force participation rate is 30 to 34 years, with 95.4% or 1,713 individuals in the labor force. Within the labor force, the 60 to 64 years age range has the highest percentage of unemployed individuals, with 7.9% or 81 of them being unemployed.
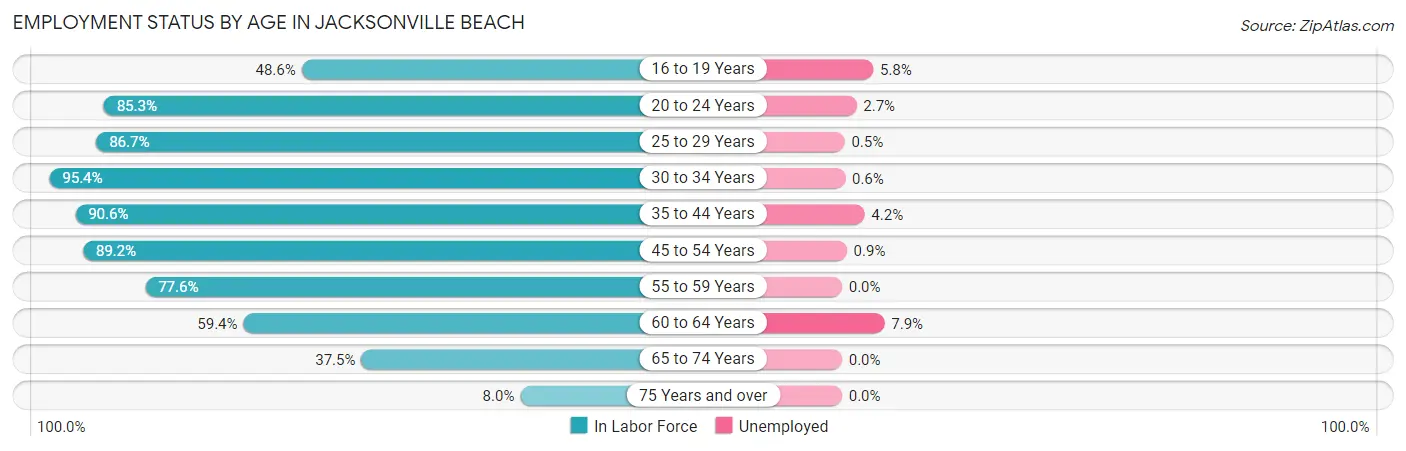
| Age Bracket | In Labor Force | Unemployed |
| 16 to 19 Years | 502 (48.6%) | 29 (5.8%) |
| 20 to 24 Years | 920 (85.3%) | 25 (2.7%) |
| 25 to 29 Years | 1,656 (86.7%) | 8 (0.5%) |
| 30 to 34 Years | 1,713 (95.4%) | 10 (0.6%) |
| 35 to 44 Years | 2,790 (90.6%) | 117 (4.2%) |
| 45 to 54 Years | 2,910 (89.2%) | 26 (0.9%) |
| 55 to 59 Years | 1,231 (77.6%) | 0 (0.0%) |
| 60 to 64 Years | 1,019 (59.4%) | 81 (7.9%) |
| 65 to 74 Years | 1,172 (37.5%) | 0 (0.0%) |
| 75 Years and over | 137 (8.0%) | 0 (0.0%) |
| Total | 14,042 (69.2%) | 295 (2.1%) |
Employment Status by Educational Attainment in Jacksonville Beach
According to labor force statistics for Jacksonville Beach, 84.8% of individuals (11,319) out of the total population between 25 and 64 years of age (13,348) are in the labor force, with 2.2% or 249 of them being unemployed. The group with the highest labor force participation rate are those with the educational attainment of bachelor's degree or higher, with 87.3% or 7,515 individuals in the labor force. Within the labor force, individuals with high school diploma education have the highest percentage of unemployment, with 3.3% or 49 of them being unemployed.
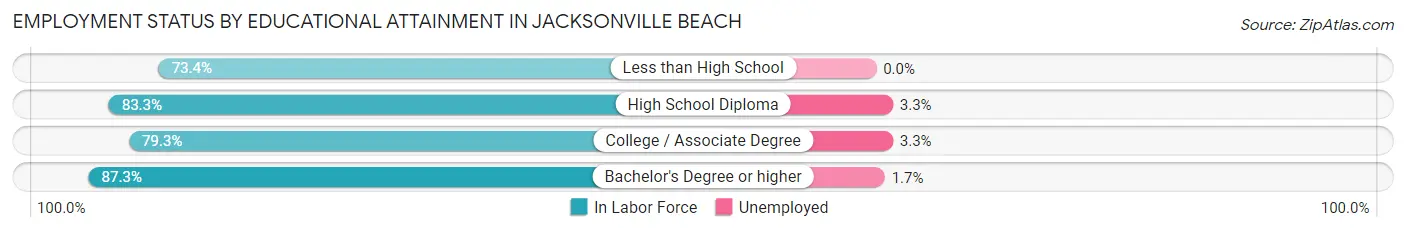
| Educational Attainment | In Labor Force | Unemployed |
| Less than High School | 293 (73.4%) | 0 (0.0%) |
| High School Diploma | 1,479 (83.3%) | 59 (3.3%) |
| College / Associate Degree | 2,035 (79.3%) | 85 (3.3%) |
| Bachelor's Degree or higher | 7,515 (87.3%) | 146 (1.7%) |
| Total | 11,319 (84.8%) | 294 (2.2%) |
Employment Occupations by Sex in Jacksonville Beach
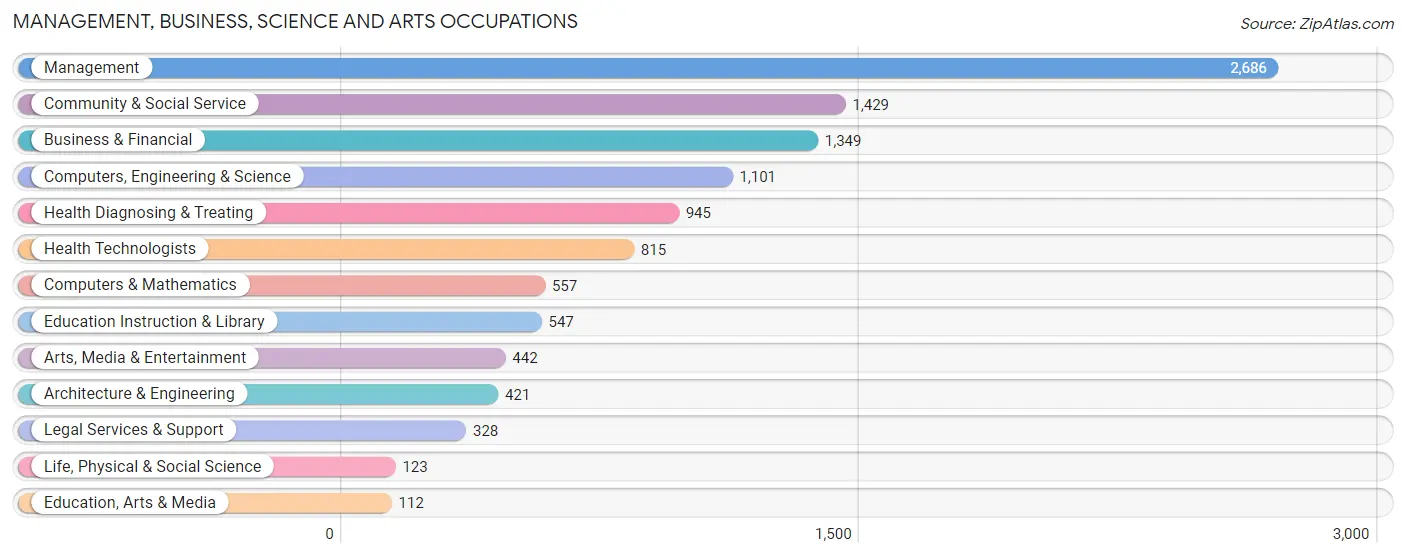
Management, Business, Science and Arts Occupations
The most common Management, Business, Science and Arts occupations in Jacksonville Beach are Management (2,686 | 19.7%), Community & Social Service (1,429 | 10.5%), Business & Financial (1,349 | 9.9%), Computers, Engineering & Science (1,101 | 8.1%), and Health Diagnosing & Treating (945 | 6.9%).
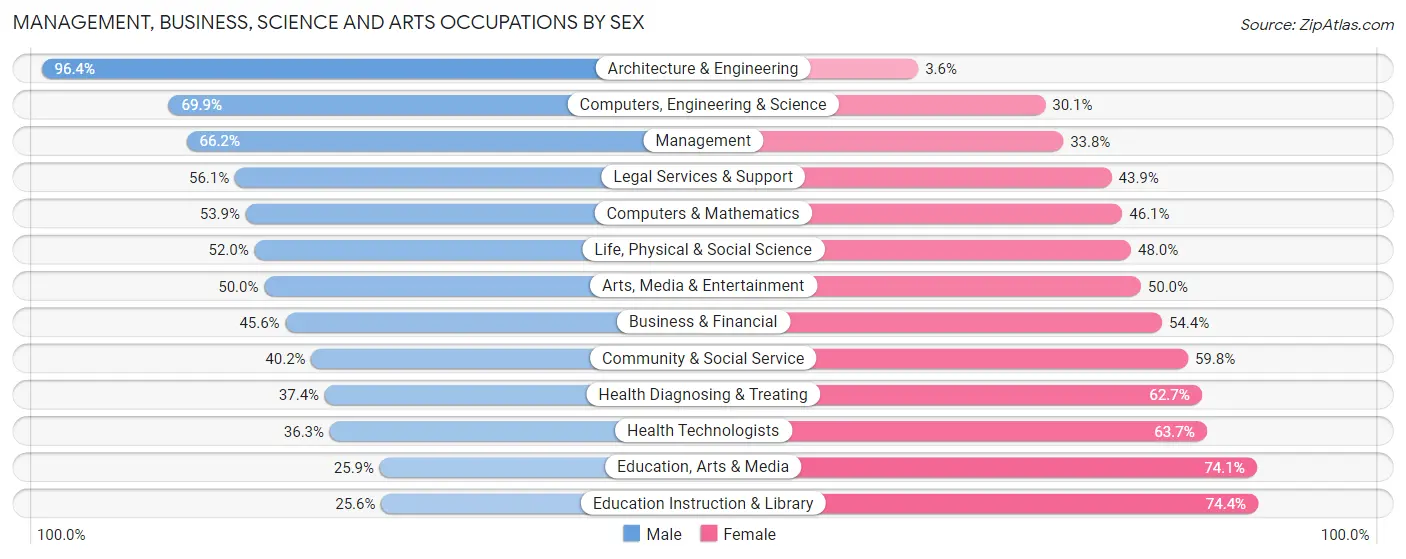
Management, Business, Science and Arts Occupations by Sex
Within the Management, Business, Science and Arts occupations in Jacksonville Beach, the most male-oriented occupations are Architecture & Engineering (96.4%), Computers, Engineering & Science (69.9%), and Management (66.2%), while the most female-oriented occupations are Education Instruction & Library (74.4%), Education, Arts & Media (74.1%), and Health Technologists (63.7%).
| Occupation | Male | Female |
| Management | 1,778 (66.2%) | 908 (33.8%) |
| Business & Financial | 615 (45.6%) | 734 (54.4%) |
| Computers, Engineering & Science | 770 (69.9%) | 331 (30.1%) |
| Computers & Mathematics | 300 (53.9%) | 257 (46.1%) |
| Architecture & Engineering | 406 (96.4%) | 15 (3.6%) |
| Life, Physical & Social Science | 64 (52.0%) | 59 (48.0%) |
| Community & Social Service | 574 (40.2%) | 855 (59.8%) |
| Education, Arts & Media | 29 (25.9%) | 83 (74.1%) |
| Legal Services & Support | 184 (56.1%) | 144 (43.9%) |
| Education Instruction & Library | 140 (25.6%) | 407 (74.4%) |
| Arts, Media & Entertainment | 221 (50.0%) | 221 (50.0%) |
| Health Diagnosing & Treating | 353 (37.3%) | 592 (62.6%) |
| Health Technologists | 296 (36.3%) | 519 (63.7%) |
| Total (Category) | 4,090 (54.5%) | 3,420 (45.5%) |
| Total (Overall) | 7,557 (55.4%) | 6,077 (44.6%) |
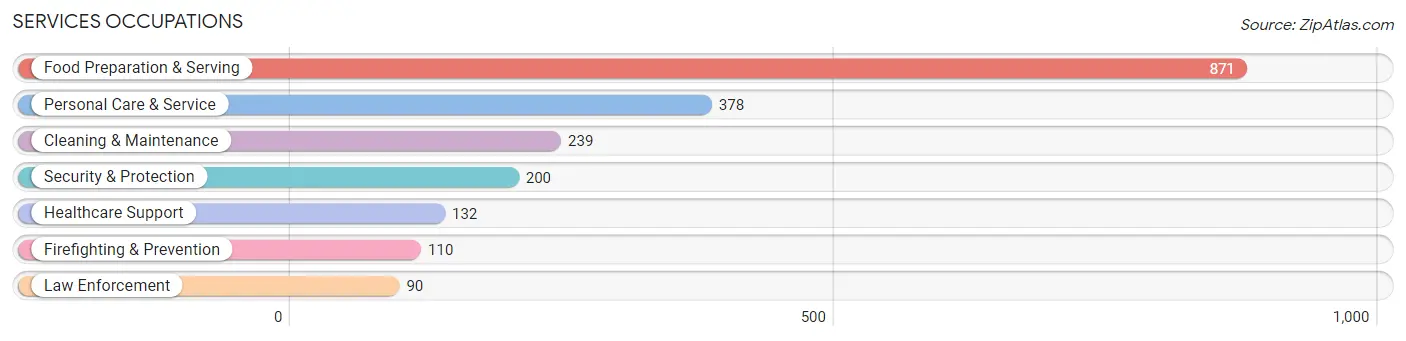
Services Occupations
The most common Services occupations in Jacksonville Beach are Food Preparation & Serving (871 | 6.4%), Personal Care & Service (378 | 2.8%), Cleaning & Maintenance (239 | 1.8%), Security & Protection (200 | 1.5%), and Healthcare Support (132 | 1.0%).
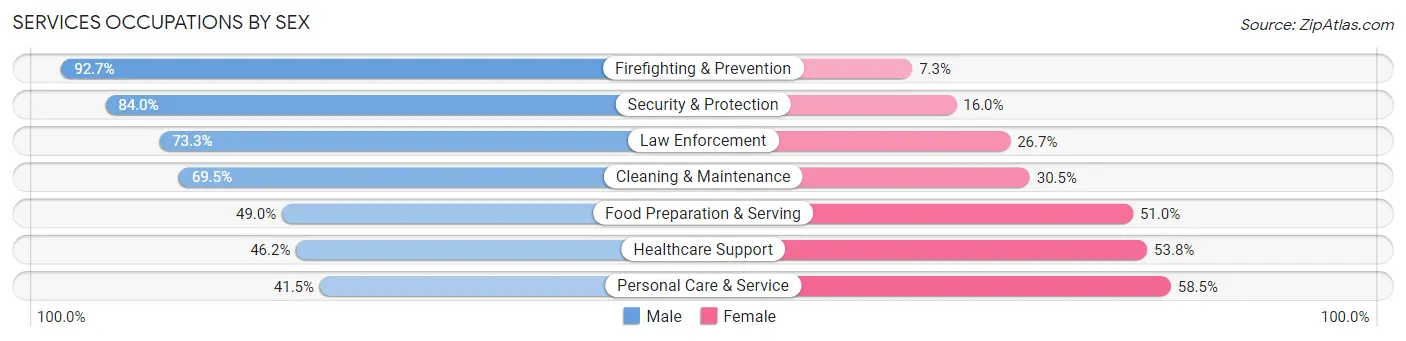
Services Occupations by Sex
Within the Services occupations in Jacksonville Beach, the most male-oriented occupations are Firefighting & Prevention (92.7%), Security & Protection (84.0%), and Law Enforcement (73.3%), while the most female-oriented occupations are Personal Care & Service (58.5%), Healthcare Support (53.8%), and Food Preparation & Serving (51.0%).
| Occupation | Male | Female |
| Healthcare Support | 61 (46.2%) | 71 (53.8%) |
| Security & Protection | 168 (84.0%) | 32 (16.0%) |
| Firefighting & Prevention | 102 (92.7%) | 8 (7.3%) |
| Law Enforcement | 66 (73.3%) | 24 (26.7%) |
| Food Preparation & Serving | 427 (49.0%) | 444 (51.0%) |
| Cleaning & Maintenance | 166 (69.5%) | 73 (30.5%) |
| Personal Care & Service | 157 (41.5%) | 221 (58.5%) |
| Total (Category) | 979 (53.8%) | 841 (46.2%) |
| Total (Overall) | 7,557 (55.4%) | 6,077 (44.6%) |
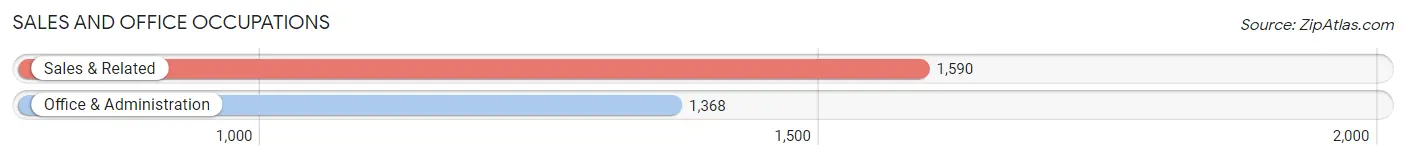
Sales and Office Occupations
The most common Sales and Office occupations in Jacksonville Beach are Sales & Related (1,590 | 11.7%), and Office & Administration (1,368 | 10.0%).
Sales and Office Occupations by Sex
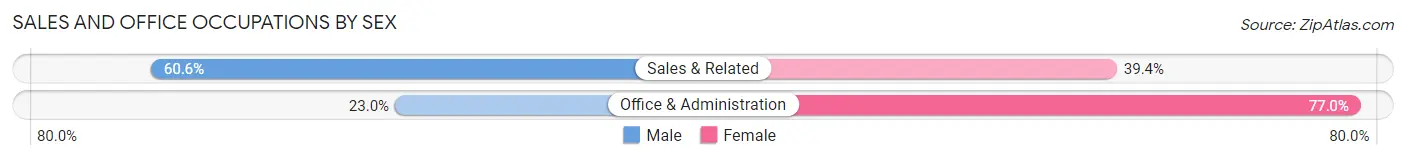
| Occupation | Male | Female |
| Sales & Related | 963 (60.6%) | 627 (39.4%) |
| Office & Administration | 315 (23.0%) | 1,053 (77.0%) |
| Total (Category) | 1,278 (43.2%) | 1,680 (56.8%) |
| Total (Overall) | 7,557 (55.4%) | 6,077 (44.6%) |
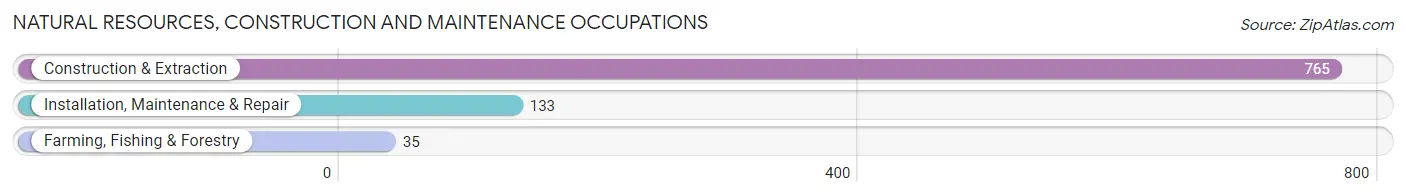
Natural Resources, Construction and Maintenance Occupations
The most common Natural Resources, Construction and Maintenance occupations in Jacksonville Beach are Construction & Extraction (765 | 5.6%), Installation, Maintenance & Repair (133 | 1.0%), and Farming, Fishing & Forestry (35 | 0.3%).
Natural Resources, Construction and Maintenance Occupations by Sex
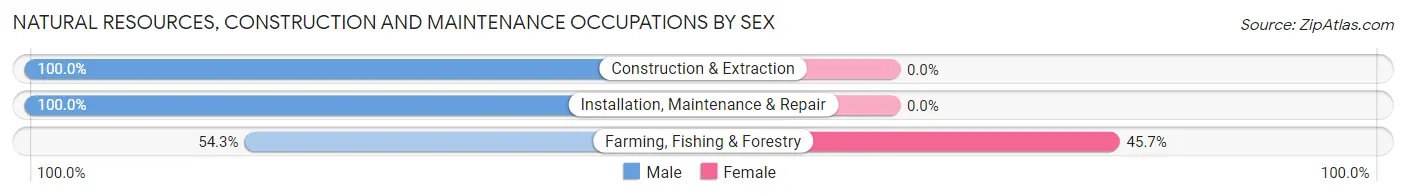
| Occupation | Male | Female |
| Farming, Fishing & Forestry | 19 (54.3%) | 16 (45.7%) |
| Construction & Extraction | 765 (100.0%) | 0 (0.0%) |
| Installation, Maintenance & Repair | 133 (100.0%) | 0 (0.0%) |
| Total (Category) | 917 (98.3%) | 16 (1.7%) |
| Total (Overall) | 7,557 (55.4%) | 6,077 (44.6%) |
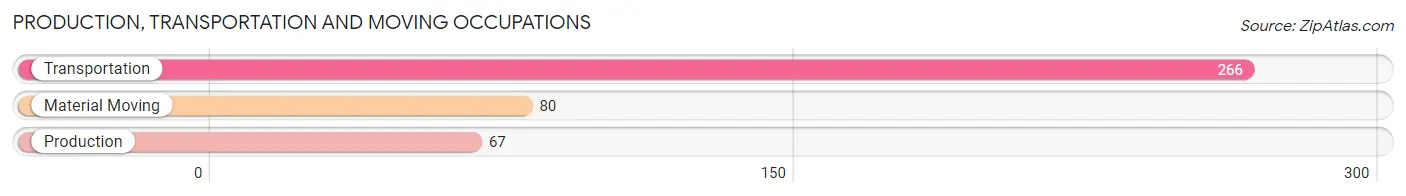
Production, Transportation and Moving Occupations
The most common Production, Transportation and Moving occupations in Jacksonville Beach are Transportation (266 | 1.9%), Material Moving (80 | 0.6%), and Production (67 | 0.5%).
Production, Transportation and Moving Occupations by Sex
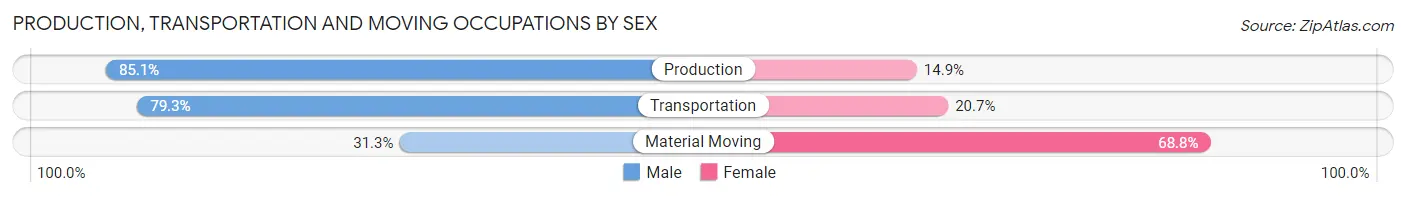
| Occupation | Male | Female |
| Production | 57 (85.1%) | 10 (14.9%) |
| Transportation | 211 (79.3%) | 55 (20.7%) |
| Material Moving | 25 (31.2%) | 55 (68.8%) |
| Total (Category) | 293 (70.9%) | 120 (29.1%) |
| Total (Overall) | 7,557 (55.4%) | 6,077 (44.6%) |
Employment Industries by Sex in Jacksonville Beach
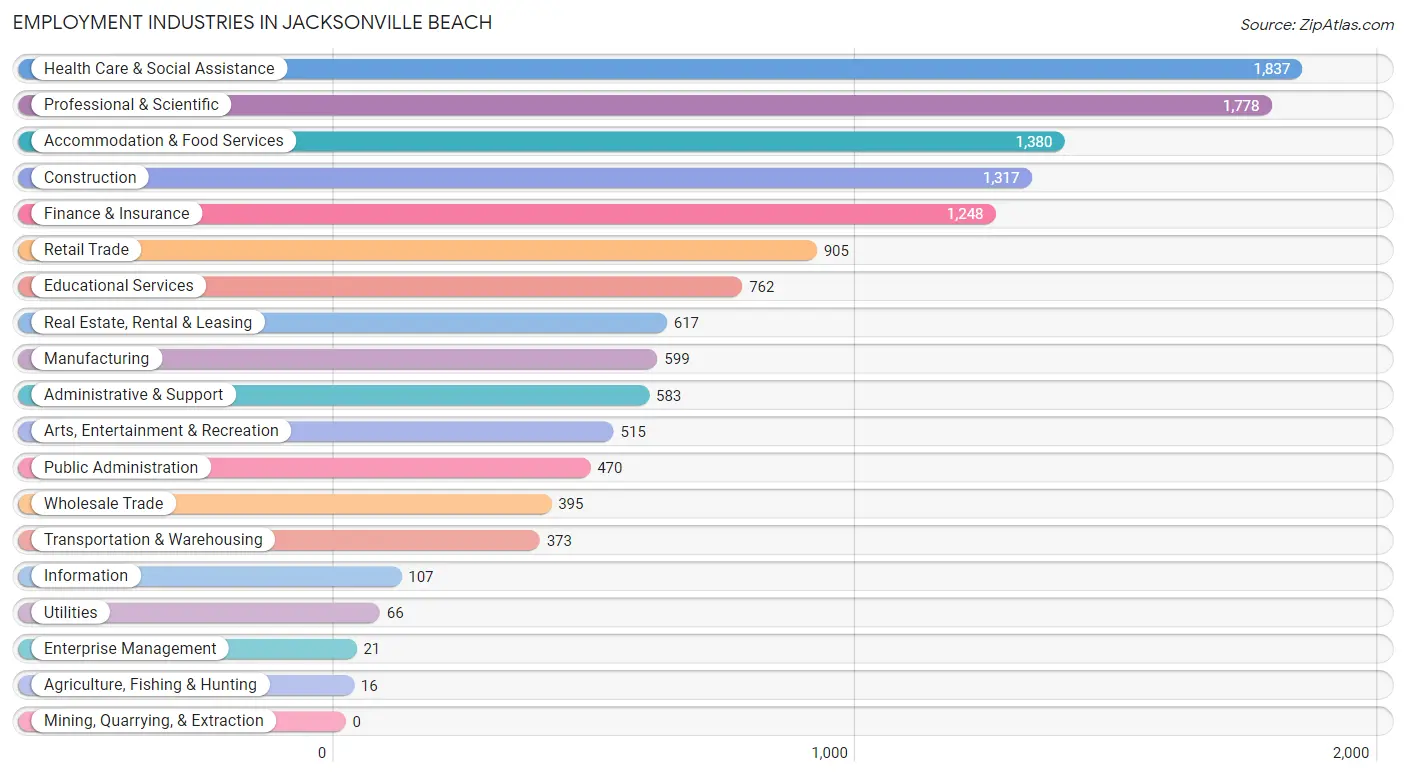
Employment Industries in Jacksonville Beach
The major employment industries in Jacksonville Beach include Health Care & Social Assistance (1,837 | 13.5%), Professional & Scientific (1,778 | 13.0%), Accommodation & Food Services (1,380 | 10.1%), Construction (1,317 | 9.7%), and Finance & Insurance (1,248 | 9.1%).
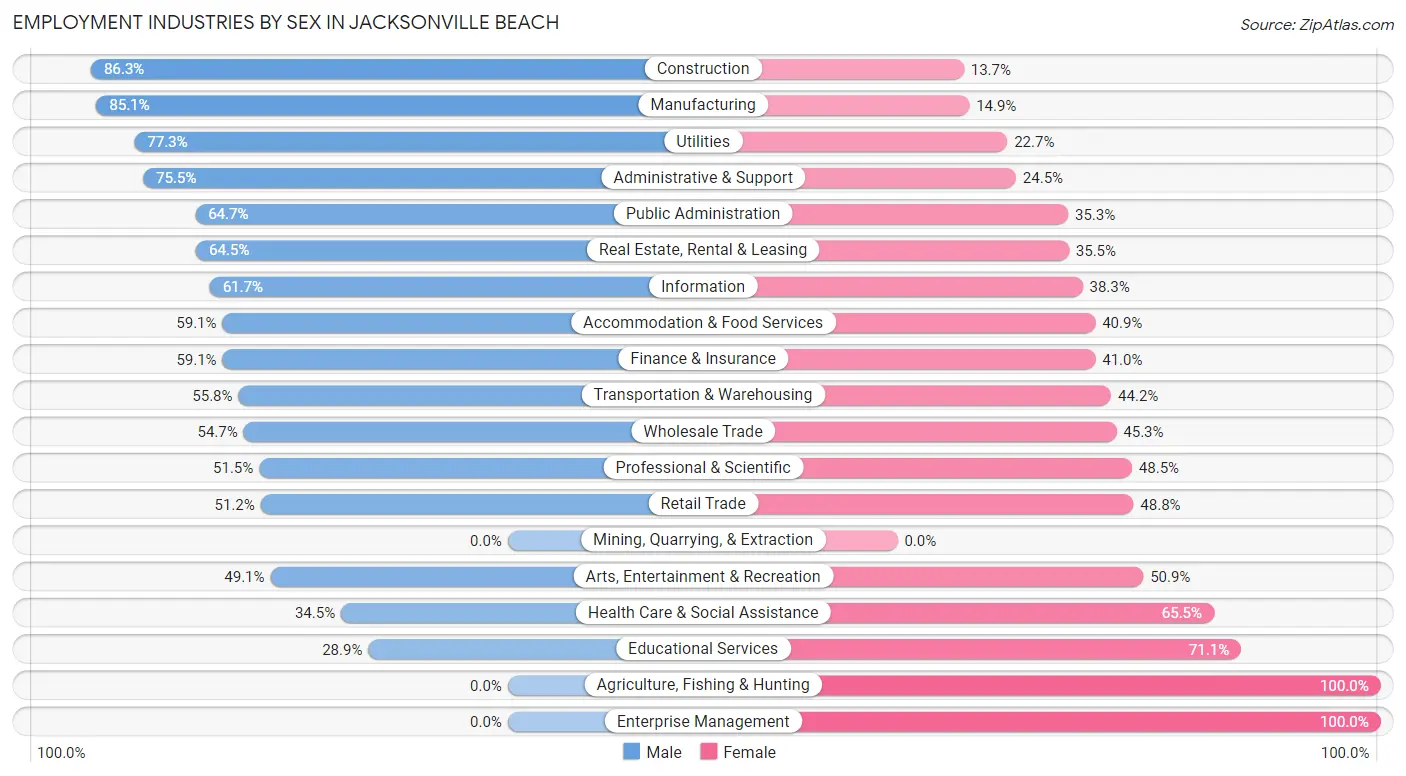
Employment Industries by Sex in Jacksonville Beach
The Jacksonville Beach industries that see more men than women are Construction (86.3%), Manufacturing (85.1%), and Utilities (77.3%), whereas the industries that tend to have a higher number of women are Agriculture, Fishing & Hunting (100.0%), Enterprise Management (100.0%), and Educational Services (71.1%).
| Industry | Male | Female |
| Agriculture, Fishing & Hunting | 0 (0.0%) | 16 (100.0%) |
| Mining, Quarrying, & Extraction | 0 (0.0%) | 0 (0.0%) |
| Construction | 1,136 (86.3%) | 181 (13.7%) |
| Manufacturing | 510 (85.1%) | 89 (14.9%) |
| Wholesale Trade | 216 (54.7%) | 179 (45.3%) |
| Retail Trade | 463 (51.2%) | 442 (48.8%) |
| Transportation & Warehousing | 208 (55.8%) | 165 (44.2%) |
| Utilities | 51 (77.3%) | 15 (22.7%) |
| Information | 66 (61.7%) | 41 (38.3%) |
| Finance & Insurance | 737 (59.1%) | 511 (40.9%) |
| Real Estate, Rental & Leasing | 398 (64.5%) | 219 (35.5%) |
| Professional & Scientific | 915 (51.5%) | 863 (48.5%) |
| Enterprise Management | 0 (0.0%) | 21 (100.0%) |
| Administrative & Support | 440 (75.5%) | 143 (24.5%) |
| Educational Services | 220 (28.9%) | 542 (71.1%) |
| Health Care & Social Assistance | 634 (34.5%) | 1,203 (65.5%) |
| Arts, Entertainment & Recreation | 253 (49.1%) | 262 (50.9%) |
| Accommodation & Food Services | 815 (59.1%) | 565 (40.9%) |
| Public Administration | 304 (64.7%) | 166 (35.3%) |
| Total | 7,557 (55.4%) | 6,077 (44.6%) |
Education in Jacksonville Beach
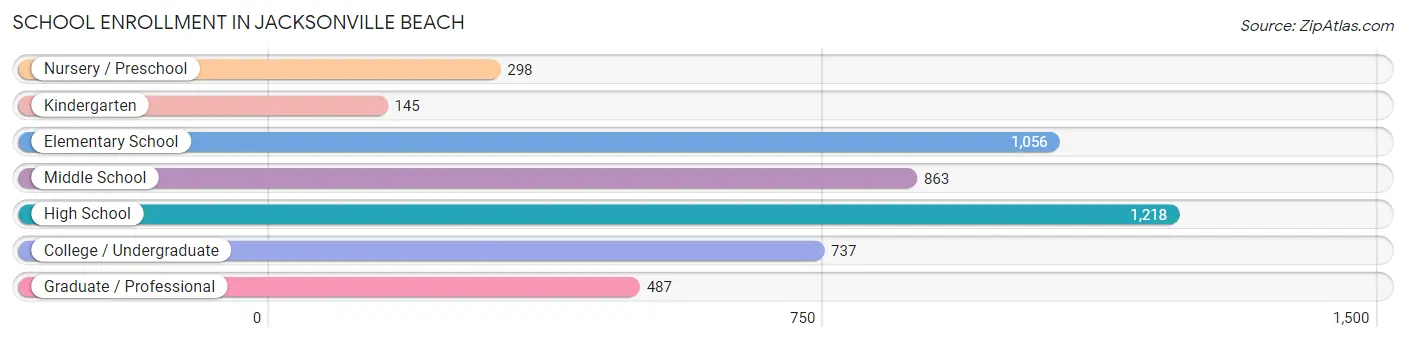
School Enrollment in Jacksonville Beach
The most common levels of schooling among the 4,804 students in Jacksonville Beach are high school (1,218 | 25.4%), elementary school (1,056 | 22.0%), and middle school (863 | 18.0%).
| School Level | # Students | % Students |
| Nursery / Preschool | 298 | 6.2% |
| Kindergarten | 145 | 3.0% |
| Elementary School | 1,056 | 22.0% |
| Middle School | 863 | 18.0% |
| High School | 1,218 | 25.4% |
| College / Undergraduate | 737 | 15.3% |
| Graduate / Professional | 487 | 10.1% |
| Total | 4,804 | 100.0% |
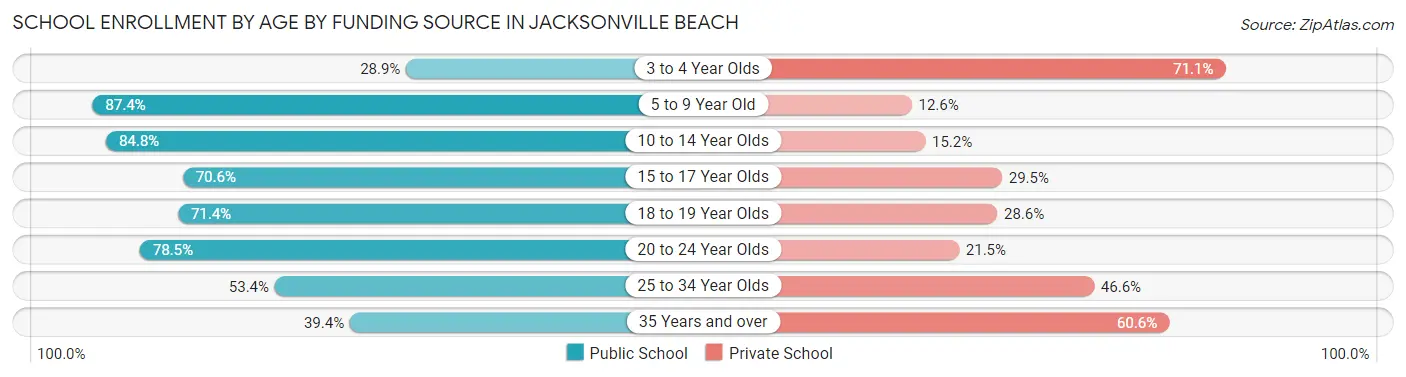
School Enrollment by Age by Funding Source in Jacksonville Beach
Out of a total of 4,804 students who are enrolled in schools in Jacksonville Beach, 1,302 (27.1%) attend a private institution, while the remaining 3,502 (72.9%) are enrolled in public schools. The age group of 3 to 4 year olds has the highest likelihood of being enrolled in private schools, with 177 (71.1% in the age bracket) enrolled. Conversely, the age group of 5 to 9 year old has the lowest likelihood of being enrolled in a private school, with 912 (87.4% in the age bracket) attending a public institution.
| Age Bracket | Public School | Private School |
| 3 to 4 Year Olds | 72 (28.9%) | 177 (71.1%) |
| 5 to 9 Year Old | 912 (87.4%) | 132 (12.6%) |
| 10 to 14 Year Olds | 1,002 (84.8%) | 179 (15.2%) |
| 15 to 17 Year Olds | 673 (70.6%) | 281 (29.4%) |
| 18 to 19 Year Olds | 140 (71.4%) | 56 (28.6%) |
| 20 to 24 Year Olds | 366 (78.5%) | 100 (21.5%) |
| 25 to 34 Year Olds | 205 (53.4%) | 179 (46.6%) |
| 35 Years and over | 130 (39.4%) | 200 (60.6%) |
| Total | 3,502 (72.9%) | 1,302 (27.1%) |
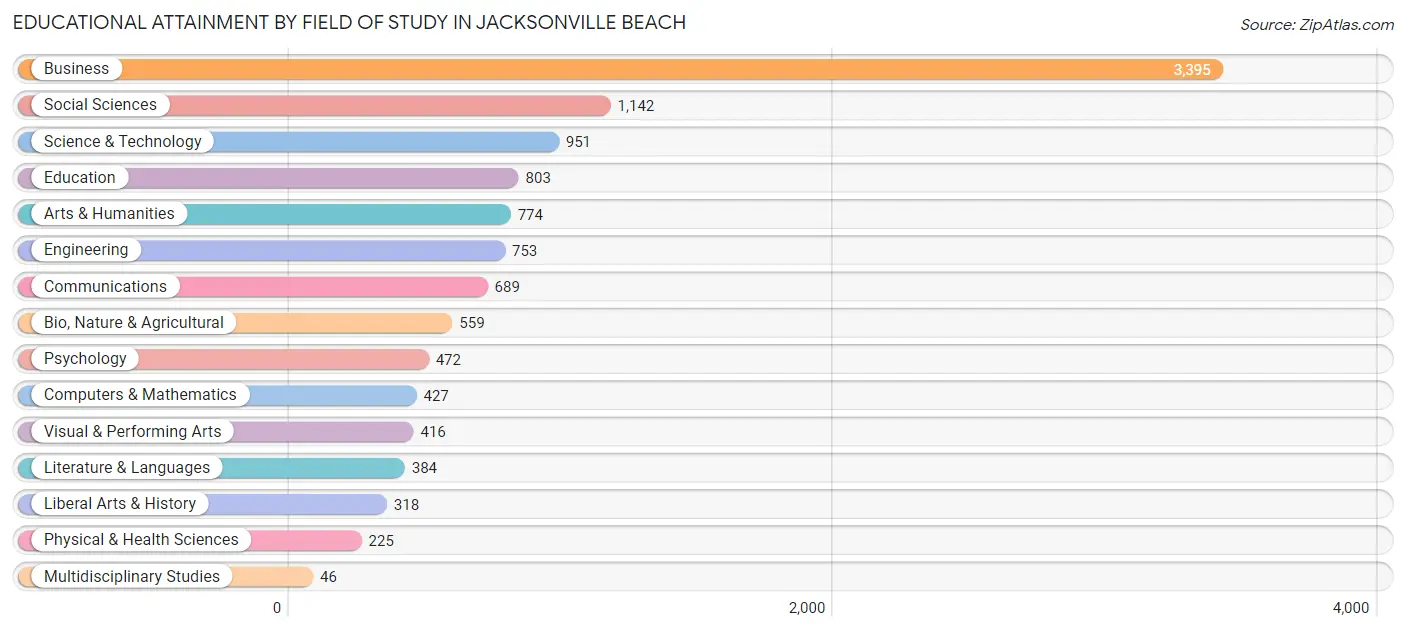
Educational Attainment by Field of Study in Jacksonville Beach
Business (3,395 | 29.9%), social sciences (1,142 | 10.1%), science & technology (951 | 8.4%), education (803 | 7.1%), and arts & humanities (774 | 6.8%) are the most common fields of study among 11,354 individuals in Jacksonville Beach who have obtained a bachelor's degree or higher.
| Field of Study | # Graduates | % Graduates |
| Computers & Mathematics | 427 | 3.8% |
| Bio, Nature & Agricultural | 559 | 4.9% |
| Physical & Health Sciences | 225 | 2.0% |
| Psychology | 472 | 4.2% |
| Social Sciences | 1,142 | 10.1% |
| Engineering | 753 | 6.6% |
| Multidisciplinary Studies | 46 | 0.4% |
| Science & Technology | 951 | 8.4% |
| Business | 3,395 | 29.9% |
| Education | 803 | 7.1% |
| Literature & Languages | 384 | 3.4% |
| Liberal Arts & History | 318 | 2.8% |
| Visual & Performing Arts | 416 | 3.7% |
| Communications | 689 | 6.1% |
| Arts & Humanities | 774 | 6.8% |
| Total | 11,354 | 100.0% |
Transportation & Commute in Jacksonville Beach
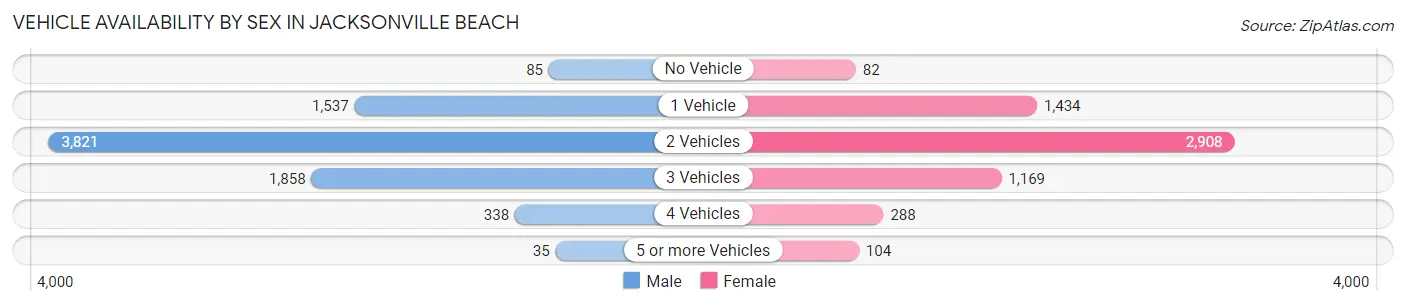
Vehicle Availability by Sex in Jacksonville Beach
The most prevalent vehicle ownership categories in Jacksonville Beach are males with 2 vehicles (3,821, accounting for 49.8%) and females with 2 vehicles (2,908, making up 63.8%).
| Vehicles Available | Male | Female |
| No Vehicle | 85 (1.1%) | 82 (1.4%) |
| 1 Vehicle | 1,537 (20.0%) | 1,434 (24.0%) |
| 2 Vehicles | 3,821 (49.8%) | 2,908 (48.6%) |
| 3 Vehicles | 1,858 (24.2%) | 1,169 (19.5%) |
| 4 Vehicles | 338 (4.4%) | 288 (4.8%) |
| 5 or more Vehicles | 35 (0.5%) | 104 (1.7%) |
| Total | 7,674 (100.0%) | 5,985 (100.0%) |
Commute Time in Jacksonville Beach
The most frequently occuring commute durations in Jacksonville Beach are 30 to 34 minutes (2,026 commuters, 18.8%), 20 to 24 minutes (1,707 commuters, 15.8%), and 10 to 14 minutes (1,545 commuters, 14.3%).
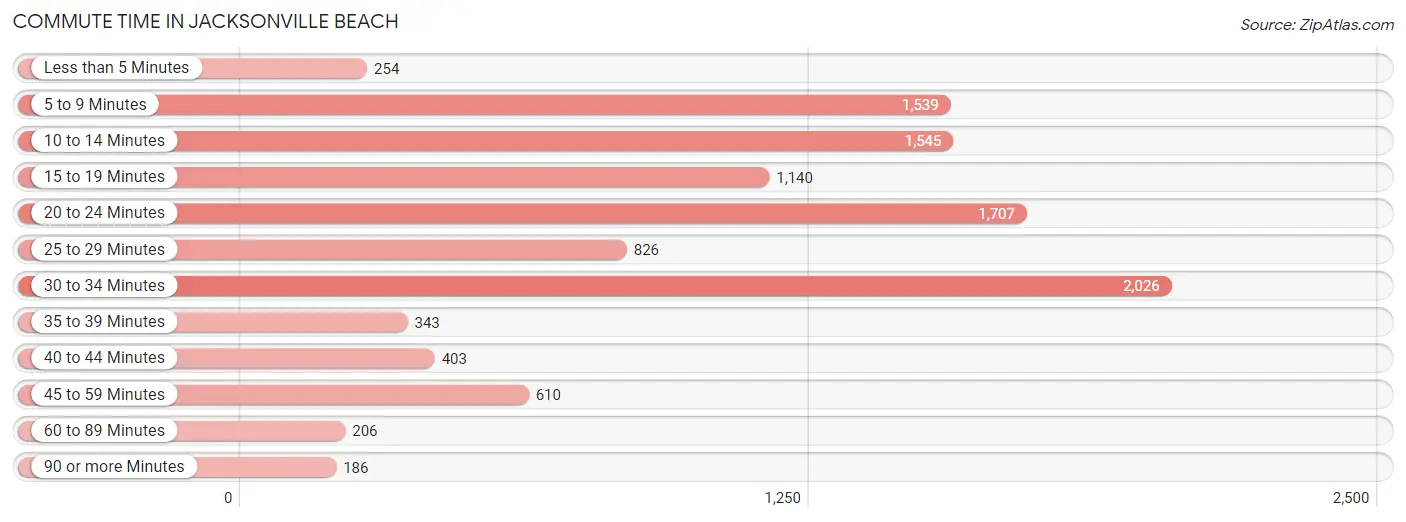
| Commute Time | # Commuters | % Commuters |
| Less than 5 Minutes | 254 | 2.4% |
| 5 to 9 Minutes | 1,539 | 14.3% |
| 10 to 14 Minutes | 1,545 | 14.3% |
| 15 to 19 Minutes | 1,140 | 10.6% |
| 20 to 24 Minutes | 1,707 | 15.8% |
| 25 to 29 Minutes | 826 | 7.7% |
| 30 to 34 Minutes | 2,026 | 18.8% |
| 35 to 39 Minutes | 343 | 3.2% |
| 40 to 44 Minutes | 403 | 3.7% |
| 45 to 59 Minutes | 610 | 5.7% |
| 60 to 89 Minutes | 206 | 1.9% |
| 90 or more Minutes | 186 | 1.7% |
Commute Time by Sex in Jacksonville Beach
The most common commute times in Jacksonville Beach are 20 to 24 minutes (1,209 commuters, 19.0%) for males and 30 to 34 minutes (916 commuters, 20.8%) for females.
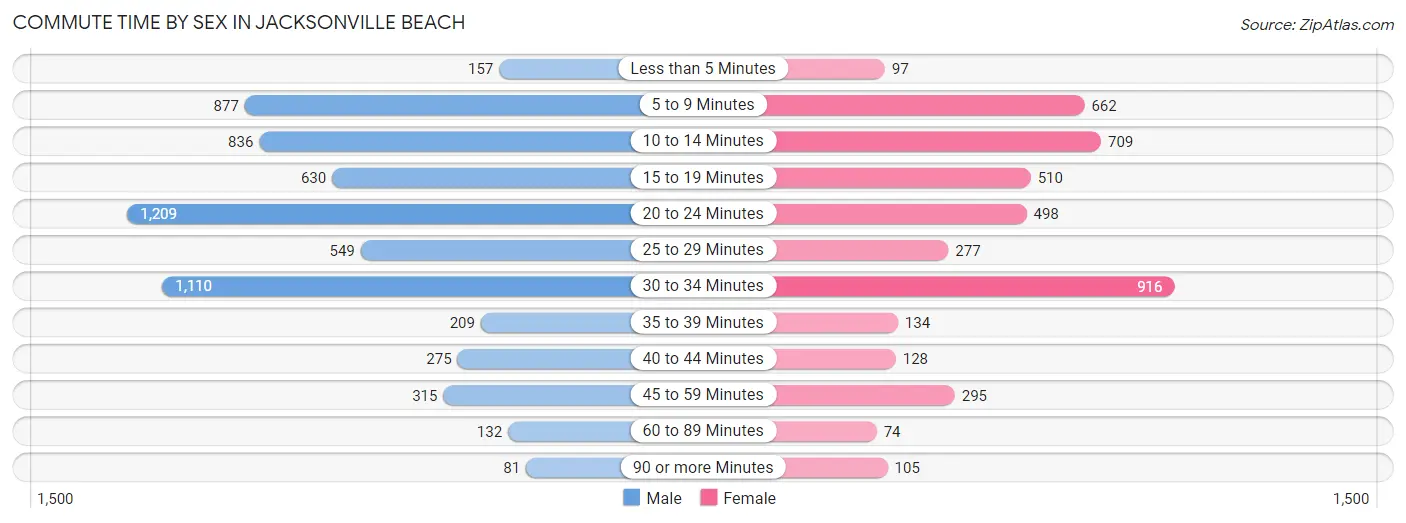
| Commute Time | Male | Female |
| Less than 5 Minutes | 157 (2.5%) | 97 (2.2%) |
| 5 to 9 Minutes | 877 (13.8%) | 662 (15.0%) |
| 10 to 14 Minutes | 836 (13.1%) | 709 (16.1%) |
| 15 to 19 Minutes | 630 (9.9%) | 510 (11.6%) |
| 20 to 24 Minutes | 1,209 (19.0%) | 498 (11.3%) |
| 25 to 29 Minutes | 549 (8.6%) | 277 (6.3%) |
| 30 to 34 Minutes | 1,110 (17.4%) | 916 (20.8%) |
| 35 to 39 Minutes | 209 (3.3%) | 134 (3.0%) |
| 40 to 44 Minutes | 275 (4.3%) | 128 (2.9%) |
| 45 to 59 Minutes | 315 (4.9%) | 295 (6.7%) |
| 60 to 89 Minutes | 132 (2.1%) | 74 (1.7%) |
| 90 or more Minutes | 81 (1.3%) | 105 (2.4%) |
Time of Departure to Work by Sex in Jacksonville Beach
The most frequent times of departure to work in Jacksonville Beach are 7:00 AM to 7:29 AM (1,277, 20.0%) for males and 8:00 AM to 8:29 AM (1,079, 24.5%) for females.
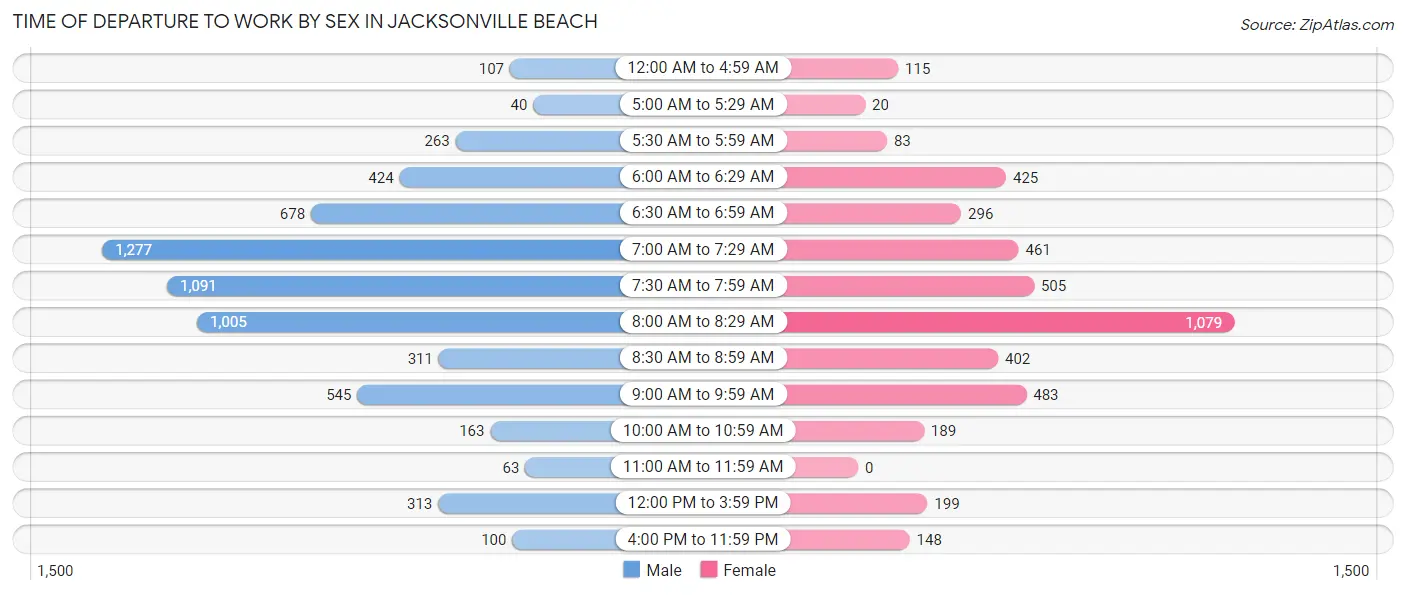
| Time of Departure | Male | Female |
| 12:00 AM to 4:59 AM | 107 (1.7%) | 115 (2.6%) |
| 5:00 AM to 5:29 AM | 40 (0.6%) | 20 (0.4%) |
| 5:30 AM to 5:59 AM | 263 (4.1%) | 83 (1.9%) |
| 6:00 AM to 6:29 AM | 424 (6.7%) | 425 (9.7%) |
| 6:30 AM to 6:59 AM | 678 (10.6%) | 296 (6.7%) |
| 7:00 AM to 7:29 AM | 1,277 (20.0%) | 461 (10.5%) |
| 7:30 AM to 7:59 AM | 1,091 (17.1%) | 505 (11.5%) |
| 8:00 AM to 8:29 AM | 1,005 (15.8%) | 1,079 (24.5%) |
| 8:30 AM to 8:59 AM | 311 (4.9%) | 402 (9.1%) |
| 9:00 AM to 9:59 AM | 545 (8.5%) | 483 (11.0%) |
| 10:00 AM to 10:59 AM | 163 (2.5%) | 189 (4.3%) |
| 11:00 AM to 11:59 AM | 63 (1.0%) | 0 (0.0%) |
| 12:00 PM to 3:59 PM | 313 (4.9%) | 199 (4.5%) |
| 4:00 PM to 11:59 PM | 100 (1.6%) | 148 (3.4%) |
| Total | 6,380 (100.0%) | 4,405 (100.0%) |
Housing Occupancy in Jacksonville Beach
Occupancy by Ownership in Jacksonville Beach
Of the total 10,822 dwellings in Jacksonville Beach, owner-occupied units account for 7,252 (67.0%), while renter-occupied units make up 3,570 (33.0%).
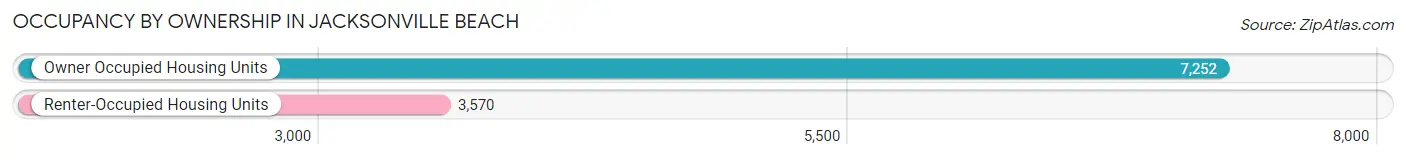
| Occupancy | # Housing Units | % Housing Units |
| Owner Occupied Housing Units | 7,252 | 67.0% |
| Renter-Occupied Housing Units | 3,570 | 33.0% |
| Total Occupied Housing Units | 10,822 | 100.0% |
Occupancy by Household Size in Jacksonville Beach
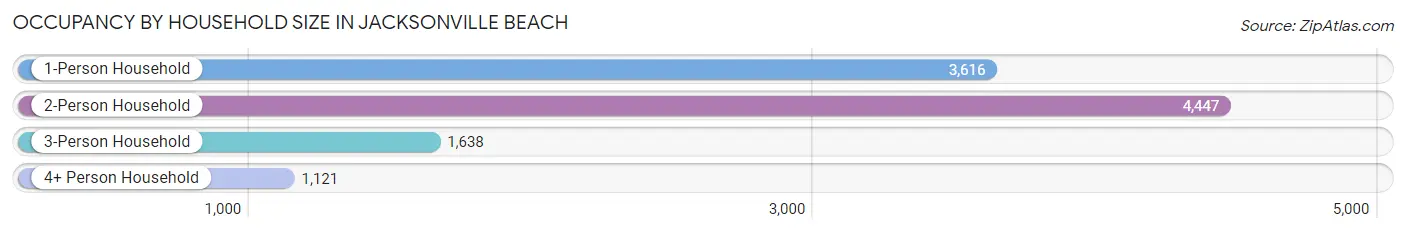
| Household Size | # Housing Units | % Housing Units |
| 1-Person Household | 3,616 | 33.4% |
| 2-Person Household | 4,447 | 41.1% |
| 3-Person Household | 1,638 | 15.1% |
| 4+ Person Household | 1,121 | 10.4% |
| Total Housing Units | 10,822 | 100.0% |
Occupancy by Ownership by Household Size in Jacksonville Beach
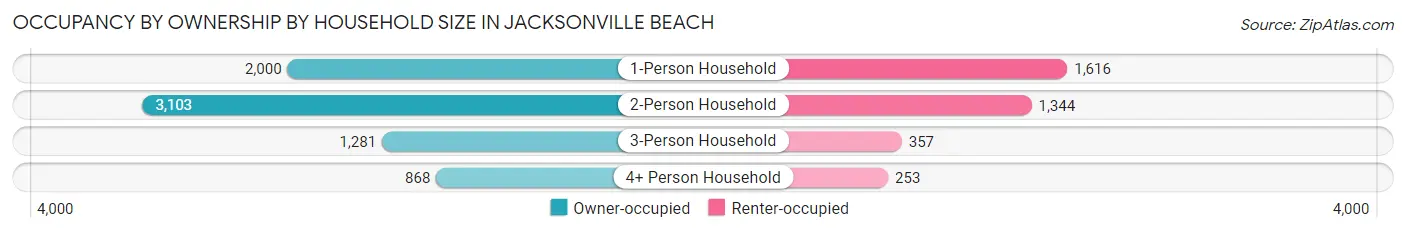
| Household Size | Owner-occupied | Renter-occupied |
| 1-Person Household | 2,000 (55.3%) | 1,616 (44.7%) |
| 2-Person Household | 3,103 (69.8%) | 1,344 (30.2%) |
| 3-Person Household | 1,281 (78.2%) | 357 (21.8%) |
| 4+ Person Household | 868 (77.4%) | 253 (22.6%) |
| Total Housing Units | 7,252 (67.0%) | 3,570 (33.0%) |
Occupancy by Educational Attainment in Jacksonville Beach
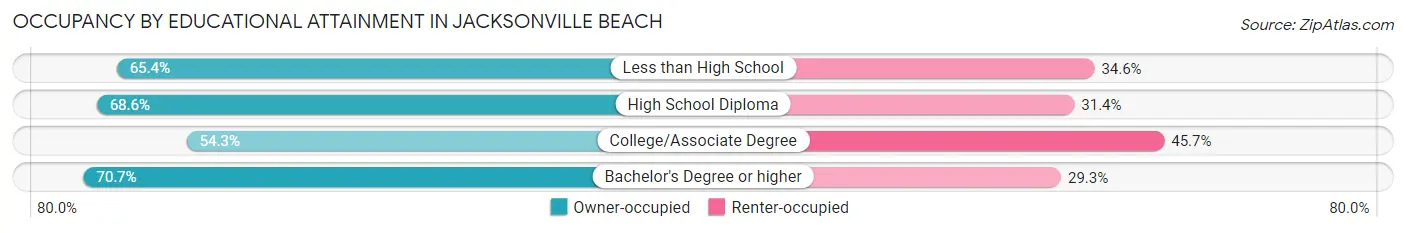
| Household Size | Owner-occupied | Renter-occupied |
| Less than High School | 204 (65.4%) | 108 (34.6%) |
| High School Diploma | 953 (68.6%) | 437 (31.4%) |
| College/Associate Degree | 1,162 (54.3%) | 978 (45.7%) |
| Bachelor's Degree or higher | 4,933 (70.7%) | 2,047 (29.3%) |
Occupancy by Age of Householder in Jacksonville Beach
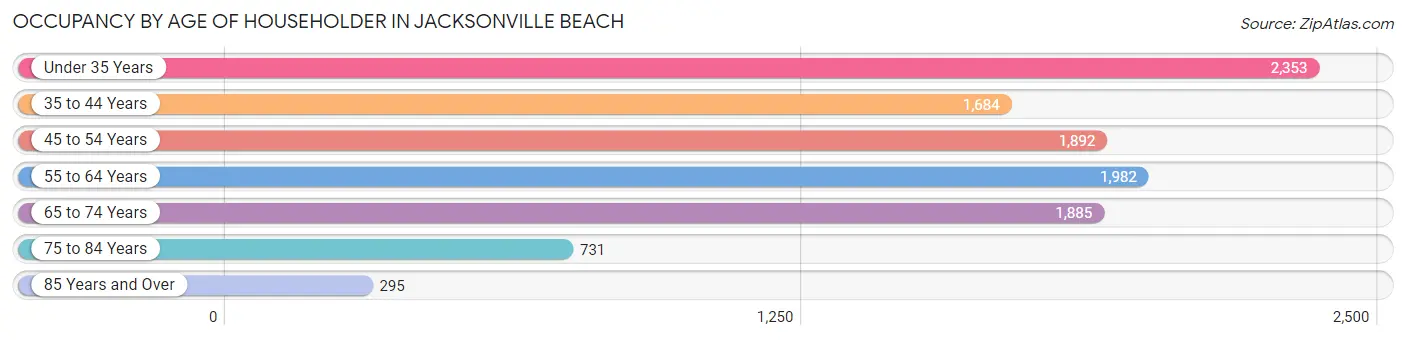
| Age Bracket | # Households | % Households |
| Under 35 Years | 2,353 | 21.7% |
| 35 to 44 Years | 1,684 | 15.6% |
| 45 to 54 Years | 1,892 | 17.5% |
| 55 to 64 Years | 1,982 | 18.3% |
| 65 to 74 Years | 1,885 | 17.4% |
| 75 to 84 Years | 731 | 6.8% |
| 85 Years and Over | 295 | 2.7% |
| Total | 10,822 | 100.0% |
Housing Finances in Jacksonville Beach
Median Income by Occupancy in Jacksonville Beach
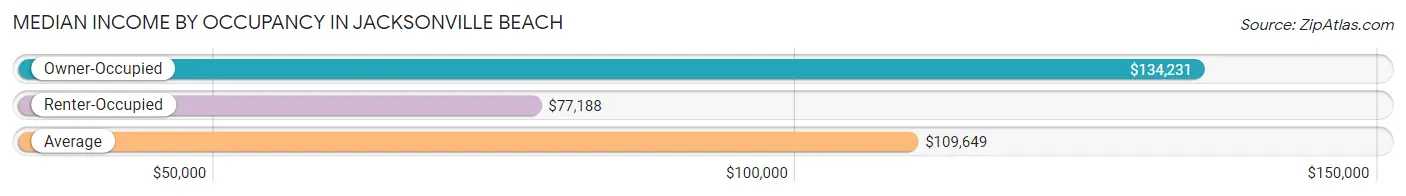
| Occupancy Type | # Households | Median Income |
| Owner-Occupied | 7,252 (67.0%) | $134,231 |
| Renter-Occupied | 3,570 (33.0%) | $77,188 |
| Average | 10,822 (100.0%) | $109,649 |
Occupancy by Householder Income Bracket in Jacksonville Beach
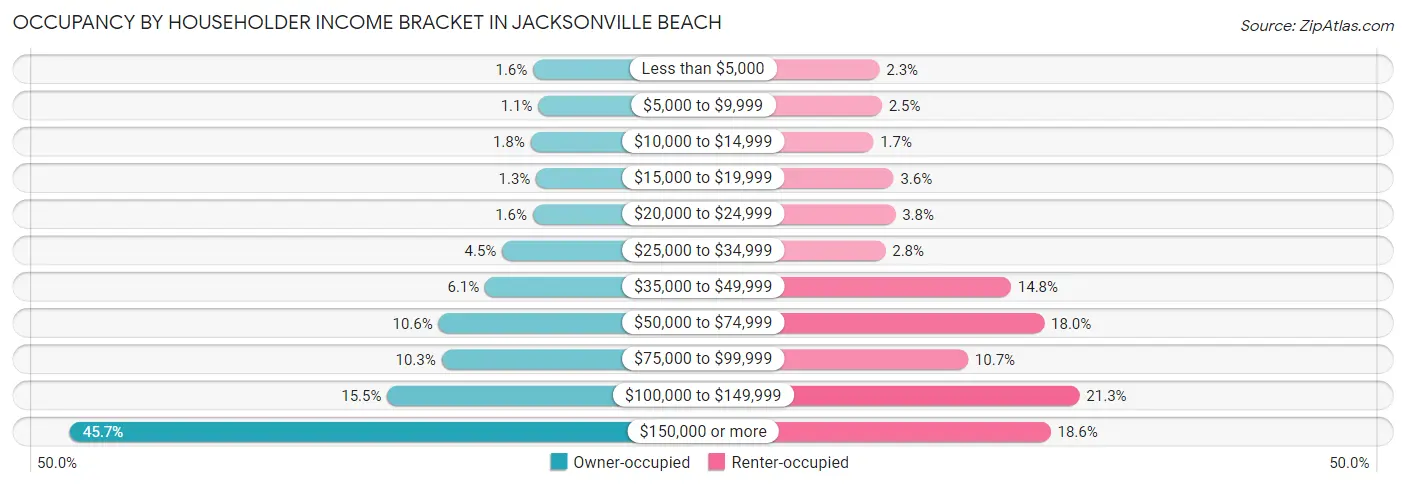
| Income Bracket | Owner-occupied | Renter-occupied |
| Less than $5,000 | 114 (1.6%) | 81 (2.3%) |
| $5,000 to $9,999 | 78 (1.1%) | 89 (2.5%) |
| $10,000 to $14,999 | 131 (1.8%) | 60 (1.7%) |
| $15,000 to $19,999 | 93 (1.3%) | 129 (3.6%) |
| $20,000 to $24,999 | 116 (1.6%) | 135 (3.8%) |
| $25,000 to $34,999 | 328 (4.5%) | 101 (2.8%) |
| $35,000 to $49,999 | 445 (6.1%) | 528 (14.8%) |
| $50,000 to $74,999 | 767 (10.6%) | 641 (18.0%) |
| $75,000 to $99,999 | 746 (10.3%) | 382 (10.7%) |
| $100,000 to $149,999 | 1,121 (15.5%) | 761 (21.3%) |
| $150,000 or more | 3,313 (45.7%) | 663 (18.6%) |
| Total | 7,252 (100.0%) | 3,570 (100.0%) |
Monthly Housing Cost Tiers in Jacksonville Beach
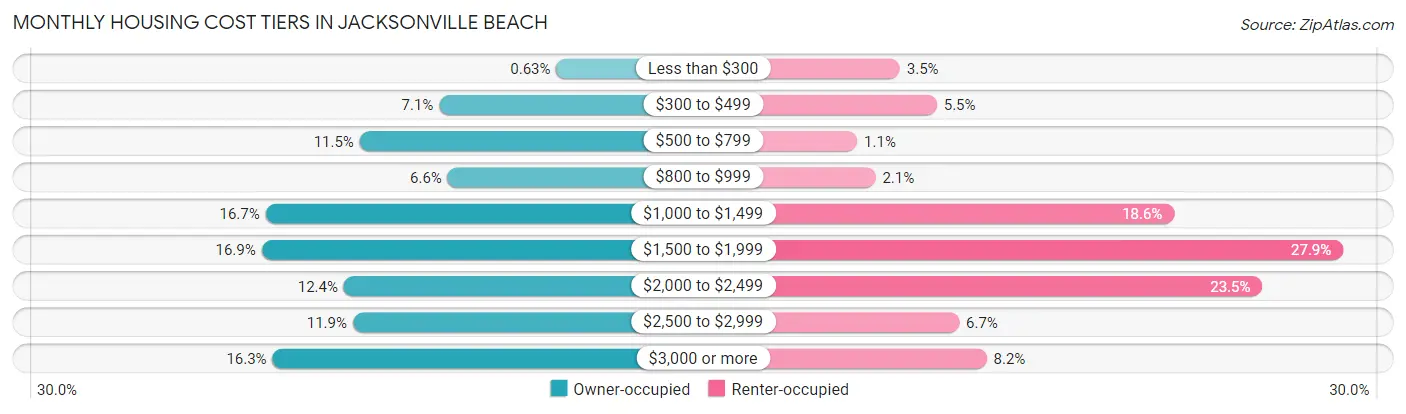
| Monthly Cost | Owner-occupied | Renter-occupied |
| Less than $300 | 46 (0.6%) | 123 (3.5%) |
| $300 to $499 | 515 (7.1%) | 196 (5.5%) |
| $500 to $799 | 833 (11.5%) | 39 (1.1%) |
| $800 to $999 | 481 (6.6%) | 75 (2.1%) |
| $1,000 to $1,499 | 1,210 (16.7%) | 664 (18.6%) |
| $1,500 to $1,999 | 1,226 (16.9%) | 997 (27.9%) |
| $2,000 to $2,499 | 897 (12.4%) | 838 (23.5%) |
| $2,500 to $2,999 | 861 (11.9%) | 240 (6.7%) |
| $3,000 or more | 1,183 (16.3%) | 294 (8.2%) |
| Total | 7,252 (100.0%) | 3,570 (100.0%) |
Physical Housing Characteristics in Jacksonville Beach
Housing Structures in Jacksonville Beach
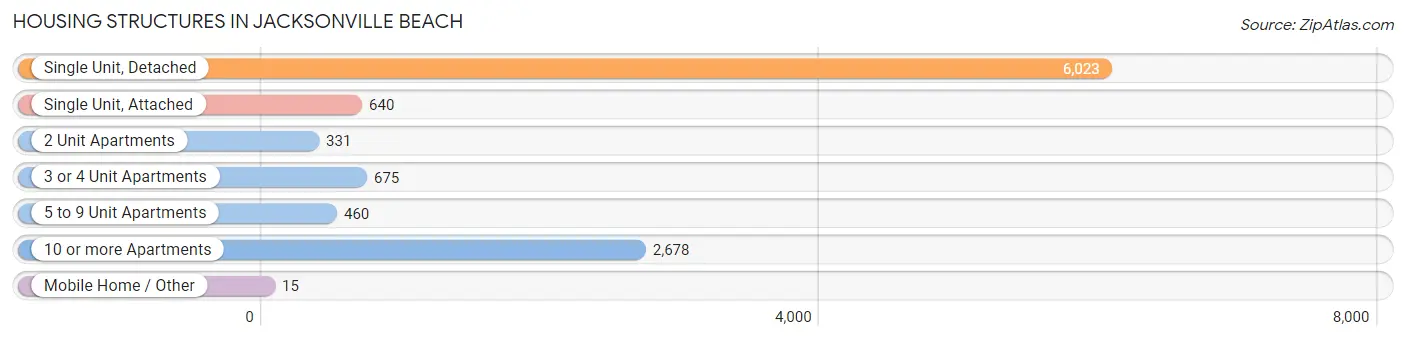
| Structure Type | # Housing Units | % Housing Units |
| Single Unit, Detached | 6,023 | 55.7% |
| Single Unit, Attached | 640 | 5.9% |
| 2 Unit Apartments | 331 | 3.1% |
| 3 or 4 Unit Apartments | 675 | 6.2% |
| 5 to 9 Unit Apartments | 460 | 4.3% |
| 10 or more Apartments | 2,678 | 24.7% |
| Mobile Home / Other | 15 | 0.1% |
| Total | 10,822 | 100.0% |
Housing Structures by Occupancy in Jacksonville Beach
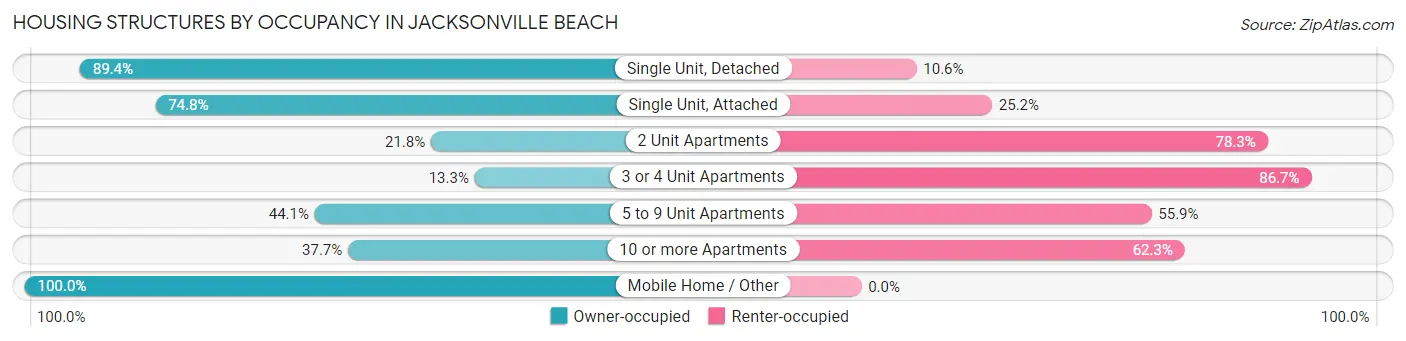
| Structure Type | Owner-occupied | Renter-occupied |
| Single Unit, Detached | 5,383 (89.4%) | 640 (10.6%) |
| Single Unit, Attached | 479 (74.8%) | 161 (25.2%) |
| 2 Unit Apartments | 72 (21.7%) | 259 (78.2%) |
| 3 or 4 Unit Apartments | 90 (13.3%) | 585 (86.7%) |
| 5 to 9 Unit Apartments | 203 (44.1%) | 257 (55.9%) |
| 10 or more Apartments | 1,010 (37.7%) | 1,668 (62.3%) |
| Mobile Home / Other | 15 (100.0%) | 0 (0.0%) |
| Total | 7,252 (67.0%) | 3,570 (33.0%) |
Housing Structures by Number of Rooms in Jacksonville Beach
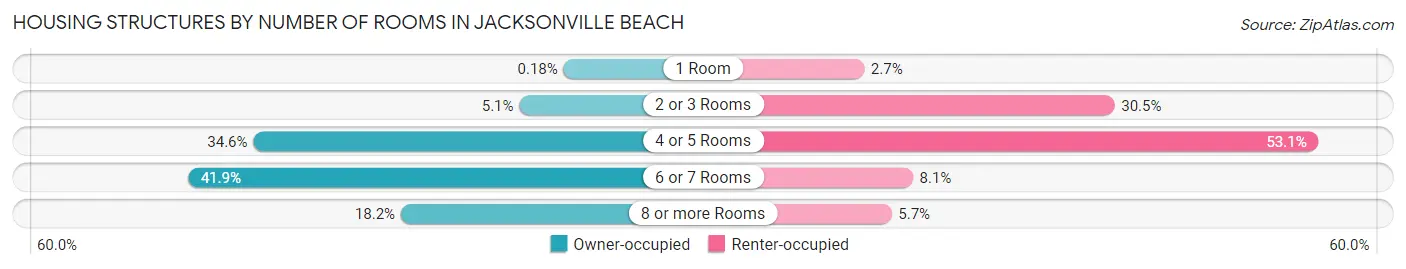
| Number of Rooms | Owner-occupied | Renter-occupied |
| 1 Room | 13 (0.2%) | 95 (2.7%) |
| 2 or 3 Rooms | 369 (5.1%) | 1,087 (30.4%) |
| 4 or 5 Rooms | 2,510 (34.6%) | 1,896 (53.1%) |
| 6 or 7 Rooms | 3,038 (41.9%) | 288 (8.1%) |
| 8 or more Rooms | 1,322 (18.2%) | 204 (5.7%) |
| Total | 7,252 (100.0%) | 3,570 (100.0%) |
Housing Structure by Heating Type in Jacksonville Beach
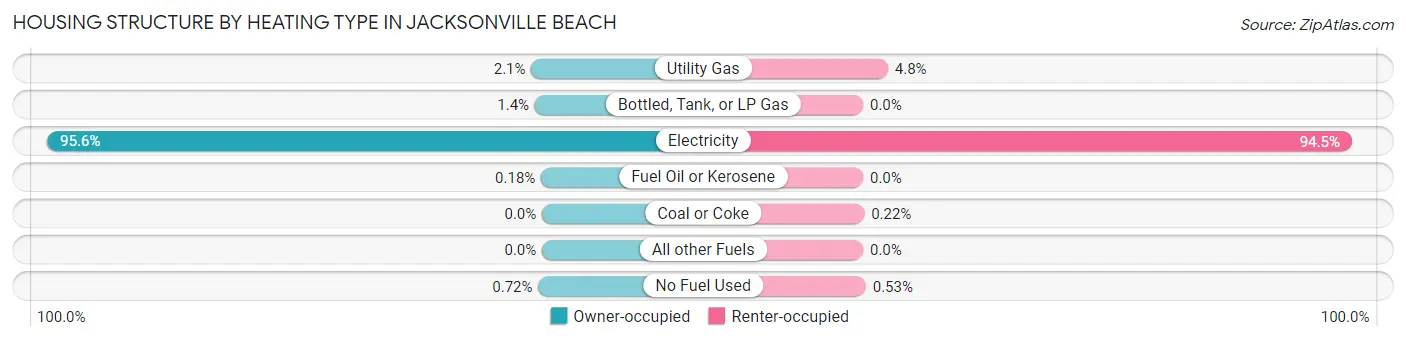
| Heating Type | Owner-occupied | Renter-occupied |
| Utility Gas | 150 (2.1%) | 171 (4.8%) |
| Bottled, Tank, or LP Gas | 101 (1.4%) | 0 (0.0%) |
| Electricity | 6,936 (95.6%) | 3,372 (94.5%) |
| Fuel Oil or Kerosene | 13 (0.2%) | 0 (0.0%) |
| Coal or Coke | 0 (0.0%) | 8 (0.2%) |
| All other Fuels | 0 (0.0%) | 0 (0.0%) |
| No Fuel Used | 52 (0.7%) | 19 (0.5%) |
| Total | 7,252 (100.0%) | 3,570 (100.0%) |
Household Vehicle Usage in Jacksonville Beach
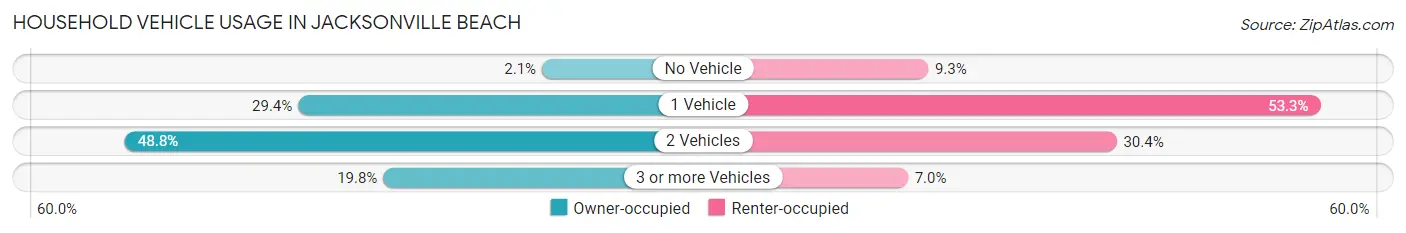
| Vehicles per Household | Owner-occupied | Renter-occupied |
| No Vehicle | 149 (2.1%) | 332 (9.3%) |
| 1 Vehicle | 2,129 (29.4%) | 1,901 (53.2%) |
| 2 Vehicles | 3,536 (48.8%) | 1,086 (30.4%) |
| 3 or more Vehicles | 1,438 (19.8%) | 251 (7.0%) |
| Total | 7,252 (100.0%) | 3,570 (100.0%) |
Real Estate & Mortgages in Jacksonville Beach
Real Estate and Mortgage Overview in Jacksonville Beach
| Characteristic | Without Mortgage | With Mortgage |
| Housing Units | 2,589 | 4,663 |
| Median Property Value | $512,800 | $463,300 |
| Median Household Income | $101,484 | $2,295 |
| Monthly Housing Costs | $851 | $1,166 |
| Real Estate Taxes | $3,800 | $135 |
Property Value by Mortgage Status in Jacksonville Beach
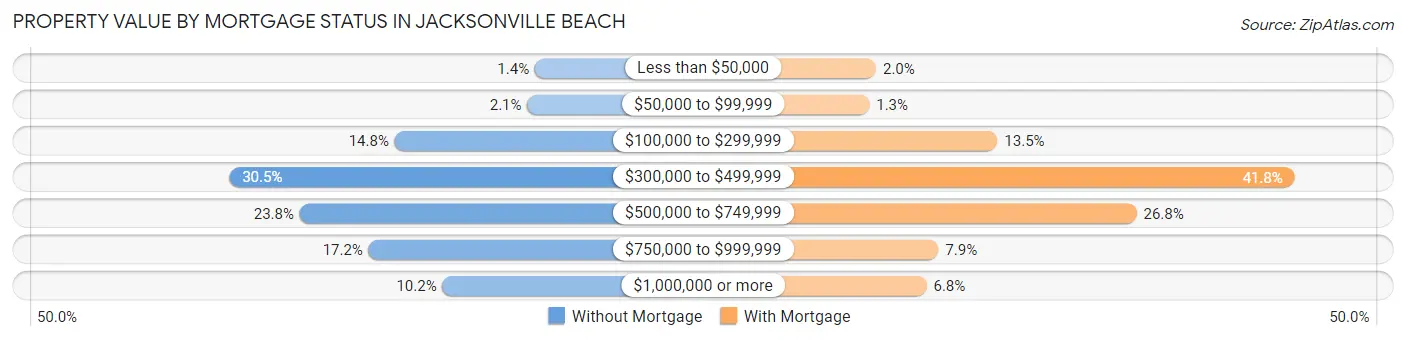
| Property Value | Without Mortgage | With Mortgage |
| Less than $50,000 | 36 (1.4%) | 91 (1.9%) |
| $50,000 to $99,999 | 55 (2.1%) | 61 (1.3%) |
| $100,000 to $299,999 | 382 (14.7%) | 630 (13.5%) |
| $300,000 to $499,999 | 790 (30.5%) | 1,950 (41.8%) |
| $500,000 to $749,999 | 616 (23.8%) | 1,248 (26.8%) |
| $750,000 to $999,999 | 446 (17.2%) | 368 (7.9%) |
| $1,000,000 or more | 264 (10.2%) | 315 (6.8%) |
| Total | 2,589 (100.0%) | 4,663 (100.0%) |
Household Income by Mortgage Status in Jacksonville Beach
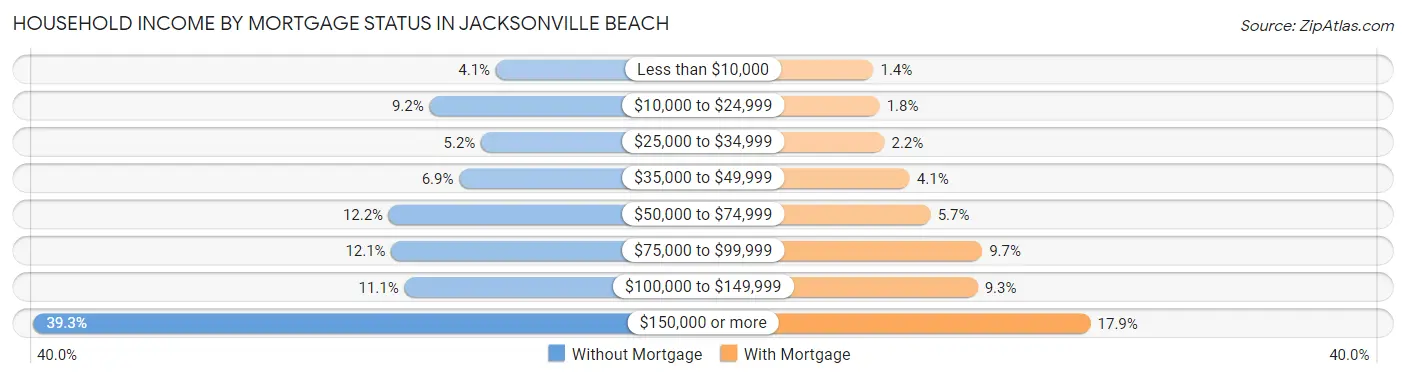
| Household Income | Without Mortgage | With Mortgage |
| Less than $10,000 | 106 (4.1%) | 64 (1.4%) |
| $10,000 to $24,999 | 237 (9.1%) | 86 (1.8%) |
| $25,000 to $34,999 | 135 (5.2%) | 103 (2.2%) |
| $35,000 to $49,999 | 178 (6.9%) | 193 (4.1%) |
| $50,000 to $74,999 | 317 (12.2%) | 267 (5.7%) |
| $75,000 to $99,999 | 312 (12.0%) | 450 (9.7%) |
| $100,000 to $149,999 | 286 (11.1%) | 434 (9.3%) |
| $150,000 or more | 1,018 (39.3%) | 835 (17.9%) |
| Total | 2,589 (100.0%) | 4,663 (100.0%) |
Property Value to Household Income Ratio in Jacksonville Beach
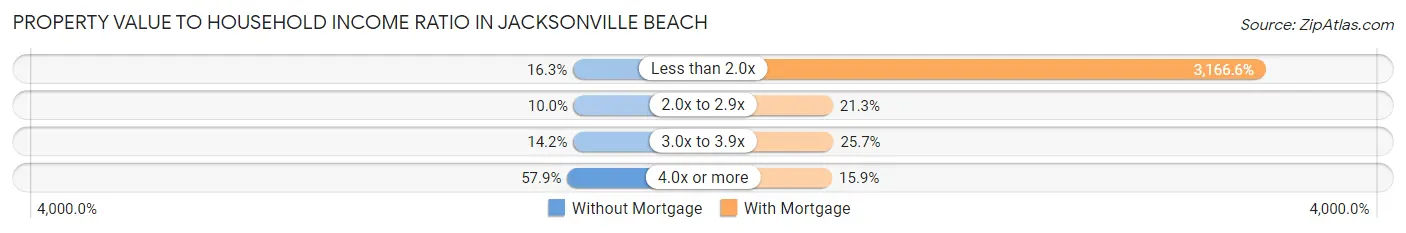
| Value-to-Income Ratio | Without Mortgage | With Mortgage |
| Less than 2.0x | 423 (16.3%) | 147,660 (3,166.6%) |
| 2.0x to 2.9x | 260 (10.0%) | 991 (21.2%) |
| 3.0x to 3.9x | 367 (14.2%) | 1,197 (25.7%) |
| 4.0x or more | 1,500 (57.9%) | 743 (15.9%) |
| Total | 2,589 (100.0%) | 4,663 (100.0%) |
Real Estate Taxes by Mortgage Status in Jacksonville Beach
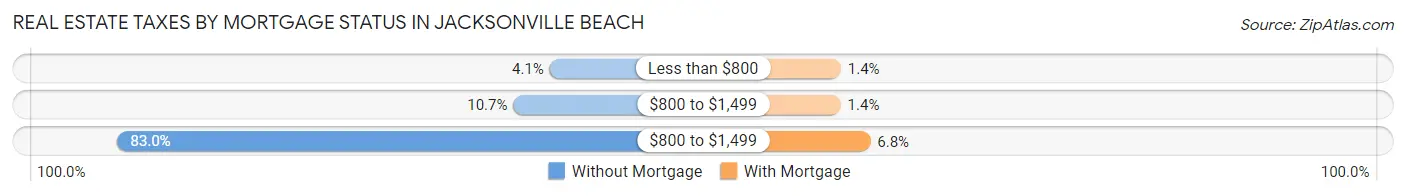
| Property Taxes | Without Mortgage | With Mortgage |
| Less than $800 | 106 (4.1%) | 66 (1.4%) |
| $800 to $1,499 | 278 (10.7%) | 65 (1.4%) |
| $800 to $1,499 | 2,150 (83.0%) | 318 (6.8%) |
| Total | 2,589 (100.0%) | 4,663 (100.0%) |
Health & Disability in Jacksonville Beach
Health Insurance Coverage by Age in Jacksonville Beach
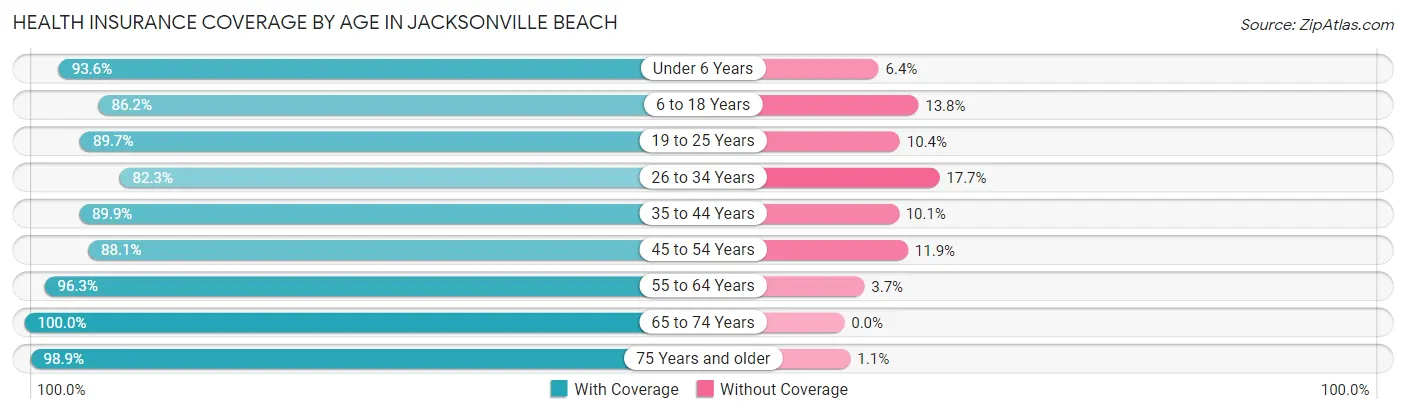
| Age Bracket | With Coverage | Without Coverage |
| Under 6 Years | 909 (93.6%) | 62 (6.4%) |
| 6 to 18 Years | 2,836 (86.2%) | 454 (13.8%) |
| 19 to 25 Years | 1,169 (89.6%) | 135 (10.3%) |
| 26 to 34 Years | 2,835 (82.3%) | 611 (17.7%) |
| 35 to 44 Years | 2,746 (89.9%) | 310 (10.1%) |
| 45 to 54 Years | 2,875 (88.1%) | 387 (11.9%) |
| 55 to 64 Years | 3,137 (96.3%) | 122 (3.7%) |
| 65 to 74 Years | 3,082 (100.0%) | 0 (0.0%) |
| 75 Years and older | 1,564 (98.9%) | 18 (1.1%) |
| Total | 21,153 (91.0%) | 2,099 (9.0%) |
Health Insurance Coverage by Citizenship Status in Jacksonville Beach
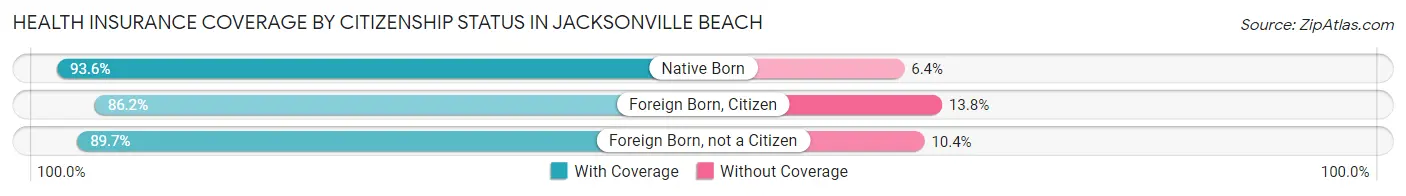
| Citizenship Status | With Coverage | Without Coverage |
| Native Born | 909 (93.6%) | 62 (6.4%) |
| Foreign Born, Citizen | 2,836 (86.2%) | 454 (13.8%) |
| Foreign Born, not a Citizen | 1,169 (89.6%) | 135 (10.3%) |
Health Insurance Coverage by Household Income in Jacksonville Beach
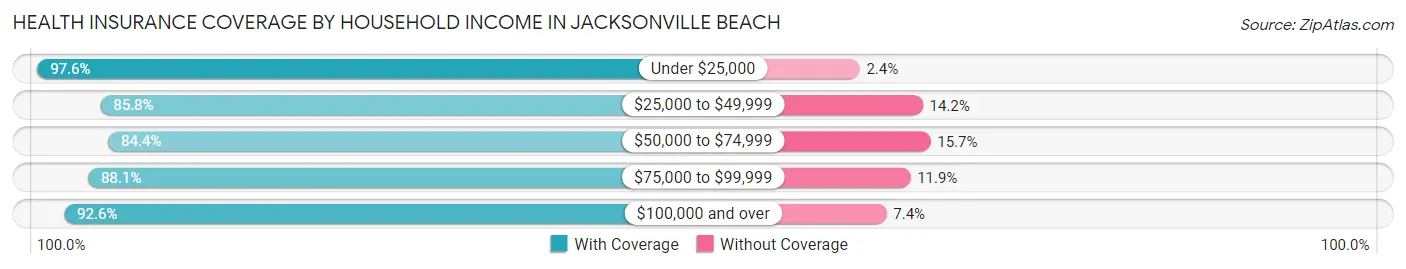
| Household Income | With Coverage | Without Coverage |
| Under $25,000 | 1,564 (97.6%) | 38 (2.4%) |
| $25,000 to $49,999 | 1,843 (85.8%) | 305 (14.2%) |
| $50,000 to $74,999 | 2,043 (84.4%) | 379 (15.7%) |
| $75,000 to $99,999 | 1,810 (88.1%) | 244 (11.9%) |
| $100,000 and over | 13,890 (92.6%) | 1,112 (7.4%) |
Public vs Private Health Insurance Coverage by Age in Jacksonville Beach
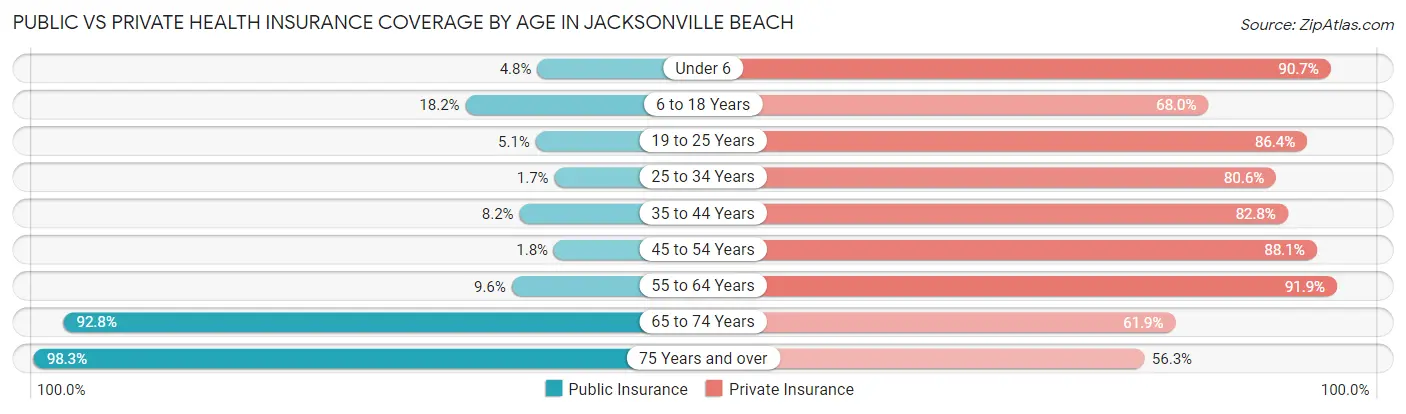
| Age Bracket | Public Insurance | Private Insurance |
| Under 6 | 47 (4.8%) | 881 (90.7%) |
| 6 to 18 Years | 598 (18.2%) | 2,238 (68.0%) |
| 19 to 25 Years | 67 (5.1%) | 1,126 (86.4%) |
| 25 to 34 Years | 57 (1.7%) | 2,778 (80.6%) |
| 35 to 44 Years | 249 (8.2%) | 2,529 (82.8%) |
| 45 to 54 Years | 57 (1.8%) | 2,874 (88.1%) |
| 55 to 64 Years | 313 (9.6%) | 2,995 (91.9%) |
| 65 to 74 Years | 2,859 (92.8%) | 1,908 (61.9%) |
| 75 Years and over | 1,555 (98.3%) | 890 (56.3%) |
| Total | 5,802 (24.9%) | 18,219 (78.3%) |
Disability Status by Sex by Age in Jacksonville Beach
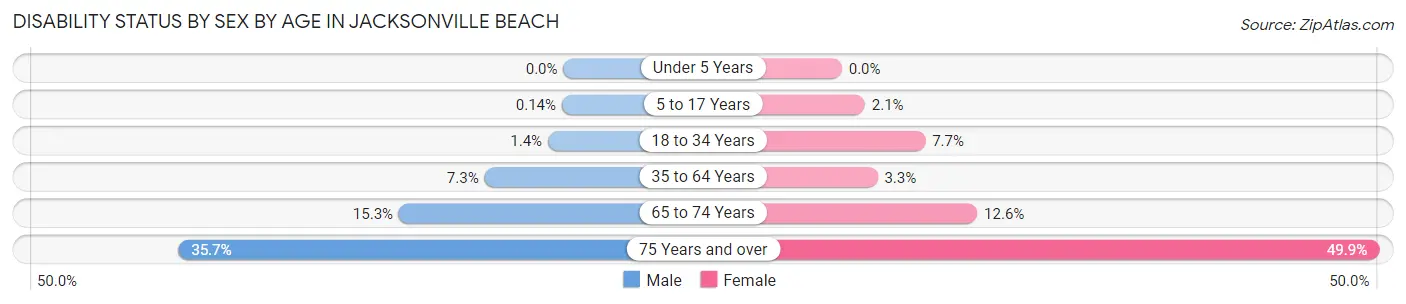
| Age Bracket | Male | Female |
| Under 5 Years | 0 (0.0%) | 0 (0.0%) |
| 5 to 17 Years | 3 (0.1%) | 23 (2.1%) |
| 18 to 34 Years | 33 (1.4%) | 203 (7.7%) |
| 35 to 64 Years | 363 (7.3%) | 153 (3.3%) |
| 65 to 74 Years | 248 (15.3%) | 183 (12.6%) |
| 75 Years and over | 214 (35.7%) | 490 (49.8%) |
Disability Class by Sex by Age in Jacksonville Beach
Disability Class: Hearing Difficulty
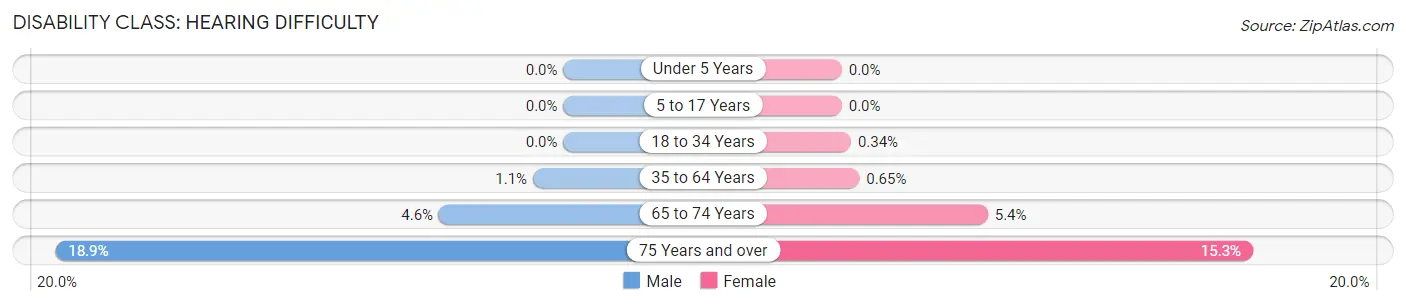
| Age Bracket | Male | Female |
| Under 5 Years | 0 (0.0%) | 0 (0.0%) |
| 5 to 17 Years | 0 (0.0%) | 0 (0.0%) |
| 18 to 34 Years | 0 (0.0%) | 9 (0.3%) |
| 35 to 64 Years | 56 (1.1%) | 30 (0.6%) |
| 65 to 74 Years | 75 (4.6%) | 79 (5.4%) |
| 75 Years and over | 113 (18.9%) | 150 (15.3%) |
Disability Class: Vision Difficulty
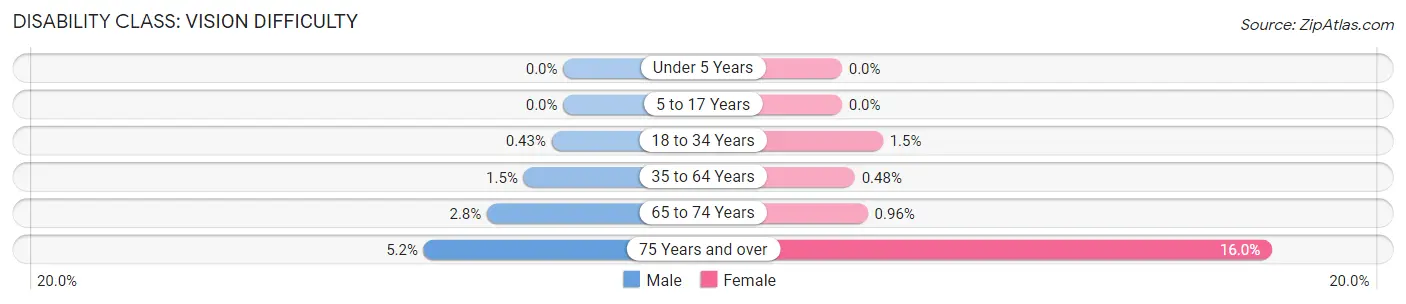
| Age Bracket | Male | Female |
| Under 5 Years | 0 (0.0%) | 0 (0.0%) |
| 5 to 17 Years | 0 (0.0%) | 0 (0.0%) |
| 18 to 34 Years | 10 (0.4%) | 40 (1.5%) |
| 35 to 64 Years | 73 (1.5%) | 22 (0.5%) |
| 65 to 74 Years | 46 (2.8%) | 14 (1.0%) |
| 75 Years and over | 31 (5.2%) | 157 (16.0%) |
Disability Class: Cognitive Difficulty
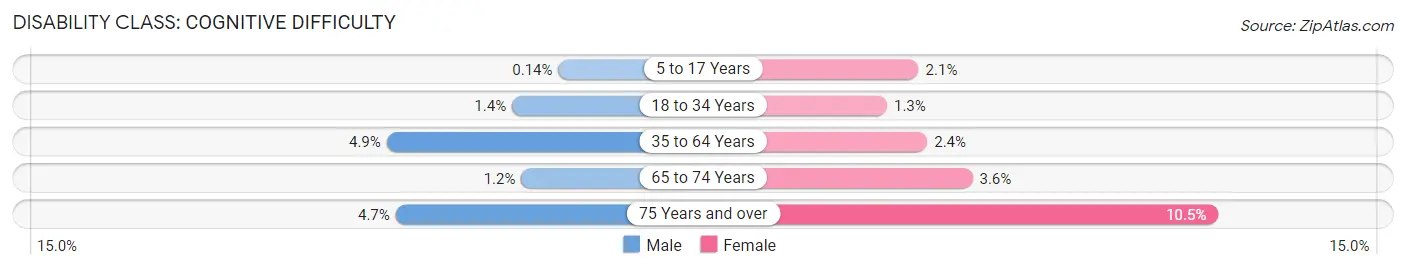
| Age Bracket | Male | Female |
| 5 to 17 Years | 3 (0.1%) | 23 (2.1%) |
| 18 to 34 Years | 33 (1.4%) | 33 (1.3%) |
| 35 to 64 Years | 244 (4.9%) | 110 (2.4%) |
| 65 to 74 Years | 19 (1.2%) | 53 (3.6%) |
| 75 Years and over | 28 (4.7%) | 103 (10.5%) |
Disability Class: Ambulatory Difficulty
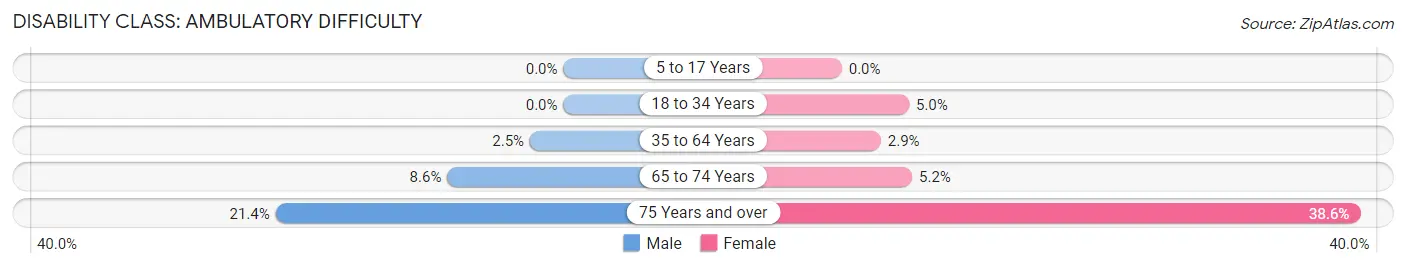
| Age Bracket | Male | Female |
| 5 to 17 Years | 0 (0.0%) | 0 (0.0%) |
| 18 to 34 Years | 0 (0.0%) | 131 (5.0%) |
| 35 to 64 Years | 123 (2.5%) | 134 (2.9%) |
| 65 to 74 Years | 140 (8.6%) | 76 (5.2%) |
| 75 Years and over | 128 (21.4%) | 379 (38.6%) |
Disability Class: Self-Care Difficulty
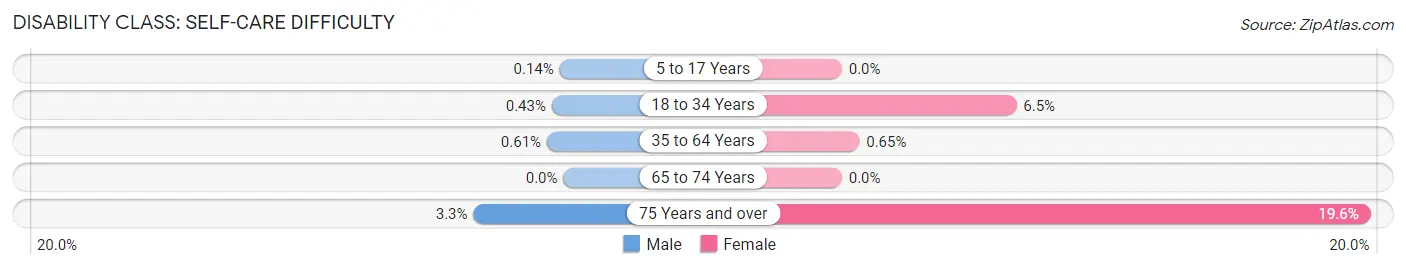
| Age Bracket | Male | Female |
| 5 to 17 Years | 3 (0.1%) | 0 (0.0%) |
| 18 to 34 Years | 10 (0.4%) | 170 (6.5%) |
| 35 to 64 Years | 30 (0.6%) | 30 (0.6%) |
| 65 to 74 Years | 0 (0.0%) | 0 (0.0%) |
| 75 Years and over | 20 (3.3%) | 193 (19.6%) |
Technology Access in Jacksonville Beach
Computing Device Access in Jacksonville Beach
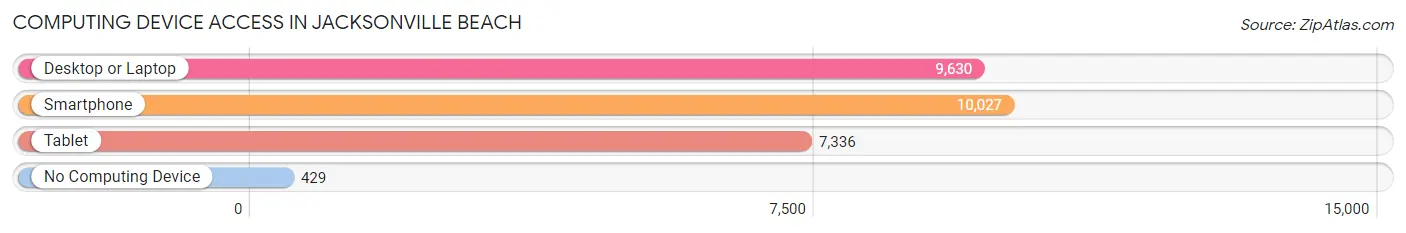
| Device Type | # Households | % Households |
| Desktop or Laptop | 9,630 | 89.0% |
| Smartphone | 10,027 | 92.6% |
| Tablet | 7,336 | 67.8% |
| No Computing Device | 429 | 4.0% |
| Total | 10,822 | 100.0% |
Internet Access in Jacksonville Beach
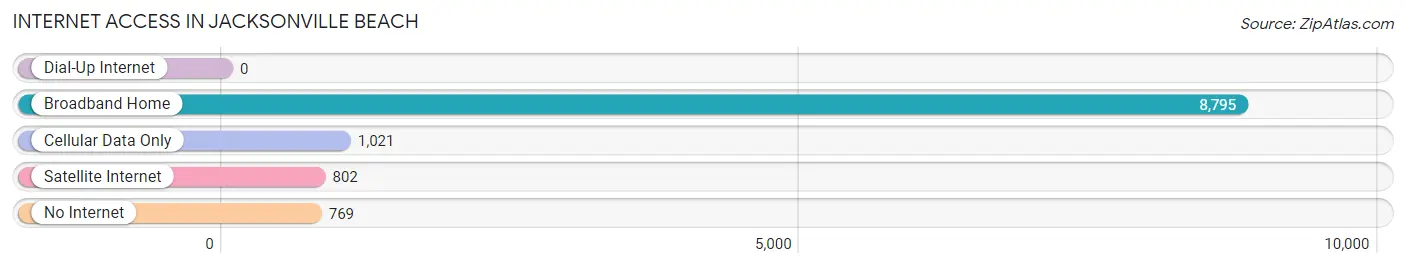
| Internet Type | # Households | % Households |
| Dial-Up Internet | 0 | 0.0% |
| Broadband Home | 8,795 | 81.3% |
| Cellular Data Only | 1,021 | 9.4% |
| Satellite Internet | 802 | 7.4% |
| No Internet | 769 | 7.1% |
| Total | 10,822 | 100.0% |
Jacksonville Beach Summary
Jacksonville Beach is a city located in Duval County, Florida, United States. It is part of the Jacksonville metropolitan area, which was home to 1,345,596 people in 2019. Jacksonville Beach is a popular tourist destination, known for its beaches, fishing, and other recreational activities.
Geography
Jacksonville Beach is located in northeastern Florida, on the Atlantic Ocean. It is bordered by the city of Jacksonville to the west, the Intracoastal Waterway to the north, and the Atlantic Ocean to the east and south. The city covers an area of approximately 10.5 square miles, with a population of 21,362 as of the 2019 census.
The city is divided into several distinct neighborhoods, including Atlantic Beach, Neptune Beach, and Jacksonville Beach. The city is home to several parks, including Hanna Park, which features a beach, picnic areas, and a nature center. The city also has several golf courses, including the Jacksonville Beach Golf Club and the Ponte Vedra Golf and Country Club.
Economy
The economy of Jacksonville Beach is largely driven by tourism. The city is home to several popular beaches, including Jacksonville Beach, Atlantic Beach, and Neptune Beach. These beaches attract visitors from all over the world, who come to enjoy the sun, sand, and surf.
In addition to tourism, Jacksonville Beach is home to several businesses, including restaurants, retail stores, and hotels. The city is also home to several corporate headquarters, including CSX Corporation, Fidelity National Financial, and Winn-Dixie.
Demographics
As of the 2019 census, the population of Jacksonville Beach was 21,362. The racial makeup of the city was 79.2% White, 11.2% African American, 0.3% Native American, 3.2% Asian, 0.1% Pacific Islander, 3.2% from other races, and 3.0% from two or more races. Hispanic or Latino of any race were 8.2% of the population.
The median household income in Jacksonville Beach was $50,945, and the median family income was $60,945. The per capita income for the city was $30,945. About 8.2% of families and 10.2% of the population were below the poverty line, including 14.2% of those under age 18 and 6.2% of those age 65 or over.
Conclusion
Jacksonville Beach is a popular tourist destination in northeastern Florida, known for its beaches, fishing, and other recreational activities. The city is home to several businesses, including restaurants, retail stores, and hotels. The population of Jacksonville Beach was 21,362 as of the 2019 census, with a median household income of $50,945. Jacksonville Beach is a vibrant city with a diverse population and a strong economy.
Common Questions
What is the Total Population of Jacksonville Beach?
Total Population of Jacksonville Beach is 23,583.
What is the Total Male Population of Jacksonville Beach?
Total Male Population of Jacksonville Beach is 12,275.
What is the Total Female Population of Jacksonville Beach?
Total Female Population of Jacksonville Beach is 11,308.
What is the Ratio of Males per 100 Females in Jacksonville Beach?
There are 108.55 Males per 100 Females in Jacksonville Beach.
What is the Ratio of Females per 100 Males in Jacksonville Beach?
There are 92.12 Females per 100 Males in Jacksonville Beach.
What is the Median Population Age in Jacksonville Beach?
Median Population Age in Jacksonville Beach is 43.3 Years.
What is the Average Family Size in Jacksonville Beach
Average Family Size in Jacksonville Beach is 2.7 People.
What is the Average Household Size in Jacksonville Beach
Average Household Size in Jacksonville Beach is 2.2 People.
What is Per Capita Income in Jacksonville Beach?
Per Capita income in Jacksonville Beach is $72,826.
What is the Median Family Income in Jacksonville Beach?
Median Family Income in Jacksonville Beach is $134,643.
What is the Median Household income in Jacksonville Beach?
Median Household Income in Jacksonville Beach is $109,649.
What is Income or Wage Gap in Jacksonville Beach?
Income or Wage Gap in Jacksonville Beach is 23.4%.
Women in Jacksonville Beach earn 76.6 cents for every dollar earned by a man.
What is Family Income Deficit in Jacksonville Beach?
Family Income Deficit in Jacksonville Beach is $10,490.
Families that are below poverty line in Jacksonville Beach earn $10,490 less on average than the poverty threshold level.
What is Inequality or Gini Index in Jacksonville Beach?
Inequality or Gini Index in Jacksonville Beach is 0.48.
How Large is the Labor Force in Jacksonville Beach?
There are 14,042 People in the Labor Forcein in Jacksonville Beach.
What is the Percentage of People in the Labor Force in Jacksonville Beach?
69.2% of People are in the Labor Force in Jacksonville Beach.
What is the Unemployment Rate in Jacksonville Beach?
Unemployment Rate in Jacksonville Beach is 2.1%.