The Crossings, FL
The Crossings Map
The Crossings Overview
22,708
TOTAL POPULATION
11,020
MALE POPULATION
11,688
FEMALE POPULATION
94.28
MALES / 100 FEMALES
106.06
FEMALES / 100 MALES
43.5
MEDIAN AGE
3.2
AVG FAMILY SIZE
2.8
AVG HOUSEHOLD SIZE
$35,736
PER CAPITA INCOME
$89,481
AVG FAMILY INCOME
$82,566
AVG HOUSEHOLD INCOME
25.5%
WAGE / INCOME GAP [ % ]
74.5¢/ $1
WAGE / INCOME GAP [ $ ]
$13,180
FAMILY INCOME DEFICIT
0.43
INEQUALITY / GINI INDEX
11,981
LABOR FORCE [ PEOPLE ]
63.9%
PERCENT IN LABOR FORCE
2.4%
UNEMPLOYMENT RATE
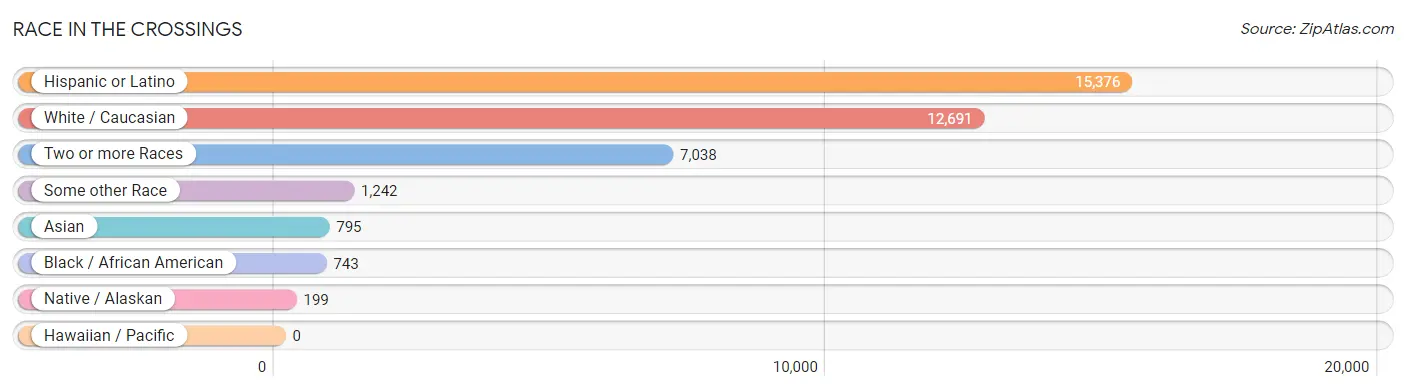
Race in The Crossings
The most populous races in The Crossings are Hispanic or Latino (15,376 | 67.7%), White / Caucasian (12,691 | 55.9%), and Two or more Races (7,038 | 31.0%).
| Race | # Population | % Population |
| Asian | 795 | 3.5% |
| Black / African American | 743 | 3.3% |
| Hawaiian / Pacific | 0 | 0.0% |
| Hispanic or Latino | 15,376 | 67.7% |
| Native / Alaskan | 199 | 0.9% |
| White / Caucasian | 12,691 | 55.9% |
| Two or more Races | 7,038 | 31.0% |
| Some other Race | 1,242 | 5.5% |
| Total | 22,708 | 100.0% |
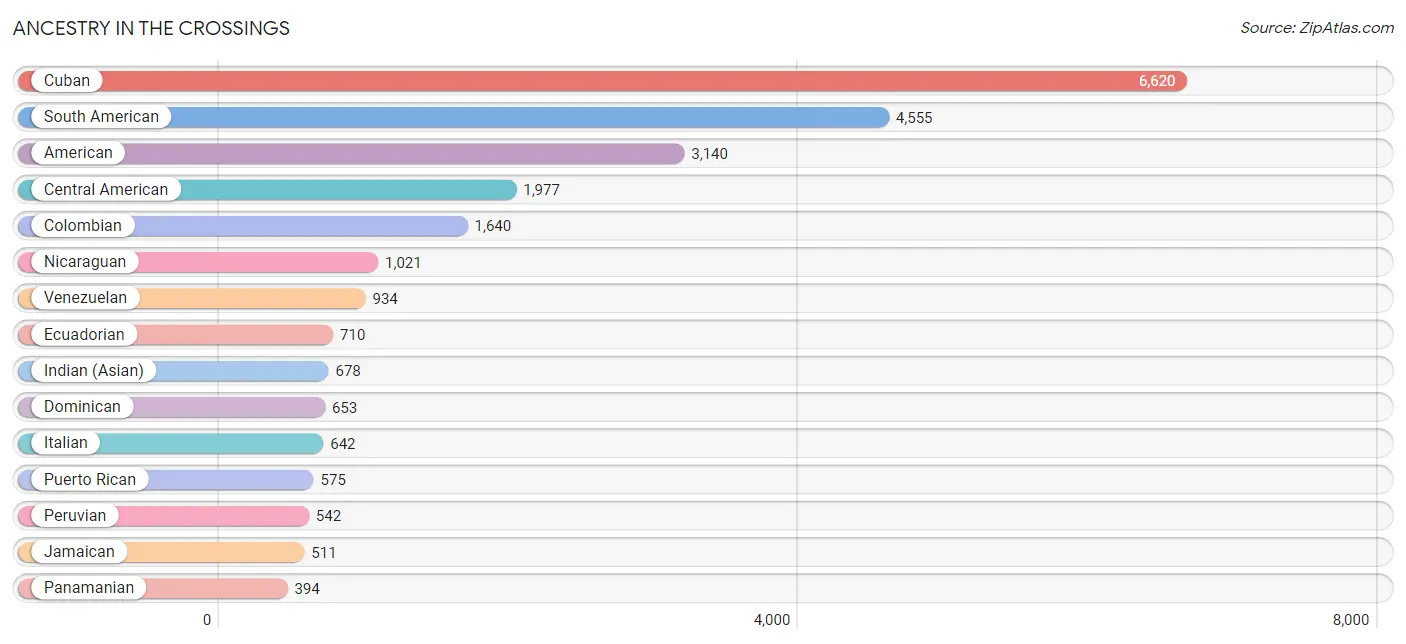
Ancestry in The Crossings
The most populous ancestries reported in The Crossings are Cuban (6,620 | 29.1%), South American (4,555 | 20.1%), American (3,140 | 13.8%), Central American (1,977 | 8.7%), and Colombian (1,640 | 7.2%), together accounting for 79.0% of all The Crossings residents.
| Ancestry | # Population | % Population |
| African | 14 | 0.1% |
| American | 3,140 | 13.8% |
| Arab | 164 | 0.7% |
| Argentinean | 334 | 1.5% |
| Armenian | 26 | 0.1% |
| Austrian | 23 | 0.1% |
| Basque | 10 | 0.0% |
| Bhutanese | 24 | 0.1% |
| Bolivian | 9 | 0.0% |
| Brazilian | 60 | 0.3% |
| British | 115 | 0.5% |
| British West Indian | 7 | 0.0% |
| Burmese | 13 | 0.1% |
| Canadian | 19 | 0.1% |
| Central American | 1,977 | 8.7% |
| Cherokee | 52 | 0.2% |
| Chilean | 356 | 1.6% |
| Colombian | 1,640 | 7.2% |
| Costa Rican | 52 | 0.2% |
| Cuban | 6,620 | 29.1% |
| Dominican | 653 | 2.9% |
| Dutch | 8 | 0.0% |
| Eastern European | 146 | 0.6% |
| Ecuadorian | 710 | 3.1% |
| English | 150 | 0.7% |
| Estonian | 13 | 0.1% |
| European | 160 | 0.7% |
| Filipino | 37 | 0.2% |
| French | 254 | 1.1% |
| French Canadian | 13 | 0.1% |
| German | 268 | 1.2% |
| German Russian | 21 | 0.1% |
| Greek | 39 | 0.2% |
| Guatemalan | 292 | 1.3% |
| Haitian | 214 | 0.9% |
| Honduran | 80 | 0.4% |
| Hungarian | 44 | 0.2% |
| Indian (Asian) | 678 | 3.0% |
| Iranian | 29 | 0.1% |
| Irish | 352 | 1.5% |
| Israeli | 24 | 0.1% |
| Italian | 642 | 2.8% |
| Jamaican | 511 | 2.2% |
| Korean | 24 | 0.1% |
| Lebanese | 55 | 0.2% |
| Lithuanian | 8 | 0.0% |
| Mexican | 202 | 0.9% |
| Moroccan | 23 | 0.1% |
| Nicaraguan | 1,021 | 4.5% |
| Northern European | 33 | 0.2% |
| Norwegian | 22 | 0.1% |
| Panamanian | 394 | 1.7% |
| Paraguayan | 15 | 0.1% |
| Peruvian | 542 | 2.4% |
| Polish | 186 | 0.8% |
| Portuguese | 75 | 0.3% |
| Puerto Rican | 575 | 2.5% |
| Romanian | 17 | 0.1% |
| Russian | 77 | 0.3% |
| Salvadoran | 138 | 0.6% |
| Scandinavian | 29 | 0.1% |
| Scotch-Irish | 11 | 0.1% |
| Scottish | 172 | 0.8% |
| Slovak | 35 | 0.2% |
| South African | 24 | 0.1% |
| South American | 4,555 | 20.1% |
| South American Indian | 240 | 1.1% |
| Spaniard | 102 | 0.4% |
| Sri Lankan | 23 | 0.1% |
| Subsaharan African | 38 | 0.2% |
| Swedish | 27 | 0.1% |
| Swiss | 46 | 0.2% |
| Thai | 163 | 0.7% |
| Trinidadian and Tobagonian | 23 | 0.1% |
| Turkish | 25 | 0.1% |
| Ukrainian | 29 | 0.1% |
| Uruguayan | 15 | 0.1% |
| Venezuelan | 934 | 4.1% |
| Welsh | 7 | 0.0% |
| West Indian | 49 | 0.2% | View All 80 Rows |
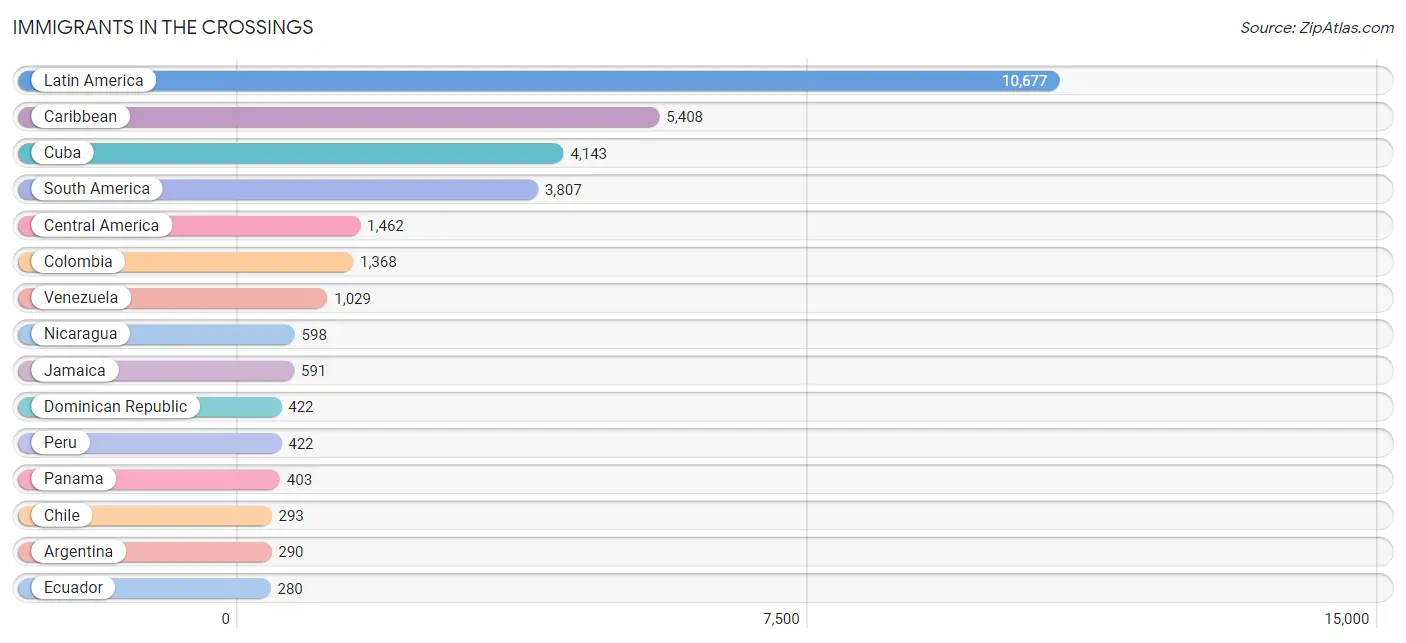
Immigrants in The Crossings
The most numerous immigrant groups reported in The Crossings came from Latin America (10,677 | 47.0%), Caribbean (5,408 | 23.8%), Cuba (4,143 | 18.2%), South America (3,807 | 16.8%), and Central America (1,462 | 6.4%), together accounting for 112.3% of all The Crossings residents.
| Immigration Origin | # Population | % Population |
| Africa | 47 | 0.2% |
| Argentina | 290 | 1.3% |
| Asia | 261 | 1.1% |
| Austria | 5 | 0.0% |
| Bolivia | 30 | 0.1% |
| Brazil | 22 | 0.1% |
| Canada | 34 | 0.2% |
| Caribbean | 5,408 | 23.8% |
| Central America | 1,462 | 6.4% |
| Chile | 293 | 1.3% |
| China | 120 | 0.5% |
| Colombia | 1,368 | 6.0% |
| Costa Rica | 42 | 0.2% |
| Cuba | 4,143 | 18.2% |
| Dominican Republic | 422 | 1.9% |
| Eastern Asia | 120 | 0.5% |
| Eastern Europe | 26 | 0.1% |
| Ecuador | 280 | 1.2% |
| El Salvador | 31 | 0.1% |
| Europe | 246 | 1.1% |
| France | 88 | 0.4% |
| Guatemala | 239 | 1.1% |
| Haiti | 127 | 0.6% |
| Honduras | 62 | 0.3% |
| India | 66 | 0.3% |
| Israel | 52 | 0.2% |
| Jamaica | 591 | 2.6% |
| Latin America | 10,677 | 47.0% |
| Mexico | 87 | 0.4% |
| Morocco | 23 | 0.1% |
| Nicaragua | 598 | 2.6% |
| Northern Africa | 23 | 0.1% |
| Northern Europe | 22 | 0.1% |
| Norway | 16 | 0.1% |
| Panama | 403 | 1.8% |
| Peru | 422 | 1.9% |
| Poland | 7 | 0.0% |
| Romania | 8 | 0.0% |
| Russia | 11 | 0.1% |
| South Africa | 24 | 0.1% |
| South America | 3,807 | 16.8% |
| South Central Asia | 66 | 0.3% |
| South Eastern Asia | 23 | 0.1% |
| Southern Europe | 64 | 0.3% |
| Spain | 64 | 0.3% |
| St. Vincent and the Grenadines | 7 | 0.0% |
| Switzerland | 41 | 0.2% |
| Taiwan | 80 | 0.4% |
| Trinidad and Tobago | 56 | 0.3% |
| Uruguay | 58 | 0.3% |
| Venezuela | 1,029 | 4.5% |
| Vietnam | 23 | 0.1% |
| Western Asia | 52 | 0.2% |
| Western Europe | 134 | 0.6% | View All 54 Rows |
Sex and Age in The Crossings
Sex and Age in The Crossings
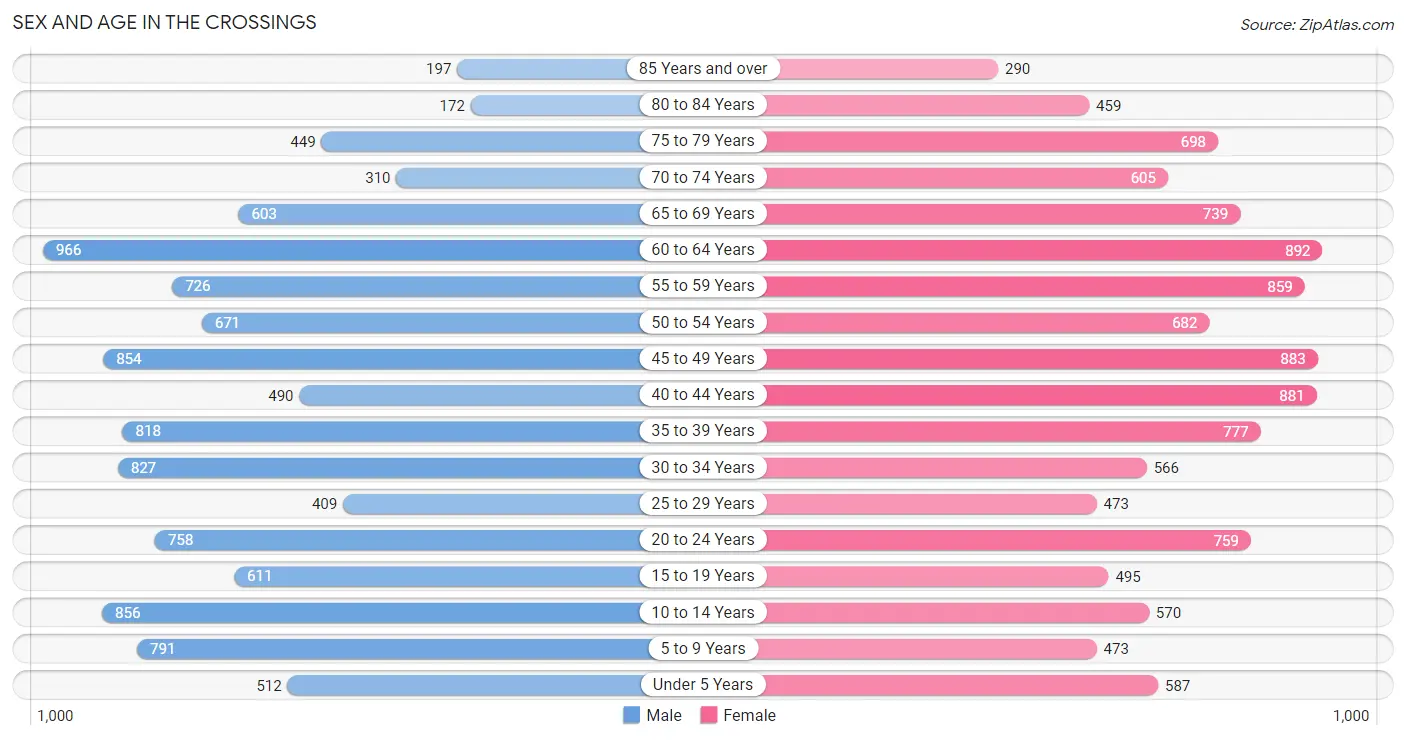
The most populous age groups in The Crossings are 60 to 64 Years (966 | 8.8%) for men and 60 to 64 Years (892 | 7.6%) for women.
| Age Bracket | Male | Female |
| Under 5 Years | 512 (4.6%) | 587 (5.0%) |
| 5 to 9 Years | 791 (7.2%) | 473 (4.1%) |
| 10 to 14 Years | 856 (7.8%) | 570 (4.9%) |
| 15 to 19 Years | 611 (5.5%) | 495 (4.2%) |
| 20 to 24 Years | 758 (6.9%) | 759 (6.5%) |
| 25 to 29 Years | 409 (3.7%) | 473 (4.1%) |
| 30 to 34 Years | 827 (7.5%) | 566 (4.8%) |
| 35 to 39 Years | 818 (7.4%) | 777 (6.7%) |
| 40 to 44 Years | 490 (4.4%) | 881 (7.5%) |
| 45 to 49 Years | 854 (7.7%) | 883 (7.5%) |
| 50 to 54 Years | 671 (6.1%) | 682 (5.8%) |
| 55 to 59 Years | 726 (6.6%) | 859 (7.3%) |
| 60 to 64 Years | 966 (8.8%) | 892 (7.6%) |
| 65 to 69 Years | 603 (5.5%) | 739 (6.3%) |
| 70 to 74 Years | 310 (2.8%) | 605 (5.2%) |
| 75 to 79 Years | 449 (4.1%) | 698 (6.0%) |
| 80 to 84 Years | 172 (1.6%) | 459 (3.9%) |
| 85 Years and over | 197 (1.8%) | 290 (2.5%) |
| Total | 11,020 (100.0%) | 11,688 (100.0%) |
Families and Households in The Crossings
Median Family Size in The Crossings
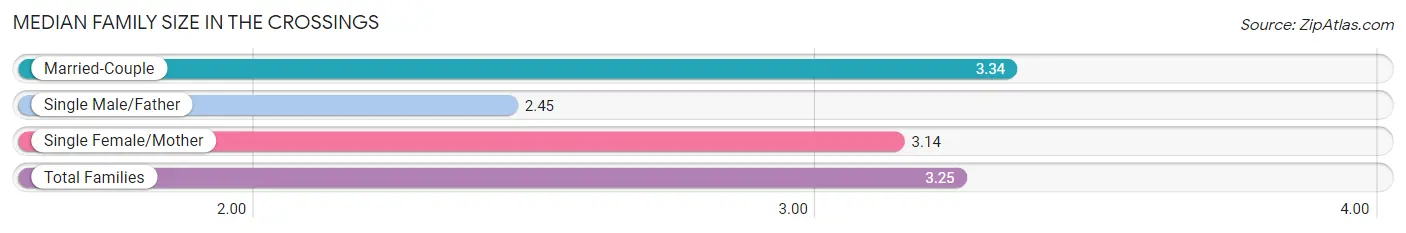
The median family size in The Crossings is 3.25 persons per family, with married-couple families (4,528 | 75.4%) accounting for the largest median family size of 3.34 persons per family. On the other hand, single male/father families (356 | 5.9%) represent the smallest median family size with 2.45 persons per family.
| Family Type | # Families | Family Size |
| Married-Couple | 4,528 (75.4%) | 3.34 |
| Single Male/Father | 356 (5.9%) | 2.45 |
| Single Female/Mother | 1,117 (18.6%) | 3.14 |
| Total Families | 6,001 (100.0%) | 3.25 |
Median Household Size in The Crossings
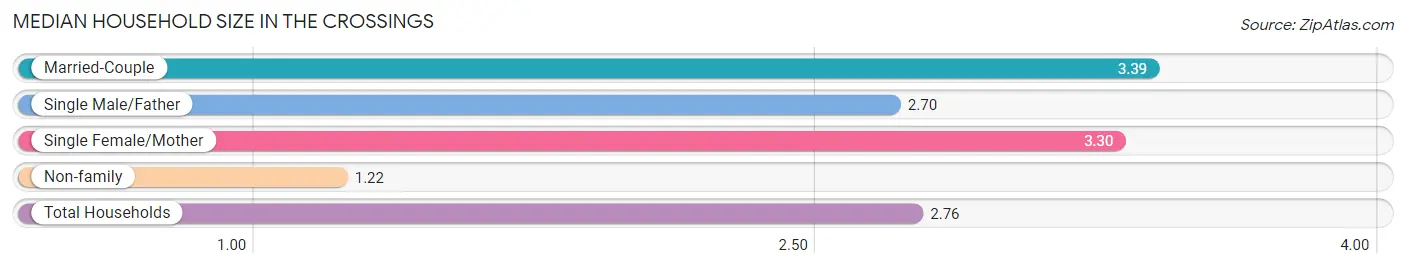
The median household size in The Crossings is 2.76 persons per household, with married-couple households (4,528 | 55.3%) accounting for the largest median household size of 3.39 persons per household. non-family households (2,189 | 26.7%) represent the smallest median household size with 1.22 persons per household.
| Household Type | # Households | Household Size |
| Married-Couple | 4,528 (55.3%) | 3.39 |
| Single Male/Father | 356 (4.3%) | 2.70 |
| Single Female/Mother | 1,117 (13.6%) | 3.30 |
| Non-family | 2,189 (26.7%) | 1.22 |
| Total Households | 8,190 (100.0%) | 2.76 |
Household Size by Marriage Status in The Crossings
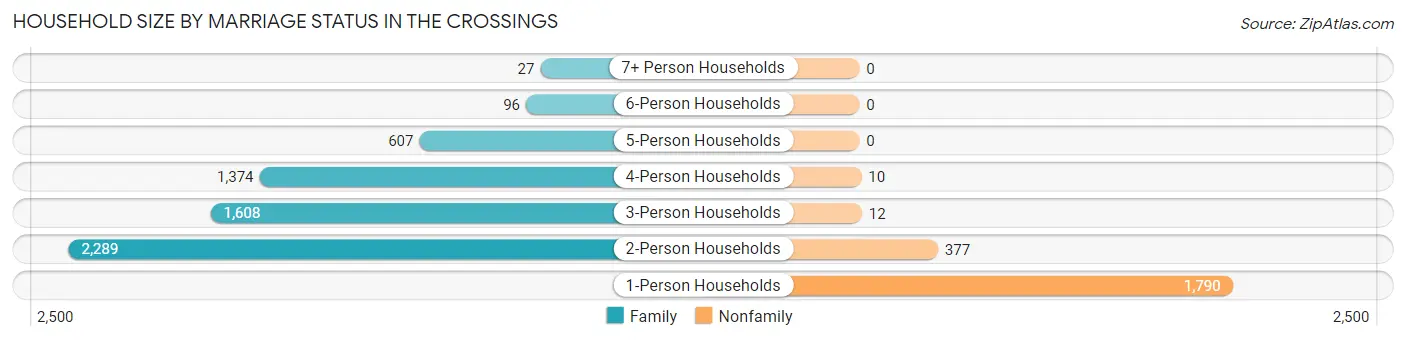
Out of a total of 8,190 households in The Crossings, 6,001 (73.3%) are family households, while 2,189 (26.7%) are nonfamily households. The most numerous type of family households are 2-person households, comprising 2,289, and the most common type of nonfamily households are 1-person households, comprising 1,790.
| Household Size | Family Households | Nonfamily Households |
| 1-Person Households | - | 1,790 (21.9%) |
| 2-Person Households | 2,289 (28.0%) | 377 (4.6%) |
| 3-Person Households | 1,608 (19.6%) | 12 (0.2%) |
| 4-Person Households | 1,374 (16.8%) | 10 (0.1%) |
| 5-Person Households | 607 (7.4%) | 0 (0.0%) |
| 6-Person Households | 96 (1.2%) | 0 (0.0%) |
| 7+ Person Households | 27 (0.3%) | 0 (0.0%) |
| Total | 6,001 (73.3%) | 2,189 (26.7%) |
Female Fertility in The Crossings
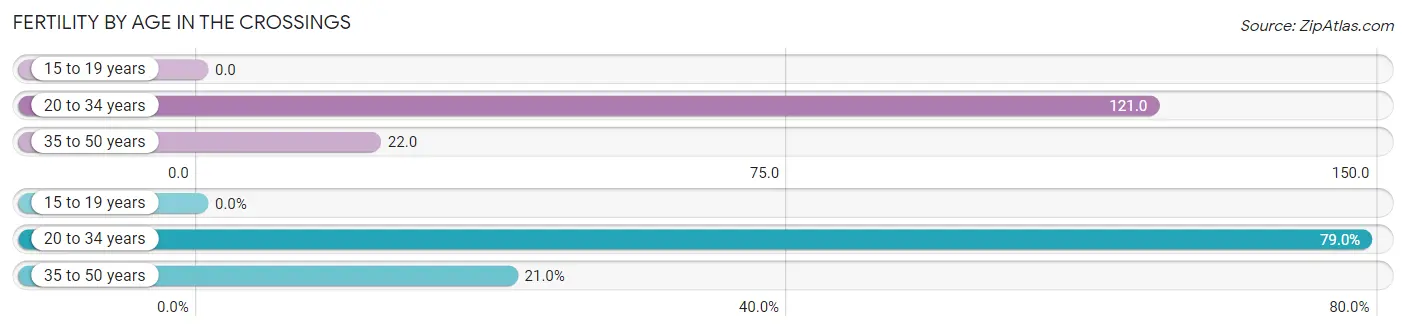
Fertility by Age in The Crossings
Average fertility rate in The Crossings is 56.0 births per 1,000 women. Women in the age bracket of 20 to 34 years have the highest fertility rate with 121.0 births per 1,000 women. Women in the age bracket of 20 to 34 years acount for 79.0% of all women with births.
| Age Bracket | Women with Births | Births / 1,000 Women |
| 15 to 19 years | 0 (0.0%) | 0.0 |
| 20 to 34 years | 218 (79.0%) | 121.0 |
| 35 to 50 years | 58 (21.0%) | 22.0 |
| Total | 276 (100.0%) | 56.0 |
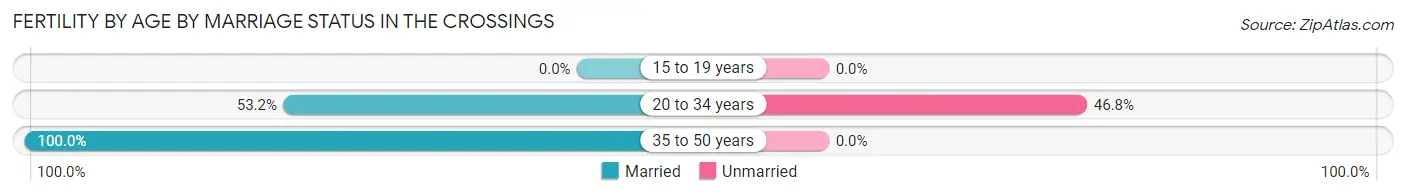
Fertility by Age by Marriage Status in The Crossings
63.0% of women with births (276) in The Crossings are married. The highest percentage of unmarried women with births falls into 20 to 34 years age bracket with 46.8% of them unmarried at the time of birth, while the lowest percentage of unmarried women with births belong to 35 to 50 years age bracket with 0.0% of them unmarried.
| Age Bracket | Married | Unmarried |
| 15 to 19 years | 0 (0.0%) | 0 (0.0%) |
| 20 to 34 years | 116 (53.2%) | 102 (46.8%) |
| 35 to 50 years | 58 (100.0%) | 0 (0.0%) |
| Total | 174 (63.0%) | 102 (37.0%) |
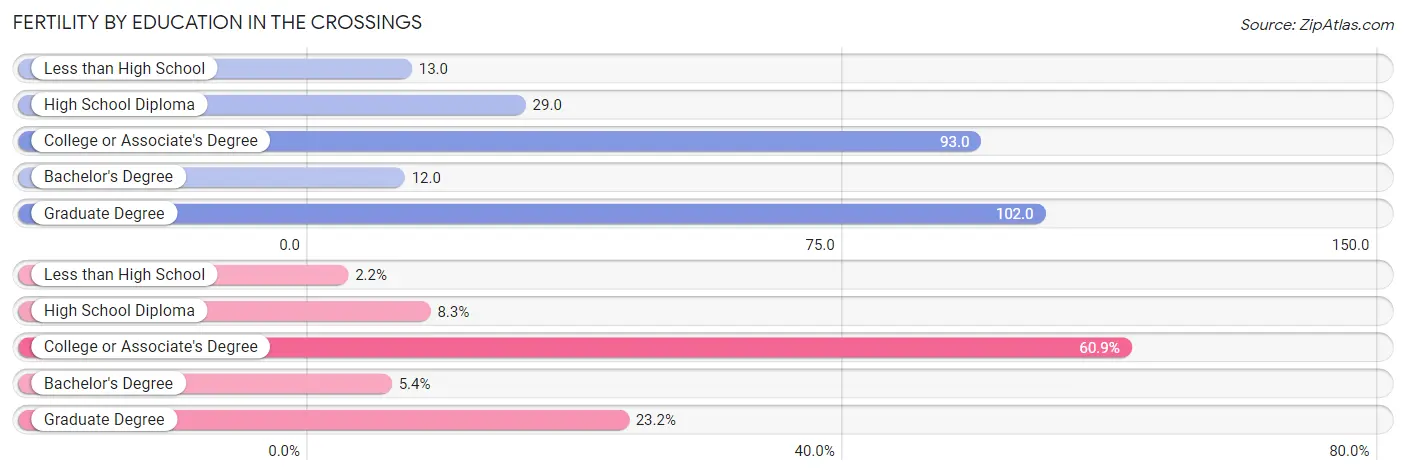
Fertility by Education in The Crossings
Average fertility rate in The Crossings is 56.0 births per 1,000 women. Women with the education attainment of graduate degree have the highest fertility rate of 102.0 births per 1,000 women, while women with the education attainment of bachelor's degree have the lowest fertility at 12.0 births per 1,000 women. Women with the education attainment of college or associate's degree represent 60.9% of all women with births.
| Educational Attainment | Women with Births | Births / 1,000 Women |
| Less than High School | 6 (2.2%) | 13.0 |
| High School Diploma | 23 (8.3%) | 29.0 |
| College or Associate's Degree | 168 (60.9%) | 93.0 |
| Bachelor's Degree | 15 (5.4%) | 12.0 |
| Graduate Degree | 64 (23.2%) | 102.0 |
| Total | 276 (100.0%) | 56.0 |
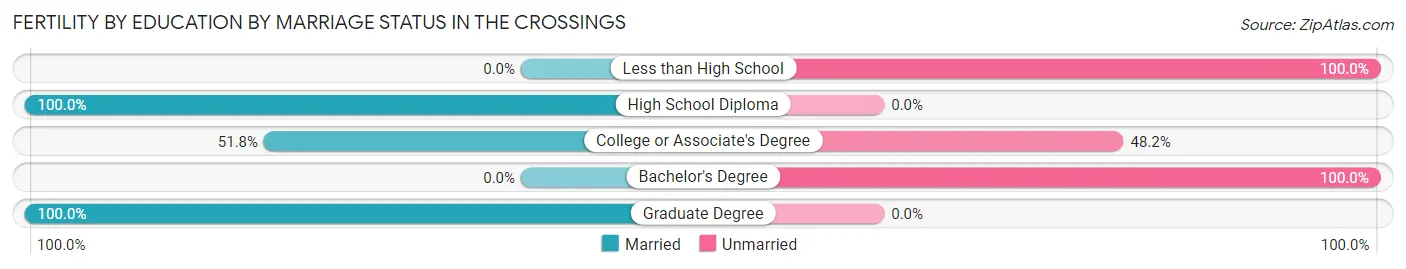
Fertility by Education by Marriage Status in The Crossings
37.0% of women with births in The Crossings are unmarried. Women with the educational attainment of high school diploma are most likely to be married with 100.0% of them married at childbirth, while women with the educational attainment of less than high school are least likely to be married with 100.0% of them unmarried at childbirth.
| Educational Attainment | Married | Unmarried |
| Less than High School | 0 (0.0%) | 6 (100.0%) |
| High School Diploma | 23 (100.0%) | 0 (0.0%) |
| College or Associate's Degree | 87 (51.8%) | 81 (48.2%) |
| Bachelor's Degree | 0 (0.0%) | 15 (100.0%) |
| Graduate Degree | 64 (100.0%) | 0 (0.0%) |
| Total | 174 (63.0%) | 102 (37.0%) |
Income in The Crossings
Income Overview in The Crossings
Per Capita Income in The Crossings is $35,736, while median incomes of families and households are $89,481 and $82,566 respectively.
| Characteristic | Number | Measure |
| Per Capita Income | 22,708 | $35,736 |
| Median Family Income | 6,001 | $89,481 |
| Mean Family Income | 6,001 | $109,258 |
| Median Household Income | 8,190 | $82,566 |
| Mean Household Income | 8,190 | $95,970 |
| Income Deficit | 6,001 | $13,180 |
| Wage / Income Gap (%) | 22,708 | 25.49% |
| Wage / Income Gap ($) | 22,708 | 74.51¢ per $1 |
| Gini / Inequality Index | 22,708 | 0.43 |
Earnings by Sex in The Crossings
Average Earnings in The Crossings are $45,215, $50,123 for men and $37,349 for women, a difference of 25.5%.
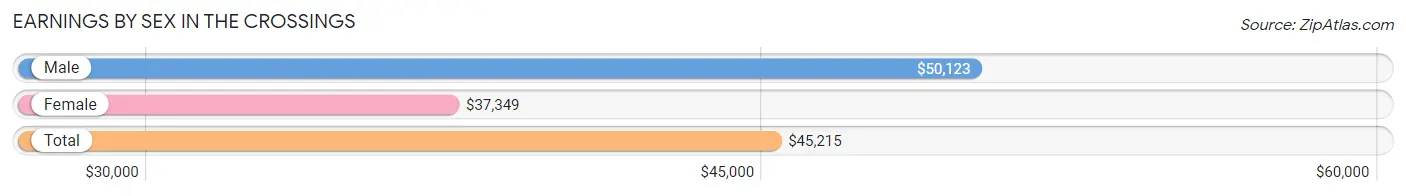
| Sex | Number | Average Earnings |
| Male | 6,314 (51.2%) | $50,123 |
| Female | 6,011 (48.8%) | $37,349 |
| Total | 12,325 (100.0%) | $45,215 |
Earnings by Sex by Income Bracket in The Crossings
The most common earnings brackets in The Crossings are $100,000+ for men (973 | 15.4%) and $100,000+ for women (776 | 12.9%).
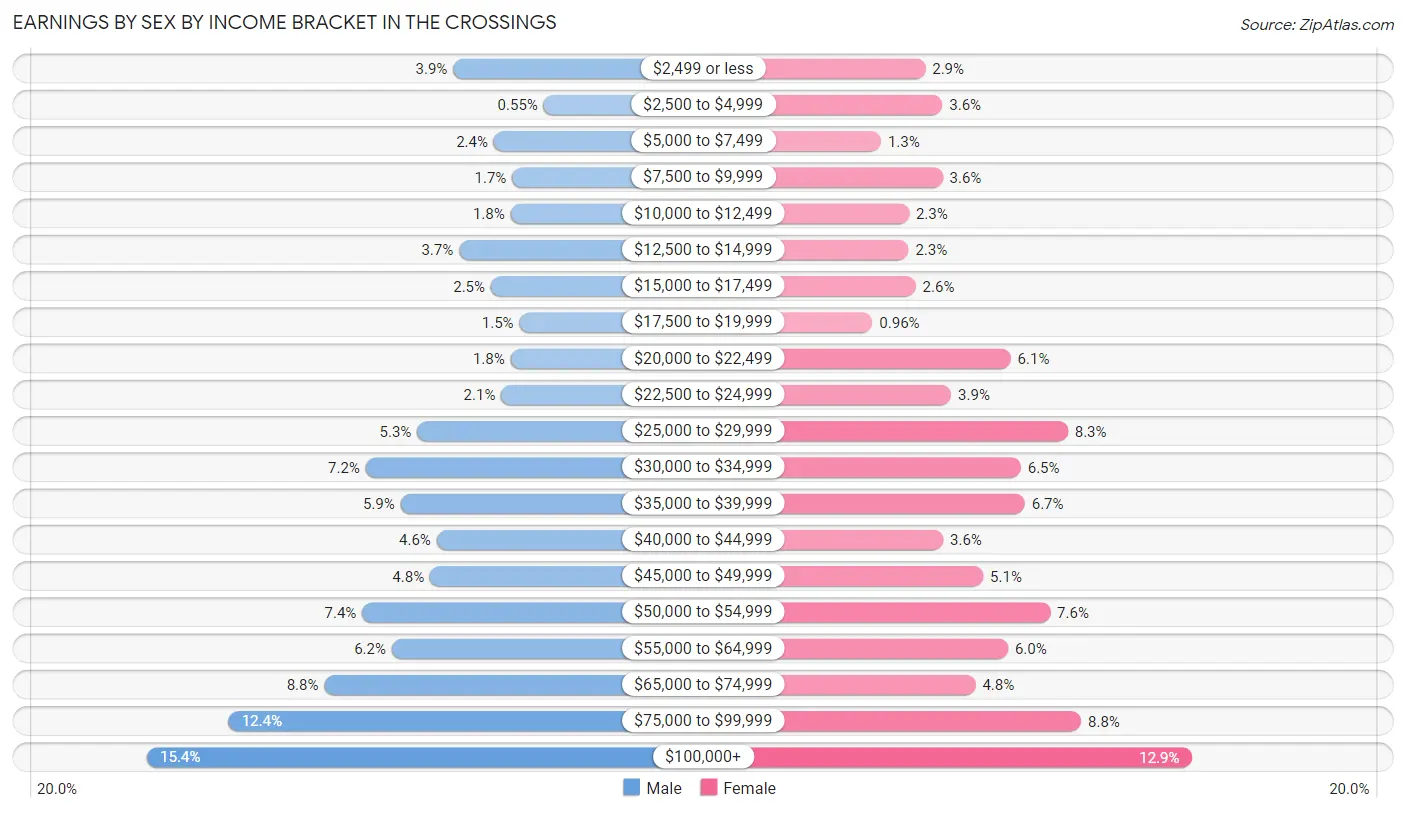
| Income | Male | Female |
| $2,499 or less | 249 (3.9%) | 177 (2.9%) |
| $2,500 to $4,999 | 35 (0.5%) | 215 (3.6%) |
| $5,000 to $7,499 | 153 (2.4%) | 77 (1.3%) |
| $7,500 to $9,999 | 109 (1.7%) | 216 (3.6%) |
| $10,000 to $12,499 | 113 (1.8%) | 140 (2.3%) |
| $12,500 to $14,999 | 235 (3.7%) | 139 (2.3%) |
| $15,000 to $17,499 | 160 (2.5%) | 155 (2.6%) |
| $17,500 to $19,999 | 92 (1.5%) | 58 (1.0%) |
| $20,000 to $22,499 | 113 (1.8%) | 369 (6.1%) |
| $22,500 to $24,999 | 135 (2.1%) | 235 (3.9%) |
| $25,000 to $29,999 | 334 (5.3%) | 498 (8.3%) |
| $30,000 to $34,999 | 456 (7.2%) | 392 (6.5%) |
| $35,000 to $39,999 | 373 (5.9%) | 401 (6.7%) |
| $40,000 to $44,999 | 288 (4.6%) | 217 (3.6%) |
| $45,000 to $49,999 | 304 (4.8%) | 307 (5.1%) |
| $50,000 to $54,999 | 464 (7.3%) | 458 (7.6%) |
| $55,000 to $64,999 | 394 (6.2%) | 363 (6.0%) |
| $65,000 to $74,999 | 554 (8.8%) | 290 (4.8%) |
| $75,000 to $99,999 | 780 (12.3%) | 528 (8.8%) |
| $100,000+ | 973 (15.4%) | 776 (12.9%) |
| Total | 6,314 (100.0%) | 6,011 (100.0%) |
Earnings by Sex by Educational Attainment in The Crossings
Average earnings in The Crossings are $54,024 for men and $44,572 for women, a difference of 17.5%. Men with an educational attainment of graduate degree enjoy the highest average annual earnings of $68,834, while those with less than high school education earn the least with $29,100. Women with an educational attainment of graduate degree earn the most with the average annual earnings of $64,457, while those with less than high school education have the smallest earnings of $26,051.
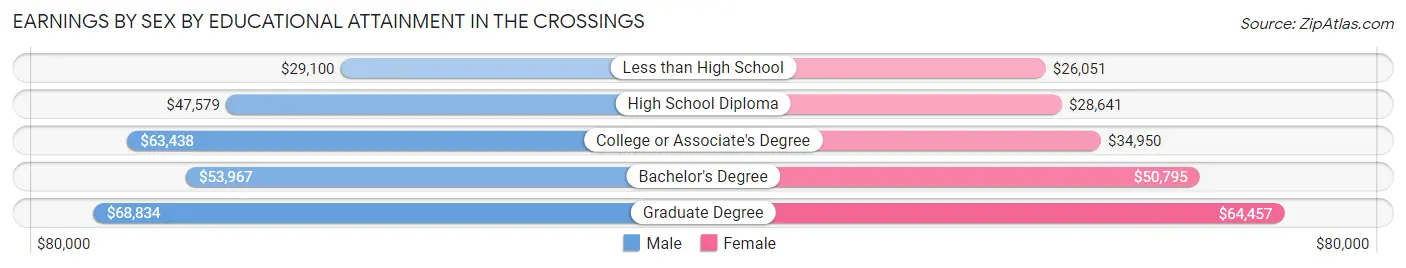
| Educational Attainment | Male Income | Female Income |
| Less than High School | $29,100 | $26,051 |
| High School Diploma | $47,579 | $28,641 |
| College or Associate's Degree | $63,438 | $34,950 |
| Bachelor's Degree | $53,967 | $50,795 |
| Graduate Degree | $68,834 | $64,457 |
| Total | $54,024 | $44,572 |
Family Income in The Crossings
Family Income Brackets in The Crossings
According to the The Crossings family income data, there are 1,158 families falling into the $100,000 to $149,999 income range, which is the most common income bracket and makes up 19.3% of all families. Conversely, the $10,000 to $14,999 income bracket is the least frequent group with only 66 families (1.1%) belonging to this category.
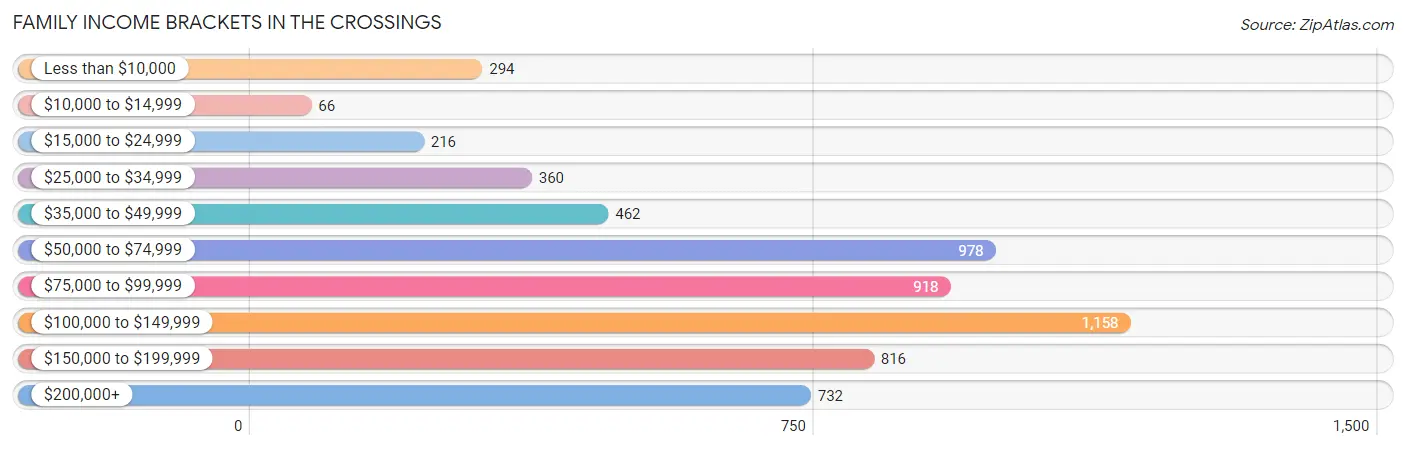
| Income Bracket | # Families | % Families |
| Less than $10,000 | 294 | 4.9% |
| $10,000 to $14,999 | 66 | 1.1% |
| $15,000 to $24,999 | 216 | 3.6% |
| $25,000 to $34,999 | 360 | 6.0% |
| $35,000 to $49,999 | 462 | 7.7% |
| $50,000 to $74,999 | 978 | 16.3% |
| $75,000 to $99,999 | 918 | 15.3% |
| $100,000 to $149,999 | 1,158 | 19.3% |
| $150,000 to $199,999 | 816 | 13.6% |
| $200,000+ | 732 | 12.2% |
Family Income by Famaliy Size in The Crossings
6-person families (66 | 1.1%) account for the highest median family income in The Crossings with $242,574 per family, while 4-person families (1,305 | 21.7%) have the highest median income of $42,131 per family member.
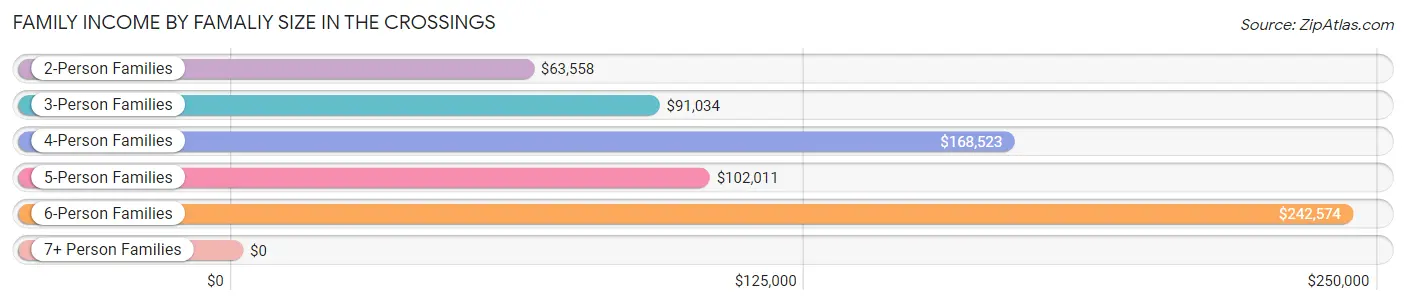
| Income Bracket | # Families | Median Income |
| 2-Person Families | 2,393 (39.9%) | $63,558 |
| 3-Person Families | 1,682 (28.0%) | $91,034 |
| 4-Person Families | 1,305 (21.7%) | $168,523 |
| 5-Person Families | 528 (8.8%) | $102,011 |
| 6-Person Families | 66 (1.1%) | $242,574 |
| 7+ Person Families | 27 (0.4%) | $0 |
| Total | 6,001 (100.0%) | $89,481 |
Family Income by Number of Earners in The Crossings
The median family income in The Crossings is $89,481, with families comprising 3+ earners (870) having the highest median family income of $140,481, while families with no earners (818) have the lowest median family income of $25,886, accounting for 14.5% and 13.6% of families, respectively.
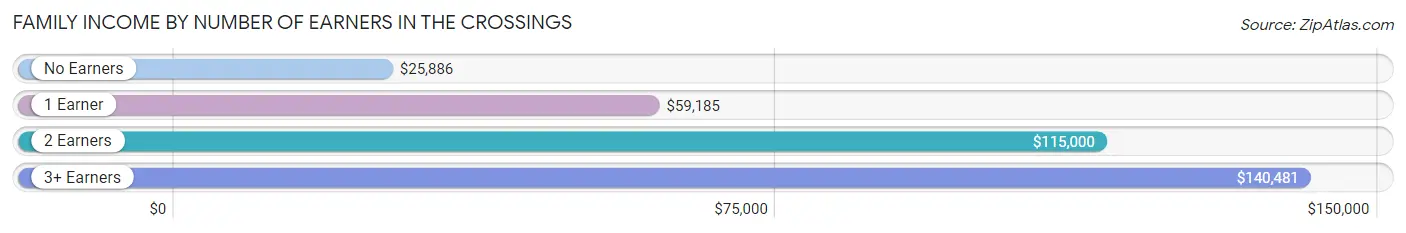
| Number of Earners | # Families | Median Income |
| No Earners | 818 (13.6%) | $25,886 |
| 1 Earner | 1,463 (24.4%) | $59,185 |
| 2 Earners | 2,850 (47.5%) | $115,000 |
| 3+ Earners | 870 (14.5%) | $140,481 |
| Total | 6,001 (100.0%) | $89,481 |
Household Income in The Crossings
Household Income Brackets in The Crossings
With 1,581 households falling in the category, the $100,000 to $149,999 income range is the most frequent in The Crossings, accounting for 19.3% of all households. In contrast, only 336 households (4.1%) fall into the $10,000 to $14,999 income bracket, making it the least populous group.
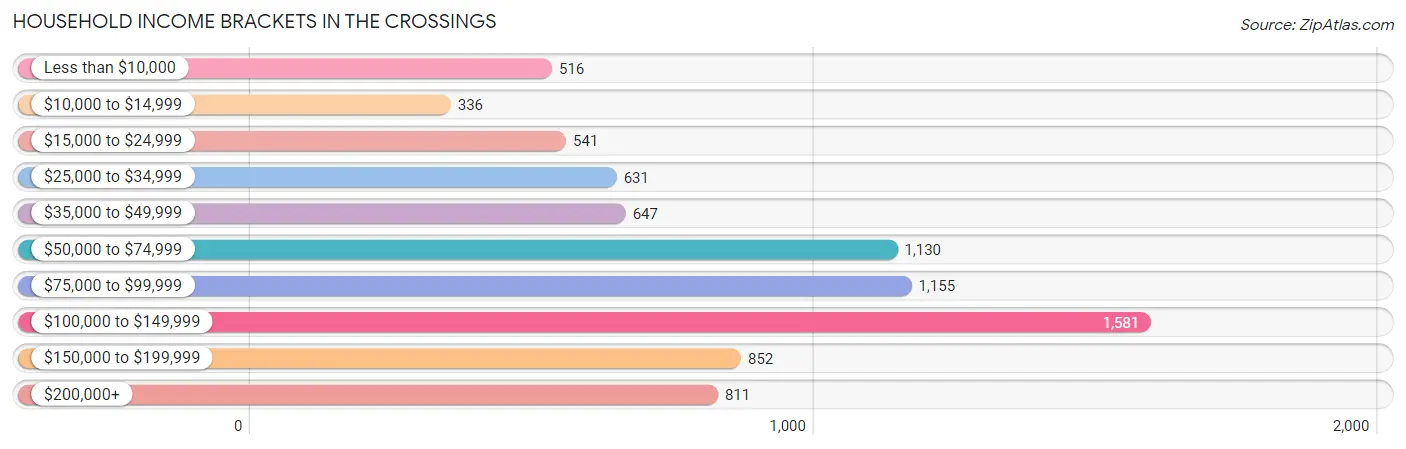
| Income Bracket | # Households | % Households |
| Less than $10,000 | 516 | 6.3% |
| $10,000 to $14,999 | 336 | 4.1% |
| $15,000 to $24,999 | 541 | 6.6% |
| $25,000 to $34,999 | 631 | 7.7% |
| $35,000 to $49,999 | 647 | 7.9% |
| $50,000 to $74,999 | 1,130 | 13.8% |
| $75,000 to $99,999 | 1,155 | 14.1% |
| $100,000 to $149,999 | 1,581 | 19.3% |
| $150,000 to $199,999 | 852 | 10.4% |
| $200,000+ | 811 | 9.9% |
Household Income by Householder Age in The Crossings
The median household income in The Crossings is $82,566, with the highest median household income of $102,375 found in the 45 to 64 years age bracket for the primary householder. A total of 3,552 households (43.4%) fall into this category. Meanwhile, the 15 to 24 years age bracket for the primary householder has the lowest median household income of $0, with 139 households (1.7%) in this group.
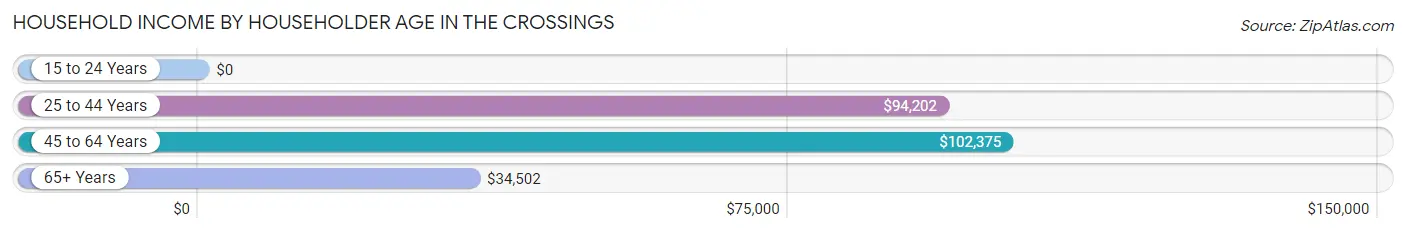
| Income Bracket | # Households | Median Income |
| 15 to 24 Years | 139 (1.7%) | $0 |
| 25 to 44 Years | 1,990 (24.3%) | $94,202 |
| 45 to 64 Years | 3,552 (43.4%) | $102,375 |
| 65+ Years | 2,509 (30.6%) | $34,502 |
| Total | 8,190 (100.0%) | $82,566 |
Poverty in The Crossings
Income Below Poverty by Sex and Age in The Crossings
With 9.9% poverty level for males and 10.0% for females among the residents of The Crossings, 15 year old males and 75 year old and over females are the most vulnerable to poverty, with 19 males (28.8%) and 315 females (22.1%) in their respective age groups living below the poverty level.
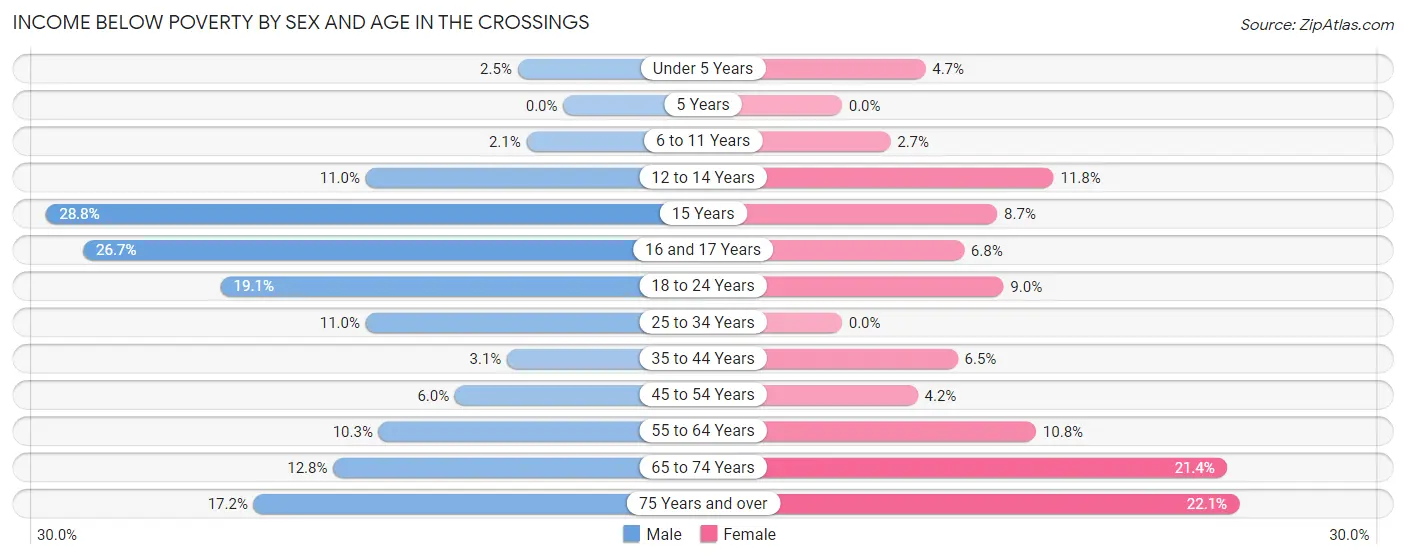
| Age Bracket | Male | Female |
| Under 5 Years | 13 (2.5%) | 27 (4.6%) |
| 5 Years | 0 (0.0%) | 0 (0.0%) |
| 6 to 11 Years | 21 (2.1%) | 13 (2.7%) |
| 12 to 14 Years | 57 (11.0%) | 50 (11.8%) |
| 15 Years | 19 (28.8%) | 9 (8.6%) |
| 16 and 17 Years | 92 (26.7%) | 20 (6.8%) |
| 18 to 24 Years | 183 (19.1%) | 77 (9.0%) |
| 25 to 34 Years | 136 (11.0%) | 0 (0.0%) |
| 35 to 44 Years | 41 (3.1%) | 107 (6.5%) |
| 45 to 54 Years | 92 (6.0%) | 66 (4.2%) |
| 55 to 64 Years | 174 (10.3%) | 189 (10.8%) |
| 65 to 74 Years | 117 (12.8%) | 288 (21.4%) |
| 75 Years and over | 141 (17.2%) | 315 (22.1%) |
| Total | 1,086 (9.9%) | 1,161 (10.0%) |
Income Above Poverty by Sex and Age in The Crossings
According to the poverty statistics in The Crossings, males aged 5 years and females aged 5 years are the age groups that are most secure financially, with 100.0% of males and 100.0% of females in these age groups living above the poverty line.
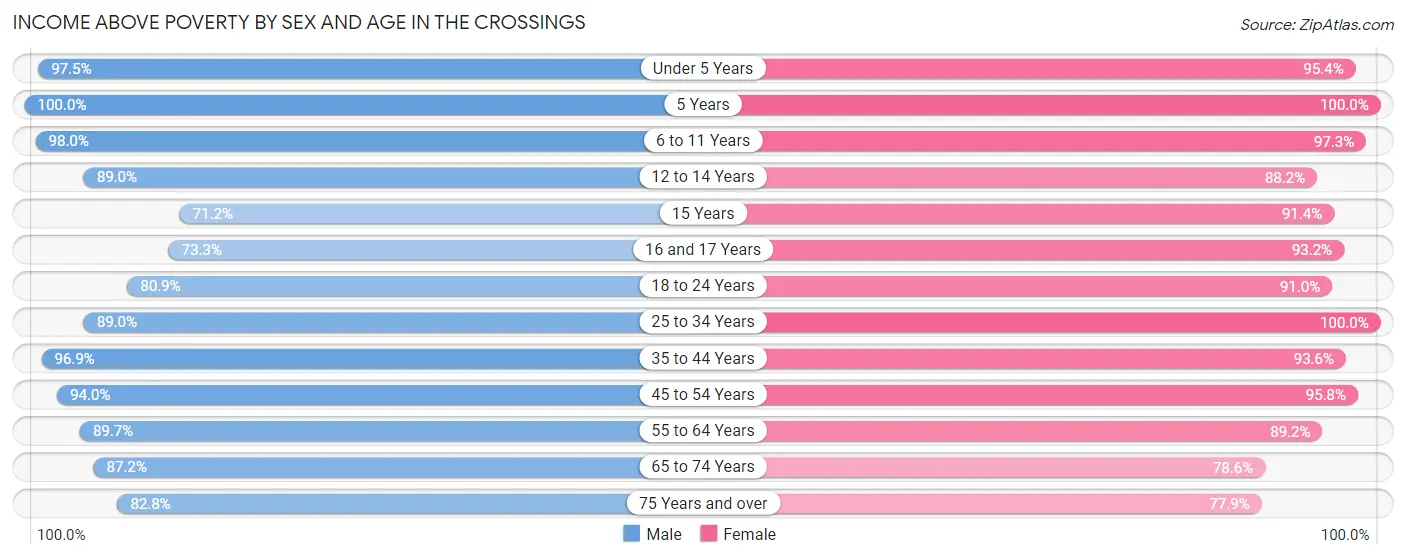
| Age Bracket | Male | Female |
| Under 5 Years | 499 (97.5%) | 554 (95.4%) |
| 5 Years | 95 (100.0%) | 127 (100.0%) |
| 6 to 11 Years | 1,004 (98.0%) | 469 (97.3%) |
| 12 to 14 Years | 461 (89.0%) | 374 (88.2%) |
| 15 Years | 47 (71.2%) | 95 (91.3%) |
| 16 and 17 Years | 252 (73.3%) | 274 (93.2%) |
| 18 to 24 Years | 776 (80.9%) | 779 (91.0%) |
| 25 to 34 Years | 1,100 (89.0%) | 1,039 (100.0%) |
| 35 to 44 Years | 1,267 (96.9%) | 1,551 (93.5%) |
| 45 to 54 Years | 1,433 (94.0%) | 1,499 (95.8%) |
| 55 to 64 Years | 1,518 (89.7%) | 1,560 (89.2%) |
| 65 to 74 Years | 796 (87.2%) | 1,056 (78.6%) |
| 75 Years and over | 677 (82.8%) | 1,110 (77.9%) |
| Total | 9,925 (90.1%) | 10,487 (90.0%) |
Income Below Poverty Among Married-Couple Families in The Crossings
The poverty statistics for married-couple families in The Crossings show that 5.6% or 255 of the total 4,528 families live below the poverty line. Families with no children have the highest poverty rate of 8.7%, comprising of 222 families. On the other hand, families with 3 or 4 children have the lowest poverty rate of 0.0%, which includes 0 families.
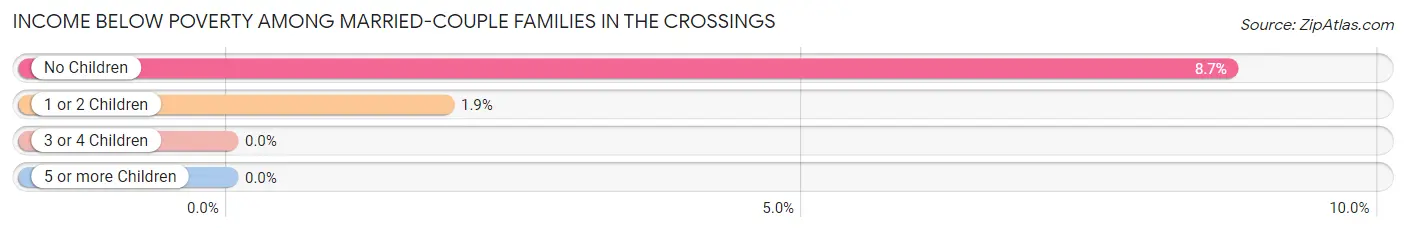
| Children | Above Poverty | Below Poverty |
| No Children | 2,327 (91.3%) | 222 (8.7%) |
| 1 or 2 Children | 1,727 (98.1%) | 33 (1.9%) |
| 3 or 4 Children | 219 (100.0%) | 0 (0.0%) |
| 5 or more Children | 0 (0.0%) | 0 (0.0%) |
| Total | 4,273 (94.4%) | 255 (5.6%) |
Income Below Poverty Among Single-Parent Households in The Crossings
According to the poverty data in The Crossings, 13.5% or 48 single-father households and 14.9% or 167 single-mother households are living below the poverty line. Among single-father households, those with 1 or 2 children have the highest poverty rate, with 15 households (21.4%) experiencing poverty. Likewise, among single-mother households, those with 3 or 4 children have the highest poverty rate, with 7 households (23.3%) falling below the poverty line.
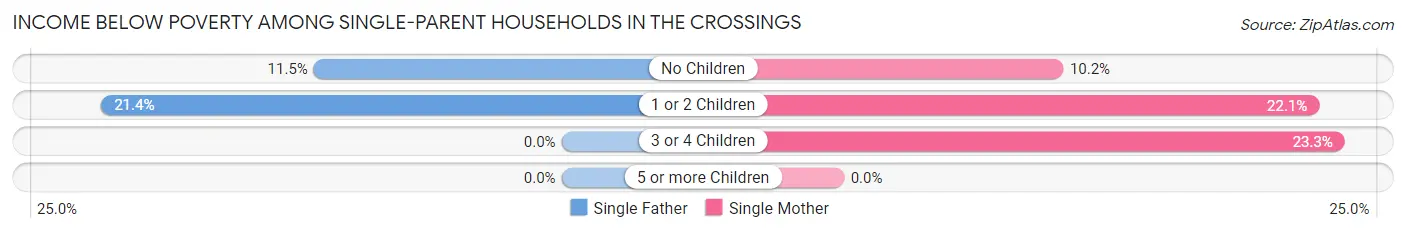
| Children | Single Father | Single Mother |
| No Children | 33 (11.5%) | 69 (10.2%) |
| 1 or 2 Children | 15 (21.4%) | 91 (22.1%) |
| 3 or 4 Children | 0 (0.0%) | 7 (23.3%) |
| 5 or more Children | 0 (0.0%) | 0 (0.0%) |
| Total | 48 (13.5%) | 167 (14.9%) |
Income Below Poverty Among Married-Couple vs Single-Parent Households in The Crossings
The poverty data for The Crossings shows that 255 of the married-couple family households (5.6%) and 215 of the single-parent households (14.6%) are living below the poverty level. Within the married-couple family households, those with no children have the highest poverty rate, with 222 households (8.7%) falling below the poverty line. Among the single-parent households, those with 3 or 4 children have the highest poverty rate, with 7 household (23.3%) living below poverty.
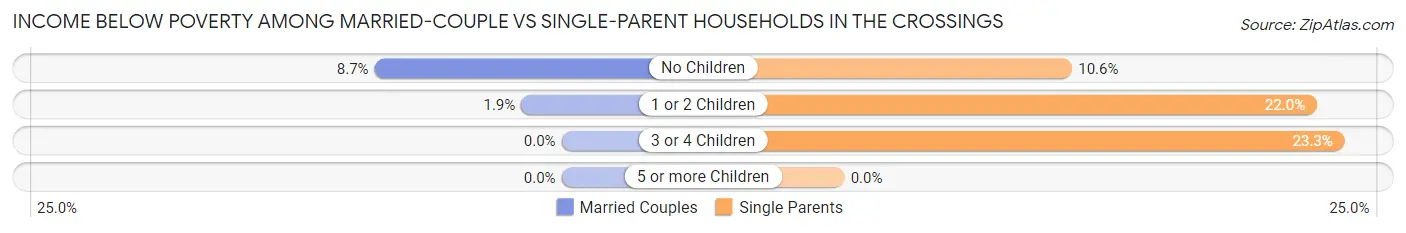
| Children | Married-Couple Families | Single-Parent Households |
| No Children | 222 (8.7%) | 102 (10.6%) |
| 1 or 2 Children | 33 (1.9%) | 106 (22.0%) |
| 3 or 4 Children | 0 (0.0%) | 7 (23.3%) |
| 5 or more Children | 0 (0.0%) | 0 (0.0%) |
| Total | 255 (5.6%) | 215 (14.6%) |
Employment Characteristics in The Crossings
Employment by Class of Employer in The Crossings
Among the 11,509 employed individuals in The Crossings, private company employees (8,179 | 71.1%), not-for-profit organizations (890 | 7.7%), and local government employees (843 | 7.3%) make up the most common classes of employment.
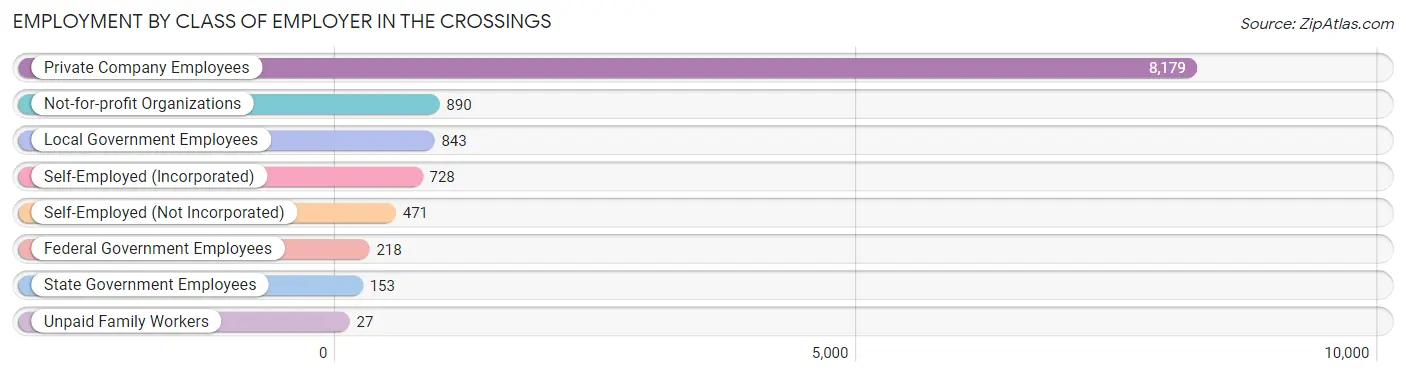
| Employer Class | # Employees | % Employees |
| Private Company Employees | 8,179 | 71.1% |
| Self-Employed (Incorporated) | 728 | 6.3% |
| Self-Employed (Not Incorporated) | 471 | 4.1% |
| Not-for-profit Organizations | 890 | 7.7% |
| Local Government Employees | 843 | 7.3% |
| State Government Employees | 153 | 1.3% |
| Federal Government Employees | 218 | 1.9% |
| Unpaid Family Workers | 27 | 0.2% |
| Total | 11,509 | 100.0% |
Employment Status by Age in The Crossings
According to the labor force statistics for The Crossings, out of the total population over 16 years of age (18,749), 63.9% or 11,981 individuals are in the labor force, with 2.4% or 288 of them unemployed. The age group with the highest labor force participation rate is 35 to 44 years, with 92.4% or 2,741 individuals in the labor force. Within the labor force, the 20 to 24 years age range has the highest percentage of unemployed individuals, with 8.4% or 88 of them being unemployed.
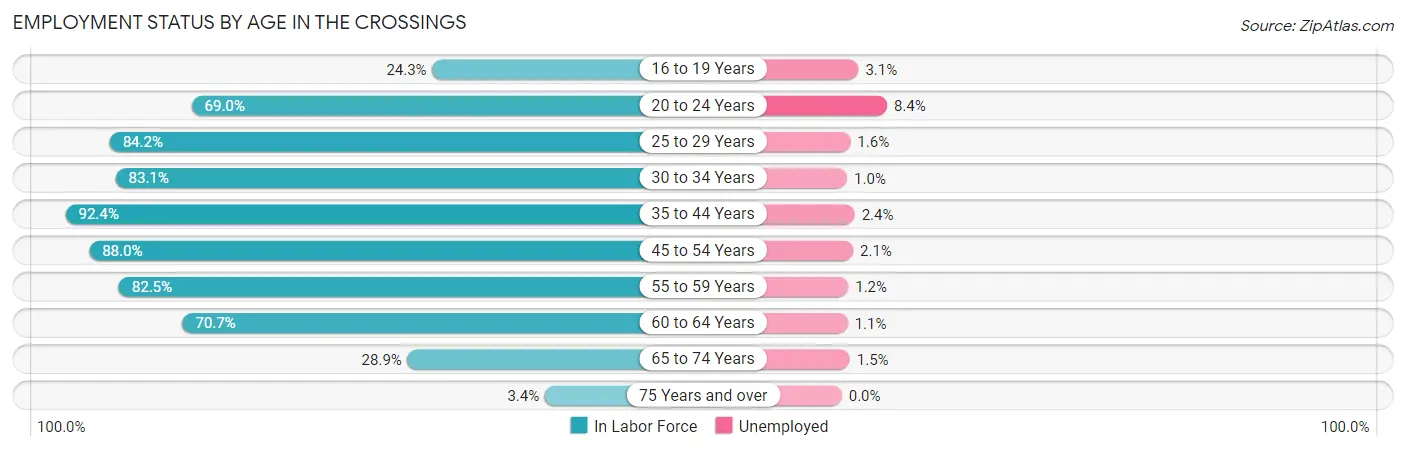
| Age Bracket | In Labor Force | Unemployed |
| 16 to 19 Years | 227 (24.3%) | 7 (3.1%) |
| 20 to 24 Years | 1,047 (69.0%) | 88 (8.4%) |
| 25 to 29 Years | 743 (84.2%) | 12 (1.6%) |
| 30 to 34 Years | 1,158 (83.1%) | 12 (1.0%) |
| 35 to 44 Years | 2,741 (92.4%) | 66 (2.4%) |
| 45 to 54 Years | 2,719 (88.0%) | 57 (2.1%) |
| 55 to 59 Years | 1,308 (82.5%) | 16 (1.2%) |
| 60 to 64 Years | 1,314 (70.7%) | 14 (1.1%) |
| 65 to 74 Years | 652 (28.9%) | 10 (1.5%) |
| 75 Years and over | 77 (3.4%) | 0 (0.0%) |
| Total | 11,981 (63.9%) | 288 (2.4%) |
Employment Status by Educational Attainment in The Crossings
According to labor force statistics for The Crossings, 84.8% of individuals (9,984) out of the total population between 25 and 64 years of age (11,774) are in the labor force, with 1.8% or 180 of them being unemployed. The group with the highest labor force participation rate are those with the educational attainment of bachelor's degree or higher, with 91.0% or 4,525 individuals in the labor force. Within the labor force, individuals with college / associate degree education have the highest percentage of unemployment, with 2.5% or 84 of them being unemployed.
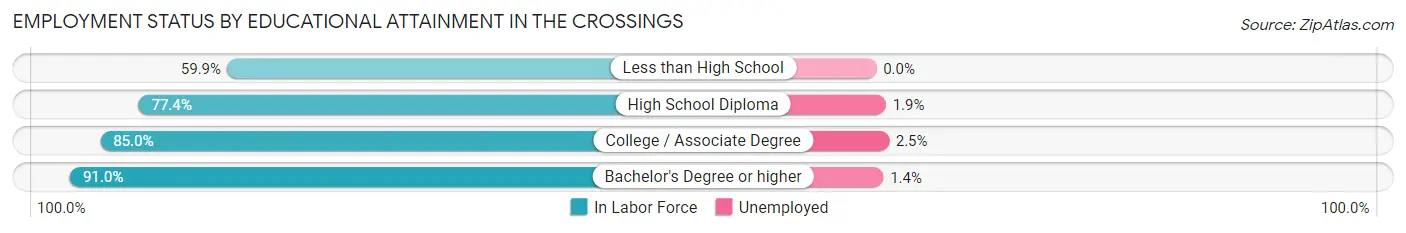
| Educational Attainment | In Labor Force | Unemployed |
| Less than High School | 368 (59.9%) | 0 (0.0%) |
| High School Diploma | 1,742 (77.4%) | 43 (1.9%) |
| College / Associate Degree | 3,346 (85.0%) | 98 (2.5%) |
| Bachelor's Degree or higher | 4,525 (91.0%) | 70 (1.4%) |
| Total | 9,984 (84.8%) | 212 (1.8%) |
Employment Occupations by Sex in The Crossings
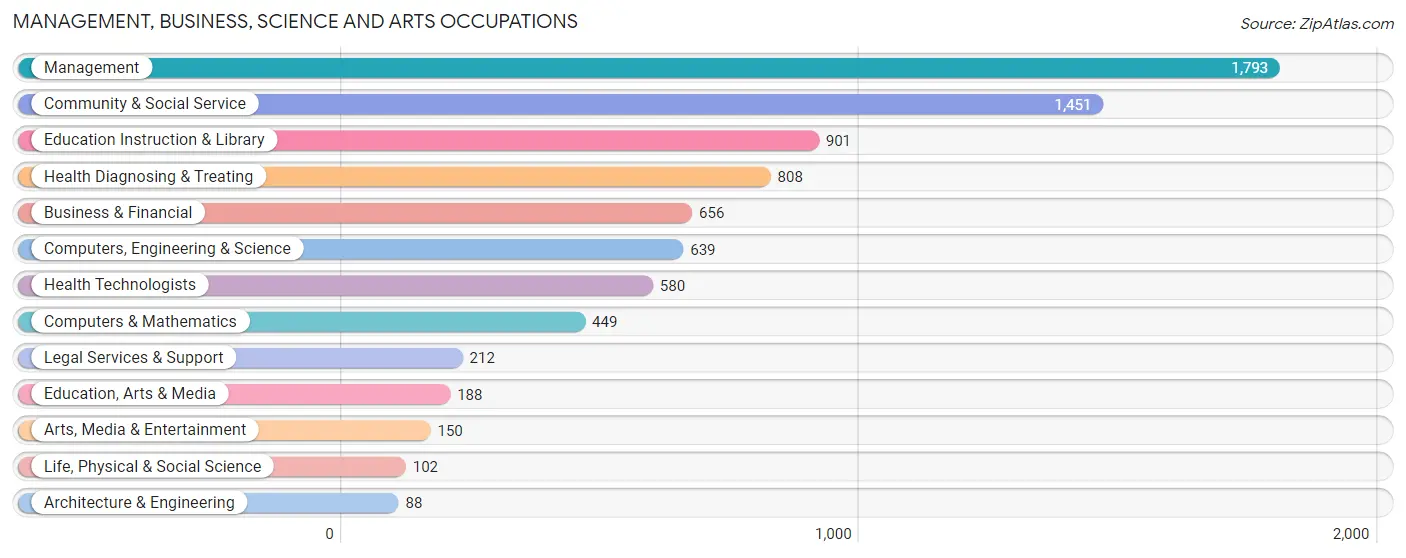
Management, Business, Science and Arts Occupations
The most common Management, Business, Science and Arts occupations in The Crossings are Management (1,793 | 15.3%), Community & Social Service (1,451 | 12.4%), Education Instruction & Library (901 | 7.7%), Health Diagnosing & Treating (808 | 6.9%), and Business & Financial (656 | 5.6%).
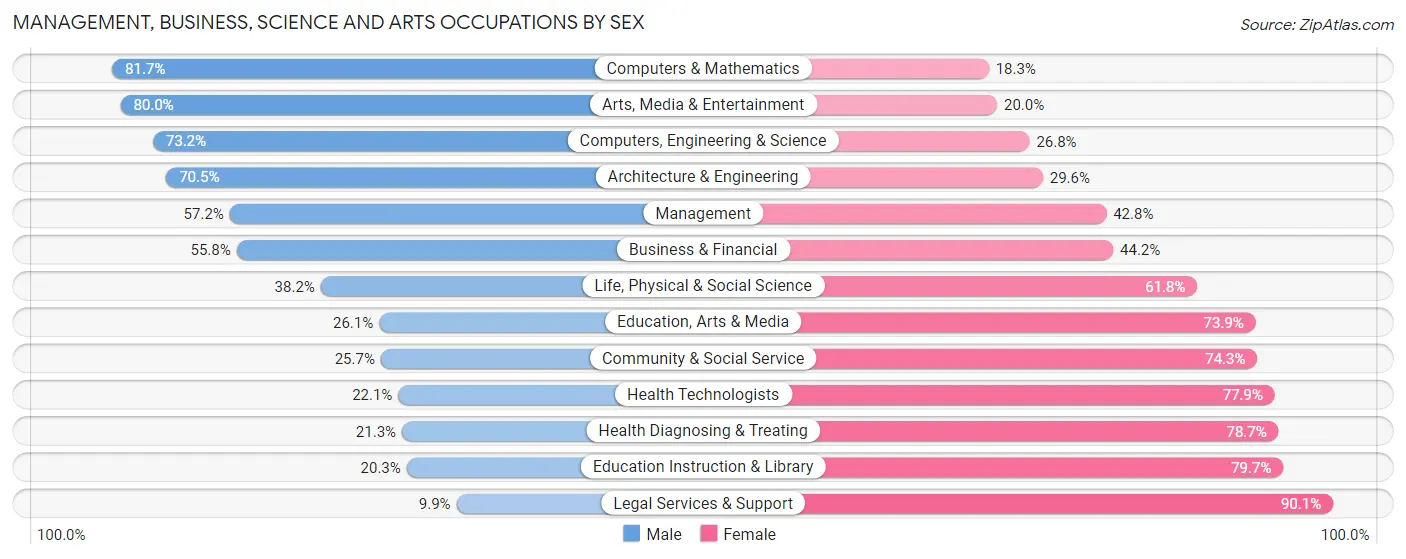
Management, Business, Science and Arts Occupations by Sex
Within the Management, Business, Science and Arts occupations in The Crossings, the most male-oriented occupations are Computers & Mathematics (81.7%), Arts, Media & Entertainment (80.0%), and Computers, Engineering & Science (73.2%), while the most female-oriented occupations are Legal Services & Support (90.1%), Education Instruction & Library (79.7%), and Health Diagnosing & Treating (78.7%).
| Occupation | Male | Female |
| Management | 1,026 (57.2%) | 767 (42.8%) |
| Business & Financial | 366 (55.8%) | 290 (44.2%) |
| Computers, Engineering & Science | 468 (73.2%) | 171 (26.8%) |
| Computers & Mathematics | 367 (81.7%) | 82 (18.3%) |
| Architecture & Engineering | 62 (70.5%) | 26 (29.5%) |
| Life, Physical & Social Science | 39 (38.2%) | 63 (61.8%) |
| Community & Social Service | 373 (25.7%) | 1,078 (74.3%) |
| Education, Arts & Media | 49 (26.1%) | 139 (73.9%) |
| Legal Services & Support | 21 (9.9%) | 191 (90.1%) |
| Education Instruction & Library | 183 (20.3%) | 718 (79.7%) |
| Arts, Media & Entertainment | 120 (80.0%) | 30 (20.0%) |
| Health Diagnosing & Treating | 172 (21.3%) | 636 (78.7%) |
| Health Technologists | 128 (22.1%) | 452 (77.9%) |
| Total (Category) | 2,405 (45.0%) | 2,942 (55.0%) |
| Total (Overall) | 5,929 (50.7%) | 5,757 (49.3%) |
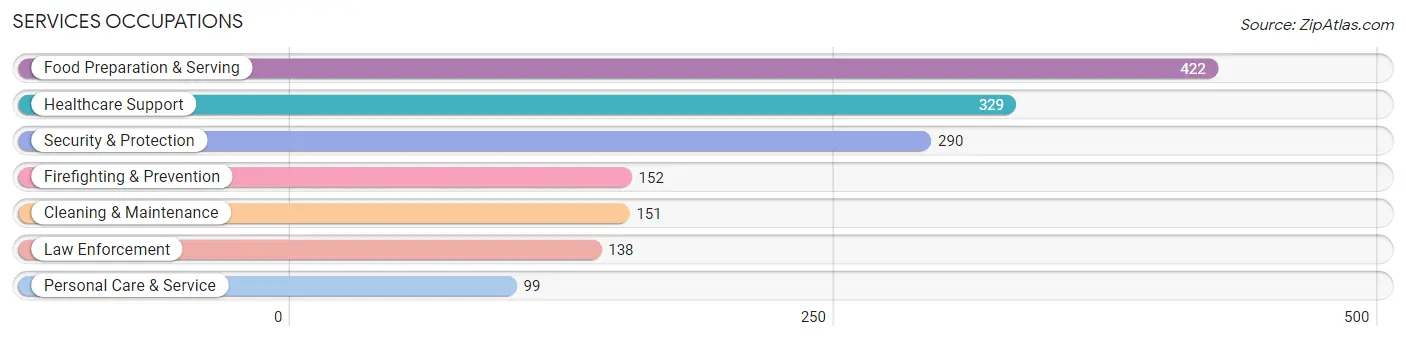
Services Occupations
The most common Services occupations in The Crossings are Food Preparation & Serving (422 | 3.6%), Healthcare Support (329 | 2.8%), Security & Protection (290 | 2.5%), Firefighting & Prevention (152 | 1.3%), and Cleaning & Maintenance (151 | 1.3%).
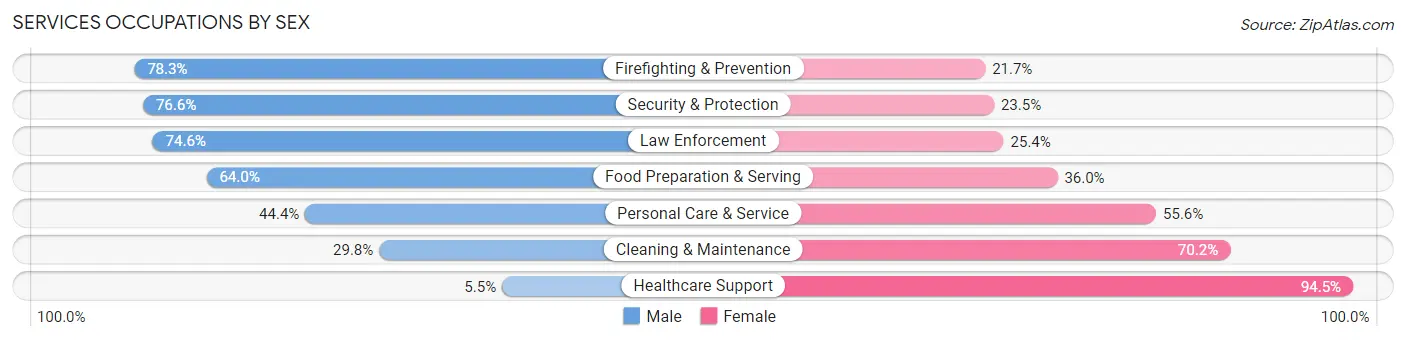
Services Occupations by Sex
Within the Services occupations in The Crossings, the most male-oriented occupations are Firefighting & Prevention (78.3%), Security & Protection (76.5%), and Law Enforcement (74.6%), while the most female-oriented occupations are Healthcare Support (94.5%), Cleaning & Maintenance (70.2%), and Personal Care & Service (55.6%).
| Occupation | Male | Female |
| Healthcare Support | 18 (5.5%) | 311 (94.5%) |
| Security & Protection | 222 (76.5%) | 68 (23.4%) |
| Firefighting & Prevention | 119 (78.3%) | 33 (21.7%) |
| Law Enforcement | 103 (74.6%) | 35 (25.4%) |
| Food Preparation & Serving | 270 (64.0%) | 152 (36.0%) |
| Cleaning & Maintenance | 45 (29.8%) | 106 (70.2%) |
| Personal Care & Service | 44 (44.4%) | 55 (55.6%) |
| Total (Category) | 599 (46.4%) | 692 (53.6%) |
| Total (Overall) | 5,929 (50.7%) | 5,757 (49.3%) |
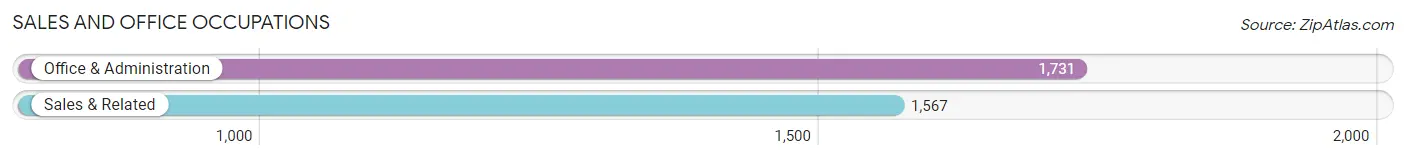
Sales and Office Occupations
The most common Sales and Office occupations in The Crossings are Office & Administration (1,731 | 14.8%), and Sales & Related (1,567 | 13.4%).
Sales and Office Occupations by Sex
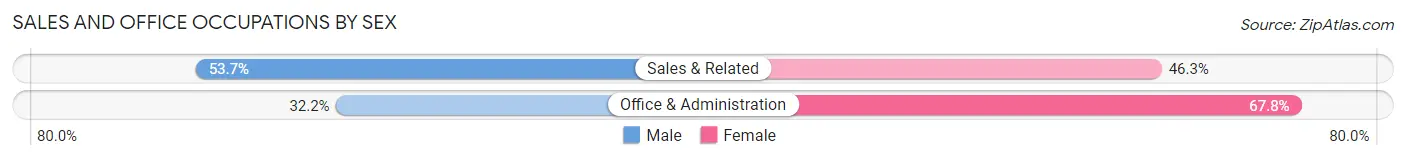
| Occupation | Male | Female |
| Sales & Related | 841 (53.7%) | 726 (46.3%) |
| Office & Administration | 557 (32.2%) | 1,174 (67.8%) |
| Total (Category) | 1,398 (42.4%) | 1,900 (57.6%) |
| Total (Overall) | 5,929 (50.7%) | 5,757 (49.3%) |
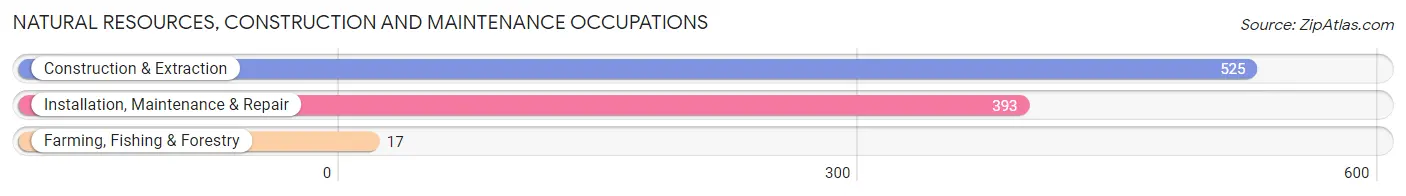
Natural Resources, Construction and Maintenance Occupations
The most common Natural Resources, Construction and Maintenance occupations in The Crossings are Construction & Extraction (525 | 4.5%), Installation, Maintenance & Repair (393 | 3.4%), and Farming, Fishing & Forestry (17 | 0.2%).
Natural Resources, Construction and Maintenance Occupations by Sex
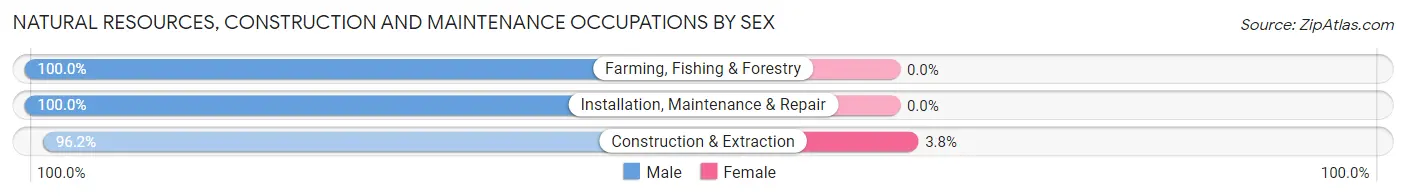
| Occupation | Male | Female |
| Farming, Fishing & Forestry | 17 (100.0%) | 0 (0.0%) |
| Construction & Extraction | 505 (96.2%) | 20 (3.8%) |
| Installation, Maintenance & Repair | 393 (100.0%) | 0 (0.0%) |
| Total (Category) | 915 (97.9%) | 20 (2.1%) |
| Total (Overall) | 5,929 (50.7%) | 5,757 (49.3%) |
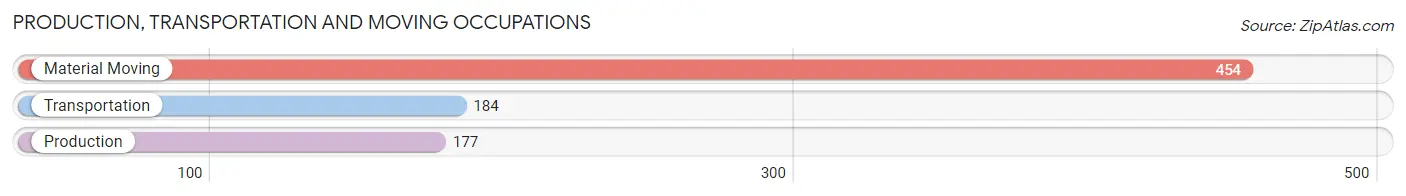
Production, Transportation and Moving Occupations
The most common Production, Transportation and Moving occupations in The Crossings are Material Moving (454 | 3.9%), Transportation (184 | 1.6%), and Production (177 | 1.5%).
Production, Transportation and Moving Occupations by Sex
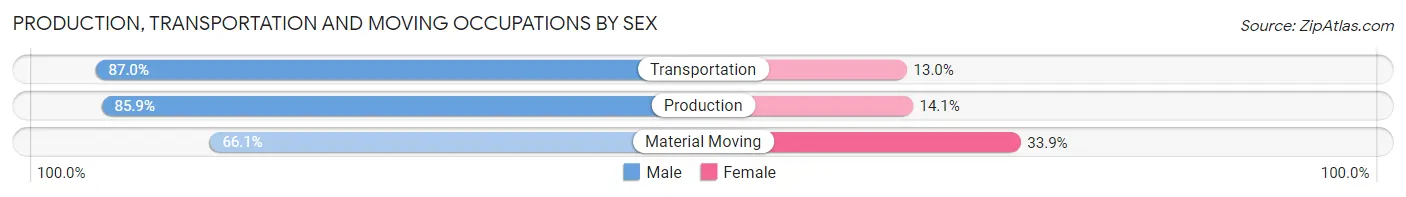
| Occupation | Male | Female |
| Production | 152 (85.9%) | 25 (14.1%) |
| Transportation | 160 (87.0%) | 24 (13.0%) |
| Material Moving | 300 (66.1%) | 154 (33.9%) |
| Total (Category) | 612 (75.1%) | 203 (24.9%) |
| Total (Overall) | 5,929 (50.7%) | 5,757 (49.3%) |
Employment Industries by Sex in The Crossings
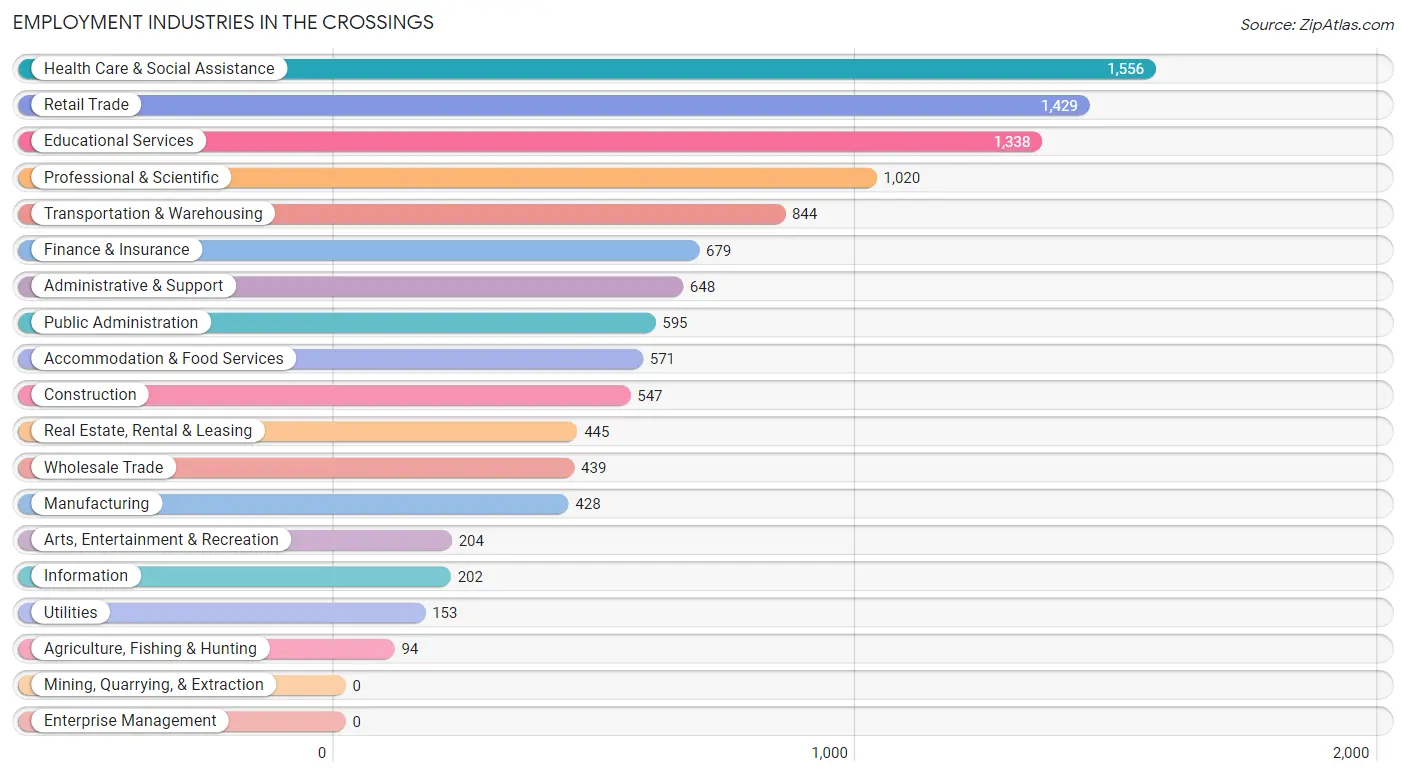
Employment Industries in The Crossings
The major employment industries in The Crossings include Health Care & Social Assistance (1,556 | 13.3%), Retail Trade (1,429 | 12.2%), Educational Services (1,338 | 11.5%), Professional & Scientific (1,020 | 8.7%), and Transportation & Warehousing (844 | 7.2%).
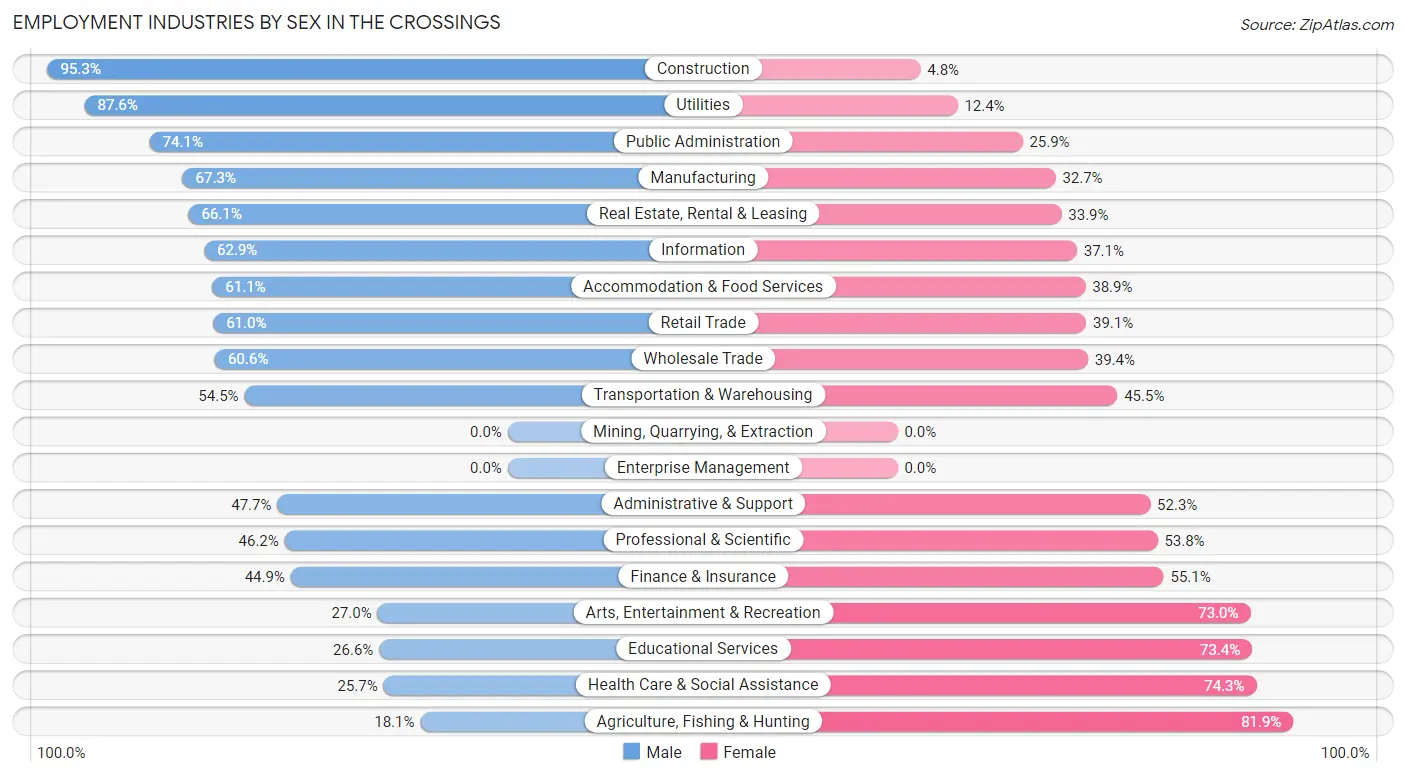
Employment Industries by Sex in The Crossings
The The Crossings industries that see more men than women are Construction (95.3%), Utilities (87.6%), and Public Administration (74.1%), whereas the industries that tend to have a higher number of women are Agriculture, Fishing & Hunting (81.9%), Health Care & Social Assistance (74.3%), and Educational Services (73.4%).
| Industry | Male | Female |
| Agriculture, Fishing & Hunting | 17 (18.1%) | 77 (81.9%) |
| Mining, Quarrying, & Extraction | 0 (0.0%) | 0 (0.0%) |
| Construction | 521 (95.3%) | 26 (4.8%) |
| Manufacturing | 288 (67.3%) | 140 (32.7%) |
| Wholesale Trade | 266 (60.6%) | 173 (39.4%) |
| Retail Trade | 871 (61.0%) | 558 (39.1%) |
| Transportation & Warehousing | 460 (54.5%) | 384 (45.5%) |
| Utilities | 134 (87.6%) | 19 (12.4%) |
| Information | 127 (62.9%) | 75 (37.1%) |
| Finance & Insurance | 305 (44.9%) | 374 (55.1%) |
| Real Estate, Rental & Leasing | 294 (66.1%) | 151 (33.9%) |
| Professional & Scientific | 471 (46.2%) | 549 (53.8%) |
| Enterprise Management | 0 (0.0%) | 0 (0.0%) |
| Administrative & Support | 309 (47.7%) | 339 (52.3%) |
| Educational Services | 356 (26.6%) | 982 (73.4%) |
| Health Care & Social Assistance | 400 (25.7%) | 1,156 (74.3%) |
| Arts, Entertainment & Recreation | 55 (27.0%) | 149 (73.0%) |
| Accommodation & Food Services | 349 (61.1%) | 222 (38.9%) |
| Public Administration | 441 (74.1%) | 154 (25.9%) |
| Total | 5,929 (50.7%) | 5,757 (49.3%) |
Education in The Crossings
School Enrollment in The Crossings
The most common levels of schooling among the 5,269 students in The Crossings are college / undergraduate (1,263 | 24.0%), high school (1,193 | 22.6%), and middle school (1,074 | 20.4%).
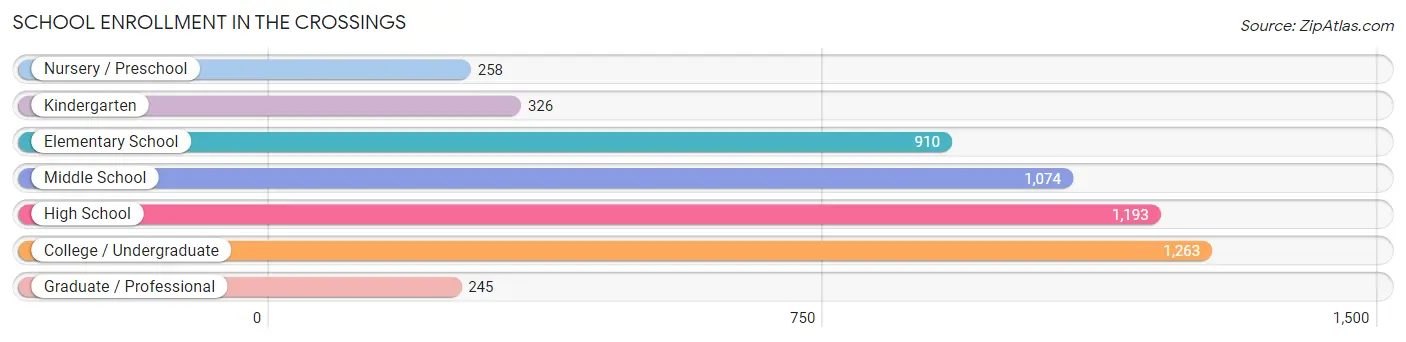
| School Level | # Students | % Students |
| Nursery / Preschool | 258 | 4.9% |
| Kindergarten | 326 | 6.2% |
| Elementary School | 910 | 17.3% |
| Middle School | 1,074 | 20.4% |
| High School | 1,193 | 22.6% |
| College / Undergraduate | 1,263 | 24.0% |
| Graduate / Professional | 245 | 4.6% |
| Total | 5,269 | 100.0% |
School Enrollment by Age by Funding Source in The Crossings
Out of a total of 5,269 students who are enrolled in schools in The Crossings, 985 (18.7%) attend a private institution, while the remaining 4,284 (81.3%) are enrolled in public schools. The age group of 25 to 34 year olds has the highest likelihood of being enrolled in private schools, with 107 (45.3% in the age bracket) enrolled. Conversely, the age group of 5 to 9 year old has the lowest likelihood of being enrolled in a private school, with 1,044 (86.7% in the age bracket) attending a public institution.
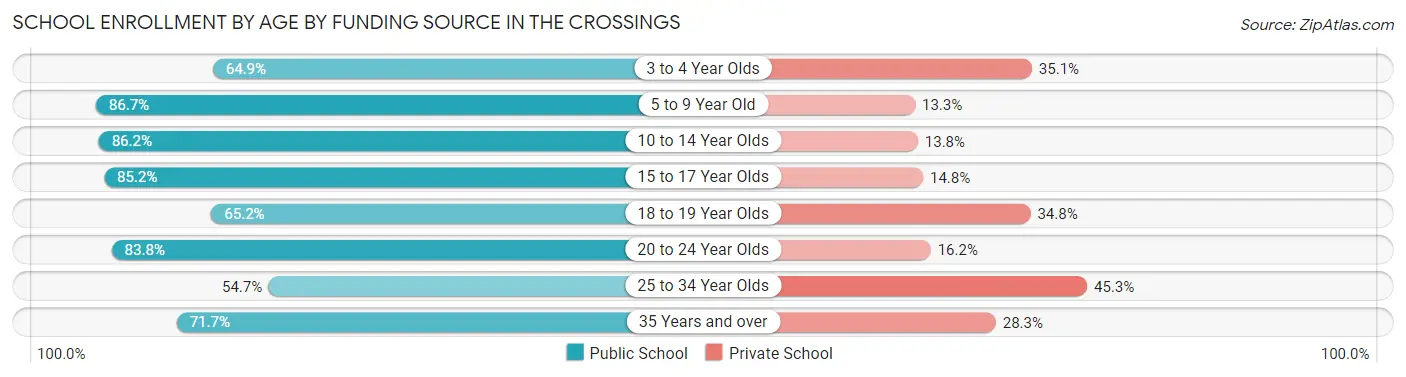
| Age Bracket | Public School | Private School |
| 3 to 4 Year Olds | 163 (64.9%) | 88 (35.1%) |
| 5 to 9 Year Old | 1,044 (86.7%) | 160 (13.3%) |
| 10 to 14 Year Olds | 1,166 (86.2%) | 187 (13.8%) |
| 15 to 17 Year Olds | 657 (85.2%) | 114 (14.8%) |
| 18 to 19 Year Olds | 193 (65.2%) | 103 (34.8%) |
| 20 to 24 Year Olds | 713 (83.8%) | 138 (16.2%) |
| 25 to 34 Year Olds | 129 (54.7%) | 107 (45.3%) |
| 35 Years and over | 220 (71.7%) | 87 (28.3%) |
| Total | 4,284 (81.3%) | 985 (18.7%) |
Educational Attainment by Field of Study in The Crossings
Business (1,982 | 30.1%), education (959 | 14.6%), science & technology (528 | 8.0%), social sciences (503 | 7.6%), and engineering (411 | 6.2%) are the most common fields of study among 6,573 individuals in The Crossings who have obtained a bachelor's degree or higher.
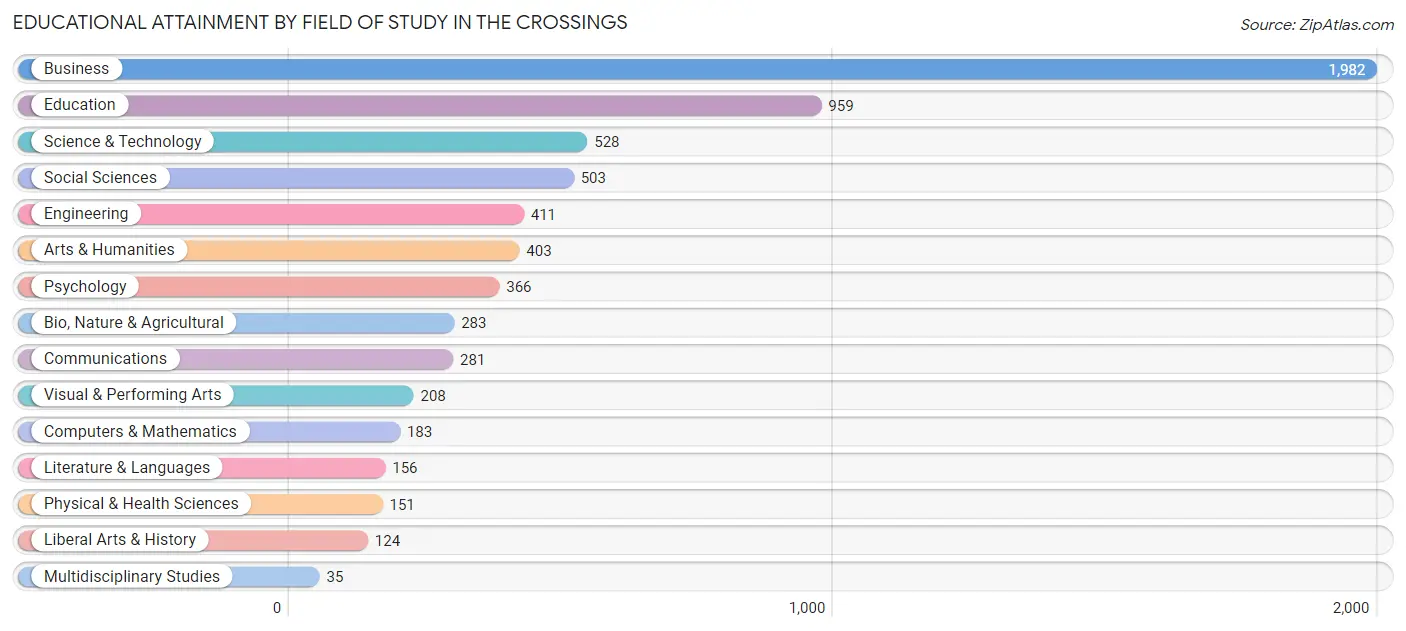
| Field of Study | # Graduates | % Graduates |
| Computers & Mathematics | 183 | 2.8% |
| Bio, Nature & Agricultural | 283 | 4.3% |
| Physical & Health Sciences | 151 | 2.3% |
| Psychology | 366 | 5.6% |
| Social Sciences | 503 | 7.6% |
| Engineering | 411 | 6.2% |
| Multidisciplinary Studies | 35 | 0.5% |
| Science & Technology | 528 | 8.0% |
| Business | 1,982 | 30.1% |
| Education | 959 | 14.6% |
| Literature & Languages | 156 | 2.4% |
| Liberal Arts & History | 124 | 1.9% |
| Visual & Performing Arts | 208 | 3.2% |
| Communications | 281 | 4.3% |
| Arts & Humanities | 403 | 6.1% |
| Total | 6,573 | 100.0% |
Transportation & Commute in The Crossings
Vehicle Availability by Sex in The Crossings
The most prevalent vehicle ownership categories in The Crossings are males with 2 vehicles (2,859, accounting for 48.5%) and females with 2 vehicles (2,942, making up 50.9%).
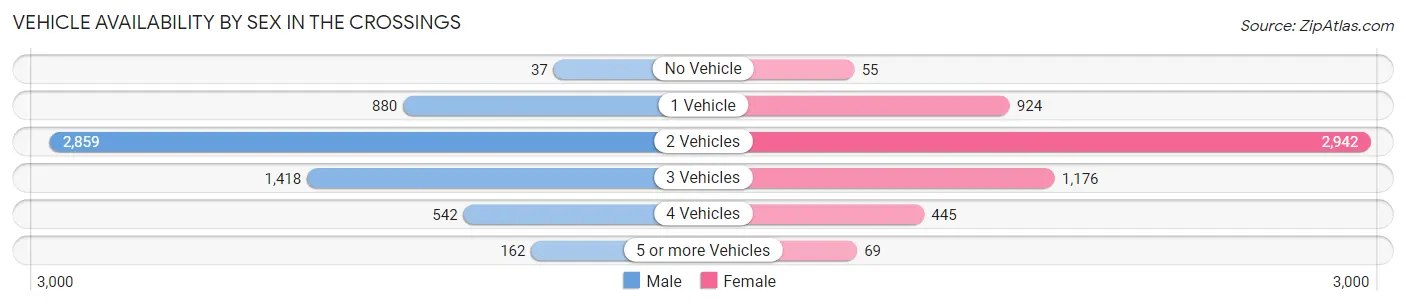
| Vehicles Available | Male | Female |
| No Vehicle | 37 (0.6%) | 55 (1.0%) |
| 1 Vehicle | 880 (14.9%) | 924 (16.5%) |
| 2 Vehicles | 2,859 (48.5%) | 2,942 (52.4%) |
| 3 Vehicles | 1,418 (24.0%) | 1,176 (21.0%) |
| 4 Vehicles | 542 (9.2%) | 445 (7.9%) |
| 5 or more Vehicles | 162 (2.8%) | 69 (1.2%) |
| Total | 5,898 (100.0%) | 5,611 (100.0%) |
Commute Time in The Crossings
The most frequently occuring commute durations in The Crossings are 20 to 24 minutes (2,373 commuters, 23.0%), 30 to 34 minutes (2,247 commuters, 21.8%), and 15 to 19 minutes (1,026 commuters, 10.0%).
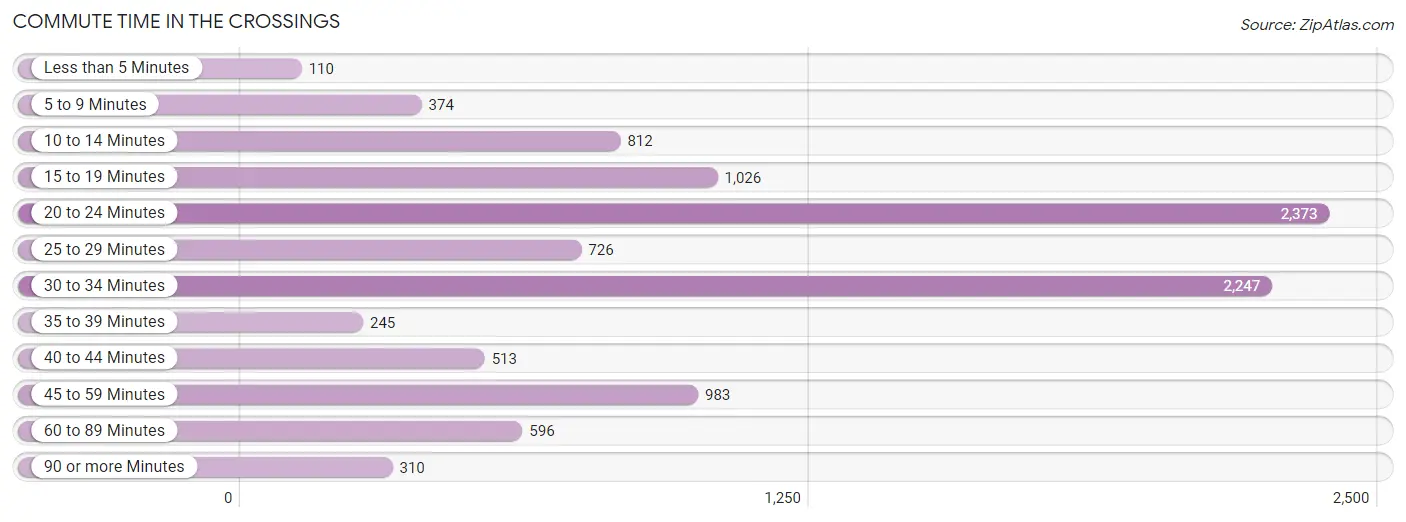
| Commute Time | # Commuters | % Commuters |
| Less than 5 Minutes | 110 | 1.1% |
| 5 to 9 Minutes | 374 | 3.6% |
| 10 to 14 Minutes | 812 | 7.9% |
| 15 to 19 Minutes | 1,026 | 10.0% |
| 20 to 24 Minutes | 2,373 | 23.0% |
| 25 to 29 Minutes | 726 | 7.0% |
| 30 to 34 Minutes | 2,247 | 21.8% |
| 35 to 39 Minutes | 245 | 2.4% |
| 40 to 44 Minutes | 513 | 5.0% |
| 45 to 59 Minutes | 983 | 9.5% |
| 60 to 89 Minutes | 596 | 5.8% |
| 90 or more Minutes | 310 | 3.0% |
Commute Time by Sex in The Crossings
The most common commute times in The Crossings are 20 to 24 minutes (1,330 commuters, 24.8%) for males and 30 to 34 minutes (1,184 commuters, 23.9%) for females.
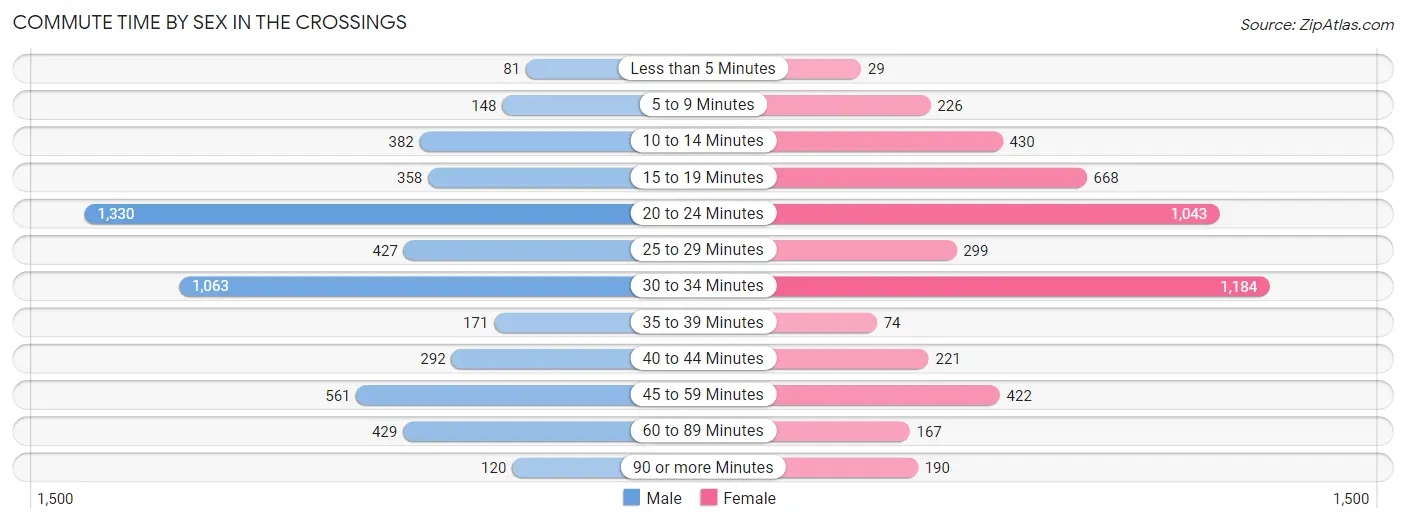
| Commute Time | Male | Female |
| Less than 5 Minutes | 81 (1.5%) | 29 (0.6%) |
| 5 to 9 Minutes | 148 (2.8%) | 226 (4.6%) |
| 10 to 14 Minutes | 382 (7.1%) | 430 (8.7%) |
| 15 to 19 Minutes | 358 (6.7%) | 668 (13.5%) |
| 20 to 24 Minutes | 1,330 (24.8%) | 1,043 (21.1%) |
| 25 to 29 Minutes | 427 (8.0%) | 299 (6.0%) |
| 30 to 34 Minutes | 1,063 (19.8%) | 1,184 (23.9%) |
| 35 to 39 Minutes | 171 (3.2%) | 74 (1.5%) |
| 40 to 44 Minutes | 292 (5.4%) | 221 (4.5%) |
| 45 to 59 Minutes | 561 (10.5%) | 422 (8.5%) |
| 60 to 89 Minutes | 429 (8.0%) | 167 (3.4%) |
| 90 or more Minutes | 120 (2.2%) | 190 (3.8%) |
Time of Departure to Work by Sex in The Crossings
The most frequent times of departure to work in The Crossings are 9:00 AM to 9:59 AM (986, 18.4%) for males and 8:00 AM to 8:29 AM (1,179, 23.8%) for females.
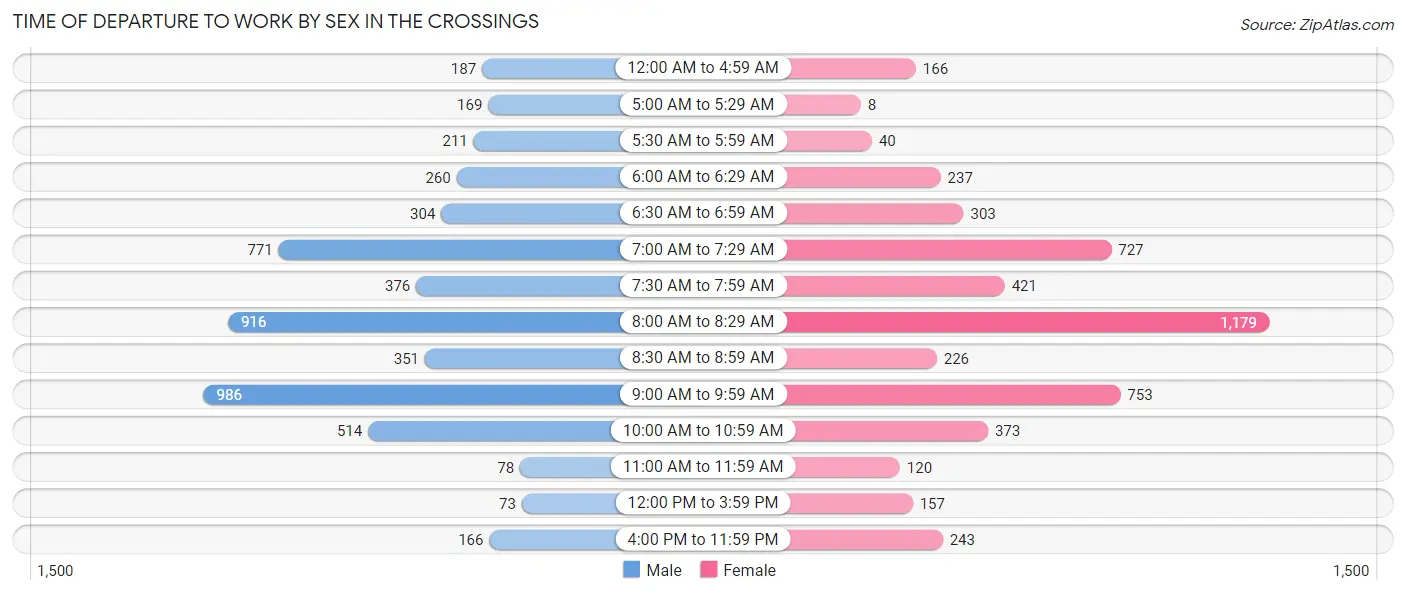
| Time of Departure | Male | Female |
| 12:00 AM to 4:59 AM | 187 (3.5%) | 166 (3.4%) |
| 5:00 AM to 5:29 AM | 169 (3.2%) | 8 (0.2%) |
| 5:30 AM to 5:59 AM | 211 (3.9%) | 40 (0.8%) |
| 6:00 AM to 6:29 AM | 260 (4.9%) | 237 (4.8%) |
| 6:30 AM to 6:59 AM | 304 (5.7%) | 303 (6.1%) |
| 7:00 AM to 7:29 AM | 771 (14.4%) | 727 (14.7%) |
| 7:30 AM to 7:59 AM | 376 (7.0%) | 421 (8.5%) |
| 8:00 AM to 8:29 AM | 916 (17.1%) | 1,179 (23.8%) |
| 8:30 AM to 8:59 AM | 351 (6.6%) | 226 (4.6%) |
| 9:00 AM to 9:59 AM | 986 (18.4%) | 753 (15.2%) |
| 10:00 AM to 10:59 AM | 514 (9.6%) | 373 (7.5%) |
| 11:00 AM to 11:59 AM | 78 (1.5%) | 120 (2.4%) |
| 12:00 PM to 3:59 PM | 73 (1.4%) | 157 (3.2%) |
| 4:00 PM to 11:59 PM | 166 (3.1%) | 243 (4.9%) |
| Total | 5,362 (100.0%) | 4,953 (100.0%) |
Housing Occupancy in The Crossings
Occupancy by Ownership in The Crossings
Of the total 8,190 dwellings in The Crossings, owner-occupied units account for 6,045 (73.8%), while renter-occupied units make up 2,145 (26.2%).
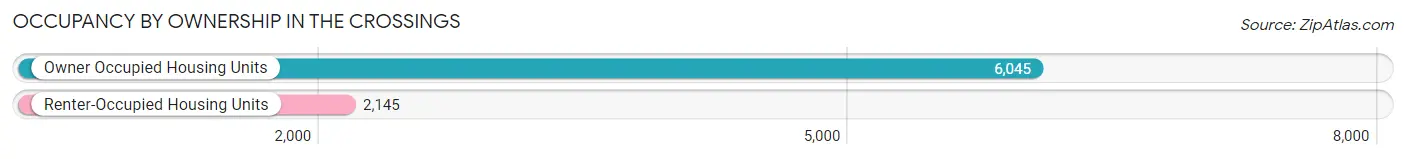
| Occupancy | # Housing Units | % Housing Units |
| Owner Occupied Housing Units | 6,045 | 73.8% |
| Renter-Occupied Housing Units | 2,145 | 26.2% |
| Total Occupied Housing Units | 8,190 | 100.0% |
Occupancy by Household Size in The Crossings
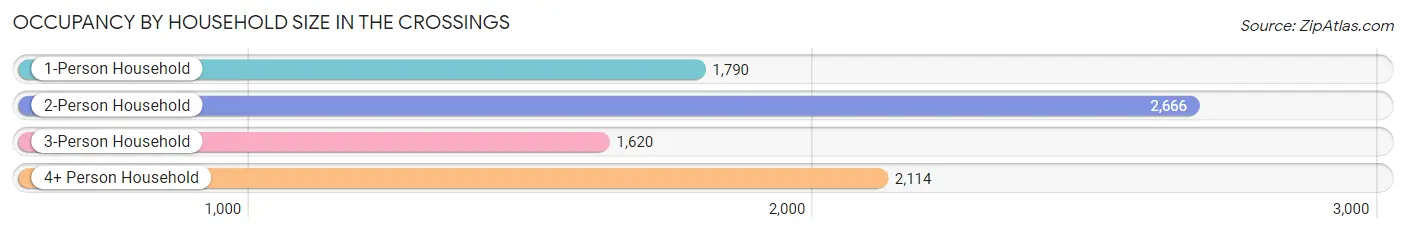
| Household Size | # Housing Units | % Housing Units |
| 1-Person Household | 1,790 | 21.9% |
| 2-Person Household | 2,666 | 32.6% |
| 3-Person Household | 1,620 | 19.8% |
| 4+ Person Household | 2,114 | 25.8% |
| Total Housing Units | 8,190 | 100.0% |
Occupancy by Ownership by Household Size in The Crossings
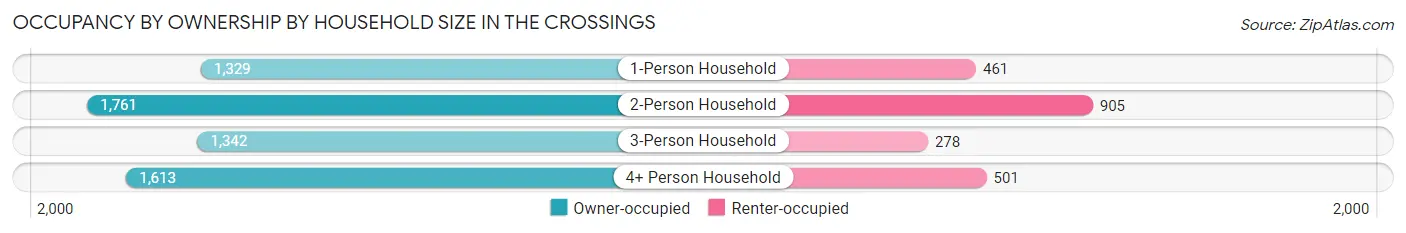
| Household Size | Owner-occupied | Renter-occupied |
| 1-Person Household | 1,329 (74.3%) | 461 (25.8%) |
| 2-Person Household | 1,761 (66.0%) | 905 (34.0%) |
| 3-Person Household | 1,342 (82.8%) | 278 (17.2%) |
| 4+ Person Household | 1,613 (76.3%) | 501 (23.7%) |
| Total Housing Units | 6,045 (73.8%) | 2,145 (26.2%) |
Occupancy by Educational Attainment in The Crossings
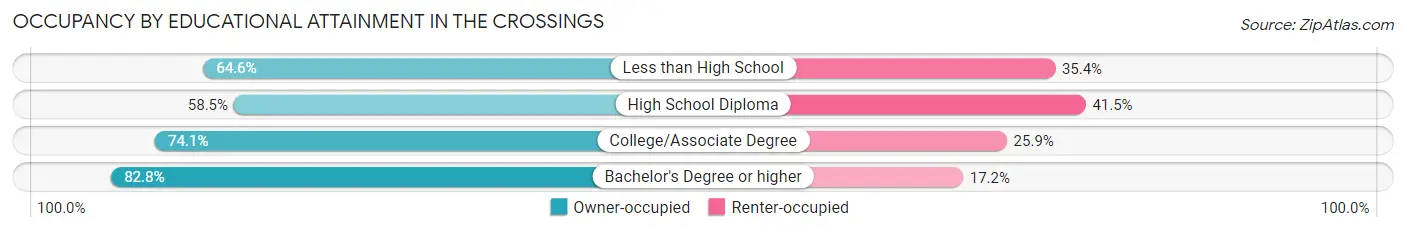
| Household Size | Owner-occupied | Renter-occupied |
| Less than High School | 348 (64.6%) | 191 (35.4%) |
| High School Diploma | 987 (58.5%) | 700 (41.5%) |
| College/Associate Degree | 1,957 (74.1%) | 683 (25.9%) |
| Bachelor's Degree or higher | 2,753 (82.8%) | 571 (17.2%) |
Occupancy by Age of Householder in The Crossings
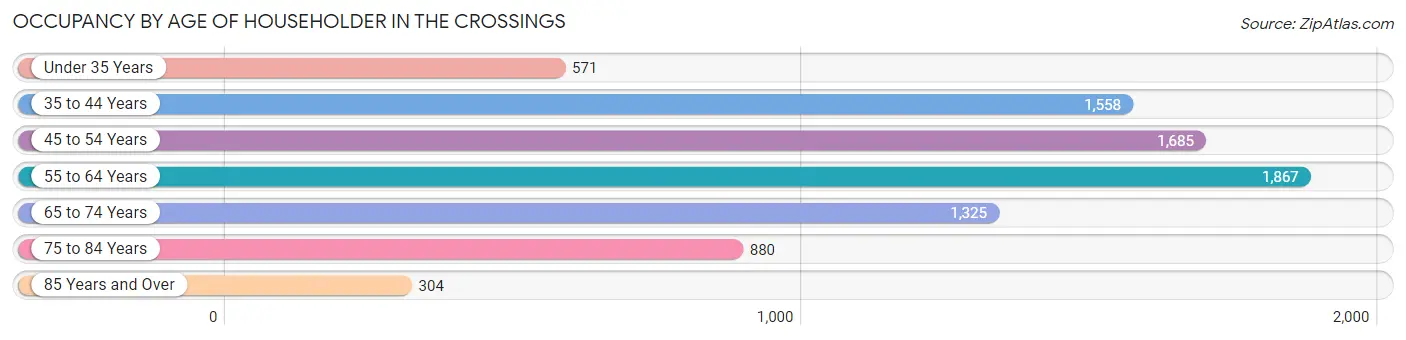
| Age Bracket | # Households | % Households |
| Under 35 Years | 571 | 7.0% |
| 35 to 44 Years | 1,558 | 19.0% |
| 45 to 54 Years | 1,685 | 20.6% |
| 55 to 64 Years | 1,867 | 22.8% |
| 65 to 74 Years | 1,325 | 16.2% |
| 75 to 84 Years | 880 | 10.7% |
| 85 Years and Over | 304 | 3.7% |
| Total | 8,190 | 100.0% |
Housing Finances in The Crossings
Median Income by Occupancy in The Crossings
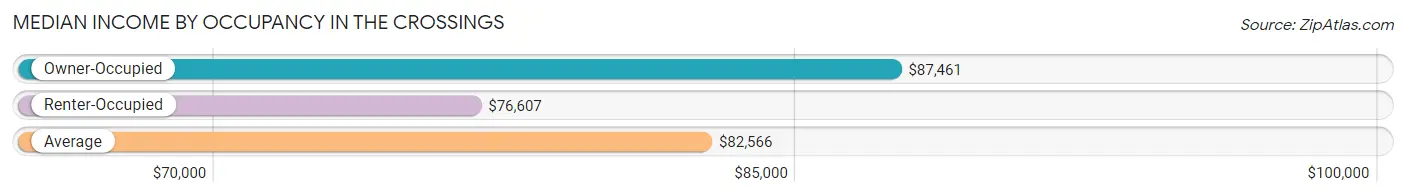
| Occupancy Type | # Households | Median Income |
| Owner-Occupied | 6,045 (73.8%) | $87,461 |
| Renter-Occupied | 2,145 (26.2%) | $76,607 |
| Average | 8,190 (100.0%) | $82,566 |
Occupancy by Householder Income Bracket in The Crossings
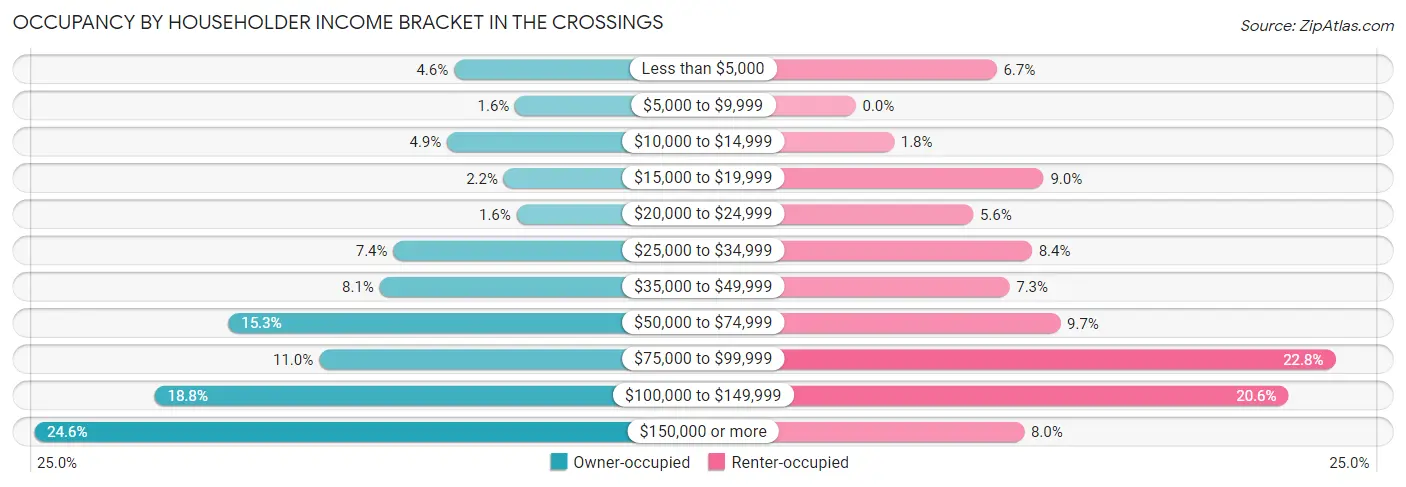
| Income Bracket | Owner-occupied | Renter-occupied |
| Less than $5,000 | 275 (4.5%) | 144 (6.7%) |
| $5,000 to $9,999 | 99 (1.6%) | 0 (0.0%) |
| $10,000 to $14,999 | 295 (4.9%) | 39 (1.8%) |
| $15,000 to $19,999 | 132 (2.2%) | 192 (8.9%) |
| $20,000 to $24,999 | 95 (1.6%) | 120 (5.6%) |
| $25,000 to $34,999 | 450 (7.4%) | 180 (8.4%) |
| $35,000 to $49,999 | 489 (8.1%) | 157 (7.3%) |
| $50,000 to $74,999 | 925 (15.3%) | 209 (9.7%) |
| $75,000 to $99,999 | 664 (11.0%) | 490 (22.8%) |
| $100,000 to $149,999 | 1,137 (18.8%) | 442 (20.6%) |
| $150,000 or more | 1,484 (24.5%) | 172 (8.0%) |
| Total | 6,045 (100.0%) | 2,145 (100.0%) |
Monthly Housing Cost Tiers in The Crossings
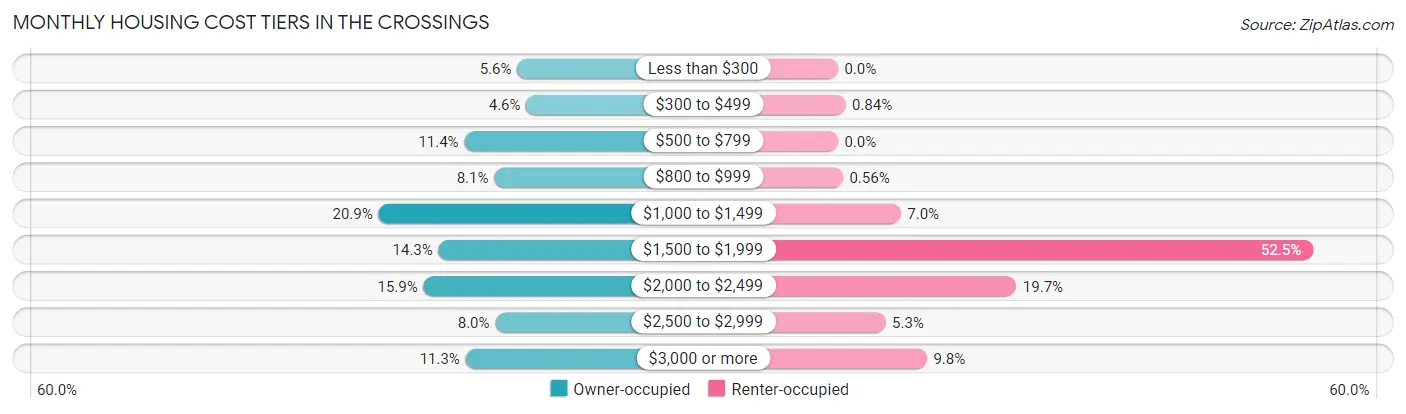
| Monthly Cost | Owner-occupied | Renter-occupied |
| Less than $300 | 337 (5.6%) | 0 (0.0%) |
| $300 to $499 | 276 (4.6%) | 18 (0.8%) |
| $500 to $799 | 690 (11.4%) | 0 (0.0%) |
| $800 to $999 | 490 (8.1%) | 12 (0.6%) |
| $1,000 to $1,499 | 1,263 (20.9%) | 149 (7.0%) |
| $1,500 to $1,999 | 862 (14.3%) | 1,127 (52.5%) |
| $2,000 to $2,499 | 963 (15.9%) | 423 (19.7%) |
| $2,500 to $2,999 | 483 (8.0%) | 113 (5.3%) |
| $3,000 or more | 681 (11.3%) | 211 (9.8%) |
| Total | 6,045 (100.0%) | 2,145 (100.0%) |
Physical Housing Characteristics in The Crossings
Housing Structures in The Crossings
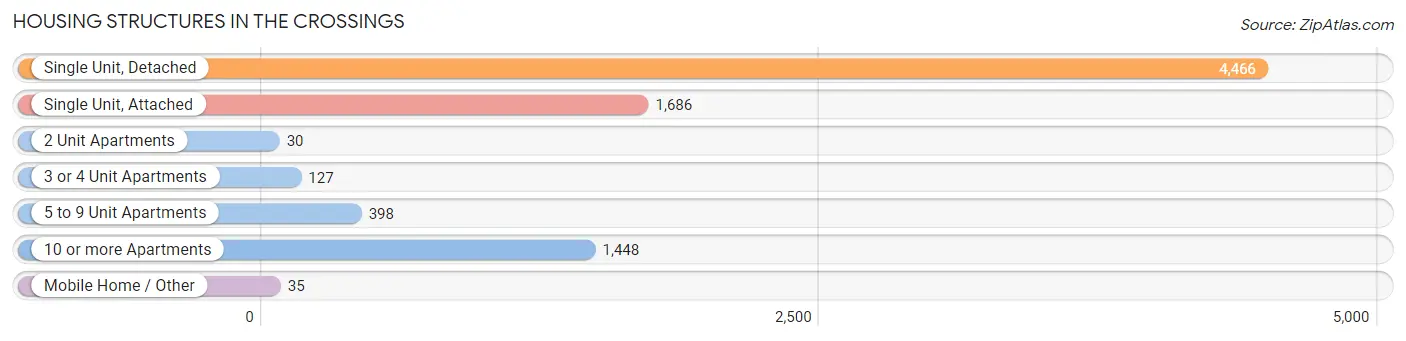
| Structure Type | # Housing Units | % Housing Units |
| Single Unit, Detached | 4,466 | 54.5% |
| Single Unit, Attached | 1,686 | 20.6% |
| 2 Unit Apartments | 30 | 0.4% |
| 3 or 4 Unit Apartments | 127 | 1.5% |
| 5 to 9 Unit Apartments | 398 | 4.9% |
| 10 or more Apartments | 1,448 | 17.7% |
| Mobile Home / Other | 35 | 0.4% |
| Total | 8,190 | 100.0% |
Housing Structures by Occupancy in The Crossings
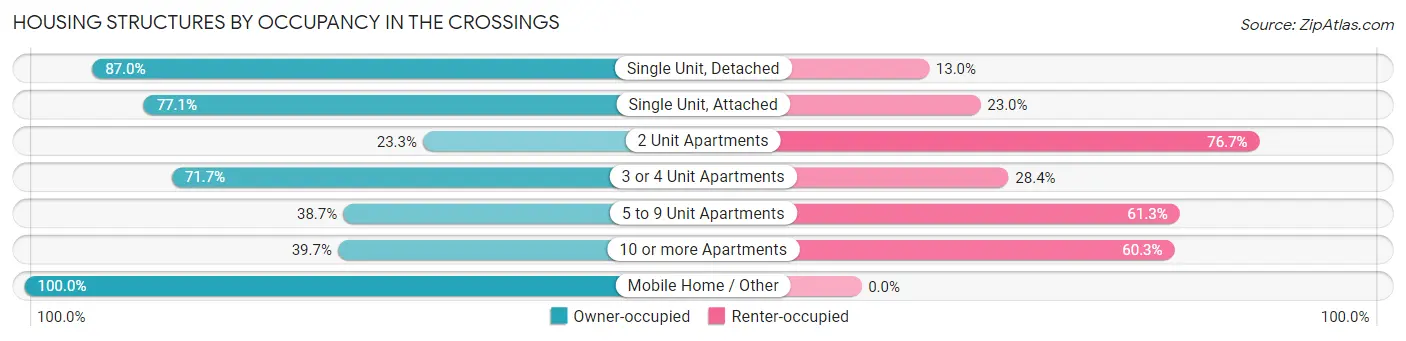
| Structure Type | Owner-occupied | Renter-occupied |
| Single Unit, Detached | 3,884 (87.0%) | 582 (13.0%) |
| Single Unit, Attached | 1,299 (77.0%) | 387 (23.0%) |
| 2 Unit Apartments | 7 (23.3%) | 23 (76.7%) |
| 3 or 4 Unit Apartments | 91 (71.7%) | 36 (28.3%) |
| 5 to 9 Unit Apartments | 154 (38.7%) | 244 (61.3%) |
| 10 or more Apartments | 575 (39.7%) | 873 (60.3%) |
| Mobile Home / Other | 35 (100.0%) | 0 (0.0%) |
| Total | 6,045 (73.8%) | 2,145 (26.2%) |
Housing Structures by Number of Rooms in The Crossings
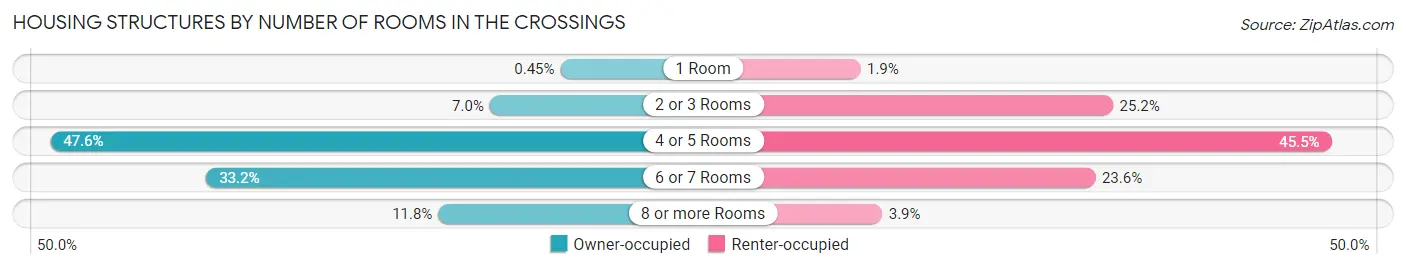
| Number of Rooms | Owner-occupied | Renter-occupied |
| 1 Room | 27 (0.4%) | 40 (1.9%) |
| 2 or 3 Rooms | 422 (7.0%) | 541 (25.2%) |
| 4 or 5 Rooms | 2,879 (47.6%) | 975 (45.5%) |
| 6 or 7 Rooms | 2,007 (33.2%) | 506 (23.6%) |
| 8 or more Rooms | 710 (11.7%) | 83 (3.9%) |
| Total | 6,045 (100.0%) | 2,145 (100.0%) |
Housing Structure by Heating Type in The Crossings
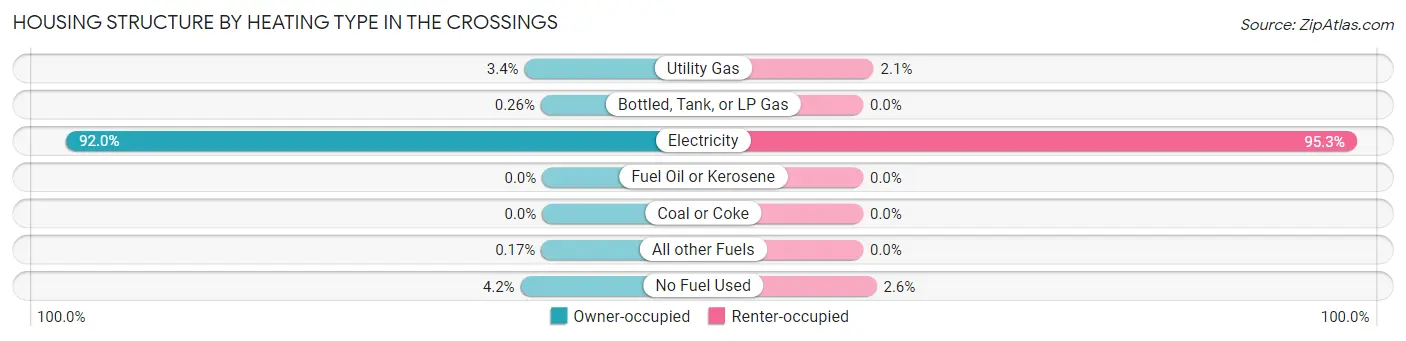
| Heating Type | Owner-occupied | Renter-occupied |
| Utility Gas | 206 (3.4%) | 44 (2.1%) |
| Bottled, Tank, or LP Gas | 16 (0.3%) | 0 (0.0%) |
| Electricity | 5,560 (92.0%) | 2,045 (95.3%) |
| Fuel Oil or Kerosene | 0 (0.0%) | 0 (0.0%) |
| Coal or Coke | 0 (0.0%) | 0 (0.0%) |
| All other Fuels | 10 (0.2%) | 0 (0.0%) |
| No Fuel Used | 253 (4.2%) | 56 (2.6%) |
| Total | 6,045 (100.0%) | 2,145 (100.0%) |
Household Vehicle Usage in The Crossings
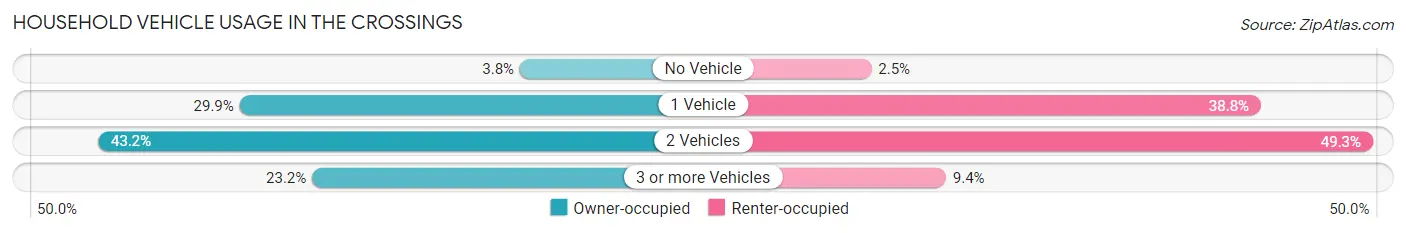
| Vehicles per Household | Owner-occupied | Renter-occupied |
| No Vehicle | 227 (3.8%) | 53 (2.5%) |
| 1 Vehicle | 1,809 (29.9%) | 833 (38.8%) |
| 2 Vehicles | 2,609 (43.2%) | 1,057 (49.3%) |
| 3 or more Vehicles | 1,400 (23.2%) | 202 (9.4%) |
| Total | 6,045 (100.0%) | 2,145 (100.0%) |
Real Estate & Mortgages in The Crossings
Real Estate and Mortgage Overview in The Crossings
| Characteristic | Without Mortgage | With Mortgage |
| Housing Units | 2,405 | 3,640 |
| Median Property Value | $358,700 | $387,300 |
| Median Household Income | $57,969 | $1,038 |
| Monthly Housing Costs | $781 | $681 |
| Real Estate Taxes | $2,895 | $33 |
Property Value by Mortgage Status in The Crossings
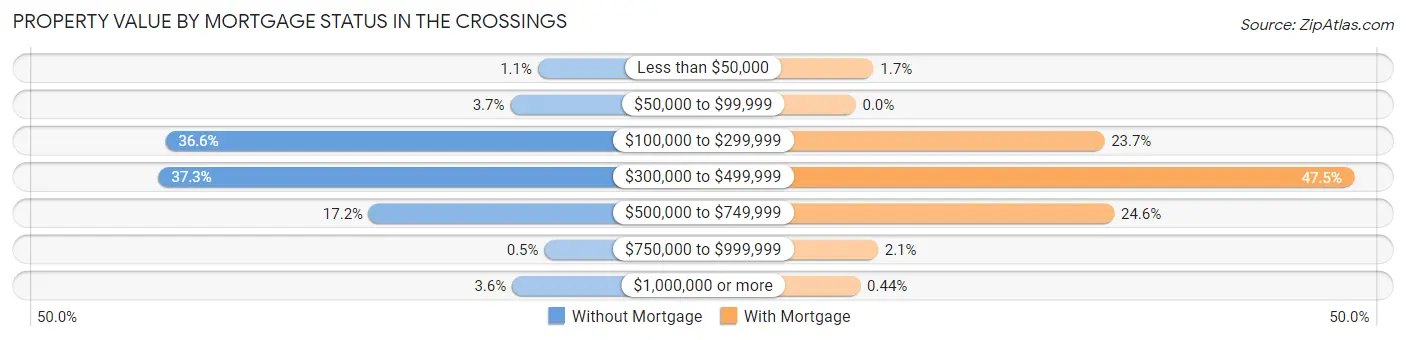
| Property Value | Without Mortgage | With Mortgage |
| Less than $50,000 | 27 (1.1%) | 62 (1.7%) |
| $50,000 to $99,999 | 90 (3.7%) | 0 (0.0%) |
| $100,000 to $299,999 | 880 (36.6%) | 862 (23.7%) |
| $300,000 to $499,999 | 896 (37.3%) | 1,727 (47.4%) |
| $500,000 to $749,999 | 414 (17.2%) | 896 (24.6%) |
| $750,000 to $999,999 | 12 (0.5%) | 77 (2.1%) |
| $1,000,000 or more | 86 (3.6%) | 16 (0.4%) |
| Total | 2,405 (100.0%) | 3,640 (100.0%) |
Household Income by Mortgage Status in The Crossings
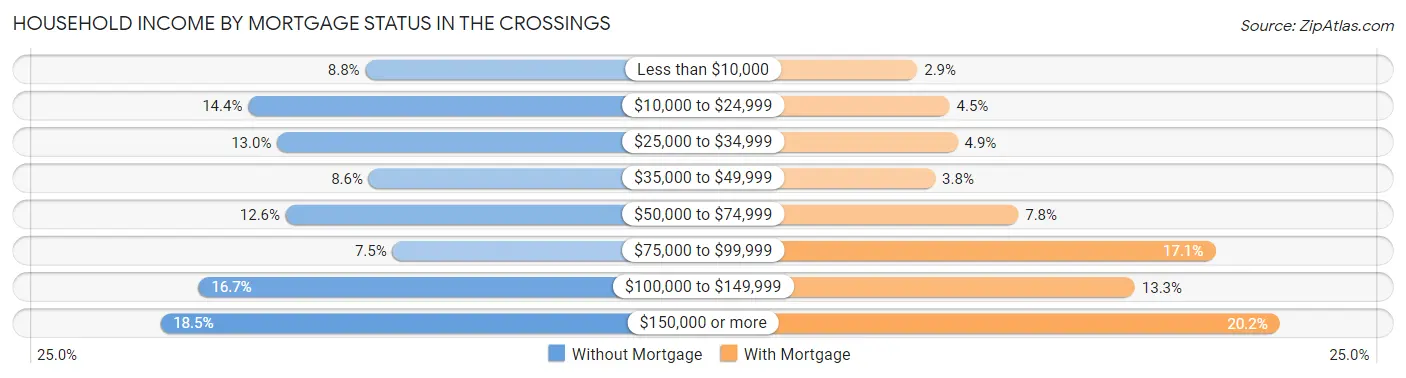
| Household Income | Without Mortgage | With Mortgage |
| Less than $10,000 | 211 (8.8%) | 107 (2.9%) |
| $10,000 to $24,999 | 345 (14.3%) | 163 (4.5%) |
| $25,000 to $34,999 | 312 (13.0%) | 177 (4.9%) |
| $35,000 to $49,999 | 207 (8.6%) | 138 (3.8%) |
| $50,000 to $74,999 | 302 (12.6%) | 282 (7.7%) |
| $75,000 to $99,999 | 180 (7.5%) | 623 (17.1%) |
| $100,000 to $149,999 | 402 (16.7%) | 484 (13.3%) |
| $150,000 or more | 446 (18.5%) | 735 (20.2%) |
| Total | 2,405 (100.0%) | 3,640 (100.0%) |
Property Value to Household Income Ratio in The Crossings
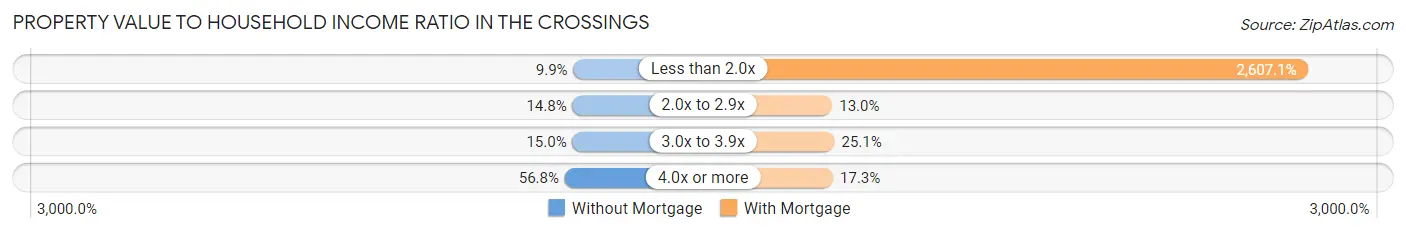
| Value-to-Income Ratio | Without Mortgage | With Mortgage |
| Less than 2.0x | 237 (9.9%) | 94,899 (2,607.1%) |
| 2.0x to 2.9x | 357 (14.8%) | 474 (13.0%) |
| 3.0x to 3.9x | 360 (15.0%) | 912 (25.1%) |
| 4.0x or more | 1,366 (56.8%) | 630 (17.3%) |
| Total | 2,405 (100.0%) | 3,640 (100.0%) |
Real Estate Taxes by Mortgage Status in The Crossings
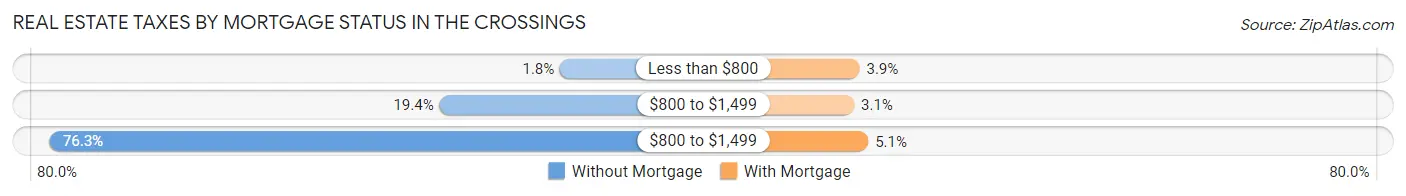
| Property Taxes | Without Mortgage | With Mortgage |
| Less than $800 | 42 (1.8%) | 141 (3.9%) |
| $800 to $1,499 | 466 (19.4%) | 112 (3.1%) |
| $800 to $1,499 | 1,835 (76.3%) | 187 (5.1%) |
| Total | 2,405 (100.0%) | 3,640 (100.0%) |
Health & Disability in The Crossings
Health Insurance Coverage by Age in The Crossings
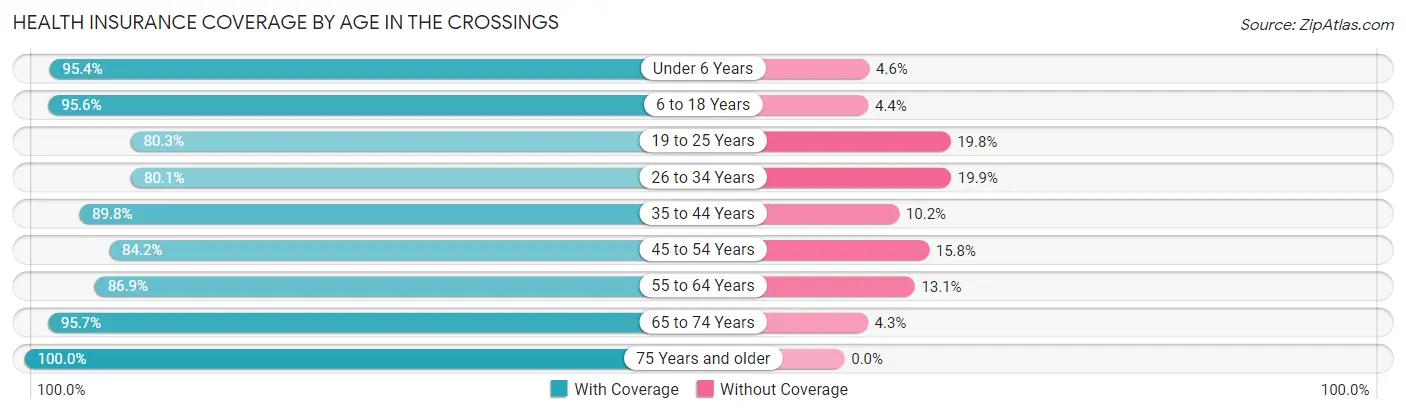
| Age Bracket | With Coverage | Without Coverage |
| Under 6 Years | 1,260 (95.4%) | 61 (4.6%) |
| 6 to 18 Years | 3,278 (95.6%) | 152 (4.4%) |
| 19 to 25 Years | 1,532 (80.2%) | 377 (19.8%) |
| 26 to 34 Years | 1,613 (80.1%) | 400 (19.9%) |
| 35 to 44 Years | 2,664 (89.8%) | 302 (10.2%) |
| 45 to 54 Years | 2,603 (84.2%) | 487 (15.8%) |
| 55 to 64 Years | 2,991 (86.9%) | 450 (13.1%) |
| 65 to 74 Years | 2,159 (95.7%) | 98 (4.3%) |
| 75 Years and older | 2,243 (100.0%) | 0 (0.0%) |
| Total | 20,343 (89.7%) | 2,327 (10.3%) |
Health Insurance Coverage by Citizenship Status in The Crossings
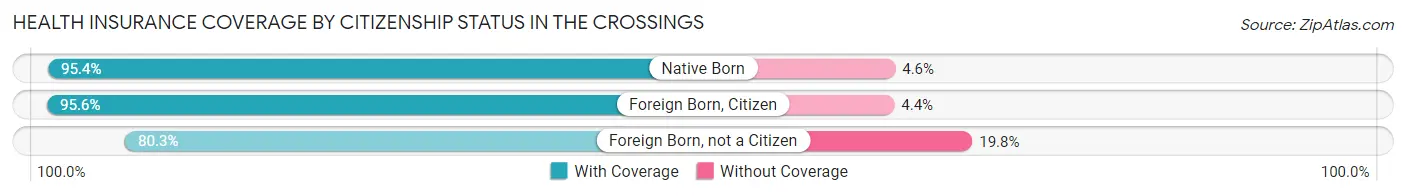
| Citizenship Status | With Coverage | Without Coverage |
| Native Born | 1,260 (95.4%) | 61 (4.6%) |
| Foreign Born, Citizen | 3,278 (95.6%) | 152 (4.4%) |
| Foreign Born, not a Citizen | 1,532 (80.2%) | 377 (19.8%) |
Health Insurance Coverage by Household Income in The Crossings
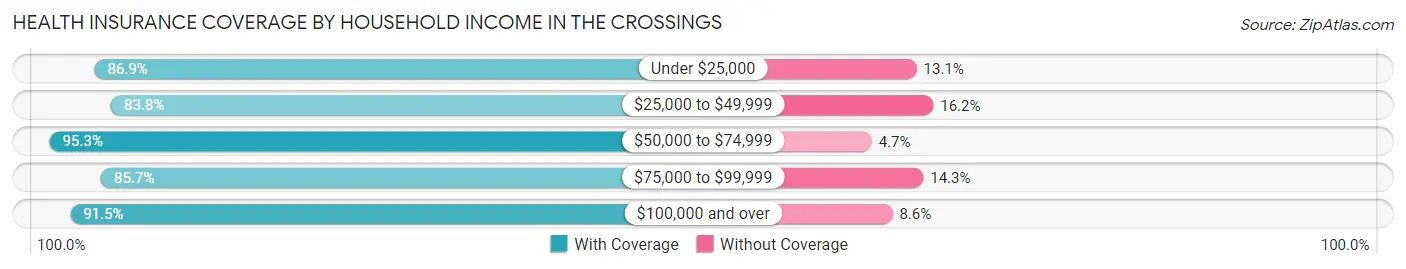
| Household Income | With Coverage | Without Coverage |
| Under $25,000 | 2,137 (86.9%) | 322 (13.1%) |
| $25,000 to $49,999 | 2,225 (83.8%) | 430 (16.2%) |
| $50,000 to $74,999 | 2,901 (95.3%) | 142 (4.7%) |
| $75,000 to $99,999 | 2,793 (85.7%) | 467 (14.3%) |
| $100,000 and over | 10,247 (91.4%) | 958 (8.6%) |
Public vs Private Health Insurance Coverage by Age in The Crossings
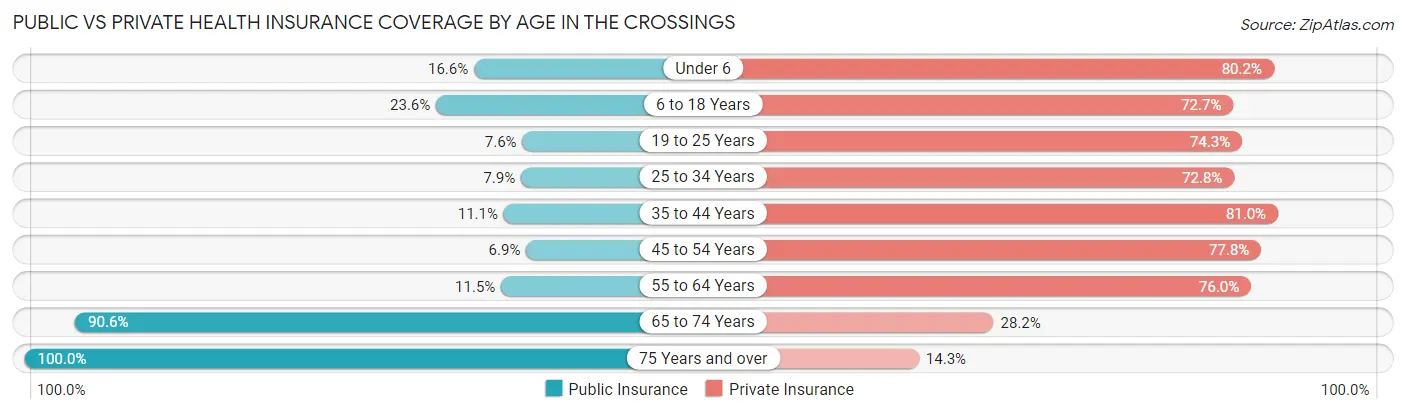
| Age Bracket | Public Insurance | Private Insurance |
| Under 6 | 219 (16.6%) | 1,059 (80.2%) |
| 6 to 18 Years | 810 (23.6%) | 2,492 (72.7%) |
| 19 to 25 Years | 145 (7.6%) | 1,418 (74.3%) |
| 25 to 34 Years | 158 (7.9%) | 1,466 (72.8%) |
| 35 to 44 Years | 328 (11.1%) | 2,401 (80.9%) |
| 45 to 54 Years | 213 (6.9%) | 2,405 (77.8%) |
| 55 to 64 Years | 397 (11.5%) | 2,614 (76.0%) |
| 65 to 74 Years | 2,045 (90.6%) | 636 (28.2%) |
| 75 Years and over | 2,243 (100.0%) | 321 (14.3%) |
| Total | 6,558 (28.9%) | 14,812 (65.3%) |
Disability Status by Sex by Age in The Crossings
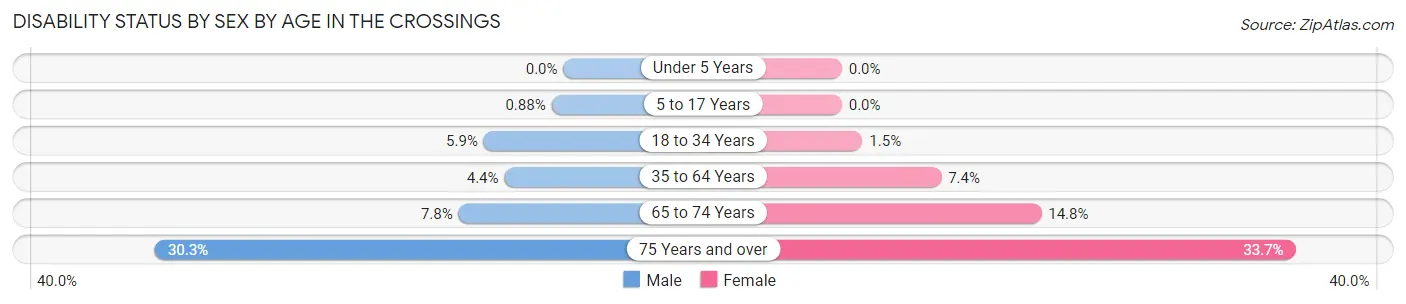
| Age Bracket | Male | Female |
| Under 5 Years | 0 (0.0%) | 0 (0.0%) |
| 5 to 17 Years | 18 (0.9%) | 0 (0.0%) |
| 18 to 34 Years | 129 (5.9%) | 29 (1.5%) |
| 35 to 64 Years | 198 (4.4%) | 367 (7.4%) |
| 65 to 74 Years | 71 (7.8%) | 199 (14.8%) |
| 75 Years and over | 248 (30.3%) | 480 (33.7%) |
Disability Class by Sex by Age in The Crossings
Disability Class: Hearing Difficulty
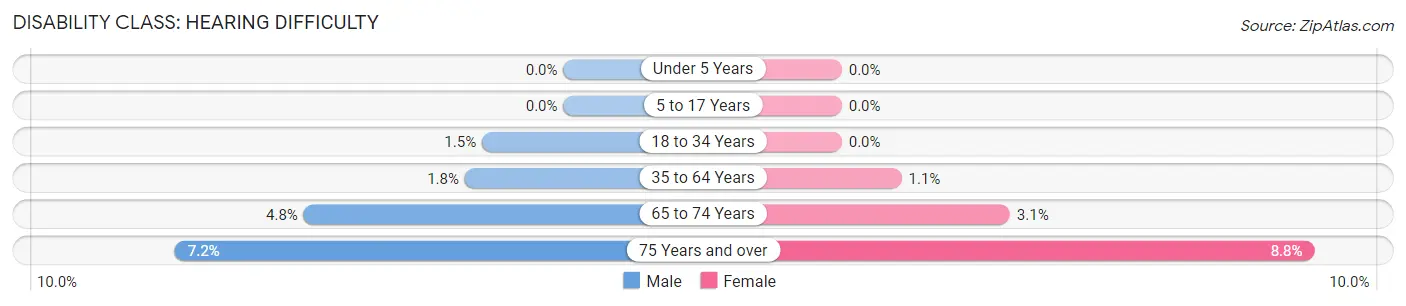
| Age Bracket | Male | Female |
| Under 5 Years | 0 (0.0%) | 0 (0.0%) |
| 5 to 17 Years | 0 (0.0%) | 0 (0.0%) |
| 18 to 34 Years | 33 (1.5%) | 0 (0.0%) |
| 35 to 64 Years | 83 (1.8%) | 55 (1.1%) |
| 65 to 74 Years | 44 (4.8%) | 42 (3.1%) |
| 75 Years and over | 59 (7.2%) | 125 (8.8%) |
Disability Class: Vision Difficulty
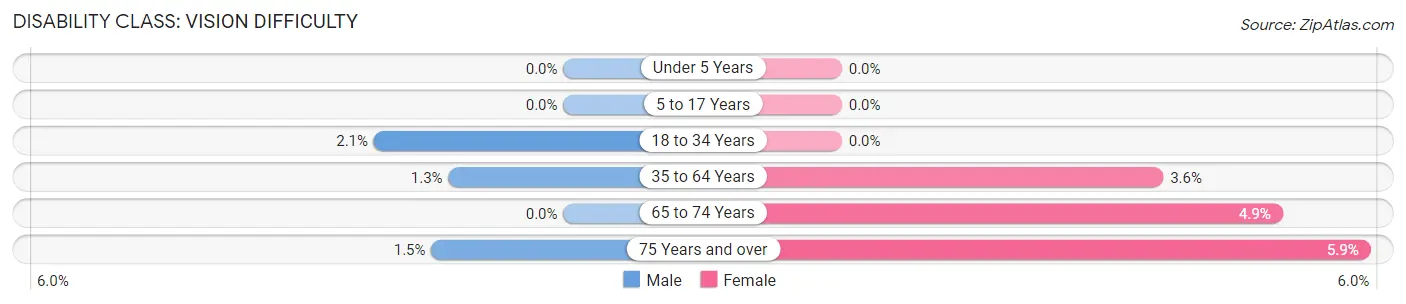
| Age Bracket | Male | Female |
| Under 5 Years | 0 (0.0%) | 0 (0.0%) |
| 5 to 17 Years | 0 (0.0%) | 0 (0.0%) |
| 18 to 34 Years | 46 (2.1%) | 0 (0.0%) |
| 35 to 64 Years | 58 (1.3%) | 178 (3.6%) |
| 65 to 74 Years | 0 (0.0%) | 66 (4.9%) |
| 75 Years and over | 12 (1.5%) | 84 (5.9%) |
Disability Class: Cognitive Difficulty
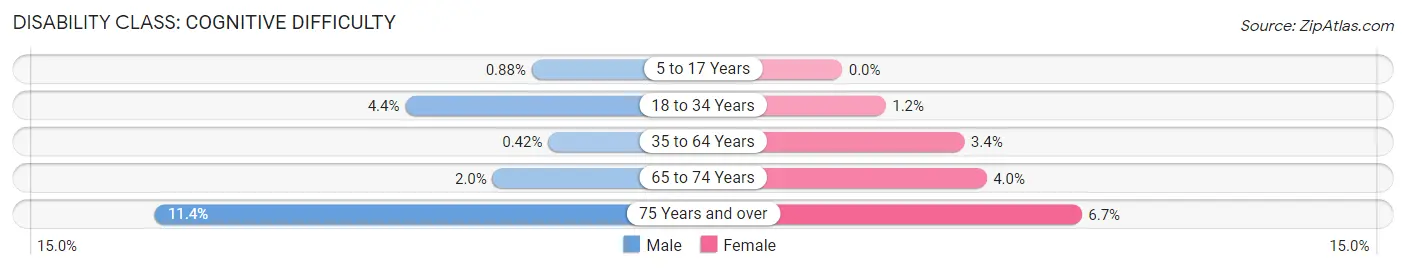
| Age Bracket | Male | Female |
| 5 to 17 Years | 18 (0.9%) | 0 (0.0%) |
| 18 to 34 Years | 96 (4.4%) | 23 (1.2%) |
| 35 to 64 Years | 19 (0.4%) | 169 (3.4%) |
| 65 to 74 Years | 18 (2.0%) | 54 (4.0%) |
| 75 Years and over | 93 (11.4%) | 95 (6.7%) |
Disability Class: Ambulatory Difficulty
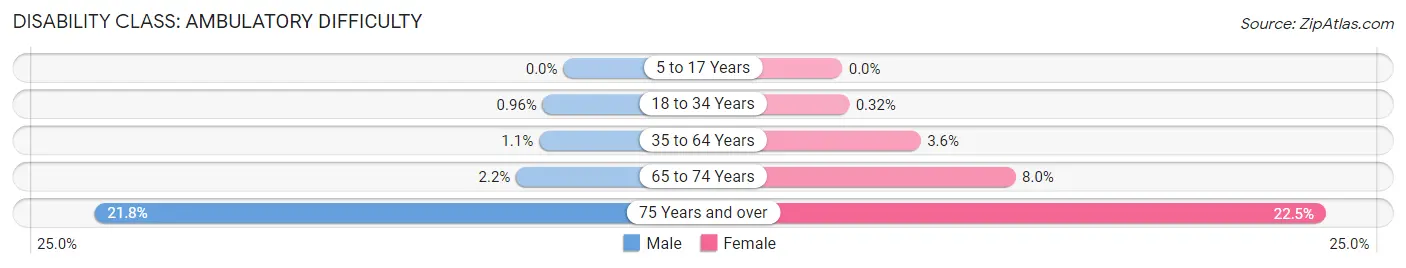
| Age Bracket | Male | Female |
| 5 to 17 Years | 0 (0.0%) | 0 (0.0%) |
| 18 to 34 Years | 21 (1.0%) | 6 (0.3%) |
| 35 to 64 Years | 51 (1.1%) | 181 (3.6%) |
| 65 to 74 Years | 20 (2.2%) | 108 (8.0%) |
| 75 Years and over | 178 (21.8%) | 320 (22.5%) |
Disability Class: Self-Care Difficulty
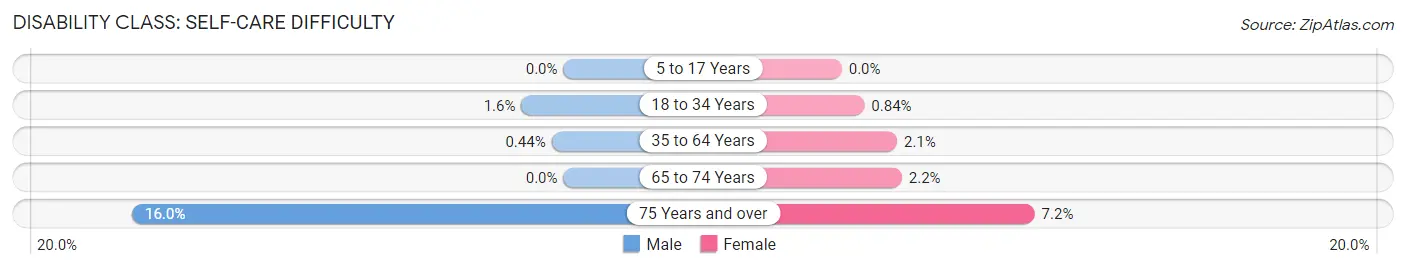
| Age Bracket | Male | Female |
| 5 to 17 Years | 0 (0.0%) | 0 (0.0%) |
| 18 to 34 Years | 34 (1.6%) | 16 (0.8%) |
| 35 to 64 Years | 20 (0.4%) | 102 (2.1%) |
| 65 to 74 Years | 0 (0.0%) | 30 (2.2%) |
| 75 Years and over | 131 (16.0%) | 102 (7.2%) |
Technology Access in The Crossings
Computing Device Access in The Crossings
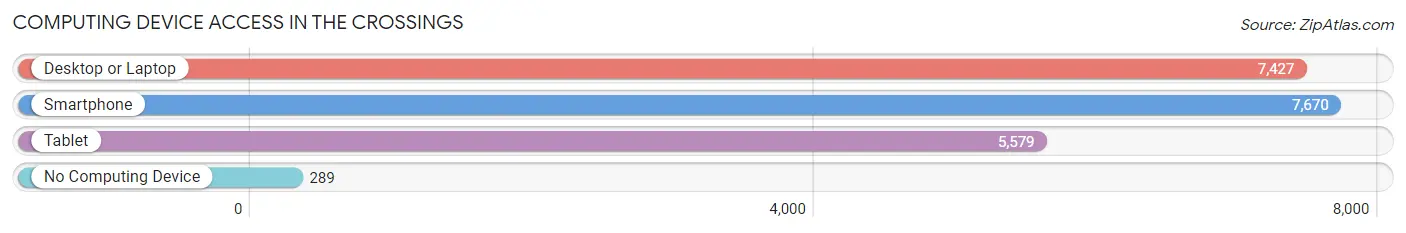
| Device Type | # Households | % Households |
| Desktop or Laptop | 7,427 | 90.7% |
| Smartphone | 7,670 | 93.6% |
| Tablet | 5,579 | 68.1% |
| No Computing Device | 289 | 3.5% |
| Total | 8,190 | 100.0% |
Internet Access in The Crossings
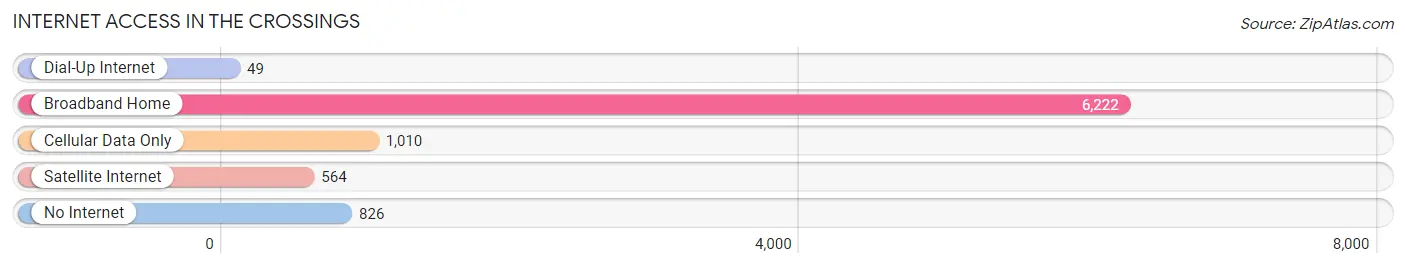
| Internet Type | # Households | % Households |
| Dial-Up Internet | 49 | 0.6% |
| Broadband Home | 6,222 | 76.0% |
| Cellular Data Only | 1,010 | 12.3% |
| Satellite Internet | 564 | 6.9% |
| No Internet | 826 | 10.1% |
| Total | 8,190 | 100.0% |
The Crossings Summary
History
The Crossings is a census-designated place (CDP) located in Miami-Dade County, Florida. It is located in the southern part of the county, just north of the city of Miami. The Crossings was originally part of the Everglades, and was first settled in the late 1800s by settlers from the Bahamas. The area was known as “The Crossings” because of the many canals and waterways that crisscrossed the area.
The Crossings was officially incorporated as a town in 1925. At the time, the town was mostly agricultural, with a few small businesses. The town was home to a few hundred people, mostly of Bahamian descent. The town was also home to a few small churches, a post office, and a few stores.
In the 1950s, the town began to grow rapidly as more people moved to the area. The population of The Crossings grew to over 1,000 people by the 1960s. The town was home to a variety of businesses, including a grocery store, a gas station, and a few restaurants.
In the 1970s, the town began to experience a decline in population as people moved away to other parts of Miami-Dade County. By the 1980s, the population had dropped to just over 500 people.
In the 1990s, the population of The Crossings began to grow again as more people moved to the area. The population of The Crossings is now over 2,000 people.
Geography
The Crossings is located in the southern part of Miami-Dade County, just north of the city of Miami. The Crossings is bordered by the cities of Miami Gardens to the north, Miami Lakes to the east, and Hialeah to the south. The Crossings is located in the Miami metropolitan area, which is home to over 5.5 million people.
The Crossings is located in a flat, low-lying area. The area is mostly covered in wetlands and swamps, with a few small hills. The area is home to a variety of wildlife, including alligators, snakes, and birds.
The Crossings is located in a humid subtropical climate, with hot, humid summers and mild, dry winters. The area receives an average of 60 inches of rain per year.
Economy
The Crossings is primarily a residential area, with a few small businesses. The area is home to a few small retail stores, restaurants, and other businesses. The area is also home to a few small industrial businesses.
The Crossings is home to a few small parks, including the Crossings Park and the Crossings Nature Center. The area is also home to a few small golf courses.
Demographics
The Crossings is home to over 2,000 people. The population is mostly Hispanic, with a small percentage of African Americans and other races. The median household income in The Crossings is $37,000, and the median home value is $150,000. The unemployment rate in The Crossings is 8.2%, which is slightly higher than the national average.
Common Questions
What is the Total Population of The Crossings?
Total Population of The Crossings is 22,708.
What is the Total Male Population of The Crossings?
Total Male Population of The Crossings is 11,020.
What is the Total Female Population of The Crossings?
Total Female Population of The Crossings is 11,688.
What is the Ratio of Males per 100 Females in The Crossings?
There are 94.28 Males per 100 Females in The Crossings.
What is the Ratio of Females per 100 Males in The Crossings?
There are 106.06 Females per 100 Males in The Crossings.
What is the Median Population Age in The Crossings?
Median Population Age in The Crossings is 43.5 Years.
What is the Average Family Size in The Crossings
Average Family Size in The Crossings is 3.2 People.
What is the Average Household Size in The Crossings
Average Household Size in The Crossings is 2.8 People.
What is Per Capita Income in The Crossings?
Per Capita income in The Crossings is $35,736.
What is the Median Family Income in The Crossings?
Median Family Income in The Crossings is $89,481.
What is the Median Household income in The Crossings?
Median Household Income in The Crossings is $82,566.
What is Income or Wage Gap in The Crossings?
Income or Wage Gap in The Crossings is 25.5%.
Women in The Crossings earn 74.5 cents for every dollar earned by a man.
What is Family Income Deficit in The Crossings?
Family Income Deficit in The Crossings is $13,180.
Families that are below poverty line in The Crossings earn $13,180 less on average than the poverty threshold level.
What is Inequality or Gini Index in The Crossings?
Inequality or Gini Index in The Crossings is 0.43.
How Large is the Labor Force in The Crossings?
There are 11,981 People in the Labor Forcein in The Crossings.
What is the Percentage of People in the Labor Force in The Crossings?
63.9% of People are in the Labor Force in The Crossings.
What is the Unemployment Rate in The Crossings?
Unemployment Rate in The Crossings is 2.4%.