St Augustine, FL
St Augustine Map
St Augustine Overview
14,642
TOTAL POPULATION
6,474
MALE POPULATION
8,168
FEMALE POPULATION
79.26
MALES / 100 FEMALES
126.17
FEMALES / 100 MALES
48.1
MEDIAN AGE
2.8
AVG FAMILY SIZE
2.2
AVG HOUSEHOLD SIZE
$42,903
PER CAPITA INCOME
$100,652
AVG FAMILY INCOME
$72,806
AVG HOUSEHOLD INCOME
20.5%
WAGE / INCOME GAP [ % ]
79.5¢/ $1
WAGE / INCOME GAP [ $ ]
0.47
INEQUALITY / GINI INDEX
7,597
LABOR FORCE [ PEOPLE ]
55.3%
PERCENT IN LABOR FORCE
3.2%
UNEMPLOYMENT RATE
St Augustine Area Codes
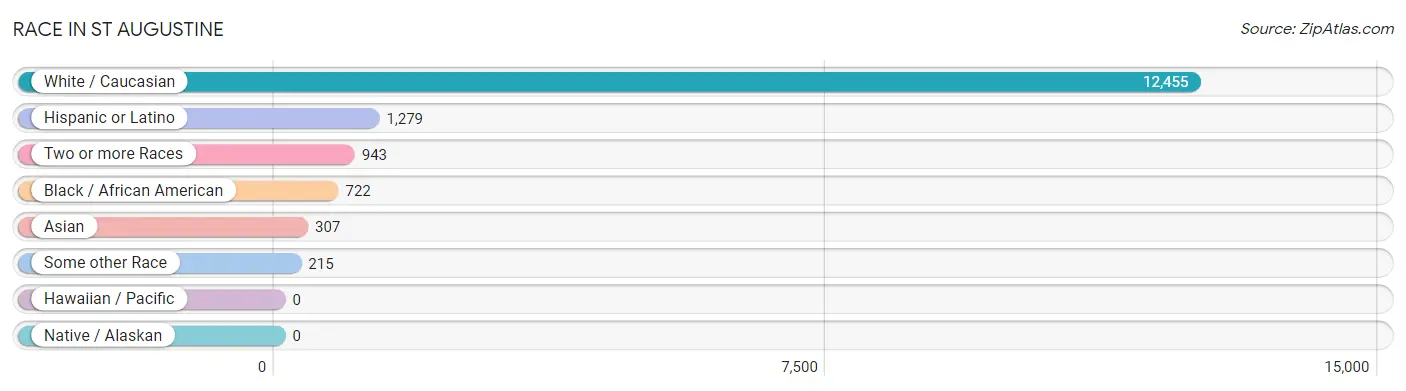
Race in St Augustine
The most populous races in St Augustine are White / Caucasian (12,455 | 85.1%), Hispanic or Latino (1,279 | 8.7%), and Two or more Races (943 | 6.4%).
| Race | # Population | % Population |
| Asian | 307 | 2.1% |
| Black / African American | 722 | 4.9% |
| Hawaiian / Pacific | 0 | 0.0% |
| Hispanic or Latino | 1,279 | 8.7% |
| Native / Alaskan | 0 | 0.0% |
| White / Caucasian | 12,455 | 85.1% |
| Two or more Races | 943 | 6.4% |
| Some other Race | 215 | 1.5% |
| Total | 14,642 | 100.0% |
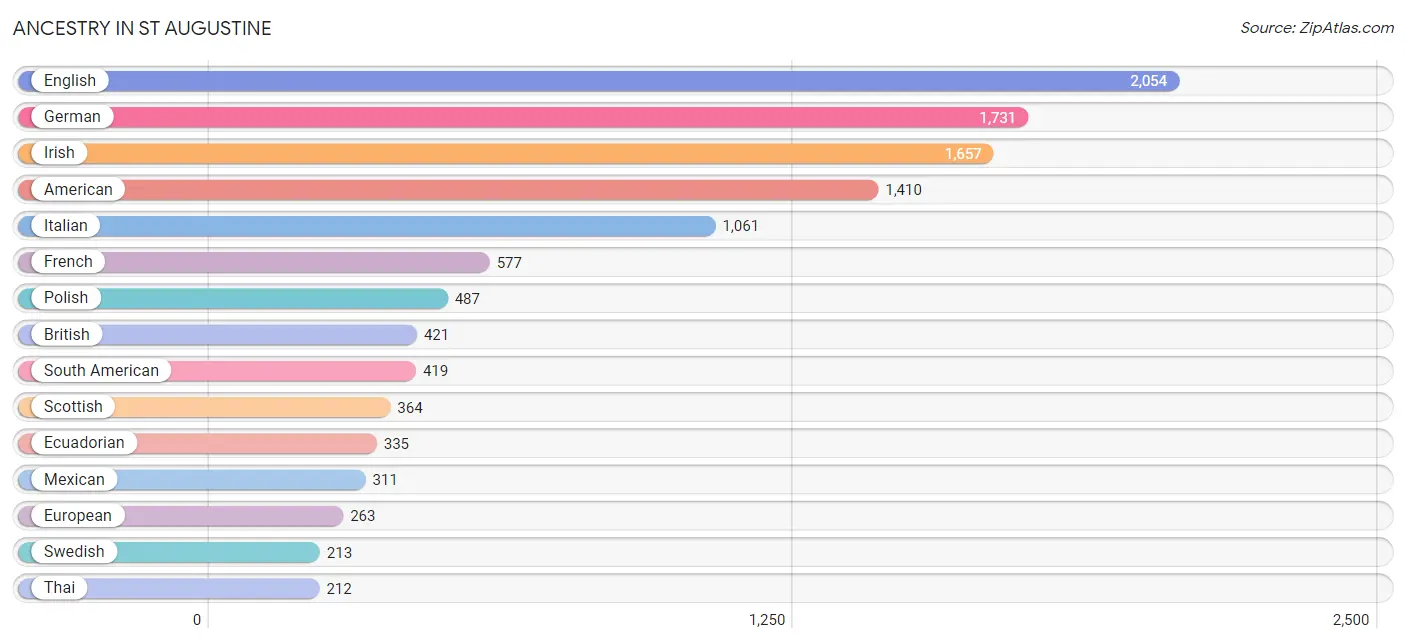
Ancestry in St Augustine
The most populous ancestries reported in St Augustine are English (2,054 | 14.0%), German (1,731 | 11.8%), Irish (1,657 | 11.3%), American (1,410 | 9.6%), and Italian (1,061 | 7.2%), together accounting for 54.0% of all St Augustine residents.
| Ancestry | # Population | % Population |
| African | 31 | 0.2% |
| American | 1,410 | 9.6% |
| Arab | 57 | 0.4% |
| Austrian | 20 | 0.1% |
| Bahamian | 9 | 0.1% |
| Bhutanese | 15 | 0.1% |
| Brazilian | 143 | 1.0% |
| British | 421 | 2.9% |
| Burmese | 50 | 0.3% |
| Cajun | 14 | 0.1% |
| Canadian | 47 | 0.3% |
| Central American | 63 | 0.4% |
| Cherokee | 31 | 0.2% |
| Chilean | 11 | 0.1% |
| Colombian | 62 | 0.4% |
| Costa Rican | 42 | 0.3% |
| Croatian | 10 | 0.1% |
| Cuban | 105 | 0.7% |
| Czech | 88 | 0.6% |
| Czechoslovakian | 10 | 0.1% |
| Danish | 35 | 0.2% |
| Dominican | 5 | 0.0% |
| Dutch | 168 | 1.1% |
| Dutch West Indian | 13 | 0.1% |
| Eastern European | 84 | 0.6% |
| Ecuadorian | 335 | 2.3% |
| English | 2,054 | 14.0% |
| European | 263 | 1.8% |
| French | 577 | 3.9% |
| French Canadian | 193 | 1.3% |
| German | 1,731 | 11.8% |
| Greek | 79 | 0.5% |
| Haitian | 25 | 0.2% |
| Honduran | 21 | 0.1% |
| Hungarian | 56 | 0.4% |
| Indian (Asian) | 31 | 0.2% |
| Indonesian | 10 | 0.1% |
| Irish | 1,657 | 11.3% |
| Italian | 1,061 | 7.2% |
| Korean | 50 | 0.3% |
| Laotian | 40 | 0.3% |
| Latvian | 6 | 0.0% |
| Lithuanian | 85 | 0.6% |
| Mexican | 311 | 2.1% |
| Navajo | 18 | 0.1% |
| Northern European | 50 | 0.3% |
| Norwegian | 174 | 1.2% |
| Pennsylvania German | 49 | 0.3% |
| Peruvian | 6 | 0.0% |
| Polish | 487 | 3.3% |
| Portuguese | 52 | 0.4% |
| Puerto Rican | 131 | 0.9% |
| Romanian | 27 | 0.2% |
| Russian | 91 | 0.6% |
| Scandinavian | 17 | 0.1% |
| Scotch-Irish | 133 | 0.9% |
| Scottish | 364 | 2.5% |
| Slovak | 19 | 0.1% |
| Slovene | 8 | 0.1% |
| South American | 419 | 2.9% |
| Spaniard | 72 | 0.5% |
| Spanish | 53 | 0.4% |
| Spanish American | 7 | 0.1% |
| Subsaharan African | 31 | 0.2% |
| Swedish | 213 | 1.5% |
| Swiss | 104 | 0.7% |
| Syrian | 6 | 0.0% |
| Thai | 212 | 1.5% |
| Tongan | 52 | 0.4% |
| Ukrainian | 75 | 0.5% |
| Venezuelan | 5 | 0.0% |
| Welsh | 110 | 0.7% | View All 72 Rows |
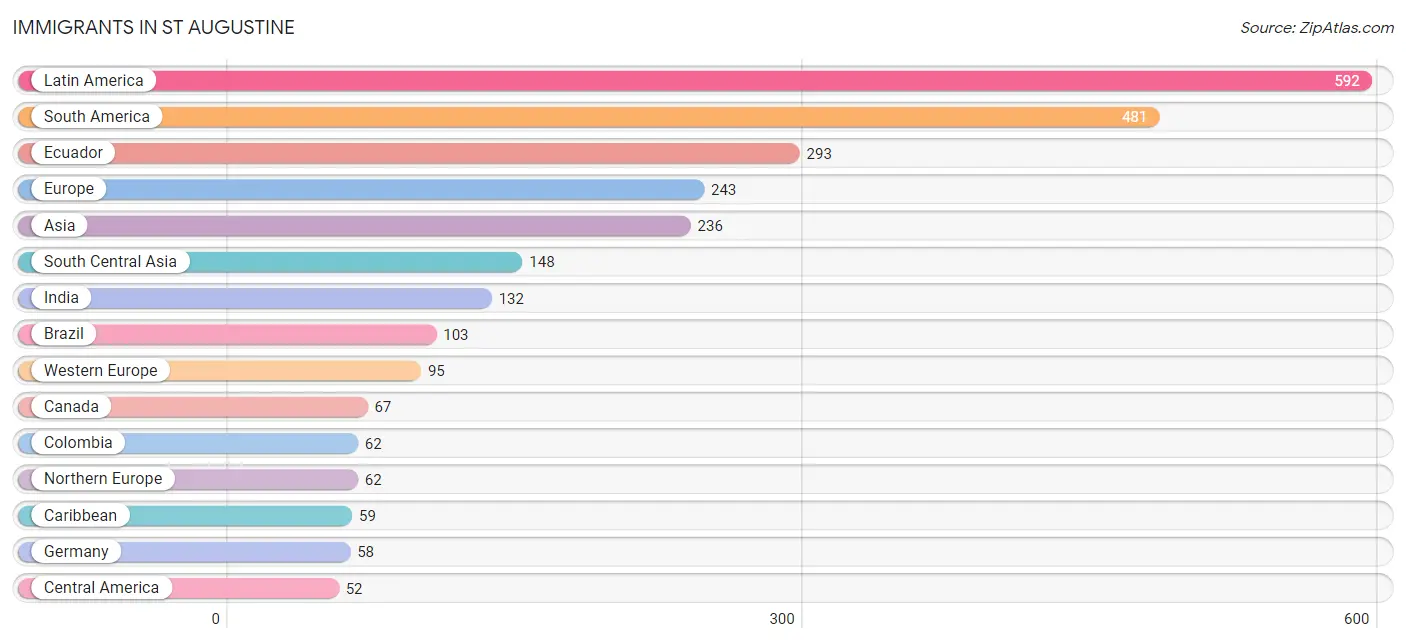
Immigrants in St Augustine
The most numerous immigrant groups reported in St Augustine came from Latin America (592 | 4.0%), South America (481 | 3.3%), Ecuador (293 | 2.0%), Europe (243 | 1.7%), and Asia (236 | 1.6%), together accounting for 12.6% of all St Augustine residents.
| Immigration Origin | # Population | % Population |
| Africa | 23 | 0.2% |
| Asia | 236 | 1.6% |
| Brazil | 103 | 0.7% |
| Canada | 67 | 0.5% |
| Caribbean | 59 | 0.4% |
| Central America | 52 | 0.4% |
| Chile | 11 | 0.1% |
| China | 18 | 0.1% |
| Colombia | 62 | 0.4% |
| Costa Rica | 36 | 0.3% |
| Cuba | 29 | 0.2% |
| Dominican Republic | 5 | 0.0% |
| Eastern Africa | 23 | 0.2% |
| Eastern Asia | 30 | 0.2% |
| Eastern Europe | 34 | 0.2% |
| Ecuador | 293 | 2.0% |
| England | 12 | 0.1% |
| Europe | 243 | 1.7% |
| France | 24 | 0.2% |
| Germany | 58 | 0.4% |
| Greece | 31 | 0.2% |
| Haiti | 25 | 0.2% |
| India | 132 | 0.9% |
| Indonesia | 19 | 0.1% |
| Ireland | 3 | 0.0% |
| Italy | 16 | 0.1% |
| Kenya | 23 | 0.2% |
| Korea | 12 | 0.1% |
| Latin America | 592 | 4.0% |
| Mexico | 16 | 0.1% |
| Netherlands | 13 | 0.1% |
| Northern Europe | 62 | 0.4% |
| Oceania | 52 | 0.4% |
| Peru | 6 | 0.0% |
| Philippines | 17 | 0.1% |
| Poland | 19 | 0.1% |
| Russia | 15 | 0.1% |
| Scotland | 4 | 0.0% |
| South America | 481 | 3.3% |
| South Central Asia | 148 | 1.0% |
| South Eastern Asia | 36 | 0.3% |
| Southern Europe | 52 | 0.4% |
| Spain | 5 | 0.0% |
| Sweden | 16 | 0.1% |
| Uzbekistan | 16 | 0.1% |
| Western Asia | 22 | 0.2% |
| Western Europe | 95 | 0.6% | View All 47 Rows |
Sex and Age in St Augustine
Sex and Age in St Augustine
The most populous age groups in St Augustine are 60 to 64 Years (594 | 9.2%) for men and 15 to 19 Years (1,029 | 12.6%) for women.
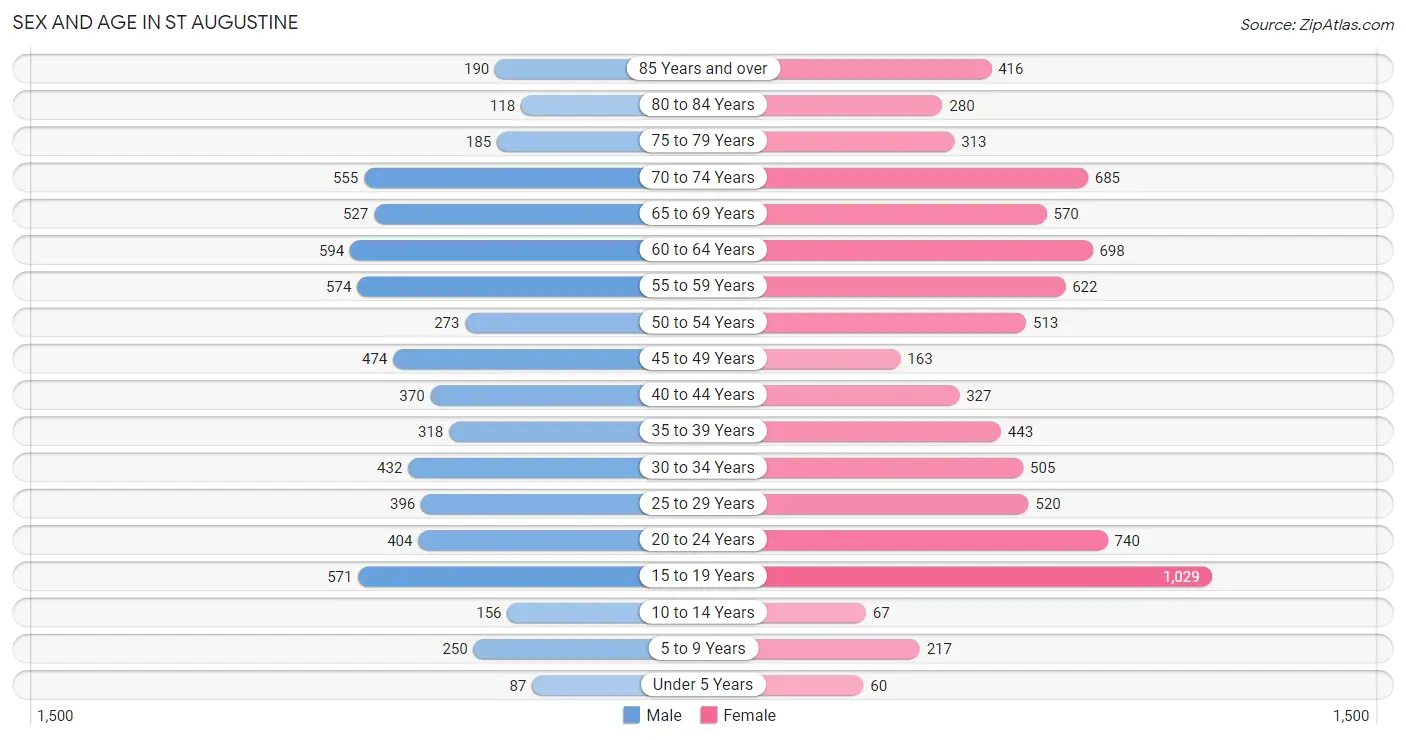
| Age Bracket | Male | Female |
| Under 5 Years | 87 (1.3%) | 60 (0.7%) |
| 5 to 9 Years | 250 (3.9%) | 217 (2.7%) |
| 10 to 14 Years | 156 (2.4%) | 67 (0.8%) |
| 15 to 19 Years | 571 (8.8%) | 1,029 (12.6%) |
| 20 to 24 Years | 404 (6.2%) | 740 (9.1%) |
| 25 to 29 Years | 396 (6.1%) | 520 (6.4%) |
| 30 to 34 Years | 432 (6.7%) | 505 (6.2%) |
| 35 to 39 Years | 318 (4.9%) | 443 (5.4%) |
| 40 to 44 Years | 370 (5.7%) | 327 (4.0%) |
| 45 to 49 Years | 474 (7.3%) | 163 (2.0%) |
| 50 to 54 Years | 273 (4.2%) | 513 (6.3%) |
| 55 to 59 Years | 574 (8.9%) | 622 (7.6%) |
| 60 to 64 Years | 594 (9.2%) | 698 (8.6%) |
| 65 to 69 Years | 527 (8.1%) | 570 (7.0%) |
| 70 to 74 Years | 555 (8.6%) | 685 (8.4%) |
| 75 to 79 Years | 185 (2.9%) | 313 (3.8%) |
| 80 to 84 Years | 118 (1.8%) | 280 (3.4%) |
| 85 Years and over | 190 (2.9%) | 416 (5.1%) |
| Total | 6,474 (100.0%) | 8,168 (100.0%) |
Families and Households in St Augustine
Median Family Size in St Augustine
The median family size in St Augustine is 2.81 persons per family, with single male/father families (91 | 3.1%) accounting for the largest median family size of 3.64 persons per family. On the other hand, married-couple families (2,397 | 82.4%) represent the smallest median family size with 2.70 persons per family.
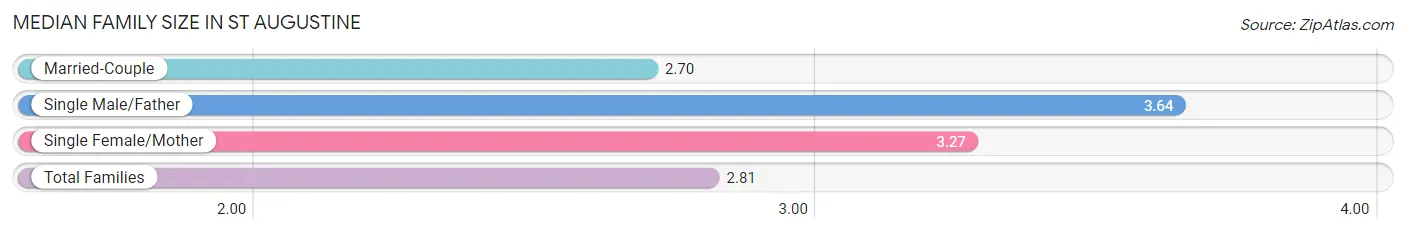
| Family Type | # Families | Family Size |
| Married-Couple | 2,397 (82.4%) | 2.70 |
| Single Male/Father | 91 (3.1%) | 3.64 |
| Single Female/Mother | 420 (14.4%) | 3.27 |
| Total Families | 2,908 (100.0%) | 2.81 |
Median Household Size in St Augustine
The median household size in St Augustine is 2.24 persons per household, with single male/father households (91 | 1.6%) accounting for the largest median household size of 3.92 persons per household. non-family households (2,925 | 50.1%) represent the smallest median household size with 1.41 persons per household.
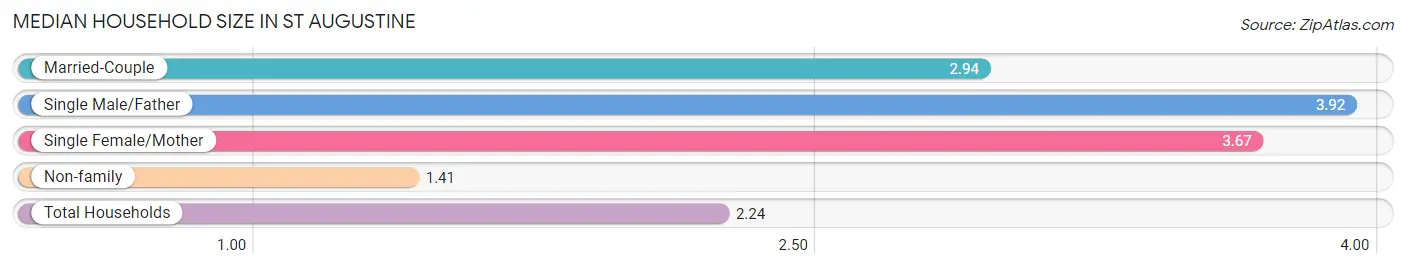
| Household Type | # Households | Household Size |
| Married-Couple | 2,397 (41.1%) | 2.94 |
| Single Male/Father | 91 (1.6%) | 3.92 |
| Single Female/Mother | 420 (7.2%) | 3.67 |
| Non-family | 2,925 (50.1%) | 1.41 |
| Total Households | 5,833 (100.0%) | 2.24 |
Household Size by Marriage Status in St Augustine
Out of a total of 5,833 households in St Augustine, 2,908 (49.8%) are family households, while 2,925 (50.1%) are nonfamily households. The most numerous type of family households are 2-person households, comprising 1,832, and the most common type of nonfamily households are 1-person households, comprising 2,105.
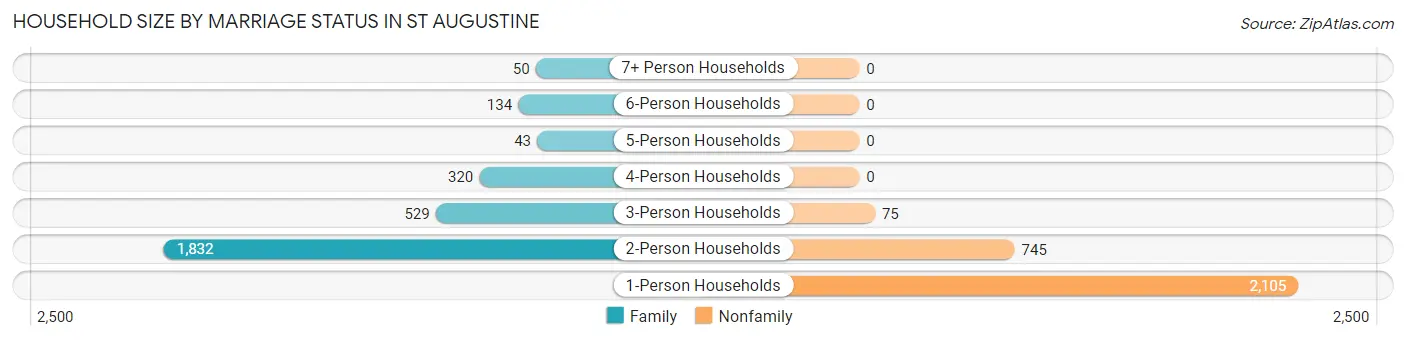
| Household Size | Family Households | Nonfamily Households |
| 1-Person Households | - | 2,105 (36.1%) |
| 2-Person Households | 1,832 (31.4%) | 745 (12.8%) |
| 3-Person Households | 529 (9.1%) | 75 (1.3%) |
| 4-Person Households | 320 (5.5%) | 0 (0.0%) |
| 5-Person Households | 43 (0.7%) | 0 (0.0%) |
| 6-Person Households | 134 (2.3%) | 0 (0.0%) |
| 7+ Person Households | 50 (0.9%) | 0 (0.0%) |
| Total | 2,908 (49.8%) | 2,925 (50.1%) |
Female Fertility in St Augustine
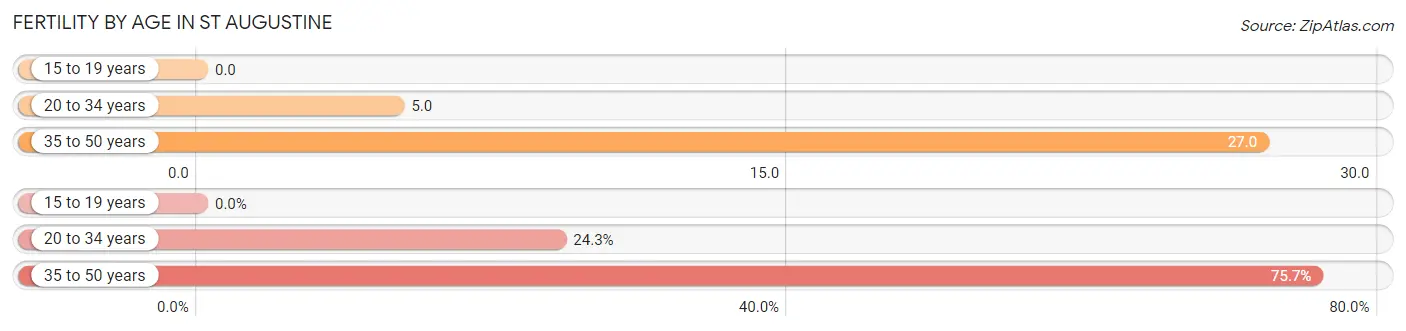
Fertility by Age in St Augustine
Average fertility rate in St Augustine is 10.0 births per 1,000 women. Women in the age bracket of 35 to 50 years have the highest fertility rate with 27.0 births per 1,000 women. Women in the age bracket of 35 to 50 years acount for 75.7% of all women with births.
| Age Bracket | Women with Births | Births / 1,000 Women |
| 15 to 19 years | 0 (0.0%) | 0.0 |
| 20 to 34 years | 9 (24.3%) | 5.0 |
| 35 to 50 years | 28 (75.7%) | 27.0 |
| Total | 37 (100.0%) | 10.0 |
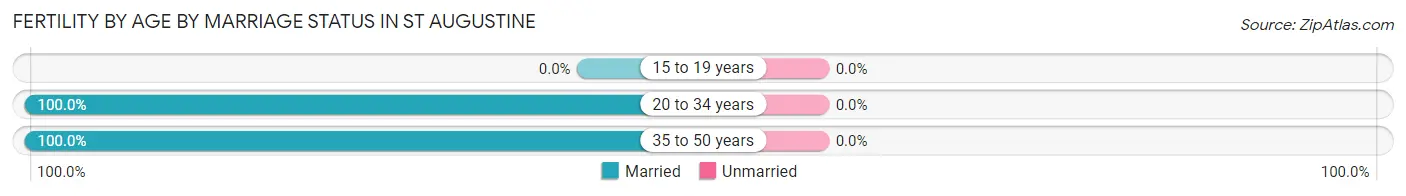
Fertility by Age by Marriage Status in St Augustine
| Age Bracket | Married | Unmarried |
| 15 to 19 years | 0 (0.0%) | 0 (0.0%) |
| 20 to 34 years | 9 (100.0%) | 0 (0.0%) |
| 35 to 50 years | 28 (100.0%) | 0 (0.0%) |
| Total | 37 (100.0%) | 0 (0.0%) |
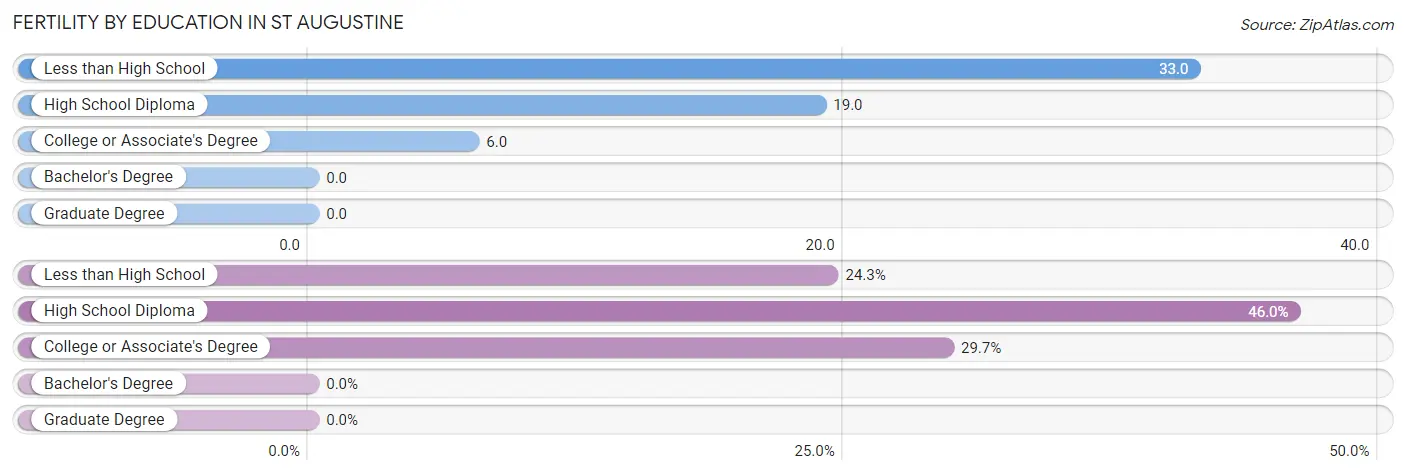
Fertility by Education in St Augustine
| Educational Attainment | Women with Births | Births / 1,000 Women |
| Less than High School | 9 (24.3%) | 33.0 |
| High School Diploma | 17 (46.0%) | 19.0 |
| College or Associate's Degree | 11 (29.7%) | 6.0 |
| Bachelor's Degree | 0 (0.0%) | 0.0 |
| Graduate Degree | 0 (0.0%) | 0.0 |
| Total | 37 (100.0%) | 10.0 |
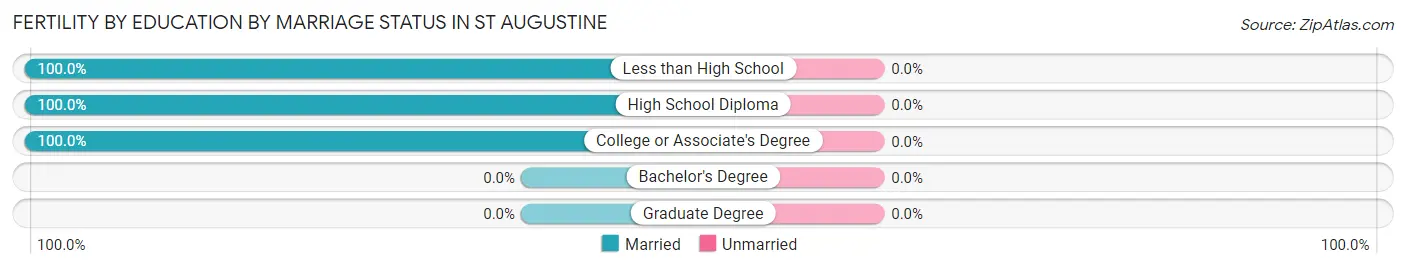
Fertility by Education by Marriage Status in St Augustine
| Educational Attainment | Married | Unmarried |
| Less than High School | 9 (100.0%) | 0 (0.0%) |
| High School Diploma | 17 (100.0%) | 0 (0.0%) |
| College or Associate's Degree | 11 (100.0%) | 0 (0.0%) |
| Bachelor's Degree | 0 (0.0%) | 0 (0.0%) |
| Graduate Degree | 0 (0.0%) | 0 (0.0%) |
| Total | 37 (100.0%) | 0 (0.0%) |
Income in St Augustine
Income Overview in St Augustine
Per Capita Income in St Augustine is $42,903, while median incomes of families and households are $100,652 and $72,806 respectively.
| Characteristic | Number | Measure |
| Per Capita Income | 14,642 | $42,903 |
| Median Family Income | 2,908 | $100,652 |
| Mean Family Income | 2,908 | $130,714 |
| Median Household Income | 5,833 | $72,806 |
| Mean Household Income | 5,833 | $99,596 |
| Income Deficit | 2,908 | $0 |
| Wage / Income Gap (%) | 14,642 | 20.51% |
| Wage / Income Gap ($) | 14,642 | 79.49¢ per $1 |
| Gini / Inequality Index | 14,642 | 0.47 |
Earnings by Sex in St Augustine
Average Earnings in St Augustine are $33,448, $36,681 for men and $29,159 for women, a difference of 20.5%.
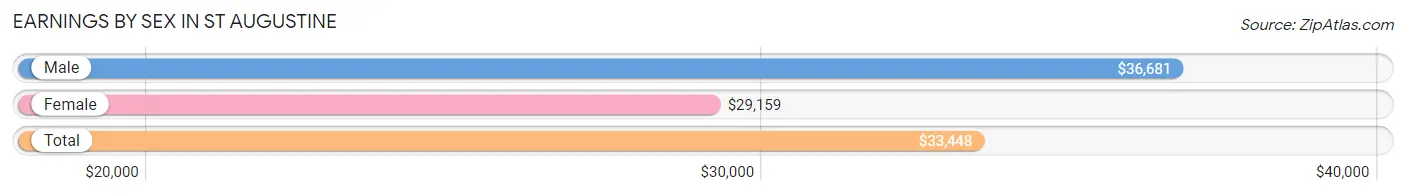
| Sex | Number | Average Earnings |
| Male | 3,893 (47.9%) | $36,681 |
| Female | 4,233 (52.1%) | $29,159 |
| Total | 8,126 (100.0%) | $33,448 |
Earnings by Sex by Income Bracket in St Augustine
The most common earnings brackets in St Augustine are $100,000+ for men (747 | 19.2%) and $25,000 to $29,999 for women (459 | 10.8%).
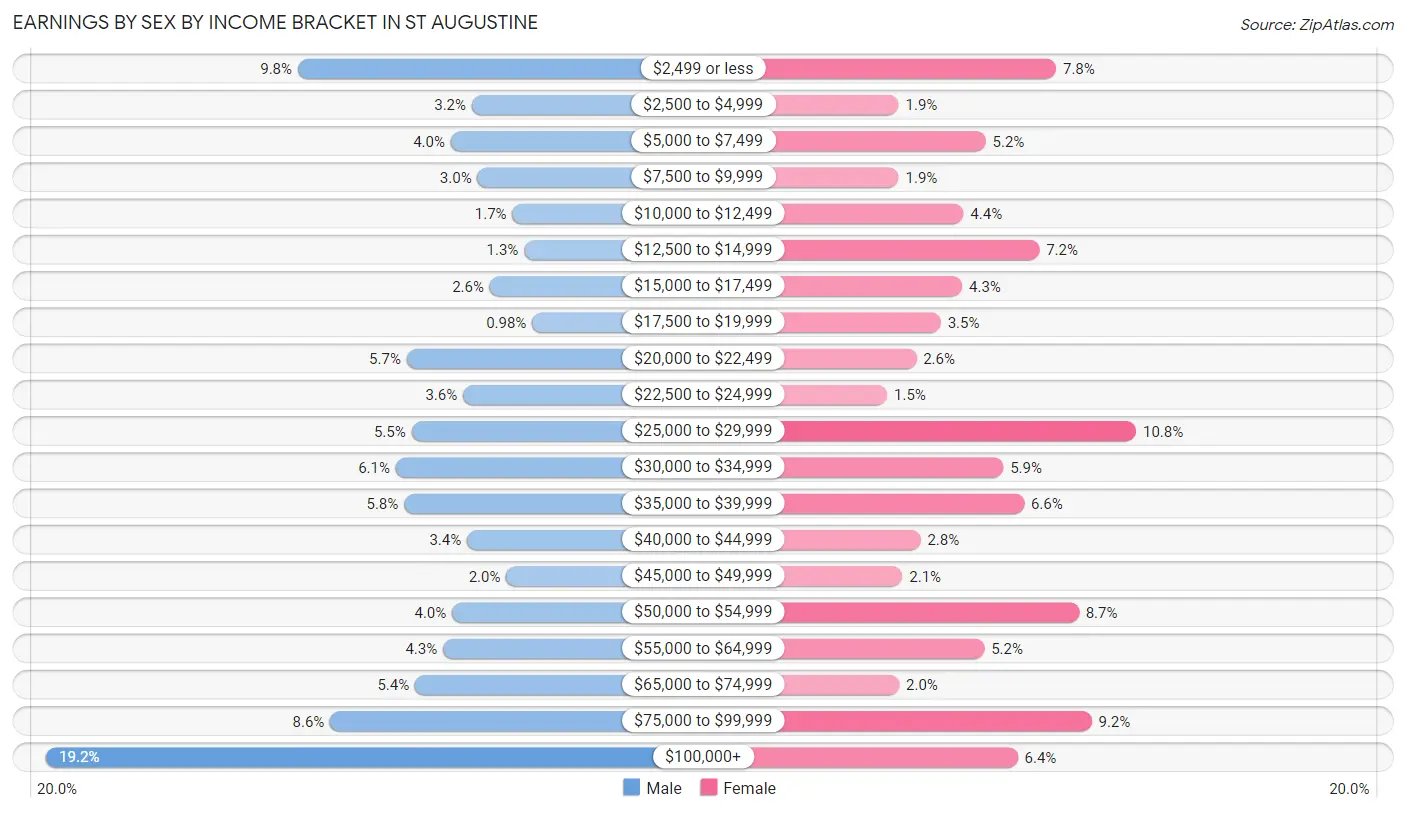
| Income | Male | Female |
| $2,499 or less | 380 (9.8%) | 332 (7.8%) |
| $2,500 to $4,999 | 126 (3.2%) | 82 (1.9%) |
| $5,000 to $7,499 | 157 (4.0%) | 220 (5.2%) |
| $7,500 to $9,999 | 118 (3.0%) | 82 (1.9%) |
| $10,000 to $12,499 | 67 (1.7%) | 185 (4.4%) |
| $12,500 to $14,999 | 50 (1.3%) | 305 (7.2%) |
| $15,000 to $17,499 | 100 (2.6%) | 183 (4.3%) |
| $17,500 to $19,999 | 38 (1.0%) | 149 (3.5%) |
| $20,000 to $22,499 | 221 (5.7%) | 110 (2.6%) |
| $22,500 to $24,999 | 139 (3.6%) | 64 (1.5%) |
| $25,000 to $29,999 | 214 (5.5%) | 459 (10.8%) |
| $30,000 to $34,999 | 237 (6.1%) | 248 (5.9%) |
| $35,000 to $39,999 | 225 (5.8%) | 281 (6.6%) |
| $40,000 to $44,999 | 133 (3.4%) | 117 (2.8%) |
| $45,000 to $49,999 | 76 (1.9%) | 88 (2.1%) |
| $50,000 to $54,999 | 155 (4.0%) | 368 (8.7%) |
| $55,000 to $64,999 | 168 (4.3%) | 218 (5.1%) |
| $65,000 to $74,999 | 209 (5.4%) | 83 (2.0%) |
| $75,000 to $99,999 | 333 (8.6%) | 388 (9.2%) |
| $100,000+ | 747 (19.2%) | 271 (6.4%) |
| Total | 3,893 (100.0%) | 4,233 (100.0%) |
Earnings by Sex by Educational Attainment in St Augustine
Average earnings in St Augustine are $43,039 for men and $36,048 for women, a difference of 16.2%. Men with an educational attainment of bachelor's degree enjoy the highest average annual earnings of $88,393, while those with less than high school education earn the least with $30,929. Women with an educational attainment of graduate degree earn the most with the average annual earnings of $46,694, while those with high school diploma education have the smallest earnings of $14,127.
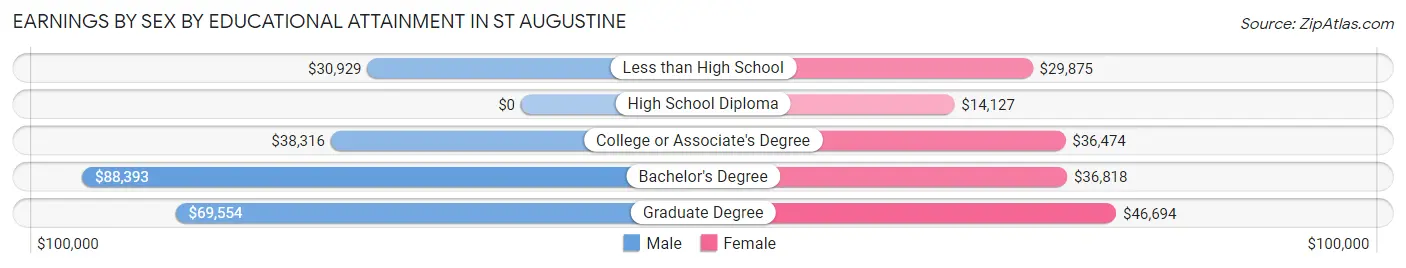
| Educational Attainment | Male Income | Female Income |
| Less than High School | $30,929 | $29,875 |
| High School Diploma | - | - |
| College or Associate's Degree | $38,316 | $36,474 |
| Bachelor's Degree | $88,393 | $36,818 |
| Graduate Degree | $69,554 | $46,694 |
| Total | $43,039 | $36,048 |
Family Income in St Augustine
Family Income Brackets in St Augustine
According to the St Augustine family income data, there are 515 families falling into the $50,000 to $74,999 income range, which is the most common income bracket and makes up 17.7% of all families. Conversely, the $10,000 to $14,999 income bracket is the least frequent group with only 38 families (1.3%) belonging to this category.
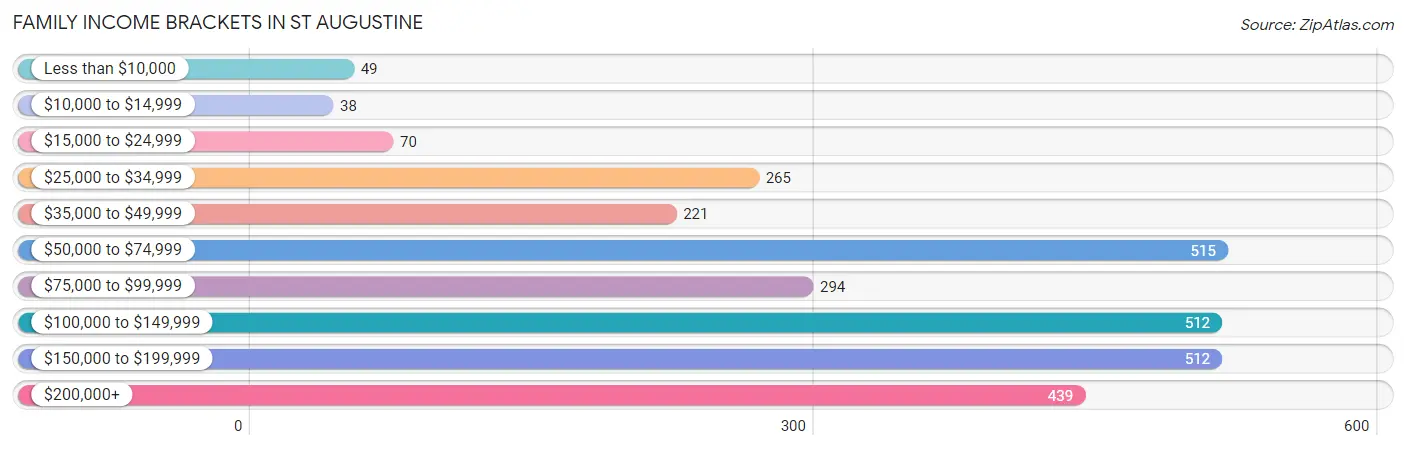
| Income Bracket | # Families | % Families |
| Less than $10,000 | 49 | 1.7% |
| $10,000 to $14,999 | 38 | 1.3% |
| $15,000 to $24,999 | 70 | 2.4% |
| $25,000 to $34,999 | 265 | 9.1% |
| $35,000 to $49,999 | 221 | 7.6% |
| $50,000 to $74,999 | 515 | 17.7% |
| $75,000 to $99,999 | 294 | 10.1% |
| $100,000 to $149,999 | 512 | 17.6% |
| $150,000 to $199,999 | 512 | 17.6% |
| $200,000+ | 439 | 15.1% |
Family Income by Famaliy Size in St Augustine
5-person families (60 | 2.1%) account for the highest median family income in St Augustine with $152,321 per family, while 2-person families (1,939 | 66.7%) have the highest median income of $48,458 per family member.
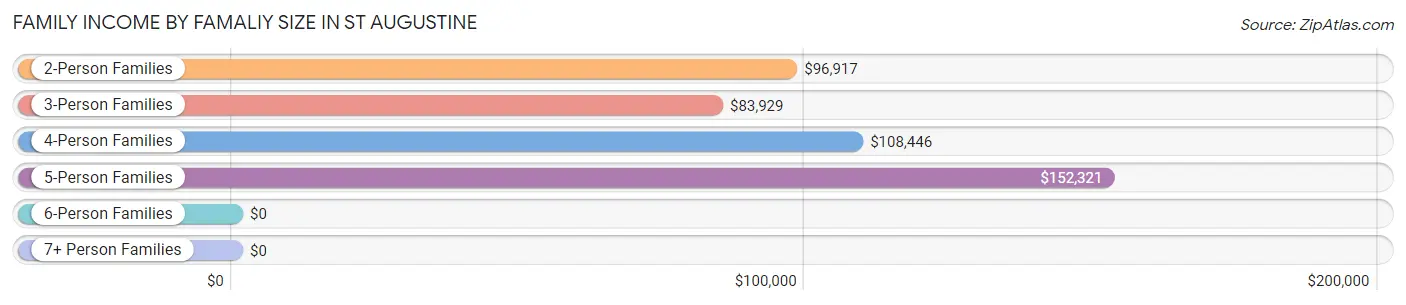
| Income Bracket | # Families | Median Income |
| 2-Person Families | 1,939 (66.7%) | $96,917 |
| 3-Person Families | 468 (16.1%) | $83,929 |
| 4-Person Families | 380 (13.1%) | $108,446 |
| 5-Person Families | 60 (2.1%) | $152,321 |
| 6-Person Families | 20 (0.7%) | $0 |
| 7+ Person Families | 41 (1.4%) | $0 |
| Total | 2,908 (100.0%) | $100,652 |
Family Income by Number of Earners in St Augustine
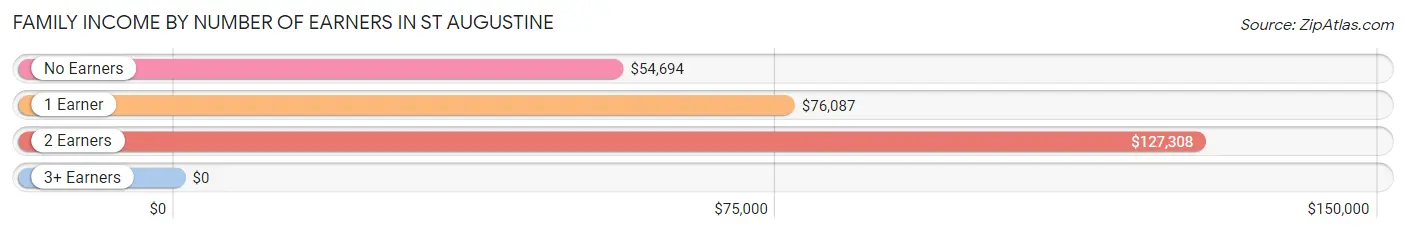
| Number of Earners | # Families | Median Income |
| No Earners | 628 (21.6%) | $54,694 |
| 1 Earner | 880 (30.3%) | $76,087 |
| 2 Earners | 1,100 (37.8%) | $127,308 |
| 3+ Earners | 300 (10.3%) | $0 |
| Total | 2,908 (100.0%) | $100,652 |
Household Income in St Augustine
Household Income Brackets in St Augustine
With 1,114 households falling in the category, the $100,000 to $149,999 income range is the most frequent in St Augustine, accounting for 19.1% of all households. In contrast, only 152 households (2.6%) fall into the $10,000 to $14,999 income bracket, making it the least populous group.
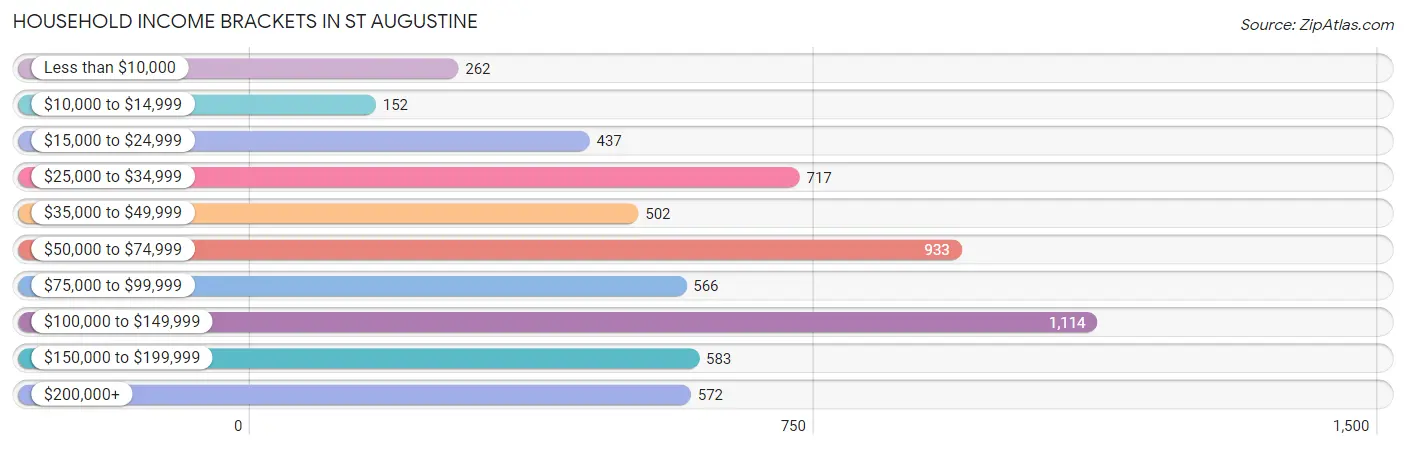
| Income Bracket | # Households | % Households |
| Less than $10,000 | 262 | 4.5% |
| $10,000 to $14,999 | 152 | 2.6% |
| $15,000 to $24,999 | 437 | 7.5% |
| $25,000 to $34,999 | 717 | 12.3% |
| $35,000 to $49,999 | 502 | 8.6% |
| $50,000 to $74,999 | 933 | 16.0% |
| $75,000 to $99,999 | 566 | 9.7% |
| $100,000 to $149,999 | 1,114 | 19.1% |
| $150,000 to $199,999 | 583 | 10.0% |
| $200,000+ | 572 | 9.8% |
Household Income by Householder Age in St Augustine
The median household income in St Augustine is $72,806, with the highest median household income of $106,163 found in the 45 to 64 years age bracket for the primary householder. A total of 2,208 households (37.9%) fall into this category. Meanwhile, the 15 to 24 years age bracket for the primary householder has the lowest median household income of $26,841, with 385 households (6.6%) in this group.
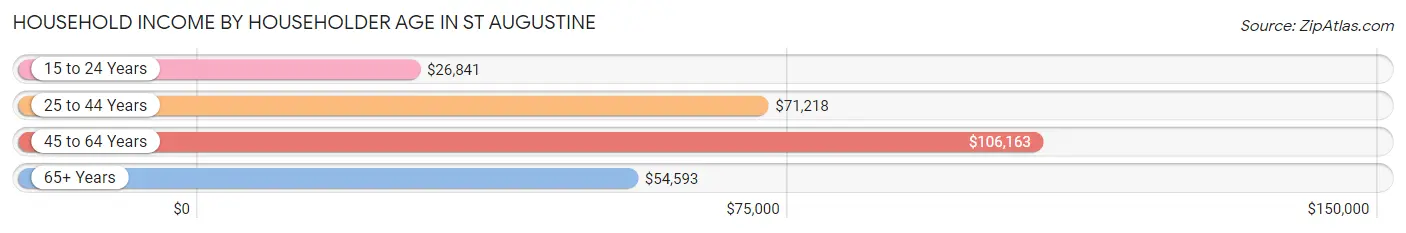
| Income Bracket | # Households | Median Income |
| 15 to 24 Years | 385 (6.6%) | $26,841 |
| 25 to 44 Years | 1,128 (19.3%) | $71,218 |
| 45 to 64 Years | 2,208 (37.9%) | $106,163 |
| 65+ Years | 2,112 (36.2%) | $54,593 |
| Total | 5,833 (100.0%) | $72,806 |
Poverty in St Augustine
Income Below Poverty by Sex and Age in St Augustine
With 10.5% poverty level for males and 14.4% for females among the residents of St Augustine, 25 to 34 year old males and 16 and 17 year old females are the most vulnerable to poverty, with 306 males (37.0%) and 56 females (37.1%) in their respective age groups living below the poverty level.
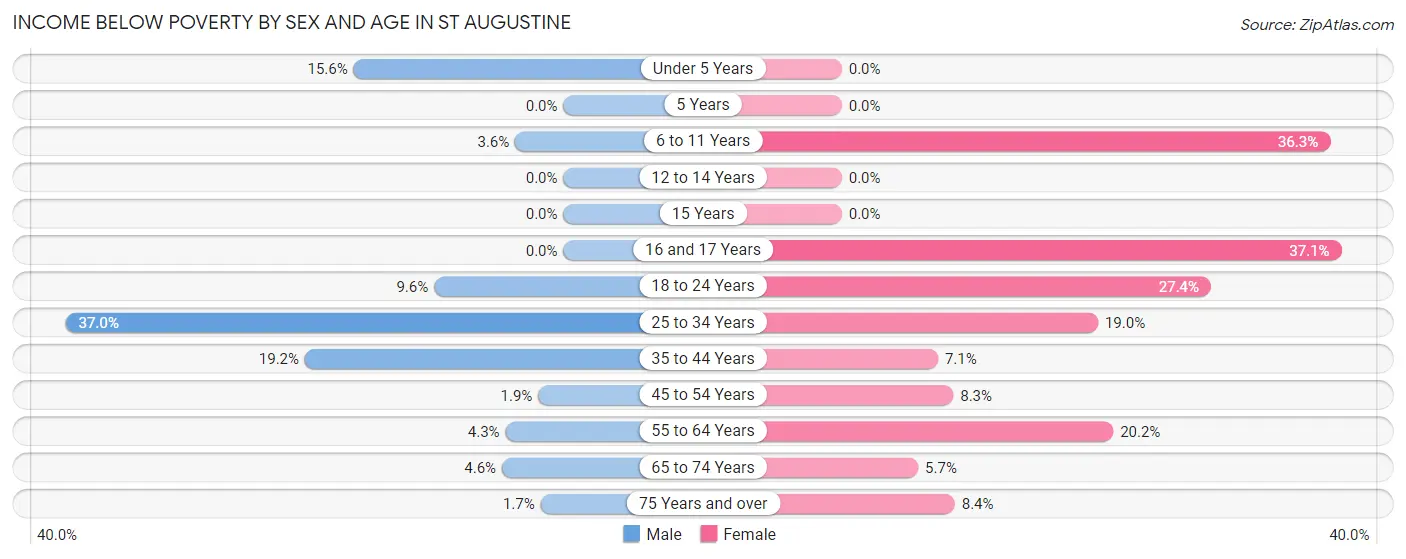
| Age Bracket | Male | Female |
| Under 5 Years | 12 (15.6%) | 0 (0.0%) |
| 5 Years | 0 (0.0%) | 0 (0.0%) |
| 6 to 11 Years | 12 (3.6%) | 58 (36.2%) |
| 12 to 14 Years | 0 (0.0%) | 0 (0.0%) |
| 15 Years | 0 (0.0%) | 0 (0.0%) |
| 16 and 17 Years | 0 (0.0%) | 56 (37.1%) |
| 18 to 24 Years | 51 (9.6%) | 211 (27.4%) |
| 25 to 34 Years | 306 (37.0%) | 195 (19.0%) |
| 35 to 44 Years | 132 (19.2%) | 55 (7.1%) |
| 45 to 54 Years | 14 (1.9%) | 56 (8.3%) |
| 55 to 64 Years | 49 (4.3%) | 266 (20.2%) |
| 65 to 74 Years | 49 (4.6%) | 69 (5.7%) |
| 75 Years and over | 8 (1.7%) | 79 (8.4%) |
| Total | 633 (10.5%) | 1,045 (14.4%) |
Income Above Poverty by Sex and Age in St Augustine
According to the poverty statistics in St Augustine, males aged 5 years and females aged under 5 years are the age groups that are most secure financially, with 100.0% of males and 100.0% of females in these age groups living above the poverty line.
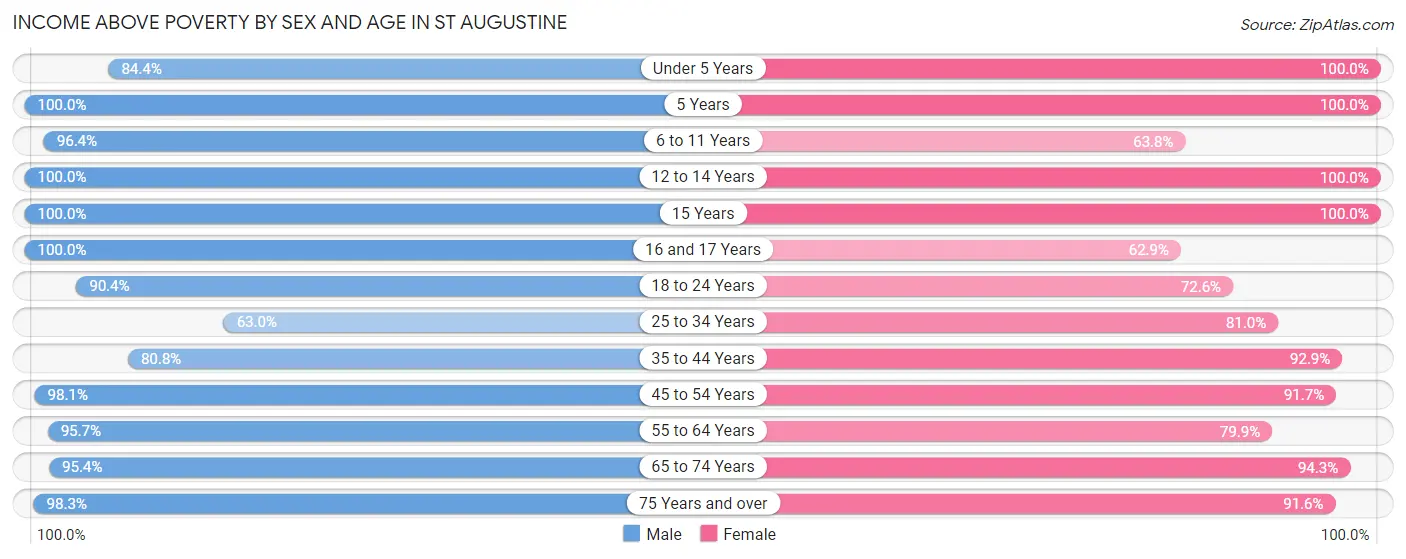
| Age Bracket | Male | Female |
| Under 5 Years | 65 (84.4%) | 60 (100.0%) |
| 5 Years | 35 (100.0%) | 103 (100.0%) |
| 6 to 11 Years | 323 (96.4%) | 102 (63.7%) |
| 12 to 14 Years | 28 (100.0%) | 21 (100.0%) |
| 15 Years | 8 (100.0%) | 60 (100.0%) |
| 16 and 17 Years | 35 (100.0%) | 95 (62.9%) |
| 18 to 24 Years | 480 (90.4%) | 559 (72.6%) |
| 25 to 34 Years | 522 (63.0%) | 830 (81.0%) |
| 35 to 44 Years | 556 (80.8%) | 715 (92.9%) |
| 45 to 54 Years | 733 (98.1%) | 620 (91.7%) |
| 55 to 64 Years | 1,090 (95.7%) | 1,054 (79.8%) |
| 65 to 74 Years | 1,026 (95.4%) | 1,147 (94.3%) |
| 75 Years and over | 465 (98.3%) | 863 (91.6%) |
| Total | 5,366 (89.4%) | 6,229 (85.6%) |
Income Below Poverty Among Married-Couple Families in St Augustine
The poverty statistics for married-couple families in St Augustine show that 3.4% or 82 of the total 2,397 families live below the poverty line. Families with no children have the highest poverty rate of 4.2%, comprising of 82 families. On the other hand, families with 1 or 2 children have the lowest poverty rate of 0.0%, which includes 0 families.
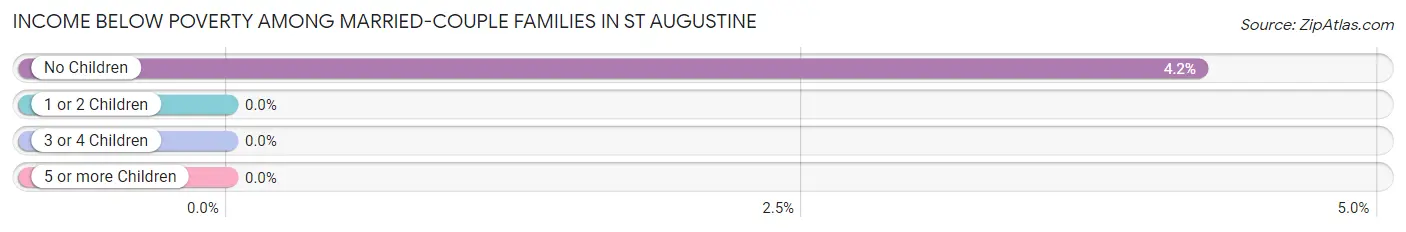
| Children | Above Poverty | Below Poverty |
| No Children | 1,861 (95.8%) | 82 (4.2%) |
| 1 or 2 Children | 370 (100.0%) | 0 (0.0%) |
| 3 or 4 Children | 84 (100.0%) | 0 (0.0%) |
| 5 or more Children | 0 (0.0%) | 0 (0.0%) |
| Total | 2,315 (96.6%) | 82 (3.4%) |
Income Below Poverty Among Single-Parent Households in St Augustine
According to the poverty data in St Augustine, 30.8% or 28 single-father households and 2.9% or 12 single-mother households are living below the poverty line. Among single-father households, those with 1 or 2 children have the highest poverty rate, with 28 households (100.0%) experiencing poverty. Likewise, among single-mother households, those with no children have the highest poverty rate, with 12 households (4.7%) falling below the poverty line.
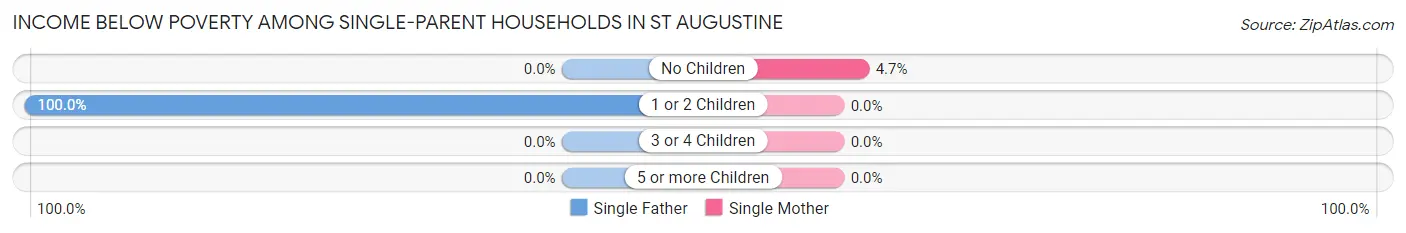
| Children | Single Father | Single Mother |
| No Children | 0 (0.0%) | 12 (4.7%) |
| 1 or 2 Children | 28 (100.0%) | 0 (0.0%) |
| 3 or 4 Children | 0 (0.0%) | 0 (0.0%) |
| 5 or more Children | 0 (0.0%) | 0 (0.0%) |
| Total | 28 (30.8%) | 12 (2.9%) |
Income Below Poverty Among Married-Couple vs Single-Parent Households in St Augustine
The poverty data for St Augustine shows that 82 of the married-couple family households (3.4%) and 40 of the single-parent households (7.8%) are living below the poverty level. Within the married-couple family households, those with no children have the highest poverty rate, with 82 households (4.2%) falling below the poverty line. Among the single-parent households, those with 1 or 2 children have the highest poverty rate, with 28 household (14.7%) living below poverty.
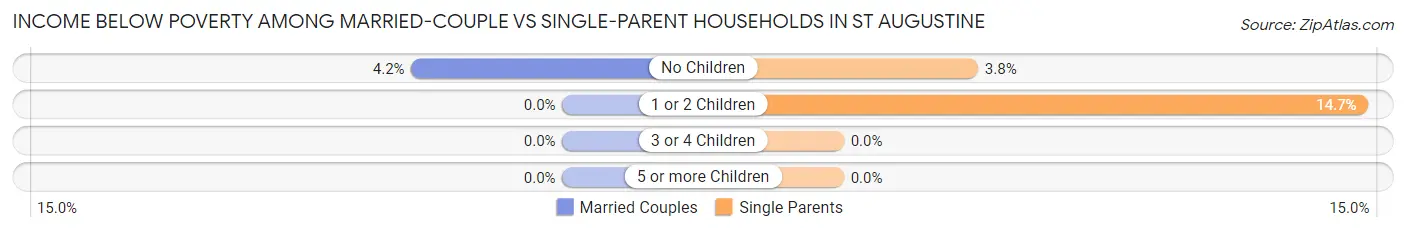
| Children | Married-Couple Families | Single-Parent Households |
| No Children | 82 (4.2%) | 12 (3.7%) |
| 1 or 2 Children | 0 (0.0%) | 28 (14.7%) |
| 3 or 4 Children | 0 (0.0%) | 0 (0.0%) |
| 5 or more Children | 0 (0.0%) | 0 (0.0%) |
| Total | 82 (3.4%) | 40 (7.8%) |
Employment Characteristics in St Augustine
Employment by Class of Employer in St Augustine
Among the 7,114 employed individuals in St Augustine, private company employees (4,783 | 67.2%), self-employed (not incorporated) (636 | 8.9%), and self-employed (incorporated) (572 | 8.0%) make up the most common classes of employment.
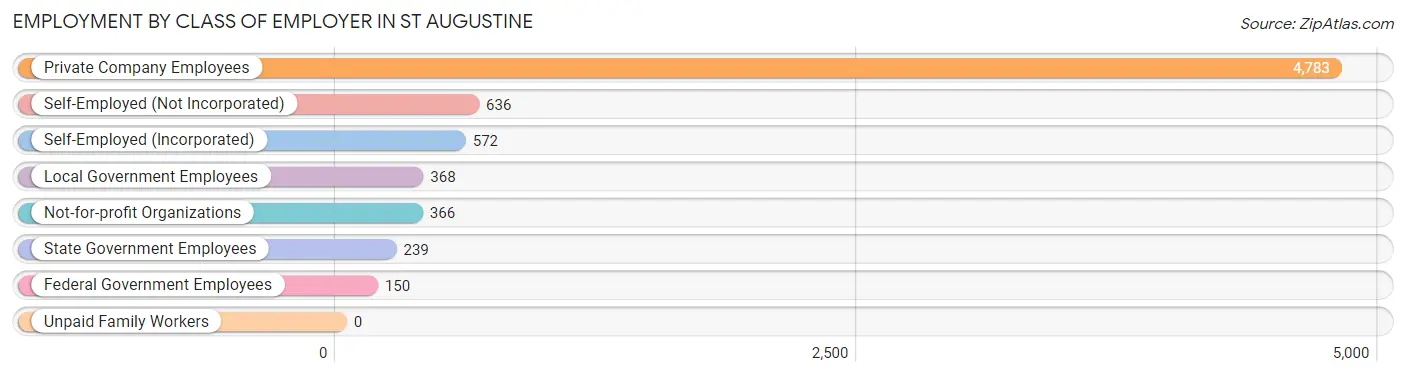
| Employer Class | # Employees | % Employees |
| Private Company Employees | 4,783 | 67.2% |
| Self-Employed (Incorporated) | 572 | 8.0% |
| Self-Employed (Not Incorporated) | 636 | 8.9% |
| Not-for-profit Organizations | 366 | 5.1% |
| Local Government Employees | 368 | 5.2% |
| State Government Employees | 239 | 3.4% |
| Federal Government Employees | 150 | 2.1% |
| Unpaid Family Workers | 0 | 0.0% |
| Total | 7,114 | 100.0% |
Employment Status by Age in St Augustine
According to the labor force statistics for St Augustine, out of the total population over 16 years of age (13,737), 55.3% or 7,597 individuals are in the labor force, with 3.2% or 243 of them unemployed. The age group with the highest labor force participation rate is 30 to 34 years, with 87.7% or 822 individuals in the labor force. Within the labor force, the 20 to 24 years age range has the highest percentage of unemployed individuals, with 11.7% or 95 of them being unemployed.
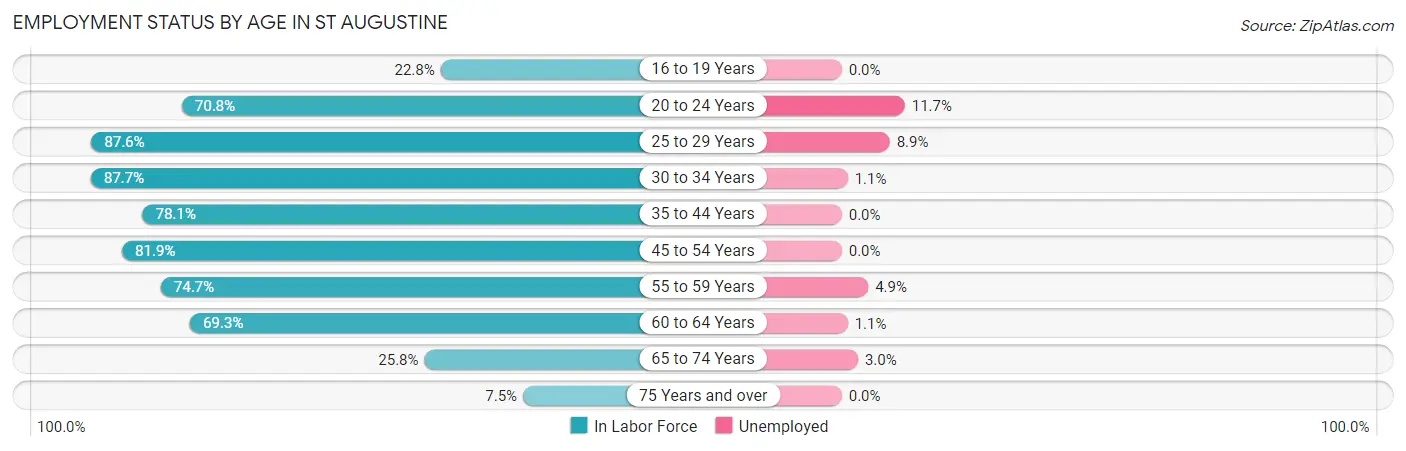
| Age Bracket | In Labor Force | Unemployed |
| 16 to 19 Years | 349 (22.8%) | 0 (0.0%) |
| 20 to 24 Years | 810 (70.8%) | 95 (11.7%) |
| 25 to 29 Years | 802 (87.6%) | 71 (8.9%) |
| 30 to 34 Years | 822 (87.7%) | 9 (1.1%) |
| 35 to 44 Years | 1,139 (78.1%) | 0 (0.0%) |
| 45 to 54 Years | 1,165 (81.9%) | 0 (0.0%) |
| 55 to 59 Years | 893 (74.7%) | 44 (4.9%) |
| 60 to 64 Years | 895 (69.3%) | 10 (1.1%) |
| 65 to 74 Years | 603 (25.8%) | 18 (3.0%) |
| 75 Years and over | 113 (7.5%) | 0 (0.0%) |
| Total | 7,597 (55.3%) | 243 (3.2%) |
Employment Status by Educational Attainment in St Augustine
According to labor force statistics for St Augustine, 79.1% of individuals (5,713) out of the total population between 25 and 64 years of age (7,222) are in the labor force, with 2.3% or 131 of them being unemployed. The group with the highest labor force participation rate are those with the educational attainment of college / associate degree, with 86.3% or 2,044 individuals in the labor force. Within the labor force, individuals with college / associate degree education have the highest percentage of unemployment, with 4.7% or 96 of them being unemployed.
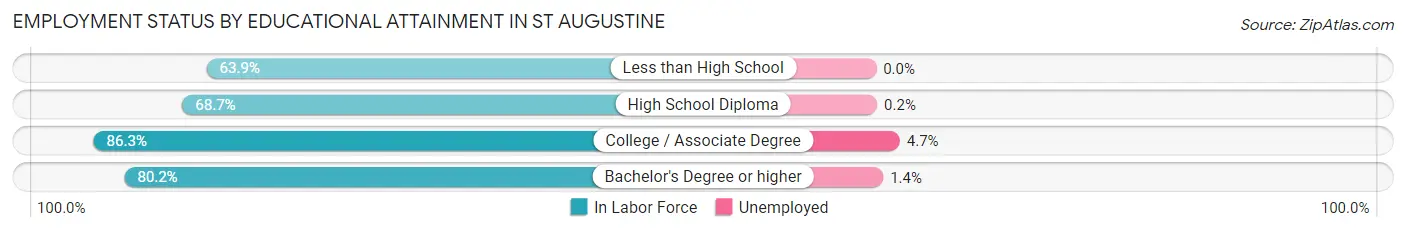
| Educational Attainment | In Labor Force | Unemployed |
| Less than High School | 168 (63.9%) | 0 (0.0%) |
| High School Diploma | 1,068 (68.7%) | 3 (0.2%) |
| College / Associate Degree | 2,044 (86.3%) | 111 (4.7%) |
| Bachelor's Degree or higher | 2,436 (80.2%) | 43 (1.4%) |
| Total | 5,713 (79.1%) | 166 (2.3%) |
Employment Occupations by Sex in St Augustine
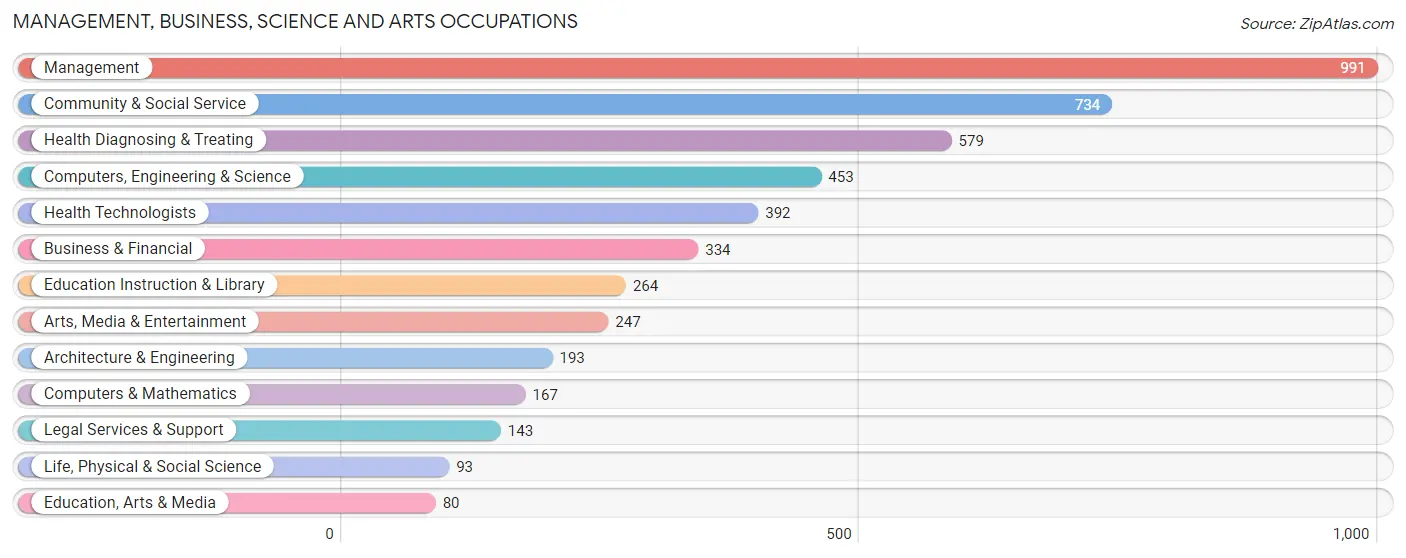
Management, Business, Science and Arts Occupations
The most common Management, Business, Science and Arts occupations in St Augustine are Management (991 | 13.5%), Community & Social Service (734 | 10.0%), Health Diagnosing & Treating (579 | 7.9%), Computers, Engineering & Science (453 | 6.2%), and Health Technologists (392 | 5.3%).
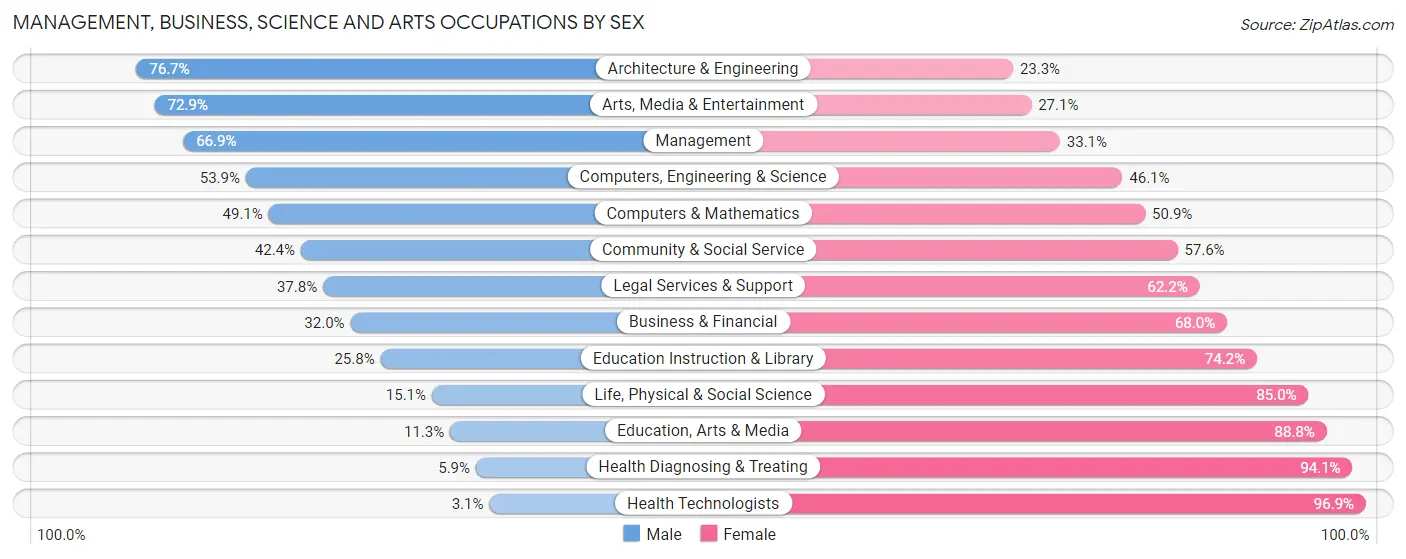
Management, Business, Science and Arts Occupations by Sex
Within the Management, Business, Science and Arts occupations in St Augustine, the most male-oriented occupations are Architecture & Engineering (76.7%), Arts, Media & Entertainment (72.9%), and Management (66.9%), while the most female-oriented occupations are Health Technologists (96.9%), Health Diagnosing & Treating (94.1%), and Education, Arts & Media (88.7%).
| Occupation | Male | Female |
| Management | 663 (66.9%) | 328 (33.1%) |
| Business & Financial | 107 (32.0%) | 227 (68.0%) |
| Computers, Engineering & Science | 244 (53.9%) | 209 (46.1%) |
| Computers & Mathematics | 82 (49.1%) | 85 (50.9%) |
| Architecture & Engineering | 148 (76.7%) | 45 (23.3%) |
| Life, Physical & Social Science | 14 (15.0%) | 79 (85.0%) |
| Community & Social Service | 311 (42.4%) | 423 (57.6%) |
| Education, Arts & Media | 9 (11.3%) | 71 (88.7%) |
| Legal Services & Support | 54 (37.8%) | 89 (62.2%) |
| Education Instruction & Library | 68 (25.8%) | 196 (74.2%) |
| Arts, Media & Entertainment | 180 (72.9%) | 67 (27.1%) |
| Health Diagnosing & Treating | 34 (5.9%) | 545 (94.1%) |
| Health Technologists | 12 (3.1%) | 380 (96.9%) |
| Total (Category) | 1,359 (44.0%) | 1,732 (56.0%) |
| Total (Overall) | 3,476 (47.4%) | 3,850 (52.5%) |
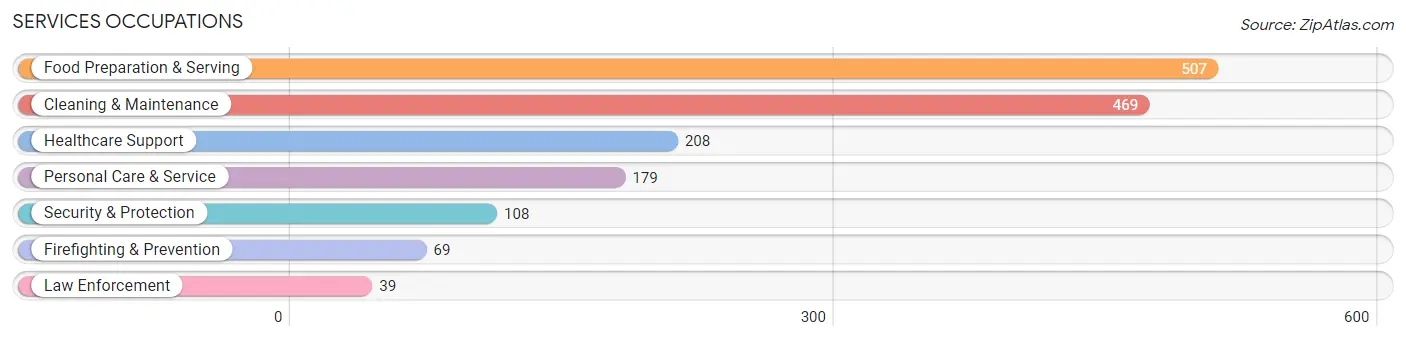
Services Occupations
The most common Services occupations in St Augustine are Food Preparation & Serving (507 | 6.9%), Cleaning & Maintenance (469 | 6.4%), Healthcare Support (208 | 2.8%), Personal Care & Service (179 | 2.4%), and Security & Protection (108 | 1.5%).
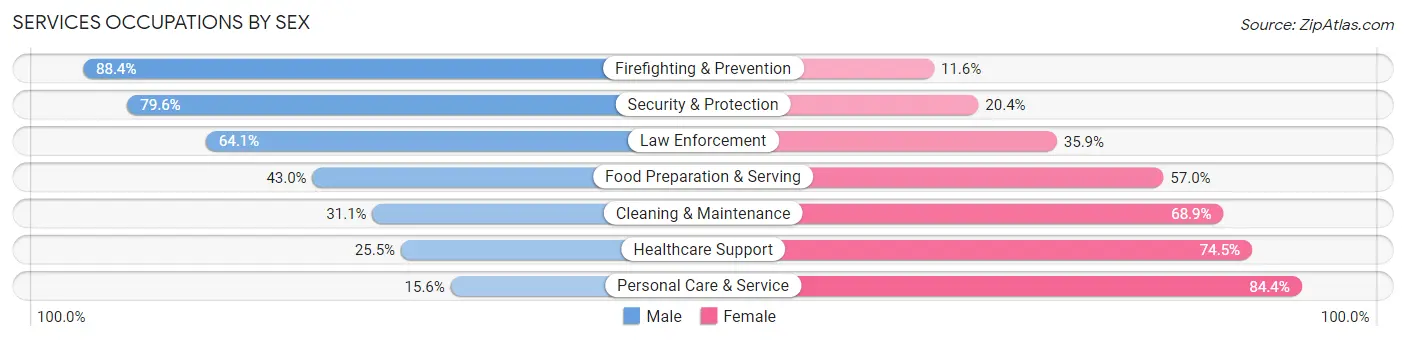
Services Occupations by Sex
Within the Services occupations in St Augustine, the most male-oriented occupations are Firefighting & Prevention (88.4%), Security & Protection (79.6%), and Law Enforcement (64.1%), while the most female-oriented occupations are Personal Care & Service (84.4%), Healthcare Support (74.5%), and Cleaning & Maintenance (68.9%).
| Occupation | Male | Female |
| Healthcare Support | 53 (25.5%) | 155 (74.5%) |
| Security & Protection | 86 (79.6%) | 22 (20.4%) |
| Firefighting & Prevention | 61 (88.4%) | 8 (11.6%) |
| Law Enforcement | 25 (64.1%) | 14 (35.9%) |
| Food Preparation & Serving | 218 (43.0%) | 289 (57.0%) |
| Cleaning & Maintenance | 146 (31.1%) | 323 (68.9%) |
| Personal Care & Service | 28 (15.6%) | 151 (84.4%) |
| Total (Category) | 531 (36.1%) | 940 (63.9%) |
| Total (Overall) | 3,476 (47.4%) | 3,850 (52.5%) |
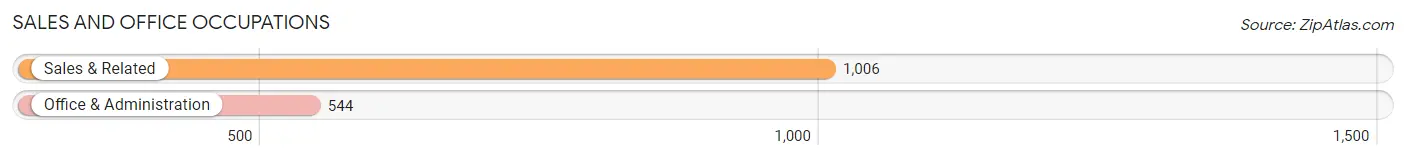
Sales and Office Occupations
The most common Sales and Office occupations in St Augustine are Sales & Related (1,006 | 13.7%), and Office & Administration (544 | 7.4%).
Sales and Office Occupations by Sex
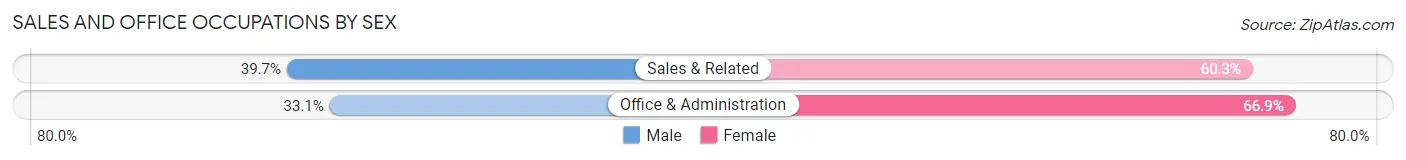
| Occupation | Male | Female |
| Sales & Related | 399 (39.7%) | 607 (60.3%) |
| Office & Administration | 180 (33.1%) | 364 (66.9%) |
| Total (Category) | 579 (37.3%) | 971 (62.6%) |
| Total (Overall) | 3,476 (47.4%) | 3,850 (52.5%) |
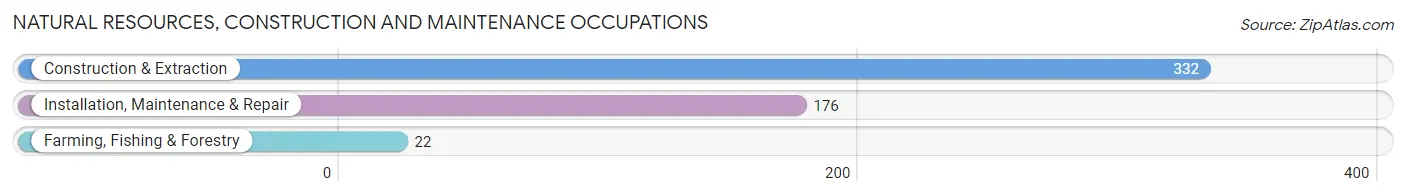
Natural Resources, Construction and Maintenance Occupations
The most common Natural Resources, Construction and Maintenance occupations in St Augustine are Construction & Extraction (332 | 4.5%), Installation, Maintenance & Repair (176 | 2.4%), and Farming, Fishing & Forestry (22 | 0.3%).
Natural Resources, Construction and Maintenance Occupations by Sex
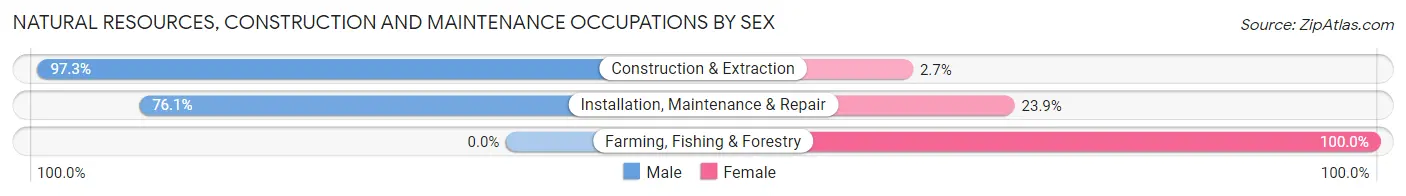
| Occupation | Male | Female |
| Farming, Fishing & Forestry | 0 (0.0%) | 22 (100.0%) |
| Construction & Extraction | 323 (97.3%) | 9 (2.7%) |
| Installation, Maintenance & Repair | 134 (76.1%) | 42 (23.9%) |
| Total (Category) | 457 (86.2%) | 73 (13.8%) |
| Total (Overall) | 3,476 (47.4%) | 3,850 (52.5%) |
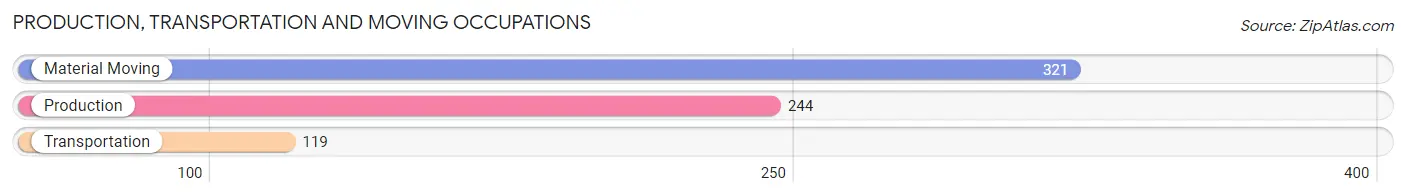
Production, Transportation and Moving Occupations
The most common Production, Transportation and Moving occupations in St Augustine are Material Moving (321 | 4.4%), Production (244 | 3.3%), and Transportation (119 | 1.6%).
Production, Transportation and Moving Occupations by Sex
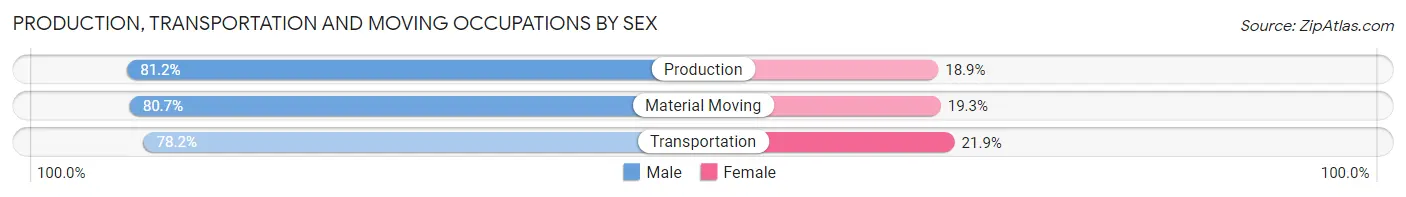
| Occupation | Male | Female |
| Production | 198 (81.1%) | 46 (18.9%) |
| Transportation | 93 (78.1%) | 26 (21.8%) |
| Material Moving | 259 (80.7%) | 62 (19.3%) |
| Total (Category) | 550 (80.4%) | 134 (19.6%) |
| Total (Overall) | 3,476 (47.4%) | 3,850 (52.5%) |
Employment Industries by Sex in St Augustine
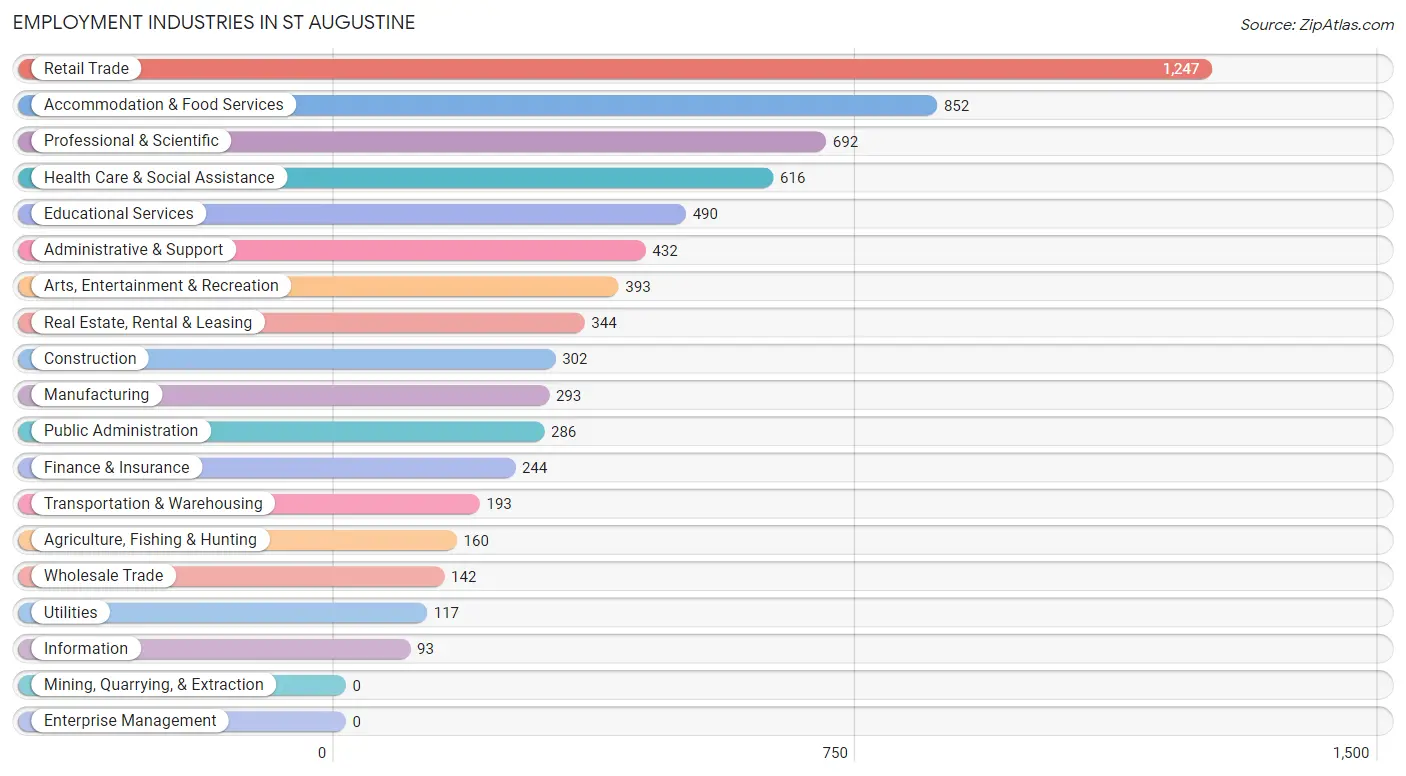
Employment Industries in St Augustine
The major employment industries in St Augustine include Retail Trade (1,247 | 17.0%), Accommodation & Food Services (852 | 11.6%), Professional & Scientific (692 | 9.5%), Health Care & Social Assistance (616 | 8.4%), and Educational Services (490 | 6.7%).
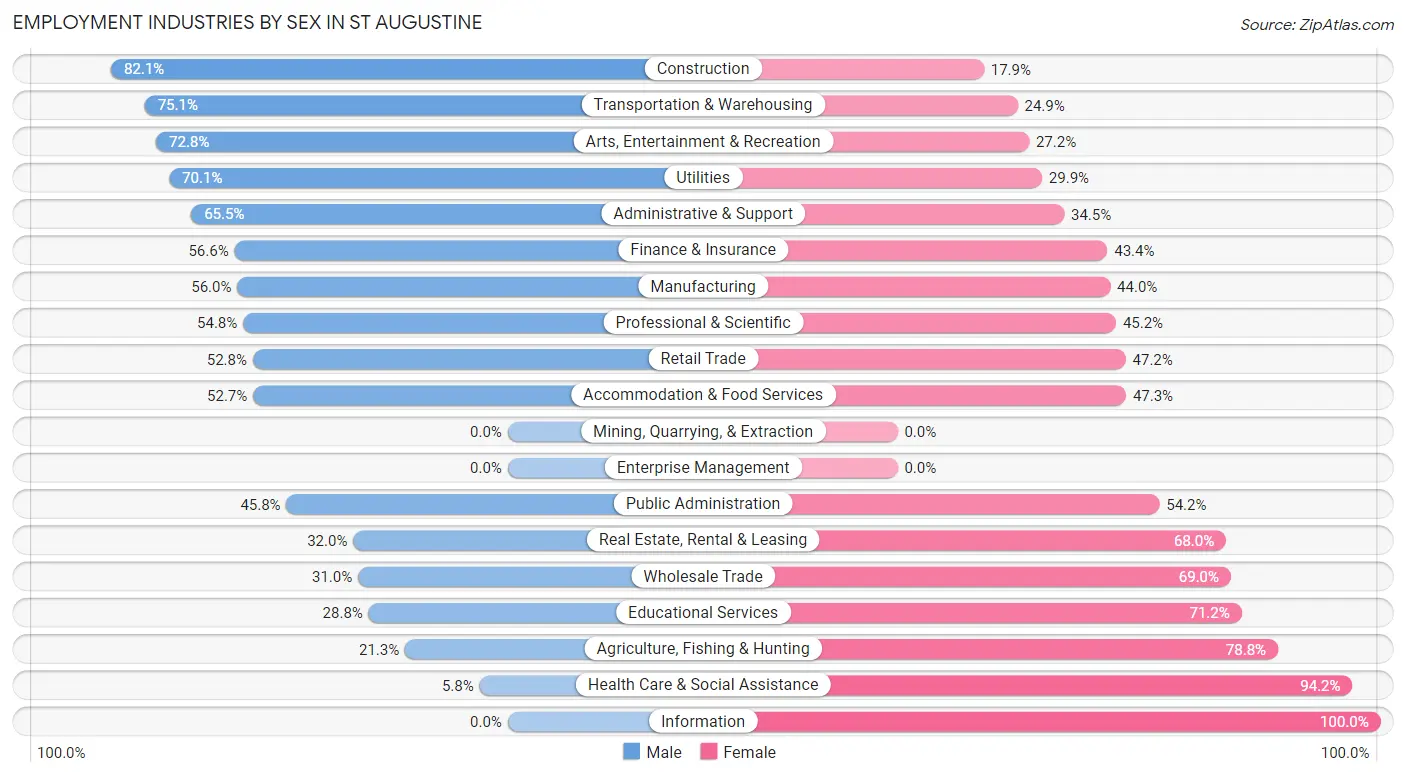
Employment Industries by Sex in St Augustine
The St Augustine industries that see more men than women are Construction (82.1%), Transportation & Warehousing (75.1%), and Arts, Entertainment & Recreation (72.8%), whereas the industries that tend to have a higher number of women are Information (100.0%), Health Care & Social Assistance (94.2%), and Agriculture, Fishing & Hunting (78.7%).
| Industry | Male | Female |
| Agriculture, Fishing & Hunting | 34 (21.2%) | 126 (78.7%) |
| Mining, Quarrying, & Extraction | 0 (0.0%) | 0 (0.0%) |
| Construction | 248 (82.1%) | 54 (17.9%) |
| Manufacturing | 164 (56.0%) | 129 (44.0%) |
| Wholesale Trade | 44 (31.0%) | 98 (69.0%) |
| Retail Trade | 658 (52.8%) | 589 (47.2%) |
| Transportation & Warehousing | 145 (75.1%) | 48 (24.9%) |
| Utilities | 82 (70.1%) | 35 (29.9%) |
| Information | 0 (0.0%) | 93 (100.0%) |
| Finance & Insurance | 138 (56.6%) | 106 (43.4%) |
| Real Estate, Rental & Leasing | 110 (32.0%) | 234 (68.0%) |
| Professional & Scientific | 379 (54.8%) | 313 (45.2%) |
| Enterprise Management | 0 (0.0%) | 0 (0.0%) |
| Administrative & Support | 283 (65.5%) | 149 (34.5%) |
| Educational Services | 141 (28.8%) | 349 (71.2%) |
| Health Care & Social Assistance | 36 (5.8%) | 580 (94.2%) |
| Arts, Entertainment & Recreation | 286 (72.8%) | 107 (27.2%) |
| Accommodation & Food Services | 449 (52.7%) | 403 (47.3%) |
| Public Administration | 131 (45.8%) | 155 (54.2%) |
| Total | 3,476 (47.4%) | 3,850 (52.5%) |
Education in St Augustine
School Enrollment in St Augustine
The most common levels of schooling among the 3,087 students in St Augustine are college / undergraduate (1,972 | 63.9%), elementary school (300 | 9.7%), and high school (285 | 9.2%).
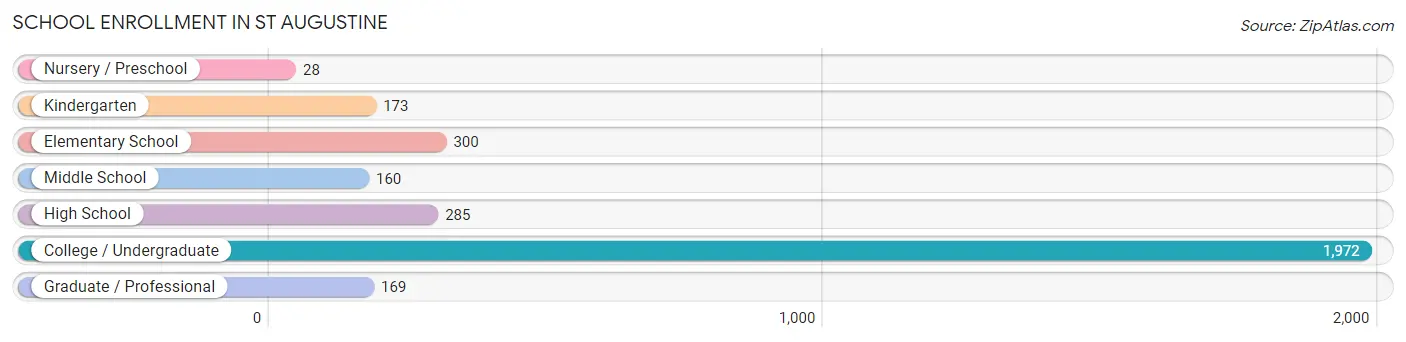
| School Level | # Students | % Students |
| Nursery / Preschool | 28 | 0.9% |
| Kindergarten | 173 | 5.6% |
| Elementary School | 300 | 9.7% |
| Middle School | 160 | 5.2% |
| High School | 285 | 9.2% |
| College / Undergraduate | 1,972 | 63.9% |
| Graduate / Professional | 169 | 5.5% |
| Total | 3,087 | 100.0% |
School Enrollment by Age by Funding Source in St Augustine
Out of a total of 3,087 students who are enrolled in schools in St Augustine, 1,491 (48.3%) attend a private institution, while the remaining 1,596 (51.7%) are enrolled in public schools. The age group of 3 to 4 year olds has the highest likelihood of being enrolled in private schools, with 10 (100.0% in the age bracket) enrolled. Conversely, the age group of 10 to 14 year olds has the lowest likelihood of being enrolled in a private school, with 209 (95.4% in the age bracket) attending a public institution.
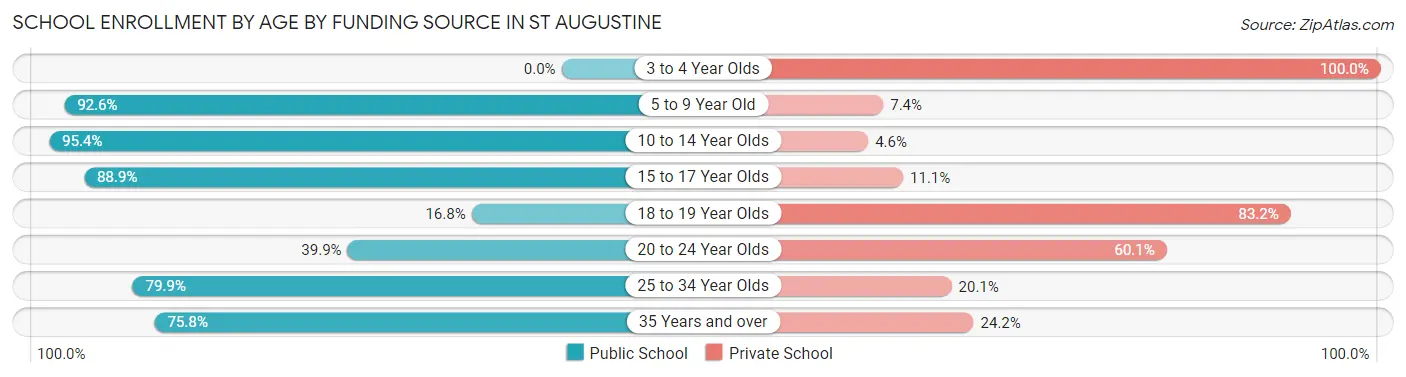
| Age Bracket | Public School | Private School |
| 3 to 4 Year Olds | 0 (0.0%) | 10 (100.0%) |
| 5 to 9 Year Old | 414 (92.6%) | 33 (7.4%) |
| 10 to 14 Year Olds | 209 (95.4%) | 10 (4.6%) |
| 15 to 17 Year Olds | 225 (88.9%) | 28 (11.1%) |
| 18 to 19 Year Olds | 189 (16.8%) | 939 (83.2%) |
| 20 to 24 Year Olds | 254 (39.9%) | 383 (60.1%) |
| 25 to 34 Year Olds | 139 (79.9%) | 35 (20.1%) |
| 35 Years and over | 166 (75.8%) | 53 (24.2%) |
| Total | 1,596 (51.7%) | 1,491 (48.3%) |
Educational Attainment by Field of Study in St Augustine
Business (872 | 17.6%), education (623 | 12.6%), engineering (475 | 9.6%), science & technology (451 | 9.1%), and social sciences (421 | 8.5%) are the most common fields of study among 4,957 individuals in St Augustine who have obtained a bachelor's degree or higher.
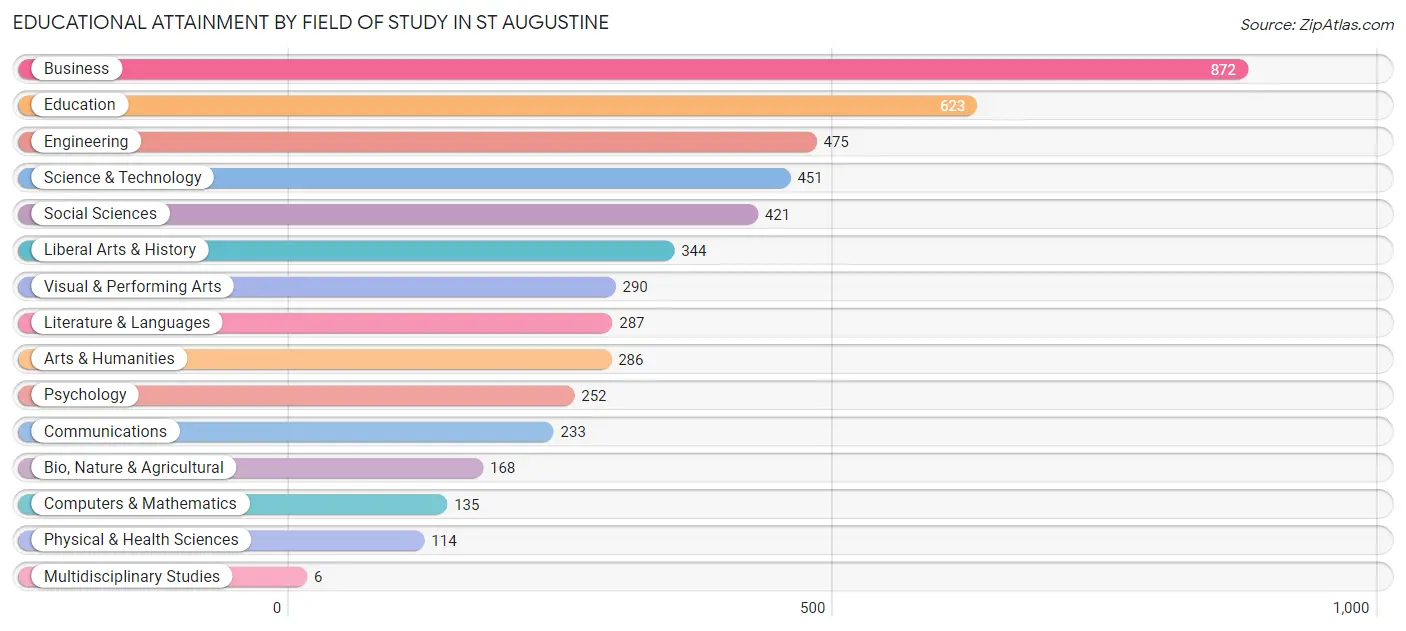
| Field of Study | # Graduates | % Graduates |
| Computers & Mathematics | 135 | 2.7% |
| Bio, Nature & Agricultural | 168 | 3.4% |
| Physical & Health Sciences | 114 | 2.3% |
| Psychology | 252 | 5.1% |
| Social Sciences | 421 | 8.5% |
| Engineering | 475 | 9.6% |
| Multidisciplinary Studies | 6 | 0.1% |
| Science & Technology | 451 | 9.1% |
| Business | 872 | 17.6% |
| Education | 623 | 12.6% |
| Literature & Languages | 287 | 5.8% |
| Liberal Arts & History | 344 | 6.9% |
| Visual & Performing Arts | 290 | 5.9% |
| Communications | 233 | 4.7% |
| Arts & Humanities | 286 | 5.8% |
| Total | 4,957 | 100.0% |
Transportation & Commute in St Augustine
Vehicle Availability by Sex in St Augustine
The most prevalent vehicle ownership categories in St Augustine are males with 2 vehicles (1,422, accounting for 43.4%) and females with 2 vehicles (1,271, making up 38.1%).
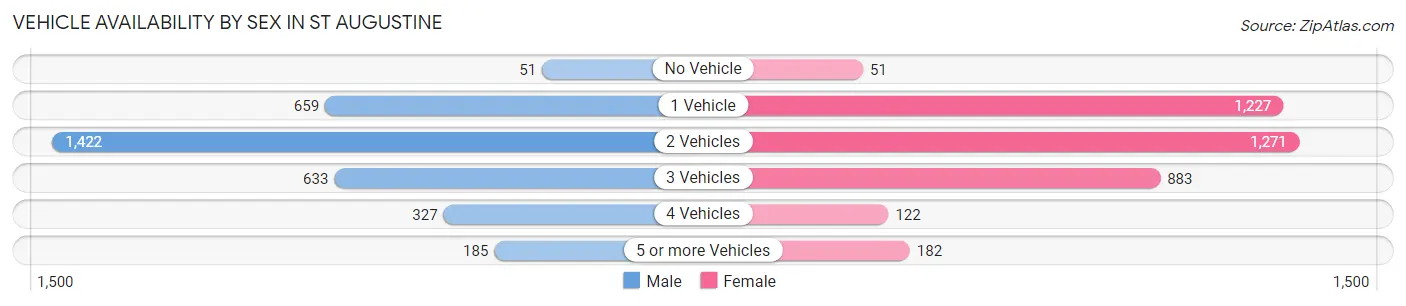
| Vehicles Available | Male | Female |
| No Vehicle | 51 (1.6%) | 51 (1.4%) |
| 1 Vehicle | 659 (20.1%) | 1,227 (32.8%) |
| 2 Vehicles | 1,422 (43.4%) | 1,271 (34.0%) |
| 3 Vehicles | 633 (19.3%) | 883 (23.6%) |
| 4 Vehicles | 327 (10.0%) | 122 (3.3%) |
| 5 or more Vehicles | 185 (5.7%) | 182 (4.9%) |
| Total | 3,277 (100.0%) | 3,736 (100.0%) |
Commute Time in St Augustine
The most frequently occuring commute durations in St Augustine are 15 to 19 minutes (1,256 commuters, 20.8%), 10 to 14 minutes (1,188 commuters, 19.6%), and 5 to 9 minutes (1,017 commuters, 16.8%).
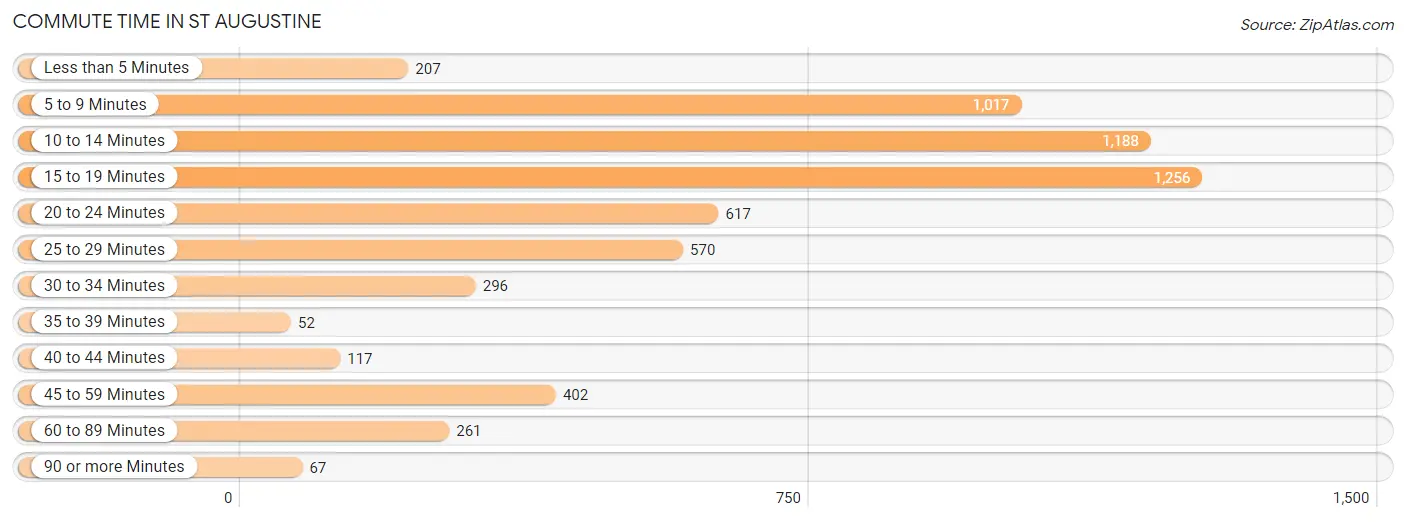
| Commute Time | # Commuters | % Commuters |
| Less than 5 Minutes | 207 | 3.4% |
| 5 to 9 Minutes | 1,017 | 16.8% |
| 10 to 14 Minutes | 1,188 | 19.6% |
| 15 to 19 Minutes | 1,256 | 20.8% |
| 20 to 24 Minutes | 617 | 10.2% |
| 25 to 29 Minutes | 570 | 9.4% |
| 30 to 34 Minutes | 296 | 4.9% |
| 35 to 39 Minutes | 52 | 0.9% |
| 40 to 44 Minutes | 117 | 1.9% |
| 45 to 59 Minutes | 402 | 6.6% |
| 60 to 89 Minutes | 261 | 4.3% |
| 90 or more Minutes | 67 | 1.1% |
Commute Time by Sex in St Augustine
The most common commute times in St Augustine are 15 to 19 minutes (534 commuters, 18.8%) for males and 10 to 14 minutes (798 commuters, 24.8%) for females.
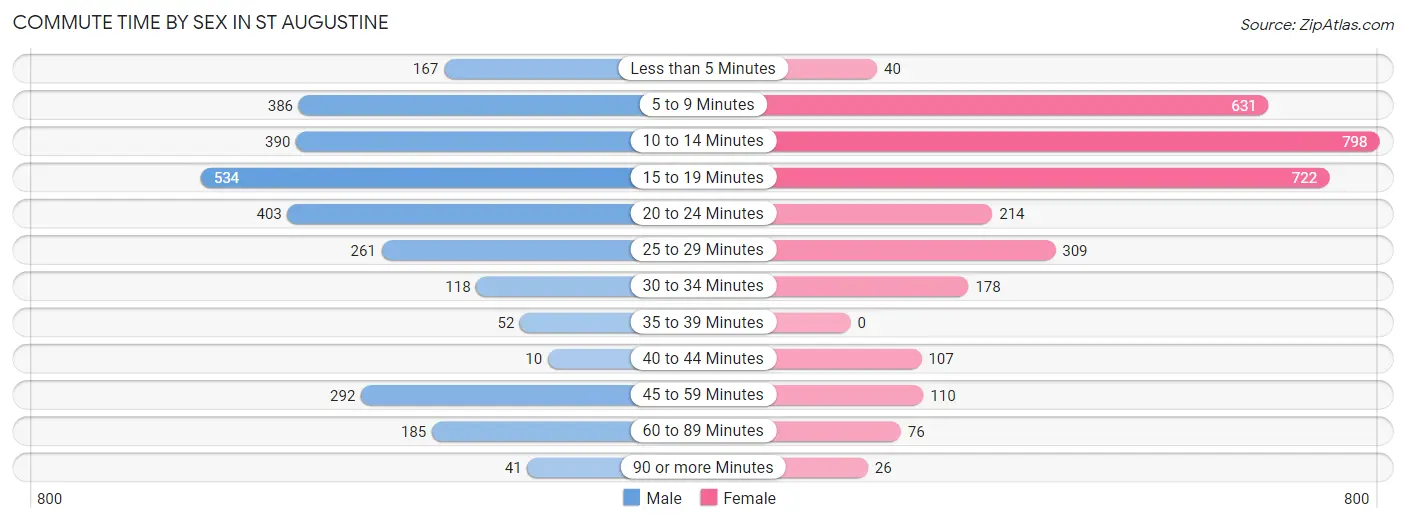
| Commute Time | Male | Female |
| Less than 5 Minutes | 167 (5.9%) | 40 (1.3%) |
| 5 to 9 Minutes | 386 (13.6%) | 631 (19.7%) |
| 10 to 14 Minutes | 390 (13.7%) | 798 (24.8%) |
| 15 to 19 Minutes | 534 (18.8%) | 722 (22.5%) |
| 20 to 24 Minutes | 403 (14.2%) | 214 (6.7%) |
| 25 to 29 Minutes | 261 (9.2%) | 309 (9.6%) |
| 30 to 34 Minutes | 118 (4.2%) | 178 (5.5%) |
| 35 to 39 Minutes | 52 (1.8%) | 0 (0.0%) |
| 40 to 44 Minutes | 10 (0.4%) | 107 (3.3%) |
| 45 to 59 Minutes | 292 (10.3%) | 110 (3.4%) |
| 60 to 89 Minutes | 185 (6.5%) | 76 (2.4%) |
| 90 or more Minutes | 41 (1.4%) | 26 (0.8%) |
Time of Departure to Work by Sex in St Augustine
The most frequent times of departure to work in St Augustine are 8:00 AM to 8:29 AM (532, 18.7%) for males and 7:00 AM to 7:29 AM (525, 16.4%) for females.
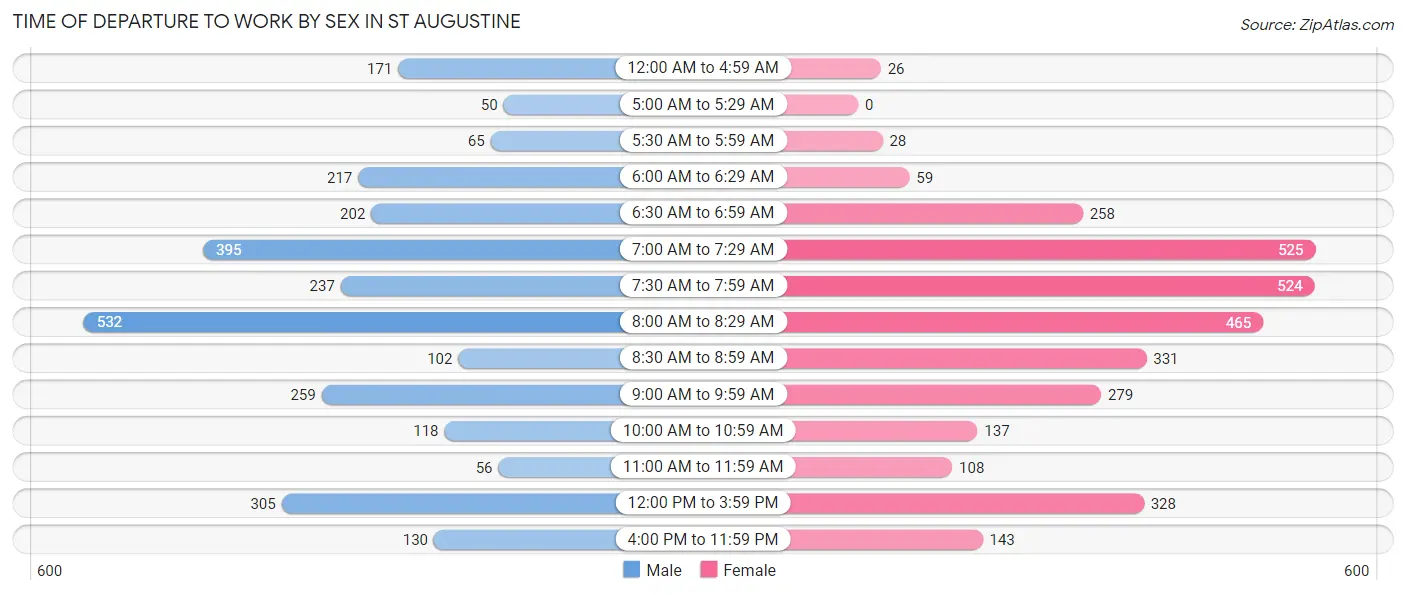
| Time of Departure | Male | Female |
| 12:00 AM to 4:59 AM | 171 (6.0%) | 26 (0.8%) |
| 5:00 AM to 5:29 AM | 50 (1.8%) | 0 (0.0%) |
| 5:30 AM to 5:59 AM | 65 (2.3%) | 28 (0.9%) |
| 6:00 AM to 6:29 AM | 217 (7.6%) | 59 (1.8%) |
| 6:30 AM to 6:59 AM | 202 (7.1%) | 258 (8.0%) |
| 7:00 AM to 7:29 AM | 395 (13.9%) | 525 (16.4%) |
| 7:30 AM to 7:59 AM | 237 (8.4%) | 524 (16.3%) |
| 8:00 AM to 8:29 AM | 532 (18.7%) | 465 (14.5%) |
| 8:30 AM to 8:59 AM | 102 (3.6%) | 331 (10.3%) |
| 9:00 AM to 9:59 AM | 259 (9.1%) | 279 (8.7%) |
| 10:00 AM to 10:59 AM | 118 (4.2%) | 137 (4.3%) |
| 11:00 AM to 11:59 AM | 56 (2.0%) | 108 (3.4%) |
| 12:00 PM to 3:59 PM | 305 (10.7%) | 328 (10.2%) |
| 4:00 PM to 11:59 PM | 130 (4.6%) | 143 (4.4%) |
| Total | 2,839 (100.0%) | 3,211 (100.0%) |
Housing Occupancy in St Augustine
Occupancy by Ownership in St Augustine
Of the total 5,833 dwellings in St Augustine, owner-occupied units account for 3,844 (65.9%), while renter-occupied units make up 1,989 (34.1%).
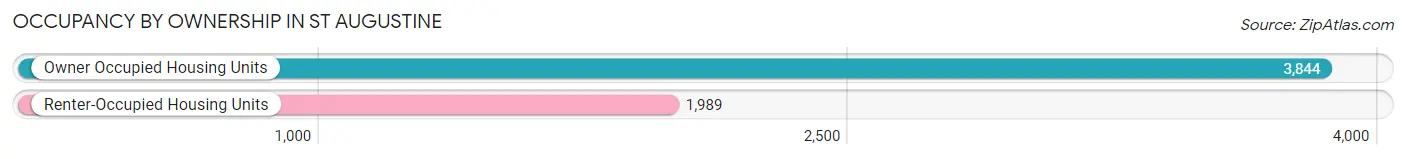
| Occupancy | # Housing Units | % Housing Units |
| Owner Occupied Housing Units | 3,844 | 65.9% |
| Renter-Occupied Housing Units | 1,989 | 34.1% |
| Total Occupied Housing Units | 5,833 | 100.0% |
Occupancy by Household Size in St Augustine
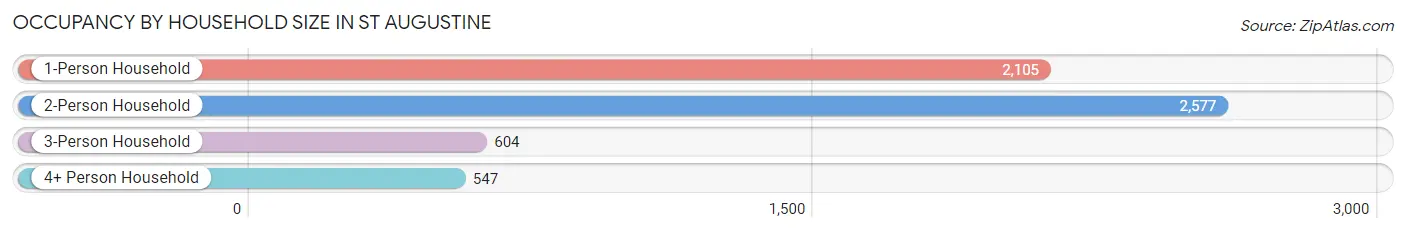
| Household Size | # Housing Units | % Housing Units |
| 1-Person Household | 2,105 | 36.1% |
| 2-Person Household | 2,577 | 44.2% |
| 3-Person Household | 604 | 10.3% |
| 4+ Person Household | 547 | 9.4% |
| Total Housing Units | 5,833 | 100.0% |
Occupancy by Ownership by Household Size in St Augustine
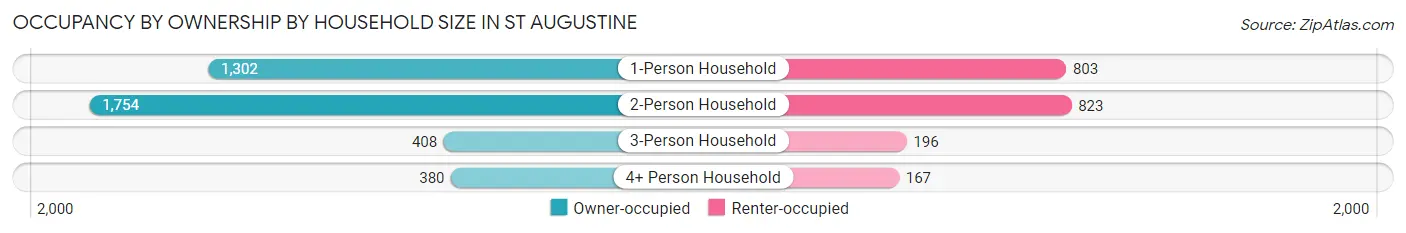
| Household Size | Owner-occupied | Renter-occupied |
| 1-Person Household | 1,302 (61.9%) | 803 (38.2%) |
| 2-Person Household | 1,754 (68.1%) | 823 (31.9%) |
| 3-Person Household | 408 (67.5%) | 196 (32.5%) |
| 4+ Person Household | 380 (69.5%) | 167 (30.5%) |
| Total Housing Units | 3,844 (65.9%) | 1,989 (34.1%) |
Occupancy by Educational Attainment in St Augustine
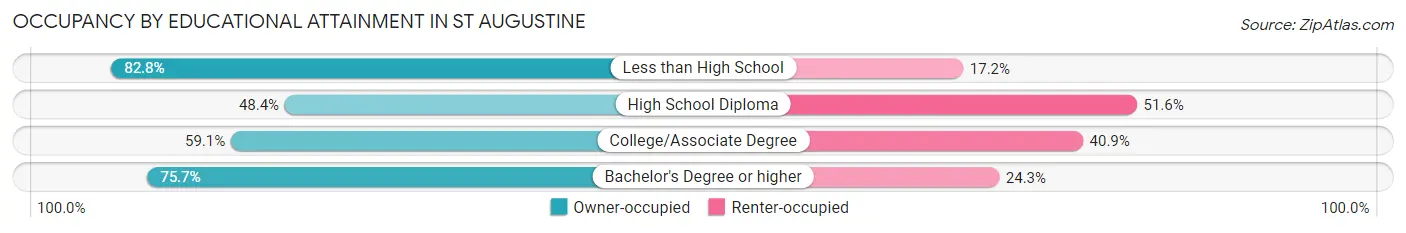
| Household Size | Owner-occupied | Renter-occupied |
| Less than High School | 106 (82.8%) | 22 (17.2%) |
| High School Diploma | 449 (48.4%) | 479 (51.6%) |
| College/Associate Degree | 1,159 (59.1%) | 803 (40.9%) |
| Bachelor's Degree or higher | 2,130 (75.7%) | 685 (24.3%) |
Occupancy by Age of Householder in St Augustine
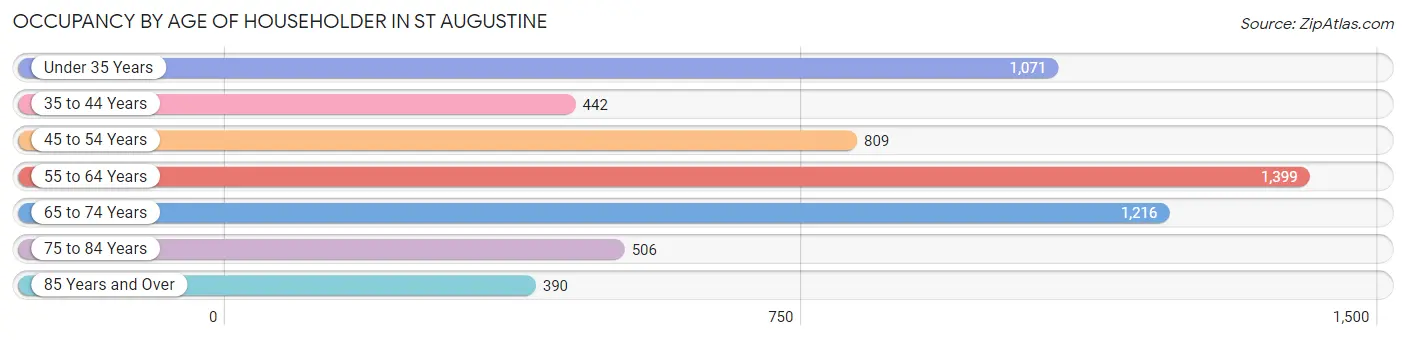
| Age Bracket | # Households | % Households |
| Under 35 Years | 1,071 | 18.4% |
| 35 to 44 Years | 442 | 7.6% |
| 45 to 54 Years | 809 | 13.9% |
| 55 to 64 Years | 1,399 | 24.0% |
| 65 to 74 Years | 1,216 | 20.8% |
| 75 to 84 Years | 506 | 8.7% |
| 85 Years and Over | 390 | 6.7% |
| Total | 5,833 | 100.0% |
Housing Finances in St Augustine
Median Income by Occupancy in St Augustine
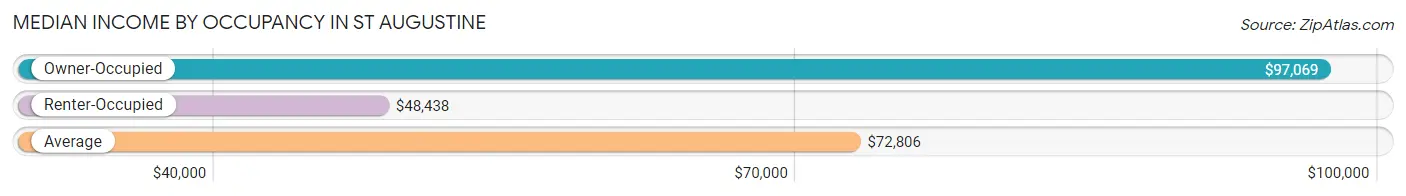
| Occupancy Type | # Households | Median Income |
| Owner-Occupied | 3,844 (65.9%) | $97,069 |
| Renter-Occupied | 1,989 (34.1%) | $48,438 |
| Average | 5,833 (100.0%) | $72,806 |
Occupancy by Householder Income Bracket in St Augustine
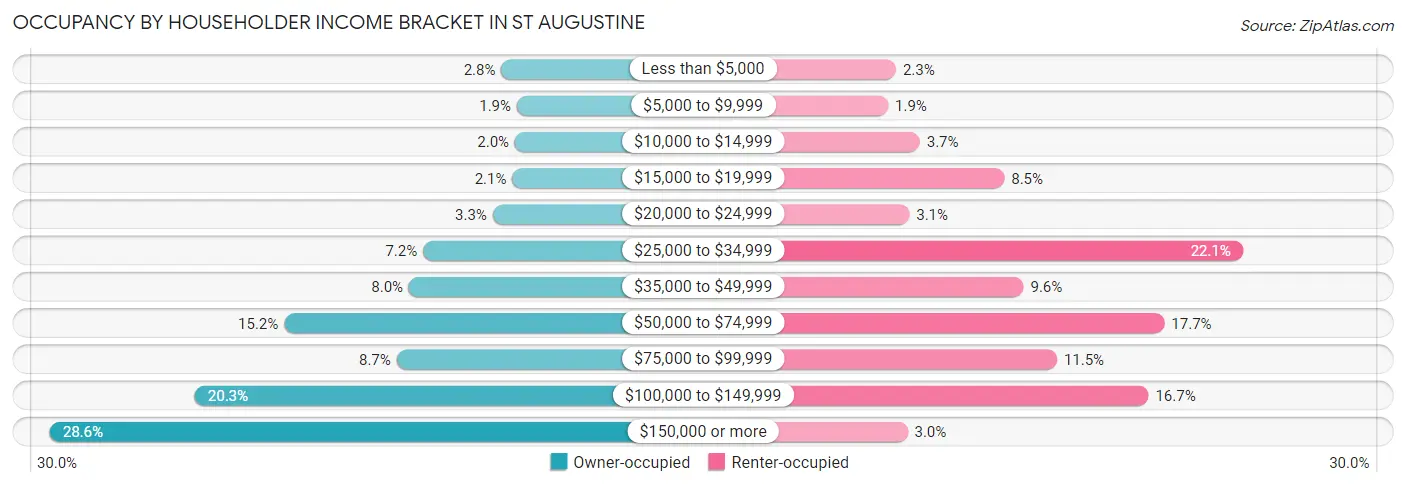
| Income Bracket | Owner-occupied | Renter-occupied |
| Less than $5,000 | 106 (2.8%) | 46 (2.3%) |
| $5,000 to $9,999 | 72 (1.9%) | 37 (1.9%) |
| $10,000 to $14,999 | 76 (2.0%) | 73 (3.7%) |
| $15,000 to $19,999 | 82 (2.1%) | 169 (8.5%) |
| $20,000 to $24,999 | 125 (3.3%) | 61 (3.1%) |
| $25,000 to $34,999 | 278 (7.2%) | 440 (22.1%) |
| $35,000 to $49,999 | 309 (8.0%) | 191 (9.6%) |
| $50,000 to $74,999 | 583 (15.2%) | 351 (17.6%) |
| $75,000 to $99,999 | 336 (8.7%) | 229 (11.5%) |
| $100,000 to $149,999 | 779 (20.3%) | 333 (16.7%) |
| $150,000 or more | 1,098 (28.6%) | 59 (3.0%) |
| Total | 3,844 (100.0%) | 1,989 (100.0%) |
Monthly Housing Cost Tiers in St Augustine
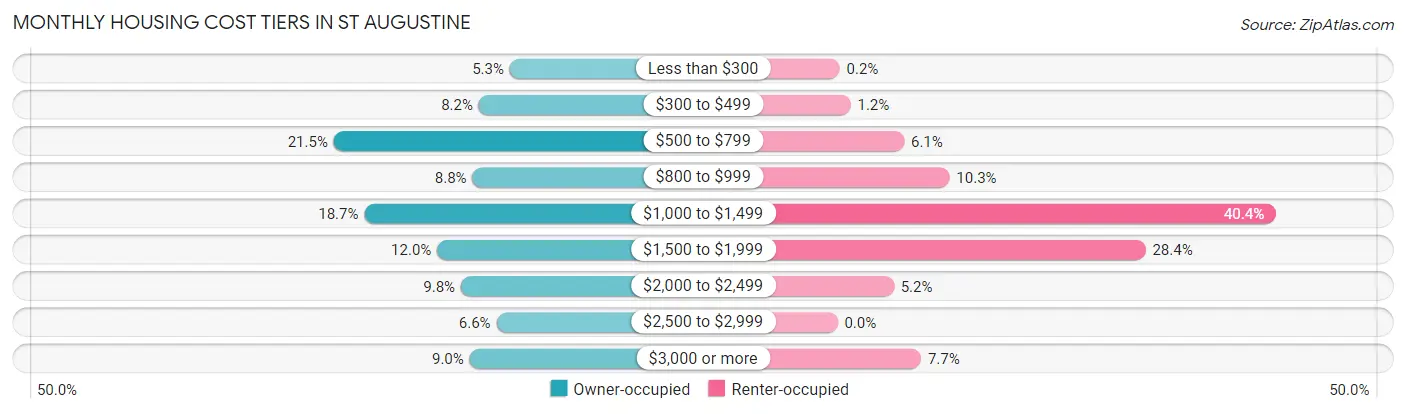
| Monthly Cost | Owner-occupied | Renter-occupied |
| Less than $300 | 205 (5.3%) | 4 (0.2%) |
| $300 to $499 | 315 (8.2%) | 24 (1.2%) |
| $500 to $799 | 828 (21.5%) | 122 (6.1%) |
| $800 to $999 | 337 (8.8%) | 205 (10.3%) |
| $1,000 to $1,499 | 720 (18.7%) | 803 (40.4%) |
| $1,500 to $1,999 | 462 (12.0%) | 564 (28.4%) |
| $2,000 to $2,499 | 378 (9.8%) | 103 (5.2%) |
| $2,500 to $2,999 | 252 (6.6%) | 0 (0.0%) |
| $3,000 or more | 347 (9.0%) | 153 (7.7%) |
| Total | 3,844 (100.0%) | 1,989 (100.0%) |
Physical Housing Characteristics in St Augustine
Housing Structures in St Augustine
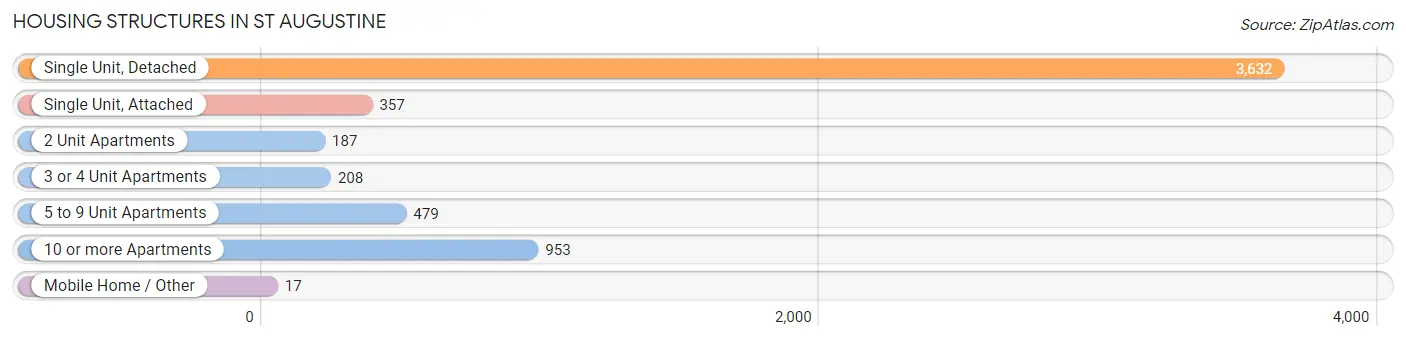
| Structure Type | # Housing Units | % Housing Units |
| Single Unit, Detached | 3,632 | 62.3% |
| Single Unit, Attached | 357 | 6.1% |
| 2 Unit Apartments | 187 | 3.2% |
| 3 or 4 Unit Apartments | 208 | 3.6% |
| 5 to 9 Unit Apartments | 479 | 8.2% |
| 10 or more Apartments | 953 | 16.3% |
| Mobile Home / Other | 17 | 0.3% |
| Total | 5,833 | 100.0% |
Housing Structures by Occupancy in St Augustine
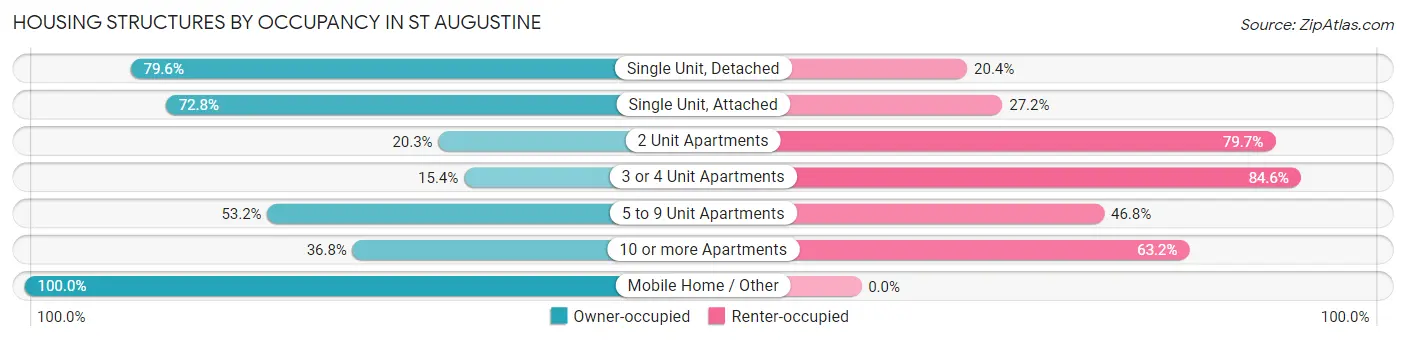
| Structure Type | Owner-occupied | Renter-occupied |
| Single Unit, Detached | 2,891 (79.6%) | 741 (20.4%) |
| Single Unit, Attached | 260 (72.8%) | 97 (27.2%) |
| 2 Unit Apartments | 38 (20.3%) | 149 (79.7%) |
| 3 or 4 Unit Apartments | 32 (15.4%) | 176 (84.6%) |
| 5 to 9 Unit Apartments | 255 (53.2%) | 224 (46.8%) |
| 10 or more Apartments | 351 (36.8%) | 602 (63.2%) |
| Mobile Home / Other | 17 (100.0%) | 0 (0.0%) |
| Total | 3,844 (65.9%) | 1,989 (34.1%) |
Housing Structures by Number of Rooms in St Augustine
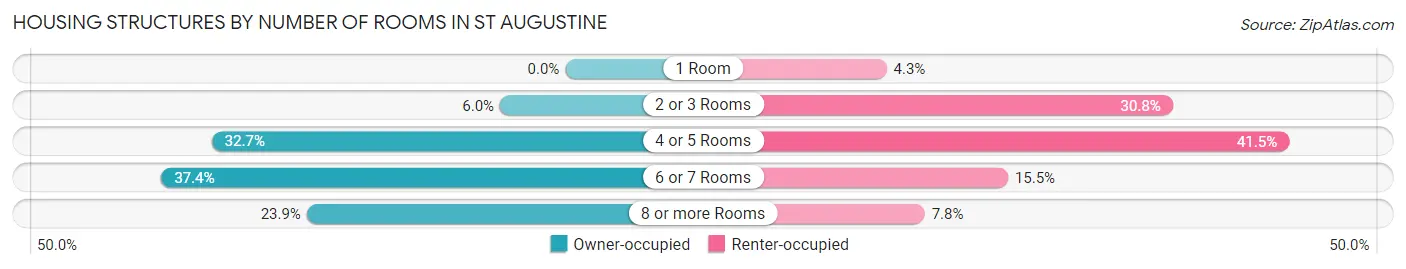
| Number of Rooms | Owner-occupied | Renter-occupied |
| 1 Room | 0 (0.0%) | 86 (4.3%) |
| 2 or 3 Rooms | 232 (6.0%) | 612 (30.8%) |
| 4 or 5 Rooms | 1,257 (32.7%) | 826 (41.5%) |
| 6 or 7 Rooms | 1,436 (37.4%) | 309 (15.5%) |
| 8 or more Rooms | 919 (23.9%) | 156 (7.8%) |
| Total | 3,844 (100.0%) | 1,989 (100.0%) |
Housing Structure by Heating Type in St Augustine
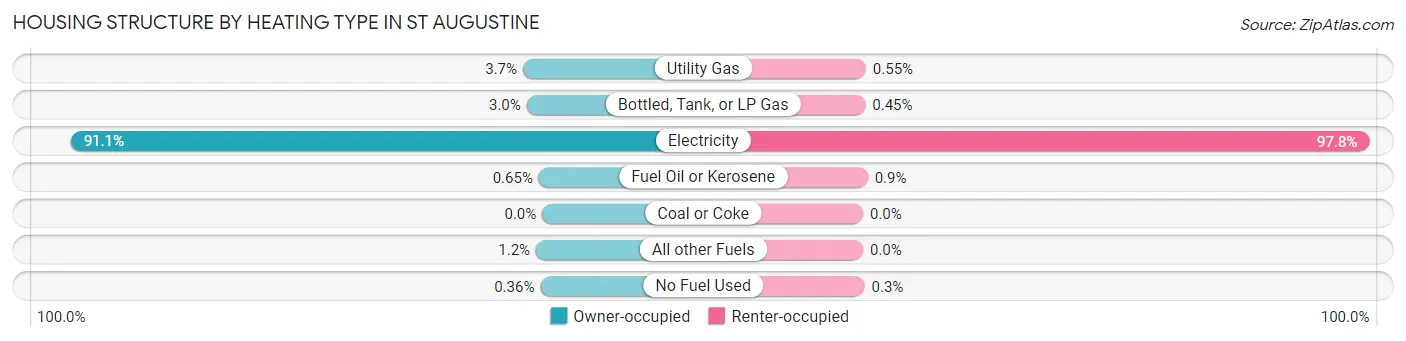
| Heating Type | Owner-occupied | Renter-occupied |
| Utility Gas | 143 (3.7%) | 11 (0.5%) |
| Bottled, Tank, or LP Gas | 115 (3.0%) | 9 (0.4%) |
| Electricity | 3,501 (91.1%) | 1,945 (97.8%) |
| Fuel Oil or Kerosene | 25 (0.6%) | 18 (0.9%) |
| Coal or Coke | 0 (0.0%) | 0 (0.0%) |
| All other Fuels | 46 (1.2%) | 0 (0.0%) |
| No Fuel Used | 14 (0.4%) | 6 (0.3%) |
| Total | 3,844 (100.0%) | 1,989 (100.0%) |
Household Vehicle Usage in St Augustine
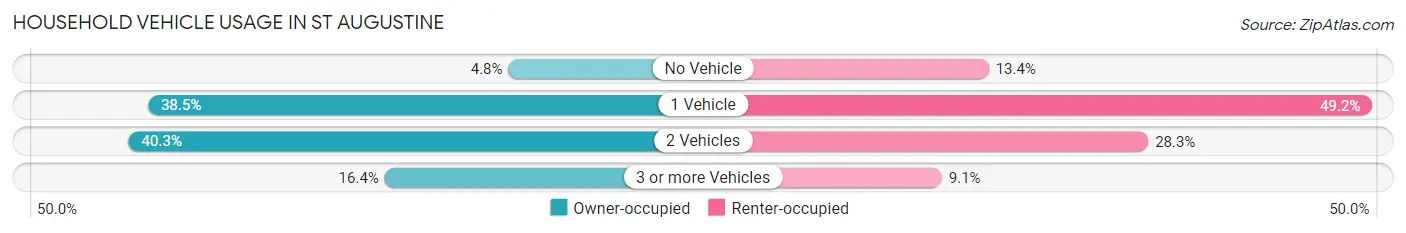
| Vehicles per Household | Owner-occupied | Renter-occupied |
| No Vehicle | 186 (4.8%) | 267 (13.4%) |
| 1 Vehicle | 1,479 (38.5%) | 979 (49.2%) |
| 2 Vehicles | 1,549 (40.3%) | 563 (28.3%) |
| 3 or more Vehicles | 630 (16.4%) | 180 (9.0%) |
| Total | 3,844 (100.0%) | 1,989 (100.0%) |
Real Estate & Mortgages in St Augustine
Real Estate and Mortgage Overview in St Augustine
| Characteristic | Without Mortgage | With Mortgage |
| Housing Units | 1,774 | 2,070 |
| Median Property Value | $369,400 | $340,600 |
| Median Household Income | $63,915 | $772 |
| Monthly Housing Costs | $692 | $270 |
| Real Estate Taxes | $2,747 | $118 |
Property Value by Mortgage Status in St Augustine
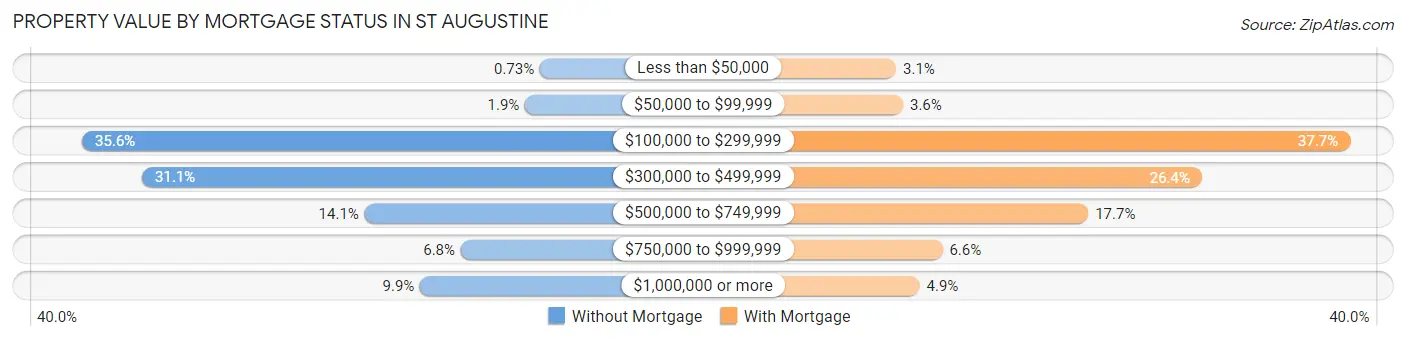
| Property Value | Without Mortgage | With Mortgage |
| Less than $50,000 | 13 (0.7%) | 64 (3.1%) |
| $50,000 to $99,999 | 33 (1.9%) | 75 (3.6%) |
| $100,000 to $299,999 | 632 (35.6%) | 780 (37.7%) |
| $300,000 to $499,999 | 551 (31.1%) | 546 (26.4%) |
| $500,000 to $749,999 | 250 (14.1%) | 367 (17.7%) |
| $750,000 to $999,999 | 120 (6.8%) | 137 (6.6%) |
| $1,000,000 or more | 175 (9.9%) | 101 (4.9%) |
| Total | 1,774 (100.0%) | 2,070 (100.0%) |
Household Income by Mortgage Status in St Augustine
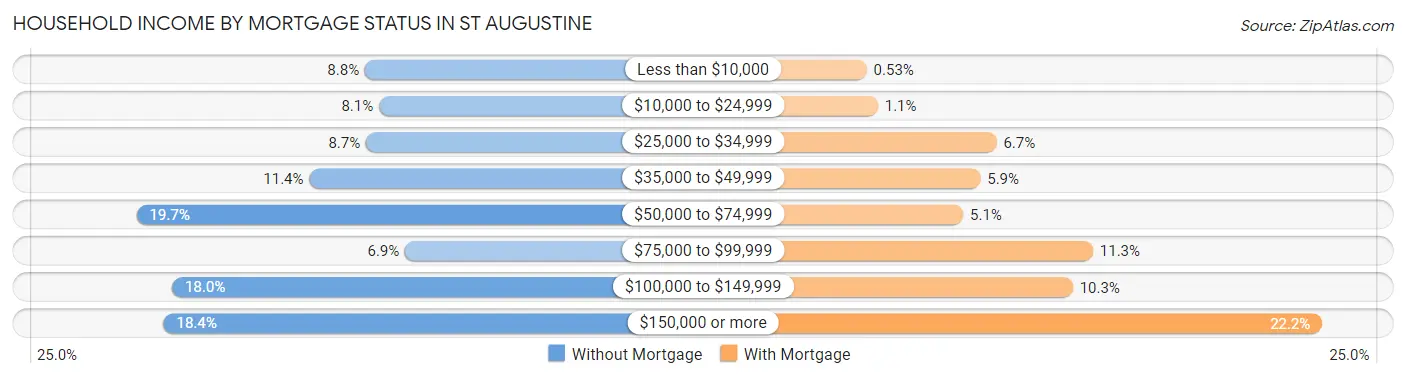
| Household Income | Without Mortgage | With Mortgage |
| Less than $10,000 | 156 (8.8%) | 11 (0.5%) |
| $10,000 to $24,999 | 144 (8.1%) | 22 (1.1%) |
| $25,000 to $34,999 | 155 (8.7%) | 139 (6.7%) |
| $35,000 to $49,999 | 203 (11.4%) | 123 (5.9%) |
| $50,000 to $74,999 | 349 (19.7%) | 106 (5.1%) |
| $75,000 to $99,999 | 122 (6.9%) | 234 (11.3%) |
| $100,000 to $149,999 | 319 (18.0%) | 214 (10.3%) |
| $150,000 or more | 326 (18.4%) | 460 (22.2%) |
| Total | 1,774 (100.0%) | 2,070 (100.0%) |
Property Value to Household Income Ratio in St Augustine
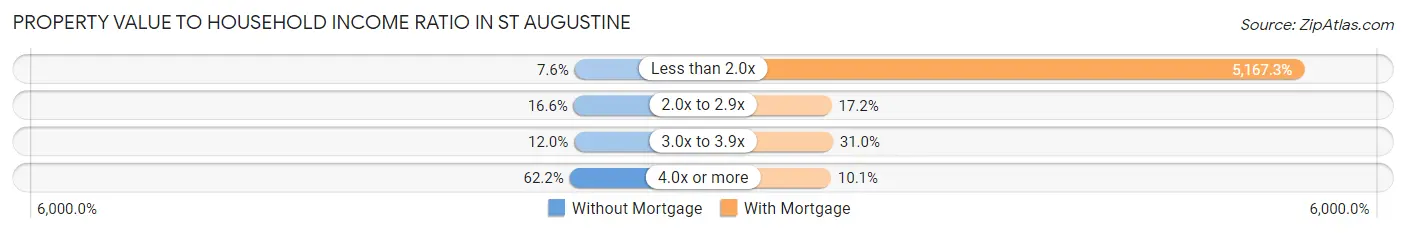
| Value-to-Income Ratio | Without Mortgage | With Mortgage |
| Less than 2.0x | 134 (7.5%) | 106,964 (5,167.3%) |
| 2.0x to 2.9x | 295 (16.6%) | 355 (17.2%) |
| 3.0x to 3.9x | 213 (12.0%) | 641 (31.0%) |
| 4.0x or more | 1,104 (62.2%) | 209 (10.1%) |
| Total | 1,774 (100.0%) | 2,070 (100.0%) |
Real Estate Taxes by Mortgage Status in St Augustine
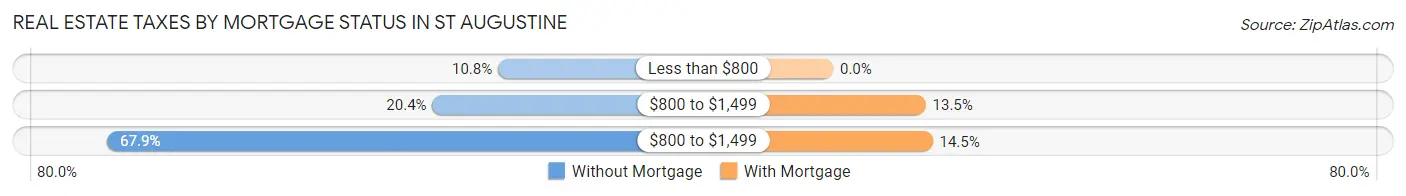
| Property Taxes | Without Mortgage | With Mortgage |
| Less than $800 | 192 (10.8%) | 0 (0.0%) |
| $800 to $1,499 | 362 (20.4%) | 280 (13.5%) |
| $800 to $1,499 | 1,205 (67.9%) | 301 (14.5%) |
| Total | 1,774 (100.0%) | 2,070 (100.0%) |
Health & Disability in St Augustine
Health Insurance Coverage by Age in St Augustine
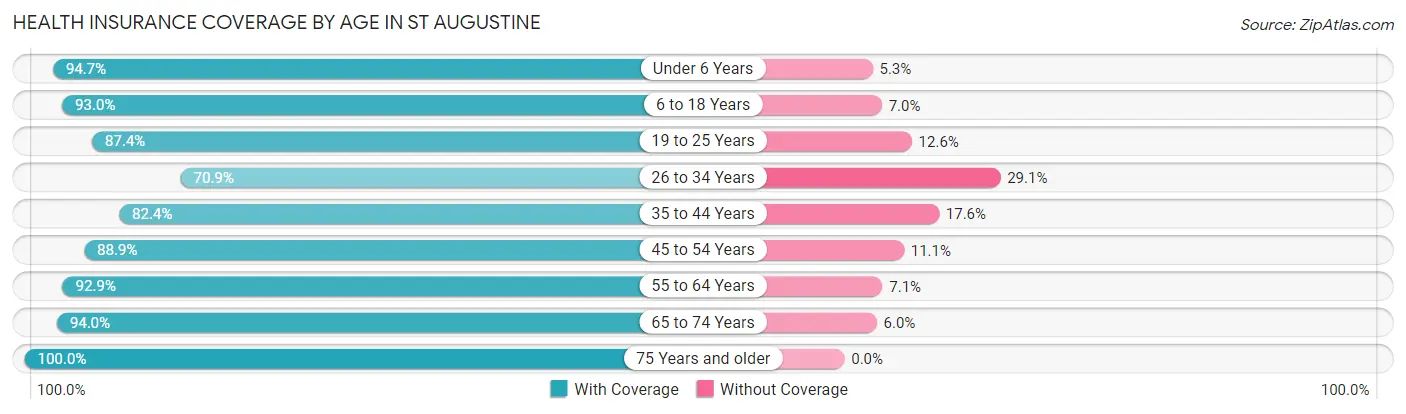
| Age Bracket | With Coverage | Without Coverage |
| Under 6 Years | 270 (94.7%) | 15 (5.3%) |
| 6 to 18 Years | 1,598 (93.0%) | 120 (7.0%) |
| 19 to 25 Years | 1,525 (87.4%) | 219 (12.6%) |
| 26 to 34 Years | 1,190 (70.9%) | 488 (29.1%) |
| 35 to 44 Years | 1,201 (82.4%) | 257 (17.6%) |
| 45 to 54 Years | 1,265 (88.9%) | 158 (11.1%) |
| 55 to 64 Years | 2,268 (92.9%) | 173 (7.1%) |
| 65 to 74 Years | 2,153 (94.0%) | 138 (6.0%) |
| 75 Years and older | 1,415 (100.0%) | 0 (0.0%) |
| Total | 12,885 (89.1%) | 1,568 (10.8%) |
Health Insurance Coverage by Citizenship Status in St Augustine
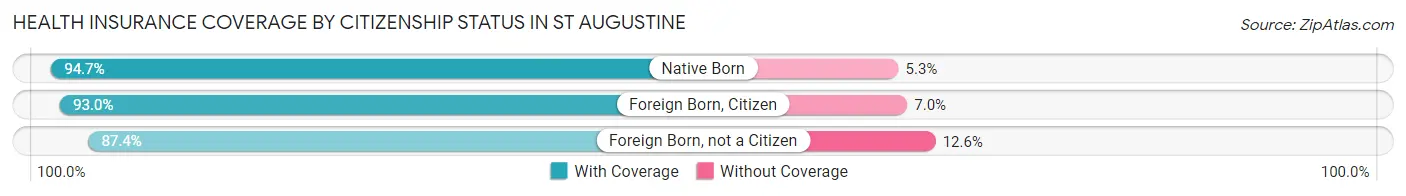
| Citizenship Status | With Coverage | Without Coverage |
| Native Born | 270 (94.7%) | 15 (5.3%) |
| Foreign Born, Citizen | 1,598 (93.0%) | 120 (7.0%) |
| Foreign Born, not a Citizen | 1,525 (87.4%) | 219 (12.6%) |
Health Insurance Coverage by Household Income in St Augustine
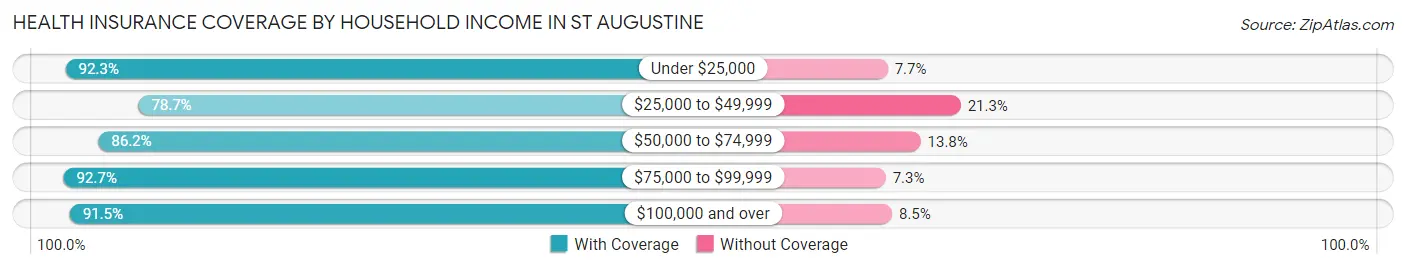
| Household Income | With Coverage | Without Coverage |
| Under $25,000 | 1,071 (92.3%) | 89 (7.7%) |
| $25,000 to $49,999 | 1,585 (78.7%) | 430 (21.3%) |
| $50,000 to $74,999 | 2,018 (86.2%) | 324 (13.8%) |
| $75,000 to $99,999 | 1,107 (92.7%) | 87 (7.3%) |
| $100,000 and over | 5,816 (91.5%) | 539 (8.5%) |
Public vs Private Health Insurance Coverage by Age in St Augustine
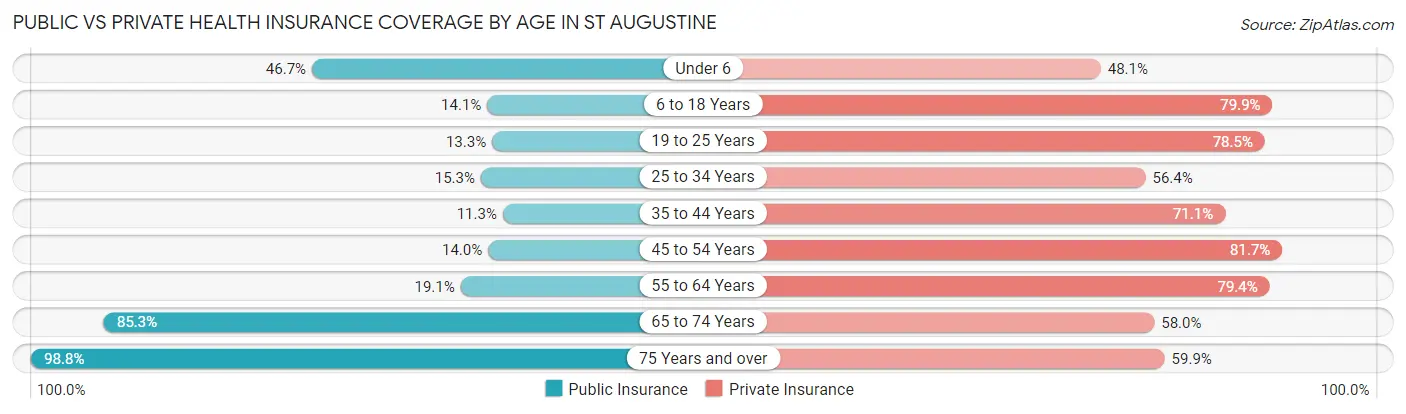
| Age Bracket | Public Insurance | Private Insurance |
| Under 6 | 133 (46.7%) | 137 (48.1%) |
| 6 to 18 Years | 243 (14.1%) | 1,373 (79.9%) |
| 19 to 25 Years | 231 (13.3%) | 1,369 (78.5%) |
| 25 to 34 Years | 257 (15.3%) | 946 (56.4%) |
| 35 to 44 Years | 164 (11.3%) | 1,037 (71.1%) |
| 45 to 54 Years | 199 (14.0%) | 1,163 (81.7%) |
| 55 to 64 Years | 466 (19.1%) | 1,938 (79.4%) |
| 65 to 74 Years | 1,954 (85.3%) | 1,329 (58.0%) |
| 75 Years and over | 1,398 (98.8%) | 848 (59.9%) |
| Total | 5,045 (34.9%) | 10,140 (70.2%) |
Disability Status by Sex by Age in St Augustine
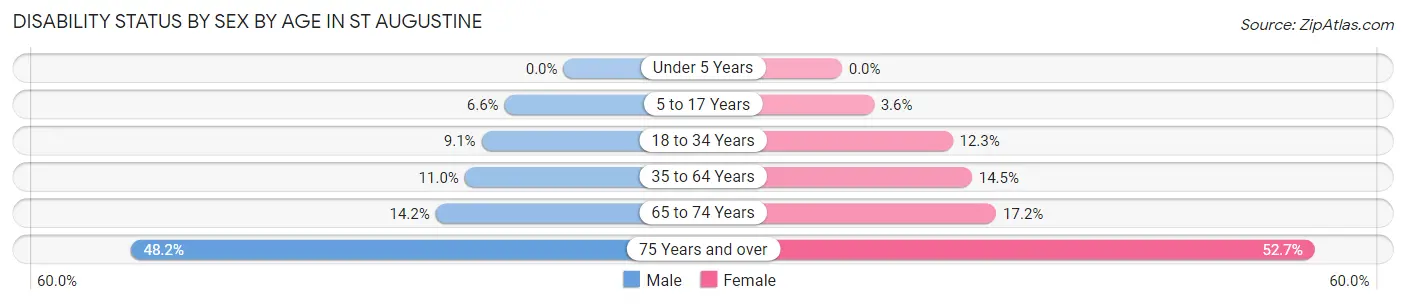
| Age Bracket | Male | Female |
| Under 5 Years | 0 (0.0%) | 0 (0.0%) |
| 5 to 17 Years | 30 (6.6%) | 18 (3.5%) |
| 18 to 34 Years | 159 (9.1%) | 317 (12.3%) |
| 35 to 64 Years | 283 (11.0%) | 398 (14.5%) |
| 65 to 74 Years | 153 (14.2%) | 209 (17.2%) |
| 75 Years and over | 228 (48.2%) | 496 (52.6%) |
Disability Class by Sex by Age in St Augustine
Disability Class: Hearing Difficulty
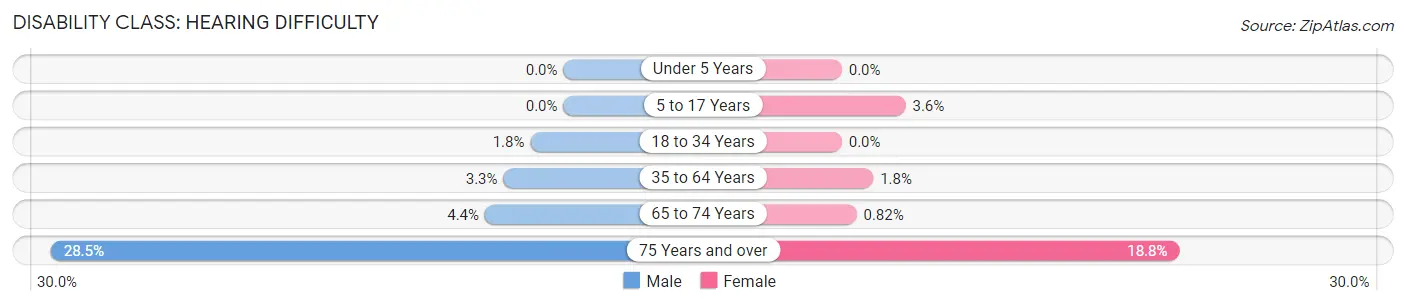
| Age Bracket | Male | Female |
| Under 5 Years | 0 (0.0%) | 0 (0.0%) |
| 5 to 17 Years | 0 (0.0%) | 18 (3.5%) |
| 18 to 34 Years | 32 (1.8%) | 0 (0.0%) |
| 35 to 64 Years | 86 (3.3%) | 48 (1.8%) |
| 65 to 74 Years | 47 (4.4%) | 10 (0.8%) |
| 75 Years and over | 135 (28.5%) | 177 (18.8%) |
Disability Class: Vision Difficulty
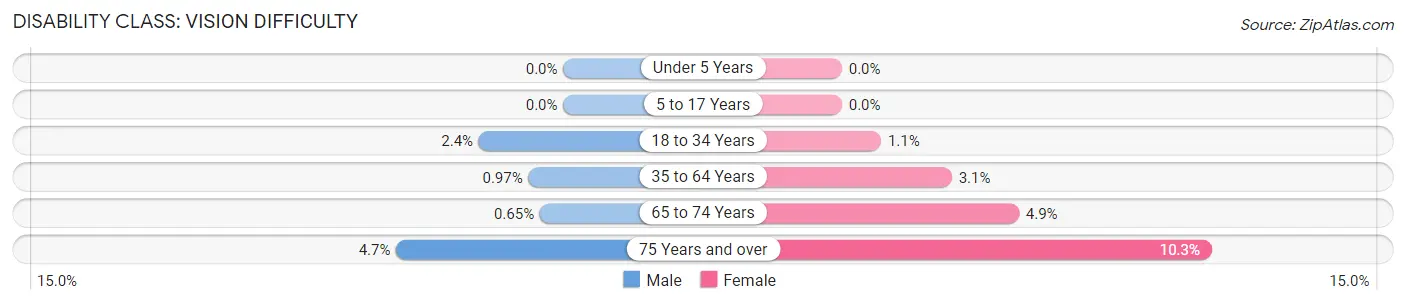
| Age Bracket | Male | Female |
| Under 5 Years | 0 (0.0%) | 0 (0.0%) |
| 5 to 17 Years | 0 (0.0%) | 0 (0.0%) |
| 18 to 34 Years | 41 (2.4%) | 28 (1.1%) |
| 35 to 64 Years | 25 (1.0%) | 84 (3.1%) |
| 65 to 74 Years | 7 (0.6%) | 60 (4.9%) |
| 75 Years and over | 22 (4.6%) | 97 (10.3%) |
Disability Class: Cognitive Difficulty
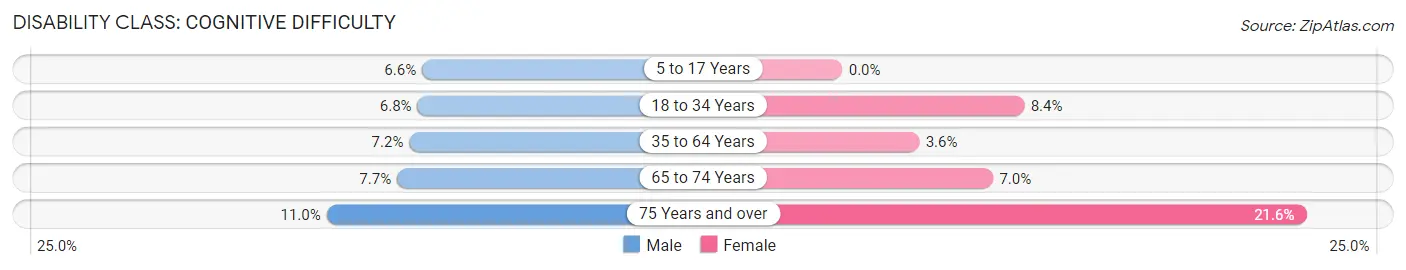
| Age Bracket | Male | Female |
| 5 to 17 Years | 30 (6.6%) | 0 (0.0%) |
| 18 to 34 Years | 118 (6.8%) | 217 (8.4%) |
| 35 to 64 Years | 184 (7.1%) | 98 (3.6%) |
| 65 to 74 Years | 83 (7.7%) | 85 (7.0%) |
| 75 Years and over | 52 (11.0%) | 203 (21.5%) |
Disability Class: Ambulatory Difficulty
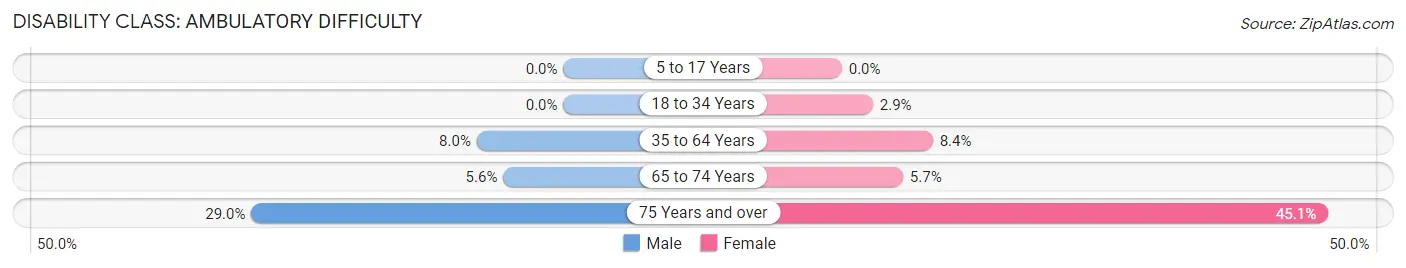
| Age Bracket | Male | Female |
| 5 to 17 Years | 0 (0.0%) | 0 (0.0%) |
| 18 to 34 Years | 0 (0.0%) | 74 (2.9%) |
| 35 to 64 Years | 207 (8.0%) | 232 (8.4%) |
| 65 to 74 Years | 60 (5.6%) | 69 (5.7%) |
| 75 Years and over | 137 (29.0%) | 425 (45.1%) |
Disability Class: Self-Care Difficulty
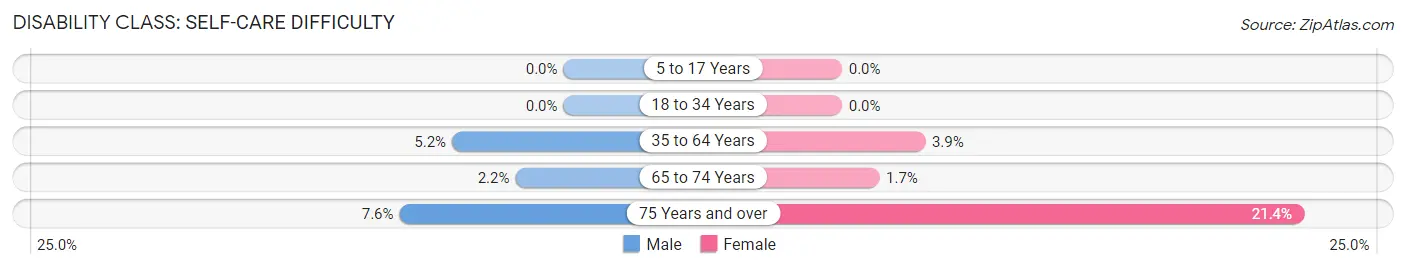
| Age Bracket | Male | Female |
| 5 to 17 Years | 0 (0.0%) | 0 (0.0%) |
| 18 to 34 Years | 0 (0.0%) | 0 (0.0%) |
| 35 to 64 Years | 133 (5.2%) | 106 (3.9%) |
| 65 to 74 Years | 24 (2.2%) | 21 (1.7%) |
| 75 Years and over | 36 (7.6%) | 202 (21.4%) |
Technology Access in St Augustine
Computing Device Access in St Augustine
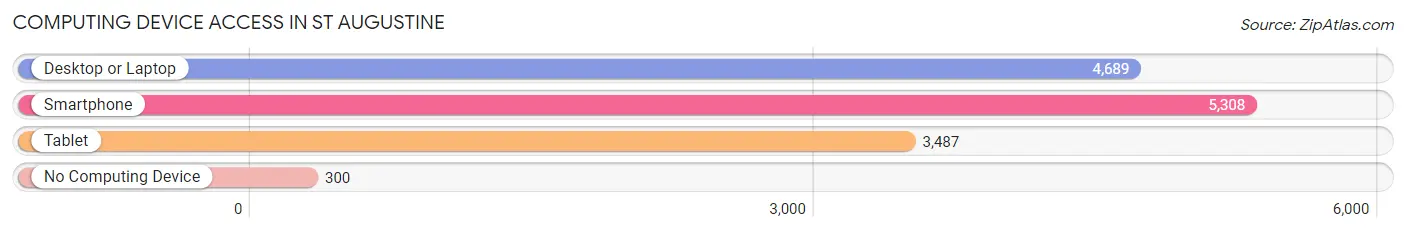
| Device Type | # Households | % Households |
| Desktop or Laptop | 4,689 | 80.4% |
| Smartphone | 5,308 | 91.0% |
| Tablet | 3,487 | 59.8% |
| No Computing Device | 300 | 5.1% |
| Total | 5,833 | 100.0% |
Internet Access in St Augustine
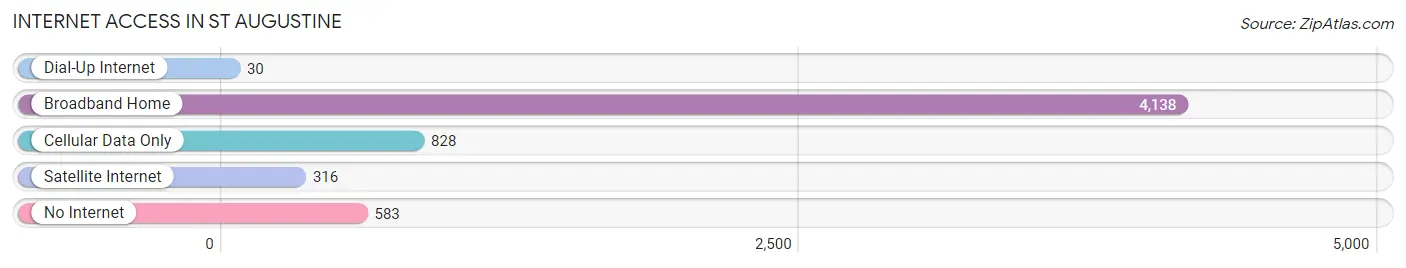
| Internet Type | # Households | % Households |
| Dial-Up Internet | 30 | 0.5% |
| Broadband Home | 4,138 | 70.9% |
| Cellular Data Only | 828 | 14.2% |
| Satellite Internet | 316 | 5.4% |
| No Internet | 583 | 10.0% |
| Total | 5,833 | 100.0% |
St Augustine Summary
St. Augustine, Florida is a city located in the northeastern part of the state, in St. Johns County. It is the oldest continuously occupied European-established settlement in the United States, having been founded in 1565 by Spanish explorer Pedro Menéndez de Avilés. St. Augustine is known for its rich history, beautiful beaches, and vibrant culture.
Geography
St. Augustine is located on the Atlantic coast of Florida, about 30 miles south of Jacksonville. It is situated on a peninsula between the Matanzas River and the San Sebastian River. The city is bordered by the Atlantic Ocean to the east, the Intracoastal Waterway to the west, and the Matanzas Bay to the south. The city covers an area of about 13.5 square miles, with a population of about 13,000 people.
Climate
St. Augustine has a humid subtropical climate, with hot, humid summers and mild winters. The average temperature in the summer is around 90°F, while in the winter it is around 60°F. The city receives an average of 51 inches of rain per year, with most of it falling in the summer months.
History
St. Augustine was founded in 1565 by Spanish explorer Pedro Menéndez de Avilés. He named the settlement after the Catholic saint Augustine of Hippo. The city was the capital of Spanish Florida for over 200 years, and was the site of several battles during the American Revolution and the Second Seminole War. In 1821, Florida became a U.S. territory, and St. Augustine was made the capital of the new territory. The city was occupied by Union forces during the Civil War, and in 1887 it became the county seat of St. Johns County.
Economy
St. Augustine’s economy is largely based on tourism, with the city being a popular destination for both domestic and international travelers. The city is home to several attractions, including the Castillo de San Marcos National Monument, the St. Augustine Lighthouse, and the St. Augustine Alligator Farm. The city also has a thriving arts and culture scene, with several museums, galleries, and performing arts venues.
In addition to tourism, St. Augustine’s economy is also supported by the military, with the city being home to several military installations, including Naval Air Station Jacksonville and Camp Blanding. The city is also home to several manufacturing and technology companies, as well as a growing number of start-ups.
Demographics
As of the 2010 census, St. Augustine had a population of 12,975 people. The racial makeup of the city was 77.3% White, 15.2% African American, 0.7% Native American, 1.3% Asian, 0.1% Pacific Islander, and 4.4% from other races. The median household income was $41,945, and the median age was 42.7 years.
St. Augustine is a diverse city, with a variety of cultures and backgrounds represented. The city is home to a large Hispanic population, as well as a growing number of immigrants from other countries. The city also has a large LGBT community, with several organizations and events dedicated to the community.
Conclusion
St. Augustine, Florida is a city with a rich history and vibrant culture. It is home to a variety of attractions, from historical sites to museums and galleries. The city’s economy is largely based on tourism, with a growing number of start-ups and technology companies. St. Augustine is a diverse city, with a variety of cultures and backgrounds represented.
Common Questions
What is the Total Population of St Augustine?
Total Population of St Augustine is 14,642.
What is the Total Male Population of St Augustine?
Total Male Population of St Augustine is 6,474.
What is the Total Female Population of St Augustine?
Total Female Population of St Augustine is 8,168.
What is the Ratio of Males per 100 Females in St Augustine?
There are 79.26 Males per 100 Females in St Augustine.
What is the Ratio of Females per 100 Males in St Augustine?
There are 126.17 Females per 100 Males in St Augustine.
What is the Median Population Age in St Augustine?
Median Population Age in St Augustine is 48.1 Years.
What is the Average Family Size in St Augustine
Average Family Size in St Augustine is 2.8 People.
What is the Average Household Size in St Augustine
Average Household Size in St Augustine is 2.2 People.
What is Per Capita Income in St Augustine?
Per Capita income in St Augustine is $42,903.
What is the Median Family Income in St Augustine?
Median Family Income in St Augustine is $100,652.
What is the Median Household income in St Augustine?
Median Household Income in St Augustine is $72,806.
What is Income or Wage Gap in St Augustine?
Income or Wage Gap in St Augustine is 20.5%.
Women in St Augustine earn 79.5 cents for every dollar earned by a man.
What is Inequality or Gini Index in St Augustine?
Inequality or Gini Index in St Augustine is 0.47.
How Large is the Labor Force in St Augustine?
There are 7,597 People in the Labor Forcein in St Augustine.
What is the Percentage of People in the Labor Force in St Augustine?
55.3% of People are in the Labor Force in St Augustine.
What is the Unemployment Rate in St Augustine?
Unemployment Rate in St Augustine is 3.2%.