Immigrants from Sierra Leone vs Native/Alaskan Community Comparison
COMPARE
Immigrants from Sierra Leone
Native/Alaskan
Social Comparison
Social Comparison
Immigrants from Sierra Leone
Natives/Alaskans
4,606
SOCIAL INDEX
43.6/ 100
SOCIAL RATING
197th/ 347
SOCIAL RANK
1,140
SOCIAL INDEX
9.0/ 100
SOCIAL RATING
321st/ 347
SOCIAL RANK
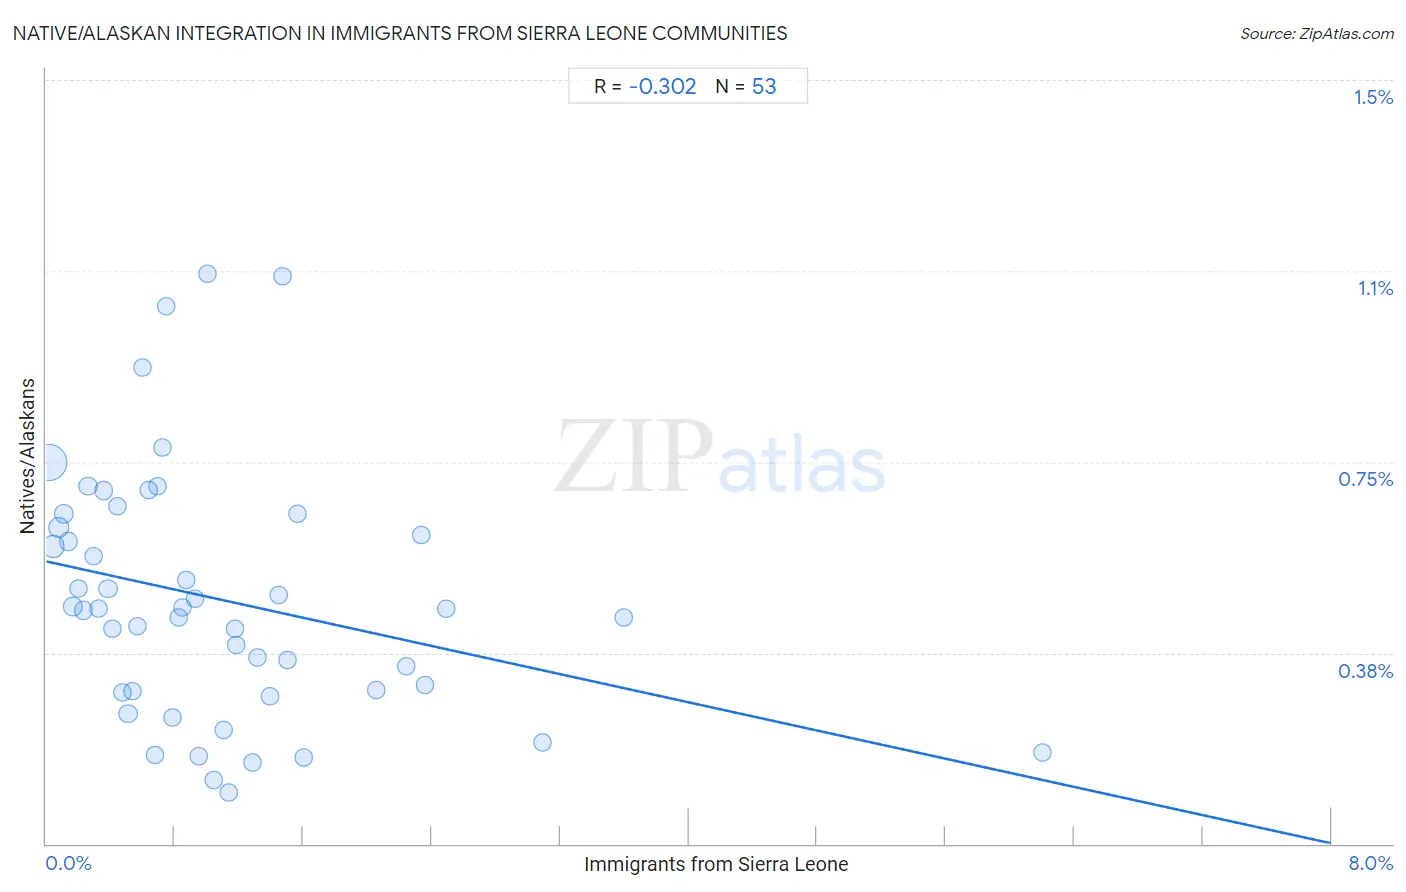
Native/Alaskan Integration in Immigrants from Sierra Leone Communities
The statistical analysis conducted on geographies consisting of 99,886,460 people shows a mild negative correlation between the proportion of Natives/Alaskans within Immigrant from Sierra Leone communities in the United States with a correlation coefficient (R) of -0.302. On average, for every 1% (one percent) increase in Immigrants from Sierra Leone within a typical geography, there is a decrease of 0.069% in Natives/Alaskans. To illustrate, in a geography comprising of 100,000 individuals, a rise of 1,000 Immigrants from Sierra Leone corresponds to a decrease of 69.2 Natives/Alaskans.
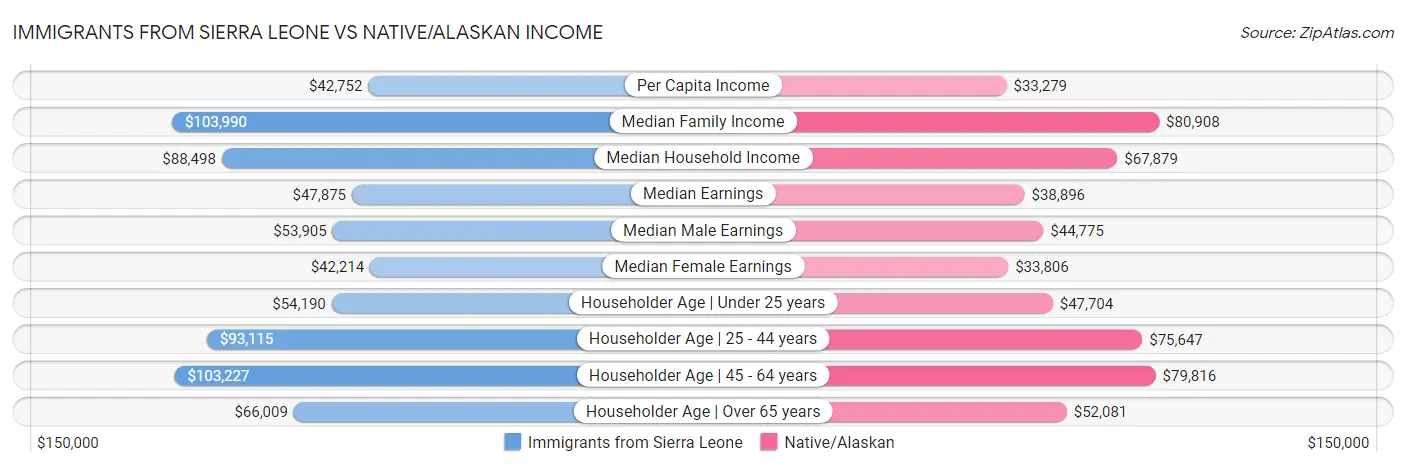
Immigrants from Sierra Leone vs Native/Alaskan Income
When considering income, the most significant differences between Immigrants from Sierra Leone and Native/Alaskan communities in the United States are seen in median household income ($88,498 compared to $67,879, a difference of 30.4%), householder income ages 45 - 64 years ($103,227 compared to $79,816, a difference of 29.3%), and median family income ($103,990 compared to $80,908, a difference of 28.5%). Conversely, both communities are more comparable in terms of householder income under 25 years ($54,190 compared to $47,704, a difference of 13.6%), wage/income gap (21.4% compared to 24.6%, a difference of 14.6%), and median male earnings ($53,905 compared to $44,775, a difference of 20.4%).
| Income Metric | Immigrants from Sierra Leone | Native/Alaskan |
| Per Capita Income | Fair $42,752 | Tragic $33,279 |
| Median Family Income | Good $103,990 | Tragic $80,908 |
| Median Household Income | Excellent $88,498 | Tragic $67,879 |
| Median Earnings | Excellent $47,875 | Tragic $38,896 |
| Median Male Earnings | Fair $53,905 | Tragic $44,775 |
| Median Female Earnings | Exceptional $42,214 | Tragic $33,806 |
| Householder Age | Under 25 years | Exceptional $54,190 | Tragic $47,704 |
| Householder Age | 25 - 44 years | Fair $93,115 | Tragic $75,647 |
| Householder Age | 45 - 64 years | Excellent $103,227 | Tragic $79,816 |
| Householder Age | Over 65 years | Exceptional $66,009 | Tragic $52,081 |
| Wage/Income Gap | Exceptional 21.4% | Exceptional 24.6% |
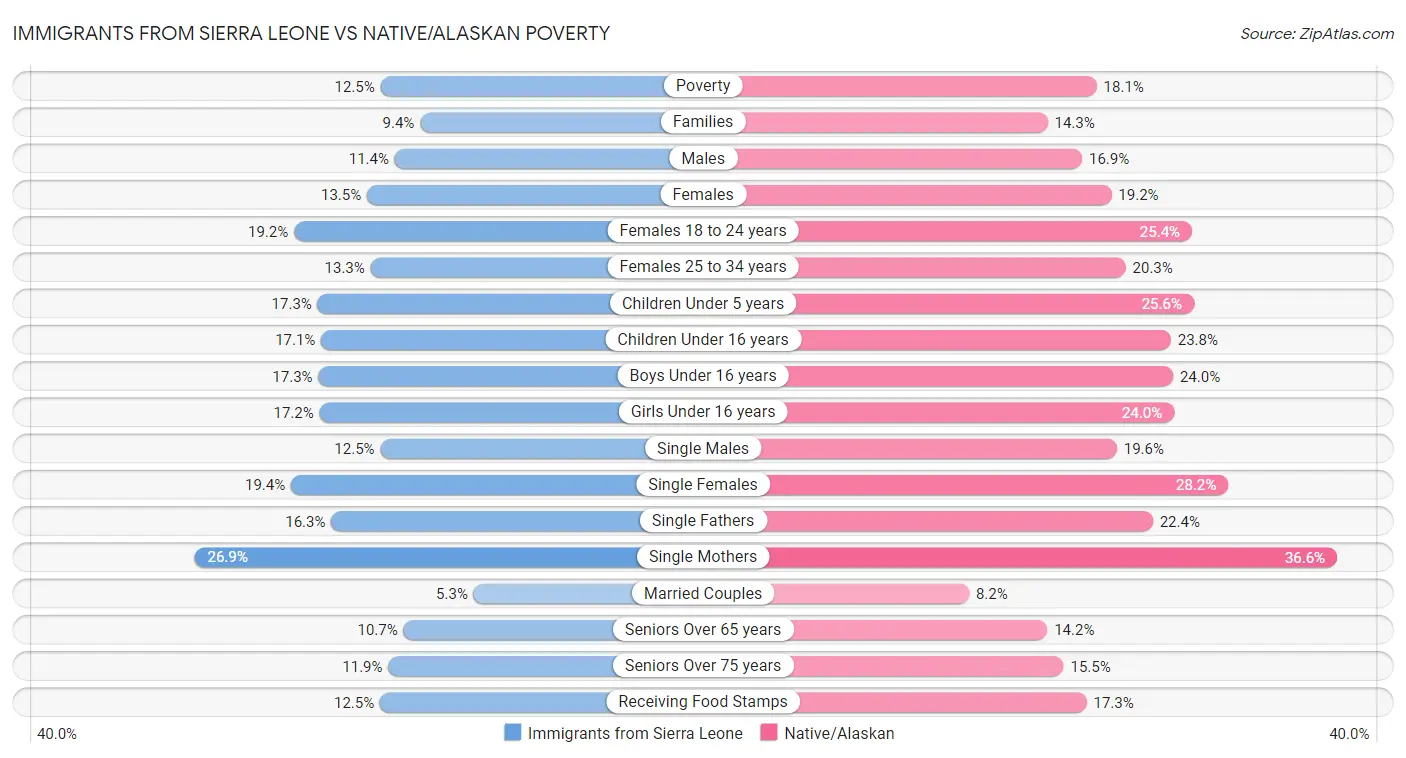
Immigrants from Sierra Leone vs Native/Alaskan Poverty
When considering poverty, the most significant differences between Immigrants from Sierra Leone and Native/Alaskan communities in the United States are seen in single male poverty (12.5% compared to 19.6%, a difference of 56.9%), married-couple family poverty (5.3% compared to 8.2%, a difference of 55.0%), and female poverty among 25-34 year olds (13.3% compared to 20.3%, a difference of 53.1%). Conversely, both communities are more comparable in terms of seniors poverty over the age of 75 (11.9% compared to 15.5%, a difference of 30.4%), female poverty among 18-24 year olds (19.2% compared to 25.4%, a difference of 32.6%), and seniors poverty over the age of 65 (10.7% compared to 14.2%, a difference of 32.9%).
| Poverty Metric | Immigrants from Sierra Leone | Native/Alaskan |
| Poverty | Fair 12.5% | Tragic 18.1% |
| Families | Poor 9.4% | Tragic 14.3% |
| Males | Fair 11.4% | Tragic 16.9% |
| Females | Average 13.5% | Tragic 19.2% |
| Females 18 to 24 years | Exceptional 19.2% | Tragic 25.4% |
| Females 25 to 34 years | Good 13.3% | Tragic 20.3% |
| Children Under 5 years | Average 17.3% | Tragic 25.6% |
| Children Under 16 years | Poor 17.1% | Tragic 23.8% |
| Boys Under 16 years | Poor 17.3% | Tragic 24.0% |
| Girls Under 16 years | Poor 17.2% | Tragic 24.0% |
| Single Males | Excellent 12.5% | Tragic 19.6% |
| Single Females | Exceptional 19.4% | Tragic 28.2% |
| Single Fathers | Average 16.3% | Tragic 22.4% |
| Single Mothers | Exceptional 26.9% | Tragic 36.6% |
| Married Couples | Fair 5.3% | Tragic 8.2% |
| Seniors Over 65 years | Good 10.7% | Tragic 14.2% |
| Seniors Over 75 years | Good 11.9% | Tragic 15.5% |
| Receiving Food Stamps | Poor 12.5% | Tragic 17.3% |
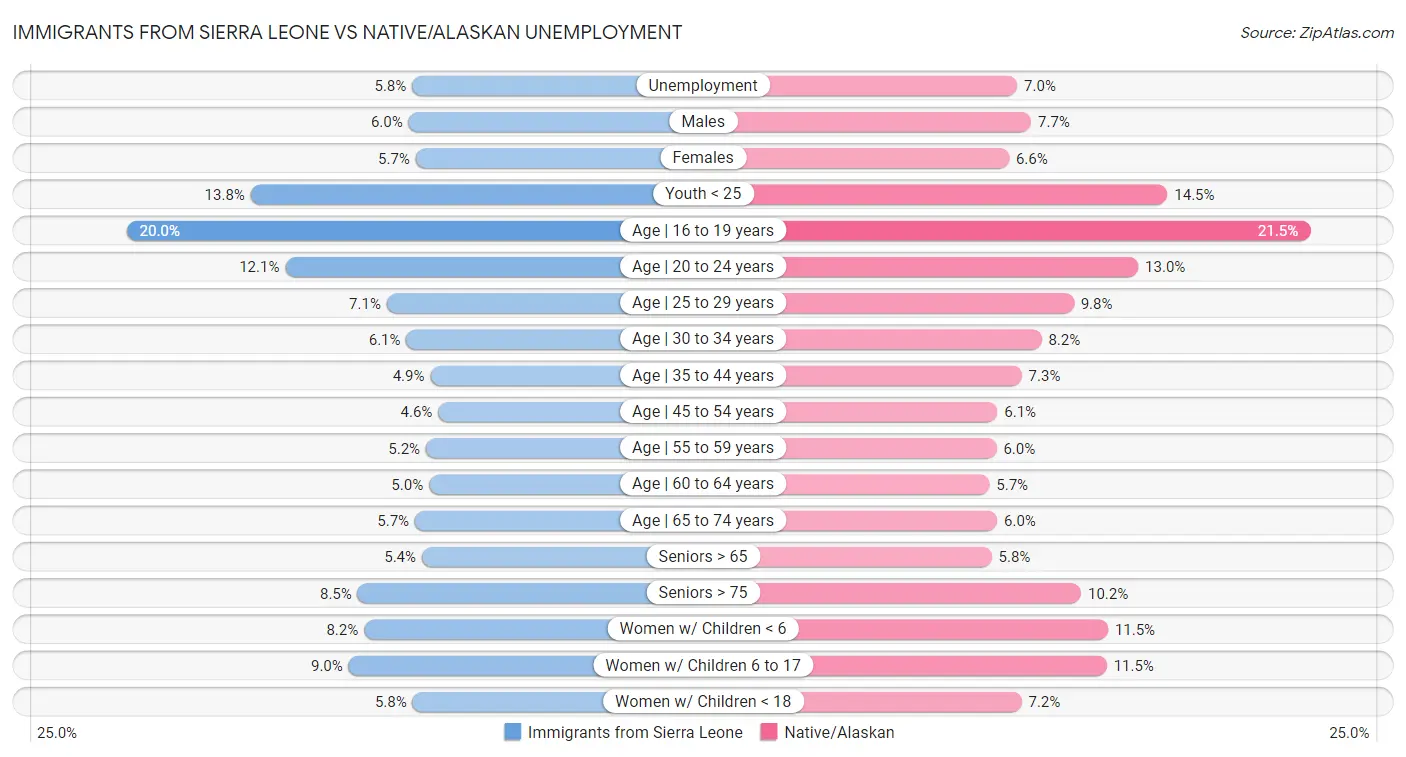
Immigrants from Sierra Leone vs Native/Alaskan Unemployment
When considering unemployment, the most significant differences between Immigrants from Sierra Leone and Native/Alaskan communities in the United States are seen in unemployment among ages 35 to 44 years (4.9% compared to 7.3%, a difference of 46.9%), unemployment among women with children under 6 years (8.2% compared to 11.5%, a difference of 40.2%), and unemployment among ages 25 to 29 years (7.1% compared to 9.8%, a difference of 38.5%). Conversely, both communities are more comparable in terms of unemployment among youth under 25 years (13.8% compared to 14.5%, a difference of 4.6%), unemployment among ages 65 to 74 years (5.7% compared to 6.0%, a difference of 6.0%), and unemployment among ages 20 to 24 years (12.1% compared to 13.0%, a difference of 7.4%).
| Unemployment Metric | Immigrants from Sierra Leone | Native/Alaskan |
| Unemployment | Tragic 5.8% | Tragic 7.0% |
| Males | Tragic 6.0% | Tragic 7.7% |
| Females | Tragic 5.7% | Tragic 6.6% |
| Youth < 25 | Tragic 13.8% | Tragic 14.5% |
| Age | 16 to 19 years | Tragic 20.0% | Tragic 21.5% |
| Age | 20 to 24 years | Tragic 12.1% | Tragic 13.0% |
| Age | 25 to 29 years | Tragic 7.1% | Tragic 9.8% |
| Age | 30 to 34 years | Tragic 6.1% | Tragic 8.2% |
| Age | 35 to 44 years | Tragic 4.9% | Tragic 7.3% |
| Age | 45 to 54 years | Fair 4.6% | Tragic 6.1% |
| Age | 55 to 59 years | Tragic 5.2% | Tragic 6.0% |
| Age | 60 to 64 years | Tragic 5.0% | Tragic 5.7% |
| Age | 65 to 74 years | Tragic 5.7% | Tragic 6.0% |
| Seniors > 65 | Tragic 5.4% | Tragic 5.8% |
| Seniors > 75 | Excellent 8.5% | Tragic 10.2% |
| Women w/ Children < 6 | Tragic 8.2% | Tragic 11.5% |
| Women w/ Children 6 to 17 | Average 9.0% | Tragic 11.5% |
| Women w/ Children < 18 | Tragic 5.8% | Tragic 7.2% |
Immigrants from Sierra Leone vs Native/Alaskan Labor Participation
When considering labor participation, the most significant differences between Immigrants from Sierra Leone and Native/Alaskan communities in the United States are seen in in labor force | age > 16 (68.5% compared to 60.6%, a difference of 13.0%), in labor force | age 20-64 (81.5% compared to 73.9%, a difference of 10.2%), and in labor force | age 45-54 (84.4% compared to 77.1%, a difference of 9.4%). Conversely, both communities are more comparable in terms of in labor force | age 16-19 (37.3% compared to 36.6%, a difference of 2.1%), in labor force | age 20-24 (75.8% compared to 72.4%, a difference of 4.6%), and in labor force | age 25-29 (85.7% compared to 79.3%, a difference of 8.1%).
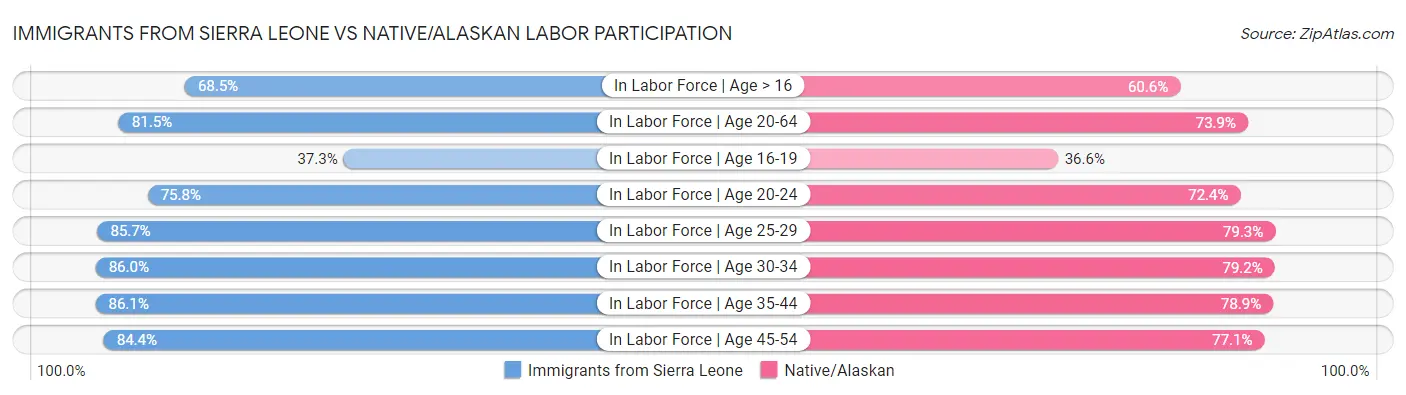
| Labor Participation Metric | Immigrants from Sierra Leone | Native/Alaskan |
| In Labor Force | Age > 16 | Exceptional 68.5% | Tragic 60.6% |
| In Labor Force | Age 20-64 | Exceptional 81.5% | Tragic 73.9% |
| In Labor Force | Age 16-19 | Excellent 37.3% | Average 36.6% |
| In Labor Force | Age 20-24 | Exceptional 75.8% | Tragic 72.4% |
| In Labor Force | Age 25-29 | Exceptional 85.7% | Tragic 79.3% |
| In Labor Force | Age 30-34 | Exceptional 86.0% | Tragic 79.2% |
| In Labor Force | Age 35-44 | Exceptional 86.1% | Tragic 78.9% |
| In Labor Force | Age 45-54 | Exceptional 84.4% | Tragic 77.1% |
Immigrants from Sierra Leone vs Native/Alaskan Family Structure
When considering family structure, the most significant differences between Immigrants from Sierra Leone and Native/Alaskan communities in the United States are seen in single father households (2.5% compared to 3.2%, a difference of 30.5%), births to unmarried women (34.2% compared to 43.0%, a difference of 25.5%), and divorced or separated (12.1% compared to 13.0%, a difference of 7.9%). Conversely, both communities are more comparable in terms of married-couple households (43.3% compared to 43.5%, a difference of 0.31%), currently married (43.8% compared to 42.8%, a difference of 2.3%), and family households (64.3% compared to 66.4%, a difference of 3.2%).
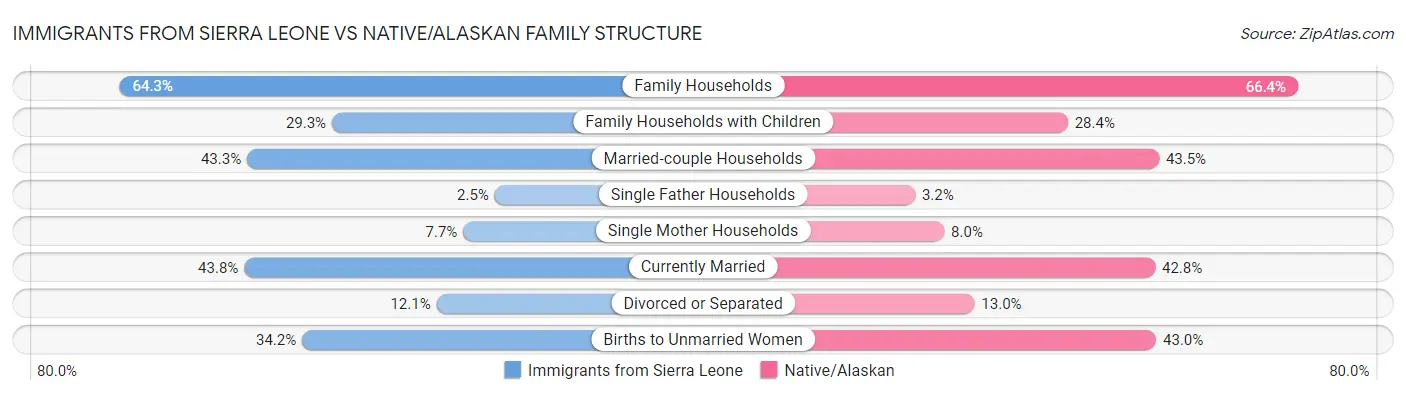
| Family Structure Metric | Immigrants from Sierra Leone | Native/Alaskan |
| Family Households | Average 64.3% | Exceptional 66.4% |
| Family Households with Children | Exceptional 29.3% | Exceptional 28.4% |
| Married-couple Households | Tragic 43.3% | Tragic 43.5% |
| Average Family Size | Exceptional 3.32 | Exceptional 3.45 |
| Single Father Households | Tragic 2.5% | Tragic 3.2% |
| Single Mother Households | Tragic 7.7% | Tragic 8.0% |
| Currently Married | Tragic 43.8% | Tragic 42.8% |
| Divorced or Separated | Average 12.1% | Tragic 13.0% |
| Births to Unmarried Women | Tragic 34.2% | Tragic 43.0% |
Immigrants from Sierra Leone vs Native/Alaskan Vehicle Availability
When considering vehicle availability, the most significant differences between Immigrants from Sierra Leone and Native/Alaskan communities in the United States are seen in 4 or more vehicles in household (6.1% compared to 8.2%, a difference of 34.1%), 3 or more vehicles in household (18.7% compared to 22.7%, a difference of 21.5%), and no vehicles in household (11.3% compared to 10.5%, a difference of 8.1%). Conversely, both communities are more comparable in terms of 1 or more vehicles in household (88.7% compared to 89.8%, a difference of 1.3%), 2 or more vehicles in household (53.2% compared to 57.0%, a difference of 7.0%), and no vehicles in household (11.3% compared to 10.5%, a difference of 8.1%).
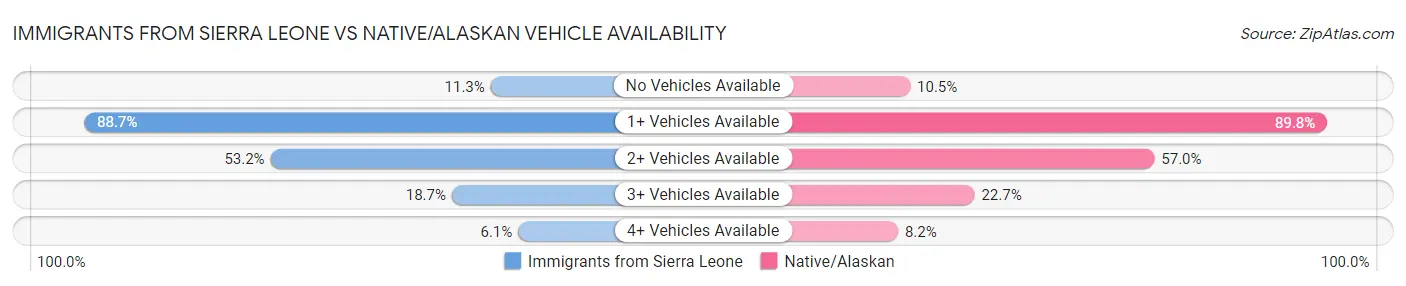
| Vehicle Availability Metric | Immigrants from Sierra Leone | Native/Alaskan |
| No Vehicles Available | Tragic 11.3% | Average 10.5% |
| 1+ Vehicles Available | Tragic 88.7% | Average 89.8% |
| 2+ Vehicles Available | Tragic 53.2% | Exceptional 57.0% |
| 3+ Vehicles Available | Poor 18.7% | Exceptional 22.7% |
| 4+ Vehicles Available | Fair 6.1% | Exceptional 8.2% |
Immigrants from Sierra Leone vs Native/Alaskan Education Level
When considering education level, the most significant differences between Immigrants from Sierra Leone and Native/Alaskan communities in the United States are seen in master's degree (16.3% compared to 9.9%, a difference of 64.1%), professional degree (4.5% compared to 3.0%, a difference of 51.0%), and doctorate degree (2.0% compared to 1.3%, a difference of 50.2%). Conversely, both communities are more comparable in terms of 8th grade (95.1% compared to 95.2%, a difference of 0.020%), 7th grade (95.5% compared to 95.6%, a difference of 0.12%), and 4th grade (97.0% compared to 97.4%, a difference of 0.40%).
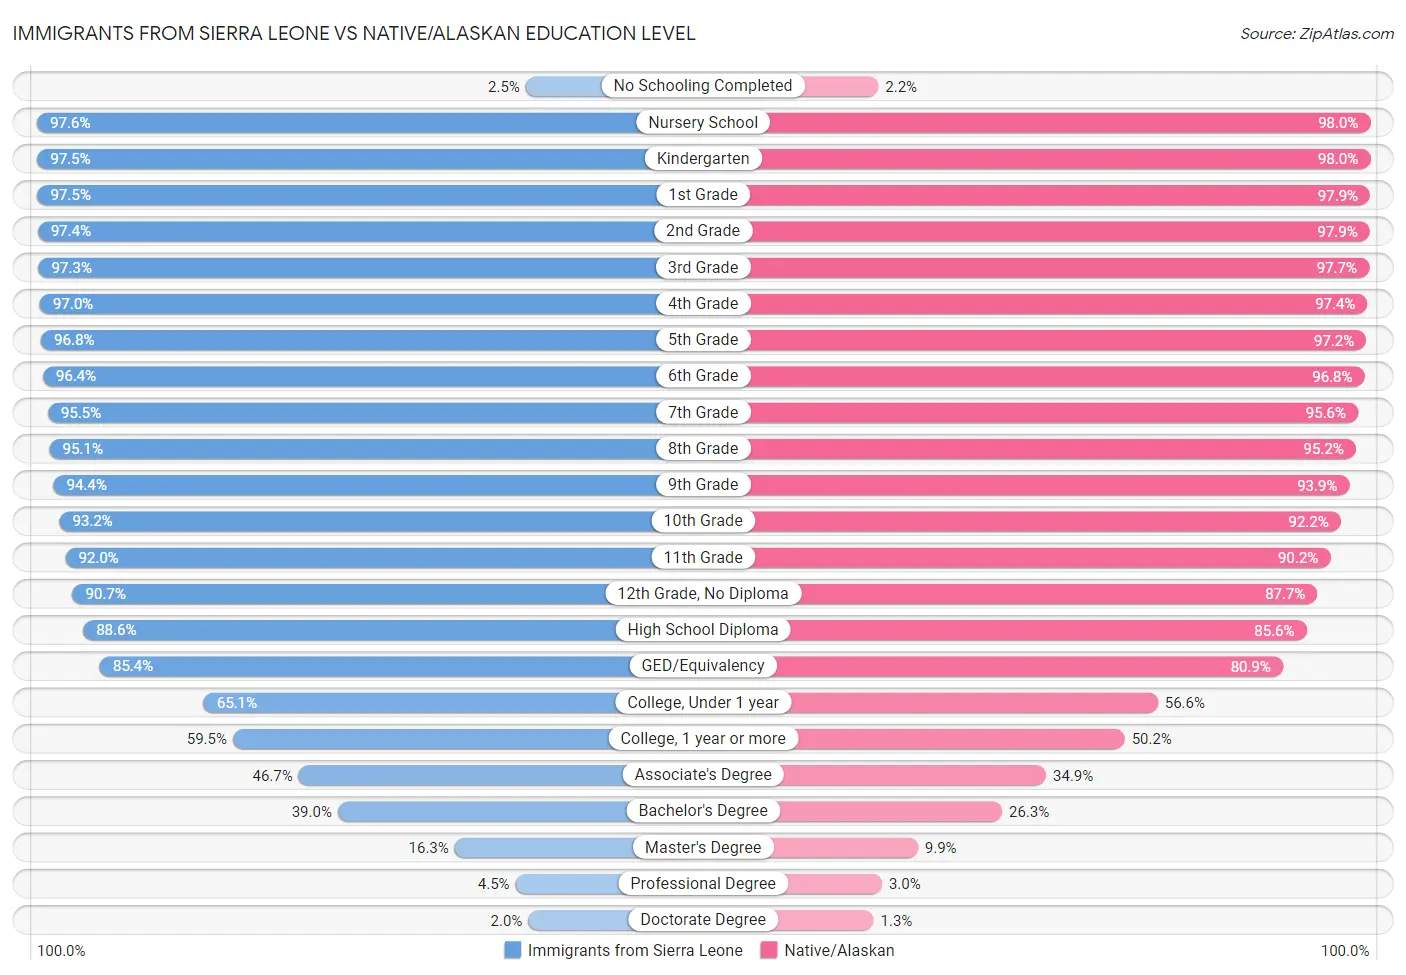
| Education Level Metric | Immigrants from Sierra Leone | Native/Alaskan |
| No Schooling Completed | Tragic 2.5% | Tragic 2.2% |
| Nursery School | Tragic 97.6% | Average 98.0% |
| Kindergarten | Tragic 97.5% | Average 98.0% |
| 1st Grade | Tragic 97.5% | Average 97.9% |
| 2nd Grade | Tragic 97.4% | Average 97.9% |
| 3rd Grade | Tragic 97.3% | Fair 97.7% |
| 4th Grade | Tragic 97.0% | Fair 97.4% |
| 5th Grade | Tragic 96.8% | Poor 97.2% |
| 6th Grade | Tragic 96.4% | Poor 96.8% |
| 7th Grade | Tragic 95.5% | Tragic 95.6% |
| 8th Grade | Tragic 95.1% | Tragic 95.2% |
| 9th Grade | Tragic 94.4% | Tragic 93.9% |
| 10th Grade | Tragic 93.2% | Tragic 92.2% |
| 11th Grade | Poor 92.0% | Tragic 90.2% |
| 12th Grade, No Diploma | Poor 90.7% | Tragic 87.7% |
| High School Diploma | Poor 88.6% | Tragic 85.6% |
| GED/Equivalency | Fair 85.4% | Tragic 80.9% |
| College, Under 1 year | Fair 65.1% | Tragic 56.6% |
| College, 1 year or more | Average 59.5% | Tragic 50.2% |
| Associate's Degree | Average 46.7% | Tragic 34.9% |
| Bachelor's Degree | Good 39.0% | Tragic 26.3% |
| Master's Degree | Exceptional 16.3% | Tragic 9.9% |
| Professional Degree | Average 4.5% | Tragic 3.0% |
| Doctorate Degree | Exceptional 2.0% | Tragic 1.3% |
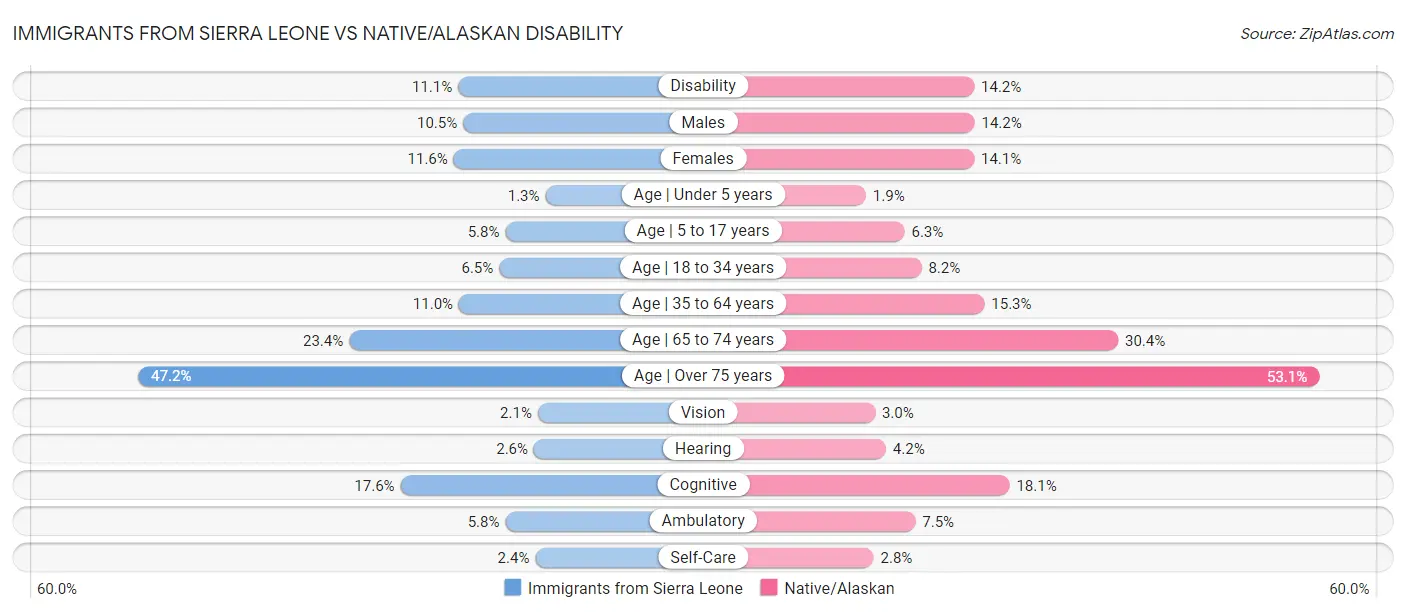
Immigrants from Sierra Leone vs Native/Alaskan Disability
When considering disability, the most significant differences between Immigrants from Sierra Leone and Native/Alaskan communities in the United States are seen in hearing disability (2.6% compared to 4.2%, a difference of 64.6%), disability age under 5 (1.3% compared to 1.9%, a difference of 54.7%), and vision disability (2.1% compared to 3.0%, a difference of 40.5%). Conversely, both communities are more comparable in terms of cognitive disability (17.6% compared to 18.1%, a difference of 3.0%), disability age 5 to 17 (5.8% compared to 6.3%, a difference of 9.1%), and disability age over 75 (47.2% compared to 53.1%, a difference of 12.4%).
| Disability Metric | Immigrants from Sierra Leone | Native/Alaskan |
| Disability | Exceptional 11.1% | Tragic 14.2% |
| Males | Exceptional 10.5% | Tragic 14.2% |
| Females | Exceptional 11.6% | Tragic 14.1% |
| Age | Under 5 years | Fair 1.3% | Tragic 1.9% |
| Age | 5 to 17 years | Tragic 5.8% | Tragic 6.3% |
| Age | 18 to 34 years | Good 6.5% | Tragic 8.2% |
| Age | 35 to 64 years | Good 11.0% | Tragic 15.3% |
| Age | 65 to 74 years | Average 23.4% | Tragic 30.4% |
| Age | Over 75 years | Good 47.2% | Tragic 53.1% |
| Vision | Excellent 2.1% | Tragic 3.0% |
| Hearing | Exceptional 2.6% | Tragic 4.2% |
| Cognitive | Tragic 17.6% | Tragic 18.1% |
| Ambulatory | Exceptional 5.8% | Tragic 7.5% |
| Self-Care | Exceptional 2.4% | Tragic 2.8% |