Cities with the Highest Percentage of Federal Government Employees in Kentucky
RELATED REPORTS & OPTIONS
Federal Government Employees
Kentucky
Compare Cities
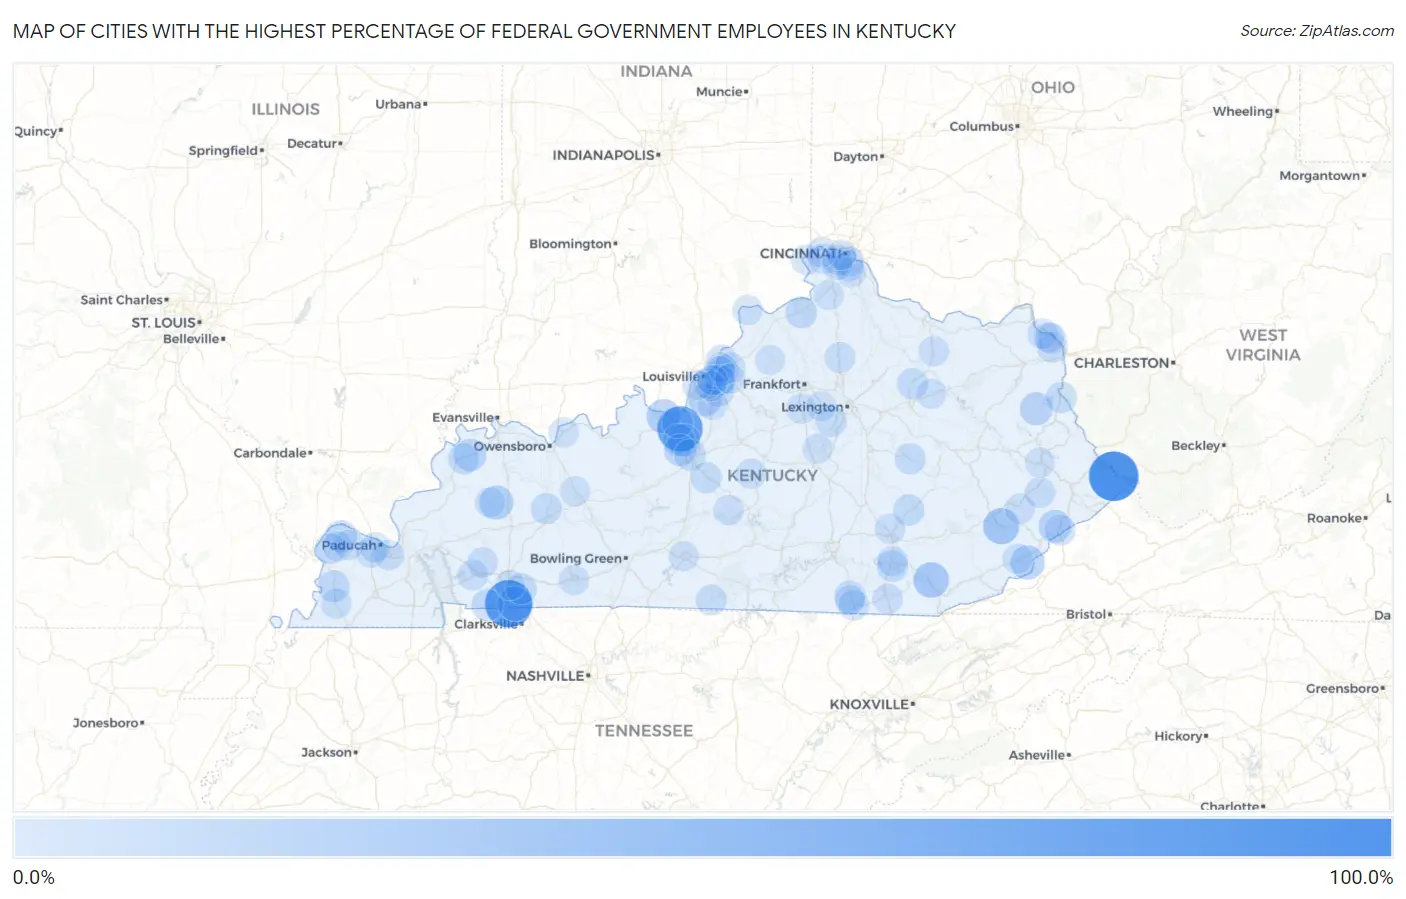
Map of Cities with the Highest Percentage of Federal Government Employees in Kentucky
0.0%
100.0%
Cities with the Highest Percentage of Federal Government Employees in Kentucky
| City | % Federal Government Employees | vs State | vs National | |
| 1. | Freeburn | 100.0% | 2.9%(+97.1)#1 | 3.4%(+96.6)#3 |
| 2. | Fort Campbell North | 89.1% | 2.9%(+86.1)#2 | 3.4%(+85.7)#37 |
| 3. | Fort Knox | 79.2% | 2.9%(+76.3)#3 | 3.4%(+75.9)#74 |
| 4. | Jeff | 31.9% | 2.9%(+29.0)#4 | 3.4%(+28.5)#365 |
| 5. | Flat Lick | 28.5% | 2.9%(+25.5)#5 | 3.4%(+25.1)#439 |
| 6. | Oak Grove | 25.6% | 2.9%(+22.7)#6 | 3.4%(+22.2)#537 |
| 7. | Doe Valley | 23.1% | 2.9%(+20.1)#7 | 3.4%(+19.7)#657 |
| 8. | Lynch | 22.6% | 2.9%(+19.6)#8 | 3.4%(+19.2)#684 |
| 9. | Manitou | 21.6% | 2.9%(+18.7)#9 | 3.4%(+18.2)#749 |
| 10. | Blaine | 16.7% | 2.9%(+13.7)#10 | 3.4%(+13.3)#1,101 |
| 11. | Mcroberts | 16.3% | 2.9%(+13.4)#11 | 3.4%(+12.9)#1,139 |
| 12. | Hollyvilla | 15.4% | 2.9%(+12.5)#12 | 3.4%(+12.0)#1,245 |
| 13. | Radcliff | 15.2% | 2.9%(+12.3)#13 | 3.4%(+11.8)#1,270 |
| 14. | Vine Grove | 14.3% | 2.9%(+11.4)#14 | 3.4%(+10.9)#1,372 |
| 15. | Waverly | 14.3% | 2.9%(+11.4)#15 | 3.4%(+10.9)#1,375 |
| 16. | Knottsville | 12.2% | 2.9%(+9.29)#16 | 3.4%(+8.84)#1,714 |
| 17. | Bandana | 11.8% | 2.9%(+8.83)#17 | 3.4%(+8.39)#1,800 |
| 18. | Lafayette | 11.6% | 2.9%(+8.67)#18 | 3.4%(+8.23)#1,841 |
| 19. | Rineyville | 11.4% | 2.9%(+8.50)#19 | 3.4%(+8.05)#1,872 |
| 20. | Arlington | 10.9% | 2.9%(+7.94)#20 | 3.4%(+7.49)#1,993 |
| 21. | Sparta | 10.5% | 2.9%(+7.59)#21 | 3.4%(+7.15)#2,073 |
| 22. | Elizabethtown | 10.2% | 2.9%(+7.26)#22 | 3.4%(+6.82)#2,161 |
| 23. | Corbin | 9.6% | 2.9%(+6.72)#23 | 3.4%(+6.27)#2,294 |
| 24. | Annville | 9.1% | 2.9%(+6.19)#24 | 3.4%(+5.74)#2,477 |
| 25. | Breckinridge Center | 9.1% | 2.9%(+6.13)#25 | 3.4%(+5.68)#2,510 |
| 26. | Louisa | 8.8% | 2.9%(+5.88)#26 | 3.4%(+5.43)#2,587 |
| 27. | Whitley City | 8.8% | 2.9%(+5.87)#27 | 3.4%(+5.43)#2,590 |
| 28. | Hodgenville | 8.6% | 2.9%(+5.69)#28 | 3.4%(+5.25)#2,664 |
| 29. | Keene | 8.6% | 2.9%(+5.68)#29 | 3.4%(+5.23)#2,670 |
| 30. | Muldraugh | 8.5% | 2.9%(+5.57)#30 | 3.4%(+5.12)#2,702 |
| 31. | Sharpsburg | 7.9% | 2.9%(+5.01)#31 | 3.4%(+4.57)#2,931 |
| 32. | South Carrollton | 7.8% | 2.9%(+4.91)#32 | 3.4%(+4.47)#2,971 |
| 33. | Pembroke | 7.4% | 2.9%(+4.51)#33 | 3.4%(+4.07)#3,152 |
| 34. | Cambridge | 7.4% | 2.9%(+4.48)#34 | 3.4%(+4.03)#3,169 |
| 35. | Ravenna | 7.3% | 2.9%(+4.33)#35 | 3.4%(+3.88)#3,244 |
| 36. | Jenkins | 7.1% | 2.9%(+4.14)#36 | 3.4%(+3.70)#3,340 |
| 37. | Pine Knot | 6.7% | 2.9%(+3.72)#37 | 3.4%(+3.27)#3,592 |
| 38. | Sadieville | 6.5% | 2.9%(+3.54)#38 | 3.4%(+3.09)#3,691 |
| 39. | Hollow Creek | 6.4% | 2.9%(+3.46)#39 | 3.4%(+3.02)#3,734 |
| 40. | Tompkinsville | 6.2% | 2.9%(+3.31)#40 | 3.4%(+2.87)#3,851 |
| 41. | Reidland | 6.1% | 2.9%(+3.16)#41 | 3.4%(+2.72)#3,959 |
| 42. | Wayland | 6.1% | 2.9%(+3.13)#42 | 3.4%(+2.68)#3,987 |
| 43. | Barlow | 5.7% | 2.9%(+2.78)#43 | 3.4%(+2.34)#4,271 |
| 44. | Cadiz | 5.6% | 2.9%(+2.68)#44 | 3.4%(+2.23)#4,360 |
| 45. | Russell | 5.5% | 2.9%(+2.53)#45 | 3.4%(+2.09)#4,487 |
| 46. | Summersville | 5.3% | 2.9%(+2.41)#46 | 3.4%(+1.97)#4,612 |
| 47. | Hebron | 5.3% | 2.9%(+2.32)#47 | 3.4%(+1.87)#4,703 |
| 48. | Strathmoor Village | 5.2% | 2.9%(+2.29)#48 | 3.4%(+1.85)#4,727 |
| 49. | Ironville | 5.2% | 2.9%(+2.29)#49 | 3.4%(+1.84)#4,731 |
| 50. | Flemingsburg | 5.2% | 2.9%(+2.26)#50 | 3.4%(+1.82)#4,751 |
| 51. | Emlyn | 5.2% | 2.9%(+2.25)#51 | 3.4%(+1.80)#4,771 |
| 52. | Massac | 5.1% | 2.9%(+2.21)#52 | 3.4%(+1.77)#4,810 |
| 53. | Cerulean | 5.0% | 2.9%(+2.09)#53 | 3.4%(+1.65)#4,942 |
| 54. | Wurtland | 4.9% | 2.9%(+1.96)#54 | 3.4%(+1.51)#5,088 |
| 55. | River Bluff | 4.8% | 2.9%(+1.88)#55 | 3.4%(+1.44)#5,173 |
| 56. | Wilder | 4.6% | 2.9%(+1.66)#56 | 3.4%(+1.21)#5,437 |
| 57. | Flatwoods | 4.6% | 2.9%(+1.66)#57 | 3.4%(+1.21)#5,440 |
| 58. | Coldstream | 4.4% | 2.9%(+1.48)#58 | 3.4%(+1.04)#5,668 |
| 59. | North Corbin | 4.4% | 2.9%(+1.45)#59 | 3.4%(+1.00)#5,718 |
| 60. | Hindman | 4.3% | 2.9%(+1.42)#60 | 3.4%(+0.970)#5,758 |
| 61. | Russellville | 4.3% | 2.9%(+1.35)#61 | 3.4%(+0.904)#5,866 |
| 62. | Clinton | 4.2% | 2.9%(+1.25)#62 | 3.4%(+0.801)#6,007 |
| 63. | Crescent Springs | 4.2% | 2.9%(+1.23)#63 | 3.4%(+0.785)#6,038 |
| 64. | Milton | 4.1% | 2.9%(+1.21)#64 | 3.4%(+0.762)#6,061 |
| 65. | Kevil | 4.1% | 2.9%(+1.14)#65 | 3.4%(+0.695)#6,190 |
| 66. | St Mary | 4.1% | 2.9%(+1.12)#66 | 3.4%(+0.676)#6,219 |
| 67. | East Bernstadt | 4.0% | 2.9%(+1.10)#67 | 3.4%(+0.652)#6,259 |
| 68. | Petersburg | 4.0% | 2.9%(+1.06)#68 | 3.4%(+0.611)#6,339 |
| 69. | Cumberland | 4.0% | 2.9%(+1.02)#69 | 3.4%(+0.574)#6,405 |
| 70. | Yelvington | 3.9% | 2.9%(+1.01)#70 | 3.4%(+0.563)#6,415 |
| 71. | Broeck Pointe | 3.9% | 2.9%(+1.00)#71 | 3.4%(+0.559)#6,420 |
| 72. | Paducah | 3.9% | 2.9%(+1.00)#72 | 3.4%(+0.555)#6,428 |
| 73. | Maceo | 3.9% | 2.9%(+0.932)#73 | 3.4%(+0.487)#6,527 |
| 74. | Nebo | 3.8% | 2.9%(+0.914)#74 | 3.4%(+0.468)#6,562 |
| 75. | St Regis Park | 3.8% | 2.9%(+0.904)#75 | 3.4%(+0.459)#6,583 |
| 76. | Hartford | 3.8% | 2.9%(+0.878)#76 | 3.4%(+0.433)#6,620 |
| 77. | Stearns | 3.8% | 2.9%(+0.862)#77 | 3.4%(+0.416)#6,658 |
| 78. | Green Spring | 3.8% | 2.9%(+0.856)#78 | 3.4%(+0.410)#6,666 |
| 79. | Prestonsburg | 3.8% | 2.9%(+0.839)#79 | 3.4%(+0.394)#6,697 |
| 80. | Hopkinsville | 3.8% | 2.9%(+0.839)#80 | 3.4%(+0.393)#6,698 |
| 81. | Hillview | 3.7% | 2.9%(+0.751)#81 | 3.4%(+0.305)#6,835 |
| 82. | Lawrenceburg | 3.7% | 2.9%(+0.748)#82 | 3.4%(+0.303)#6,839 |
| 83. | Old Brownsboro Place | 3.6% | 2.9%(+0.660)#83 | 3.4%(+0.215)#7,012 |
| 84. | Taylor Mill | 3.6% | 2.9%(+0.621)#84 | 3.4%(+0.176)#7,087 |
| 85. | Owingsville | 3.5% | 2.9%(+0.615)#85 | 3.4%(+0.169)#7,099 |
| 86. | Versailles | 3.5% | 2.9%(+0.568)#86 | 3.4%(+0.123)#7,180 |
| 87. | Glasgow | 3.5% | 2.9%(+0.561)#87 | 3.4%(+0.115)#7,195 |
| 88. | Audubon Park | 3.5% | 2.9%(+0.525)#88 | 3.4%(+0.079)#7,254 |
| 89. | Francisville | 3.4% | 2.9%(+0.512)#89 | 3.4%(+0.067)#7,289 |
| 90. | Watterson Park | 3.4% | 2.9%(+0.429)#90 | 3.4%(-0.016)#7,452 |
| 91. | Eminence | 3.3% | 2.9%(+0.398)#91 | 3.4%(-0.047)#7,526 |
| 92. | Ryland Heights | 3.3% | 2.9%(+0.364)#92 | 3.4%(-0.081)#7,593 |
| 93. | Erlanger | 3.2% | 2.9%(+0.297)#93 | 3.4%(-0.148)#7,756 |
| 94. | Seneca Gardens | 3.2% | 2.9%(+0.293)#94 | 3.4%(-0.152)#7,762 |
| 95. | Ludlow | 3.2% | 2.9%(+0.279)#95 | 3.4%(-0.167)#7,800 |
| 96. | Middletown | 3.2% | 2.9%(+0.277)#96 | 3.4%(-0.169)#7,806 |
| 97. | La Center | 3.2% | 2.9%(+0.271)#97 | 3.4%(-0.175)#7,819 |
| 98. | Verona | 3.2% | 2.9%(+0.259)#98 | 3.4%(-0.186)#7,851 |
| 99. | Burgin | 3.2% | 2.9%(+0.259)#99 | 3.4%(-0.186)#7,852 |
| 100. | Shively | 3.2% | 2.9%(+0.248)#100 | 3.4%(-0.198)#7,873 |
Common Questions
What are the Top 10 Cities with the Highest Percentage of Federal Government Employees in Kentucky?
Top 10 Cities with the Highest Percentage of Federal Government Employees in Kentucky are:
#1
100.0%
#2
89.1%
#3
79.2%
#4
31.9%
#5
28.5%
#6
25.6%
#7
23.1%
#8
22.6%
#9
21.6%
#10
16.7%
What city has the Highest Percentage of Federal Government Employees in Kentucky?
Freeburn has the Highest Percentage of Federal Government Employees in Kentucky with 100.0%.
What is the Percentage of Federal Government Employees in the State of Kentucky?
Percentage of Federal Government Employees in Kentucky is 2.9%.
What is the Percentage of Federal Government Employees in the United States?
Percentage of Federal Government Employees in the United States is 3.4%.