Sand Hill, PA
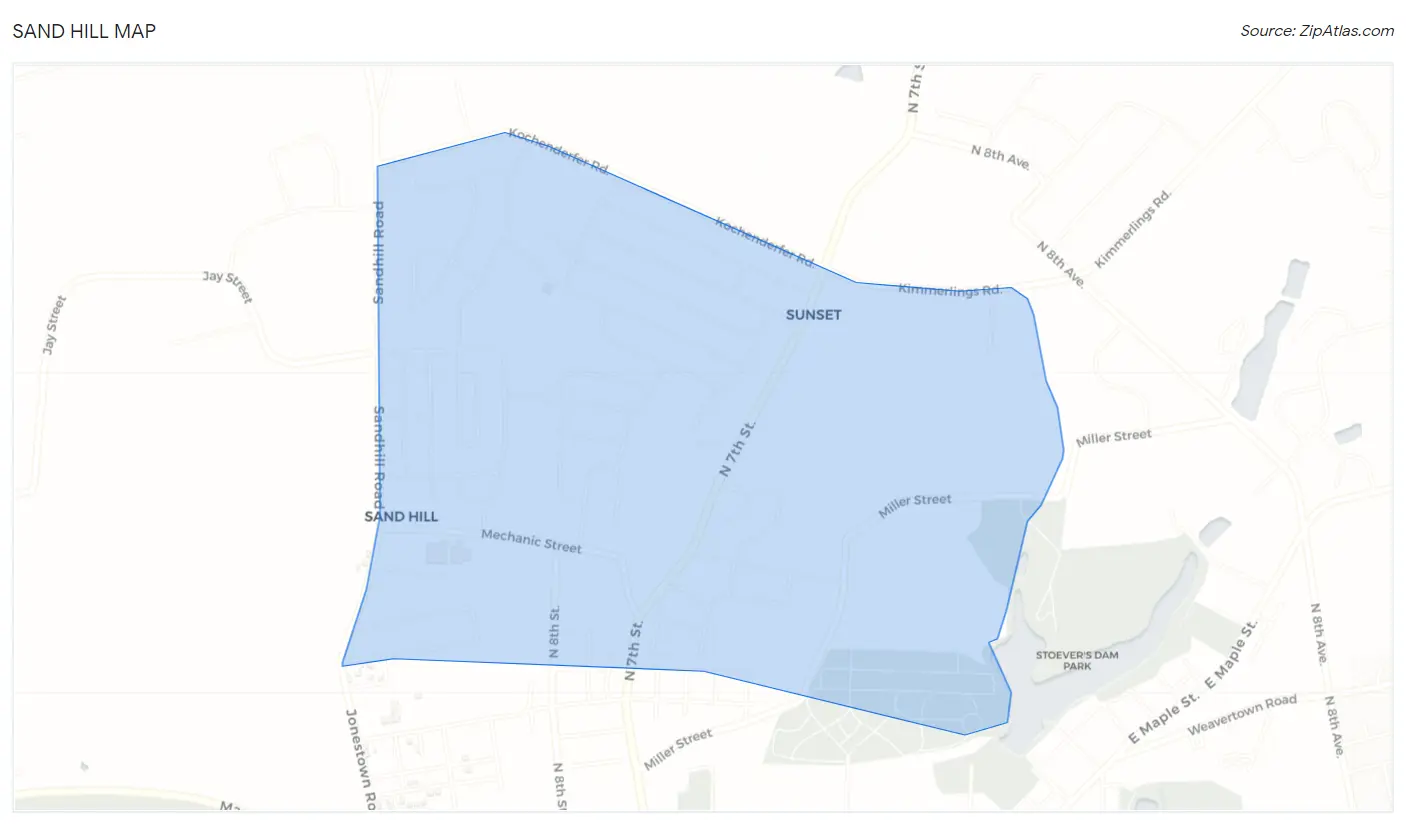
Sand Hill Map
Sand Hill Overview
2,526
TOTAL POPULATION
1,419
MALE POPULATION
1,107
FEMALE POPULATION
128.18
MALES / 100 FEMALES
78.01
FEMALES / 100 MALES
53.6
MEDIAN AGE
3.0
AVG FAMILY SIZE
2.4
AVG HOUSEHOLD SIZE
$40,562
PER CAPITA INCOME
$106,382
AVG FAMILY INCOME
$81,625
AVG HOUSEHOLD INCOME
8.6%
WAGE / INCOME GAP [ % ]
91.4¢/ $1
WAGE / INCOME GAP [ $ ]
0.39
INEQUALITY / GINI INDEX
1,495
LABOR FORCE [ PEOPLE ]
67.0%
PERCENT IN LABOR FORCE
1.7%
UNEMPLOYMENT RATE
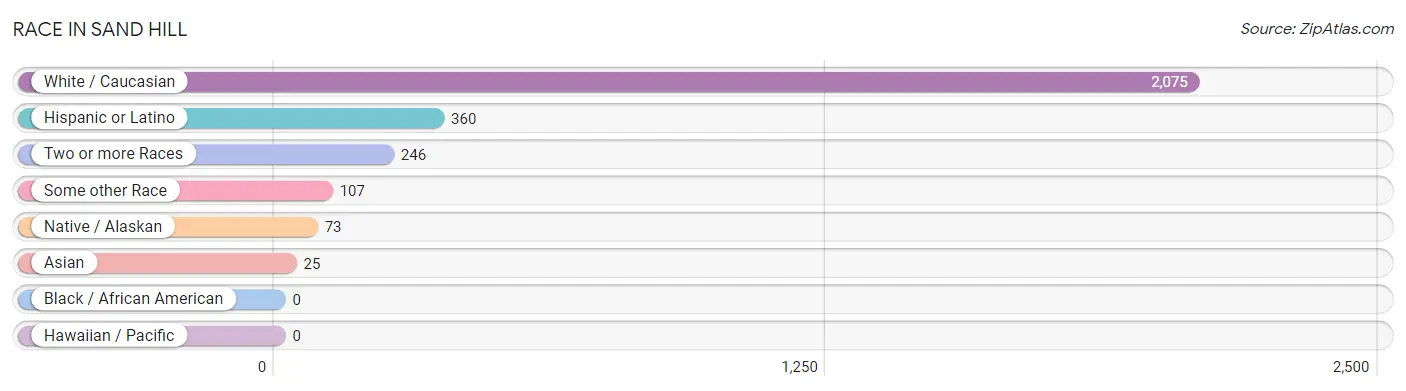
Race in Sand Hill
The most populous races in Sand Hill are White / Caucasian (2,075 | 82.2%), Hispanic or Latino (360 | 14.2%), and Two or more Races (246 | 9.7%).
| Race | # Population | % Population |
| Asian | 25 | 1.0% |
| Black / African American | 0 | 0.0% |
| Hawaiian / Pacific | 0 | 0.0% |
| Hispanic or Latino | 360 | 14.2% |
| Native / Alaskan | 73 | 2.9% |
| White / Caucasian | 2,075 | 82.2% |
| Two or more Races | 246 | 9.7% |
| Some other Race | 107 | 4.2% |
| Total | 2,526 | 100.0% |
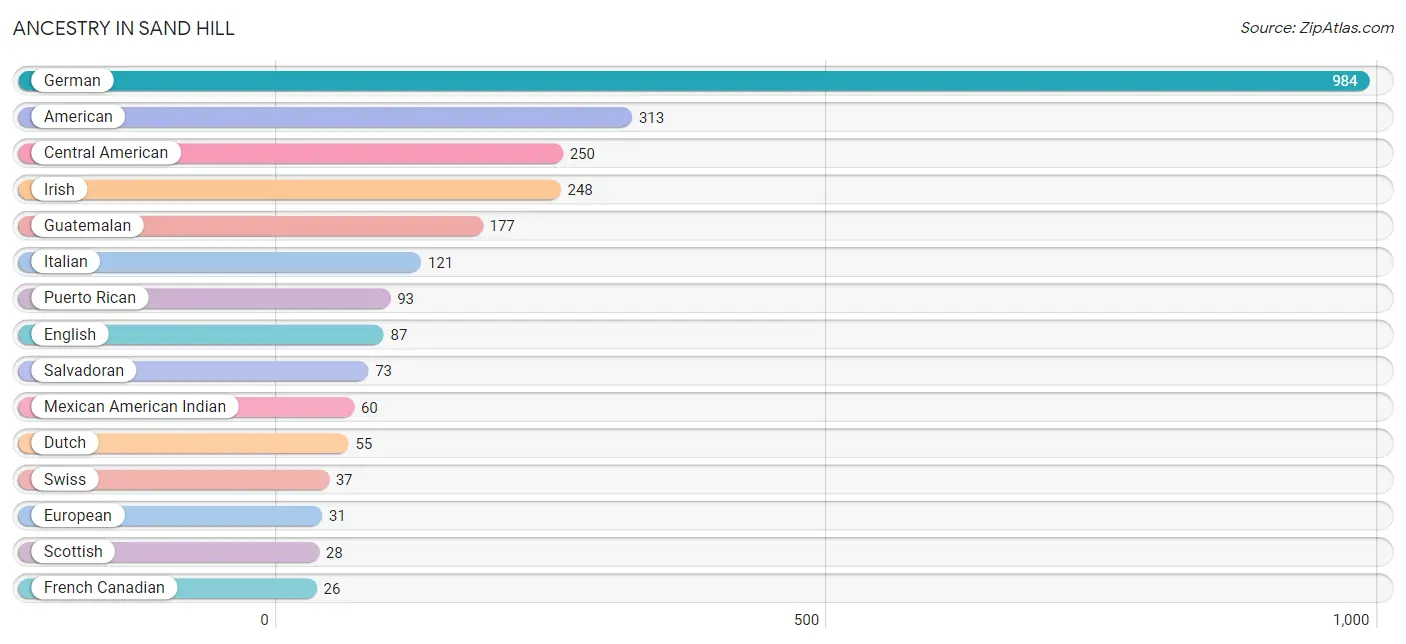
Ancestry in Sand Hill
The most populous ancestries reported in Sand Hill are German (984 | 39.0%), American (313 | 12.4%), Central American (250 | 9.9%), Irish (248 | 9.8%), and Guatemalan (177 | 7.0%), together accounting for 78.1% of all Sand Hill residents.
| Ancestry | # Population | % Population |
| American | 313 | 12.4% |
| Central American | 250 | 9.9% |
| Czechoslovakian | 19 | 0.7% |
| Dominican | 17 | 0.7% |
| Dutch | 55 | 2.2% |
| English | 87 | 3.4% |
| European | 31 | 1.2% |
| French Canadian | 26 | 1.0% |
| German | 984 | 39.0% |
| Guatemalan | 177 | 7.0% |
| Hungarian | 16 | 0.6% |
| Irish | 248 | 9.8% |
| Italian | 121 | 4.8% |
| Japanese | 25 | 1.0% |
| Mexican American Indian | 60 | 2.4% |
| Pennsylvania German | 15 | 0.6% |
| Polish | 25 | 1.0% |
| Puerto Rican | 93 | 3.7% |
| Salvadoran | 73 | 2.9% |
| Scottish | 28 | 1.1% |
| Swedish | 17 | 0.7% |
| Swiss | 37 | 1.5% |
| Ukrainian | 26 | 1.0% | View All 23 Rows |
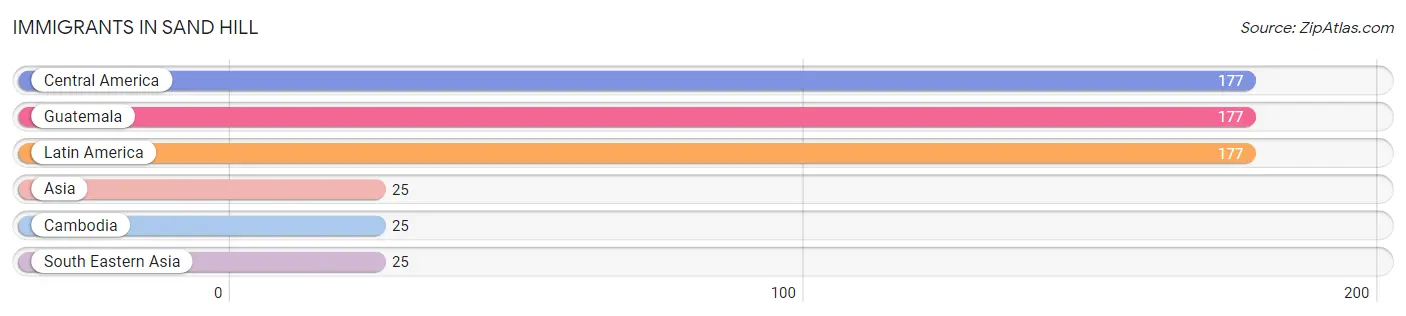
Immigrants in Sand Hill
The most numerous immigrant groups reported in Sand Hill came from Central America (177 | 7.0%), Guatemala (177 | 7.0%), Latin America (177 | 7.0%), Asia (25 | 1.0%), and Cambodia (25 | 1.0%), together accounting for 23.0% of all Sand Hill residents.
| Immigration Origin | # Population | % Population |
| Asia | 25 | 1.0% |
| Cambodia | 25 | 1.0% |
| Central America | 177 | 7.0% |
| Guatemala | 177 | 7.0% |
| Latin America | 177 | 7.0% |
| South Eastern Asia | 25 | 1.0% | View All 6 Rows |
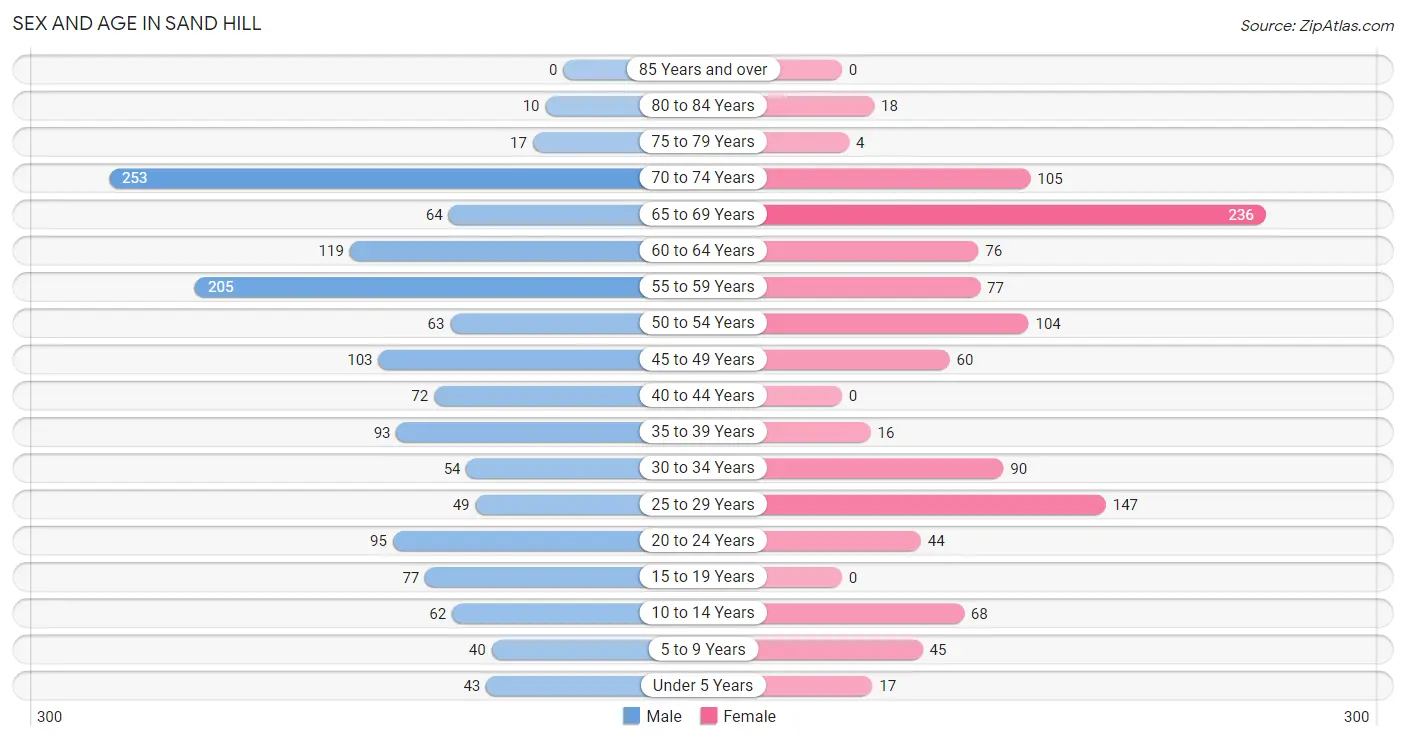
Sex and Age in Sand Hill
Sex and Age in Sand Hill
The most populous age groups in Sand Hill are 70 to 74 Years (253 | 17.8%) for men and 65 to 69 Years (236 | 21.3%) for women.
| Age Bracket | Male | Female |
| Under 5 Years | 43 (3.0%) | 17 (1.5%) |
| 5 to 9 Years | 40 (2.8%) | 45 (4.1%) |
| 10 to 14 Years | 62 (4.4%) | 68 (6.1%) |
| 15 to 19 Years | 77 (5.4%) | 0 (0.0%) |
| 20 to 24 Years | 95 (6.7%) | 44 (4.0%) |
| 25 to 29 Years | 49 (3.5%) | 147 (13.3%) |
| 30 to 34 Years | 54 (3.8%) | 90 (8.1%) |
| 35 to 39 Years | 93 (6.6%) | 16 (1.5%) |
| 40 to 44 Years | 72 (5.1%) | 0 (0.0%) |
| 45 to 49 Years | 103 (7.3%) | 60 (5.4%) |
| 50 to 54 Years | 63 (4.4%) | 104 (9.4%) |
| 55 to 59 Years | 205 (14.4%) | 77 (7.0%) |
| 60 to 64 Years | 119 (8.4%) | 76 (6.9%) |
| 65 to 69 Years | 64 (4.5%) | 236 (21.3%) |
| 70 to 74 Years | 253 (17.8%) | 105 (9.5%) |
| 75 to 79 Years | 17 (1.2%) | 4 (0.4%) |
| 80 to 84 Years | 10 (0.7%) | 18 (1.6%) |
| 85 Years and over | 0 (0.0%) | 0 (0.0%) |
| Total | 1,419 (100.0%) | 1,107 (100.0%) |
Families and Households in Sand Hill
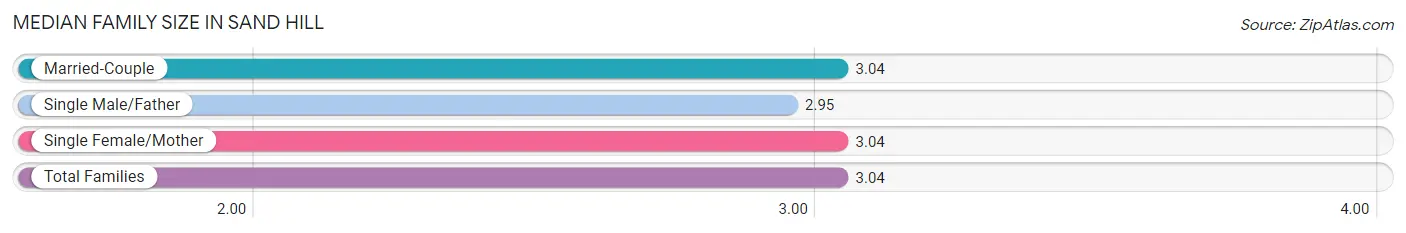
Median Family Size in Sand Hill
The median family size in Sand Hill is 3.04 persons per family, with married-couple families (639 | 91.0%) accounting for the largest median family size of 3.04 persons per family. On the other hand, single male/father families (40 | 5.7%) represent the smallest median family size with 2.95 persons per family.
| Family Type | # Families | Family Size |
| Married-Couple | 639 (91.0%) | 3.04 |
| Single Male/Father | 40 (5.7%) | 2.95 |
| Single Female/Mother | 23 (3.3%) | 3.04 |
| Total Families | 702 (100.0%) | 3.04 |
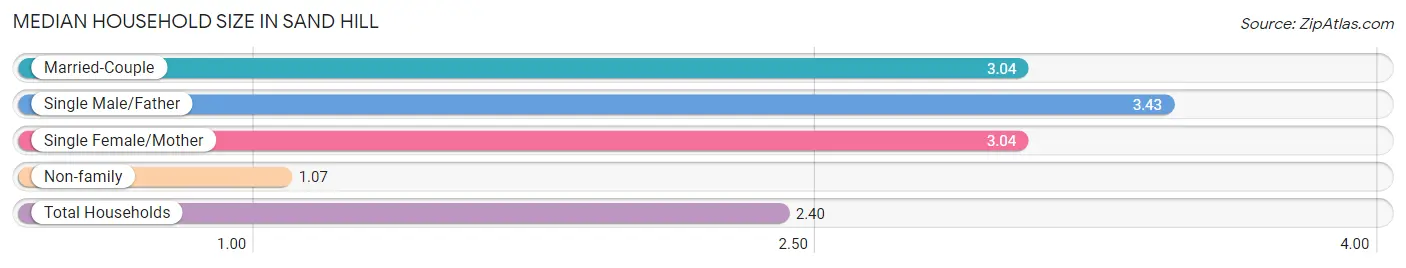
Median Household Size in Sand Hill
The median household size in Sand Hill is 2.40 persons per household, with single male/father households (40 | 3.8%) accounting for the largest median household size of 3.43 persons per household. non-family households (351 | 33.3%) represent the smallest median household size with 1.07 persons per household.
| Household Type | # Households | Household Size |
| Married-Couple | 639 (60.7%) | 3.04 |
| Single Male/Father | 40 (3.8%) | 3.43 |
| Single Female/Mother | 23 (2.2%) | 3.04 |
| Non-family | 351 (33.3%) | 1.07 |
| Total Households | 1,053 (100.0%) | 2.40 |
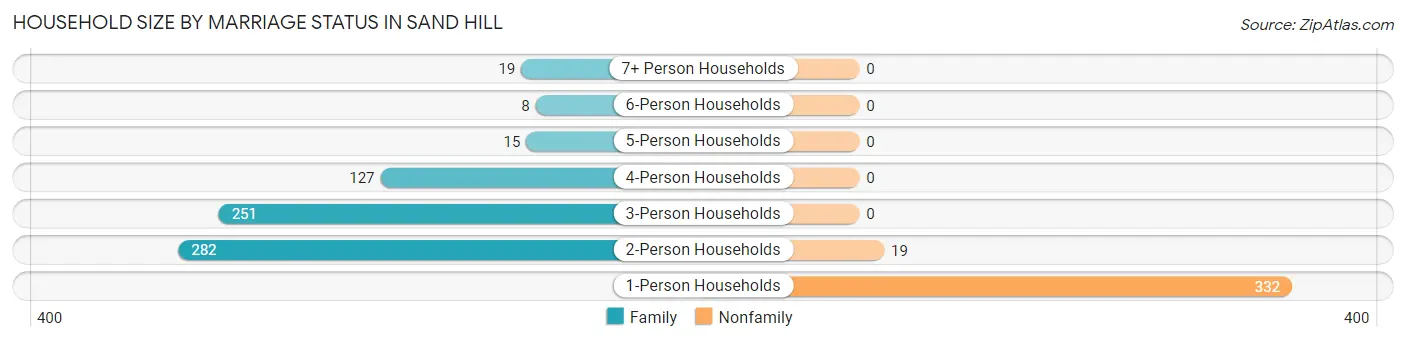
Household Size by Marriage Status in Sand Hill
Out of a total of 1,053 households in Sand Hill, 702 (66.7%) are family households, while 351 (33.3%) are nonfamily households. The most numerous type of family households are 2-person households, comprising 282, and the most common type of nonfamily households are 1-person households, comprising 332.
| Household Size | Family Households | Nonfamily Households |
| 1-Person Households | - | 332 (31.5%) |
| 2-Person Households | 282 (26.8%) | 19 (1.8%) |
| 3-Person Households | 251 (23.8%) | 0 (0.0%) |
| 4-Person Households | 127 (12.1%) | 0 (0.0%) |
| 5-Person Households | 15 (1.4%) | 0 (0.0%) |
| 6-Person Households | 8 (0.8%) | 0 (0.0%) |
| 7+ Person Households | 19 (1.8%) | 0 (0.0%) |
| Total | 702 (66.7%) | 351 (33.3%) |
Female Fertility in Sand Hill
Fertility by Age in Sand Hill
Average fertility rate in Sand Hill is 54.0 births per 1,000 women. Women in the age bracket of 20 to 34 years have the highest fertility rate with 71.0 births per 1,000 women. Women in the age bracket of 20 to 34 years acount for 100.0% of all women with births.
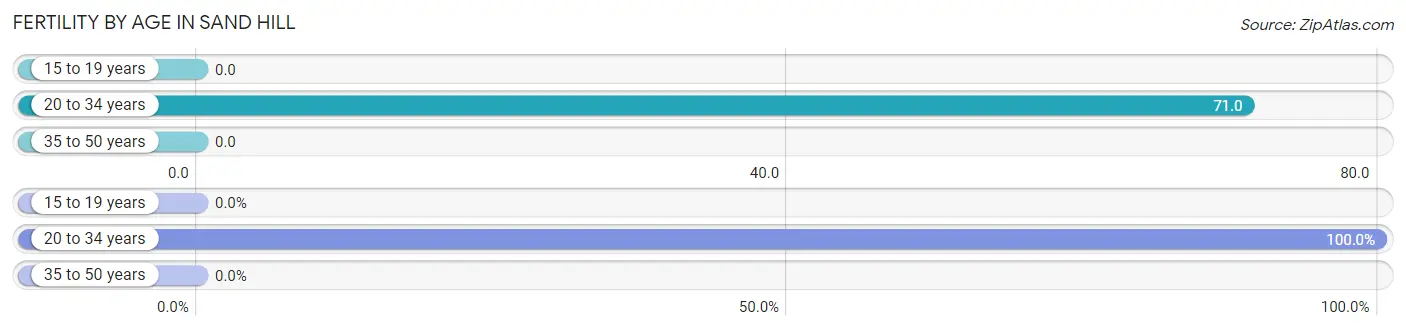
| Age Bracket | Women with Births | Births / 1,000 Women |
| 15 to 19 years | 0 (0.0%) | 0.0 |
| 20 to 34 years | 20 (100.0%) | 71.0 |
| 35 to 50 years | 0 (0.0%) | 0.0 |
| Total | 20 (100.0%) | 54.0 |
Fertility by Age by Marriage Status in Sand Hill
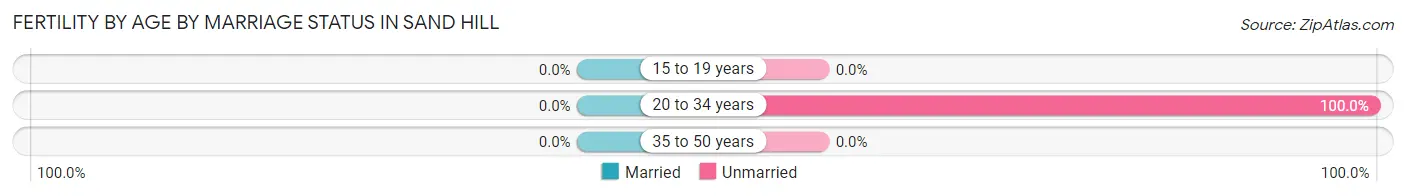
| Age Bracket | Married | Unmarried |
| 15 to 19 years | 0 (0.0%) | 0 (0.0%) |
| 20 to 34 years | 0 (0.0%) | 20 (100.0%) |
| 35 to 50 years | 0 (0.0%) | 0 (0.0%) |
| Total | 0 (0.0%) | 20 (100.0%) |
Fertility by Education in Sand Hill
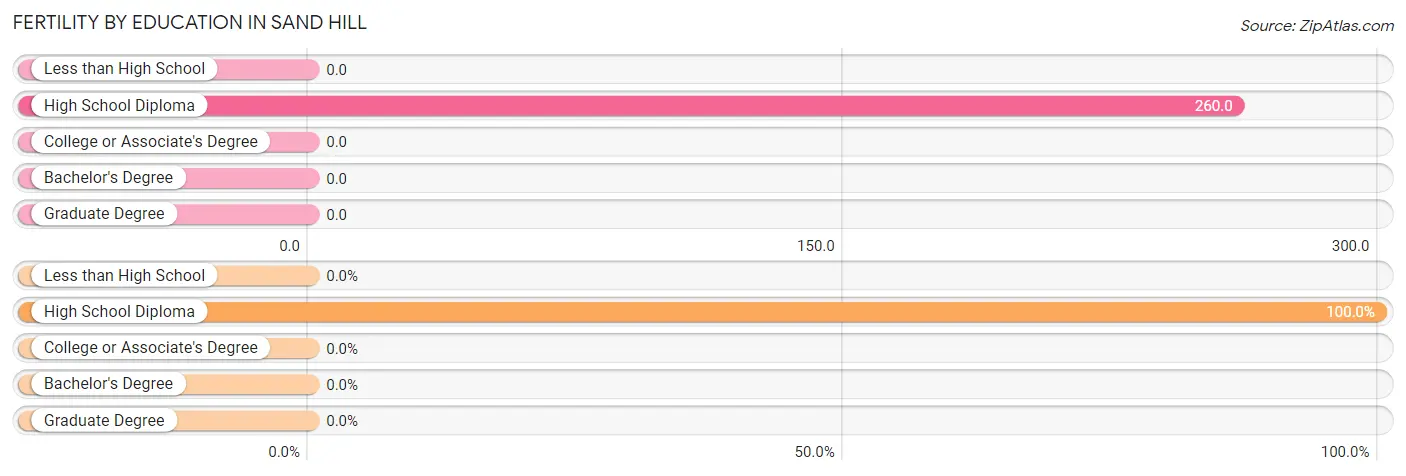
| Educational Attainment | Women with Births | Births / 1,000 Women |
| Less than High School | 0 (0.0%) | 0.0 |
| High School Diploma | 20 (100.0%) | 260.0 |
| College or Associate's Degree | 0 (0.0%) | 0.0 |
| Bachelor's Degree | 0 (0.0%) | 0.0 |
| Graduate Degree | 0 (0.0%) | 0.0 |
| Total | 20 (100.0%) | 54.0 |
Fertility by Education by Marriage Status in Sand Hill
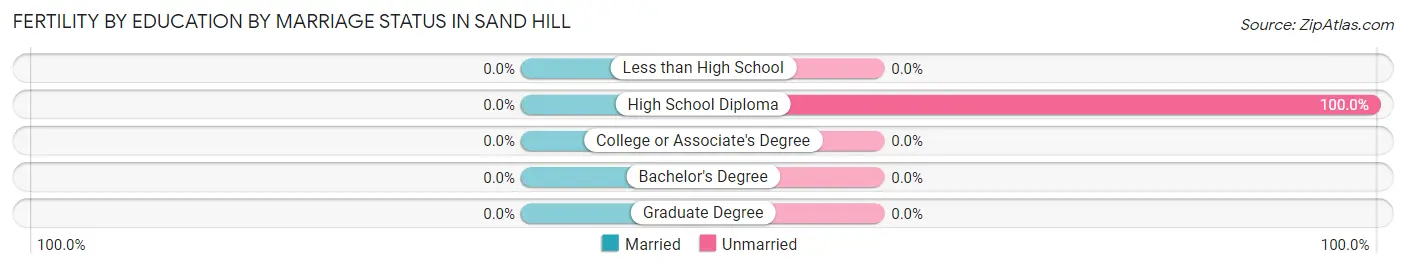
| Educational Attainment | Married | Unmarried |
| Less than High School | 0 (0.0%) | 0 (0.0%) |
| High School Diploma | 0 (0.0%) | 20 (100.0%) |
| College or Associate's Degree | 0 (0.0%) | 0 (0.0%) |
| Bachelor's Degree | 0 (0.0%) | 0 (0.0%) |
| Graduate Degree | 0 (0.0%) | 0 (0.0%) |
| Total | 0 (0.0%) | 20 (100.0%) |
Income in Sand Hill
Income Overview in Sand Hill
Per Capita Income in Sand Hill is $40,562, while median incomes of families and households are $106,382 and $81,625 respectively.
| Characteristic | Number | Measure |
| Per Capita Income | 2,526 | $40,562 |
| Median Family Income | 702 | $106,382 |
| Mean Family Income | 702 | $119,739 |
| Median Household Income | 1,053 | $81,625 |
| Mean Household Income | 1,053 | $95,043 |
| Income Deficit | 702 | $0 |
| Wage / Income Gap (%) | 2,526 | 8.62% |
| Wage / Income Gap ($) | 2,526 | 91.38¢ per $1 |
| Gini / Inequality Index | 2,526 | 0.39 |
Earnings by Sex in Sand Hill
Average Earnings in Sand Hill are $39,054, $39,848 for men and $36,412 for women, a difference of 8.6%.
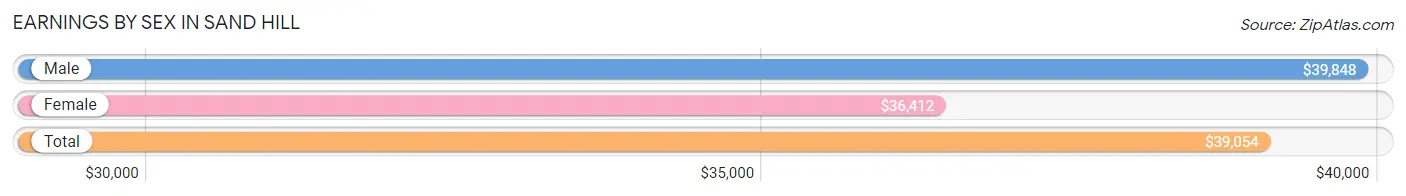
| Sex | Number | Average Earnings |
| Male | 951 (57.2%) | $39,848 |
| Female | 711 (42.8%) | $36,412 |
| Total | 1,662 (100.0%) | $39,054 |
Earnings by Sex by Income Bracket in Sand Hill
The most common earnings brackets in Sand Hill are $75,000 to $99,999 for men (169 | 17.8%) and $30,000 to $34,999 for women (174 | 24.5%).
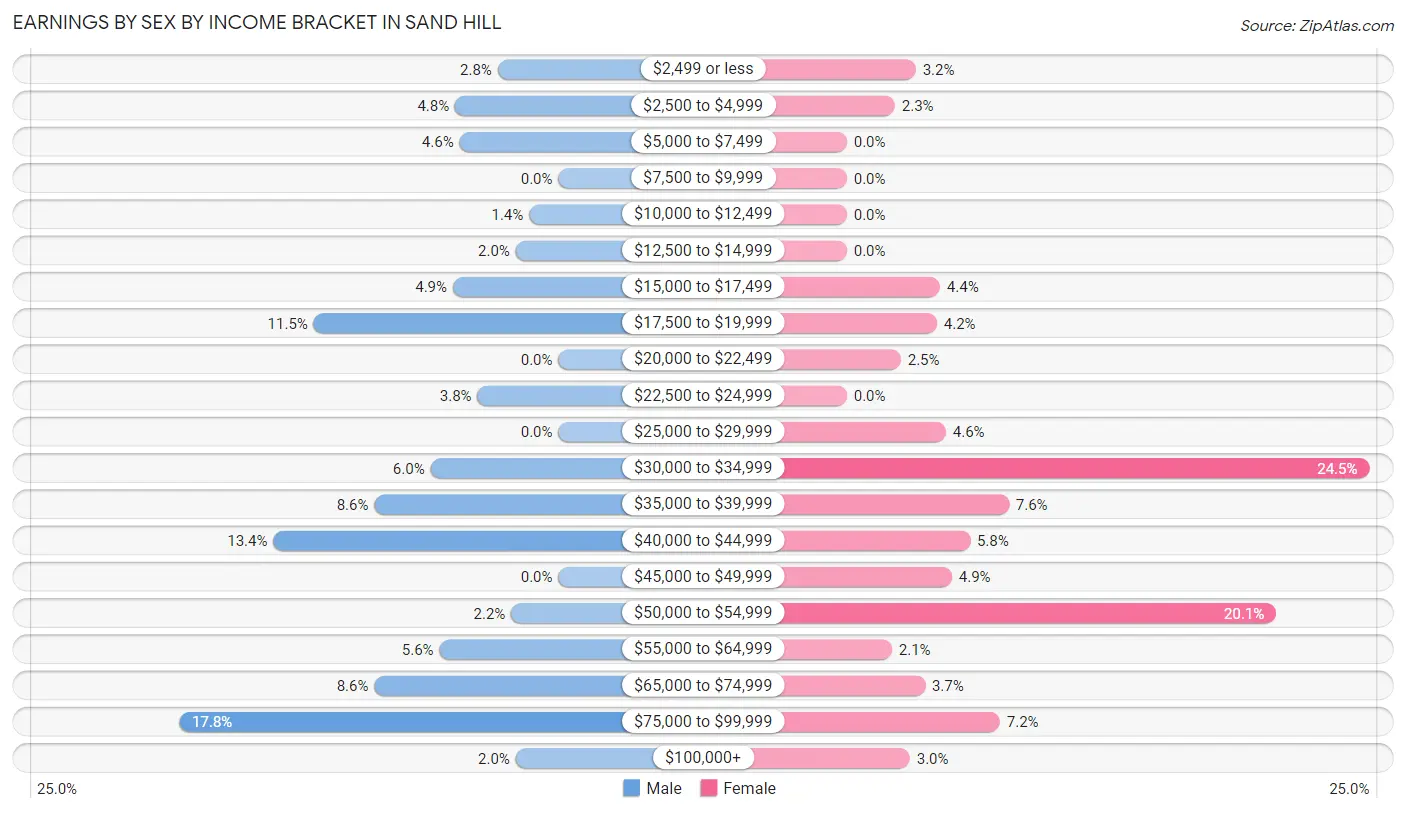
| Income | Male | Female |
| $2,499 or less | 27 (2.8%) | 23 (3.2%) |
| $2,500 to $4,999 | 46 (4.8%) | 16 (2.2%) |
| $5,000 to $7,499 | 44 (4.6%) | 0 (0.0%) |
| $7,500 to $9,999 | 0 (0.0%) | 0 (0.0%) |
| $10,000 to $12,499 | 13 (1.4%) | 0 (0.0%) |
| $12,500 to $14,999 | 19 (2.0%) | 0 (0.0%) |
| $15,000 to $17,499 | 47 (4.9%) | 31 (4.4%) |
| $17,500 to $19,999 | 109 (11.5%) | 30 (4.2%) |
| $20,000 to $22,499 | 0 (0.0%) | 18 (2.5%) |
| $22,500 to $24,999 | 36 (3.8%) | 0 (0.0%) |
| $25,000 to $29,999 | 0 (0.0%) | 33 (4.6%) |
| $30,000 to $34,999 | 57 (6.0%) | 174 (24.5%) |
| $35,000 to $39,999 | 82 (8.6%) | 54 (7.6%) |
| $40,000 to $44,999 | 127 (13.4%) | 41 (5.8%) |
| $45,000 to $49,999 | 0 (0.0%) | 35 (4.9%) |
| $50,000 to $54,999 | 21 (2.2%) | 143 (20.1%) |
| $55,000 to $64,999 | 53 (5.6%) | 15 (2.1%) |
| $65,000 to $74,999 | 82 (8.6%) | 26 (3.7%) |
| $75,000 to $99,999 | 169 (17.8%) | 51 (7.2%) |
| $100,000+ | 19 (2.0%) | 21 (2.9%) |
| Total | 951 (100.0%) | 711 (100.0%) |
Earnings by Sex by Educational Attainment in Sand Hill
Average earnings in Sand Hill are $40,893 for men and $37,431 for women, a difference of 8.5%. Men with an educational attainment of bachelor's degree enjoy the highest average annual earnings of $86,786, while those with less than high school education earn the least with $19,174. Women with an educational attainment of bachelor's degree earn the most with the average annual earnings of $51,378, while those with less than high school education have the smallest earnings of $17,750.
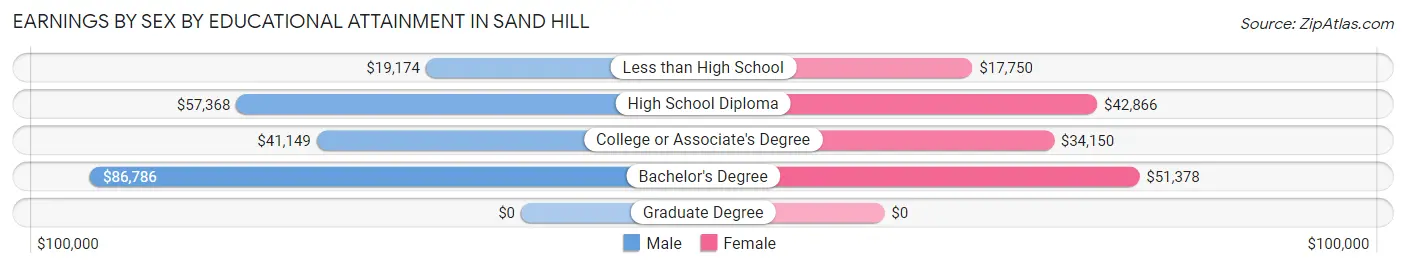
| Educational Attainment | Male Income | Female Income |
| Less than High School | $19,174 | $17,750 |
| High School Diploma | $57,368 | $42,866 |
| College or Associate's Degree | $41,149 | $34,150 |
| Bachelor's Degree | $86,786 | $51,378 |
| Graduate Degree | - | - |
| Total | $40,893 | $37,431 |
Family Income in Sand Hill
Family Income Brackets in Sand Hill
According to the Sand Hill family income data, there are 170 families falling into the $100,000 to $149,999 income range, which is the most common income bracket and makes up 24.2% of all families.
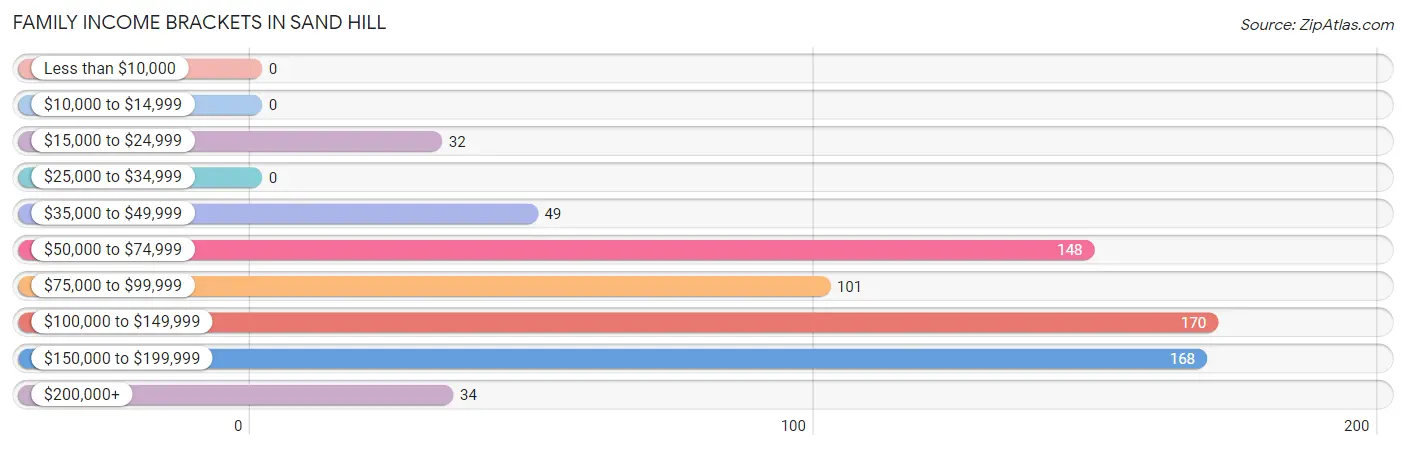
| Income Bracket | # Families | % Families |
| Less than $10,000 | 0 | 0.0% |
| $10,000 to $14,999 | 0 | 0.0% |
| $15,000 to $24,999 | 32 | 4.6% |
| $25,000 to $34,999 | 0 | 0.0% |
| $35,000 to $49,999 | 49 | 7.0% |
| $50,000 to $74,999 | 148 | 21.1% |
| $75,000 to $99,999 | 101 | 14.4% |
| $100,000 to $149,999 | 170 | 24.2% |
| $150,000 to $199,999 | 168 | 23.9% |
| $200,000+ | 34 | 4.8% |
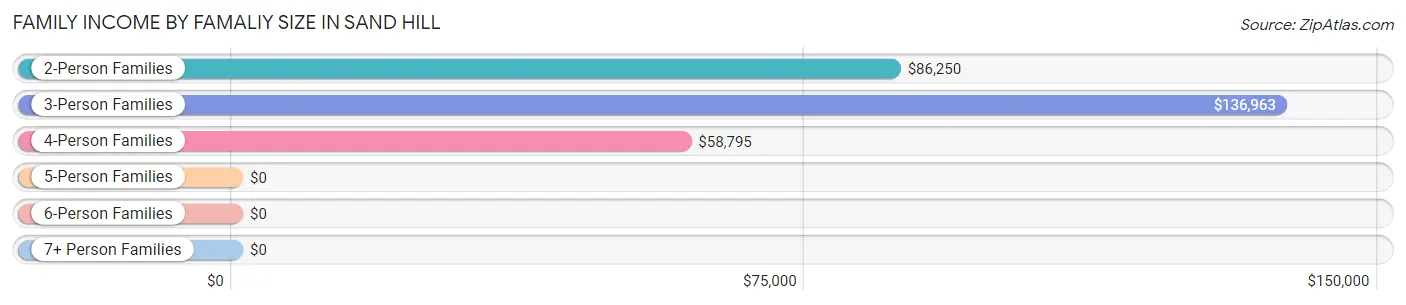
Family Income by Famaliy Size in Sand Hill
3-person families (233 | 33.2%) account for the highest median family income in Sand Hill with $136,963 per family, while 3-person families (233 | 33.2%) have the highest median income of $45,654 per family member.
| Income Bracket | # Families | Median Income |
| 2-Person Families | 300 (42.7%) | $86,250 |
| 3-Person Families | 233 (33.2%) | $136,963 |
| 4-Person Families | 127 (18.1%) | $58,795 |
| 5-Person Families | 15 (2.1%) | $0 |
| 6-Person Families | 8 (1.1%) | $0 |
| 7+ Person Families | 19 (2.7%) | $0 |
| Total | 702 (100.0%) | $106,382 |
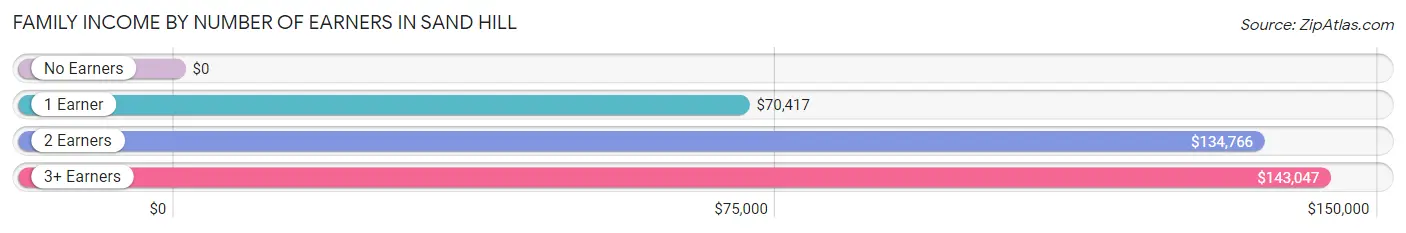
Family Income by Number of Earners in Sand Hill
| Number of Earners | # Families | Median Income |
| No Earners | 109 (15.5%) | $0 |
| 1 Earner | 123 (17.5%) | $70,417 |
| 2 Earners | 249 (35.5%) | $134,766 |
| 3+ Earners | 221 (31.5%) | $143,047 |
| Total | 702 (100.0%) | $106,382 |
Household Income in Sand Hill
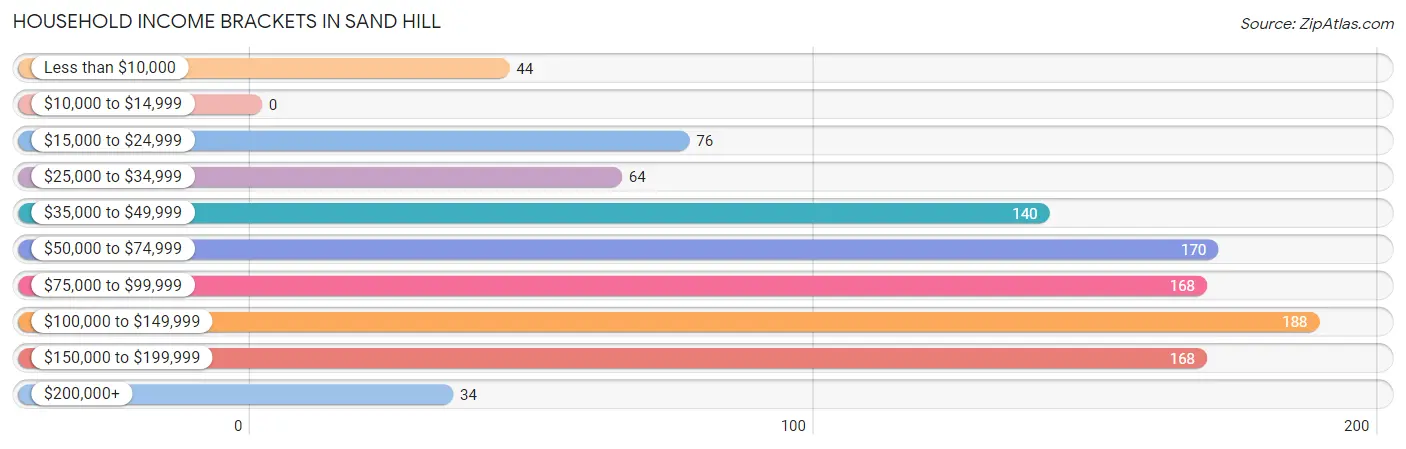
Household Income Brackets in Sand Hill
With 188 households falling in the category, the $100,000 to $149,999 income range is the most frequent in Sand Hill, accounting for 17.8% of all households.
| Income Bracket | # Households | % Households |
| Less than $10,000 | 44 | 4.2% |
| $10,000 to $14,999 | 0 | 0.0% |
| $15,000 to $24,999 | 76 | 7.2% |
| $25,000 to $34,999 | 64 | 6.1% |
| $35,000 to $49,999 | 140 | 13.3% |
| $50,000 to $74,999 | 170 | 16.1% |
| $75,000 to $99,999 | 168 | 16.0% |
| $100,000 to $149,999 | 188 | 17.9% |
| $150,000 to $199,999 | 168 | 16.0% |
| $200,000+ | 34 | 3.2% |
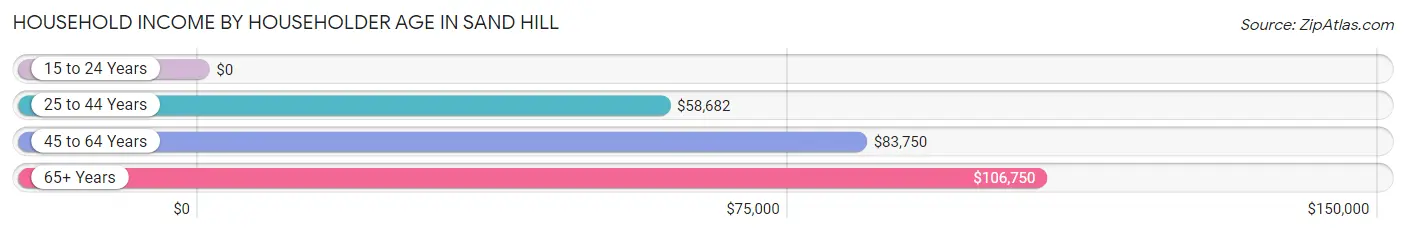
Household Income by Householder Age in Sand Hill
The median household income in Sand Hill is $81,625, with the highest median household income of $106,750 found in the 65+ years age bracket for the primary householder. A total of 374 households (35.5%) fall into this category. Meanwhile, the 15 to 24 years age bracket for the primary householder has the lowest median household income of $0, with 29 households (2.8%) in this group.
| Income Bracket | # Households | Median Income |
| 15 to 24 Years | 29 (2.8%) | $0 |
| 25 to 44 Years | 128 (12.2%) | $58,682 |
| 45 to 64 Years | 522 (49.6%) | $83,750 |
| 65+ Years | 374 (35.5%) | $106,750 |
| Total | 1,053 (100.0%) | $81,625 |
Poverty in Sand Hill
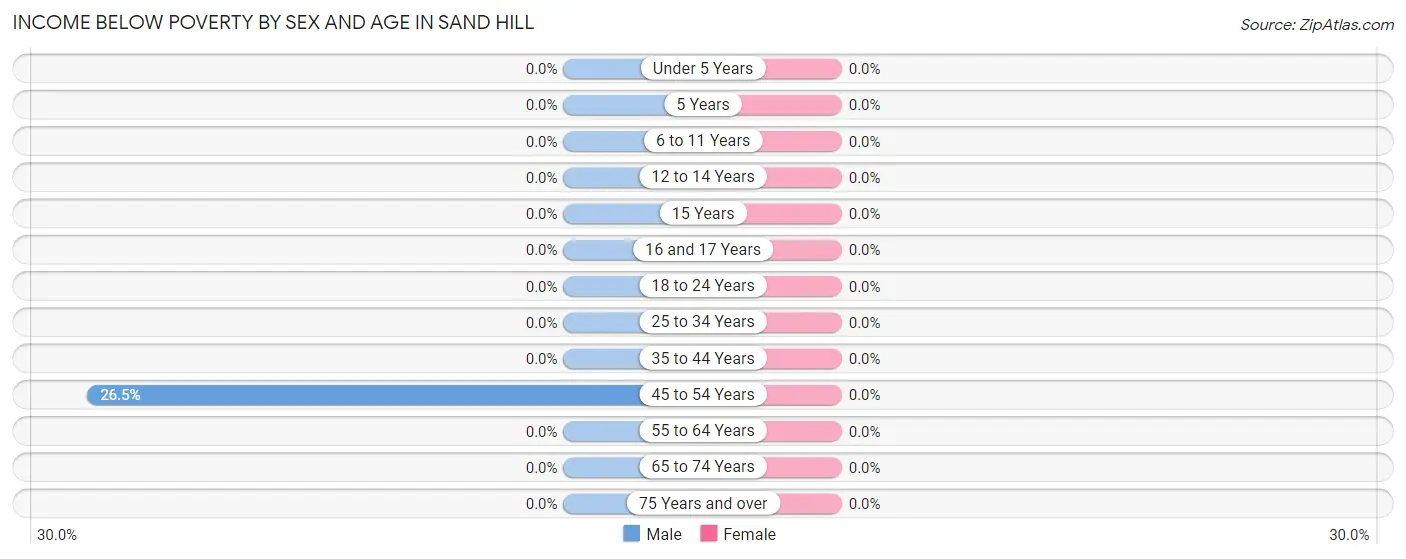
Income Below Poverty by Sex and Age in Sand Hill
| Age Bracket | Male | Female |
| Under 5 Years | 0 (0.0%) | 0 (0.0%) |
| 5 Years | 0 (0.0%) | 0 (0.0%) |
| 6 to 11 Years | 0 (0.0%) | 0 (0.0%) |
| 12 to 14 Years | 0 (0.0%) | 0 (0.0%) |
| 15 Years | 0 (0.0%) | 0 (0.0%) |
| 16 and 17 Years | 0 (0.0%) | 0 (0.0%) |
| 18 to 24 Years | 0 (0.0%) | 0 (0.0%) |
| 25 to 34 Years | 0 (0.0%) | 0 (0.0%) |
| 35 to 44 Years | 0 (0.0%) | 0 (0.0%) |
| 45 to 54 Years | 44 (26.5%) | 0 (0.0%) |
| 55 to 64 Years | 0 (0.0%) | 0 (0.0%) |
| 65 to 74 Years | 0 (0.0%) | 0 (0.0%) |
| 75 Years and over | 0 (0.0%) | 0 (0.0%) |
| Total | 44 (3.1%) | 0 (0.0%) |
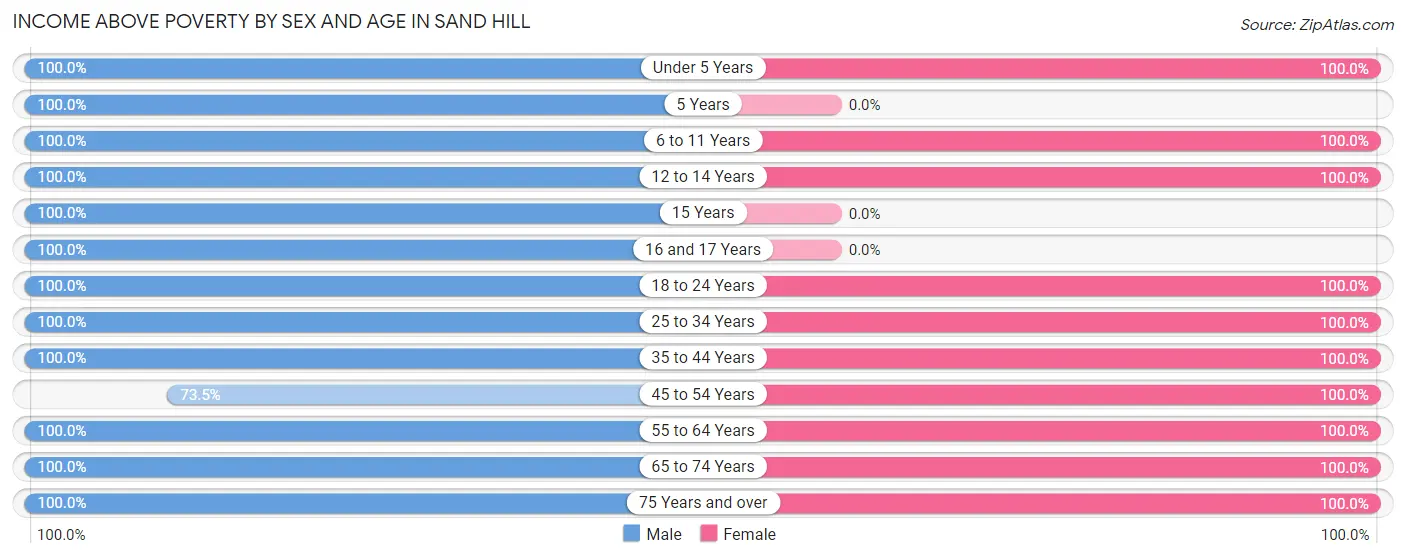
Income Above Poverty by Sex and Age in Sand Hill
According to the poverty statistics in Sand Hill, males aged under 5 years and females aged under 5 years are the age groups that are most secure financially, with 100.0% of males and 100.0% of females in these age groups living above the poverty line.
| Age Bracket | Male | Female |
| Under 5 Years | 43 (100.0%) | 17 (100.0%) |
| 5 Years | 19 (100.0%) | 0 (0.0%) |
| 6 to 11 Years | 30 (100.0%) | 85 (100.0%) |
| 12 to 14 Years | 53 (100.0%) | 28 (100.0%) |
| 15 Years | 19 (100.0%) | 0 (0.0%) |
| 16 and 17 Years | 23 (100.0%) | 0 (0.0%) |
| 18 to 24 Years | 130 (100.0%) | 44 (100.0%) |
| 25 to 34 Years | 103 (100.0%) | 237 (100.0%) |
| 35 to 44 Years | 165 (100.0%) | 16 (100.0%) |
| 45 to 54 Years | 122 (73.5%) | 164 (100.0%) |
| 55 to 64 Years | 324 (100.0%) | 153 (100.0%) |
| 65 to 74 Years | 317 (100.0%) | 341 (100.0%) |
| 75 Years and over | 27 (100.0%) | 22 (100.0%) |
| Total | 1,375 (96.9%) | 1,107 (100.0%) |
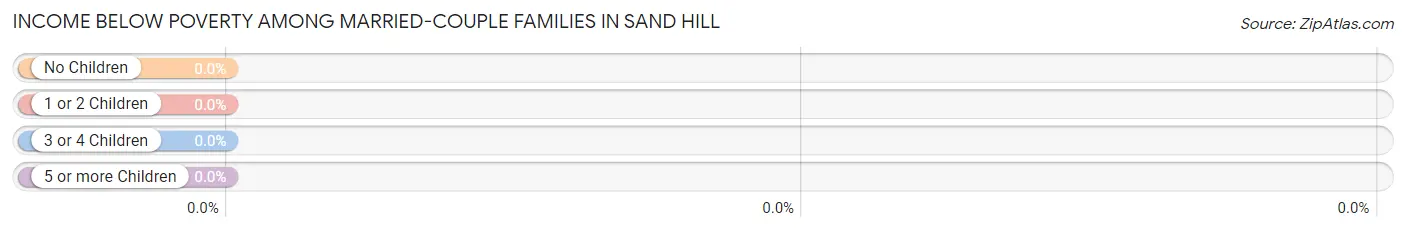
Income Below Poverty Among Married-Couple Families in Sand Hill
| Children | Above Poverty | Below Poverty |
| No Children | 492 (100.0%) | 0 (0.0%) |
| 1 or 2 Children | 120 (100.0%) | 0 (0.0%) |
| 3 or 4 Children | 27 (100.0%) | 0 (0.0%) |
| 5 or more Children | 0 (0.0%) | 0 (0.0%) |
| Total | 639 (100.0%) | 0 (0.0%) |
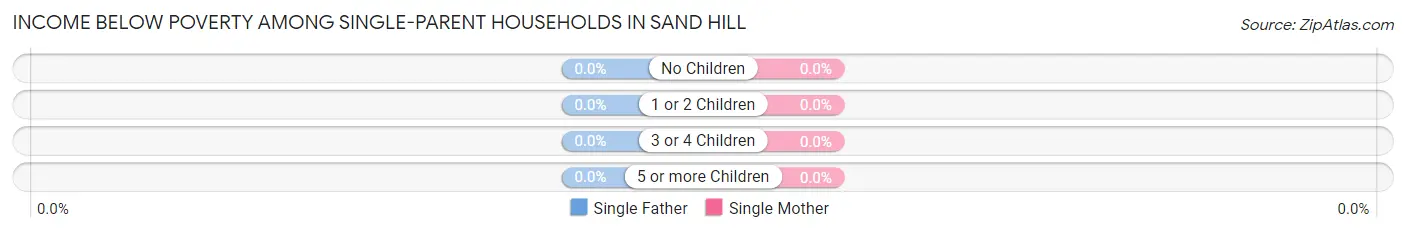
Income Below Poverty Among Single-Parent Households in Sand Hill
| Children | Single Father | Single Mother |
| No Children | 0 (0.0%) | 0 (0.0%) |
| 1 or 2 Children | 0 (0.0%) | 0 (0.0%) |
| 3 or 4 Children | 0 (0.0%) | 0 (0.0%) |
| 5 or more Children | 0 (0.0%) | 0 (0.0%) |
| Total | 0 (0.0%) | 0 (0.0%) |
Income Below Poverty Among Married-Couple vs Single-Parent Households in Sand Hill
| Children | Married-Couple Families | Single-Parent Households |
| No Children | 0 (0.0%) | 0 (0.0%) |
| 1 or 2 Children | 0 (0.0%) | 0 (0.0%) |
| 3 or 4 Children | 0 (0.0%) | 0 (0.0%) |
| 5 or more Children | 0 (0.0%) | 0 (0.0%) |
| Total | 0 (0.0%) | 0 (0.0%) |
Employment Characteristics in Sand Hill
Employment by Class of Employer in Sand Hill
Among the 1,451 employed individuals in Sand Hill, private company employees (919 | 63.3%), not-for-profit organizations (157 | 10.8%), and federal government employees (149 | 10.3%) make up the most common classes of employment.
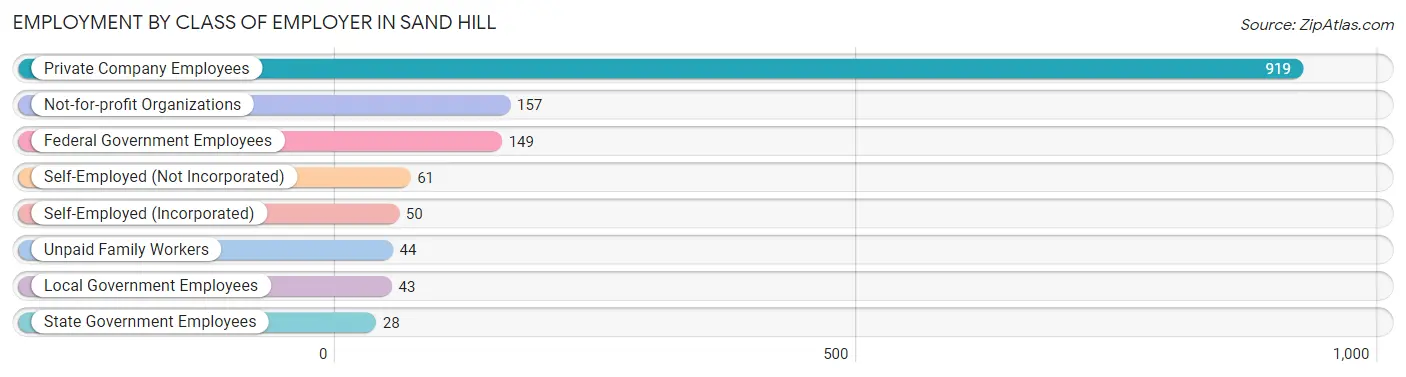
| Employer Class | # Employees | % Employees |
| Private Company Employees | 919 | 63.3% |
| Self-Employed (Incorporated) | 50 | 3.5% |
| Self-Employed (Not Incorporated) | 61 | 4.2% |
| Not-for-profit Organizations | 157 | 10.8% |
| Local Government Employees | 43 | 3.0% |
| State Government Employees | 28 | 1.9% |
| Federal Government Employees | 149 | 10.3% |
| Unpaid Family Workers | 44 | 3.0% |
| Total | 1,451 | 100.0% |
Employment Status by Age in Sand Hill
According to the labor force statistics for Sand Hill, out of the total population over 16 years of age (2,232), 67.0% or 1,495 individuals are in the labor force, with 1.7% or 25 of them unemployed. The age group with the highest labor force participation rate is 25 to 29 years, with 100.0% or 196 individuals in the labor force. Within the labor force, the 25 to 29 years age range has the highest percentage of unemployed individuals, with 12.8% or 25 of them being unemployed.
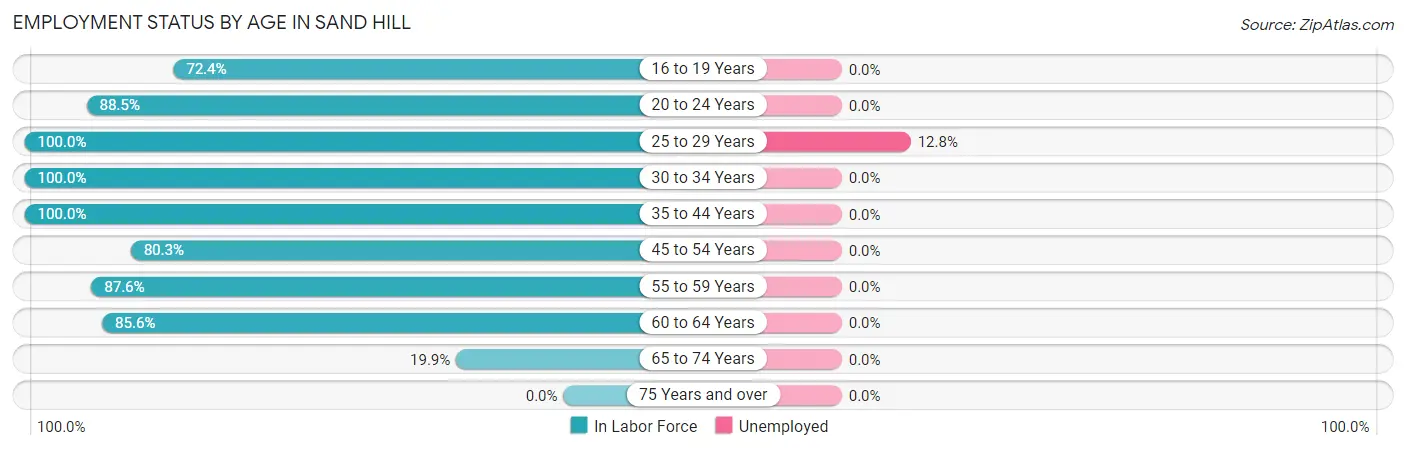
| Age Bracket | In Labor Force | Unemployed |
| 16 to 19 Years | 42 (72.4%) | 0 (0.0%) |
| 20 to 24 Years | 123 (88.5%) | 0 (0.0%) |
| 25 to 29 Years | 196 (100.0%) | 25 (12.8%) |
| 30 to 34 Years | 144 (100.0%) | 0 (0.0%) |
| 35 to 44 Years | 181 (100.0%) | 0 (0.0%) |
| 45 to 54 Years | 265 (80.3%) | 0 (0.0%) |
| 55 to 59 Years | 247 (87.6%) | 0 (0.0%) |
| 60 to 64 Years | 167 (85.6%) | 0 (0.0%) |
| 65 to 74 Years | 131 (19.9%) | 0 (0.0%) |
| 75 Years and over | 0 (0.0%) | 0 (0.0%) |
| Total | 1,495 (67.0%) | 25 (1.7%) |
Employment Status by Educational Attainment in Sand Hill
According to labor force statistics for Sand Hill, 90.4% of individuals (1,201) out of the total population between 25 and 64 years of age (1,328) are in the labor force, with 2.1% or 25 of them being unemployed. The group with the highest labor force participation rate are those with the educational attainment of less than high school, with 100.0% or 157 individuals in the labor force. Within the labor force, individuals with college / associate degree education have the highest percentage of unemployment, with 10.2% or 25 of them being unemployed.
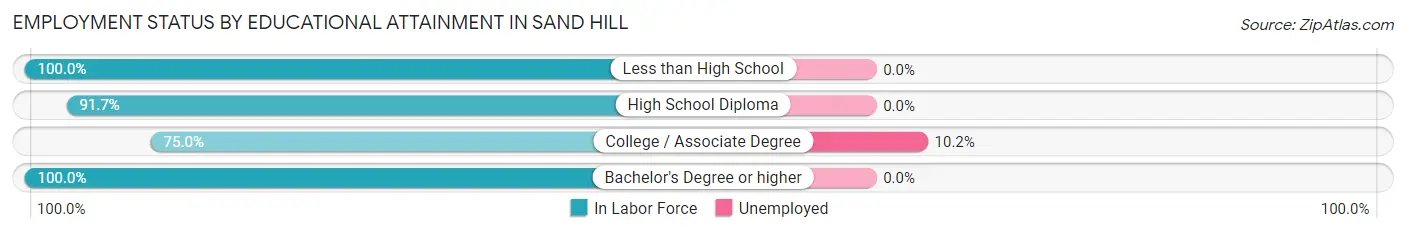
| Educational Attainment | In Labor Force | Unemployed |
| Less than High School | 157 (100.0%) | 0 (0.0%) |
| High School Diploma | 505 (91.7%) | 0 (0.0%) |
| College / Associate Degree | 246 (75.0%) | 33 (10.2%) |
| Bachelor's Degree or higher | 292 (100.0%) | 0 (0.0%) |
| Total | 1,201 (90.4%) | 28 (2.1%) |
Employment Occupations by Sex in Sand Hill
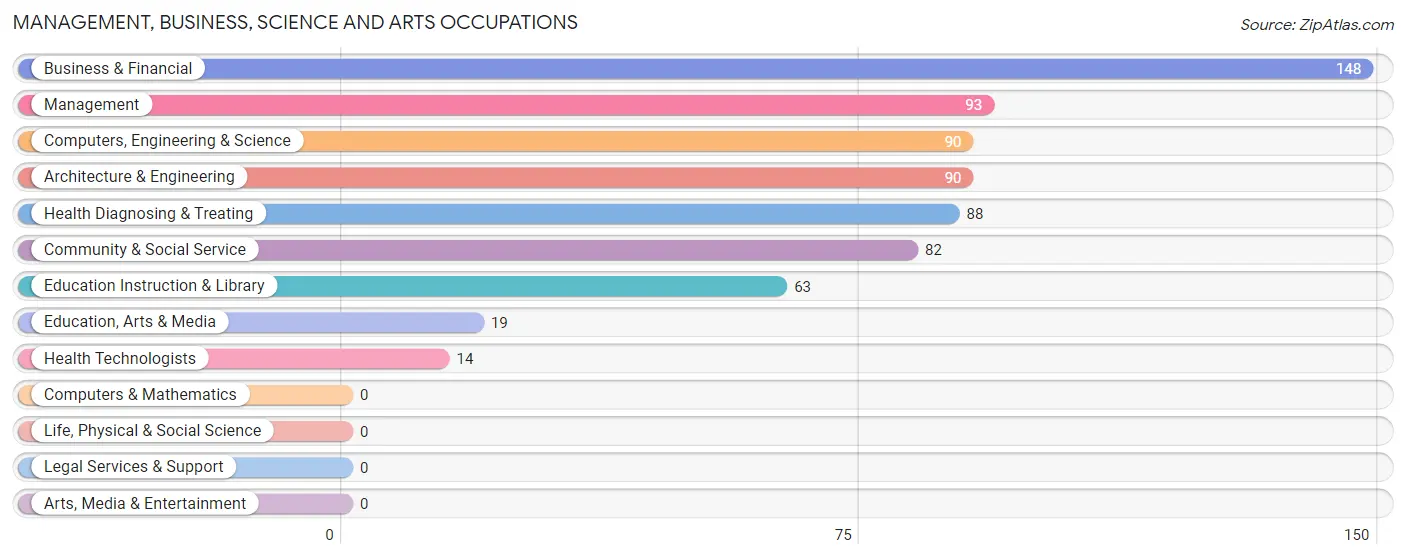
Management, Business, Science and Arts Occupations
The most common Management, Business, Science and Arts occupations in Sand Hill are Business & Financial (148 | 10.1%), Management (93 | 6.3%), Computers, Engineering & Science (90 | 6.1%), Architecture & Engineering (90 | 6.1%), and Health Diagnosing & Treating (88 | 6.0%).
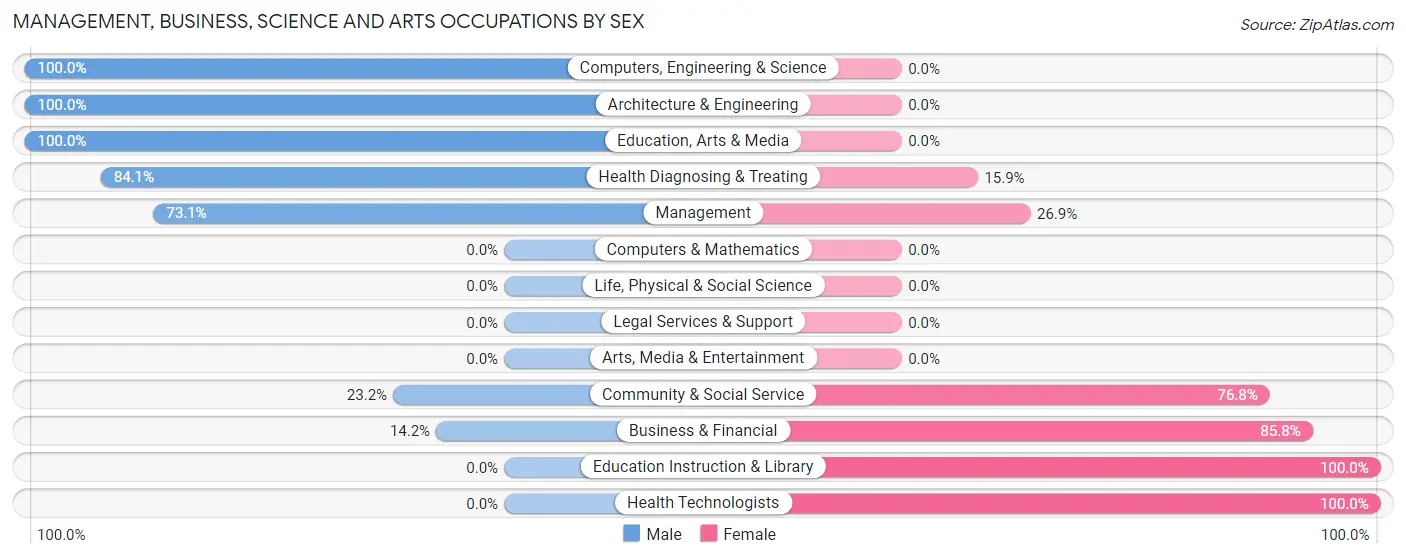
Management, Business, Science and Arts Occupations by Sex
Within the Management, Business, Science and Arts occupations in Sand Hill, the most male-oriented occupations are Computers, Engineering & Science (100.0%), Architecture & Engineering (100.0%), and Education, Arts & Media (100.0%), while the most female-oriented occupations are Education Instruction & Library (100.0%), Health Technologists (100.0%), and Business & Financial (85.8%).
| Occupation | Male | Female |
| Management | 68 (73.1%) | 25 (26.9%) |
| Business & Financial | 21 (14.2%) | 127 (85.8%) |
| Computers, Engineering & Science | 90 (100.0%) | 0 (0.0%) |
| Computers & Mathematics | 0 (0.0%) | 0 (0.0%) |
| Architecture & Engineering | 90 (100.0%) | 0 (0.0%) |
| Life, Physical & Social Science | 0 (0.0%) | 0 (0.0%) |
| Community & Social Service | 19 (23.2%) | 63 (76.8%) |
| Education, Arts & Media | 19 (100.0%) | 0 (0.0%) |
| Legal Services & Support | 0 (0.0%) | 0 (0.0%) |
| Education Instruction & Library | 0 (0.0%) | 63 (100.0%) |
| Arts, Media & Entertainment | 0 (0.0%) | 0 (0.0%) |
| Health Diagnosing & Treating | 74 (84.1%) | 14 (15.9%) |
| Health Technologists | 0 (0.0%) | 14 (100.0%) |
| Total (Category) | 272 (54.3%) | 229 (45.7%) |
| Total (Overall) | 926 (62.9%) | 545 (37.0%) |
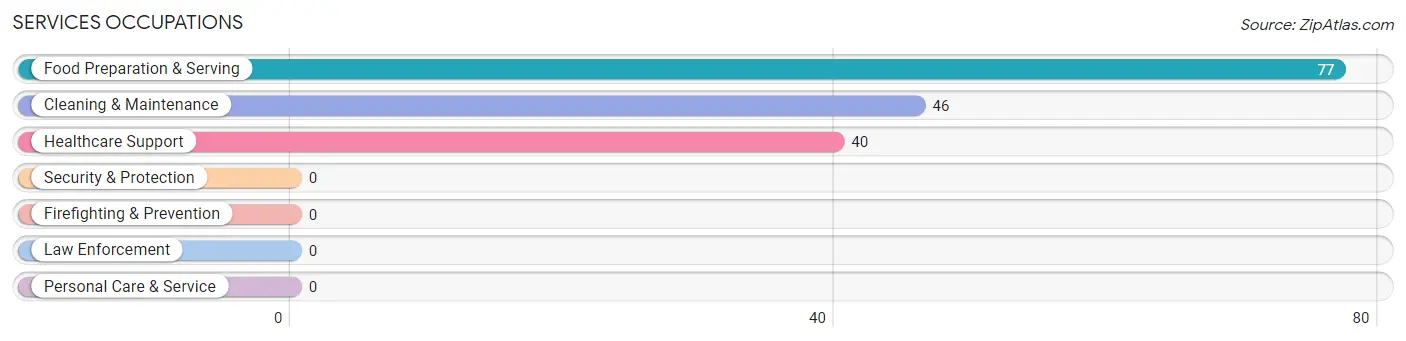
Services Occupations
The most common Services occupations in Sand Hill are Food Preparation & Serving (77 | 5.2%), Cleaning & Maintenance (46 | 3.1%), and Healthcare Support (40 | 2.7%).
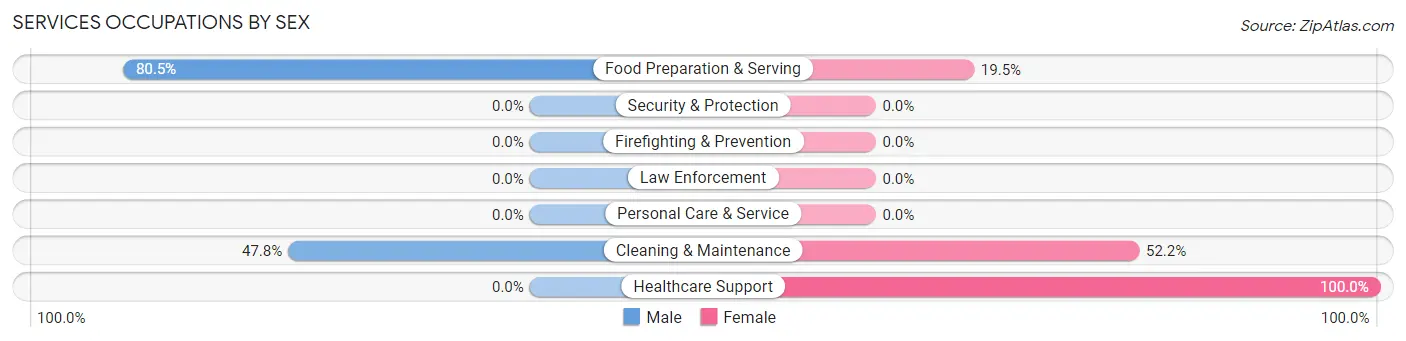
Services Occupations by Sex
Within the Services occupations in Sand Hill, the most male-oriented occupations are Food Preparation & Serving (80.5%), and Cleaning & Maintenance (47.8%), while the most female-oriented occupations are Healthcare Support (100.0%), Cleaning & Maintenance (52.2%), and Food Preparation & Serving (19.5%).
| Occupation | Male | Female |
| Healthcare Support | 0 (0.0%) | 40 (100.0%) |
| Security & Protection | 0 (0.0%) | 0 (0.0%) |
| Firefighting & Prevention | 0 (0.0%) | 0 (0.0%) |
| Law Enforcement | 0 (0.0%) | 0 (0.0%) |
| Food Preparation & Serving | 62 (80.5%) | 15 (19.5%) |
| Cleaning & Maintenance | 22 (47.8%) | 24 (52.2%) |
| Personal Care & Service | 0 (0.0%) | 0 (0.0%) |
| Total (Category) | 84 (51.5%) | 79 (48.5%) |
| Total (Overall) | 926 (62.9%) | 545 (37.0%) |
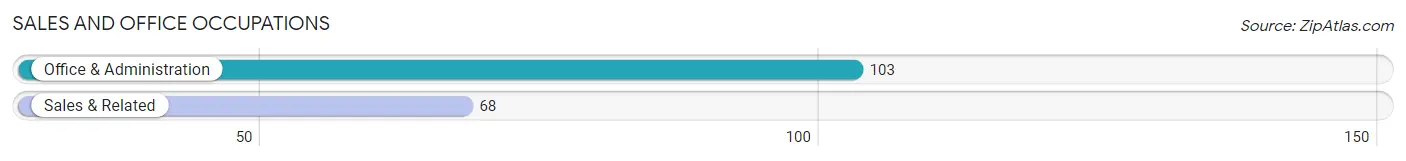
Sales and Office Occupations
The most common Sales and Office occupations in Sand Hill are Office & Administration (103 | 7.0%), and Sales & Related (68 | 4.6%).
Sales and Office Occupations by Sex
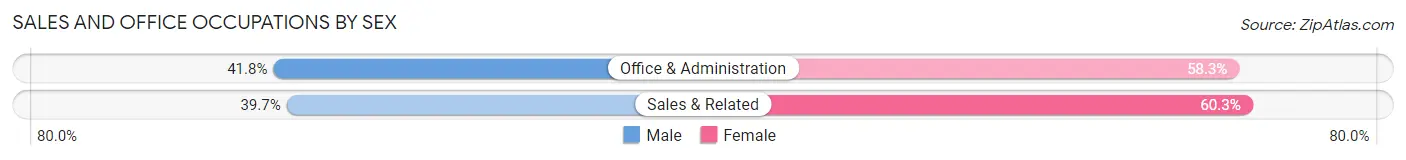
| Occupation | Male | Female |
| Sales & Related | 27 (39.7%) | 41 (60.3%) |
| Office & Administration | 43 (41.7%) | 60 (58.3%) |
| Total (Category) | 70 (40.9%) | 101 (59.1%) |
| Total (Overall) | 926 (62.9%) | 545 (37.0%) |
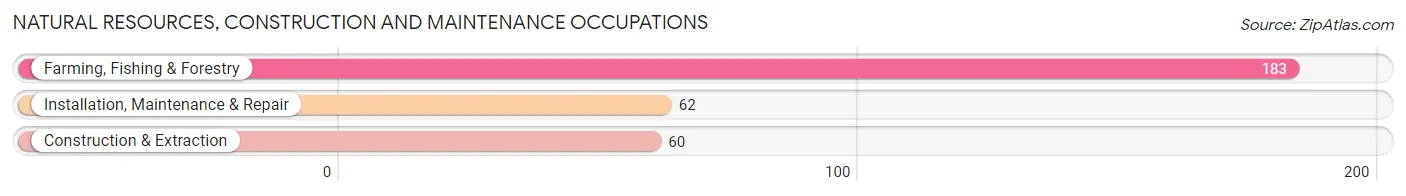
Natural Resources, Construction and Maintenance Occupations
The most common Natural Resources, Construction and Maintenance occupations in Sand Hill are Farming, Fishing & Forestry (183 | 12.4%), Installation, Maintenance & Repair (62 | 4.2%), and Construction & Extraction (60 | 4.1%).
Natural Resources, Construction and Maintenance Occupations by Sex
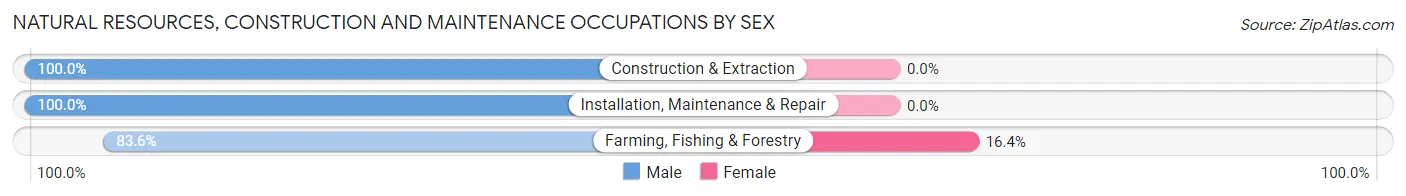
| Occupation | Male | Female |
| Farming, Fishing & Forestry | 153 (83.6%) | 30 (16.4%) |
| Construction & Extraction | 60 (100.0%) | 0 (0.0%) |
| Installation, Maintenance & Repair | 62 (100.0%) | 0 (0.0%) |
| Total (Category) | 275 (90.2%) | 30 (9.8%) |
| Total (Overall) | 926 (62.9%) | 545 (37.0%) |
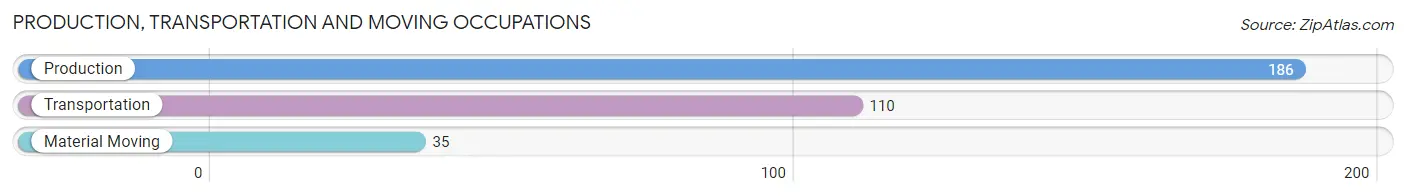
Production, Transportation and Moving Occupations
The most common Production, Transportation and Moving occupations in Sand Hill are Production (186 | 12.6%), Transportation (110 | 7.5%), and Material Moving (35 | 2.4%).
Production, Transportation and Moving Occupations by Sex
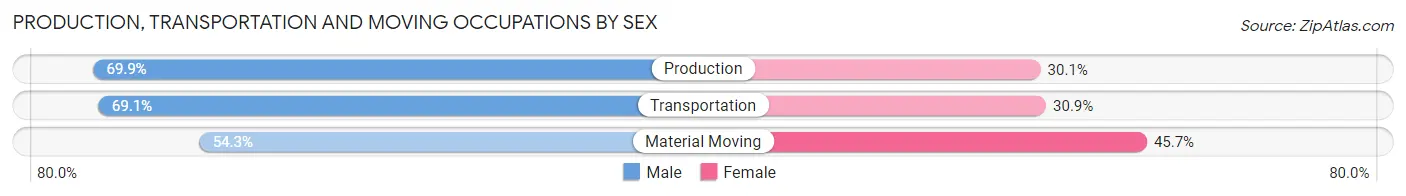
| Occupation | Male | Female |
| Production | 130 (69.9%) | 56 (30.1%) |
| Transportation | 76 (69.1%) | 34 (30.9%) |
| Material Moving | 19 (54.3%) | 16 (45.7%) |
| Total (Category) | 225 (68.0%) | 106 (32.0%) |
| Total (Overall) | 926 (62.9%) | 545 (37.0%) |
Employment Industries by Sex in Sand Hill
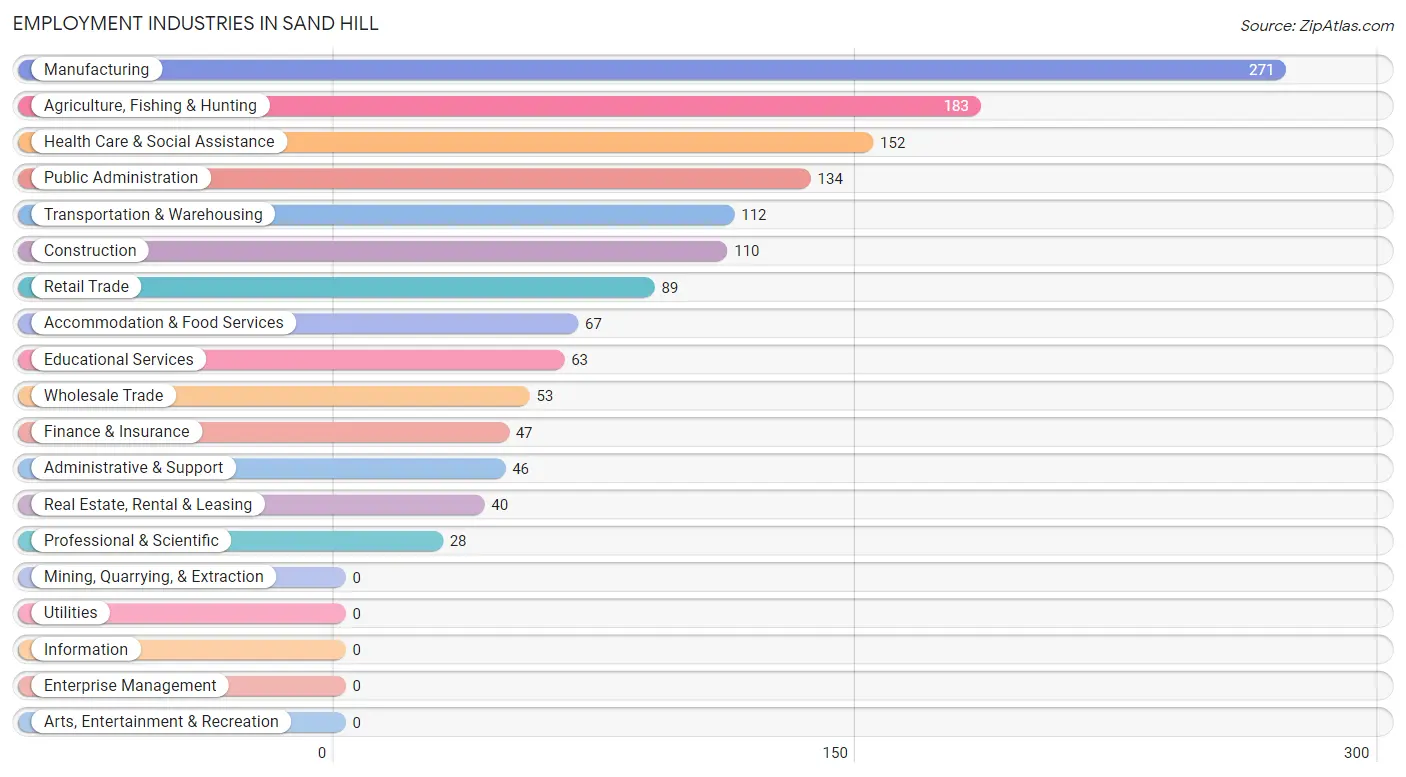
Employment Industries in Sand Hill
The major employment industries in Sand Hill include Manufacturing (271 | 18.4%), Agriculture, Fishing & Hunting (183 | 12.4%), Health Care & Social Assistance (152 | 10.3%), Public Administration (134 | 9.1%), and Transportation & Warehousing (112 | 7.6%).
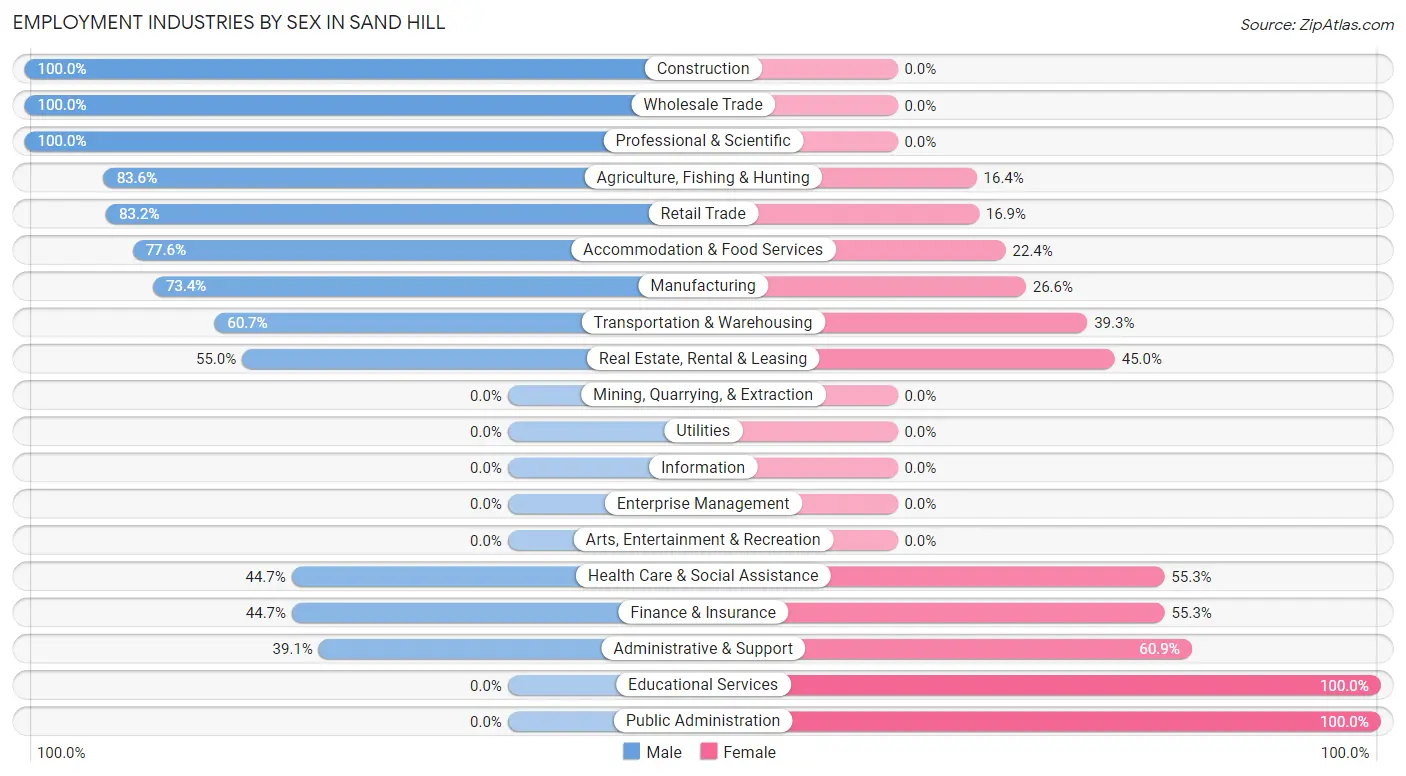
Employment Industries by Sex in Sand Hill
The Sand Hill industries that see more men than women are Construction (100.0%), Wholesale Trade (100.0%), and Professional & Scientific (100.0%), whereas the industries that tend to have a higher number of women are Educational Services (100.0%), Public Administration (100.0%), and Administrative & Support (60.9%).
| Industry | Male | Female |
| Agriculture, Fishing & Hunting | 153 (83.6%) | 30 (16.4%) |
| Mining, Quarrying, & Extraction | 0 (0.0%) | 0 (0.0%) |
| Construction | 110 (100.0%) | 0 (0.0%) |
| Manufacturing | 199 (73.4%) | 72 (26.6%) |
| Wholesale Trade | 53 (100.0%) | 0 (0.0%) |
| Retail Trade | 74 (83.2%) | 15 (16.9%) |
| Transportation & Warehousing | 68 (60.7%) | 44 (39.3%) |
| Utilities | 0 (0.0%) | 0 (0.0%) |
| Information | 0 (0.0%) | 0 (0.0%) |
| Finance & Insurance | 21 (44.7%) | 26 (55.3%) |
| Real Estate, Rental & Leasing | 22 (55.0%) | 18 (45.0%) |
| Professional & Scientific | 28 (100.0%) | 0 (0.0%) |
| Enterprise Management | 0 (0.0%) | 0 (0.0%) |
| Administrative & Support | 18 (39.1%) | 28 (60.9%) |
| Educational Services | 0 (0.0%) | 63 (100.0%) |
| Health Care & Social Assistance | 68 (44.7%) | 84 (55.3%) |
| Arts, Entertainment & Recreation | 0 (0.0%) | 0 (0.0%) |
| Accommodation & Food Services | 52 (77.6%) | 15 (22.4%) |
| Public Administration | 0 (0.0%) | 134 (100.0%) |
| Total | 926 (62.9%) | 545 (37.0%) |
Education in Sand Hill
School Enrollment in Sand Hill
The most common levels of schooling among the 325 students in Sand Hill are middle school (122 | 37.5%), high school (70 | 21.5%), and elementary school (66 | 20.3%).
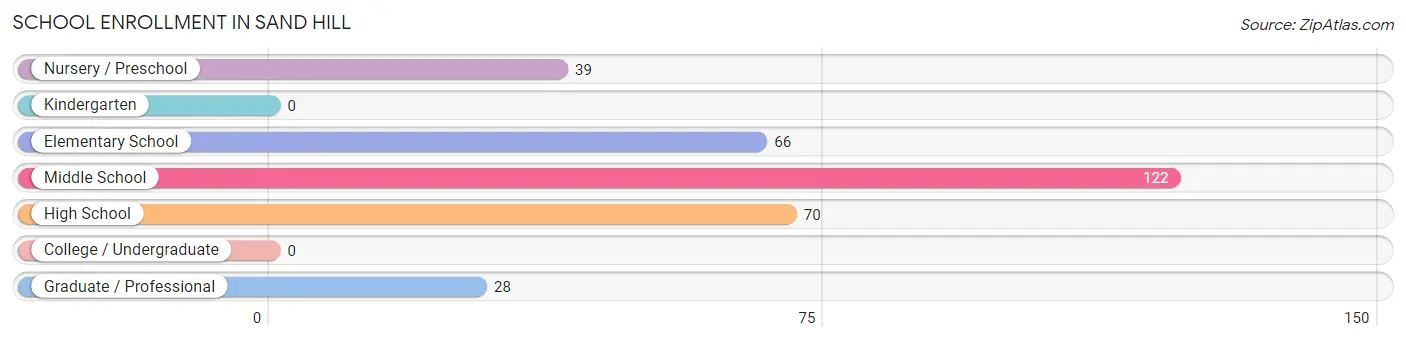
| School Level | # Students | % Students |
| Nursery / Preschool | 39 | 12.0% |
| Kindergarten | 0 | 0.0% |
| Elementary School | 66 | 20.3% |
| Middle School | 122 | 37.5% |
| High School | 70 | 21.5% |
| College / Undergraduate | 0 | 0.0% |
| Graduate / Professional | 28 | 8.6% |
| Total | 325 | 100.0% |
School Enrollment by Age by Funding Source in Sand Hill
Out of a total of 325 students who are enrolled in schools in Sand Hill, 28 (8.6%) attend a private institution, while the remaining 297 (91.4%) are enrolled in public schools. The age group of 20 to 24 year olds has the highest likelihood of being enrolled in private schools, with 28 (100.0% in the age bracket) enrolled. Conversely, the age group of 3 to 4 year olds has the lowest likelihood of being enrolled in a private school, with 20 (100.0% in the age bracket) attending a public institution.
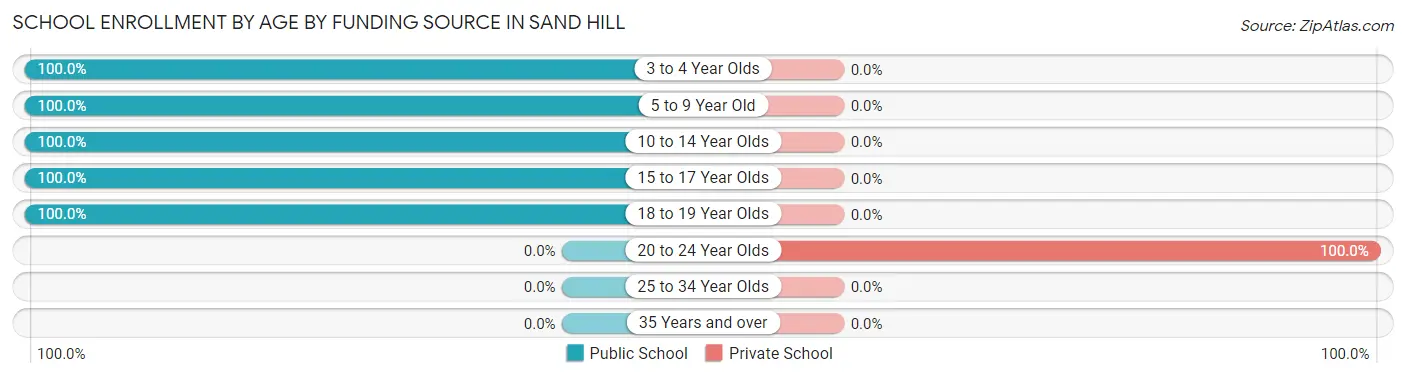
| Age Bracket | Public School | Private School |
| 3 to 4 Year Olds | 20 (100.0%) | 0 (0.0%) |
| 5 to 9 Year Old | 85 (100.0%) | 0 (0.0%) |
| 10 to 14 Year Olds | 130 (100.0%) | 0 (0.0%) |
| 15 to 17 Year Olds | 27 (100.0%) | 0 (0.0%) |
| 18 to 19 Year Olds | 35 (100.0%) | 0 (0.0%) |
| 20 to 24 Year Olds | 0 (0.0%) | 28 (100.0%) |
| 25 to 34 Year Olds | 0 (0.0%) | 0 (0.0%) |
| 35 Years and over | 0 (0.0%) | 0 (0.0%) |
| Total | 297 (91.4%) | 28 (8.6%) |
Educational Attainment by Field of Study in Sand Hill
Bio, nature & agricultural (127 | 33.7%), education (103 | 27.3%), business (42 | 11.1%), engineering (35 | 9.3%), and arts & humanities (35 | 9.3%) are the most common fields of study among 377 individuals in Sand Hill who have obtained a bachelor's degree or higher.
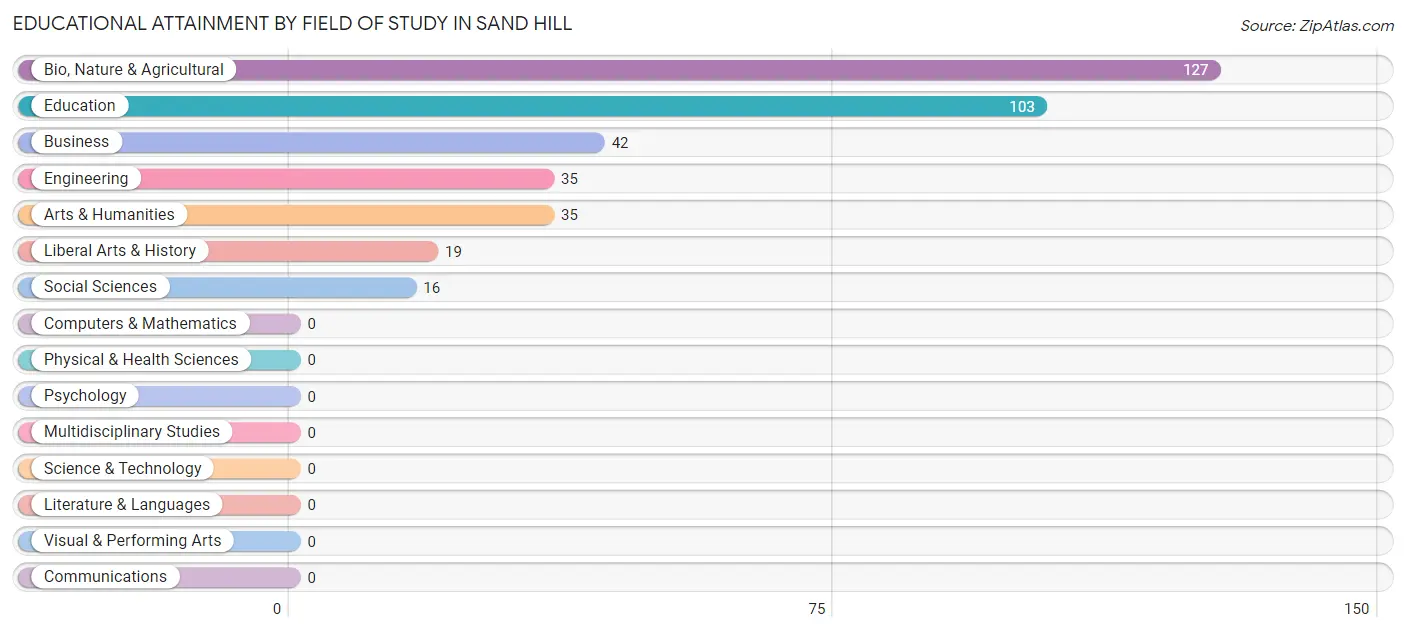
| Field of Study | # Graduates | % Graduates |
| Computers & Mathematics | 0 | 0.0% |
| Bio, Nature & Agricultural | 127 | 33.7% |
| Physical & Health Sciences | 0 | 0.0% |
| Psychology | 0 | 0.0% |
| Social Sciences | 16 | 4.2% |
| Engineering | 35 | 9.3% |
| Multidisciplinary Studies | 0 | 0.0% |
| Science & Technology | 0 | 0.0% |
| Business | 42 | 11.1% |
| Education | 103 | 27.3% |
| Literature & Languages | 0 | 0.0% |
| Liberal Arts & History | 19 | 5.0% |
| Visual & Performing Arts | 0 | 0.0% |
| Communications | 0 | 0.0% |
| Arts & Humanities | 35 | 9.3% |
| Total | 377 | 100.0% |
Transportation & Commute in Sand Hill
Vehicle Availability by Sex in Sand Hill
The most prevalent vehicle ownership categories in Sand Hill are males with 2 vehicles (298, accounting for 32.2%) and females with 2 vehicles (132, making up 56.8%).
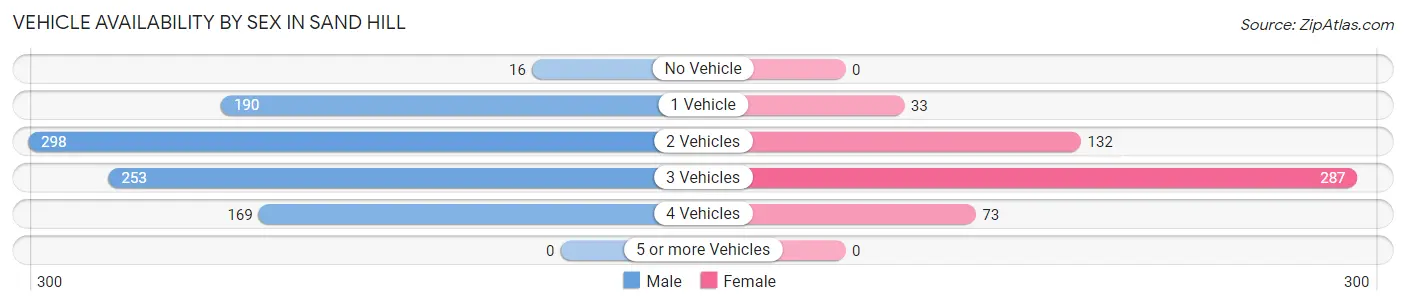
| Vehicles Available | Male | Female |
| No Vehicle | 16 (1.7%) | 0 (0.0%) |
| 1 Vehicle | 190 (20.5%) | 33 (6.3%) |
| 2 Vehicles | 298 (32.2%) | 132 (25.1%) |
| 3 Vehicles | 253 (27.3%) | 287 (54.7%) |
| 4 Vehicles | 169 (18.2%) | 73 (13.9%) |
| 5 or more Vehicles | 0 (0.0%) | 0 (0.0%) |
| Total | 926 (100.0%) | 525 (100.0%) |
Commute Time in Sand Hill
The most frequently occuring commute durations in Sand Hill are 15 to 19 minutes (305 commuters, 21.3%), 5 to 9 minutes (296 commuters, 20.7%), and 10 to 14 minutes (267 commuters, 18.7%).
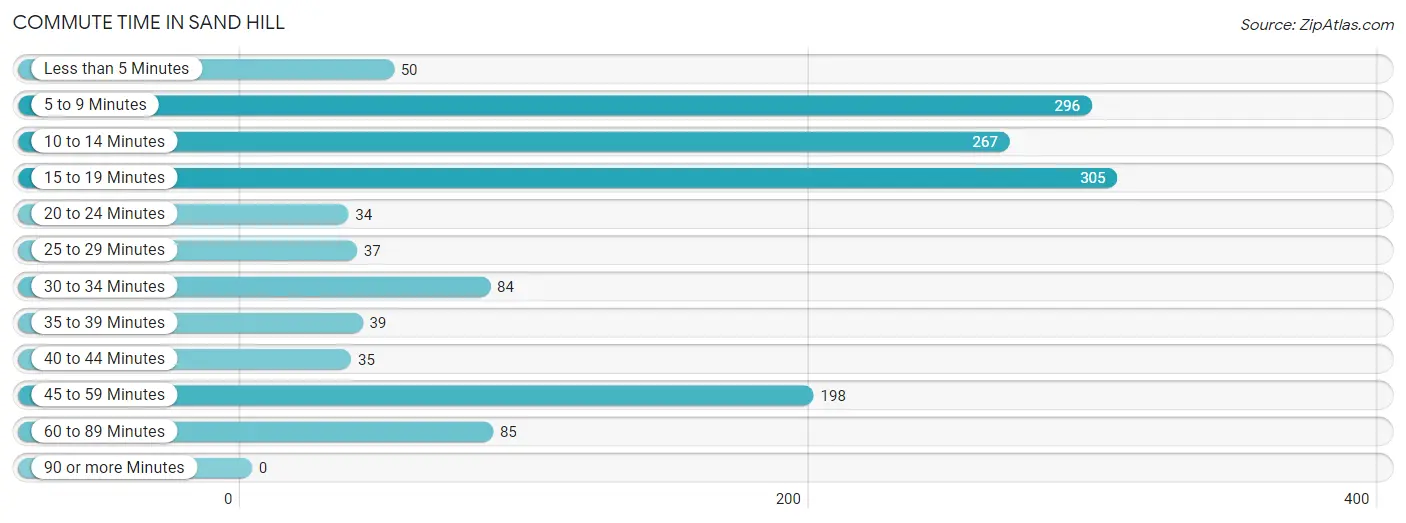
| Commute Time | # Commuters | % Commuters |
| Less than 5 Minutes | 50 | 3.5% |
| 5 to 9 Minutes | 296 | 20.7% |
| 10 to 14 Minutes | 267 | 18.7% |
| 15 to 19 Minutes | 305 | 21.3% |
| 20 to 24 Minutes | 34 | 2.4% |
| 25 to 29 Minutes | 37 | 2.6% |
| 30 to 34 Minutes | 84 | 5.9% |
| 35 to 39 Minutes | 39 | 2.7% |
| 40 to 44 Minutes | 35 | 2.5% |
| 45 to 59 Minutes | 198 | 13.9% |
| 60 to 89 Minutes | 85 | 5.9% |
| 90 or more Minutes | 0 | 0.0% |
Commute Time by Sex in Sand Hill
The most common commute times in Sand Hill are 10 to 14 minutes (196 commuters, 21.2%) for males and 15 to 19 minutes (161 commuters, 31.9%) for females.
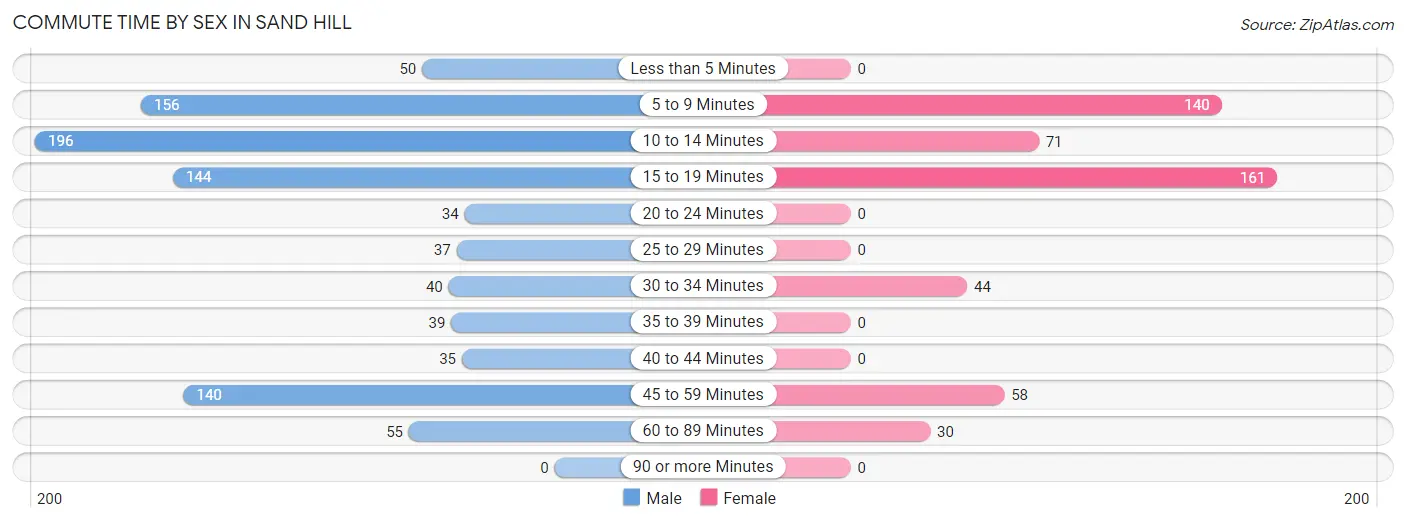
| Commute Time | Male | Female |
| Less than 5 Minutes | 50 (5.4%) | 0 (0.0%) |
| 5 to 9 Minutes | 156 (16.9%) | 140 (27.8%) |
| 10 to 14 Minutes | 196 (21.2%) | 71 (14.1%) |
| 15 to 19 Minutes | 144 (15.5%) | 161 (31.9%) |
| 20 to 24 Minutes | 34 (3.7%) | 0 (0.0%) |
| 25 to 29 Minutes | 37 (4.0%) | 0 (0.0%) |
| 30 to 34 Minutes | 40 (4.3%) | 44 (8.7%) |
| 35 to 39 Minutes | 39 (4.2%) | 0 (0.0%) |
| 40 to 44 Minutes | 35 (3.8%) | 0 (0.0%) |
| 45 to 59 Minutes | 140 (15.1%) | 58 (11.5%) |
| 60 to 89 Minutes | 55 (5.9%) | 30 (5.9%) |
| 90 or more Minutes | 0 (0.0%) | 0 (0.0%) |
Time of Departure to Work by Sex in Sand Hill
The most frequent times of departure to work in Sand Hill are 6:30 AM to 6:59 AM (198, 21.4%) for males and 4:00 PM to 11:59 PM (135, 26.8%) for females.
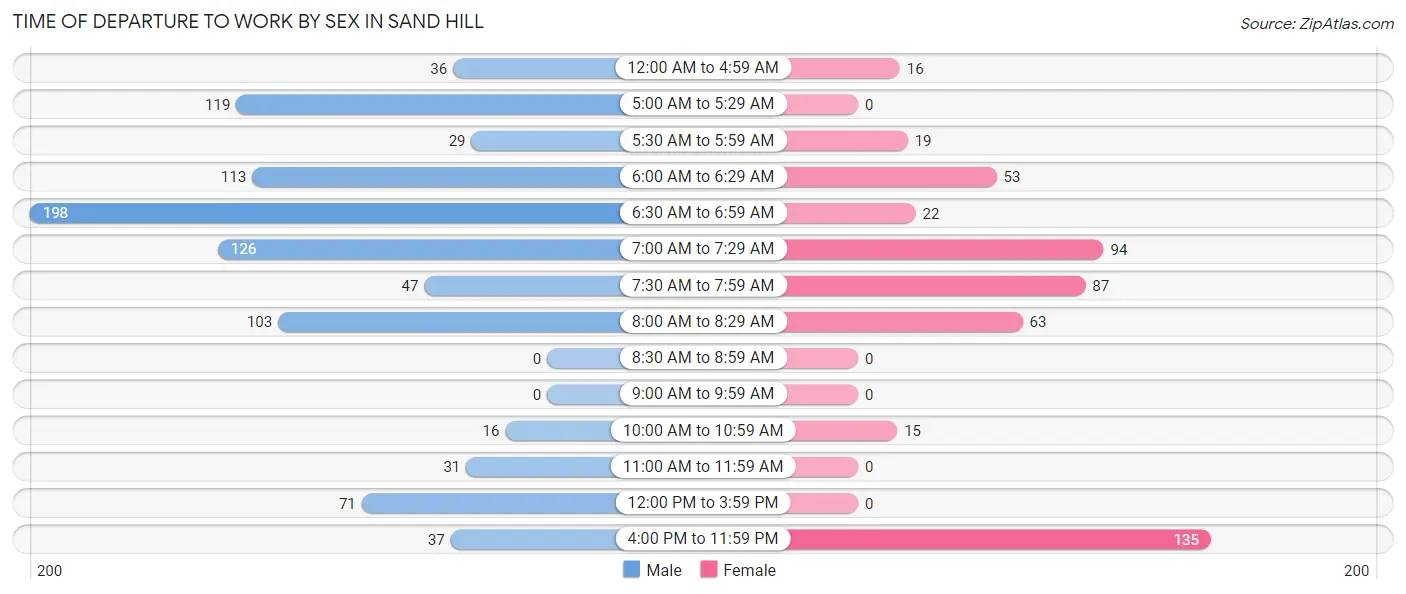
| Time of Departure | Male | Female |
| 12:00 AM to 4:59 AM | 36 (3.9%) | 16 (3.2%) |
| 5:00 AM to 5:29 AM | 119 (12.9%) | 0 (0.0%) |
| 5:30 AM to 5:59 AM | 29 (3.1%) | 19 (3.8%) |
| 6:00 AM to 6:29 AM | 113 (12.2%) | 53 (10.5%) |
| 6:30 AM to 6:59 AM | 198 (21.4%) | 22 (4.4%) |
| 7:00 AM to 7:29 AM | 126 (13.6%) | 94 (18.6%) |
| 7:30 AM to 7:59 AM | 47 (5.1%) | 87 (17.3%) |
| 8:00 AM to 8:29 AM | 103 (11.1%) | 63 (12.5%) |
| 8:30 AM to 8:59 AM | 0 (0.0%) | 0 (0.0%) |
| 9:00 AM to 9:59 AM | 0 (0.0%) | 0 (0.0%) |
| 10:00 AM to 10:59 AM | 16 (1.7%) | 15 (3.0%) |
| 11:00 AM to 11:59 AM | 31 (3.4%) | 0 (0.0%) |
| 12:00 PM to 3:59 PM | 71 (7.7%) | 0 (0.0%) |
| 4:00 PM to 11:59 PM | 37 (4.0%) | 135 (26.8%) |
| Total | 926 (100.0%) | 504 (100.0%) |
Housing Occupancy in Sand Hill
Occupancy by Ownership in Sand Hill
Of the total 1,053 dwellings in Sand Hill, owner-occupied units account for 888 (84.3%), while renter-occupied units make up 165 (15.7%).
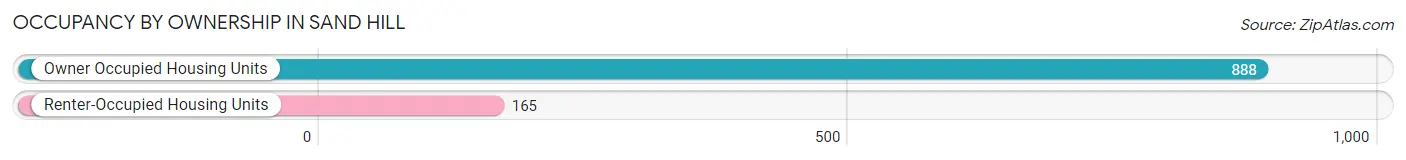
| Occupancy | # Housing Units | % Housing Units |
| Owner Occupied Housing Units | 888 | 84.3% |
| Renter-Occupied Housing Units | 165 | 15.7% |
| Total Occupied Housing Units | 1,053 | 100.0% |
Occupancy by Household Size in Sand Hill
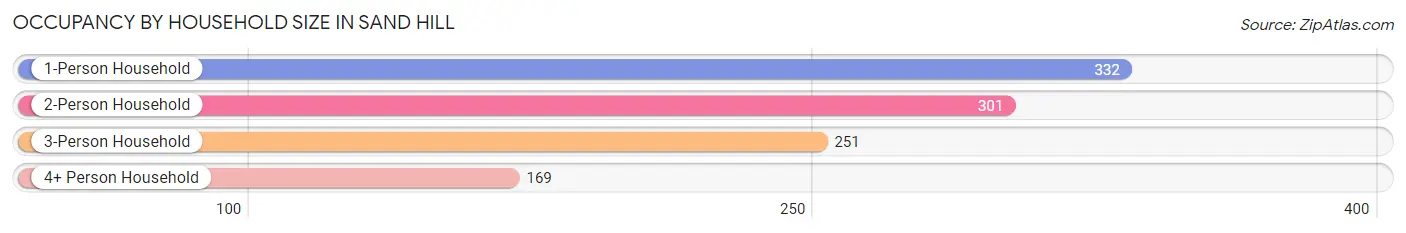
| Household Size | # Housing Units | % Housing Units |
| 1-Person Household | 332 | 31.5% |
| 2-Person Household | 301 | 28.6% |
| 3-Person Household | 251 | 23.8% |
| 4+ Person Household | 169 | 16.1% |
| Total Housing Units | 1,053 | 100.0% |
Occupancy by Ownership by Household Size in Sand Hill
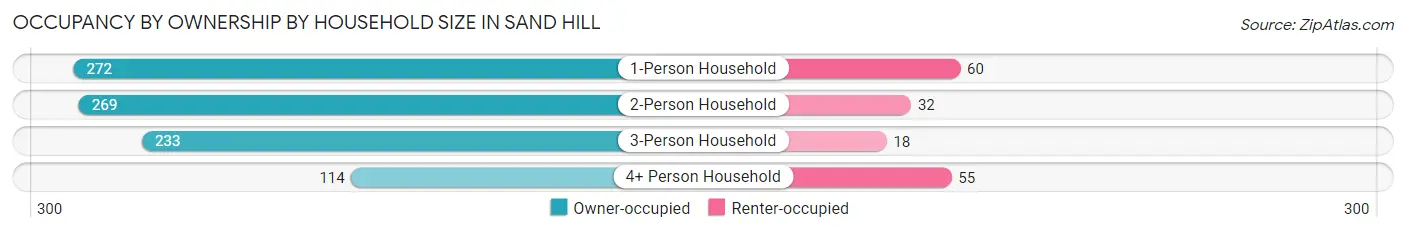
| Household Size | Owner-occupied | Renter-occupied |
| 1-Person Household | 272 (81.9%) | 60 (18.1%) |
| 2-Person Household | 269 (89.4%) | 32 (10.6%) |
| 3-Person Household | 233 (92.8%) | 18 (7.2%) |
| 4+ Person Household | 114 (67.5%) | 55 (32.5%) |
| Total Housing Units | 888 (84.3%) | 165 (15.7%) |
Occupancy by Educational Attainment in Sand Hill
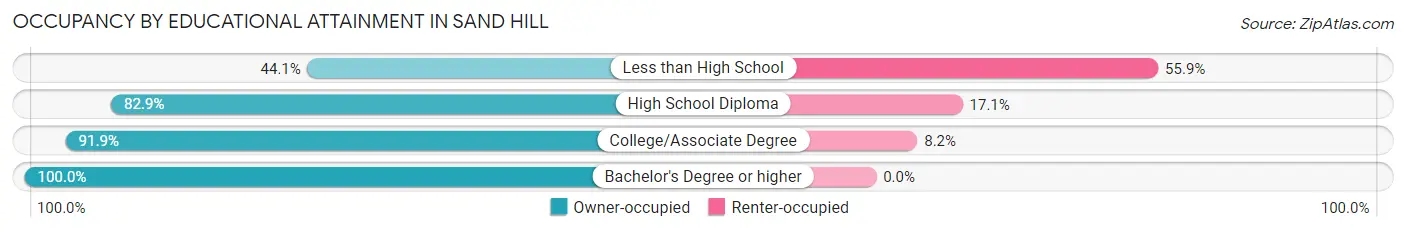
| Household Size | Owner-occupied | Renter-occupied |
| Less than High School | 56 (44.1%) | 71 (55.9%) |
| High School Diploma | 290 (82.9%) | 60 (17.1%) |
| College/Associate Degree | 383 (91.8%) | 34 (8.2%) |
| Bachelor's Degree or higher | 159 (100.0%) | 0 (0.0%) |
Occupancy by Age of Householder in Sand Hill
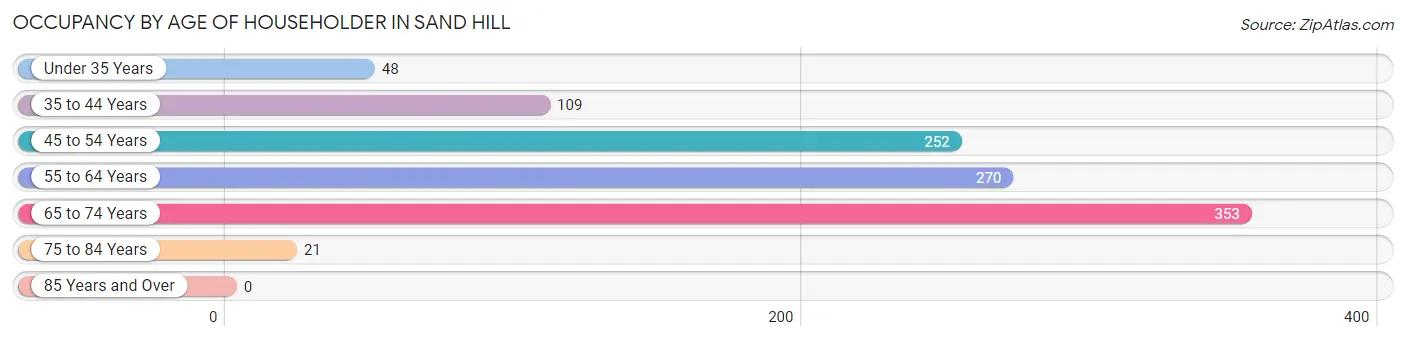
| Age Bracket | # Households | % Households |
| Under 35 Years | 48 | 4.6% |
| 35 to 44 Years | 109 | 10.3% |
| 45 to 54 Years | 252 | 23.9% |
| 55 to 64 Years | 270 | 25.6% |
| 65 to 74 Years | 353 | 33.5% |
| 75 to 84 Years | 21 | 2.0% |
| 85 Years and Over | 0 | 0.0% |
| Total | 1,053 | 100.0% |
Housing Finances in Sand Hill
Median Income by Occupancy in Sand Hill
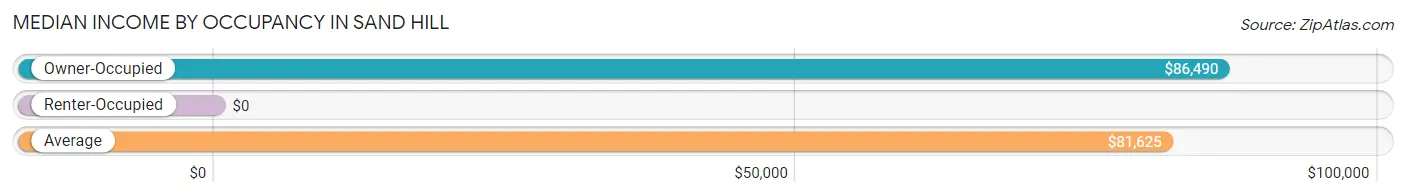
| Occupancy Type | # Households | Median Income |
| Owner-Occupied | 888 (84.3%) | $86,490 |
| Renter-Occupied | 165 (15.7%) | $0 |
| Average | 1,053 (100.0%) | $81,625 |
Occupancy by Householder Income Bracket in Sand Hill
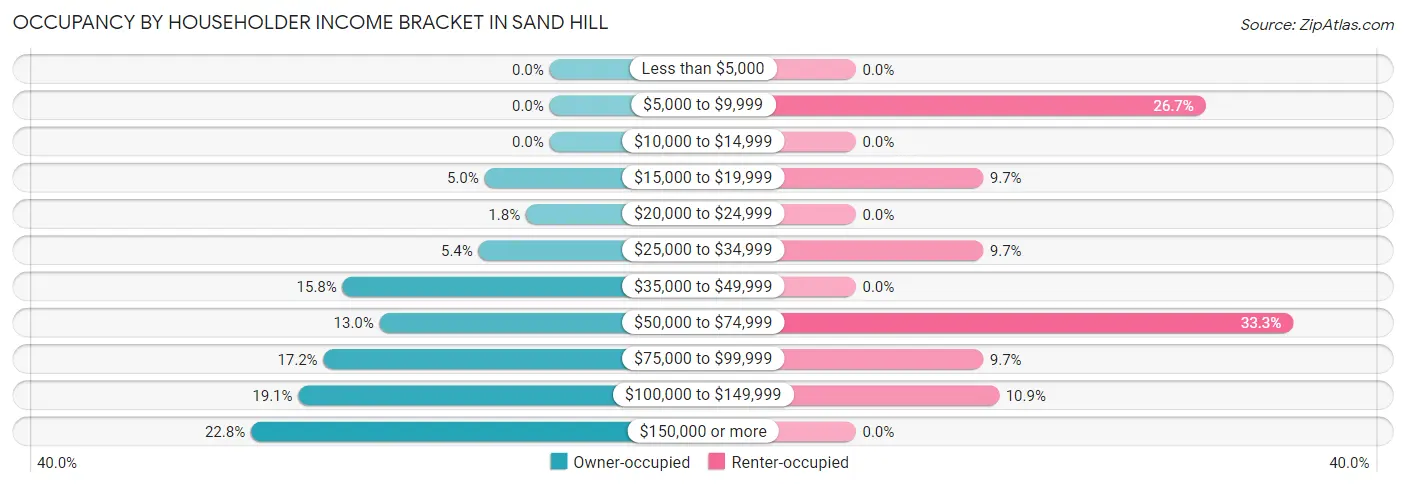
| Income Bracket | Owner-occupied | Renter-occupied |
| Less than $5,000 | 0 (0.0%) | 0 (0.0%) |
| $5,000 to $9,999 | 0 (0.0%) | 44 (26.7%) |
| $10,000 to $14,999 | 0 (0.0%) | 0 (0.0%) |
| $15,000 to $19,999 | 44 (5.0%) | 16 (9.7%) |
| $20,000 to $24,999 | 16 (1.8%) | 0 (0.0%) |
| $25,000 to $34,999 | 48 (5.4%) | 16 (9.7%) |
| $35,000 to $49,999 | 140 (15.8%) | 0 (0.0%) |
| $50,000 to $74,999 | 115 (13.0%) | 55 (33.3%) |
| $75,000 to $99,999 | 153 (17.2%) | 16 (9.7%) |
| $100,000 to $149,999 | 170 (19.1%) | 18 (10.9%) |
| $150,000 or more | 202 (22.8%) | 0 (0.0%) |
| Total | 888 (100.0%) | 165 (100.0%) |
Monthly Housing Cost Tiers in Sand Hill
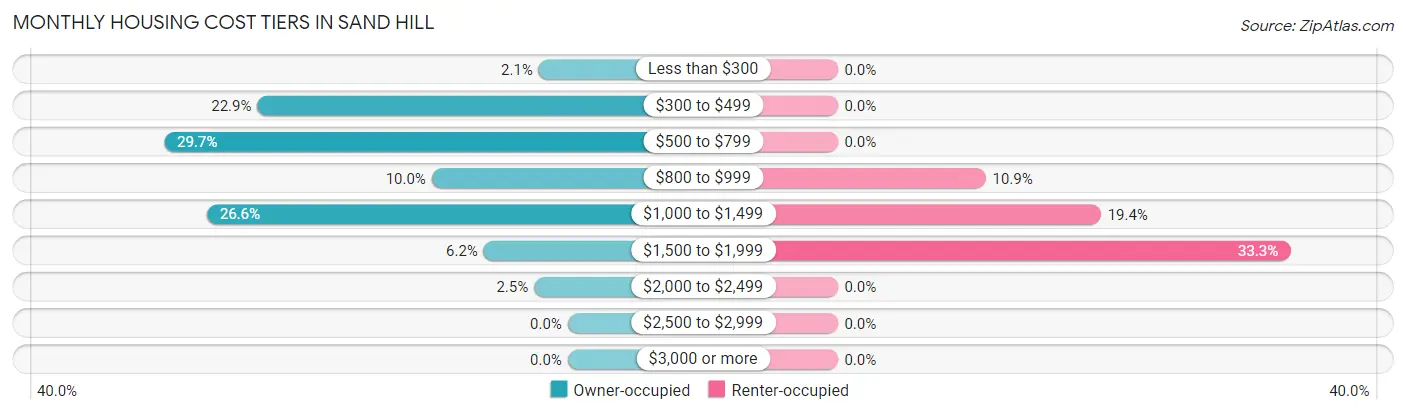
| Monthly Cost | Owner-occupied | Renter-occupied |
| Less than $300 | 19 (2.1%) | 0 (0.0%) |
| $300 to $499 | 203 (22.9%) | 0 (0.0%) |
| $500 to $799 | 264 (29.7%) | 0 (0.0%) |
| $800 to $999 | 89 (10.0%) | 18 (10.9%) |
| $1,000 to $1,499 | 236 (26.6%) | 32 (19.4%) |
| $1,500 to $1,999 | 55 (6.2%) | 55 (33.3%) |
| $2,000 to $2,499 | 22 (2.5%) | 0 (0.0%) |
| $2,500 to $2,999 | 0 (0.0%) | 0 (0.0%) |
| $3,000 or more | 0 (0.0%) | 0 (0.0%) |
| Total | 888 (100.0%) | 165 (100.0%) |
Physical Housing Characteristics in Sand Hill
Housing Structures in Sand Hill
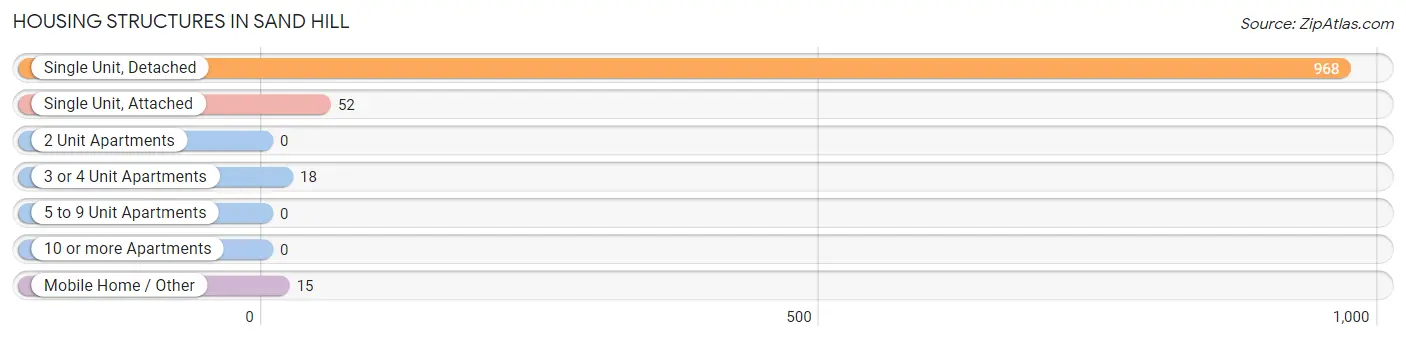
| Structure Type | # Housing Units | % Housing Units |
| Single Unit, Detached | 968 | 91.9% |
| Single Unit, Attached | 52 | 4.9% |
| 2 Unit Apartments | 0 | 0.0% |
| 3 or 4 Unit Apartments | 18 | 1.7% |
| 5 to 9 Unit Apartments | 0 | 0.0% |
| 10 or more Apartments | 0 | 0.0% |
| Mobile Home / Other | 15 | 1.4% |
| Total | 1,053 | 100.0% |
Housing Structures by Occupancy in Sand Hill
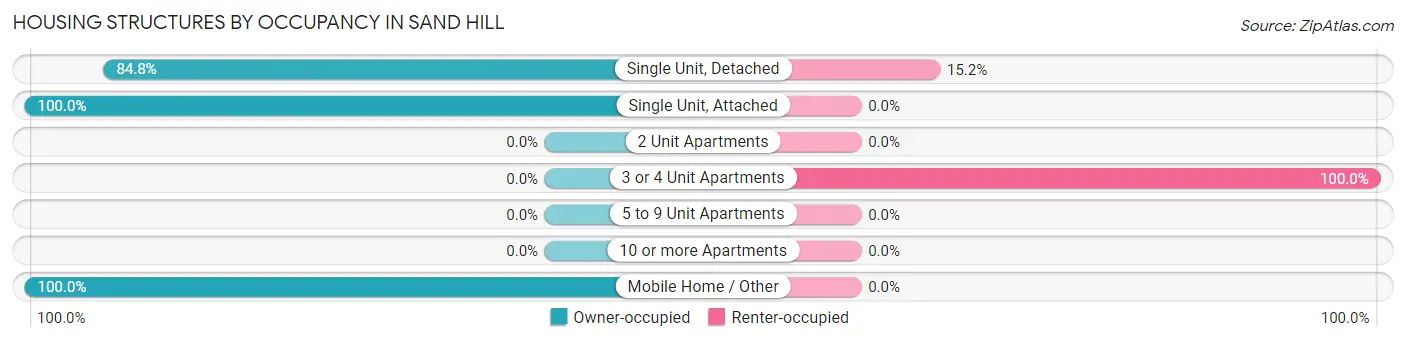
| Structure Type | Owner-occupied | Renter-occupied |
| Single Unit, Detached | 821 (84.8%) | 147 (15.2%) |
| Single Unit, Attached | 52 (100.0%) | 0 (0.0%) |
| 2 Unit Apartments | 0 (0.0%) | 0 (0.0%) |
| 3 or 4 Unit Apartments | 0 (0.0%) | 18 (100.0%) |
| 5 to 9 Unit Apartments | 0 (0.0%) | 0 (0.0%) |
| 10 or more Apartments | 0 (0.0%) | 0 (0.0%) |
| Mobile Home / Other | 15 (100.0%) | 0 (0.0%) |
| Total | 888 (84.3%) | 165 (15.7%) |
Housing Structures by Number of Rooms in Sand Hill
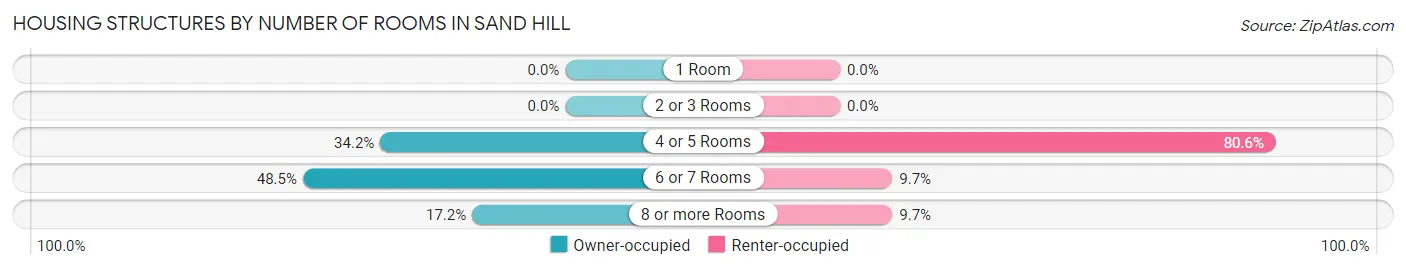
| Number of Rooms | Owner-occupied | Renter-occupied |
| 1 Room | 0 (0.0%) | 0 (0.0%) |
| 2 or 3 Rooms | 0 (0.0%) | 0 (0.0%) |
| 4 or 5 Rooms | 304 (34.2%) | 133 (80.6%) |
| 6 or 7 Rooms | 431 (48.5%) | 16 (9.7%) |
| 8 or more Rooms | 153 (17.2%) | 16 (9.7%) |
| Total | 888 (100.0%) | 165 (100.0%) |
Housing Structure by Heating Type in Sand Hill
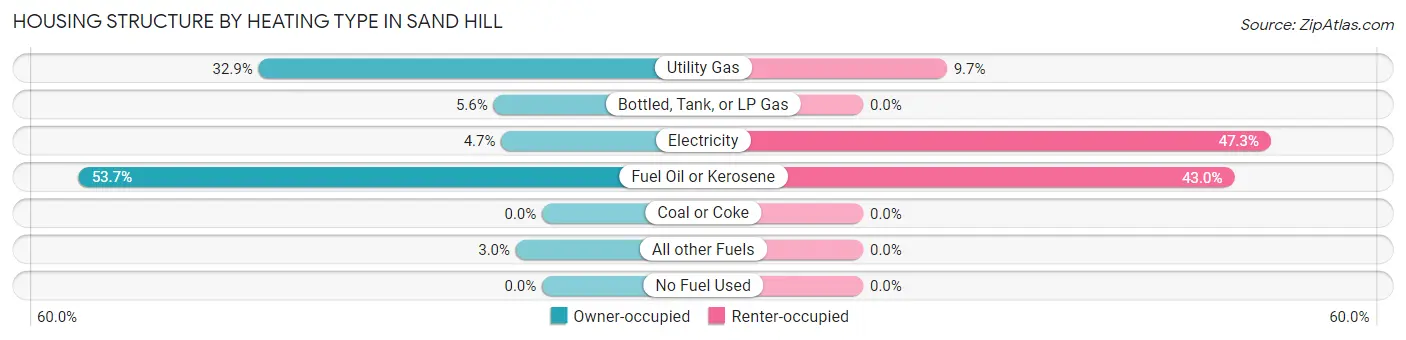
| Heating Type | Owner-occupied | Renter-occupied |
| Utility Gas | 292 (32.9%) | 16 (9.7%) |
| Bottled, Tank, or LP Gas | 50 (5.6%) | 0 (0.0%) |
| Electricity | 42 (4.7%) | 78 (47.3%) |
| Fuel Oil or Kerosene | 477 (53.7%) | 71 (43.0%) |
| Coal or Coke | 0 (0.0%) | 0 (0.0%) |
| All other Fuels | 27 (3.0%) | 0 (0.0%) |
| No Fuel Used | 0 (0.0%) | 0 (0.0%) |
| Total | 888 (100.0%) | 165 (100.0%) |
Household Vehicle Usage in Sand Hill
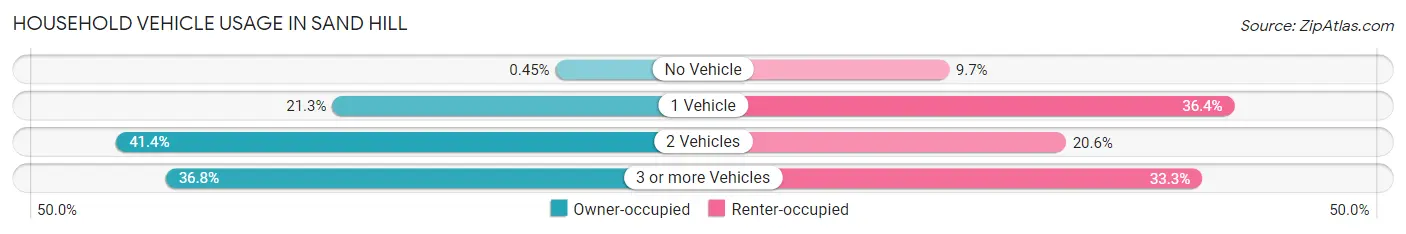
| Vehicles per Household | Owner-occupied | Renter-occupied |
| No Vehicle | 4 (0.4%) | 16 (9.7%) |
| 1 Vehicle | 189 (21.3%) | 60 (36.4%) |
| 2 Vehicles | 368 (41.4%) | 34 (20.6%) |
| 3 or more Vehicles | 327 (36.8%) | 55 (33.3%) |
| Total | 888 (100.0%) | 165 (100.0%) |
Real Estate & Mortgages in Sand Hill
Real Estate and Mortgage Overview in Sand Hill
| Characteristic | Without Mortgage | With Mortgage |
| Housing Units | 486 | 402 |
| Median Property Value | $203,900 | $166,300 |
| Median Household Income | $81,850 | $125 |
| Monthly Housing Costs | $511 | $0 |
| Real Estate Taxes | $3,080 | $0 |
Property Value by Mortgage Status in Sand Hill
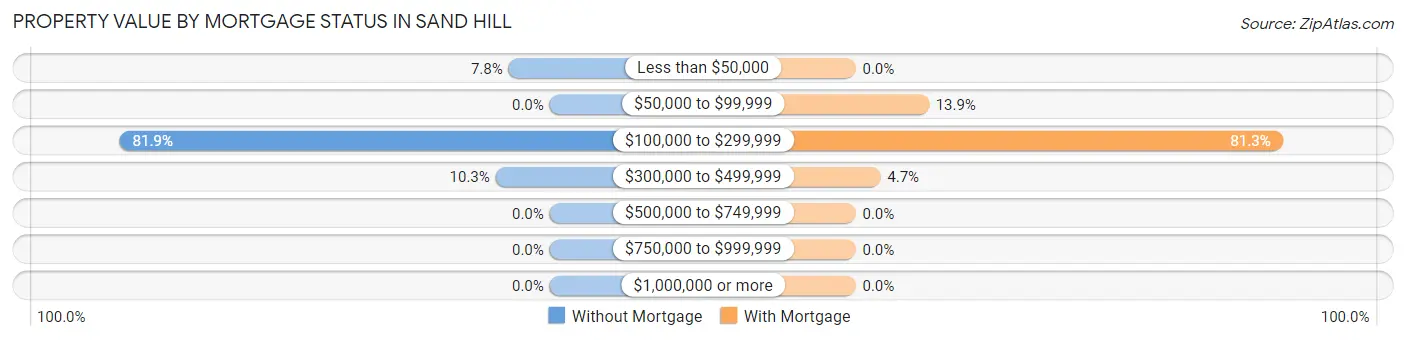
| Property Value | Without Mortgage | With Mortgage |
| Less than $50,000 | 38 (7.8%) | 0 (0.0%) |
| $50,000 to $99,999 | 0 (0.0%) | 56 (13.9%) |
| $100,000 to $299,999 | 398 (81.9%) | 327 (81.3%) |
| $300,000 to $499,999 | 50 (10.3%) | 19 (4.7%) |
| $500,000 to $749,999 | 0 (0.0%) | 0 (0.0%) |
| $750,000 to $999,999 | 0 (0.0%) | 0 (0.0%) |
| $1,000,000 or more | 0 (0.0%) | 0 (0.0%) |
| Total | 486 (100.0%) | 402 (100.0%) |
Household Income by Mortgage Status in Sand Hill
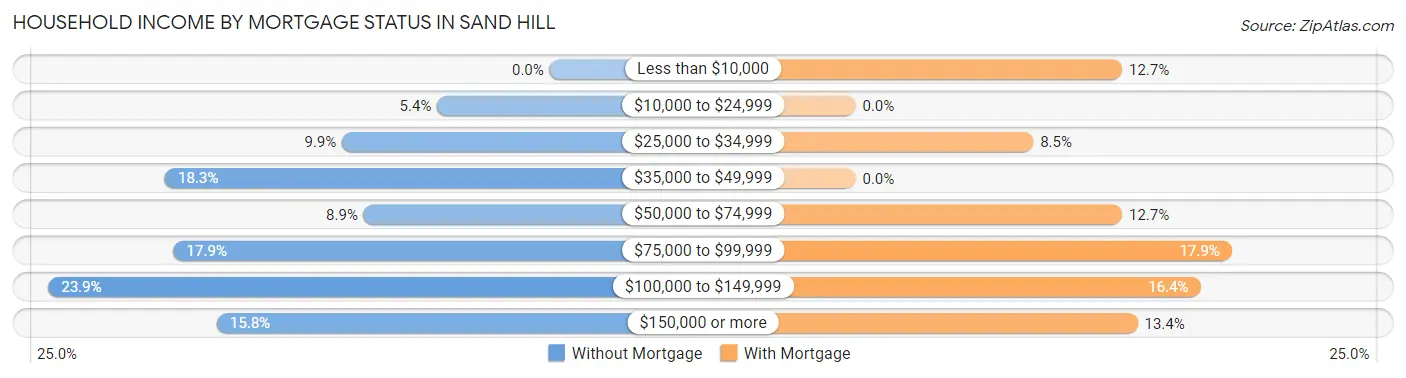
| Household Income | Without Mortgage | With Mortgage |
| Less than $10,000 | 0 (0.0%) | 51 (12.7%) |
| $10,000 to $24,999 | 26 (5.3%) | 0 (0.0%) |
| $25,000 to $34,999 | 48 (9.9%) | 34 (8.5%) |
| $35,000 to $49,999 | 89 (18.3%) | 0 (0.0%) |
| $50,000 to $74,999 | 43 (8.8%) | 51 (12.7%) |
| $75,000 to $99,999 | 87 (17.9%) | 72 (17.9%) |
| $100,000 to $149,999 | 116 (23.9%) | 66 (16.4%) |
| $150,000 or more | 77 (15.8%) | 54 (13.4%) |
| Total | 486 (100.0%) | 402 (100.0%) |
Property Value to Household Income Ratio in Sand Hill
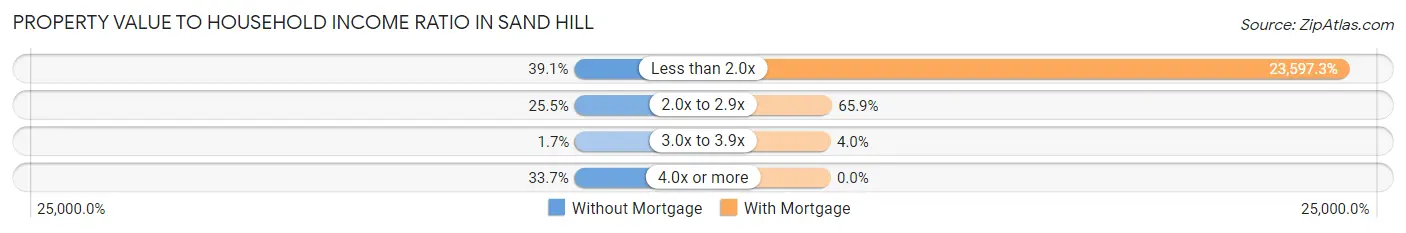
| Value-to-Income Ratio | Without Mortgage | With Mortgage |
| Less than 2.0x | 190 (39.1%) | 94,861 (23,597.3%) |
| 2.0x to 2.9x | 124 (25.5%) | 265 (65.9%) |
| 3.0x to 3.9x | 8 (1.7%) | 16 (4.0%) |
| 4.0x or more | 164 (33.7%) | 0 (0.0%) |
| Total | 486 (100.0%) | 402 (100.0%) |
Real Estate Taxes by Mortgage Status in Sand Hill
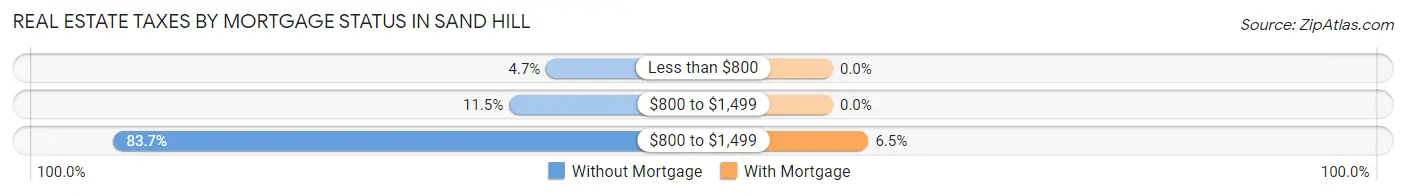
| Property Taxes | Without Mortgage | With Mortgage |
| Less than $800 | 23 (4.7%) | 0 (0.0%) |
| $800 to $1,499 | 56 (11.5%) | 0 (0.0%) |
| $800 to $1,499 | 407 (83.7%) | 26 (6.5%) |
| Total | 486 (100.0%) | 402 (100.0%) |
Health & Disability in Sand Hill
Health Insurance Coverage by Age in Sand Hill
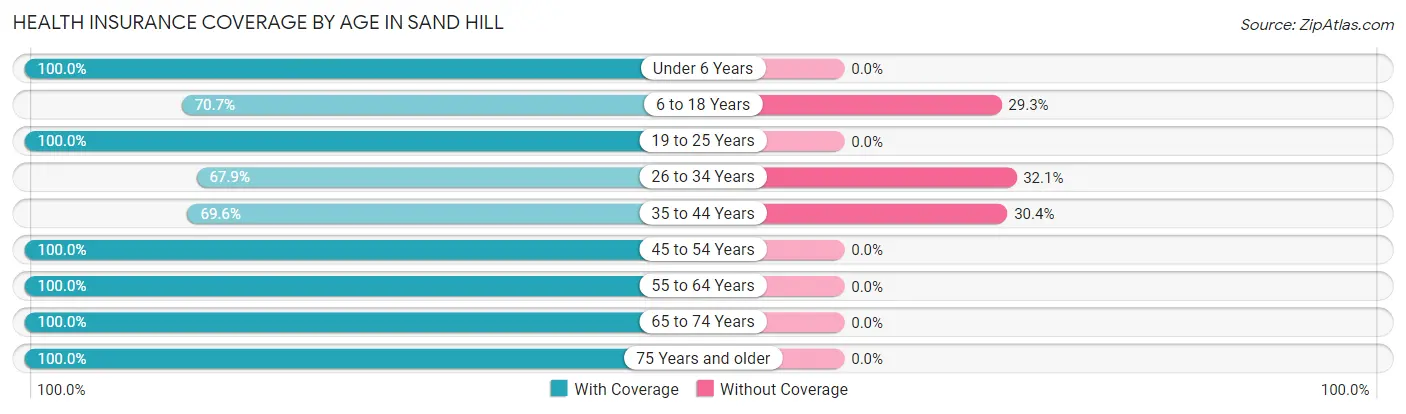
| Age Bracket | With Coverage | Without Coverage |
| Under 6 Years | 79 (100.0%) | 0 (0.0%) |
| 6 to 18 Years | 193 (70.7%) | 80 (29.3%) |
| 19 to 25 Years | 139 (100.0%) | 0 (0.0%) |
| 26 to 34 Years | 231 (67.9%) | 109 (32.1%) |
| 35 to 44 Years | 126 (69.6%) | 55 (30.4%) |
| 45 to 54 Years | 330 (100.0%) | 0 (0.0%) |
| 55 to 64 Years | 477 (100.0%) | 0 (0.0%) |
| 65 to 74 Years | 658 (100.0%) | 0 (0.0%) |
| 75 Years and older | 49 (100.0%) | 0 (0.0%) |
| Total | 2,282 (90.3%) | 244 (9.7%) |
Health Insurance Coverage by Citizenship Status in Sand Hill
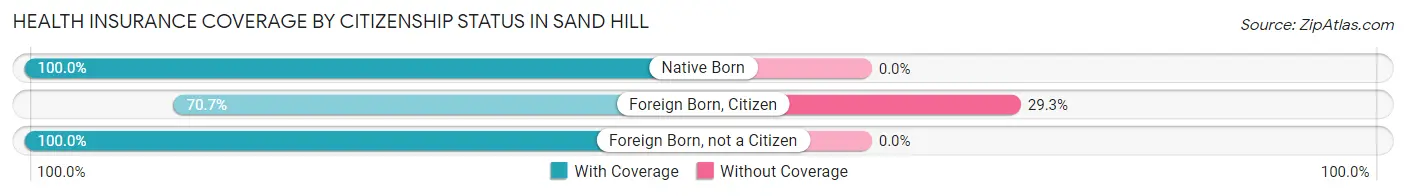
| Citizenship Status | With Coverage | Without Coverage |
| Native Born | 79 (100.0%) | 0 (0.0%) |
| Foreign Born, Citizen | 193 (70.7%) | 80 (29.3%) |
| Foreign Born, not a Citizen | 139 (100.0%) | 0 (0.0%) |
Health Insurance Coverage by Household Income in Sand Hill
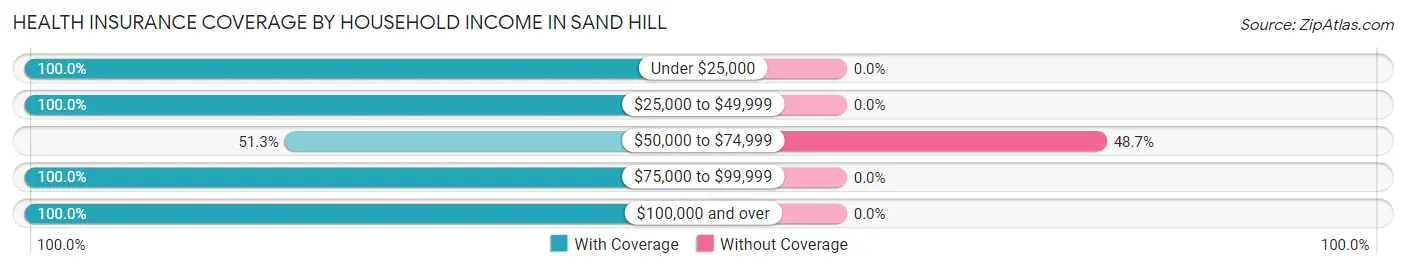
| Household Income | With Coverage | Without Coverage |
| Under $25,000 | 150 (100.0%) | 0 (0.0%) |
| $25,000 to $49,999 | 304 (100.0%) | 0 (0.0%) |
| $50,000 to $74,999 | 257 (51.3%) | 244 (48.7%) |
| $75,000 to $99,999 | 294 (100.0%) | 0 (0.0%) |
| $100,000 and over | 1,277 (100.0%) | 0 (0.0%) |
Public vs Private Health Insurance Coverage by Age in Sand Hill
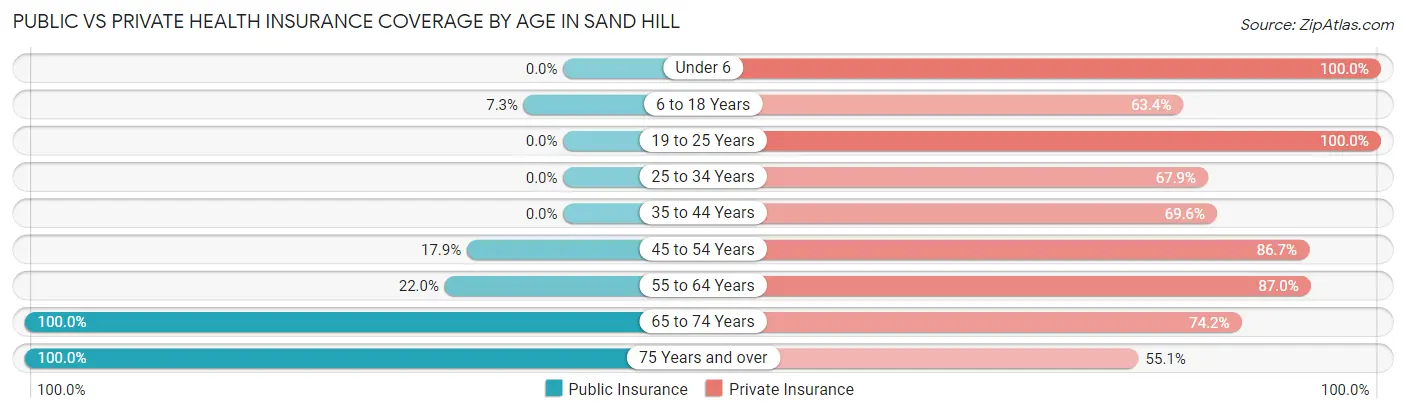
| Age Bracket | Public Insurance | Private Insurance |
| Under 6 | 0 (0.0%) | 79 (100.0%) |
| 6 to 18 Years | 20 (7.3%) | 173 (63.4%) |
| 19 to 25 Years | 0 (0.0%) | 139 (100.0%) |
| 25 to 34 Years | 0 (0.0%) | 231 (67.9%) |
| 35 to 44 Years | 0 (0.0%) | 126 (69.6%) |
| 45 to 54 Years | 59 (17.9%) | 286 (86.7%) |
| 55 to 64 Years | 105 (22.0%) | 415 (87.0%) |
| 65 to 74 Years | 658 (100.0%) | 488 (74.2%) |
| 75 Years and over | 49 (100.0%) | 27 (55.1%) |
| Total | 891 (35.3%) | 1,964 (77.7%) |
Disability Status by Sex by Age in Sand Hill
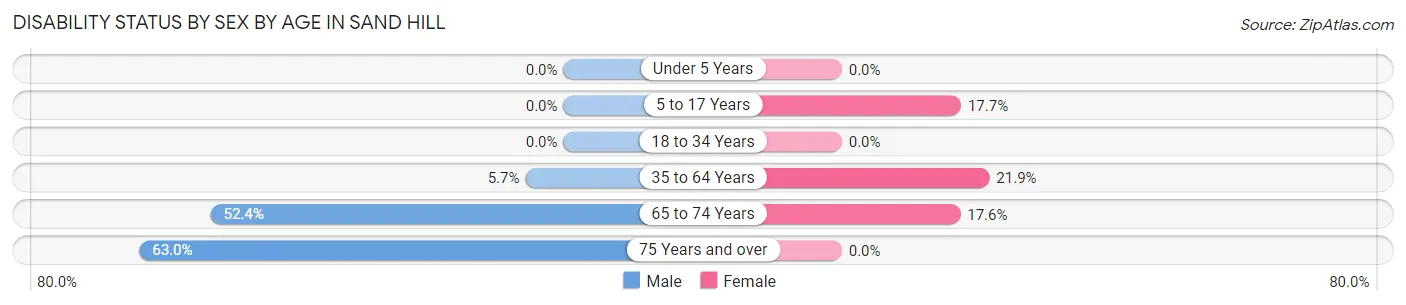
| Age Bracket | Male | Female |
| Under 5 Years | 0 (0.0%) | 0 (0.0%) |
| 5 to 17 Years | 0 (0.0%) | 20 (17.7%) |
| 18 to 34 Years | 0 (0.0%) | 0 (0.0%) |
| 35 to 64 Years | 37 (5.7%) | 73 (21.9%) |
| 65 to 74 Years | 166 (52.4%) | 60 (17.6%) |
| 75 Years and over | 17 (63.0%) | 0 (0.0%) |
Disability Class by Sex by Age in Sand Hill
Disability Class: Hearing Difficulty
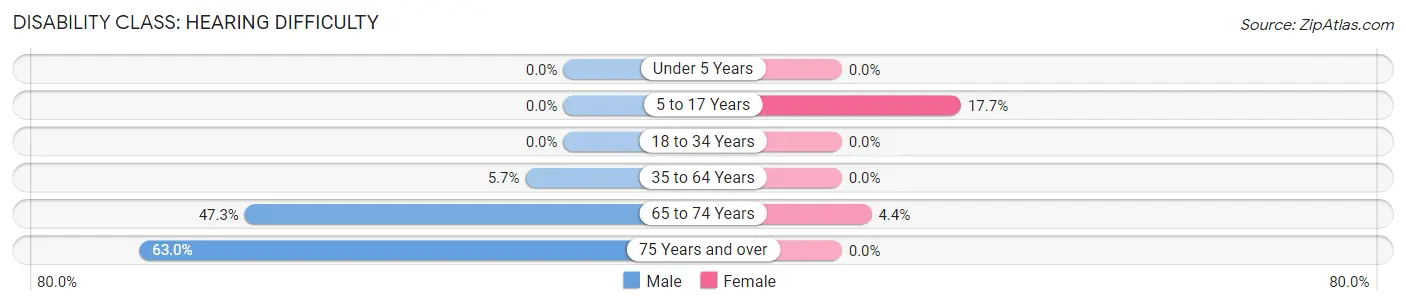
| Age Bracket | Male | Female |
| Under 5 Years | 0 (0.0%) | 0 (0.0%) |
| 5 to 17 Years | 0 (0.0%) | 20 (17.7%) |
| 18 to 34 Years | 0 (0.0%) | 0 (0.0%) |
| 35 to 64 Years | 37 (5.7%) | 0 (0.0%) |
| 65 to 74 Years | 150 (47.3%) | 15 (4.4%) |
| 75 Years and over | 17 (63.0%) | 0 (0.0%) |
Disability Class: Vision Difficulty
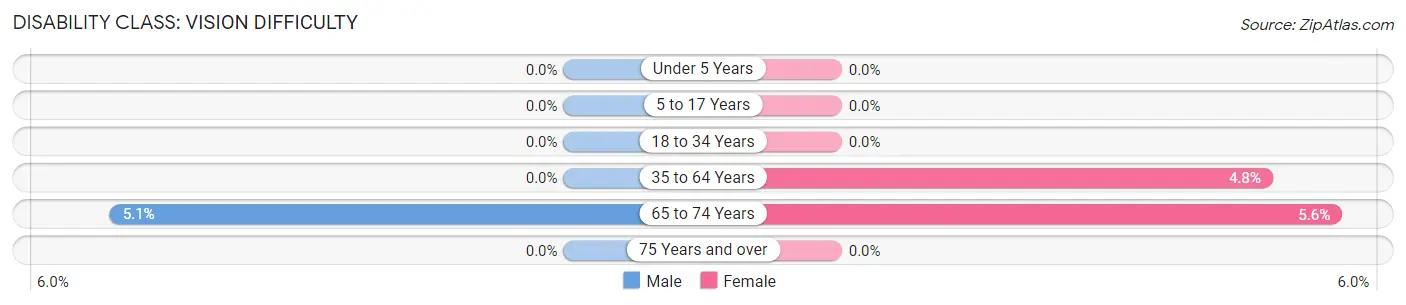
| Age Bracket | Male | Female |
| Under 5 Years | 0 (0.0%) | 0 (0.0%) |
| 5 to 17 Years | 0 (0.0%) | 0 (0.0%) |
| 18 to 34 Years | 0 (0.0%) | 0 (0.0%) |
| 35 to 64 Years | 0 (0.0%) | 16 (4.8%) |
| 65 to 74 Years | 16 (5.1%) | 19 (5.6%) |
| 75 Years and over | 0 (0.0%) | 0 (0.0%) |
Disability Class: Cognitive Difficulty
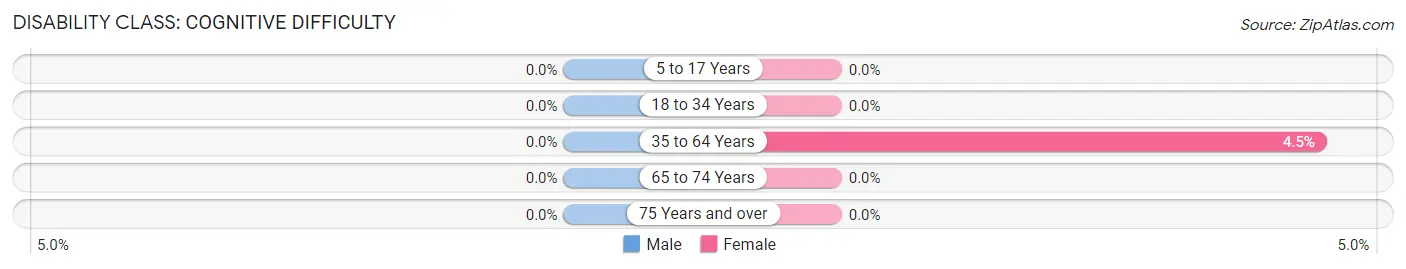
| Age Bracket | Male | Female |
| 5 to 17 Years | 0 (0.0%) | 0 (0.0%) |
| 18 to 34 Years | 0 (0.0%) | 0 (0.0%) |
| 35 to 64 Years | 0 (0.0%) | 15 (4.5%) |
| 65 to 74 Years | 0 (0.0%) | 0 (0.0%) |
| 75 Years and over | 0 (0.0%) | 0 (0.0%) |
Disability Class: Ambulatory Difficulty
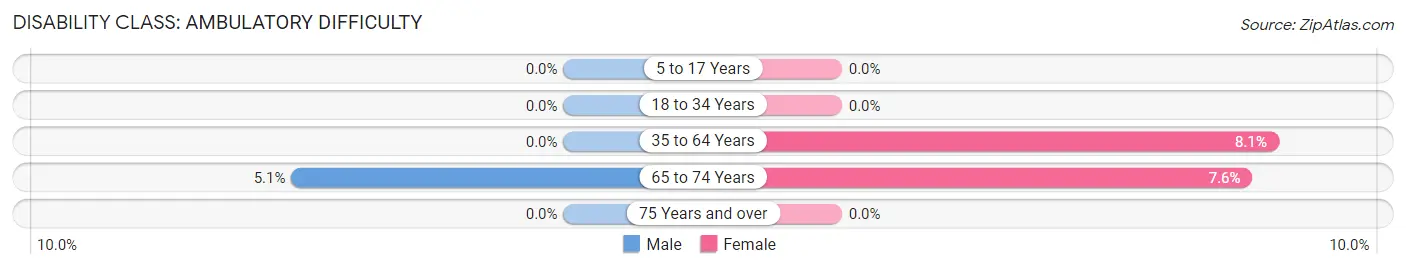
| Age Bracket | Male | Female |
| 5 to 17 Years | 0 (0.0%) | 0 (0.0%) |
| 18 to 34 Years | 0 (0.0%) | 0 (0.0%) |
| 35 to 64 Years | 0 (0.0%) | 27 (8.1%) |
| 65 to 74 Years | 16 (5.1%) | 26 (7.6%) |
| 75 Years and over | 0 (0.0%) | 0 (0.0%) |
Disability Class: Self-Care Difficulty
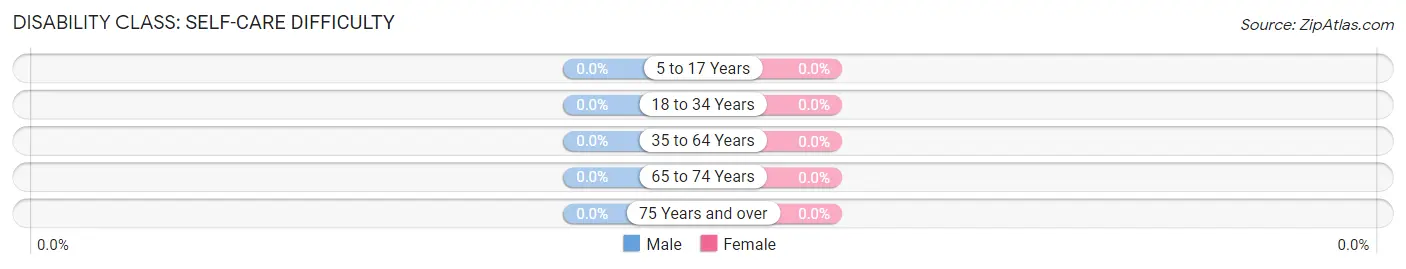
| Age Bracket | Male | Female |
| 5 to 17 Years | 0 (0.0%) | 0 (0.0%) |
| 18 to 34 Years | 0 (0.0%) | 0 (0.0%) |
| 35 to 64 Years | 0 (0.0%) | 0 (0.0%) |
| 65 to 74 Years | 0 (0.0%) | 0 (0.0%) |
| 75 Years and over | 0 (0.0%) | 0 (0.0%) |
Technology Access in Sand Hill
Computing Device Access in Sand Hill
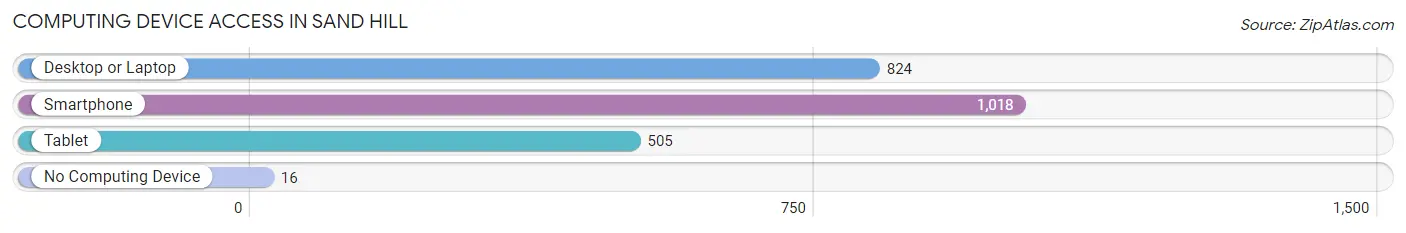
| Device Type | # Households | % Households |
| Desktop or Laptop | 824 | 78.2% |
| Smartphone | 1,018 | 96.7% |
| Tablet | 505 | 48.0% |
| No Computing Device | 16 | 1.5% |
| Total | 1,053 | 100.0% |
Internet Access in Sand Hill
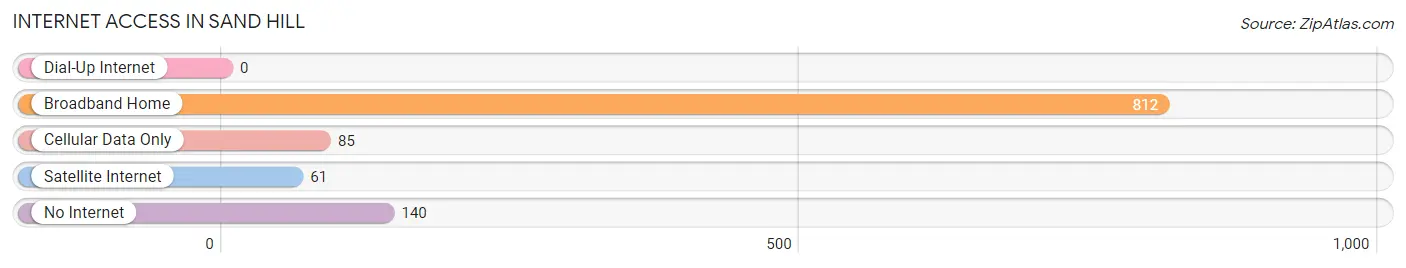
| Internet Type | # Households | % Households |
| Dial-Up Internet | 0 | 0.0% |
| Broadband Home | 812 | 77.1% |
| Cellular Data Only | 85 | 8.1% |
| Satellite Internet | 61 | 5.8% |
| No Internet | 140 | 13.3% |
| Total | 1,053 | 100.0% |
Sand Hill Summary
Sand Hill is a small unincorporated community located in the southeastern corner of Pennsylvania, in the United States. It is situated in the northern part of Bucks County, approximately 25 miles north of Philadelphia. The community is located in the Delaware Valley, and is part of the Philadelphia metropolitan area.
History
The area that is now Sand Hill was originally inhabited by the Lenape Native Americans. The first European settlers arrived in the area in the late 17th century, and the community was established in 1737. The community was named after the sand hills that were located in the area.
In the 19th century, the community was a rural farming area, and the main industry was agriculture. The area was also known for its iron ore deposits, which were mined and used to produce iron products.
Geography
Sand Hill is located in the northern part of Bucks County, approximately 25 miles north of Philadelphia. The community is situated in the Delaware Valley, and is part of the Philadelphia metropolitan area. The area is characterized by rolling hills and valleys, and is mostly rural in nature.
The climate in Sand Hill is humid subtropical, with hot, humid summers and cold, wet winters. The average annual temperature is around 54°F, and the average annual precipitation is around 42 inches.
Economy
The economy of Sand Hill is largely based on agriculture and tourism. The area is home to several farms, which produce a variety of crops, including corn, soybeans, wheat, and hay. The area is also known for its apple orchards, which produce a variety of apples, including Honeycrisp, Gala, and Golden Delicious.
The area is also home to several wineries, which produce a variety of wines, including Chardonnay, Merlot, and Cabernet Sauvignon. The area is also known for its craft breweries, which produce a variety of beers, including IPAs, stouts, and lagers.
The area is also home to several tourist attractions, including the Bucks County Historical Society, the Bucks County Playhouse, and the Bucks County Civil War Museum.
Demographics
As of the 2010 census, the population of Sand Hill was 1,845. The racial makeup of the community was 94.3% White, 2.2% African American, 0.3% Native American, 0.7% Asian, 0.1% Pacific Islander, 0.7% from other races, and 1.7% from two or more races. Hispanic or Latino of any race were 2.2% of the population.
The median household income in Sand Hill was $60,938, and the median family income was $68,750. The per capita income was $25,945. About 4.3% of families and 5.7% of the population were below the poverty line, including 8.2% of those under age 18 and 4.2% of those age 65 or over.
Common Questions
What is the Total Population of Sand Hill?
Total Population of Sand Hill is 2,526.
What is the Total Male Population of Sand Hill?
Total Male Population of Sand Hill is 1,419.
What is the Total Female Population of Sand Hill?
Total Female Population of Sand Hill is 1,107.
What is the Ratio of Males per 100 Females in Sand Hill?
There are 128.18 Males per 100 Females in Sand Hill.
What is the Ratio of Females per 100 Males in Sand Hill?
There are 78.01 Females per 100 Males in Sand Hill.
What is the Median Population Age in Sand Hill?
Median Population Age in Sand Hill is 53.6 Years.
What is the Average Family Size in Sand Hill
Average Family Size in Sand Hill is 3.0 People.
What is the Average Household Size in Sand Hill
Average Household Size in Sand Hill is 2.4 People.
What is Per Capita Income in Sand Hill?
Per Capita income in Sand Hill is $40,562.
What is the Median Family Income in Sand Hill?
Median Family Income in Sand Hill is $106,382.
What is the Median Household income in Sand Hill?
Median Household Income in Sand Hill is $81,625.
What is Income or Wage Gap in Sand Hill?
Income or Wage Gap in Sand Hill is 8.6%.
Women in Sand Hill earn 91.4 cents for every dollar earned by a man.
What is Inequality or Gini Index in Sand Hill?
Inequality or Gini Index in Sand Hill is 0.39.
How Large is the Labor Force in Sand Hill?
There are 1,495 People in the Labor Forcein in Sand Hill.
What is the Percentage of People in the Labor Force in Sand Hill?
67.0% of People are in the Labor Force in Sand Hill.
What is the Unemployment Rate in Sand Hill?
Unemployment Rate in Sand Hill is 1.7%.