Rennerdale, PA
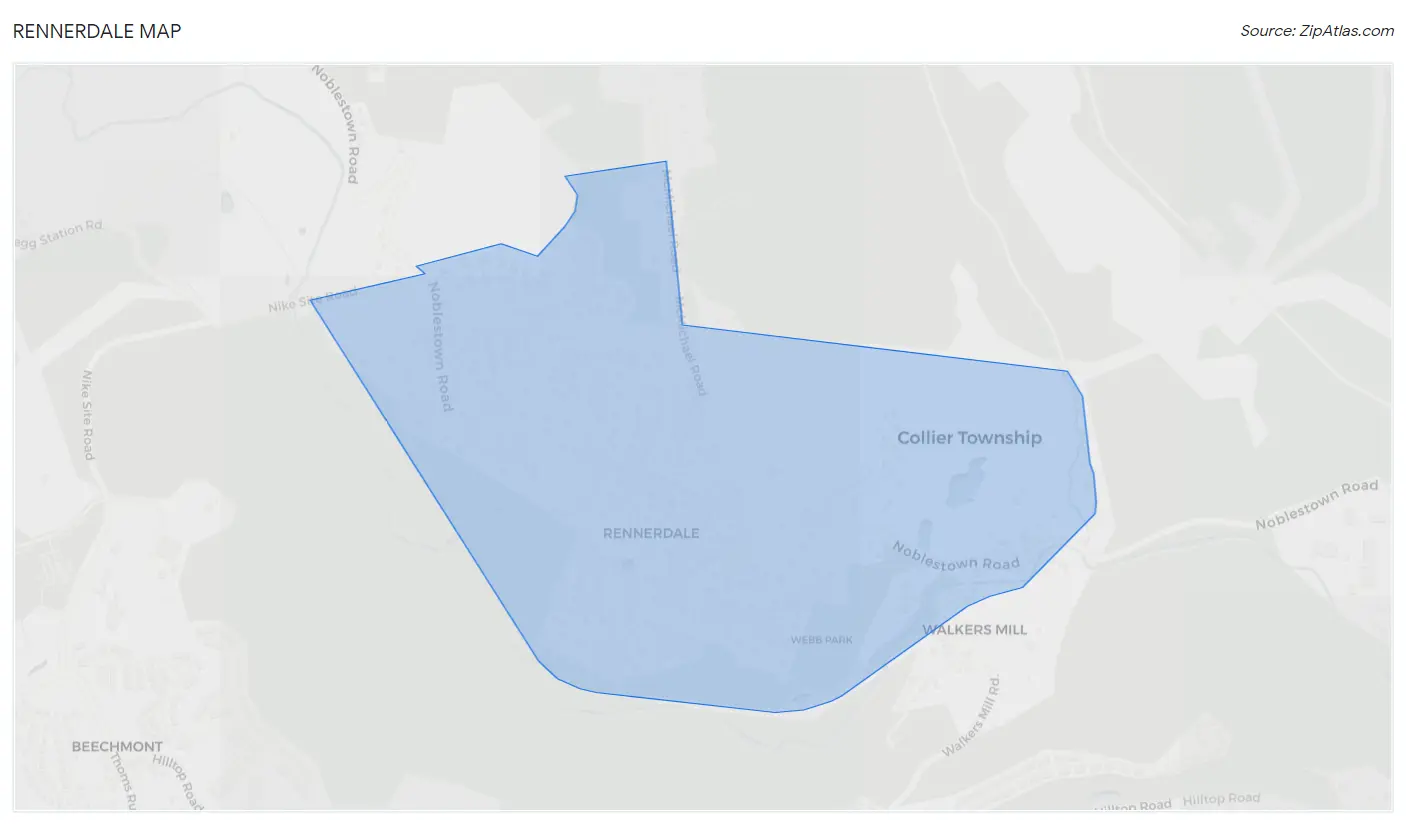
Rennerdale Map
Rennerdale Overview
955
TOTAL POPULATION
485
MALE POPULATION
470
FEMALE POPULATION
103.19
MALES / 100 FEMALES
96.91
FEMALES / 100 MALES
60.2
MEDIAN AGE
2.5
AVG FAMILY SIZE
2.0
AVG HOUSEHOLD SIZE
$46,374
PER CAPITA INCOME
$125,453
AVG FAMILY INCOME
$67,632
AVG HOUSEHOLD INCOME
16.1%
WAGE / INCOME GAP [ % ]
83.9¢/ $1
WAGE / INCOME GAP [ $ ]
0.40
INEQUALITY / GINI INDEX
490
LABOR FORCE [ PEOPLE ]
55.8%
PERCENT IN LABOR FORCE
5.9%
UNEMPLOYMENT RATE
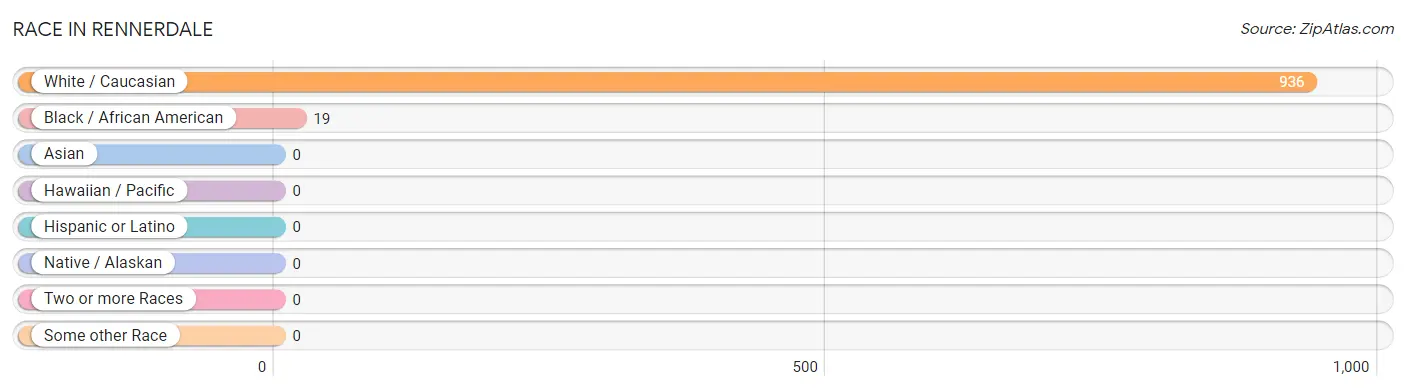
Race in Rennerdale
The most populous races in Rennerdale are White / Caucasian (936 | 98.0%), and Black / African American (19 | 2.0%).
| Race | # Population | % Population |
| Asian | 0 | 0.0% |
| Black / African American | 19 | 2.0% |
| Hawaiian / Pacific | 0 | 0.0% |
| Hispanic or Latino | 0 | 0.0% |
| Native / Alaskan | 0 | 0.0% |
| White / Caucasian | 936 | 98.0% |
| Two or more Races | 0 | 0.0% |
| Some other Race | 0 | 0.0% |
| Total | 955 | 100.0% |
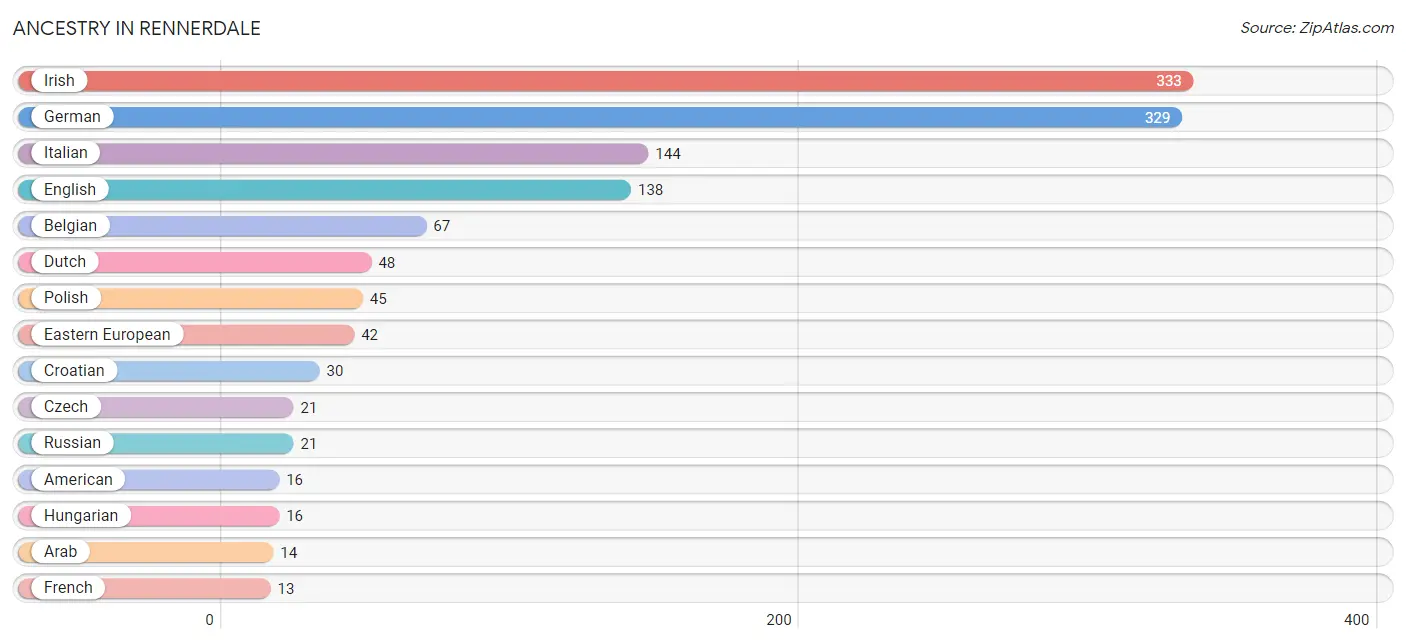
Ancestry in Rennerdale
The most populous ancestries reported in Rennerdale are Irish (333 | 34.9%), German (329 | 34.4%), Italian (144 | 15.1%), English (138 | 14.4%), and Belgian (67 | 7.0%), together accounting for 105.9% of all Rennerdale residents.
| Ancestry | # Population | % Population |
| American | 16 | 1.7% |
| Arab | 14 | 1.5% |
| Belgian | 67 | 7.0% |
| Croatian | 30 | 3.1% |
| Czech | 21 | 2.2% |
| Dutch | 48 | 5.0% |
| Eastern European | 42 | 4.4% |
| English | 138 | 14.4% |
| French | 13 | 1.4% |
| German | 329 | 34.4% |
| Hungarian | 16 | 1.7% |
| Irish | 333 | 34.9% |
| Italian | 144 | 15.1% |
| Polish | 45 | 4.7% |
| Russian | 21 | 2.2% |
| Scotch-Irish | 13 | 1.4% | View All 16 Rows |
Immigrants in Rennerdale

| Immigration Origin | # Population | % Population | View All 0 Rows |
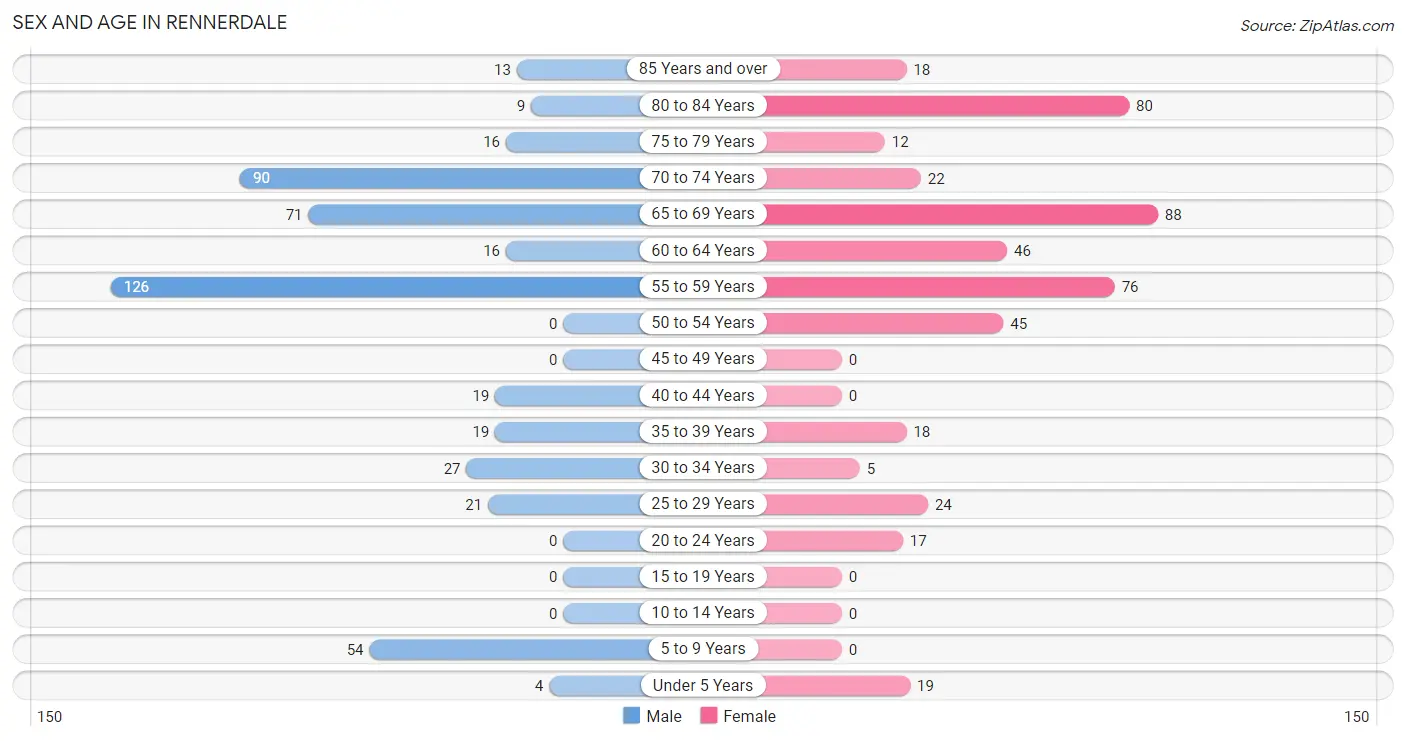
Sex and Age in Rennerdale
Sex and Age in Rennerdale
The most populous age groups in Rennerdale are 55 to 59 Years (126 | 26.0%) for men and 65 to 69 Years (88 | 18.7%) for women.
| Age Bracket | Male | Female |
| Under 5 Years | 4 (0.8%) | 19 (4.0%) |
| 5 to 9 Years | 54 (11.1%) | 0 (0.0%) |
| 10 to 14 Years | 0 (0.0%) | 0 (0.0%) |
| 15 to 19 Years | 0 (0.0%) | 0 (0.0%) |
| 20 to 24 Years | 0 (0.0%) | 17 (3.6%) |
| 25 to 29 Years | 21 (4.3%) | 24 (5.1%) |
| 30 to 34 Years | 27 (5.6%) | 5 (1.1%) |
| 35 to 39 Years | 19 (3.9%) | 18 (3.8%) |
| 40 to 44 Years | 19 (3.9%) | 0 (0.0%) |
| 45 to 49 Years | 0 (0.0%) | 0 (0.0%) |
| 50 to 54 Years | 0 (0.0%) | 45 (9.6%) |
| 55 to 59 Years | 126 (26.0%) | 76 (16.2%) |
| 60 to 64 Years | 16 (3.3%) | 46 (9.8%) |
| 65 to 69 Years | 71 (14.6%) | 88 (18.7%) |
| 70 to 74 Years | 90 (18.6%) | 22 (4.7%) |
| 75 to 79 Years | 16 (3.3%) | 12 (2.5%) |
| 80 to 84 Years | 9 (1.9%) | 80 (17.0%) |
| 85 Years and over | 13 (2.7%) | 18 (3.8%) |
| Total | 485 (100.0%) | 470 (100.0%) |
Families and Households in Rennerdale
Median Family Size in Rennerdale
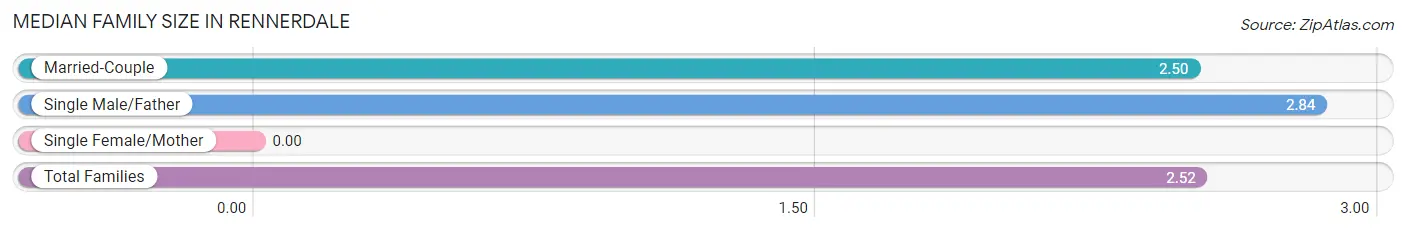
| Family Type | # Families | Family Size |
| Married-Couple | 254 (93.0%) | 2.50 |
| Single Male/Father | 19 (7.0%) | 2.84 |
| Single Female/Mother | 0 (0.0%) | - |
| Total Families | 273 (100.0%) | 2.52 |
Median Household Size in Rennerdale
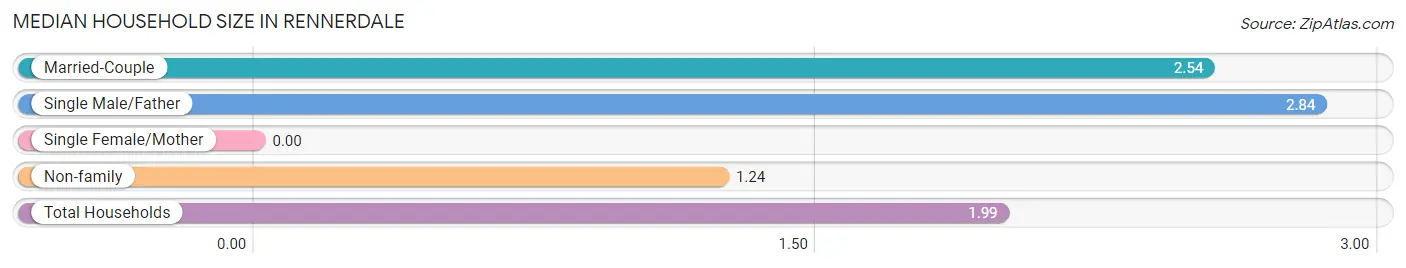
| Household Type | # Households | Household Size |
| Married-Couple | 254 (53.1%) | 2.54 |
| Single Male/Father | 19 (4.0%) | 2.84 |
| Single Female/Mother | 0 (0.0%) | - |
| Non-family | 205 (42.9%) | 1.24 |
| Total Households | 478 (100.0%) | 1.99 |
Household Size by Marriage Status in Rennerdale
Out of a total of 478 households in Rennerdale, 273 (57.1%) are family households, while 205 (42.9%) are nonfamily households. The most numerous type of family households are 2-person households, comprising 161, and the most common type of nonfamily households are 1-person households, comprising 157.
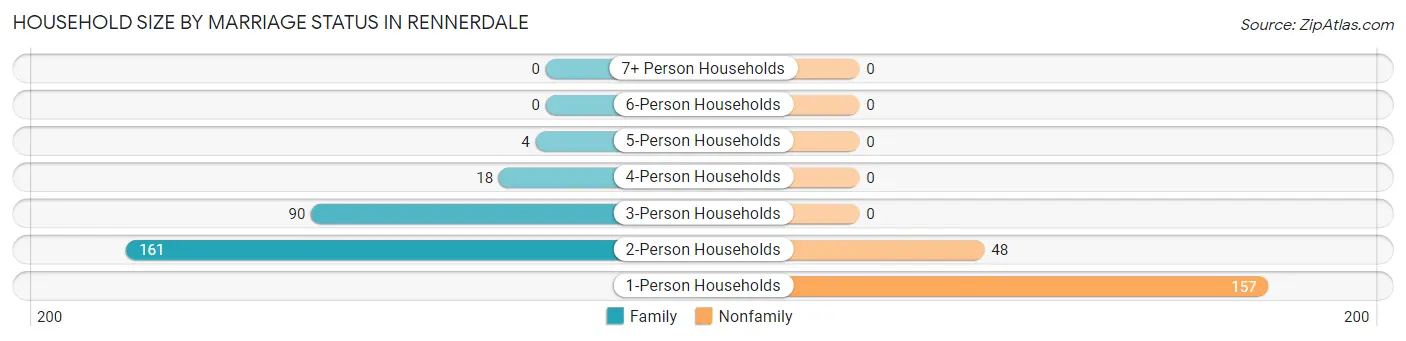
| Household Size | Family Households | Nonfamily Households |
| 1-Person Households | - | 157 (32.9%) |
| 2-Person Households | 161 (33.7%) | 48 (10.0%) |
| 3-Person Households | 90 (18.8%) | 0 (0.0%) |
| 4-Person Households | 18 (3.8%) | 0 (0.0%) |
| 5-Person Households | 4 (0.8%) | 0 (0.0%) |
| 6-Person Households | 0 (0.0%) | 0 (0.0%) |
| 7+ Person Households | 0 (0.0%) | 0 (0.0%) |
| Total | 273 (57.1%) | 205 (42.9%) |
Female Fertility in Rennerdale
Fertility by Age in Rennerdale
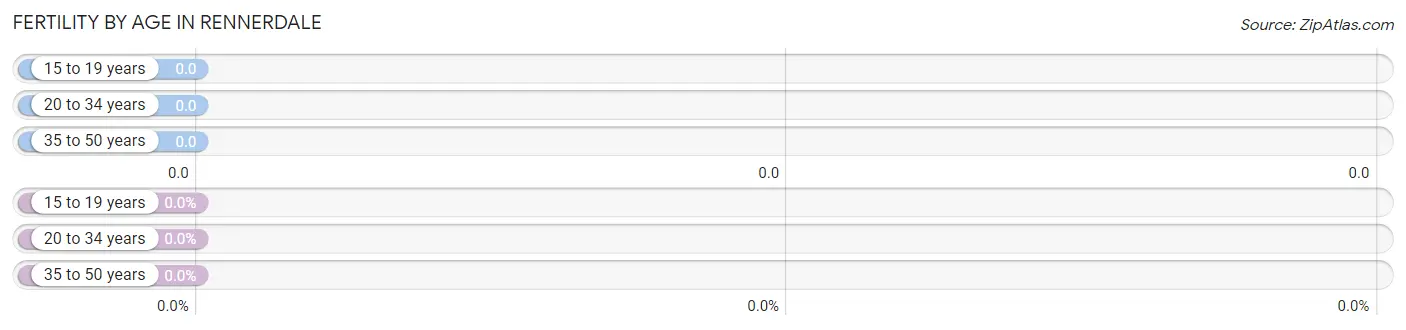
| Age Bracket | Women with Births | Births / 1,000 Women |
| 15 to 19 years | 0 (0.0%) | 0.0 |
| 20 to 34 years | 0 (0.0%) | 0.0 |
| 35 to 50 years | 0 (0.0%) | 0.0 |
| Total | 0 (0.0%) | 0.0 |
Fertility by Age by Marriage Status in Rennerdale
| Age Bracket | Married | Unmarried |
| 15 to 19 years | 0 (0.0%) | 0 (0.0%) |
| 20 to 34 years | 0 (0.0%) | 0 (0.0%) |
| 35 to 50 years | 0 (0.0%) | 0 (0.0%) |
| Total | 0 (0.0%) | 0 (0.0%) |
Fertility by Education in Rennerdale
| Educational Attainment | Women with Births | Births / 1,000 Women |
| Less than High School | 0 (0.0%) | 0.0 |
| High School Diploma | 0 (0.0%) | 0.0 |
| College or Associate's Degree | 0 (0.0%) | 0.0 |
| Bachelor's Degree | 0 (0.0%) | 0.0 |
| Graduate Degree | 0 (0.0%) | 0.0 |
| Total | 0 (0.0%) | 0.0 |
Fertility by Education by Marriage Status in Rennerdale
| Educational Attainment | Married | Unmarried |
| Less than High School | 0 (0.0%) | 0 (0.0%) |
| High School Diploma | 0 (0.0%) | 0 (0.0%) |
| College or Associate's Degree | 0 (0.0%) | 0 (0.0%) |
| Bachelor's Degree | 0 (0.0%) | 0 (0.0%) |
| Graduate Degree | 0 (0.0%) | 0 (0.0%) |
| Total | 0 (0.0%) | 0 (0.0%) |
Income in Rennerdale
Income Overview in Rennerdale
Per Capita Income in Rennerdale is $46,374, while median incomes of families and households are $125,453 and $67,632 respectively.
| Characteristic | Number | Measure |
| Per Capita Income | 955 | $46,374 |
| Median Family Income | 273 | $125,453 |
| Mean Family Income | 273 | $123,071 |
| Median Household Income | 478 | $67,632 |
| Mean Household Income | 478 | $91,694 |
| Income Deficit | 273 | $0 |
| Wage / Income Gap (%) | 955 | 16.08% |
| Wage / Income Gap ($) | 955 | 83.92¢ per $1 |
| Gini / Inequality Index | 955 | 0.40 |
Earnings by Sex in Rennerdale
Average Earnings in Rennerdale are $56,352, $66,146 for men and $55,510 for women, a difference of 16.1%.
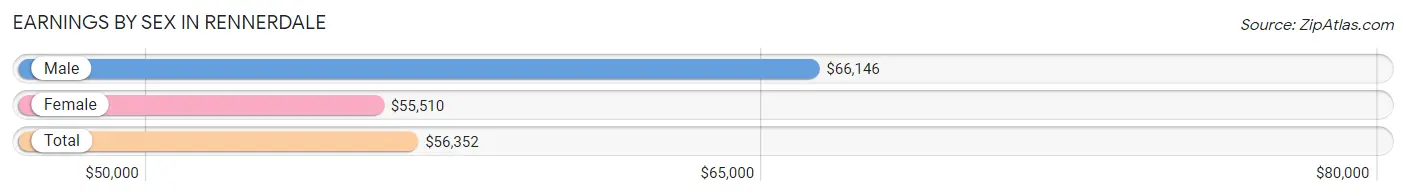
| Sex | Number | Average Earnings |
| Male | 287 (57.8%) | $66,146 |
| Female | 210 (42.2%) | $55,510 |
| Total | 497 (100.0%) | $56,352 |
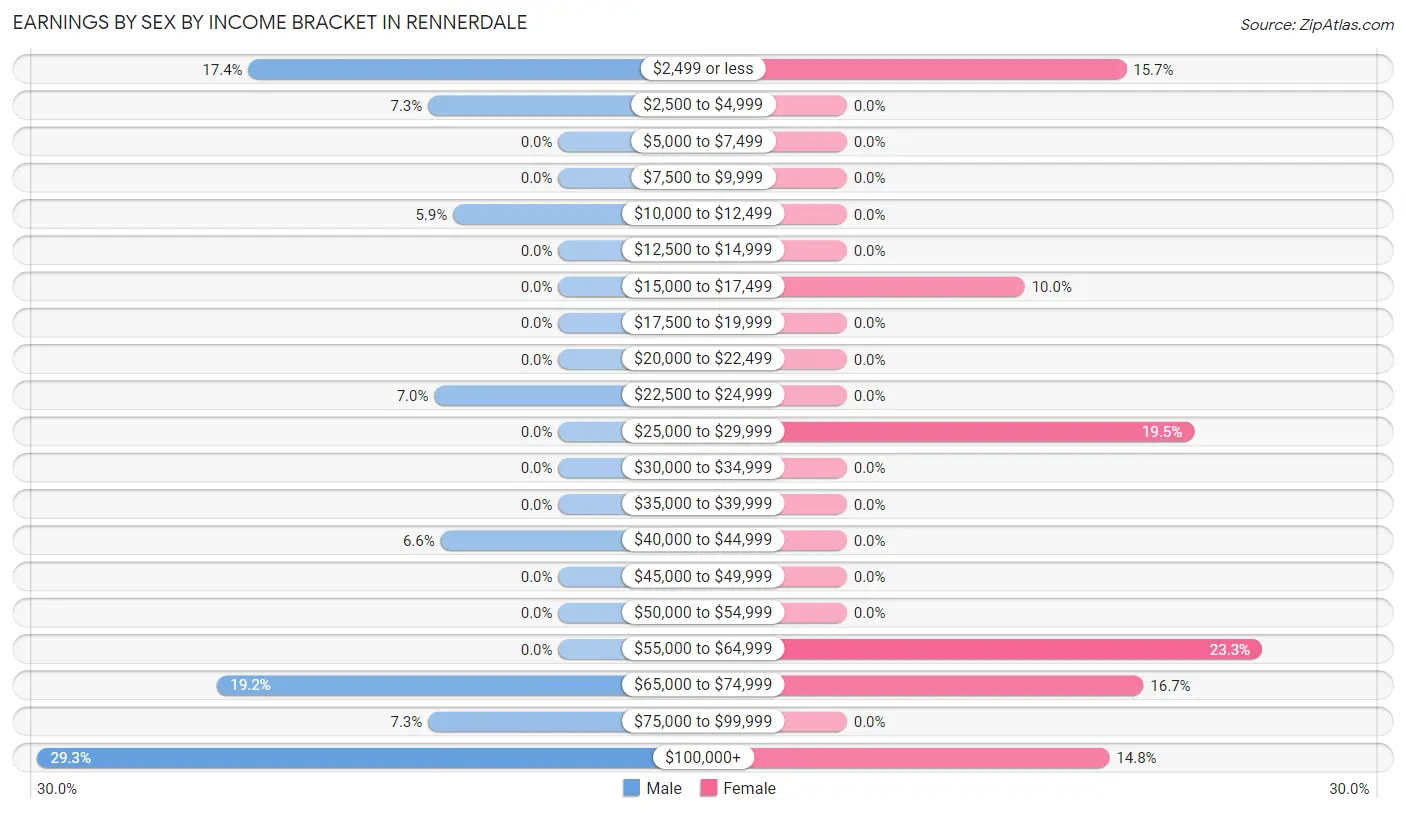
Earnings by Sex by Income Bracket in Rennerdale
The most common earnings brackets in Rennerdale are $100,000+ for men (84 | 29.3%) and $55,000 to $64,999 for women (49 | 23.3%).
| Income | Male | Female |
| $2,499 or less | 50 (17.4%) | 33 (15.7%) |
| $2,500 to $4,999 | 21 (7.3%) | 0 (0.0%) |
| $5,000 to $7,499 | 0 (0.0%) | 0 (0.0%) |
| $7,500 to $9,999 | 0 (0.0%) | 0 (0.0%) |
| $10,000 to $12,499 | 17 (5.9%) | 0 (0.0%) |
| $12,500 to $14,999 | 0 (0.0%) | 0 (0.0%) |
| $15,000 to $17,499 | 0 (0.0%) | 21 (10.0%) |
| $17,500 to $19,999 | 0 (0.0%) | 0 (0.0%) |
| $20,000 to $22,499 | 0 (0.0%) | 0 (0.0%) |
| $22,500 to $24,999 | 20 (7.0%) | 0 (0.0%) |
| $25,000 to $29,999 | 0 (0.0%) | 41 (19.5%) |
| $30,000 to $34,999 | 0 (0.0%) | 0 (0.0%) |
| $35,000 to $39,999 | 0 (0.0%) | 0 (0.0%) |
| $40,000 to $44,999 | 19 (6.6%) | 0 (0.0%) |
| $45,000 to $49,999 | 0 (0.0%) | 0 (0.0%) |
| $50,000 to $54,999 | 0 (0.0%) | 0 (0.0%) |
| $55,000 to $64,999 | 0 (0.0%) | 49 (23.3%) |
| $65,000 to $74,999 | 55 (19.2%) | 35 (16.7%) |
| $75,000 to $99,999 | 21 (7.3%) | 0 (0.0%) |
| $100,000+ | 84 (29.3%) | 31 (14.8%) |
| Total | 287 (100.0%) | 210 (100.0%) |
Earnings by Sex by Educational Attainment in Rennerdale
| Educational Attainment | Male Income | Female Income |
| Less than High School | - | - |
| High School Diploma | - | - |
| College or Associate's Degree | - | - |
| Bachelor's Degree | - | - |
| Graduate Degree | - | - |
| Total | $66,146 | $55,944 |
Family Income in Rennerdale
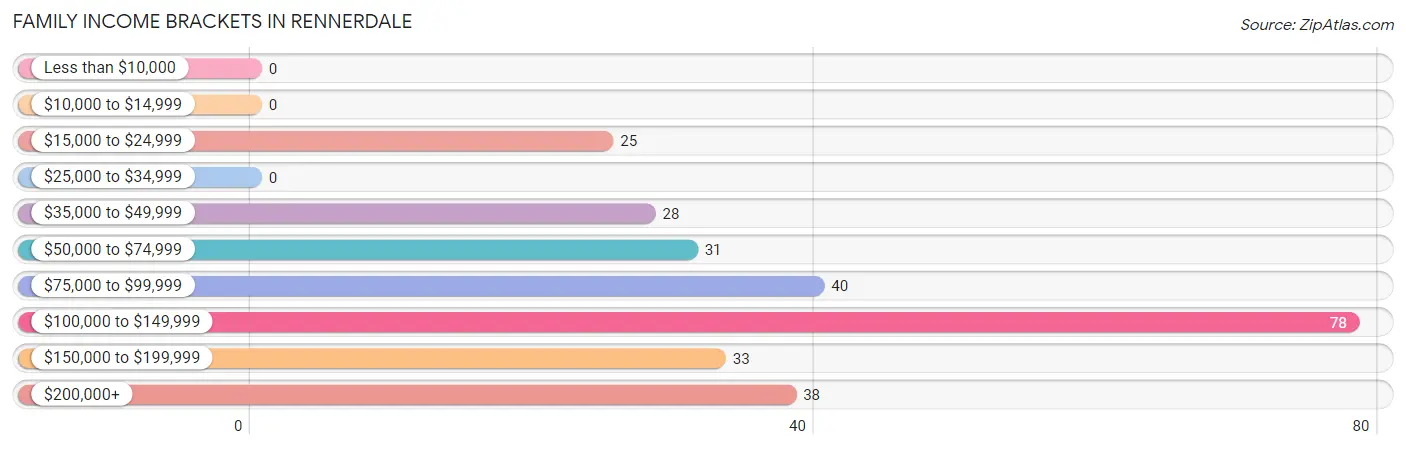
Family Income Brackets in Rennerdale
According to the Rennerdale family income data, there are 78 families falling into the $100,000 to $149,999 income range, which is the most common income bracket and makes up 28.6% of all families.
| Income Bracket | # Families | % Families |
| Less than $10,000 | 0 | 0.0% |
| $10,000 to $14,999 | 0 | 0.0% |
| $15,000 to $24,999 | 25 | 9.2% |
| $25,000 to $34,999 | 0 | 0.0% |
| $35,000 to $49,999 | 28 | 10.3% |
| $50,000 to $74,999 | 31 | 11.4% |
| $75,000 to $99,999 | 40 | 14.7% |
| $100,000 to $149,999 | 78 | 28.6% |
| $150,000 to $199,999 | 33 | 12.1% |
| $200,000+ | 38 | 13.9% |
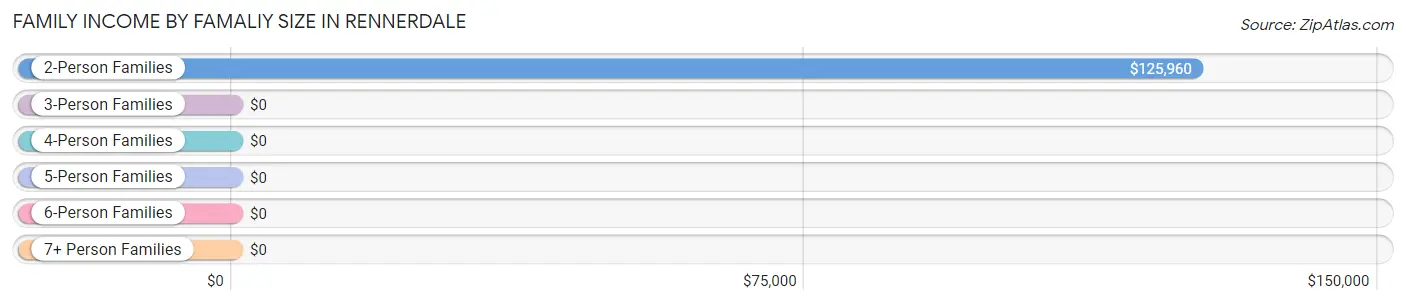
Family Income by Famaliy Size in Rennerdale
2-person families (161 | 59.0%) account for the highest median family income in Rennerdale with $125,960 per family, while 2-person families (161 | 59.0%) have the highest median income of $62,980 per family member.
| Income Bracket | # Families | Median Income |
| 2-Person Families | 161 (59.0%) | $125,960 |
| 3-Person Families | 94 (34.4%) | $0 |
| 4-Person Families | 18 (6.6%) | $0 |
| 5-Person Families | 0 (0.0%) | $0 |
| 6-Person Families | 0 (0.0%) | $0 |
| 7+ Person Families | 0 (0.0%) | $0 |
| Total | 273 (100.0%) | $125,453 |
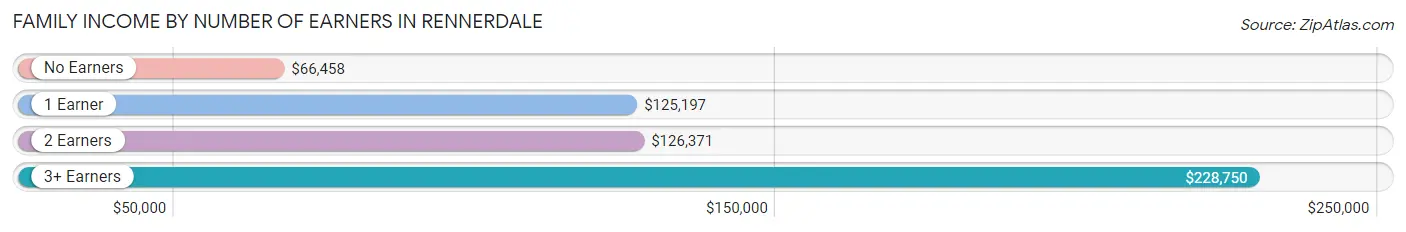
Family Income by Number of Earners in Rennerdale
The median family income in Rennerdale is $125,453, with families comprising 3+ earners (55) having the highest median family income of $228,750, while families with no earners (54) have the lowest median family income of $66,458, accounting for 20.2% and 19.8% of families, respectively.
| Number of Earners | # Families | Median Income |
| No Earners | 54 (19.8%) | $66,458 |
| 1 Earner | 94 (34.4%) | $125,197 |
| 2 Earners | 70 (25.6%) | $126,371 |
| 3+ Earners | 55 (20.2%) | $228,750 |
| Total | 273 (100.0%) | $125,453 |
Household Income in Rennerdale
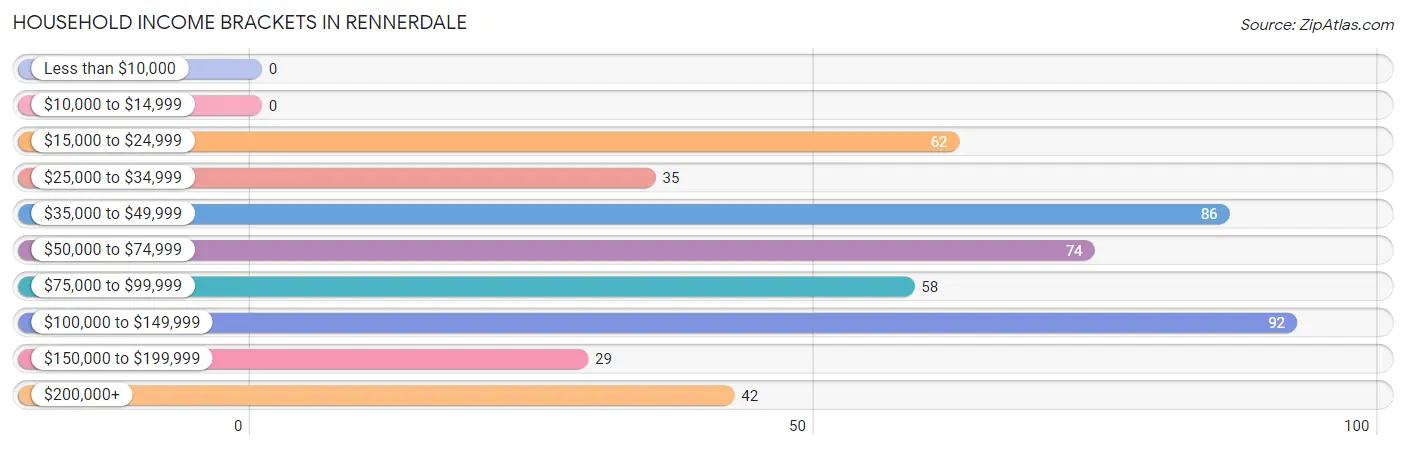
Household Income Brackets in Rennerdale
With 92 households falling in the category, the $100,000 to $149,999 income range is the most frequent in Rennerdale, accounting for 19.3% of all households.
| Income Bracket | # Households | % Households |
| Less than $10,000 | 0 | 0.0% |
| $10,000 to $14,999 | 0 | 0.0% |
| $15,000 to $24,999 | 62 | 13.0% |
| $25,000 to $34,999 | 35 | 7.3% |
| $35,000 to $49,999 | 86 | 18.0% |
| $50,000 to $74,999 | 74 | 15.5% |
| $75,000 to $99,999 | 58 | 12.1% |
| $100,000 to $149,999 | 92 | 19.2% |
| $150,000 to $199,999 | 29 | 6.1% |
| $200,000+ | 42 | 8.8% |
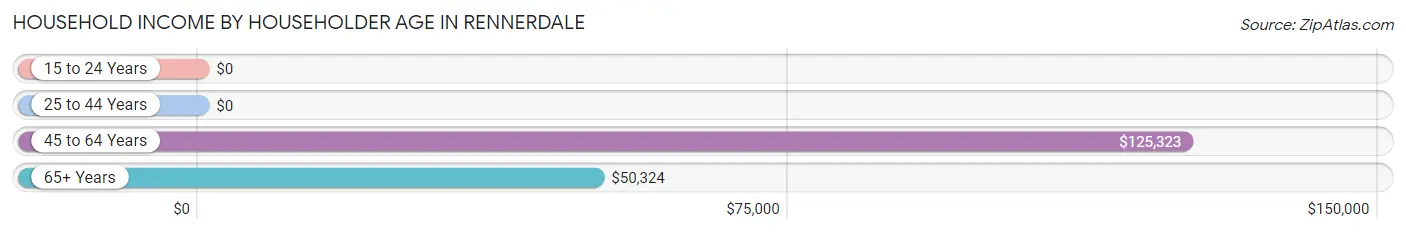
Household Income by Householder Age in Rennerdale
The median household income in Rennerdale is $67,632, with the highest median household income of $125,323 found in the 45 to 64 years age bracket for the primary householder. A total of 172 households (36.0%) fall into this category.
| Income Bracket | # Households | Median Income |
| 15 to 24 Years | 0 (0.0%) | $0 |
| 25 to 44 Years | 37 (7.7%) | $0 |
| 45 to 64 Years | 172 (36.0%) | $125,323 |
| 65+ Years | 269 (56.3%) | $50,324 |
| Total | 478 (100.0%) | $67,632 |
Poverty in Rennerdale
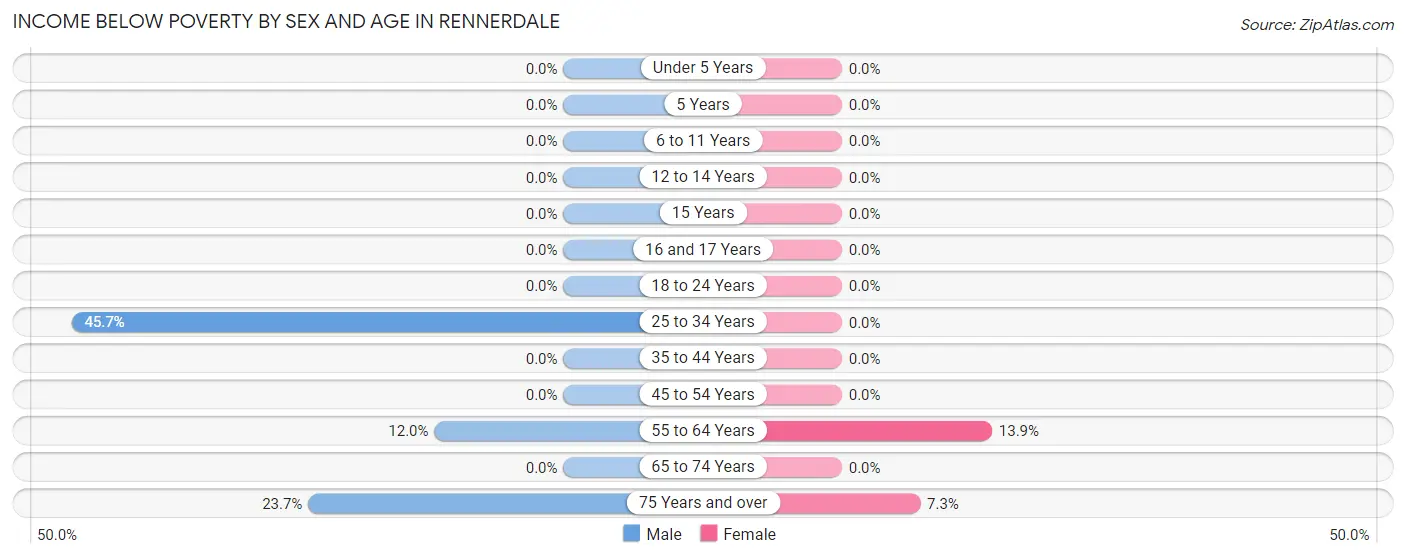
Income Below Poverty by Sex and Age in Rennerdale
With 9.8% poverty level for males and 5.3% for females among the residents of Rennerdale, 25 to 34 year old males and 55 to 64 year old females are the most vulnerable to poverty, with 21 males (45.7%) and 17 females (13.9%) in their respective age groups living below the poverty level.
| Age Bracket | Male | Female |
| Under 5 Years | 0 (0.0%) | 0 (0.0%) |
| 5 Years | 0 (0.0%) | 0 (0.0%) |
| 6 to 11 Years | 0 (0.0%) | 0 (0.0%) |
| 12 to 14 Years | 0 (0.0%) | 0 (0.0%) |
| 15 Years | 0 (0.0%) | 0 (0.0%) |
| 16 and 17 Years | 0 (0.0%) | 0 (0.0%) |
| 18 to 24 Years | 0 (0.0%) | 0 (0.0%) |
| 25 to 34 Years | 21 (45.7%) | 0 (0.0%) |
| 35 to 44 Years | 0 (0.0%) | 0 (0.0%) |
| 45 to 54 Years | 0 (0.0%) | 0 (0.0%) |
| 55 to 64 Years | 17 (12.0%) | 17 (13.9%) |
| 65 to 74 Years | 0 (0.0%) | 0 (0.0%) |
| 75 Years and over | 9 (23.7%) | 8 (7.3%) |
| Total | 47 (9.8%) | 25 (5.3%) |
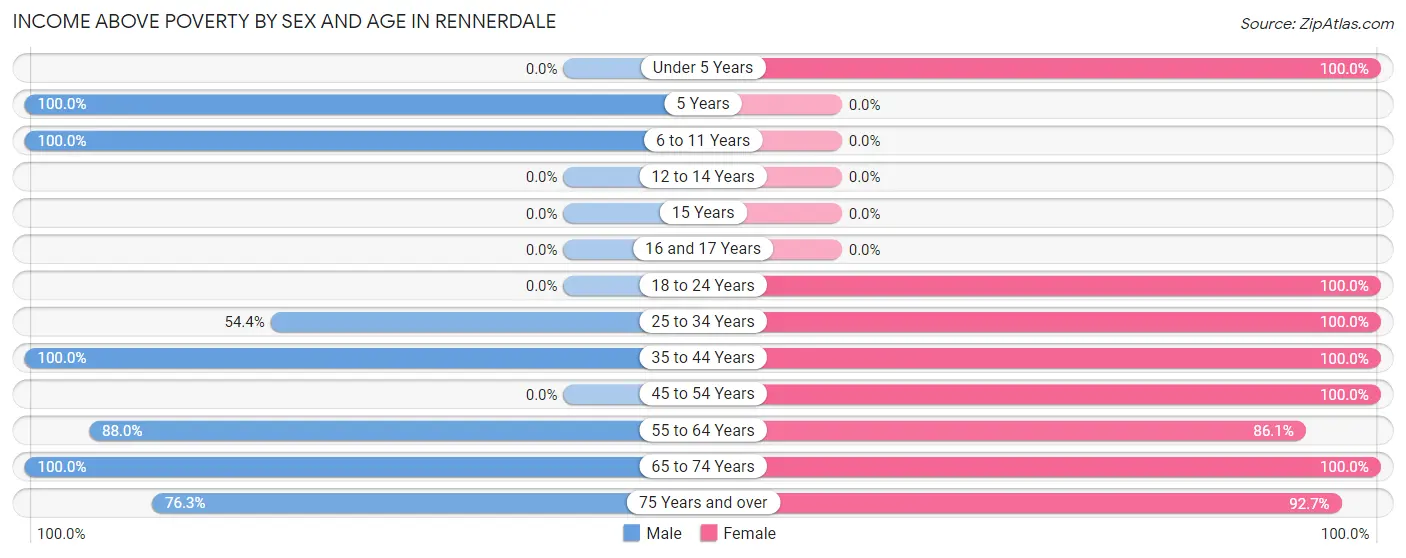
Income Above Poverty by Sex and Age in Rennerdale
According to the poverty statistics in Rennerdale, males aged 5 years and females aged under 5 years are the age groups that are most secure financially, with 100.0% of males and 100.0% of females in these age groups living above the poverty line.
| Age Bracket | Male | Female |
| Under 5 Years | 0 (0.0%) | 19 (100.0%) |
| 5 Years | 37 (100.0%) | 0 (0.0%) |
| 6 to 11 Years | 17 (100.0%) | 0 (0.0%) |
| 12 to 14 Years | 0 (0.0%) | 0 (0.0%) |
| 15 Years | 0 (0.0%) | 0 (0.0%) |
| 16 and 17 Years | 0 (0.0%) | 0 (0.0%) |
| 18 to 24 Years | 0 (0.0%) | 17 (100.0%) |
| 25 to 34 Years | 25 (54.3%) | 29 (100.0%) |
| 35 to 44 Years | 38 (100.0%) | 18 (100.0%) |
| 45 to 54 Years | 0 (0.0%) | 45 (100.0%) |
| 55 to 64 Years | 125 (88.0%) | 105 (86.1%) |
| 65 to 74 Years | 161 (100.0%) | 110 (100.0%) |
| 75 Years and over | 29 (76.3%) | 102 (92.7%) |
| Total | 432 (90.2%) | 445 (94.7%) |
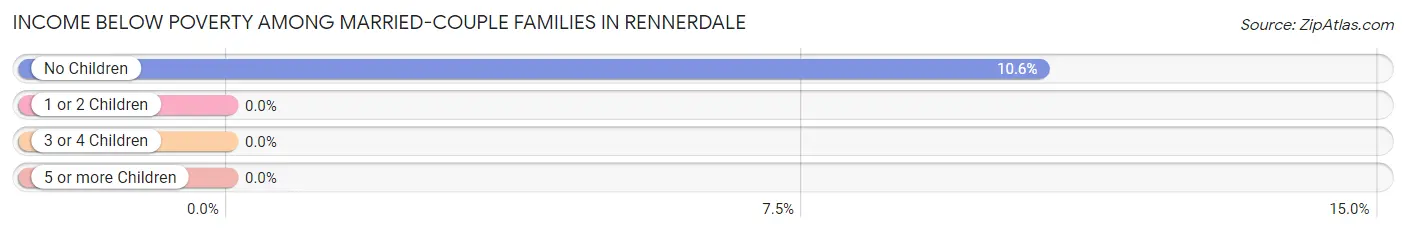
Income Below Poverty Among Married-Couple Families in Rennerdale
The poverty statistics for married-couple families in Rennerdale show that 9.8% or 25 of the total 254 families live below the poverty line. Families with no children have the highest poverty rate of 10.6%, comprising of 25 families. On the other hand, families with 1 or 2 children have the lowest poverty rate of 0.0%, which includes 0 families.
| Children | Above Poverty | Below Poverty |
| No Children | 211 (89.4%) | 25 (10.6%) |
| 1 or 2 Children | 18 (100.0%) | 0 (0.0%) |
| 3 or 4 Children | 0 (0.0%) | 0 (0.0%) |
| 5 or more Children | 0 (0.0%) | 0 (0.0%) |
| Total | 229 (90.2%) | 25 (9.8%) |
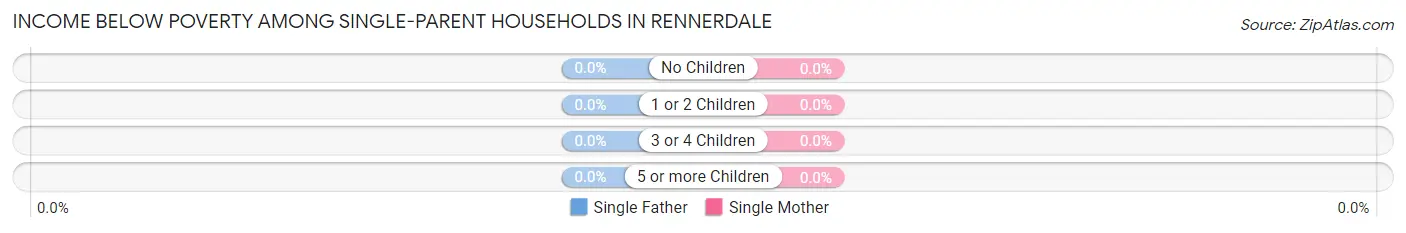
Income Below Poverty Among Single-Parent Households in Rennerdale
| Children | Single Father | Single Mother |
| No Children | 0 (0.0%) | 0 (0.0%) |
| 1 or 2 Children | 0 (0.0%) | 0 (0.0%) |
| 3 or 4 Children | 0 (0.0%) | 0 (0.0%) |
| 5 or more Children | 0 (0.0%) | 0 (0.0%) |
| Total | 0 (0.0%) | 0 (0.0%) |
Income Below Poverty Among Married-Couple vs Single-Parent Households in Rennerdale
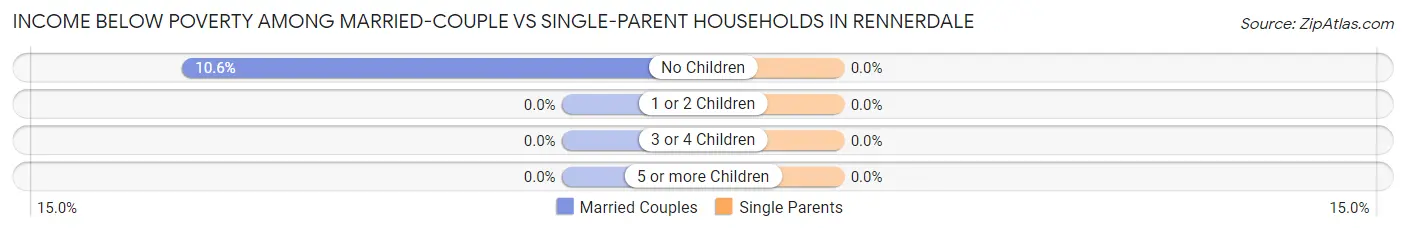
| Children | Married-Couple Families | Single-Parent Households |
| No Children | 25 (10.6%) | 0 (0.0%) |
| 1 or 2 Children | 0 (0.0%) | 0 (0.0%) |
| 3 or 4 Children | 0 (0.0%) | 0 (0.0%) |
| 5 or more Children | 0 (0.0%) | 0 (0.0%) |
| Total | 25 (9.8%) | 0 (0.0%) |
Employment Characteristics in Rennerdale
Employment by Class of Employer in Rennerdale
Among the 461 employed individuals in Rennerdale, private company employees (180 | 39.1%), self-employed (not incorporated) (140 | 30.4%), and federal government employees (41 | 8.9%) make up the most common classes of employment.
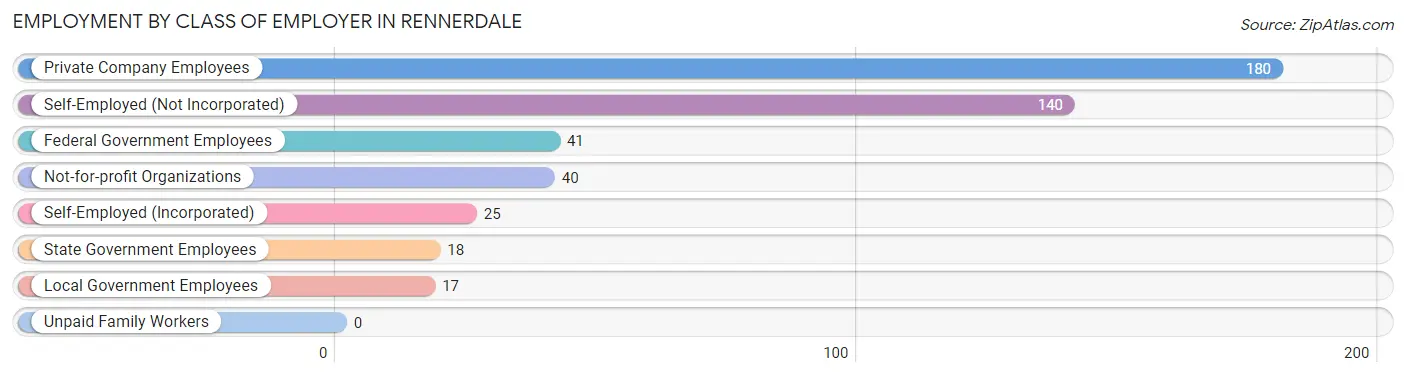
| Employer Class | # Employees | % Employees |
| Private Company Employees | 180 | 39.1% |
| Self-Employed (Incorporated) | 25 | 5.4% |
| Self-Employed (Not Incorporated) | 140 | 30.4% |
| Not-for-profit Organizations | 40 | 8.7% |
| Local Government Employees | 17 | 3.7% |
| State Government Employees | 18 | 3.9% |
| Federal Government Employees | 41 | 8.9% |
| Unpaid Family Workers | 0 | 0.0% |
| Total | 461 | 100.0% |
Employment Status by Age in Rennerdale
According to the labor force statistics for Rennerdale, out of the total population over 16 years of age (878), 55.8% or 490 individuals are in the labor force, with 5.9% or 29 of them unemployed. The age group with the highest labor force participation rate is 20 to 24 years, with 100.0% or 17 individuals in the labor force. Within the labor force, the 30 to 34 years age range has the highest percentage of unemployed individuals, with 66.7% or 20 of them being unemployed.
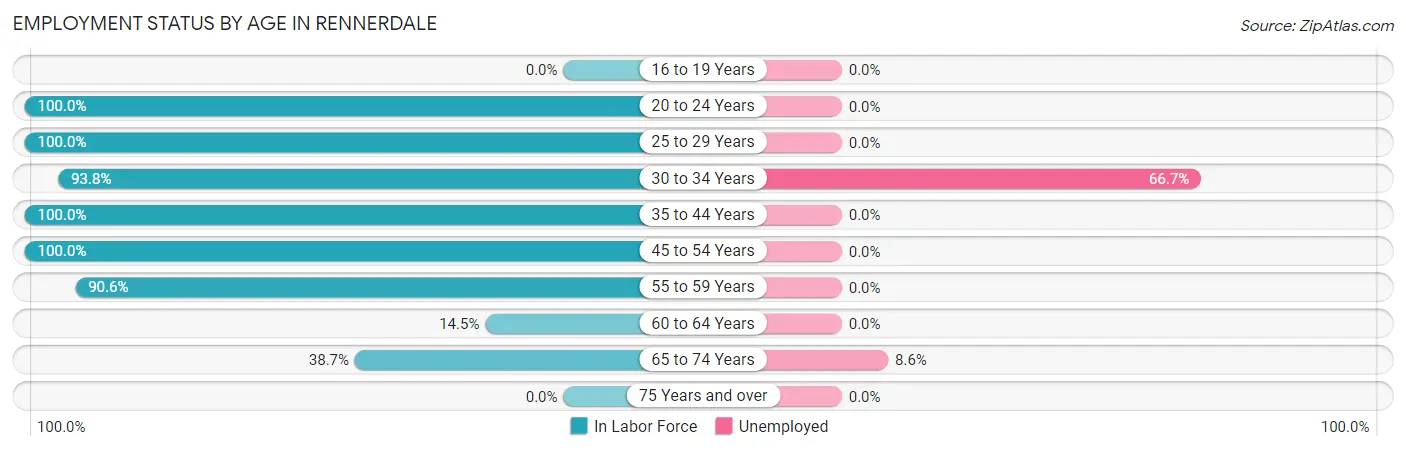
| Age Bracket | In Labor Force | Unemployed |
| 16 to 19 Years | 0 (0.0%) | 0 (0.0%) |
| 20 to 24 Years | 17 (100.0%) | 0 (0.0%) |
| 25 to 29 Years | 45 (100.0%) | 0 (0.0%) |
| 30 to 34 Years | 30 (93.8%) | 20 (66.7%) |
| 35 to 44 Years | 56 (100.0%) | 0 (0.0%) |
| 45 to 54 Years | 45 (100.0%) | 0 (0.0%) |
| 55 to 59 Years | 183 (90.6%) | 0 (0.0%) |
| 60 to 64 Years | 9 (14.5%) | 0 (0.0%) |
| 65 to 74 Years | 105 (38.7%) | 9 (8.6%) |
| 75 Years and over | 0 (0.0%) | 0 (0.0%) |
| Total | 490 (55.8%) | 29 (5.9%) |
Employment Status by Educational Attainment in Rennerdale
According to labor force statistics for Rennerdale, 83.3% of individuals (368) out of the total population between 25 and 64 years of age (442) are in the labor force, with 5.4% or 20 of them being unemployed. The group with the highest labor force participation rate are those with the educational attainment of bachelor's degree or higher, with 100.0% or 122 individuals in the labor force. Within the labor force, individuals with college / associate degree education have the highest percentage of unemployment, with 14.1% or 20 of them being unemployed.
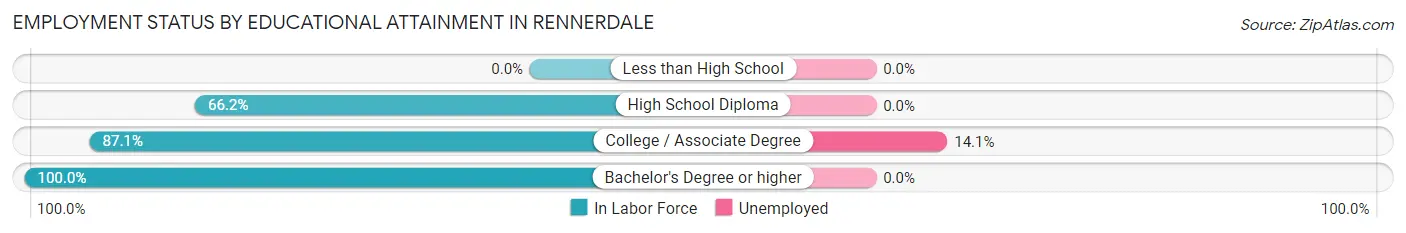
| Educational Attainment | In Labor Force | Unemployed |
| Less than High School | 0 (0.0%) | 0 (0.0%) |
| High School Diploma | 104 (66.2%) | 0 (0.0%) |
| College / Associate Degree | 142 (87.1%) | 23 (14.1%) |
| Bachelor's Degree or higher | 122 (100.0%) | 0 (0.0%) |
| Total | 368 (83.3%) | 24 (5.4%) |
Employment Occupations by Sex in Rennerdale
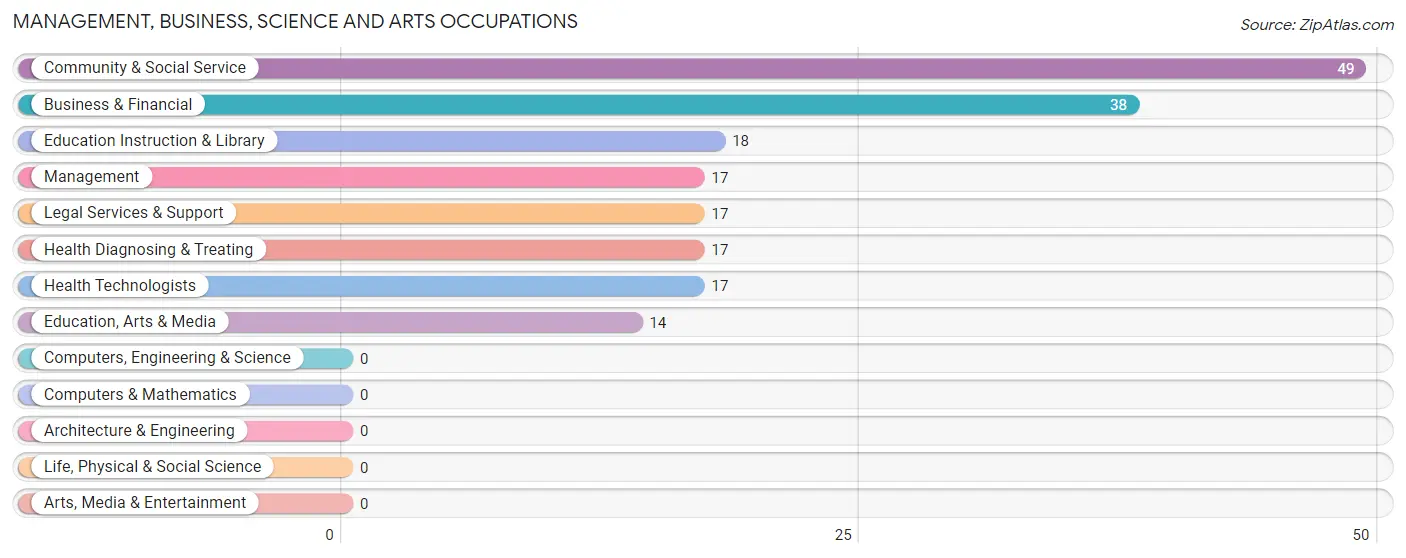
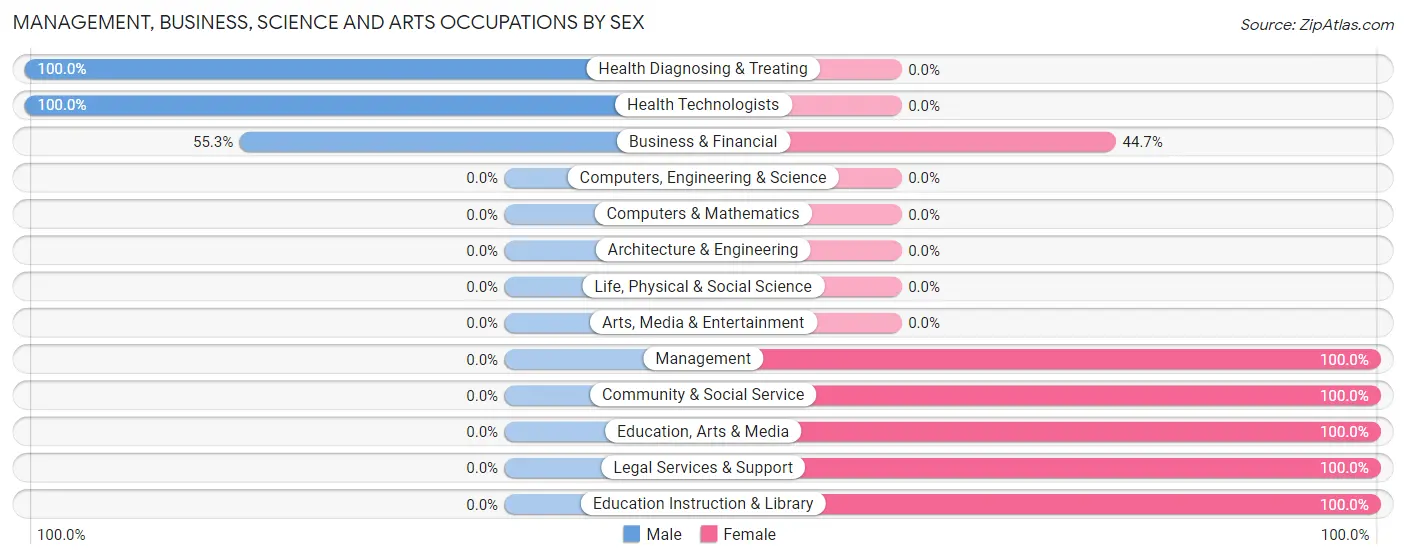
Management, Business, Science and Arts Occupations
The most common Management, Business, Science and Arts occupations in Rennerdale are Community & Social Service (49 | 10.6%), Business & Financial (38 | 8.2%), Education Instruction & Library (18 | 3.9%), Management (17 | 3.7%), and Legal Services & Support (17 | 3.7%).
Management, Business, Science and Arts Occupations by Sex
Within the Management, Business, Science and Arts occupations in Rennerdale, the most male-oriented occupations are Health Diagnosing & Treating (100.0%), Health Technologists (100.0%), and Business & Financial (55.3%), while the most female-oriented occupations are Management (100.0%), Community & Social Service (100.0%), and Education, Arts & Media (100.0%).
| Occupation | Male | Female |
| Management | 0 (0.0%) | 17 (100.0%) |
| Business & Financial | 21 (55.3%) | 17 (44.7%) |
| Computers, Engineering & Science | 0 (0.0%) | 0 (0.0%) |
| Computers & Mathematics | 0 (0.0%) | 0 (0.0%) |
| Architecture & Engineering | 0 (0.0%) | 0 (0.0%) |
| Life, Physical & Social Science | 0 (0.0%) | 0 (0.0%) |
| Community & Social Service | 0 (0.0%) | 49 (100.0%) |
| Education, Arts & Media | 0 (0.0%) | 14 (100.0%) |
| Legal Services & Support | 0 (0.0%) | 17 (100.0%) |
| Education Instruction & Library | 0 (0.0%) | 18 (100.0%) |
| Arts, Media & Entertainment | 0 (0.0%) | 0 (0.0%) |
| Health Diagnosing & Treating | 17 (100.0%) | 0 (0.0%) |
| Health Technologists | 17 (100.0%) | 0 (0.0%) |
| Total (Category) | 38 (31.4%) | 83 (68.6%) |
| Total (Overall) | 267 (57.9%) | 194 (42.1%) |
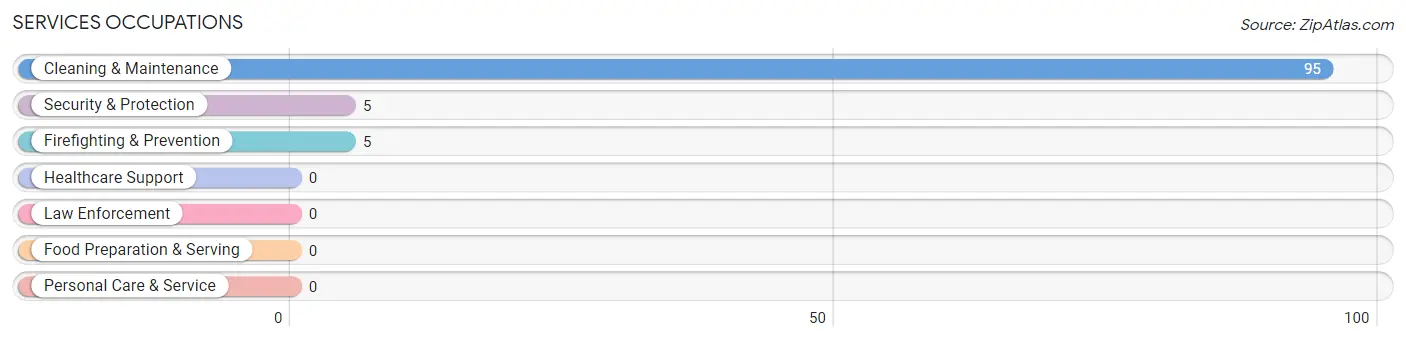
Services Occupations
The most common Services occupations in Rennerdale are Cleaning & Maintenance (95 | 20.6%), Security & Protection (5 | 1.1%), and Firefighting & Prevention (5 | 1.1%).
Services Occupations by Sex
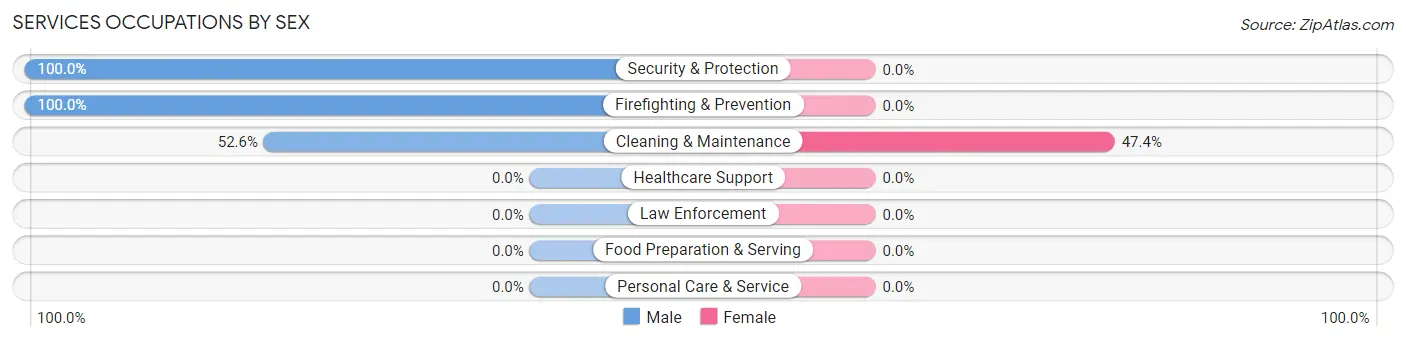
| Occupation | Male | Female |
| Healthcare Support | 0 (0.0%) | 0 (0.0%) |
| Security & Protection | 5 (100.0%) | 0 (0.0%) |
| Firefighting & Prevention | 5 (100.0%) | 0 (0.0%) |
| Law Enforcement | 0 (0.0%) | 0 (0.0%) |
| Food Preparation & Serving | 0 (0.0%) | 0 (0.0%) |
| Cleaning & Maintenance | 50 (52.6%) | 45 (47.4%) |
| Personal Care & Service | 0 (0.0%) | 0 (0.0%) |
| Total (Category) | 55 (55.0%) | 45 (45.0%) |
| Total (Overall) | 267 (57.9%) | 194 (42.1%) |
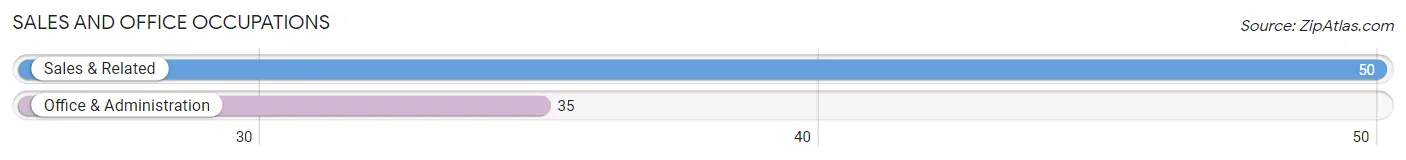
Sales and Office Occupations
The most common Sales and Office occupations in Rennerdale are Sales & Related (50 | 10.8%), and Office & Administration (35 | 7.6%).
Sales and Office Occupations by Sex
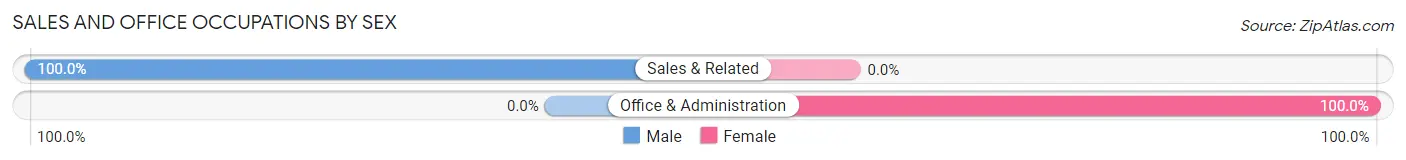
| Occupation | Male | Female |
| Sales & Related | 50 (100.0%) | 0 (0.0%) |
| Office & Administration | 0 (0.0%) | 35 (100.0%) |
| Total (Category) | 50 (58.8%) | 35 (41.2%) |
| Total (Overall) | 267 (57.9%) | 194 (42.1%) |
Natural Resources, Construction and Maintenance Occupations
The most common Natural Resources, Construction and Maintenance occupations in Rennerdale are , and Construction & Extraction (57 | 12.4%).

Natural Resources, Construction and Maintenance Occupations by Sex
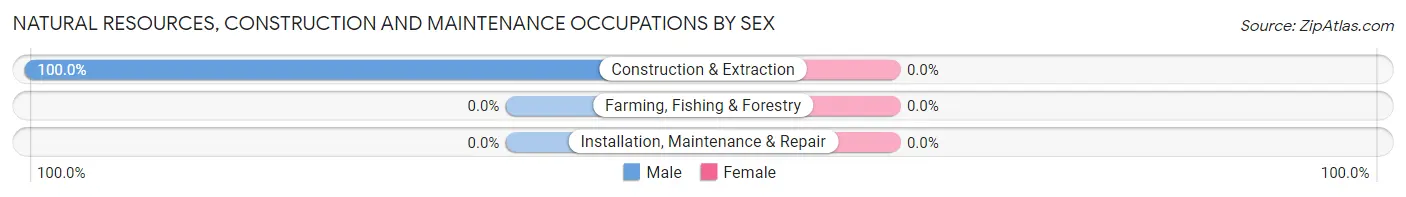
| Occupation | Male | Female |
| Farming, Fishing & Forestry | 0 (0.0%) | 0 (0.0%) |
| Construction & Extraction | 57 (100.0%) | 0 (0.0%) |
| Installation, Maintenance & Repair | 0 (0.0%) | 0 (0.0%) |
| Total (Category) | 57 (100.0%) | 0 (0.0%) |
| Total (Overall) | 267 (57.9%) | 194 (42.1%) |
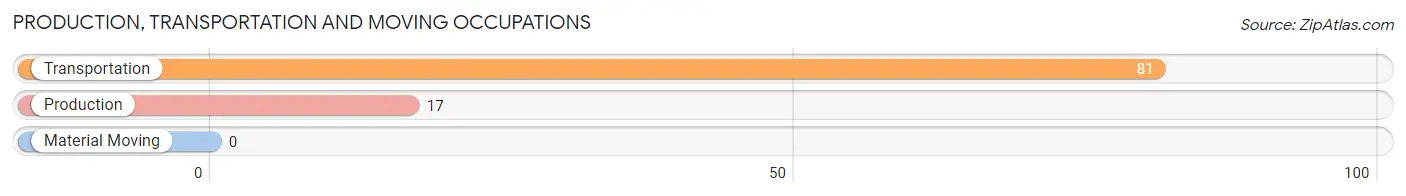
Production, Transportation and Moving Occupations
The most common Production, Transportation and Moving occupations in Rennerdale are Transportation (81 | 17.6%), and Production (17 | 3.7%).
Production, Transportation and Moving Occupations by Sex
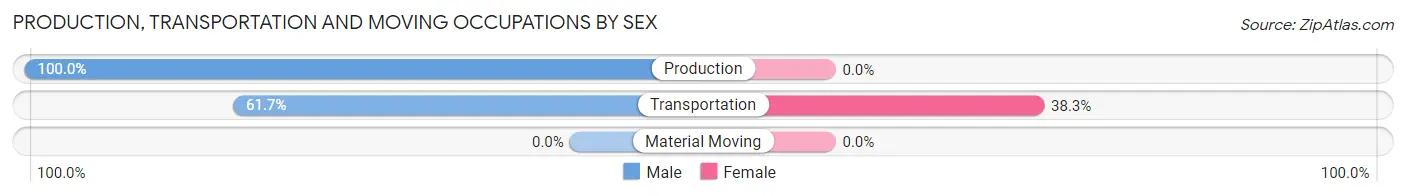
| Occupation | Male | Female |
| Production | 17 (100.0%) | 0 (0.0%) |
| Transportation | 50 (61.7%) | 31 (38.3%) |
| Material Moving | 0 (0.0%) | 0 (0.0%) |
| Total (Category) | 67 (68.4%) | 31 (31.6%) |
| Total (Overall) | 267 (57.9%) | 194 (42.1%) |
Employment Industries by Sex in Rennerdale
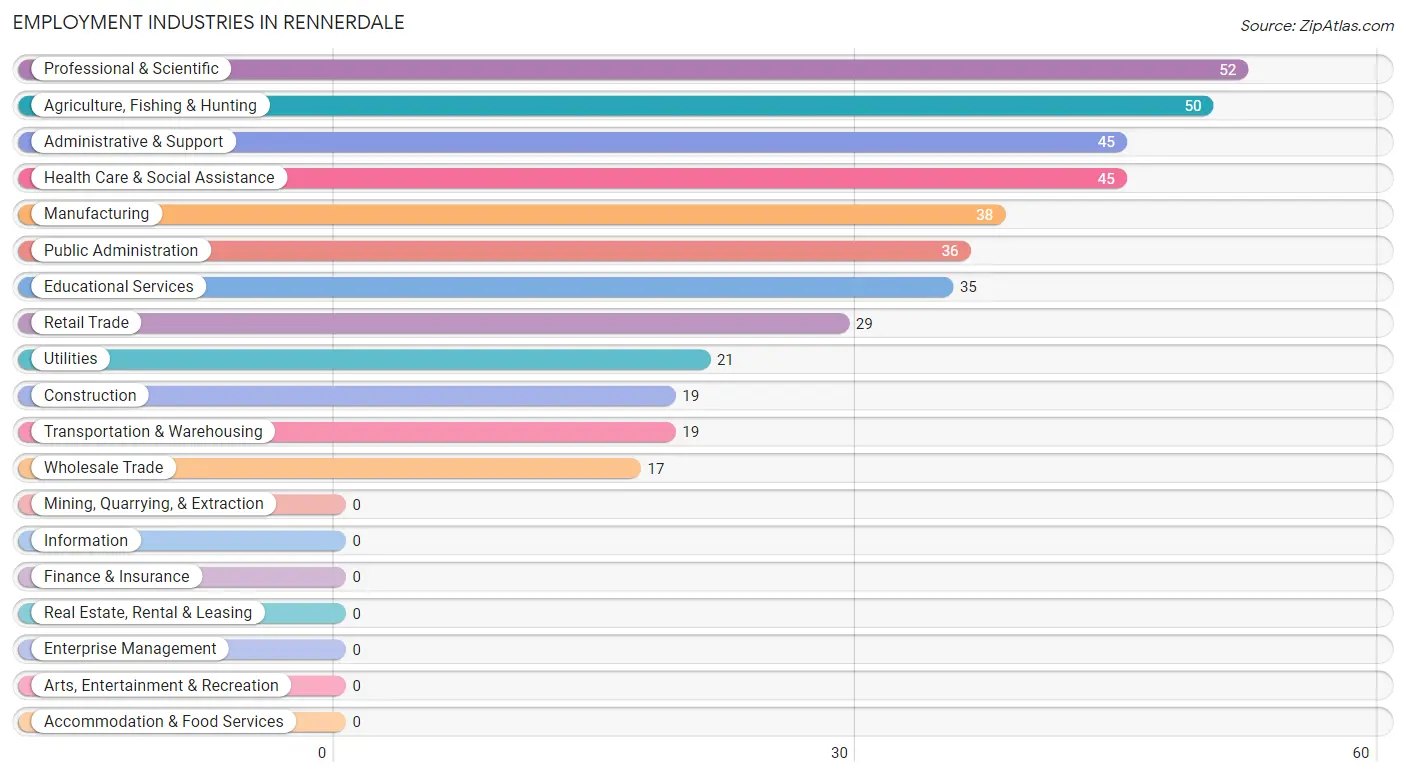
Employment Industries in Rennerdale
The major employment industries in Rennerdale include Professional & Scientific (52 | 11.3%), Agriculture, Fishing & Hunting (50 | 10.8%), Administrative & Support (45 | 9.8%), Health Care & Social Assistance (45 | 9.8%), and Manufacturing (38 | 8.2%).
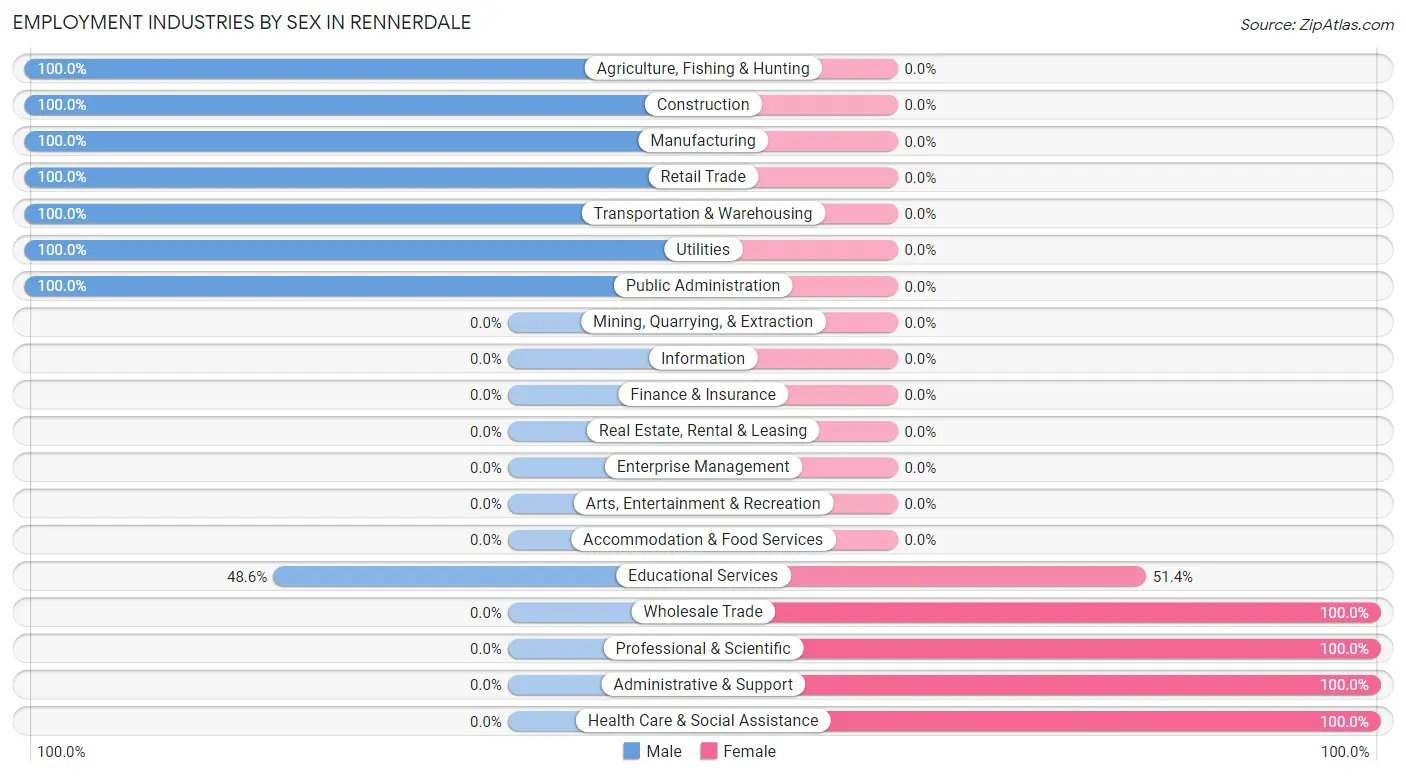
Employment Industries by Sex in Rennerdale
The Rennerdale industries that see more men than women are Agriculture, Fishing & Hunting (100.0%), Construction (100.0%), and Manufacturing (100.0%), whereas the industries that tend to have a higher number of women are Wholesale Trade (100.0%), Professional & Scientific (100.0%), and Administrative & Support (100.0%).
| Industry | Male | Female |
| Agriculture, Fishing & Hunting | 50 (100.0%) | 0 (0.0%) |
| Mining, Quarrying, & Extraction | 0 (0.0%) | 0 (0.0%) |
| Construction | 19 (100.0%) | 0 (0.0%) |
| Manufacturing | 38 (100.0%) | 0 (0.0%) |
| Wholesale Trade | 0 (0.0%) | 17 (100.0%) |
| Retail Trade | 29 (100.0%) | 0 (0.0%) |
| Transportation & Warehousing | 19 (100.0%) | 0 (0.0%) |
| Utilities | 21 (100.0%) | 0 (0.0%) |
| Information | 0 (0.0%) | 0 (0.0%) |
| Finance & Insurance | 0 (0.0%) | 0 (0.0%) |
| Real Estate, Rental & Leasing | 0 (0.0%) | 0 (0.0%) |
| Professional & Scientific | 0 (0.0%) | 52 (100.0%) |
| Enterprise Management | 0 (0.0%) | 0 (0.0%) |
| Administrative & Support | 0 (0.0%) | 45 (100.0%) |
| Educational Services | 17 (48.6%) | 18 (51.4%) |
| Health Care & Social Assistance | 0 (0.0%) | 45 (100.0%) |
| Arts, Entertainment & Recreation | 0 (0.0%) | 0 (0.0%) |
| Accommodation & Food Services | 0 (0.0%) | 0 (0.0%) |
| Public Administration | 36 (100.0%) | 0 (0.0%) |
| Total | 267 (57.9%) | 194 (42.1%) |
Education in Rennerdale
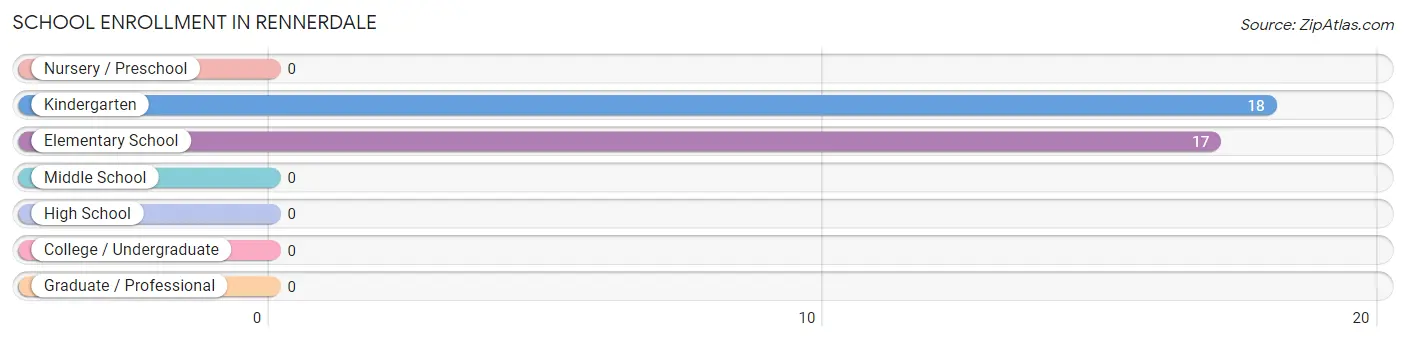
School Enrollment in Rennerdale
The most common levels of schooling among the 35 students in Rennerdale are kindergarten (18 | 51.4%), and elementary school (17 | 48.6%).
| School Level | # Students | % Students |
| Nursery / Preschool | 0 | 0.0% |
| Kindergarten | 18 | 51.4% |
| Elementary School | 17 | 48.6% |
| Middle School | 0 | 0.0% |
| High School | 0 | 0.0% |
| College / Undergraduate | 0 | 0.0% |
| Graduate / Professional | 0 | 0.0% |
| Total | 35 | 100.0% |
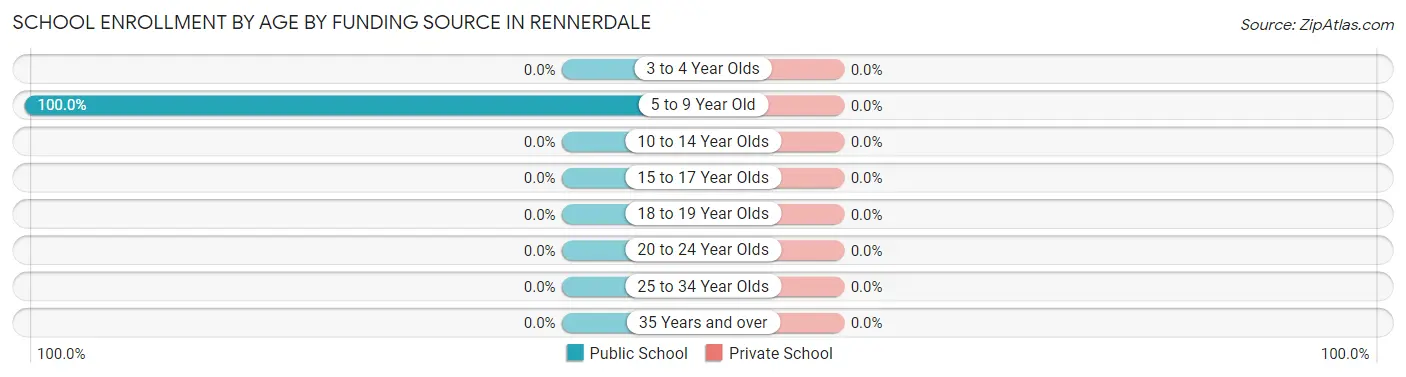
School Enrollment by Age by Funding Source in Rennerdale
| Age Bracket | Public School | Private School |
| 3 to 4 Year Olds | 0 (0.0%) | 0 (0.0%) |
| 5 to 9 Year Old | 35 (100.0%) | 0 (0.0%) |
| 10 to 14 Year Olds | 0 (0.0%) | 0 (0.0%) |
| 15 to 17 Year Olds | 0 (0.0%) | 0 (0.0%) |
| 18 to 19 Year Olds | 0 (0.0%) | 0 (0.0%) |
| 20 to 24 Year Olds | 0 (0.0%) | 0 (0.0%) |
| 25 to 34 Year Olds | 0 (0.0%) | 0 (0.0%) |
| 35 Years and over | 0 (0.0%) | 0 (0.0%) |
| Total | 35 (100.0%) | 0 (0.0%) |
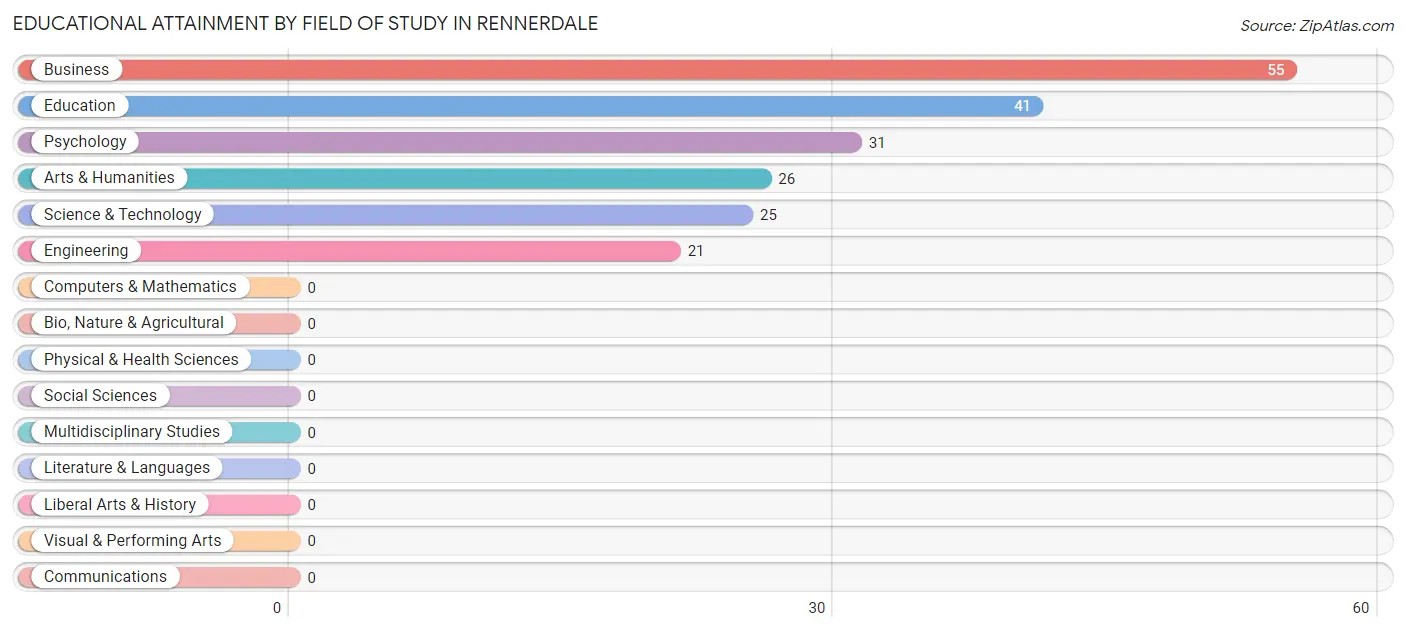
Educational Attainment by Field of Study in Rennerdale
Business (55 | 27.6%), education (41 | 20.6%), psychology (31 | 15.6%), arts & humanities (26 | 13.1%), and science & technology (25 | 12.6%) are the most common fields of study among 199 individuals in Rennerdale who have obtained a bachelor's degree or higher.
| Field of Study | # Graduates | % Graduates |
| Computers & Mathematics | 0 | 0.0% |
| Bio, Nature & Agricultural | 0 | 0.0% |
| Physical & Health Sciences | 0 | 0.0% |
| Psychology | 31 | 15.6% |
| Social Sciences | 0 | 0.0% |
| Engineering | 21 | 10.5% |
| Multidisciplinary Studies | 0 | 0.0% |
| Science & Technology | 25 | 12.6% |
| Business | 55 | 27.6% |
| Education | 41 | 20.6% |
| Literature & Languages | 0 | 0.0% |
| Liberal Arts & History | 0 | 0.0% |
| Visual & Performing Arts | 0 | 0.0% |
| Communications | 0 | 0.0% |
| Arts & Humanities | 26 | 13.1% |
| Total | 199 | 100.0% |
Transportation & Commute in Rennerdale
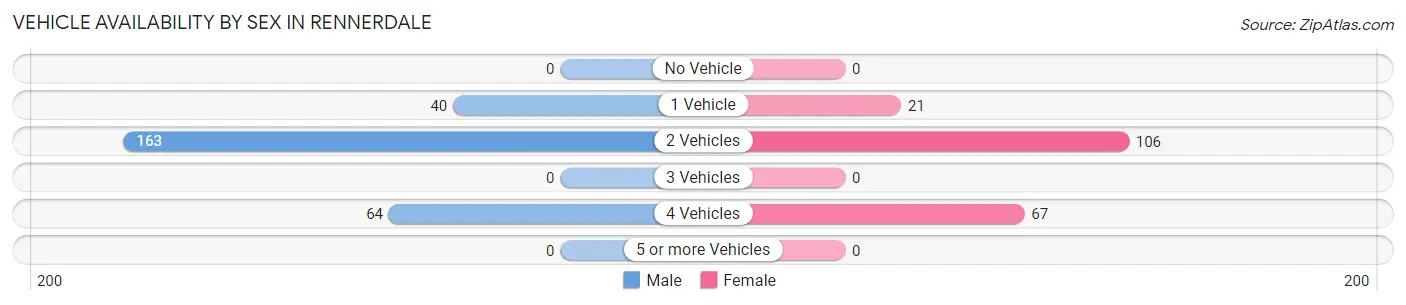
Vehicle Availability by Sex in Rennerdale
The most prevalent vehicle ownership categories in Rennerdale are males with 2 vehicles (163, accounting for 61.1%) and females with 2 vehicles (106, making up 84.0%).
| Vehicles Available | Male | Female |
| No Vehicle | 0 (0.0%) | 0 (0.0%) |
| 1 Vehicle | 40 (15.0%) | 21 (10.8%) |
| 2 Vehicles | 163 (61.1%) | 106 (54.6%) |
| 3 Vehicles | 0 (0.0%) | 0 (0.0%) |
| 4 Vehicles | 64 (24.0%) | 67 (34.5%) |
| 5 or more Vehicles | 0 (0.0%) | 0 (0.0%) |
| Total | 267 (100.0%) | 194 (100.0%) |
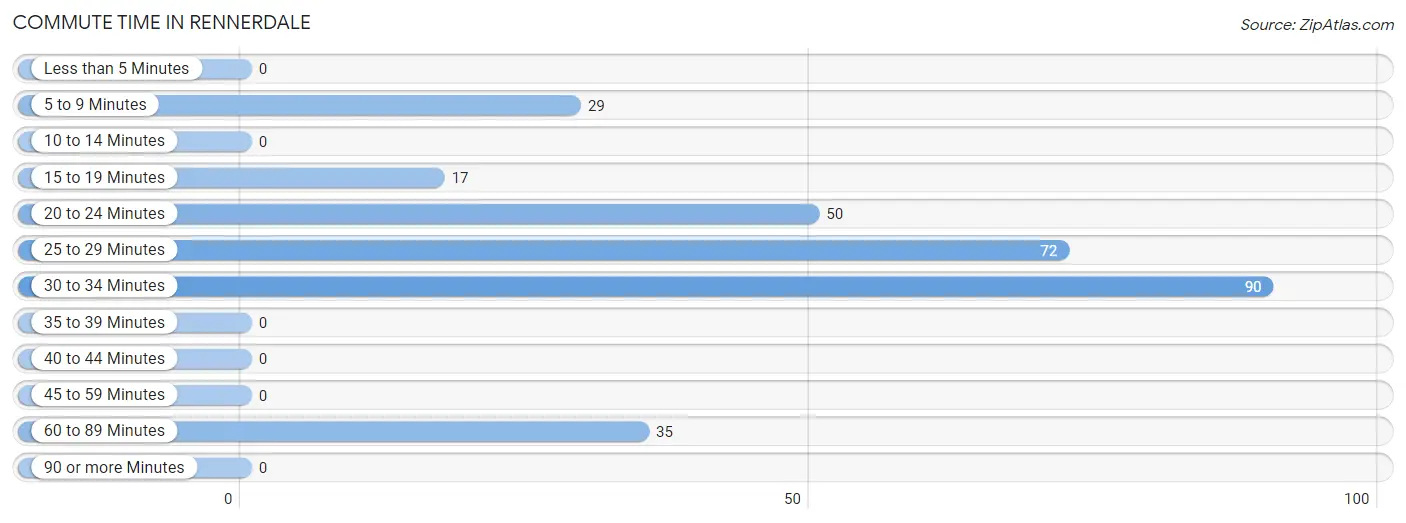
Commute Time in Rennerdale
The most frequently occuring commute durations in Rennerdale are 30 to 34 minutes (90 commuters, 30.7%), 25 to 29 minutes (72 commuters, 24.6%), and 20 to 24 minutes (50 commuters, 17.1%).
| Commute Time | # Commuters | % Commuters |
| Less than 5 Minutes | 0 | 0.0% |
| 5 to 9 Minutes | 29 | 9.9% |
| 10 to 14 Minutes | 0 | 0.0% |
| 15 to 19 Minutes | 17 | 5.8% |
| 20 to 24 Minutes | 50 | 17.1% |
| 25 to 29 Minutes | 72 | 24.6% |
| 30 to 34 Minutes | 90 | 30.7% |
| 35 to 39 Minutes | 0 | 0.0% |
| 40 to 44 Minutes | 0 | 0.0% |
| 45 to 59 Minutes | 0 | 0.0% |
| 60 to 89 Minutes | 35 | 11.9% |
| 90 or more Minutes | 0 | 0.0% |
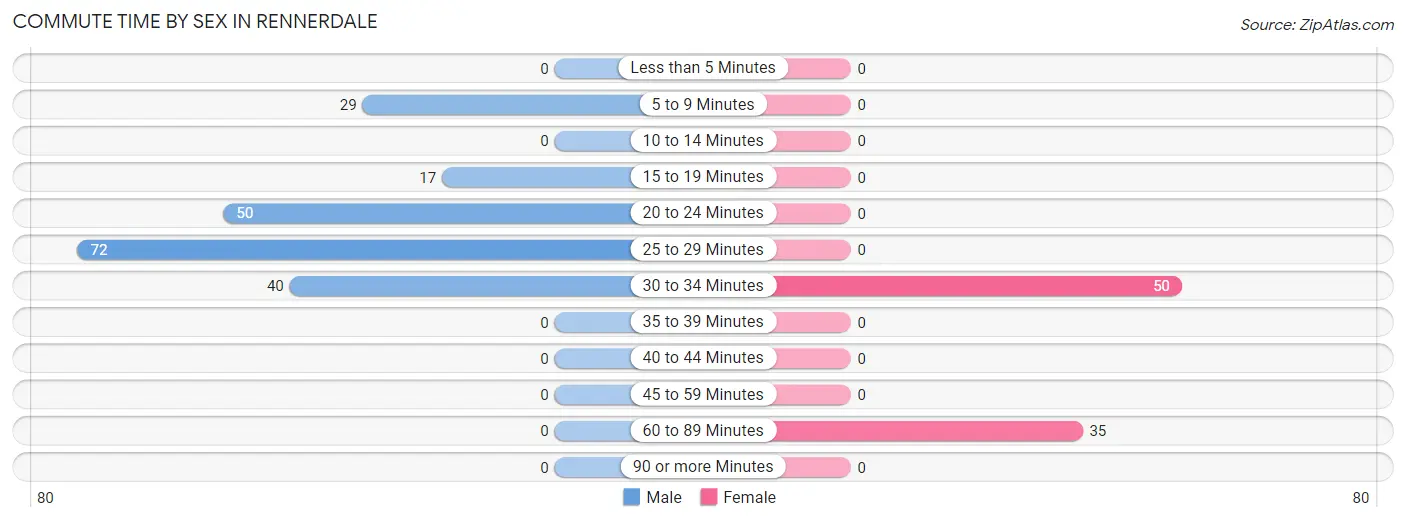
Commute Time by Sex in Rennerdale
The most common commute times in Rennerdale are 25 to 29 minutes (72 commuters, 34.6%) for males and 30 to 34 minutes (50 commuters, 58.8%) for females.
| Commute Time | Male | Female |
| Less than 5 Minutes | 0 (0.0%) | 0 (0.0%) |
| 5 to 9 Minutes | 29 (13.9%) | 0 (0.0%) |
| 10 to 14 Minutes | 0 (0.0%) | 0 (0.0%) |
| 15 to 19 Minutes | 17 (8.2%) | 0 (0.0%) |
| 20 to 24 Minutes | 50 (24.0%) | 0 (0.0%) |
| 25 to 29 Minutes | 72 (34.6%) | 0 (0.0%) |
| 30 to 34 Minutes | 40 (19.2%) | 50 (58.8%) |
| 35 to 39 Minutes | 0 (0.0%) | 0 (0.0%) |
| 40 to 44 Minutes | 0 (0.0%) | 0 (0.0%) |
| 45 to 59 Minutes | 0 (0.0%) | 0 (0.0%) |
| 60 to 89 Minutes | 0 (0.0%) | 35 (41.2%) |
| 90 or more Minutes | 0 (0.0%) | 0 (0.0%) |
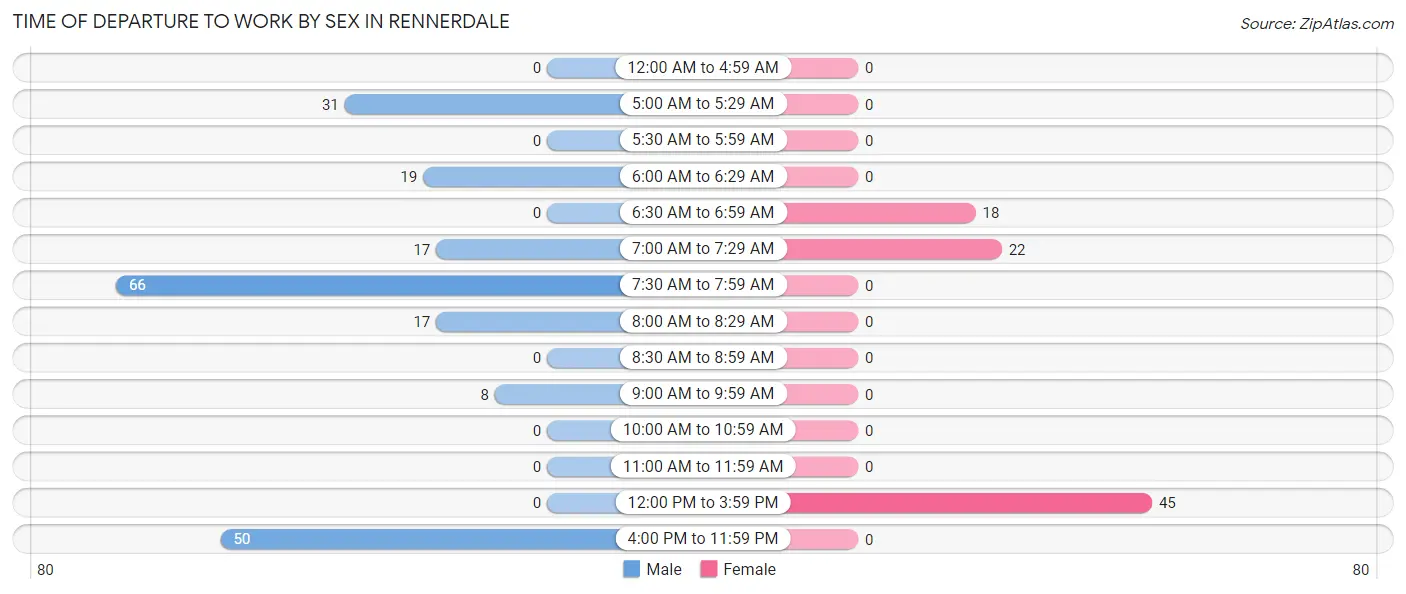
Time of Departure to Work by Sex in Rennerdale
The most frequent times of departure to work in Rennerdale are 7:30 AM to 7:59 AM (66, 31.7%) for males and 12:00 PM to 3:59 PM (45, 52.9%) for females.
| Time of Departure | Male | Female |
| 12:00 AM to 4:59 AM | 0 (0.0%) | 0 (0.0%) |
| 5:00 AM to 5:29 AM | 31 (14.9%) | 0 (0.0%) |
| 5:30 AM to 5:59 AM | 0 (0.0%) | 0 (0.0%) |
| 6:00 AM to 6:29 AM | 19 (9.1%) | 0 (0.0%) |
| 6:30 AM to 6:59 AM | 0 (0.0%) | 18 (21.2%) |
| 7:00 AM to 7:29 AM | 17 (8.2%) | 22 (25.9%) |
| 7:30 AM to 7:59 AM | 66 (31.7%) | 0 (0.0%) |
| 8:00 AM to 8:29 AM | 17 (8.2%) | 0 (0.0%) |
| 8:30 AM to 8:59 AM | 0 (0.0%) | 0 (0.0%) |
| 9:00 AM to 9:59 AM | 8 (3.8%) | 0 (0.0%) |
| 10:00 AM to 10:59 AM | 0 (0.0%) | 0 (0.0%) |
| 11:00 AM to 11:59 AM | 0 (0.0%) | 0 (0.0%) |
| 12:00 PM to 3:59 PM | 0 (0.0%) | 45 (52.9%) |
| 4:00 PM to 11:59 PM | 50 (24.0%) | 0 (0.0%) |
| Total | 208 (100.0%) | 85 (100.0%) |
Housing Occupancy in Rennerdale
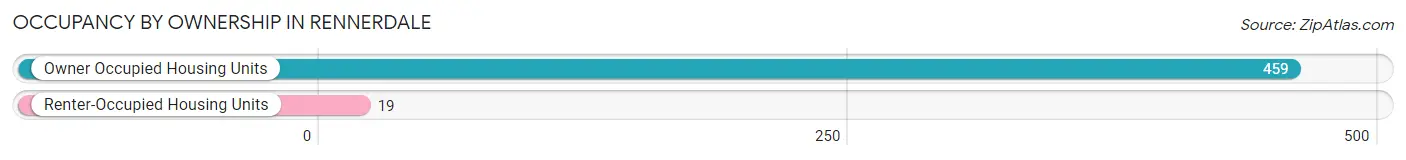
Occupancy by Ownership in Rennerdale
Of the total 478 dwellings in Rennerdale, owner-occupied units account for 459 (96.0%), while renter-occupied units make up 19 (4.0%).
| Occupancy | # Housing Units | % Housing Units |
| Owner Occupied Housing Units | 459 | 96.0% |
| Renter-Occupied Housing Units | 19 | 4.0% |
| Total Occupied Housing Units | 478 | 100.0% |
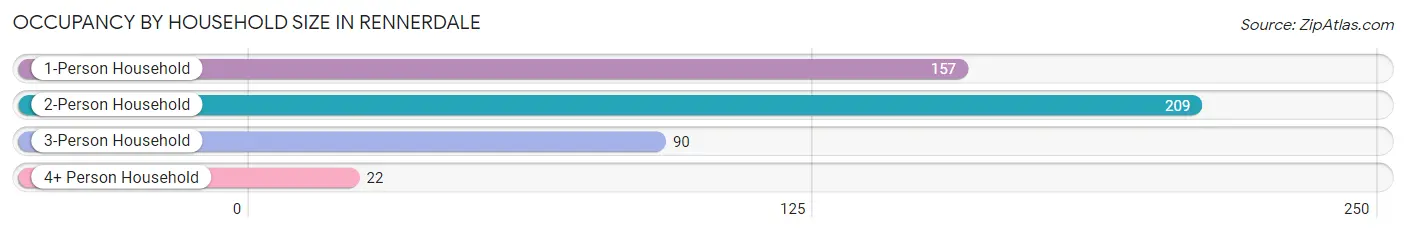
Occupancy by Household Size in Rennerdale
| Household Size | # Housing Units | % Housing Units |
| 1-Person Household | 157 | 32.9% |
| 2-Person Household | 209 | 43.7% |
| 3-Person Household | 90 | 18.8% |
| 4+ Person Household | 22 | 4.6% |
| Total Housing Units | 478 | 100.0% |
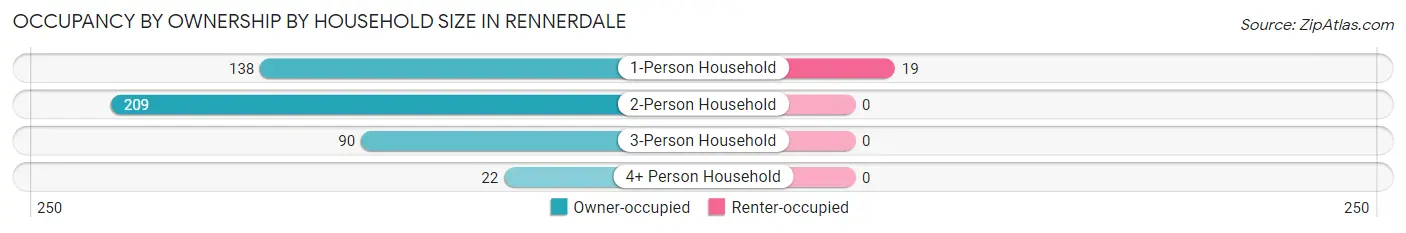
Occupancy by Ownership by Household Size in Rennerdale
| Household Size | Owner-occupied | Renter-occupied |
| 1-Person Household | 138 (87.9%) | 19 (12.1%) |
| 2-Person Household | 209 (100.0%) | 0 (0.0%) |
| 3-Person Household | 90 (100.0%) | 0 (0.0%) |
| 4+ Person Household | 22 (100.0%) | 0 (0.0%) |
| Total Housing Units | 459 (96.0%) | 19 (4.0%) |
Occupancy by Educational Attainment in Rennerdale
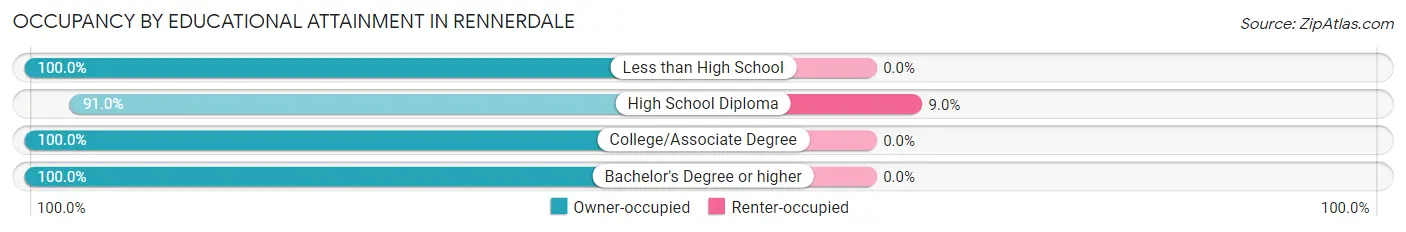
| Household Size | Owner-occupied | Renter-occupied |
| Less than High School | 18 (100.0%) | 0 (0.0%) |
| High School Diploma | 192 (91.0%) | 19 (9.0%) |
| College/Associate Degree | 128 (100.0%) | 0 (0.0%) |
| Bachelor's Degree or higher | 121 (100.0%) | 0 (0.0%) |
Occupancy by Age of Householder in Rennerdale
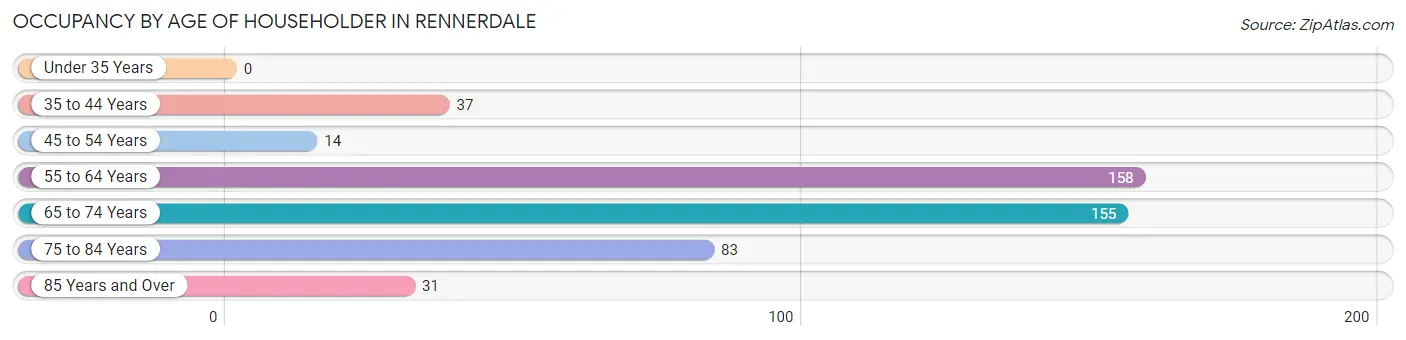
| Age Bracket | # Households | % Households |
| Under 35 Years | 0 | 0.0% |
| 35 to 44 Years | 37 | 7.7% |
| 45 to 54 Years | 14 | 2.9% |
| 55 to 64 Years | 158 | 33.1% |
| 65 to 74 Years | 155 | 32.4% |
| 75 to 84 Years | 83 | 17.4% |
| 85 Years and Over | 31 | 6.5% |
| Total | 478 | 100.0% |
Housing Finances in Rennerdale
Median Income by Occupancy in Rennerdale
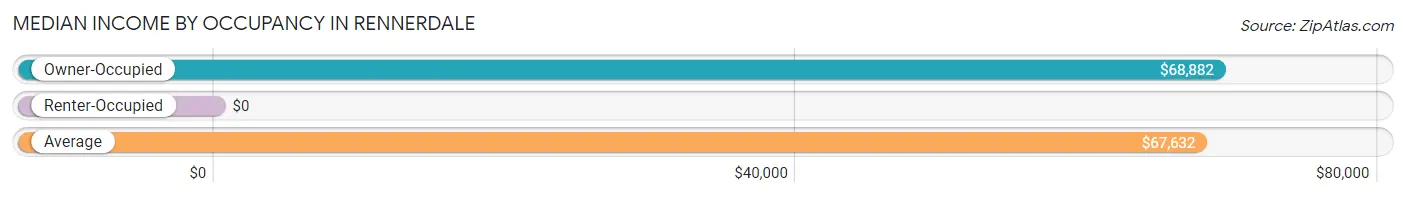
| Occupancy Type | # Households | Median Income |
| Owner-Occupied | 459 (96.0%) | $68,882 |
| Renter-Occupied | 19 (4.0%) | $0 |
| Average | 478 (100.0%) | $67,632 |
Occupancy by Householder Income Bracket in Rennerdale
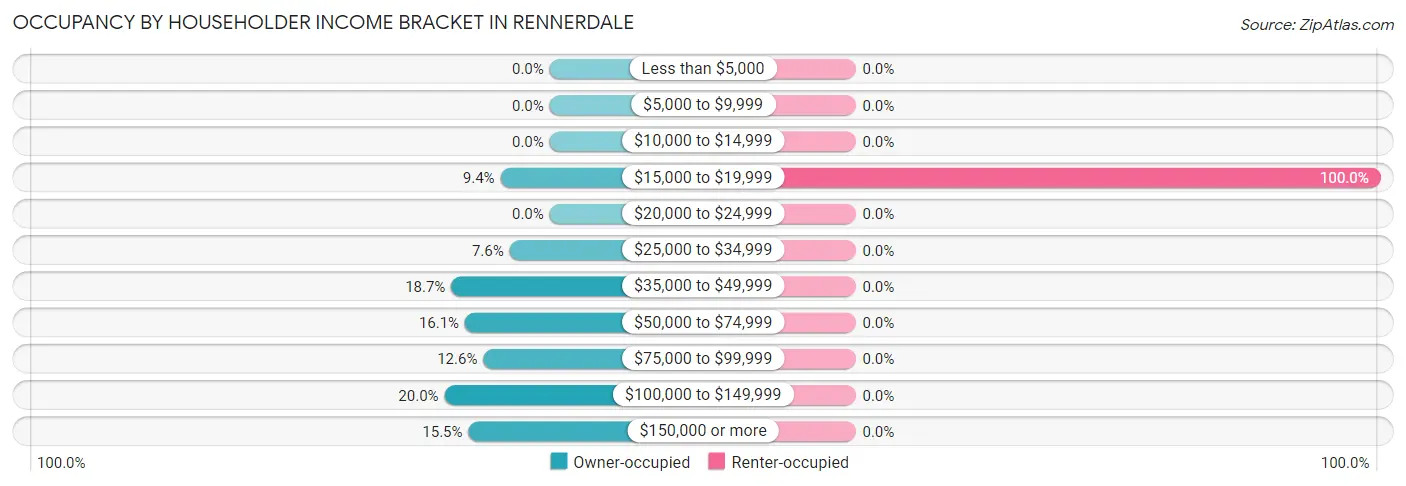
| Income Bracket | Owner-occupied | Renter-occupied |
| Less than $5,000 | 0 (0.0%) | 0 (0.0%) |
| $5,000 to $9,999 | 0 (0.0%) | 0 (0.0%) |
| $10,000 to $14,999 | 0 (0.0%) | 0 (0.0%) |
| $15,000 to $19,999 | 43 (9.4%) | 19 (100.0%) |
| $20,000 to $24,999 | 0 (0.0%) | 0 (0.0%) |
| $25,000 to $34,999 | 35 (7.6%) | 0 (0.0%) |
| $35,000 to $49,999 | 86 (18.7%) | 0 (0.0%) |
| $50,000 to $74,999 | 74 (16.1%) | 0 (0.0%) |
| $75,000 to $99,999 | 58 (12.6%) | 0 (0.0%) |
| $100,000 to $149,999 | 92 (20.0%) | 0 (0.0%) |
| $150,000 or more | 71 (15.5%) | 0 (0.0%) |
| Total | 459 (100.0%) | 19 (100.0%) |
Monthly Housing Cost Tiers in Rennerdale
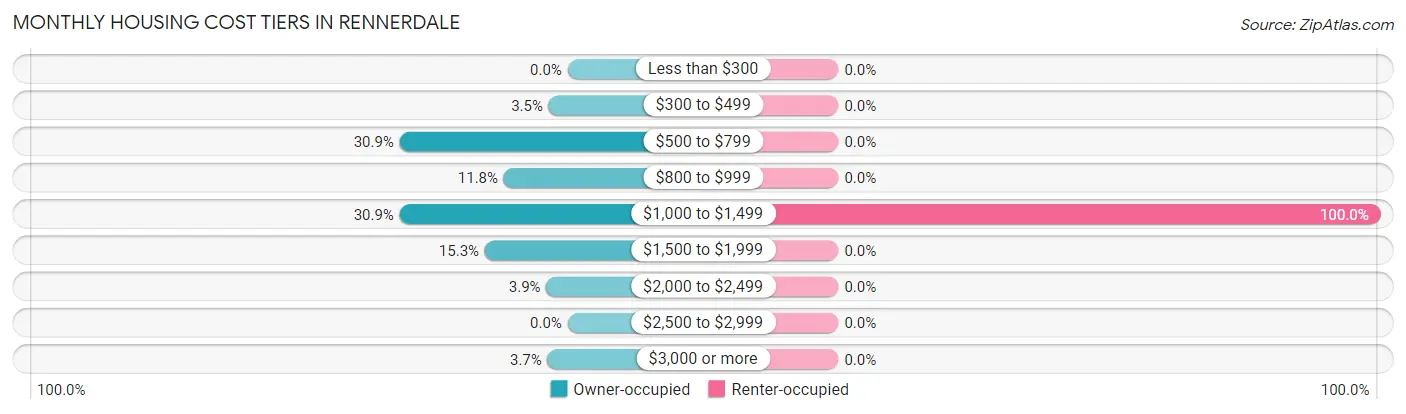
| Monthly Cost | Owner-occupied | Renter-occupied |
| Less than $300 | 0 (0.0%) | 0 (0.0%) |
| $300 to $499 | 16 (3.5%) | 0 (0.0%) |
| $500 to $799 | 142 (30.9%) | 0 (0.0%) |
| $800 to $999 | 54 (11.8%) | 0 (0.0%) |
| $1,000 to $1,499 | 142 (30.9%) | 19 (100.0%) |
| $1,500 to $1,999 | 70 (15.2%) | 0 (0.0%) |
| $2,000 to $2,499 | 18 (3.9%) | 0 (0.0%) |
| $2,500 to $2,999 | 0 (0.0%) | 0 (0.0%) |
| $3,000 or more | 17 (3.7%) | 0 (0.0%) |
| Total | 459 (100.0%) | 19 (100.0%) |
Physical Housing Characteristics in Rennerdale
Housing Structures in Rennerdale
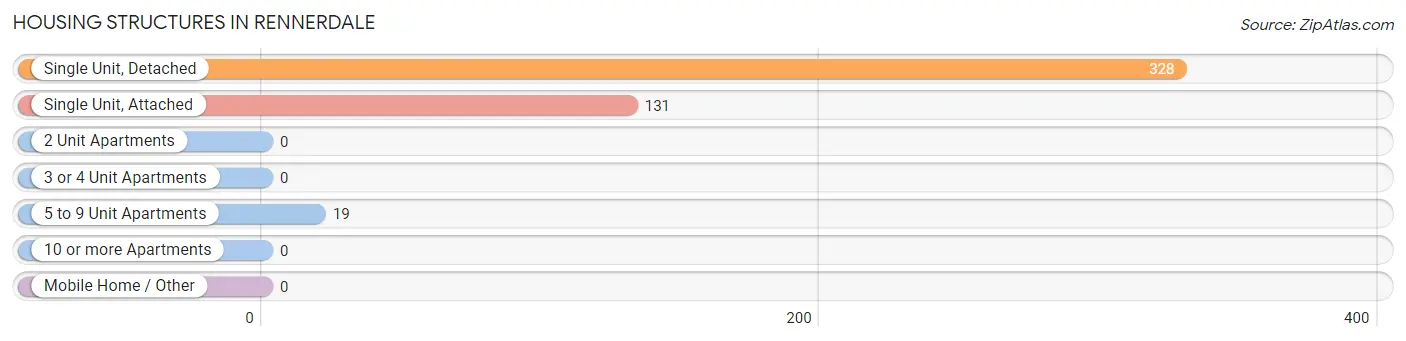
| Structure Type | # Housing Units | % Housing Units |
| Single Unit, Detached | 328 | 68.6% |
| Single Unit, Attached | 131 | 27.4% |
| 2 Unit Apartments | 0 | 0.0% |
| 3 or 4 Unit Apartments | 0 | 0.0% |
| 5 to 9 Unit Apartments | 19 | 4.0% |
| 10 or more Apartments | 0 | 0.0% |
| Mobile Home / Other | 0 | 0.0% |
| Total | 478 | 100.0% |
Housing Structures by Occupancy in Rennerdale
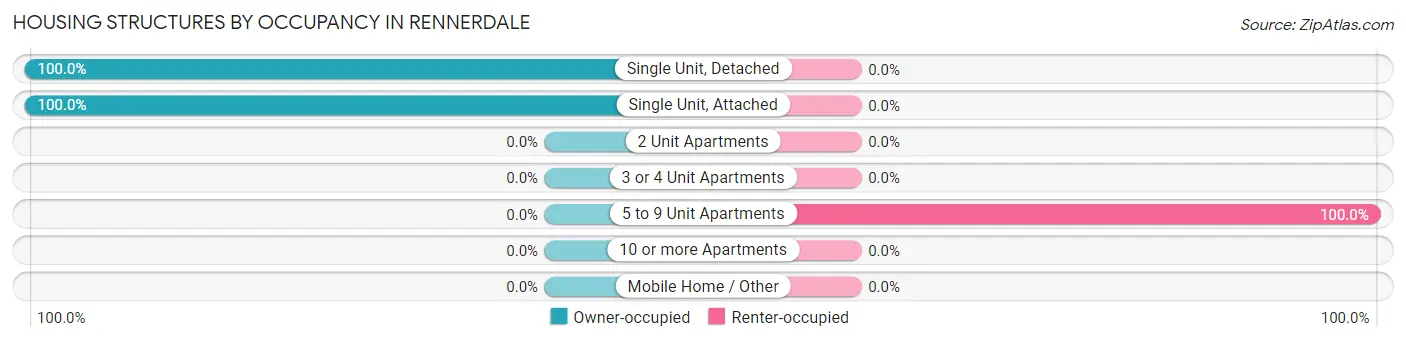
| Structure Type | Owner-occupied | Renter-occupied |
| Single Unit, Detached | 328 (100.0%) | 0 (0.0%) |
| Single Unit, Attached | 131 (100.0%) | 0 (0.0%) |
| 2 Unit Apartments | 0 (0.0%) | 0 (0.0%) |
| 3 or 4 Unit Apartments | 0 (0.0%) | 0 (0.0%) |
| 5 to 9 Unit Apartments | 0 (0.0%) | 19 (100.0%) |
| 10 or more Apartments | 0 (0.0%) | 0 (0.0%) |
| Mobile Home / Other | 0 (0.0%) | 0 (0.0%) |
| Total | 459 (96.0%) | 19 (4.0%) |
Housing Structures by Number of Rooms in Rennerdale
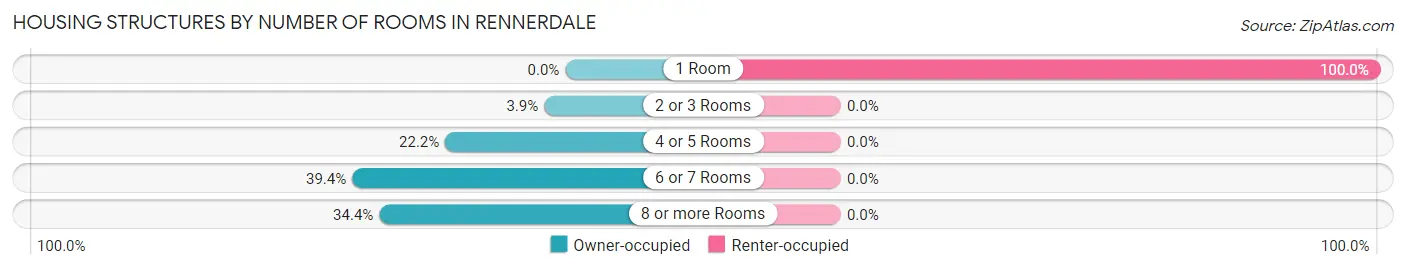
| Number of Rooms | Owner-occupied | Renter-occupied |
| 1 Room | 0 (0.0%) | 19 (100.0%) |
| 2 or 3 Rooms | 18 (3.9%) | 0 (0.0%) |
| 4 or 5 Rooms | 102 (22.2%) | 0 (0.0%) |
| 6 or 7 Rooms | 181 (39.4%) | 0 (0.0%) |
| 8 or more Rooms | 158 (34.4%) | 0 (0.0%) |
| Total | 459 (100.0%) | 19 (100.0%) |
Housing Structure by Heating Type in Rennerdale
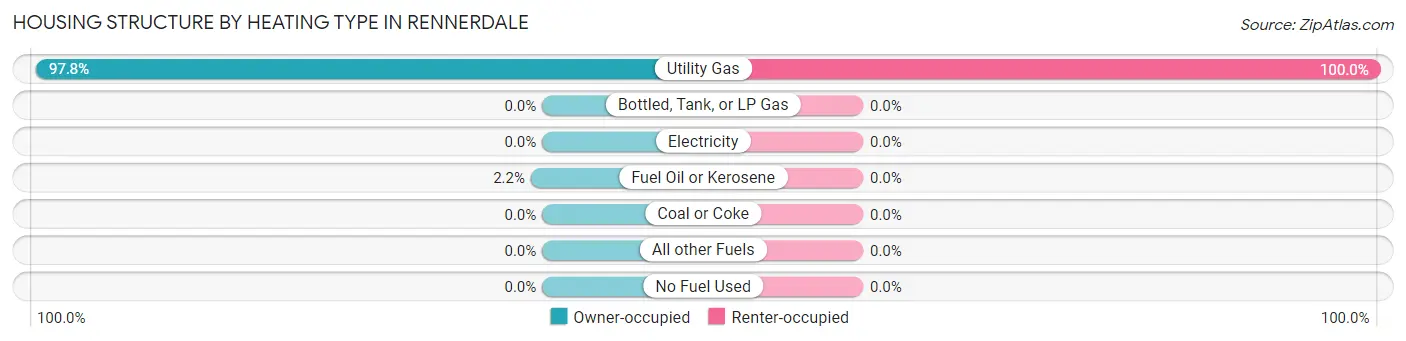
| Heating Type | Owner-occupied | Renter-occupied |
| Utility Gas | 449 (97.8%) | 19 (100.0%) |
| Bottled, Tank, or LP Gas | 0 (0.0%) | 0 (0.0%) |
| Electricity | 0 (0.0%) | 0 (0.0%) |
| Fuel Oil or Kerosene | 10 (2.2%) | 0 (0.0%) |
| Coal or Coke | 0 (0.0%) | 0 (0.0%) |
| All other Fuels | 0 (0.0%) | 0 (0.0%) |
| No Fuel Used | 0 (0.0%) | 0 (0.0%) |
| Total | 459 (100.0%) | 19 (100.0%) |
Household Vehicle Usage in Rennerdale
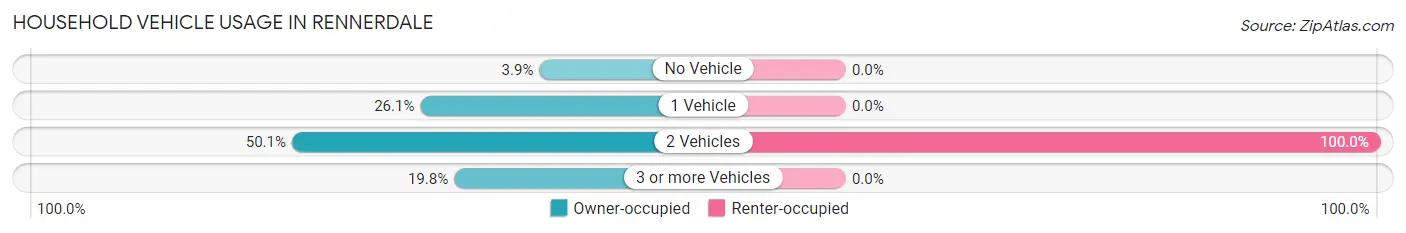
| Vehicles per Household | Owner-occupied | Renter-occupied |
| No Vehicle | 18 (3.9%) | 0 (0.0%) |
| 1 Vehicle | 120 (26.1%) | 0 (0.0%) |
| 2 Vehicles | 230 (50.1%) | 19 (100.0%) |
| 3 or more Vehicles | 91 (19.8%) | 0 (0.0%) |
| Total | 459 (100.0%) | 19 (100.0%) |
Real Estate & Mortgages in Rennerdale
Real Estate and Mortgage Overview in Rennerdale
| Characteristic | Without Mortgage | With Mortgage |
| Housing Units | 236 | 223 |
| Median Property Value | $244,000 | $282,900 |
| Median Household Income | $49,526 | $38 |
| Monthly Housing Costs | $694 | $17 |
| Real Estate Taxes | $3,956 | $0 |
Property Value by Mortgage Status in Rennerdale
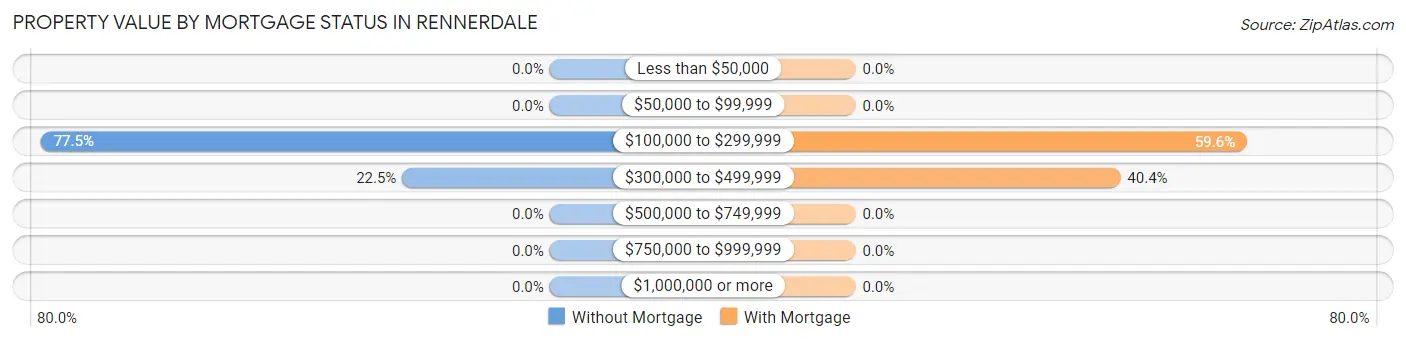
| Property Value | Without Mortgage | With Mortgage |
| Less than $50,000 | 0 (0.0%) | 0 (0.0%) |
| $50,000 to $99,999 | 0 (0.0%) | 0 (0.0%) |
| $100,000 to $299,999 | 183 (77.5%) | 133 (59.6%) |
| $300,000 to $499,999 | 53 (22.5%) | 90 (40.4%) |
| $500,000 to $749,999 | 0 (0.0%) | 0 (0.0%) |
| $750,000 to $999,999 | 0 (0.0%) | 0 (0.0%) |
| $1,000,000 or more | 0 (0.0%) | 0 (0.0%) |
| Total | 236 (100.0%) | 223 (100.0%) |
Household Income by Mortgage Status in Rennerdale
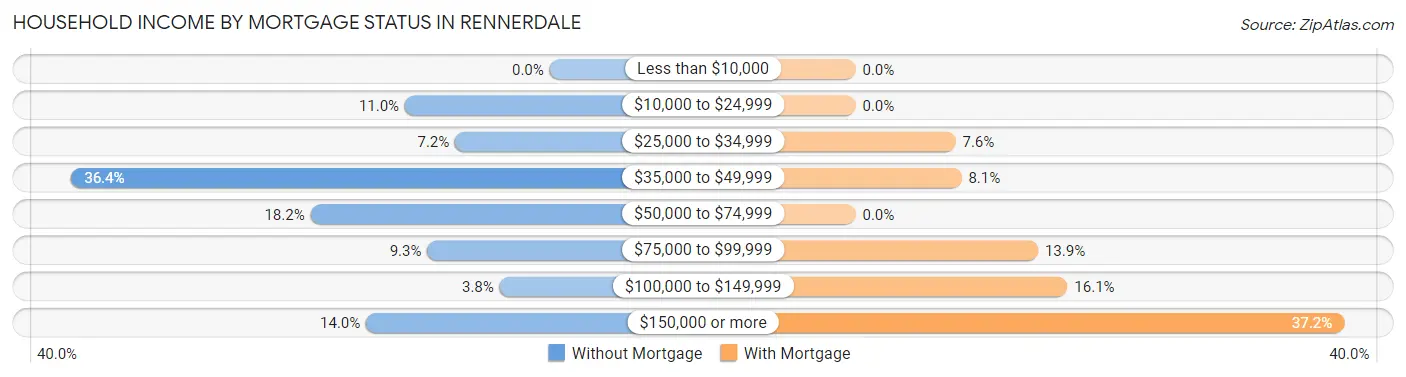
| Household Income | Without Mortgage | With Mortgage |
| Less than $10,000 | 0 (0.0%) | 0 (0.0%) |
| $10,000 to $24,999 | 26 (11.0%) | 0 (0.0%) |
| $25,000 to $34,999 | 17 (7.2%) | 17 (7.6%) |
| $35,000 to $49,999 | 86 (36.4%) | 18 (8.1%) |
| $50,000 to $74,999 | 43 (18.2%) | 0 (0.0%) |
| $75,000 to $99,999 | 22 (9.3%) | 31 (13.9%) |
| $100,000 to $149,999 | 9 (3.8%) | 36 (16.1%) |
| $150,000 or more | 33 (14.0%) | 83 (37.2%) |
| Total | 236 (100.0%) | 223 (100.0%) |
Property Value to Household Income Ratio in Rennerdale
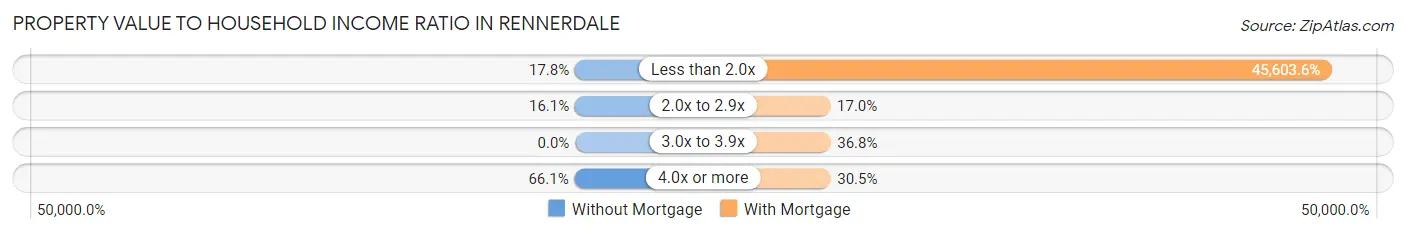
| Value-to-Income Ratio | Without Mortgage | With Mortgage |
| Less than 2.0x | 42 (17.8%) | 101,696 (45,603.6%) |
| 2.0x to 2.9x | 38 (16.1%) | 38 (17.0%) |
| 3.0x to 3.9x | 0 (0.0%) | 82 (36.8%) |
| 4.0x or more | 156 (66.1%) | 68 (30.5%) |
| Total | 236 (100.0%) | 223 (100.0%) |
Real Estate Taxes by Mortgage Status in Rennerdale
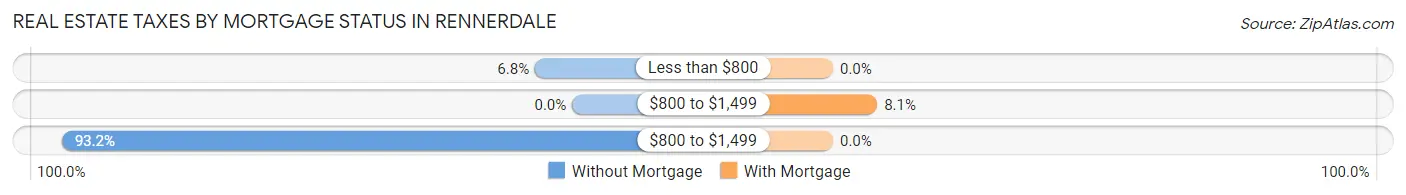
| Property Taxes | Without Mortgage | With Mortgage |
| Less than $800 | 16 (6.8%) | 0 (0.0%) |
| $800 to $1,499 | 0 (0.0%) | 18 (8.1%) |
| $800 to $1,499 | 220 (93.2%) | 0 (0.0%) |
| Total | 236 (100.0%) | 223 (100.0%) |
Health & Disability in Rennerdale
Health Insurance Coverage by Age in Rennerdale
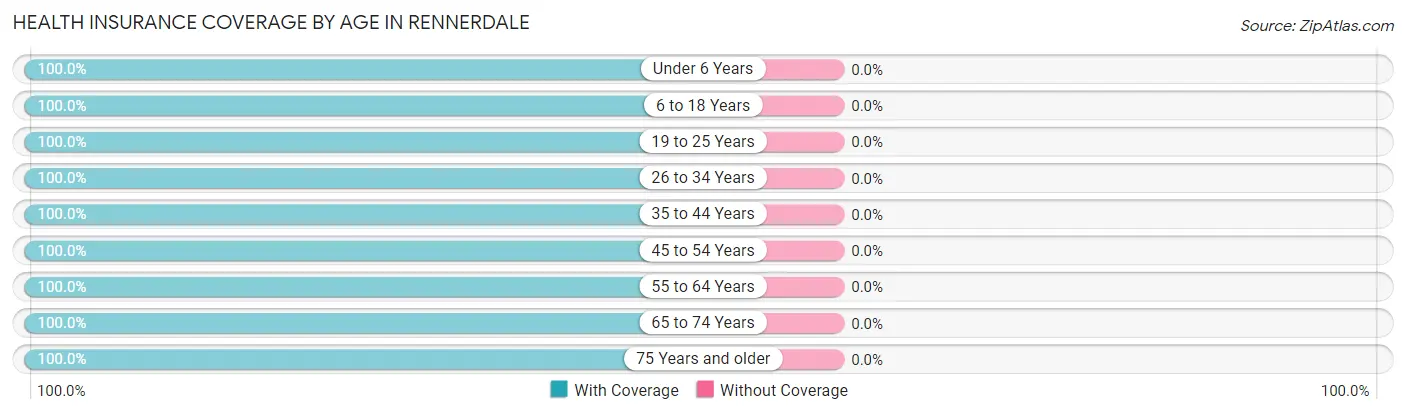
| Age Bracket | With Coverage | Without Coverage |
| Under 6 Years | 60 (100.0%) | 0 (0.0%) |
| 6 to 18 Years | 17 (100.0%) | 0 (0.0%) |
| 19 to 25 Years | 17 (100.0%) | 0 (0.0%) |
| 26 to 34 Years | 75 (100.0%) | 0 (0.0%) |
| 35 to 44 Years | 56 (100.0%) | 0 (0.0%) |
| 45 to 54 Years | 45 (100.0%) | 0 (0.0%) |
| 55 to 64 Years | 264 (100.0%) | 0 (0.0%) |
| 65 to 74 Years | 271 (100.0%) | 0 (0.0%) |
| 75 Years and older | 148 (100.0%) | 0 (0.0%) |
| Total | 953 (100.0%) | 0 (0.0%) |
Health Insurance Coverage by Citizenship Status in Rennerdale
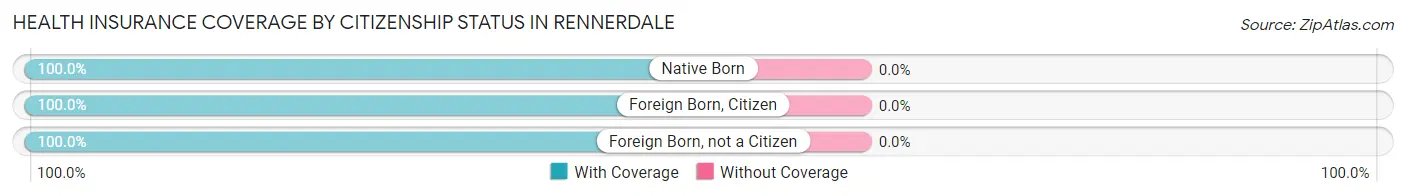
| Citizenship Status | With Coverage | Without Coverage |
| Native Born | 60 (100.0%) | 0 (0.0%) |
| Foreign Born, Citizen | 17 (100.0%) | 0 (0.0%) |
| Foreign Born, not a Citizen | 17 (100.0%) | 0 (0.0%) |
Health Insurance Coverage by Household Income in Rennerdale
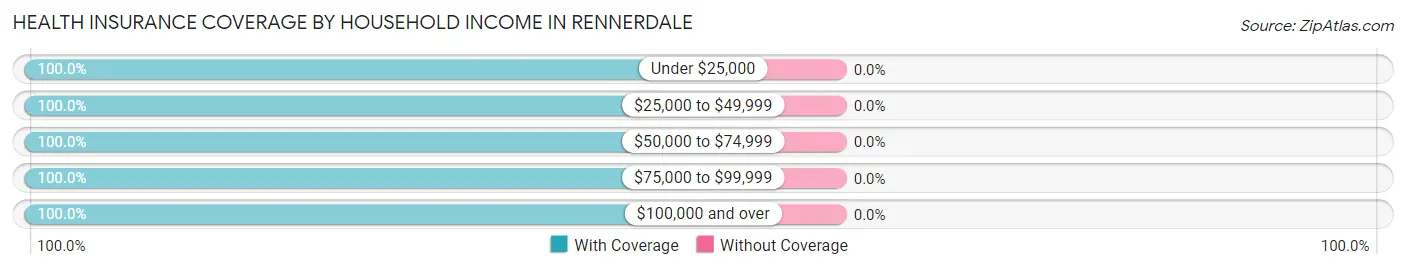
| Household Income | With Coverage | Without Coverage |
| Under $25,000 | 109 (100.0%) | 0 (0.0%) |
| $25,000 to $49,999 | 219 (100.0%) | 0 (0.0%) |
| $50,000 to $74,999 | 122 (100.0%) | 0 (0.0%) |
| $75,000 to $99,999 | 137 (100.0%) | 0 (0.0%) |
| $100,000 and over | 366 (100.0%) | 0 (0.0%) |
Public vs Private Health Insurance Coverage by Age in Rennerdale
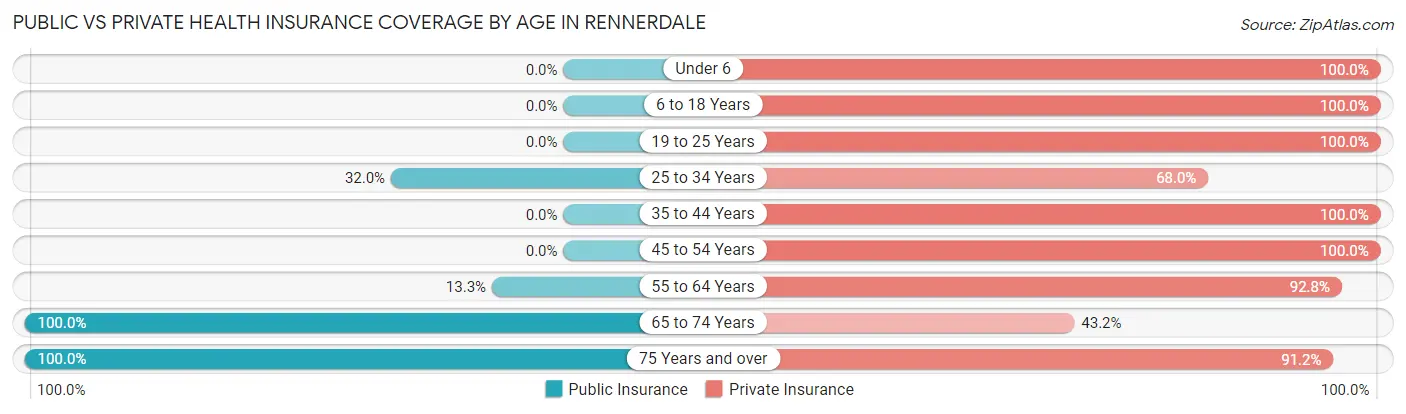
| Age Bracket | Public Insurance | Private Insurance |
| Under 6 | 0 (0.0%) | 60 (100.0%) |
| 6 to 18 Years | 0 (0.0%) | 17 (100.0%) |
| 19 to 25 Years | 0 (0.0%) | 17 (100.0%) |
| 25 to 34 Years | 24 (32.0%) | 51 (68.0%) |
| 35 to 44 Years | 0 (0.0%) | 56 (100.0%) |
| 45 to 54 Years | 0 (0.0%) | 45 (100.0%) |
| 55 to 64 Years | 35 (13.3%) | 245 (92.8%) |
| 65 to 74 Years | 271 (100.0%) | 117 (43.2%) |
| 75 Years and over | 148 (100.0%) | 135 (91.2%) |
| Total | 478 (50.2%) | 743 (78.0%) |
Disability Status by Sex by Age in Rennerdale
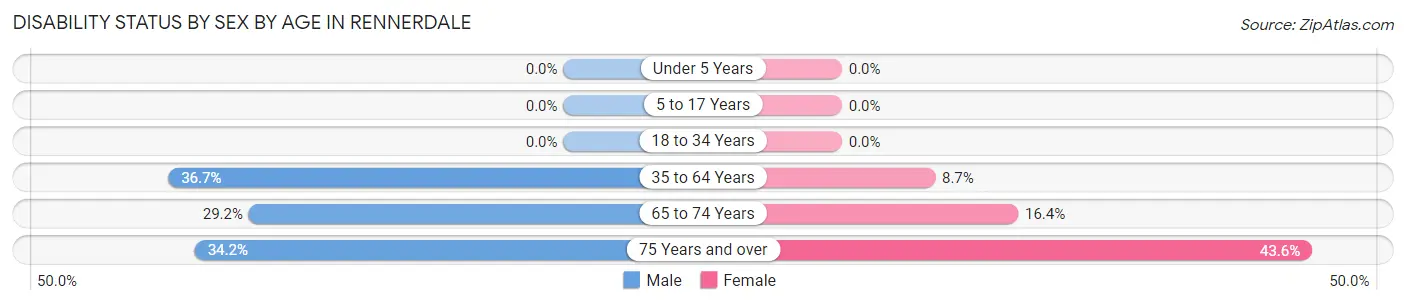
| Age Bracket | Male | Female |
| Under 5 Years | 0 (0.0%) | 0 (0.0%) |
| 5 to 17 Years | 0 (0.0%) | 0 (0.0%) |
| 18 to 34 Years | 0 (0.0%) | 0 (0.0%) |
| 35 to 64 Years | 66 (36.7%) | 16 (8.6%) |
| 65 to 74 Years | 47 (29.2%) | 18 (16.4%) |
| 75 Years and over | 13 (34.2%) | 48 (43.6%) |
Disability Class by Sex by Age in Rennerdale
Disability Class: Hearing Difficulty
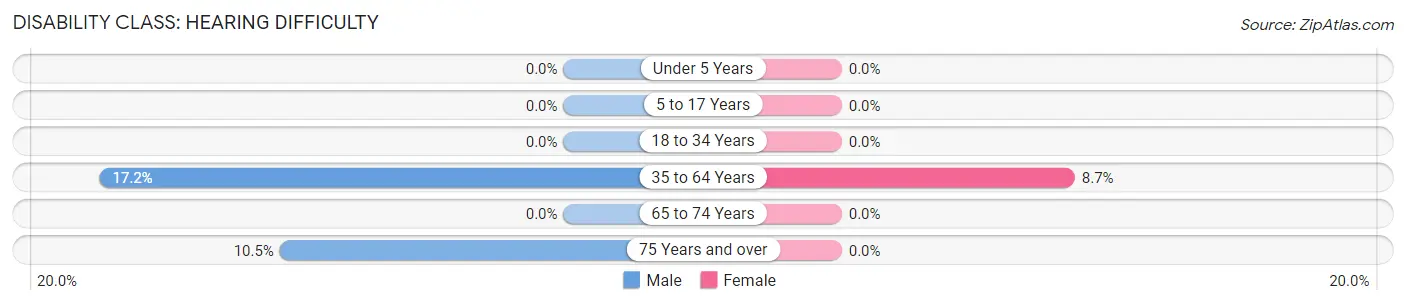
| Age Bracket | Male | Female |
| Under 5 Years | 0 (0.0%) | 0 (0.0%) |
| 5 to 17 Years | 0 (0.0%) | 0 (0.0%) |
| 18 to 34 Years | 0 (0.0%) | 0 (0.0%) |
| 35 to 64 Years | 31 (17.2%) | 16 (8.6%) |
| 65 to 74 Years | 0 (0.0%) | 0 (0.0%) |
| 75 Years and over | 4 (10.5%) | 0 (0.0%) |
Disability Class: Vision Difficulty
| Age Bracket | Male | Female |
| Under 5 Years | 0 (0.0%) | 0 (0.0%) |
| 5 to 17 Years | 0 (0.0%) | 0 (0.0%) |
| 18 to 34 Years | 0 (0.0%) | 0 (0.0%) |
| 35 to 64 Years | 0 (0.0%) | 0 (0.0%) |
| 65 to 74 Years | 0 (0.0%) | 0 (0.0%) |
| 75 Years and over | 0 (0.0%) | 0 (0.0%) |
Disability Class: Cognitive Difficulty
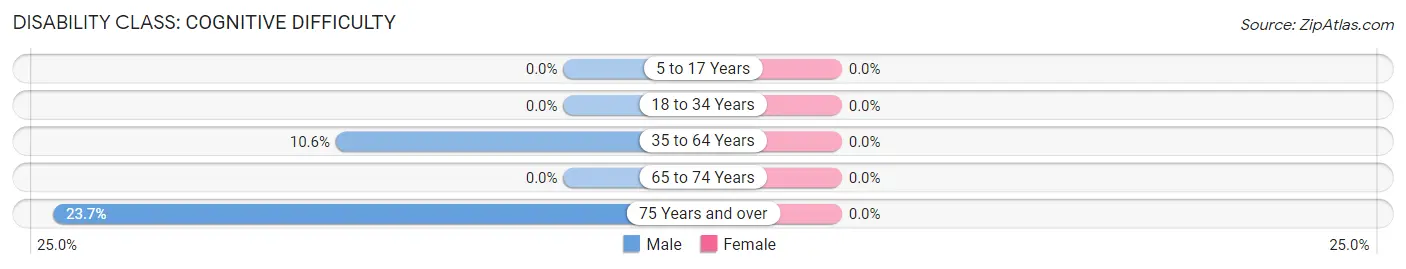
| Age Bracket | Male | Female |
| 5 to 17 Years | 0 (0.0%) | 0 (0.0%) |
| 18 to 34 Years | 0 (0.0%) | 0 (0.0%) |
| 35 to 64 Years | 19 (10.6%) | 0 (0.0%) |
| 65 to 74 Years | 0 (0.0%) | 0 (0.0%) |
| 75 Years and over | 9 (23.7%) | 0 (0.0%) |
Disability Class: Ambulatory Difficulty
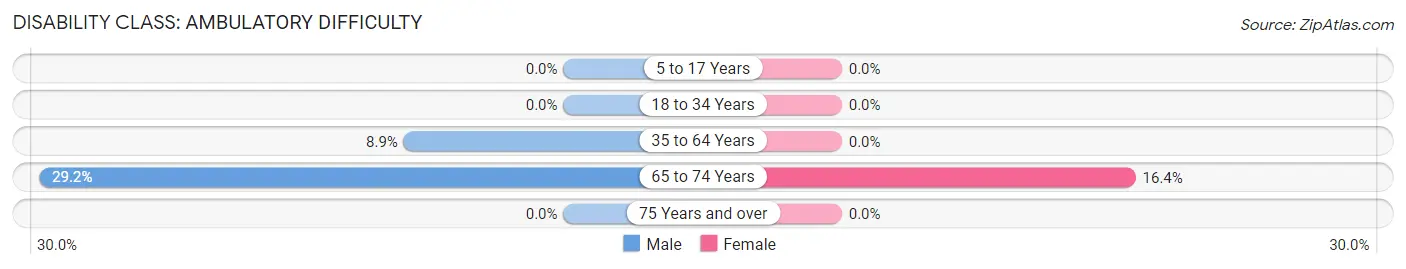
| Age Bracket | Male | Female |
| 5 to 17 Years | 0 (0.0%) | 0 (0.0%) |
| 18 to 34 Years | 0 (0.0%) | 0 (0.0%) |
| 35 to 64 Years | 16 (8.9%) | 0 (0.0%) |
| 65 to 74 Years | 47 (29.2%) | 18 (16.4%) |
| 75 Years and over | 0 (0.0%) | 0 (0.0%) |
Disability Class: Self-Care Difficulty
| Age Bracket | Male | Female |
| 5 to 17 Years | 0 (0.0%) | 0 (0.0%) |
| 18 to 34 Years | 0 (0.0%) | 0 (0.0%) |
| 35 to 64 Years | 0 (0.0%) | 0 (0.0%) |
| 65 to 74 Years | 0 (0.0%) | 0 (0.0%) |
| 75 Years and over | 0 (0.0%) | 0 (0.0%) |
Technology Access in Rennerdale
Computing Device Access in Rennerdale
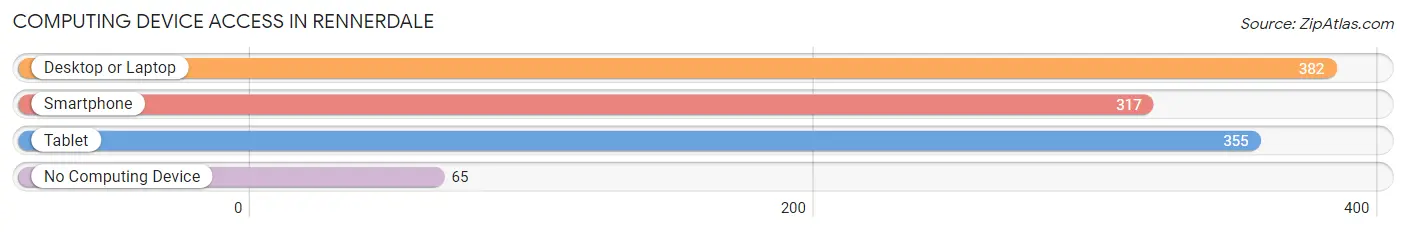
| Device Type | # Households | % Households |
| Desktop or Laptop | 382 | 79.9% |
| Smartphone | 317 | 66.3% |
| Tablet | 355 | 74.3% |
| No Computing Device | 65 | 13.6% |
| Total | 478 | 100.0% |
Internet Access in Rennerdale
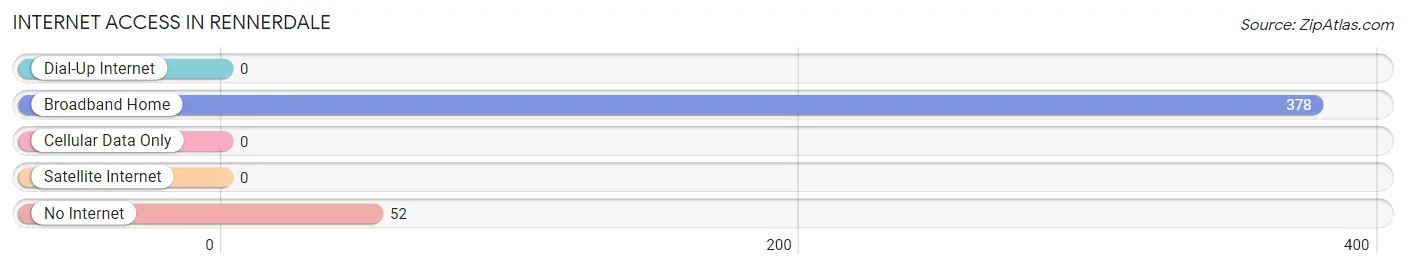
| Internet Type | # Households | % Households |
| Dial-Up Internet | 0 | 0.0% |
| Broadband Home | 378 | 79.1% |
| Cellular Data Only | 0 | 0.0% |
| Satellite Internet | 0 | 0.0% |
| No Internet | 52 | 10.9% |
| Total | 478 | 100.0% |
Rennerdale Summary
Rennerdale is a small borough located in Allegheny County, Pennsylvania. It is situated in the southwestern part of the county, approximately 15 miles from downtown Pittsburgh. The borough is bordered by the townships of Collier, Robinson, and South Fayette. According to the 2010 census, the population of Rennerdale was 1,845.
History
The area that is now Rennerdale was first settled in the late 1700s by German immigrants. The first settlers were the Renner family, who gave the borough its name. The Renner family owned a large tract of land in the area, and the family’s homestead was located near the present-day intersection of Rennerdale Road and Noblestown Road.
In 1876, the area was incorporated as the Borough of Rennerdale. The borough was named after the Renner family, who had been the first settlers in the area. The first mayor of Rennerdale was John Renner, a descendant of the original settlers.
Geography
Rennerdale is located in southwestern Allegheny County, approximately 15 miles from downtown Pittsburgh. The borough is bordered by the townships of Collier, Robinson, and South Fayette. According to the United States Census Bureau, the borough has a total area of 0.7 square miles, all of which is land.
The borough is situated in the Allegheny Plateau region of Pennsylvania. The terrain is mostly hilly, with some flat areas. The highest point in the borough is located at the intersection of Rennerdale Road and Noblestown Road, which is approximately 1,000 feet above sea level.
Economy
The economy of Rennerdale is largely based on small businesses and local services. The borough is home to a variety of small businesses, including restaurants, retail stores, and professional services. The borough also has a few larger employers, such as a manufacturing plant and a medical center.
The median household income in Rennerdale is $45,813, which is slightly higher than the national average. The unemployment rate in the borough is 4.2%, which is lower than the national average.
Demographics
According to the 2010 census, the population of Rennerdale was 1,845. The racial makeup of the borough was 94.2% White, 2.7% African American, 0.3% Native American, 0.7% Asian, 0.1% Pacific Islander, 0.7% from other races, and 1.2% from two or more races. Hispanic or Latino of any race were 1.7% of the population.
The median age in Rennerdale is 43.3 years, which is slightly higher than the national average. The median household income in the borough is $45,813, which is slightly higher than the national average. The poverty rate in Rennerdale is 8.3%, which is lower than the national average.
Conclusion
Rennerdale is a small borough located in southwestern Allegheny County, Pennsylvania. The borough was first settled in the late 1700s by German immigrants, and was incorporated in 1876. The economy of Rennerdale is largely based on small businesses and local services. According to the 2010 census, the population of Rennerdale was 1,845. The median age in Rennerdale is 43.3 years, and the median household income is $45,813.
Common Questions
What is the Total Population of Rennerdale?
Total Population of Rennerdale is 955.
What is the Total Male Population of Rennerdale?
Total Male Population of Rennerdale is 485.
What is the Total Female Population of Rennerdale?
Total Female Population of Rennerdale is 470.
What is the Ratio of Males per 100 Females in Rennerdale?
There are 103.19 Males per 100 Females in Rennerdale.
What is the Ratio of Females per 100 Males in Rennerdale?
There are 96.91 Females per 100 Males in Rennerdale.
What is the Median Population Age in Rennerdale?
Median Population Age in Rennerdale is 60.2 Years.
What is the Average Family Size in Rennerdale
Average Family Size in Rennerdale is 2.5 People.
What is the Average Household Size in Rennerdale
Average Household Size in Rennerdale is 2.0 People.
What is Per Capita Income in Rennerdale?
Per Capita income in Rennerdale is $46,374.
What is the Median Family Income in Rennerdale?
Median Family Income in Rennerdale is $125,453.
What is the Median Household income in Rennerdale?
Median Household Income in Rennerdale is $67,632.
What is Income or Wage Gap in Rennerdale?
Income or Wage Gap in Rennerdale is 16.1%.
Women in Rennerdale earn 83.9 cents for every dollar earned by a man.
What is Inequality or Gini Index in Rennerdale?
Inequality or Gini Index in Rennerdale is 0.40.
How Large is the Labor Force in Rennerdale?
There are 490 People in the Labor Forcein in Rennerdale.
What is the Percentage of People in the Labor Force in Rennerdale?
55.8% of People are in the Labor Force in Rennerdale.
What is the Unemployment Rate in Rennerdale?
Unemployment Rate in Rennerdale is 5.9%.