Lake Heritage, PA
Lake Heritage Map
Lake Heritage Overview
2,731
TOTAL POPULATION
1,225
MALE POPULATION
1,506
FEMALE POPULATION
81.34
MALES / 100 FEMALES
122.94
FEMALES / 100 MALES
48.8
MEDIAN AGE
3.1
AVG FAMILY SIZE
2.6
AVG HOUSEHOLD SIZE
$47,366
PER CAPITA INCOME
$132,159
AVG FAMILY INCOME
$116,211
AVG HOUSEHOLD INCOME
51.5%
WAGE / INCOME GAP [ % ]
48.5¢/ $1
WAGE / INCOME GAP [ $ ]
0.33
INEQUALITY / GINI INDEX
1,397
LABOR FORCE [ PEOPLE ]
59.3%
PERCENT IN LABOR FORCE
2.6%
UNEMPLOYMENT RATE
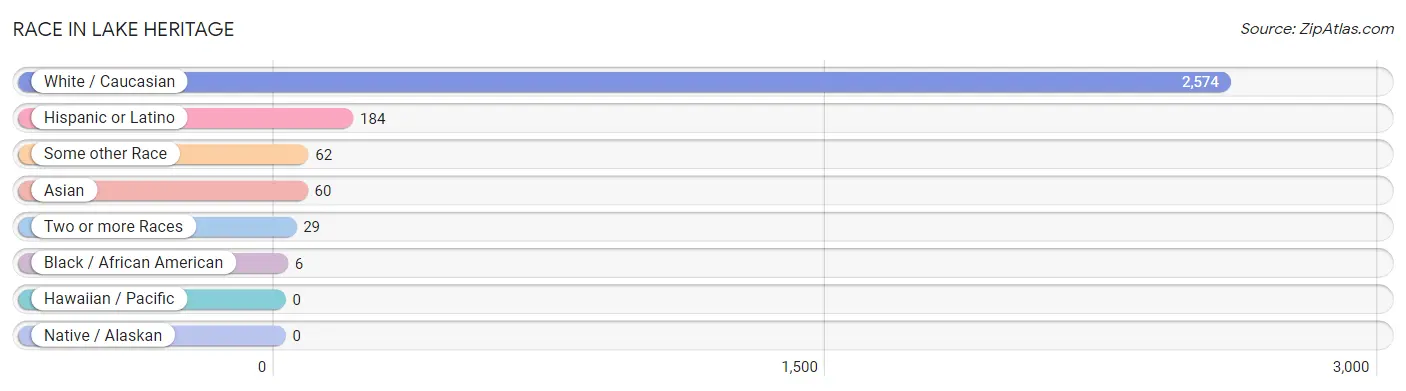
Race in Lake Heritage
The most populous races in Lake Heritage are White / Caucasian (2,574 | 94.3%), Hispanic or Latino (184 | 6.7%), and Some other Race (62 | 2.3%).
| Race | # Population | % Population |
| Asian | 60 | 2.2% |
| Black / African American | 6 | 0.2% |
| Hawaiian / Pacific | 0 | 0.0% |
| Hispanic or Latino | 184 | 6.7% |
| Native / Alaskan | 0 | 0.0% |
| White / Caucasian | 2,574 | 94.3% |
| Two or more Races | 29 | 1.1% |
| Some other Race | 62 | 2.3% |
| Total | 2,731 | 100.0% |
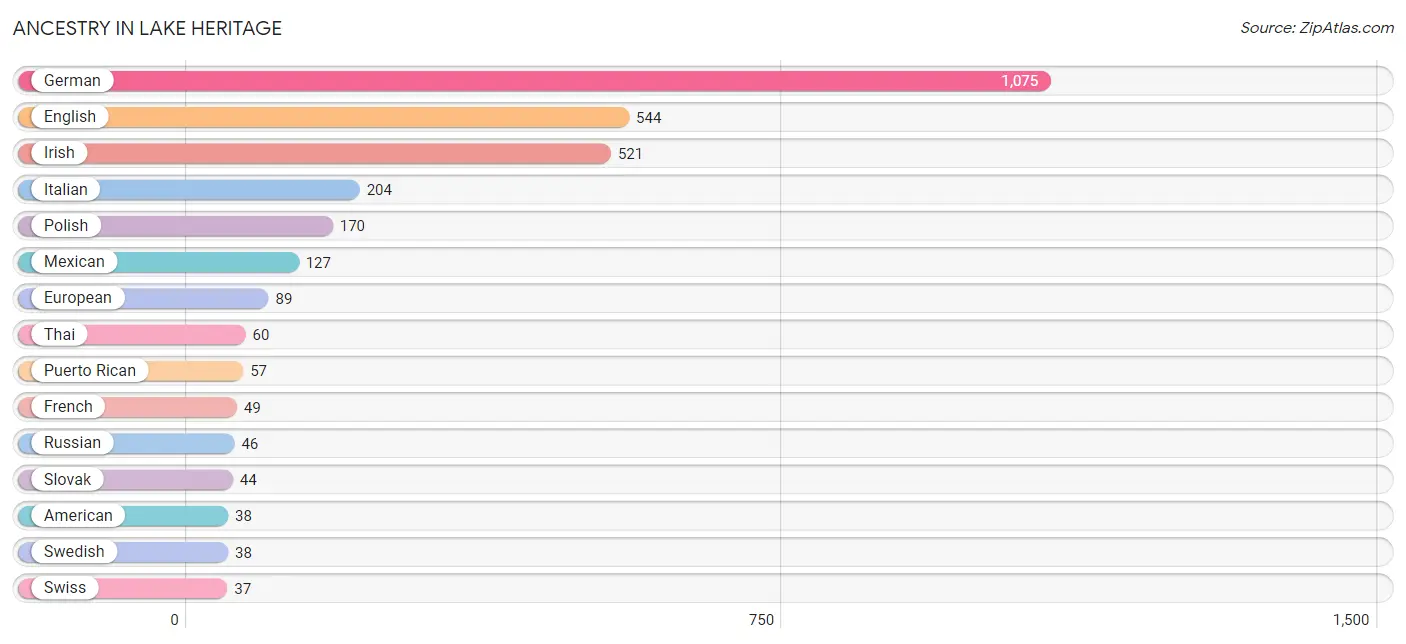
Ancestry in Lake Heritage
The most populous ancestries reported in Lake Heritage are German (1,075 | 39.4%), English (544 | 19.9%), Irish (521 | 19.1%), Italian (204 | 7.5%), and Polish (170 | 6.2%), together accounting for 92.0% of all Lake Heritage residents.
| Ancestry | # Population | % Population |
| American | 38 | 1.4% |
| Belgian | 8 | 0.3% |
| British | 12 | 0.4% |
| Dutch | 17 | 0.6% |
| English | 544 | 19.9% |
| European | 89 | 3.3% |
| French | 49 | 1.8% |
| French Canadian | 13 | 0.5% |
| German | 1,075 | 39.4% |
| Hungarian | 7 | 0.3% |
| Irish | 521 | 19.1% |
| Italian | 204 | 7.5% |
| Mexican | 127 | 4.6% |
| Norwegian | 18 | 0.7% |
| Polish | 170 | 6.2% |
| Puerto Rican | 57 | 2.1% |
| Russian | 46 | 1.7% |
| Scottish | 29 | 1.1% |
| Serbian | 14 | 0.5% |
| Slovak | 44 | 1.6% |
| Swedish | 38 | 1.4% |
| Swiss | 37 | 1.3% |
| Thai | 60 | 2.2% |
| Ukrainian | 13 | 0.5% |
| Welsh | 8 | 0.3% | View All 25 Rows |
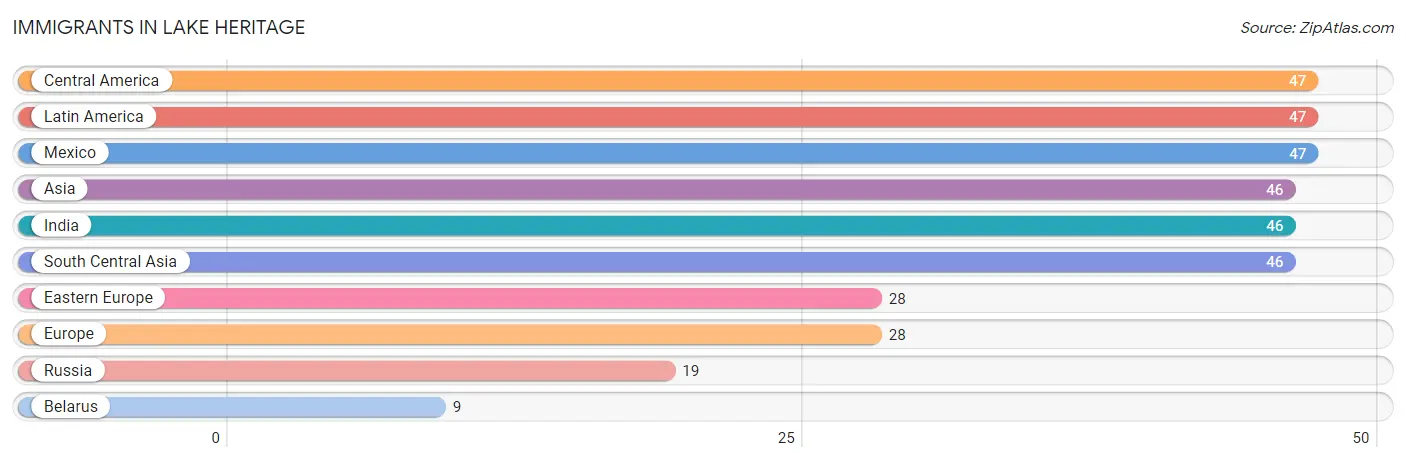
Immigrants in Lake Heritage
The most numerous immigrant groups reported in Lake Heritage came from Central America (47 | 1.7%), Latin America (47 | 1.7%), Mexico (47 | 1.7%), Asia (46 | 1.7%), and India (46 | 1.7%), together accounting for 8.5% of all Lake Heritage residents.
| Immigration Origin | # Population | % Population |
| Asia | 46 | 1.7% |
| Belarus | 9 | 0.3% |
| Central America | 47 | 1.7% |
| Eastern Europe | 28 | 1.0% |
| Europe | 28 | 1.0% |
| India | 46 | 1.7% |
| Latin America | 47 | 1.7% |
| Mexico | 47 | 1.7% |
| Russia | 19 | 0.7% |
| South Central Asia | 46 | 1.7% | View All 10 Rows |
Sex and Age in Lake Heritage
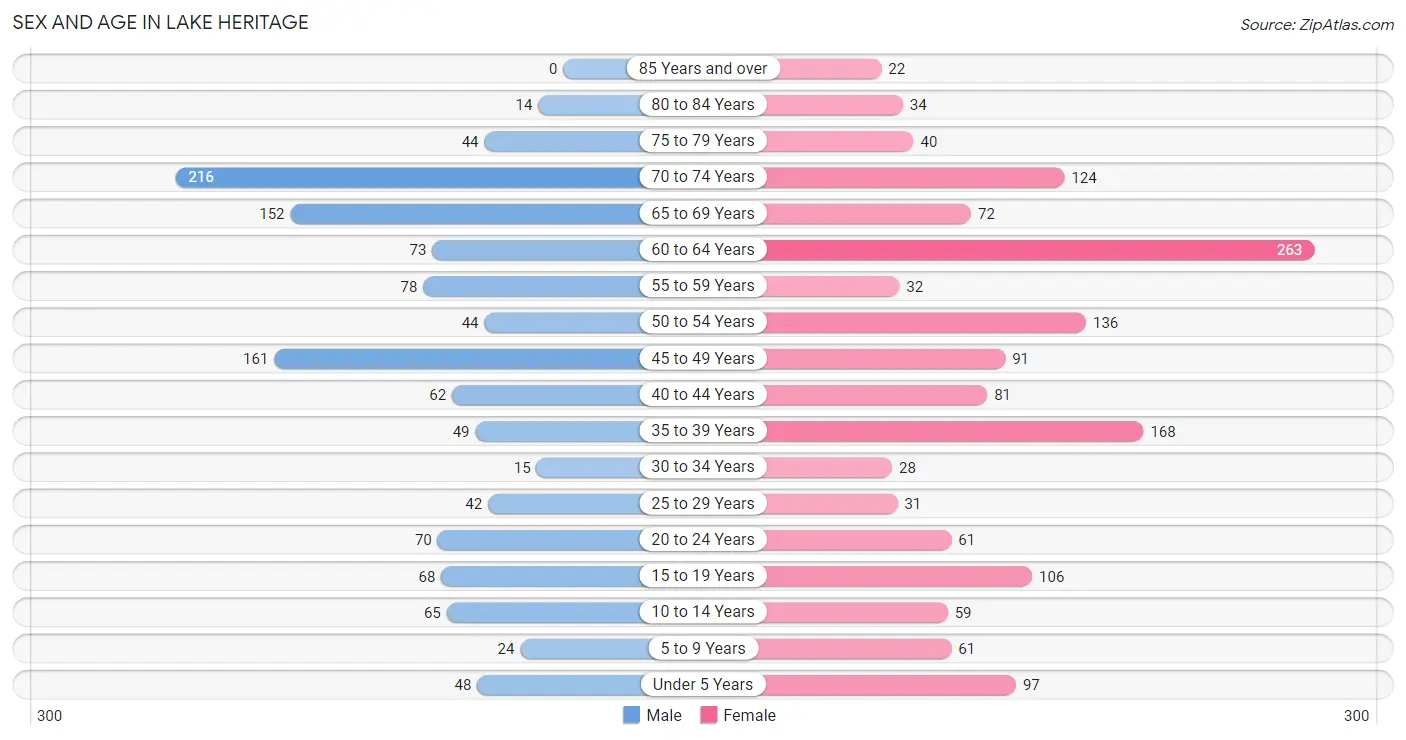
Sex and Age in Lake Heritage
The most populous age groups in Lake Heritage are 70 to 74 Years (216 | 17.6%) for men and 60 to 64 Years (263 | 17.5%) for women.
| Age Bracket | Male | Female |
| Under 5 Years | 48 (3.9%) | 97 (6.4%) |
| 5 to 9 Years | 24 (2.0%) | 61 (4.1%) |
| 10 to 14 Years | 65 (5.3%) | 59 (3.9%) |
| 15 to 19 Years | 68 (5.6%) | 106 (7.0%) |
| 20 to 24 Years | 70 (5.7%) | 61 (4.1%) |
| 25 to 29 Years | 42 (3.4%) | 31 (2.1%) |
| 30 to 34 Years | 15 (1.2%) | 28 (1.9%) |
| 35 to 39 Years | 49 (4.0%) | 168 (11.2%) |
| 40 to 44 Years | 62 (5.1%) | 81 (5.4%) |
| 45 to 49 Years | 161 (13.1%) | 91 (6.0%) |
| 50 to 54 Years | 44 (3.6%) | 136 (9.0%) |
| 55 to 59 Years | 78 (6.4%) | 32 (2.1%) |
| 60 to 64 Years | 73 (6.0%) | 263 (17.5%) |
| 65 to 69 Years | 152 (12.4%) | 72 (4.8%) |
| 70 to 74 Years | 216 (17.6%) | 124 (8.2%) |
| 75 to 79 Years | 44 (3.6%) | 40 (2.7%) |
| 80 to 84 Years | 14 (1.1%) | 34 (2.3%) |
| 85 Years and over | 0 (0.0%) | 22 (1.5%) |
| Total | 1,225 (100.0%) | 1,506 (100.0%) |
Families and Households in Lake Heritage
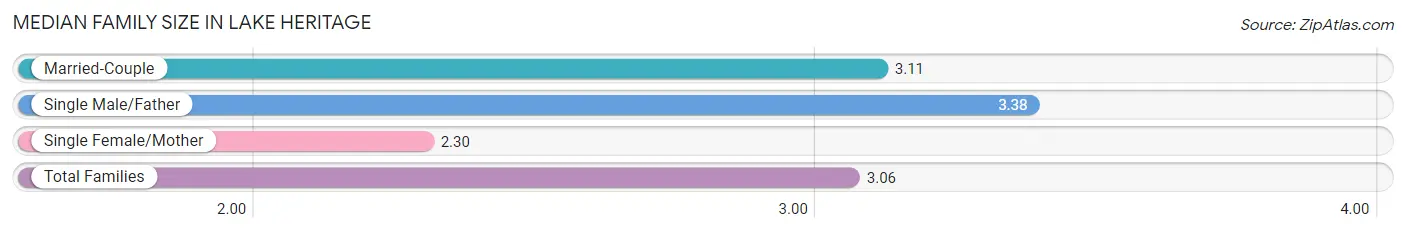
Median Family Size in Lake Heritage
The median family size in Lake Heritage is 3.06 persons per family, with single male/father families (8 | 1.0%) accounting for the largest median family size of 3.38 persons per family. On the other hand, single female/mother families (46 | 5.8%) represent the smallest median family size with 2.30 persons per family.
| Family Type | # Families | Family Size |
| Married-Couple | 745 (93.2%) | 3.11 |
| Single Male/Father | 8 (1.0%) | 3.38 |
| Single Female/Mother | 46 (5.8%) | 2.30 |
| Total Families | 799 (100.0%) | 3.06 |
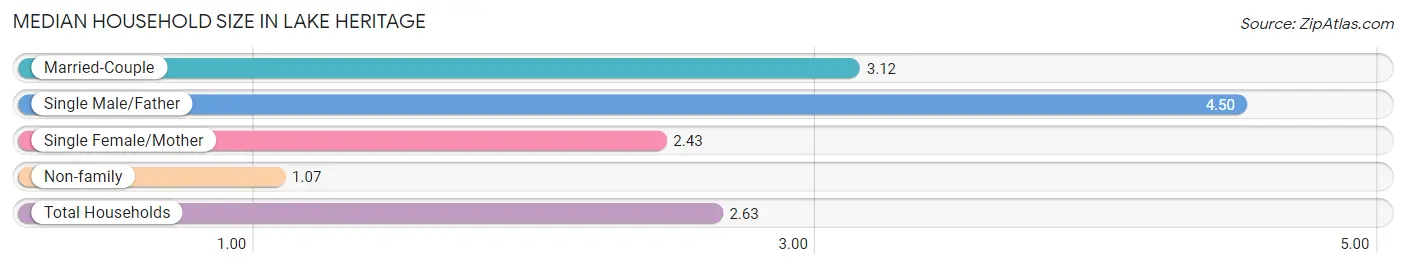
Median Household Size in Lake Heritage
The median household size in Lake Heritage is 2.63 persons per household, with single male/father households (8 | 0.8%) accounting for the largest median household size of 4.5 persons per household. non-family households (240 | 23.1%) represent the smallest median household size with 1.07 persons per household.
| Household Type | # Households | Household Size |
| Married-Couple | 745 (71.7%) | 3.12 |
| Single Male/Father | 8 (0.8%) | 4.50 |
| Single Female/Mother | 46 (4.4%) | 2.43 |
| Non-family | 240 (23.1%) | 1.07 |
| Total Households | 1,039 (100.0%) | 2.63 |
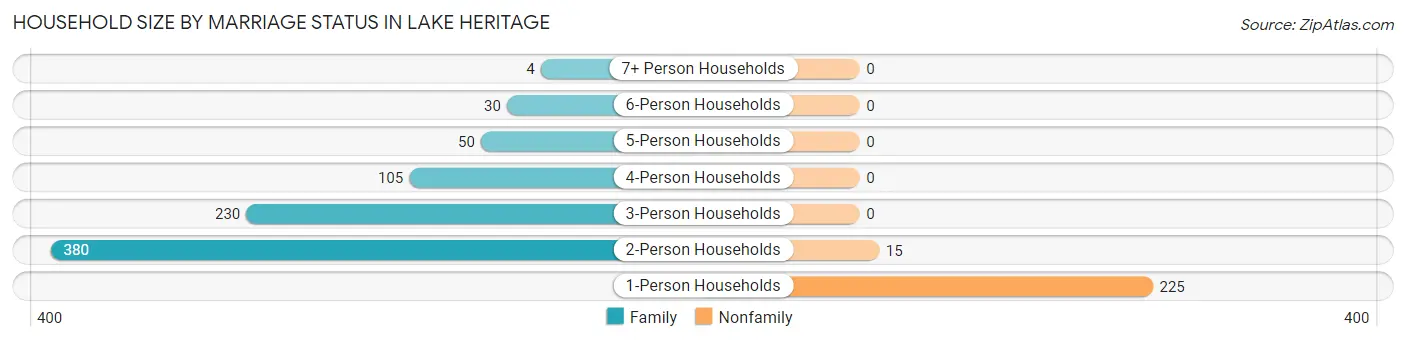
Household Size by Marriage Status in Lake Heritage
Out of a total of 1,039 households in Lake Heritage, 799 (76.9%) are family households, while 240 (23.1%) are nonfamily households. The most numerous type of family households are 2-person households, comprising 380, and the most common type of nonfamily households are 1-person households, comprising 225.
| Household Size | Family Households | Nonfamily Households |
| 1-Person Households | - | 225 (21.7%) |
| 2-Person Households | 380 (36.6%) | 15 (1.4%) |
| 3-Person Households | 230 (22.1%) | 0 (0.0%) |
| 4-Person Households | 105 (10.1%) | 0 (0.0%) |
| 5-Person Households | 50 (4.8%) | 0 (0.0%) |
| 6-Person Households | 30 (2.9%) | 0 (0.0%) |
| 7+ Person Households | 4 (0.4%) | 0 (0.0%) |
| Total | 799 (76.9%) | 240 (23.1%) |
Female Fertility in Lake Heritage
Fertility by Age in Lake Heritage
Average fertility rate in Lake Heritage is 34.0 births per 1,000 women. Women in the age bracket of 20 to 34 years have the highest fertility rate with 167.0 births per 1,000 women. Women in the age bracket of 20 to 34 years acount for 100.0% of all women with births.
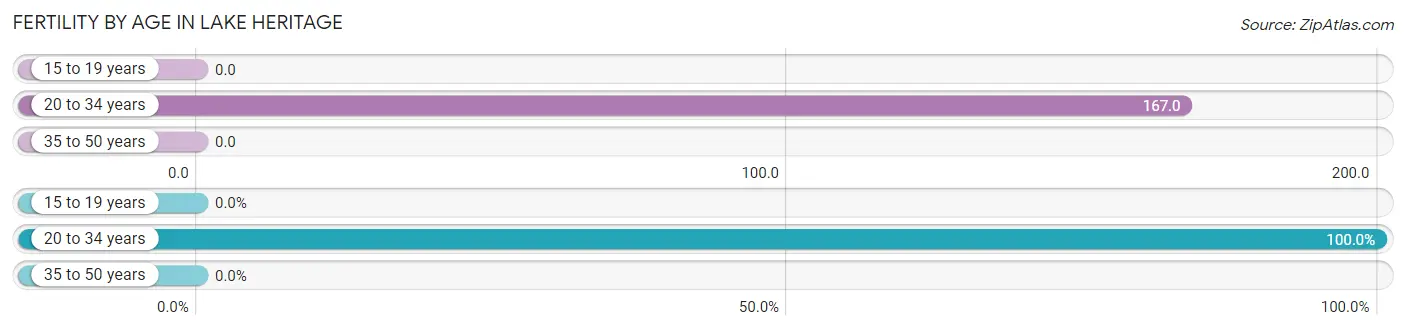
| Age Bracket | Women with Births | Births / 1,000 Women |
| 15 to 19 years | 0 (0.0%) | 0.0 |
| 20 to 34 years | 20 (100.0%) | 167.0 |
| 35 to 50 years | 0 (0.0%) | 0.0 |
| Total | 20 (100.0%) | 34.0 |
Fertility by Age by Marriage Status in Lake Heritage
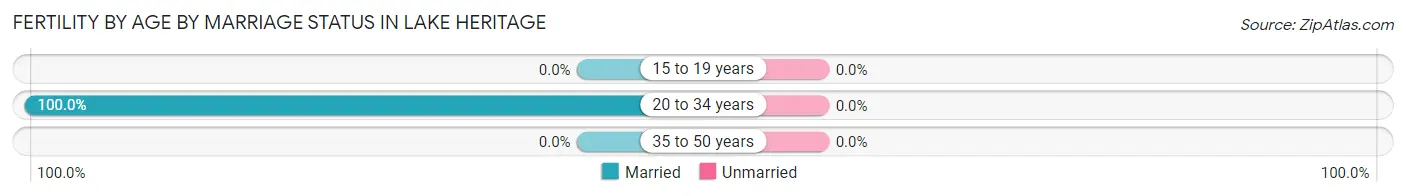
| Age Bracket | Married | Unmarried |
| 15 to 19 years | 0 (0.0%) | 0 (0.0%) |
| 20 to 34 years | 20 (100.0%) | 0 (0.0%) |
| 35 to 50 years | 0 (0.0%) | 0 (0.0%) |
| Total | 20 (100.0%) | 0 (0.0%) |
Fertility by Education in Lake Heritage
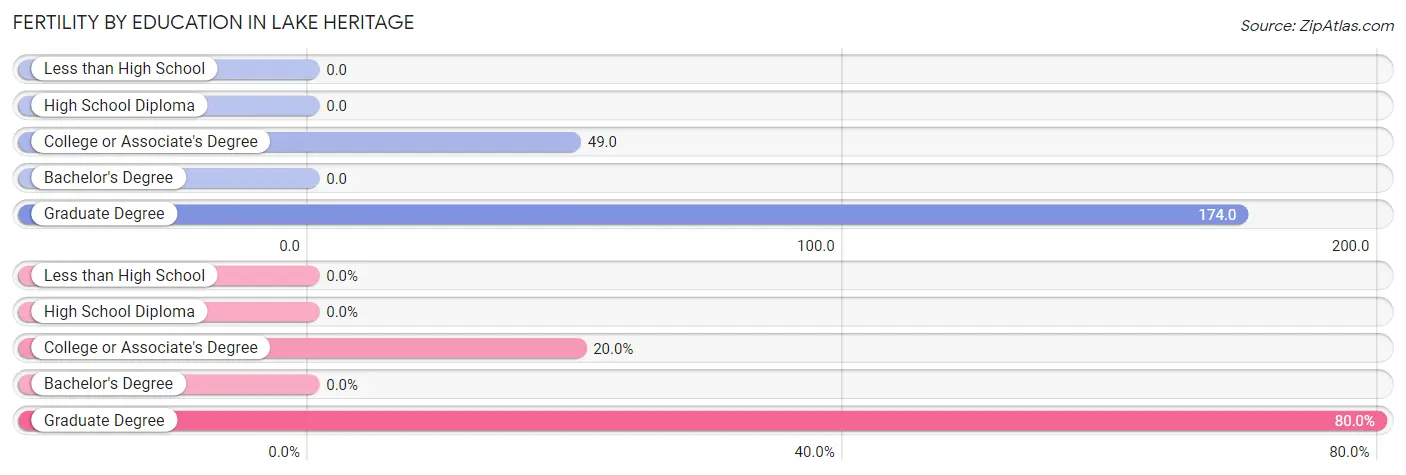
| Educational Attainment | Women with Births | Births / 1,000 Women |
| Less than High School | 0 (0.0%) | 0.0 |
| High School Diploma | 0 (0.0%) | 0.0 |
| College or Associate's Degree | 4 (20.0%) | 49.0 |
| Bachelor's Degree | 0 (0.0%) | 0.0 |
| Graduate Degree | 16 (80.0%) | 174.0 |
| Total | 20 (100.0%) | 34.0 |
Fertility by Education by Marriage Status in Lake Heritage
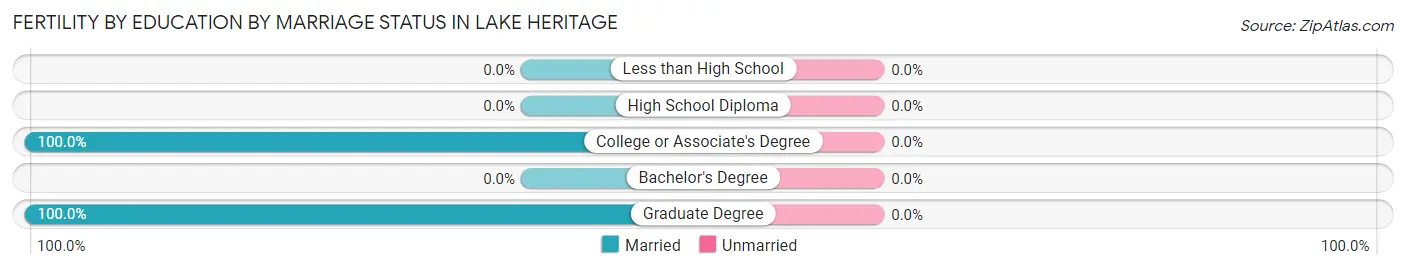
| Educational Attainment | Married | Unmarried |
| Less than High School | 0 (0.0%) | 0 (0.0%) |
| High School Diploma | 0 (0.0%) | 0 (0.0%) |
| College or Associate's Degree | 4 (100.0%) | 0 (0.0%) |
| Bachelor's Degree | 0 (0.0%) | 0 (0.0%) |
| Graduate Degree | 16 (100.0%) | 0 (0.0%) |
| Total | 20 (100.0%) | 0 (0.0%) |
Income in Lake Heritage
Income Overview in Lake Heritage
Per Capita Income in Lake Heritage is $47,366, while median incomes of families and households are $132,159 and $116,211 respectively.
| Characteristic | Number | Measure |
| Per Capita Income | 2,731 | $47,366 |
| Median Family Income | 799 | $132,159 |
| Mean Family Income | 799 | $138,509 |
| Median Household Income | 1,039 | $116,211 |
| Mean Household Income | 1,039 | $122,502 |
| Income Deficit | 799 | $0 |
| Wage / Income Gap (%) | 2,731 | 51.48% |
| Wage / Income Gap ($) | 2,731 | 48.52¢ per $1 |
| Gini / Inequality Index | 2,731 | 0.33 |
Earnings by Sex in Lake Heritage
Average Earnings in Lake Heritage are $46,299, $58,660 for men and $28,462 for women, a difference of 51.5%.
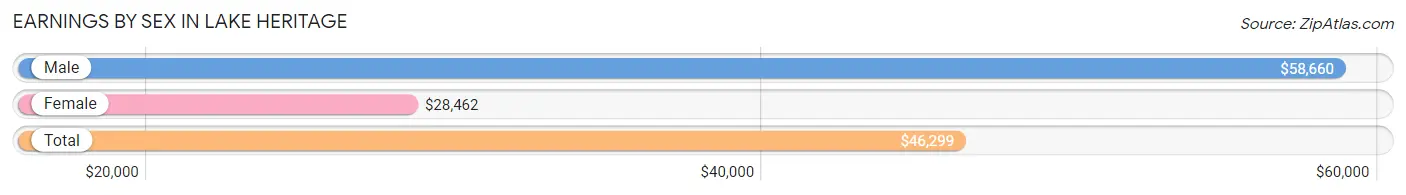
| Sex | Number | Average Earnings |
| Male | 757 (46.5%) | $58,660 |
| Female | 872 (53.5%) | $28,462 |
| Total | 1,629 (100.0%) | $46,299 |
Earnings by Sex by Income Bracket in Lake Heritage
The most common earnings brackets in Lake Heritage are $100,000+ for men (199 | 26.3%) and $22,500 to $24,999 for women (126 | 14.4%).
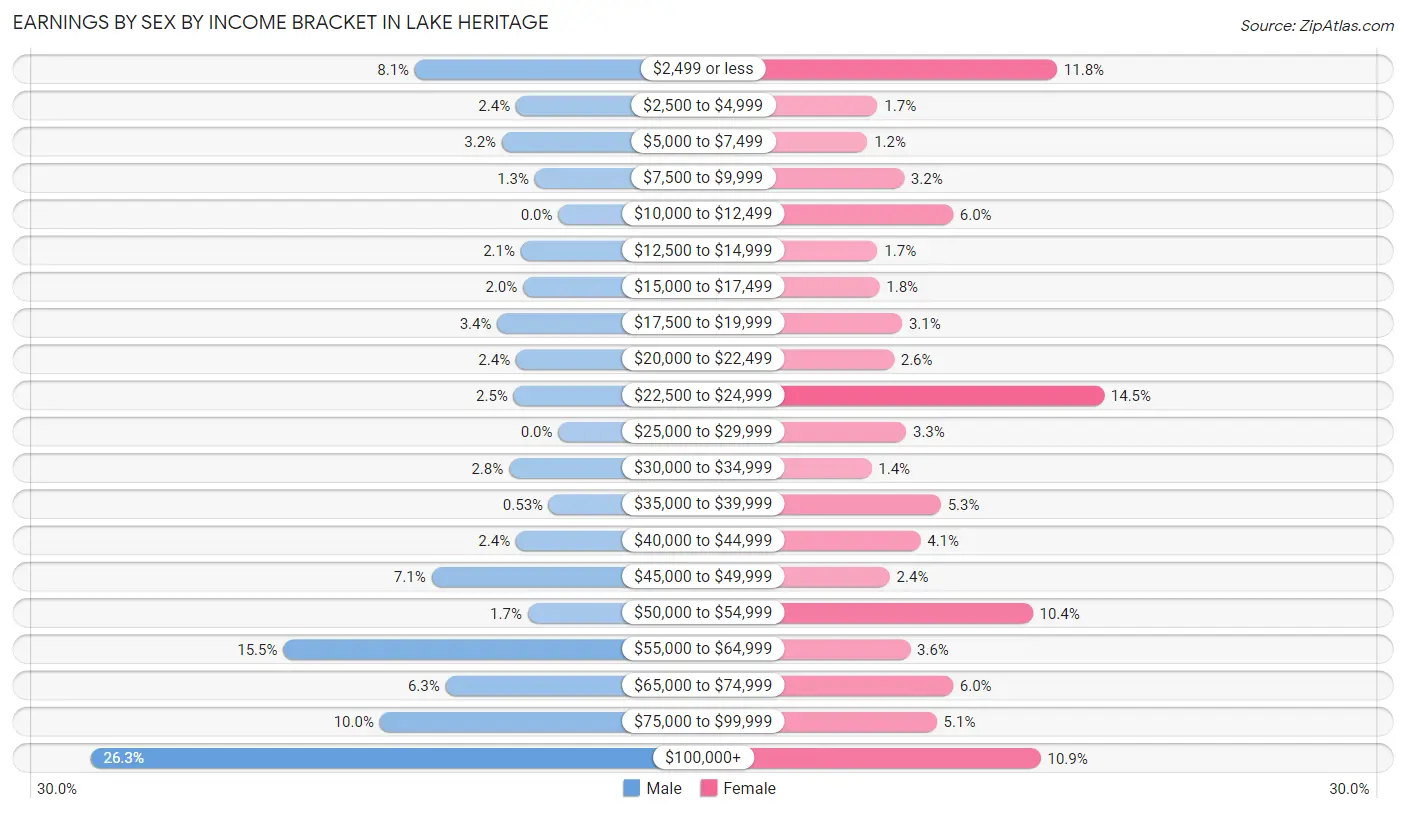
| Income | Male | Female |
| $2,499 or less | 61 (8.1%) | 103 (11.8%) |
| $2,500 to $4,999 | 18 (2.4%) | 15 (1.7%) |
| $5,000 to $7,499 | 24 (3.2%) | 10 (1.1%) |
| $7,500 to $9,999 | 10 (1.3%) | 28 (3.2%) |
| $10,000 to $12,499 | 0 (0.0%) | 52 (6.0%) |
| $12,500 to $14,999 | 16 (2.1%) | 15 (1.7%) |
| $15,000 to $17,499 | 15 (2.0%) | 16 (1.8%) |
| $17,500 to $19,999 | 26 (3.4%) | 27 (3.1%) |
| $20,000 to $22,499 | 18 (2.4%) | 23 (2.6%) |
| $22,500 to $24,999 | 19 (2.5%) | 126 (14.4%) |
| $25,000 to $29,999 | 0 (0.0%) | 29 (3.3%) |
| $30,000 to $34,999 | 21 (2.8%) | 12 (1.4%) |
| $35,000 to $39,999 | 4 (0.5%) | 46 (5.3%) |
| $40,000 to $44,999 | 18 (2.4%) | 36 (4.1%) |
| $45,000 to $49,999 | 54 (7.1%) | 21 (2.4%) |
| $50,000 to $54,999 | 13 (1.7%) | 91 (10.4%) |
| $55,000 to $64,999 | 117 (15.5%) | 31 (3.6%) |
| $65,000 to $74,999 | 48 (6.3%) | 52 (6.0%) |
| $75,000 to $99,999 | 76 (10.0%) | 44 (5.1%) |
| $100,000+ | 199 (26.3%) | 95 (10.9%) |
| Total | 757 (100.0%) | 872 (100.0%) |
Earnings by Sex by Educational Attainment in Lake Heritage
Average earnings in Lake Heritage are $59,563 for men and $41,076 for women, a difference of 31.0%. Men with an educational attainment of graduate degree enjoy the highest average annual earnings of $101,875, while those with high school diploma education earn the least with $45,875. Women with an educational attainment of bachelor's degree earn the most with the average annual earnings of $50,353, while those with college or associate's degree education have the smallest earnings of $35,500.
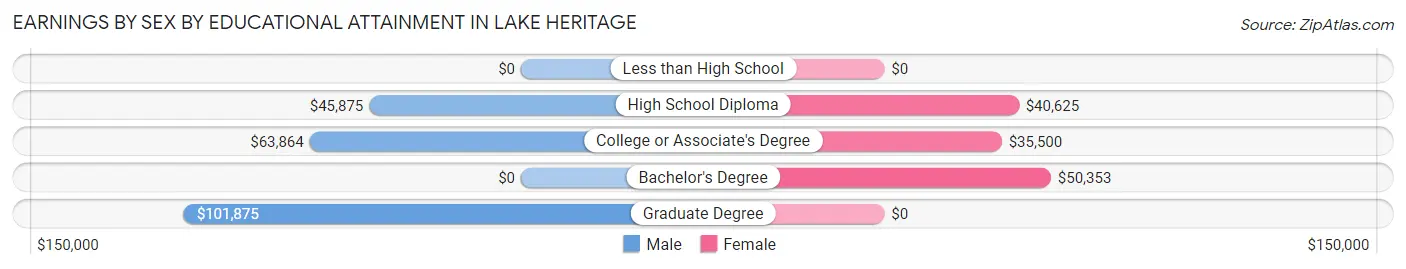
| Educational Attainment | Male Income | Female Income |
| Less than High School | - | - |
| High School Diploma | $45,875 | $40,625 |
| College or Associate's Degree | $63,864 | $35,500 |
| Bachelor's Degree | - | - |
| Graduate Degree | $101,875 | $0 |
| Total | $59,563 | $41,076 |
Family Income in Lake Heritage
Family Income Brackets in Lake Heritage
According to the Lake Heritage family income data, there are 230 families falling into the $150,000 to $199,999 income range, which is the most common income bracket and makes up 28.8% of all families.
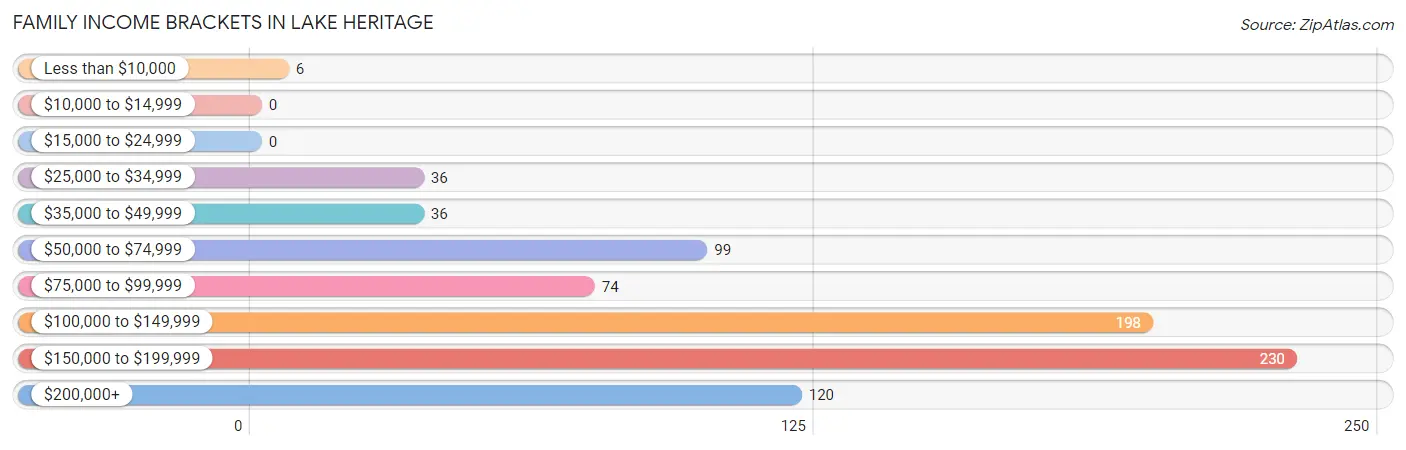
| Income Bracket | # Families | % Families |
| Less than $10,000 | 6 | 0.8% |
| $10,000 to $14,999 | 0 | 0.0% |
| $15,000 to $24,999 | 0 | 0.0% |
| $25,000 to $34,999 | 36 | 4.5% |
| $35,000 to $49,999 | 36 | 4.5% |
| $50,000 to $74,999 | 99 | 12.4% |
| $75,000 to $99,999 | 74 | 9.3% |
| $100,000 to $149,999 | 198 | 24.8% |
| $150,000 to $199,999 | 230 | 28.8% |
| $200,000+ | 120 | 15.0% |
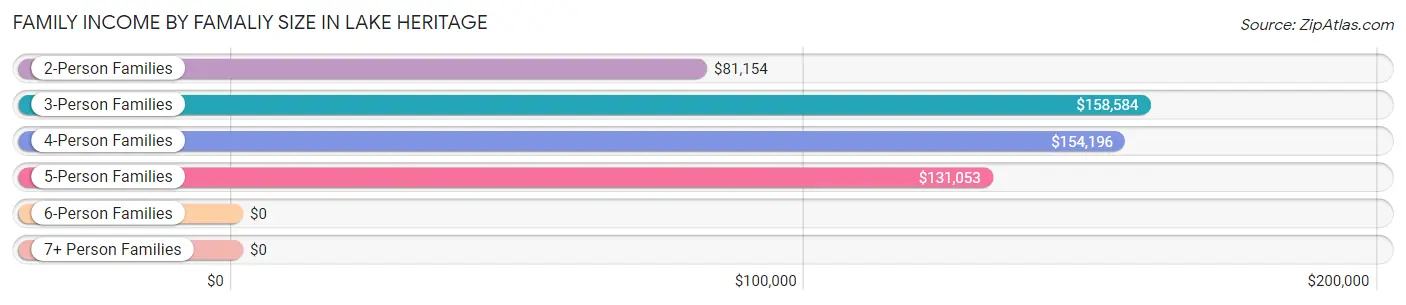
Family Income by Famaliy Size in Lake Heritage
3-person families (232 | 29.0%) account for the highest median family income in Lake Heritage with $158,584 per family, while 3-person families (232 | 29.0%) have the highest median income of $52,861 per family member.
| Income Bracket | # Families | Median Income |
| 2-Person Families | 386 (48.3%) | $81,154 |
| 3-Person Families | 232 (29.0%) | $158,584 |
| 4-Person Families | 97 (12.1%) | $154,196 |
| 5-Person Families | 60 (7.5%) | $131,053 |
| 6-Person Families | 20 (2.5%) | $0 |
| 7+ Person Families | 4 (0.5%) | $0 |
| Total | 799 (100.0%) | $132,159 |
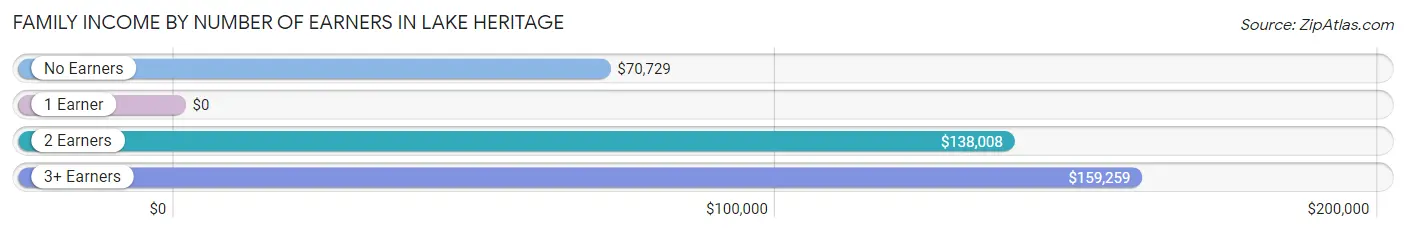
Family Income by Number of Earners in Lake Heritage
| Number of Earners | # Families | Median Income |
| No Earners | 181 (22.7%) | $70,729 |
| 1 Earner | 148 (18.5%) | $0 |
| 2 Earners | 213 (26.7%) | $138,008 |
| 3+ Earners | 257 (32.2%) | $159,259 |
| Total | 799 (100.0%) | $132,159 |
Household Income in Lake Heritage
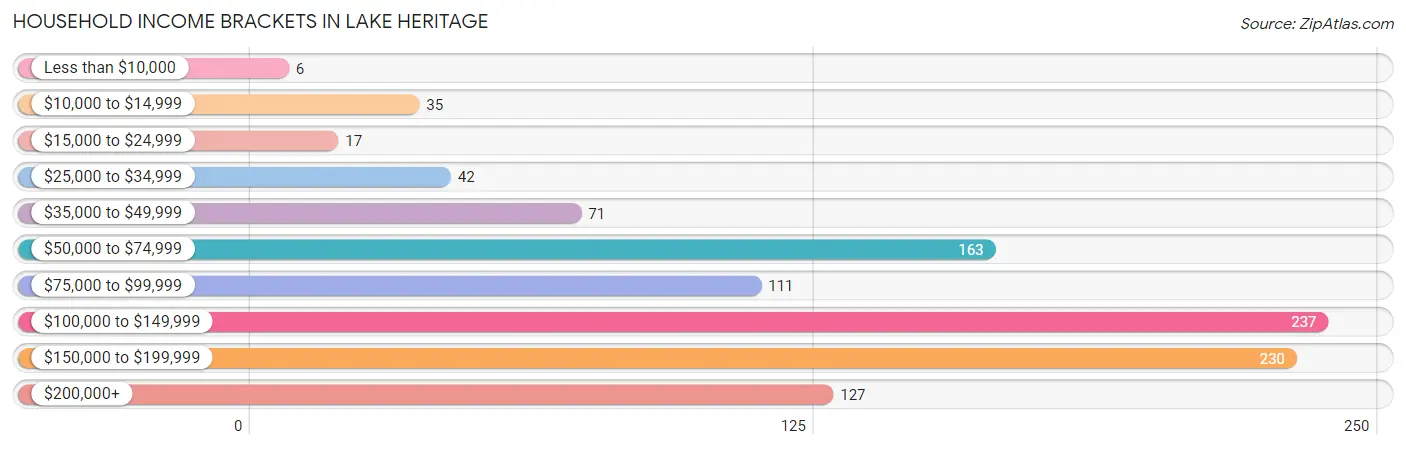
Household Income Brackets in Lake Heritage
With 237 households falling in the category, the $100,000 to $149,999 income range is the most frequent in Lake Heritage, accounting for 22.8% of all households. In contrast, only 6 households (0.6%) fall into the less than $10,000 income bracket, making it the least populous group.
| Income Bracket | # Households | % Households |
| Less than $10,000 | 6 | 0.6% |
| $10,000 to $14,999 | 35 | 3.4% |
| $15,000 to $24,999 | 17 | 1.6% |
| $25,000 to $34,999 | 42 | 4.0% |
| $35,000 to $49,999 | 71 | 6.8% |
| $50,000 to $74,999 | 163 | 15.7% |
| $75,000 to $99,999 | 111 | 10.7% |
| $100,000 to $149,999 | 237 | 22.8% |
| $150,000 to $199,999 | 230 | 22.1% |
| $200,000+ | 127 | 12.2% |
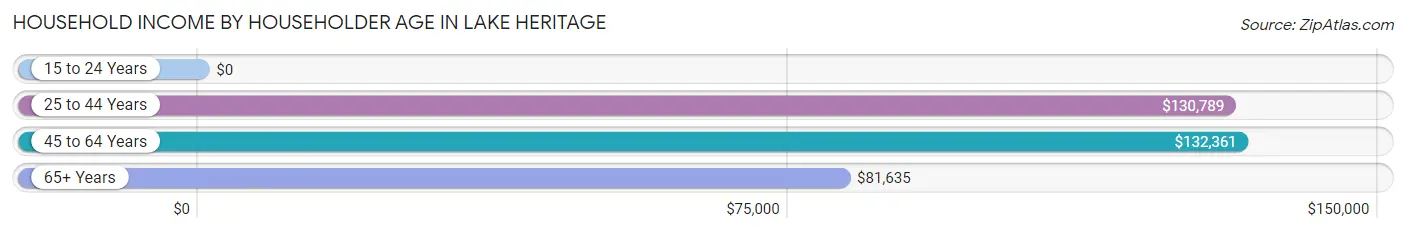
Household Income by Householder Age in Lake Heritage
The median household income in Lake Heritage is $116,211, with the highest median household income of $132,361 found in the 45 to 64 years age bracket for the primary householder. A total of 466 households (44.9%) fall into this category. Meanwhile, the 15 to 24 years age bracket for the primary householder has the lowest median household income of $0, with 44 households (4.2%) in this group.
| Income Bracket | # Households | Median Income |
| 15 to 24 Years | 44 (4.2%) | $0 |
| 25 to 44 Years | 172 (16.6%) | $130,789 |
| 45 to 64 Years | 466 (44.9%) | $132,361 |
| 65+ Years | 357 (34.4%) | $81,635 |
| Total | 1,039 (100.0%) | $116,211 |
Poverty in Lake Heritage
Income Below Poverty by Sex and Age in Lake Heritage
With 2.3% poverty level for males and 2.5% for females among the residents of Lake Heritage, 18 to 24 year old males and 12 to 14 year old females are the most vulnerable to poverty, with 16 males (22.9%) and 6 females (14.3%) in their respective age groups living below the poverty level.
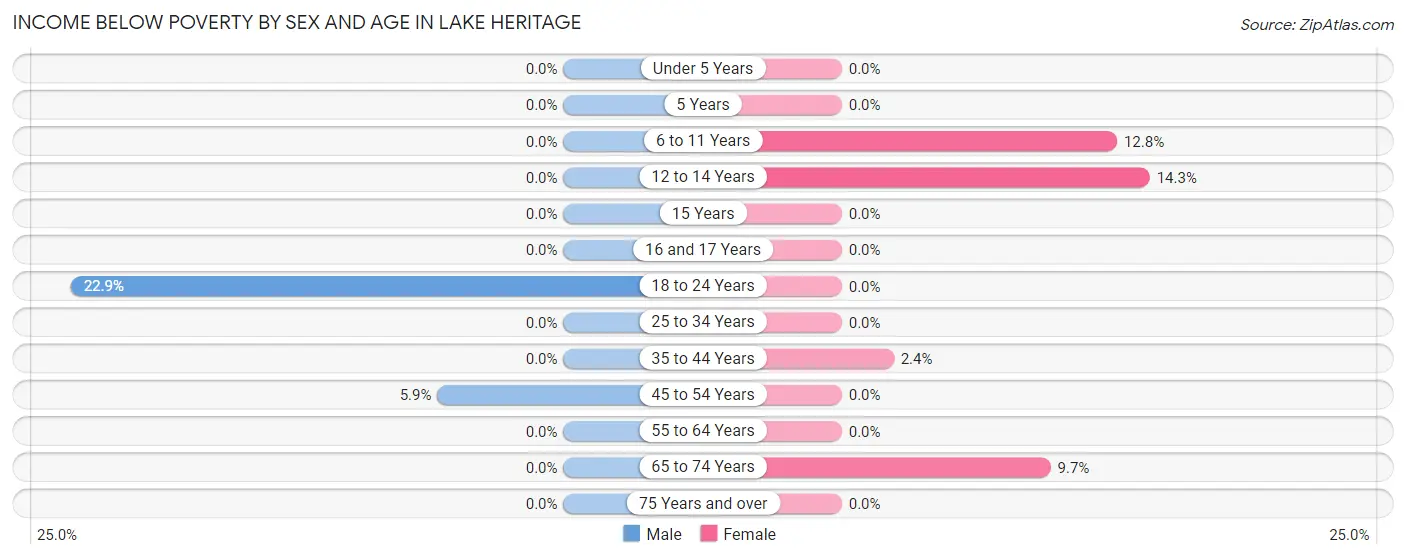
| Age Bracket | Male | Female |
| Under 5 Years | 0 (0.0%) | 0 (0.0%) |
| 5 Years | 0 (0.0%) | 0 (0.0%) |
| 6 to 11 Years | 0 (0.0%) | 6 (12.8%) |
| 12 to 14 Years | 0 (0.0%) | 6 (14.3%) |
| 15 Years | 0 (0.0%) | 0 (0.0%) |
| 16 and 17 Years | 0 (0.0%) | 0 (0.0%) |
| 18 to 24 Years | 16 (22.9%) | 0 (0.0%) |
| 25 to 34 Years | 0 (0.0%) | 0 (0.0%) |
| 35 to 44 Years | 0 (0.0%) | 6 (2.4%) |
| 45 to 54 Years | 12 (5.9%) | 0 (0.0%) |
| 55 to 64 Years | 0 (0.0%) | 0 (0.0%) |
| 65 to 74 Years | 0 (0.0%) | 19 (9.7%) |
| 75 Years and over | 0 (0.0%) | 0 (0.0%) |
| Total | 28 (2.3%) | 37 (2.5%) |
Income Above Poverty by Sex and Age in Lake Heritage
According to the poverty statistics in Lake Heritage, males aged under 5 years and females aged under 5 years are the age groups that are most secure financially, with 100.0% of males and 100.0% of females in these age groups living above the poverty line.
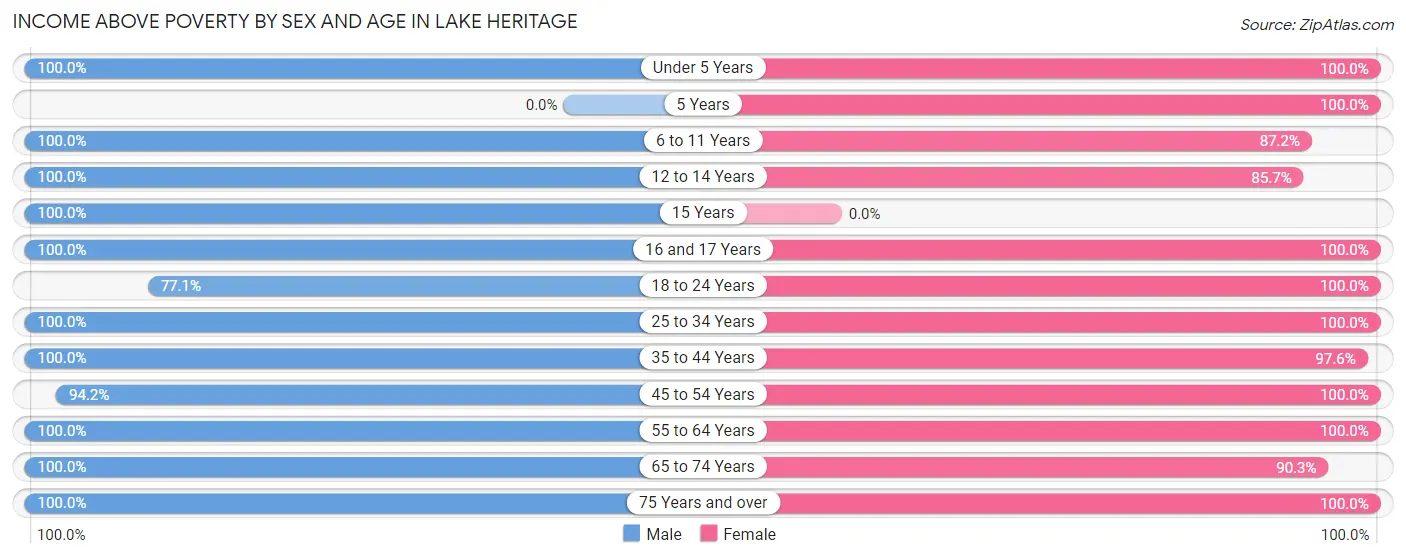
| Age Bracket | Male | Female |
| Under 5 Years | 48 (100.0%) | 97 (100.0%) |
| 5 Years | 0 (0.0%) | 31 (100.0%) |
| 6 to 11 Years | 48 (100.0%) | 41 (87.2%) |
| 12 to 14 Years | 41 (100.0%) | 36 (85.7%) |
| 15 Years | 22 (100.0%) | 0 (0.0%) |
| 16 and 17 Years | 46 (100.0%) | 42 (100.0%) |
| 18 to 24 Years | 54 (77.1%) | 125 (100.0%) |
| 25 to 34 Years | 57 (100.0%) | 59 (100.0%) |
| 35 to 44 Years | 111 (100.0%) | 243 (97.6%) |
| 45 to 54 Years | 193 (94.2%) | 227 (100.0%) |
| 55 to 64 Years | 151 (100.0%) | 295 (100.0%) |
| 65 to 74 Years | 368 (100.0%) | 177 (90.3%) |
| 75 Years and over | 58 (100.0%) | 96 (100.0%) |
| Total | 1,197 (97.7%) | 1,469 (97.5%) |
Income Below Poverty Among Married-Couple Families in Lake Heritage
The poverty statistics for married-couple families in Lake Heritage show that 0.8% or 6 of the total 745 families live below the poverty line. Families with 1 or 2 children have the highest poverty rate of 2.5%, comprising of 6 families. On the other hand, families with no children have the lowest poverty rate of 0.0%, which includes 0 families.
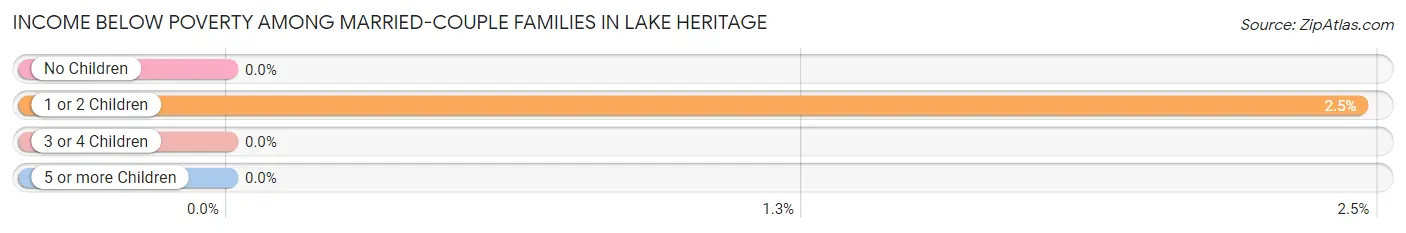
| Children | Above Poverty | Below Poverty |
| No Children | 483 (100.0%) | 0 (0.0%) |
| 1 or 2 Children | 238 (97.5%) | 6 (2.5%) |
| 3 or 4 Children | 18 (100.0%) | 0 (0.0%) |
| 5 or more Children | 0 (0.0%) | 0 (0.0%) |
| Total | 739 (99.2%) | 6 (0.8%) |
Income Below Poverty Among Single-Parent Households in Lake Heritage
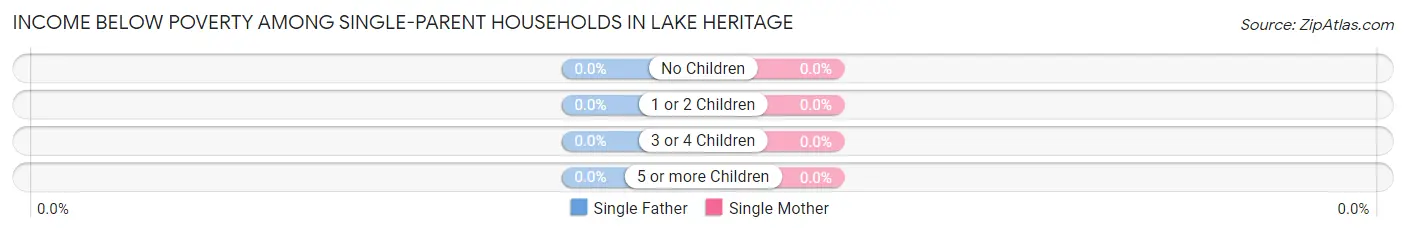
| Children | Single Father | Single Mother |
| No Children | 0 (0.0%) | 0 (0.0%) |
| 1 or 2 Children | 0 (0.0%) | 0 (0.0%) |
| 3 or 4 Children | 0 (0.0%) | 0 (0.0%) |
| 5 or more Children | 0 (0.0%) | 0 (0.0%) |
| Total | 0 (0.0%) | 0 (0.0%) |
Income Below Poverty Among Married-Couple vs Single-Parent Households in Lake Heritage
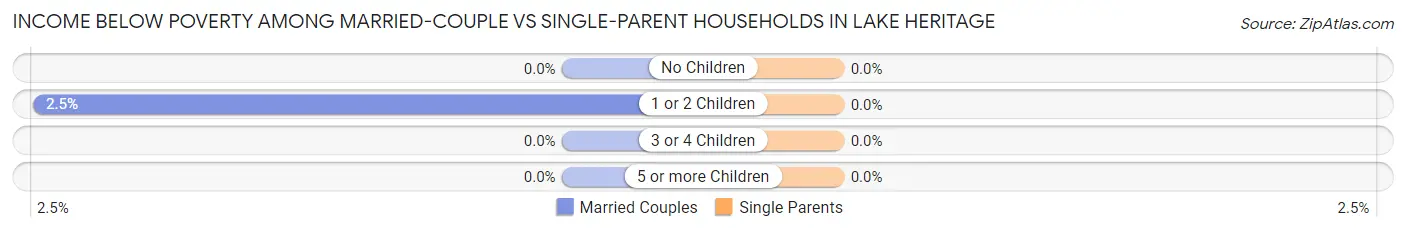
| Children | Married-Couple Families | Single-Parent Households |
| No Children | 0 (0.0%) | 0 (0.0%) |
| 1 or 2 Children | 6 (2.5%) | 0 (0.0%) |
| 3 or 4 Children | 0 (0.0%) | 0 (0.0%) |
| 5 or more Children | 0 (0.0%) | 0 (0.0%) |
| Total | 6 (0.8%) | 0 (0.0%) |
Employment Characteristics in Lake Heritage
Employment by Class of Employer in Lake Heritage
Among the 1,266 employed individuals in Lake Heritage, private company employees (692 | 54.7%), self-employed (incorporated) (158 | 12.5%), and local government employees (127 | 10.0%) make up the most common classes of employment.
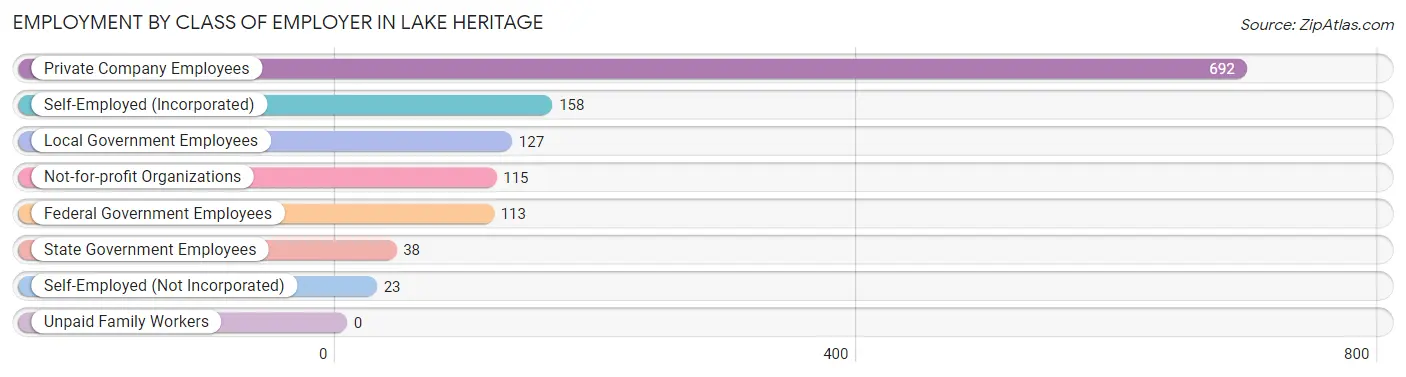
| Employer Class | # Employees | % Employees |
| Private Company Employees | 692 | 54.7% |
| Self-Employed (Incorporated) | 158 | 12.5% |
| Self-Employed (Not Incorporated) | 23 | 1.8% |
| Not-for-profit Organizations | 115 | 9.1% |
| Local Government Employees | 127 | 10.0% |
| State Government Employees | 38 | 3.0% |
| Federal Government Employees | 113 | 8.9% |
| Unpaid Family Workers | 0 | 0.0% |
| Total | 1,266 | 100.0% |
Employment Status by Age in Lake Heritage
According to the labor force statistics for Lake Heritage, out of the total population over 16 years of age (2,355), 59.3% or 1,397 individuals are in the labor force, with 2.6% or 36 of them unemployed. The age group with the highest labor force participation rate is 30 to 34 years, with 100.0% or 43 individuals in the labor force. Within the labor force, the 20 to 24 years age range has the highest percentage of unemployed individuals, with 16.7% or 21 of them being unemployed.
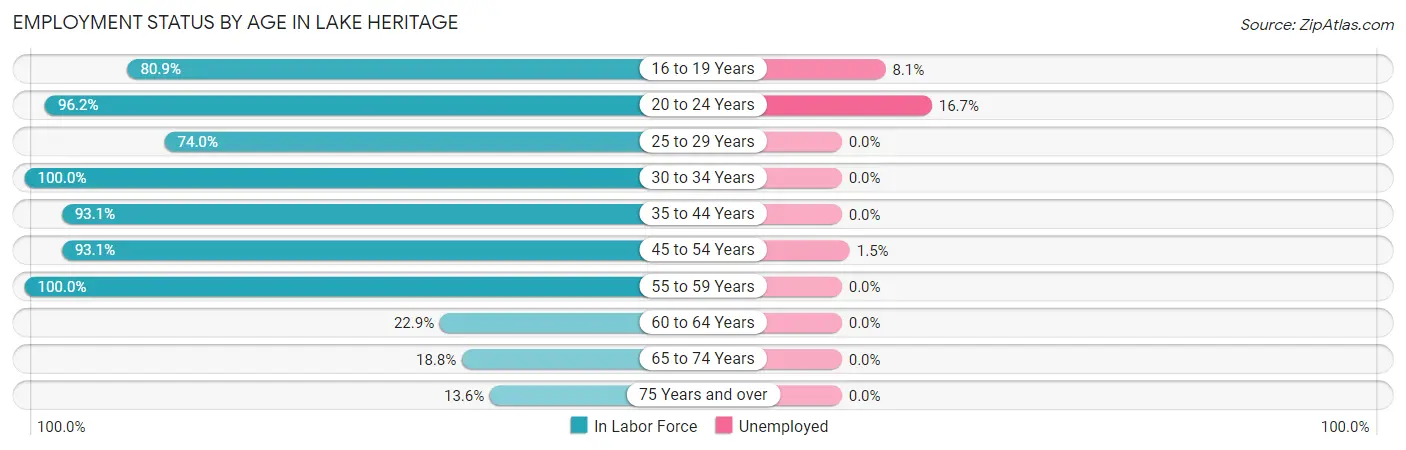
| Age Bracket | In Labor Force | Unemployed |
| 16 to 19 Years | 123 (80.9%) | 10 (8.1%) |
| 20 to 24 Years | 126 (96.2%) | 21 (16.7%) |
| 25 to 29 Years | 54 (74.0%) | 0 (0.0%) |
| 30 to 34 Years | 43 (100.0%) | 0 (0.0%) |
| 35 to 44 Years | 335 (93.1%) | 0 (0.0%) |
| 45 to 54 Years | 402 (93.1%) | 6 (1.5%) |
| 55 to 59 Years | 110 (100.0%) | 0 (0.0%) |
| 60 to 64 Years | 77 (22.9%) | 0 (0.0%) |
| 65 to 74 Years | 106 (18.8%) | 0 (0.0%) |
| 75 Years and over | 21 (13.6%) | 0 (0.0%) |
| Total | 1,397 (59.3%) | 36 (2.6%) |
Employment Status by Educational Attainment in Lake Heritage
According to labor force statistics for Lake Heritage, 75.4% of individuals (1,021) out of the total population between 25 and 64 years of age (1,354) are in the labor force, with 0.6% or 6 of them being unemployed. The group with the highest labor force participation rate are those with the educational attainment of high school diploma, with 87.2% or 251 individuals in the labor force. Within the labor force, individuals with high school diploma education have the highest percentage of unemployment, with 2.4% or 6 of them being unemployed.
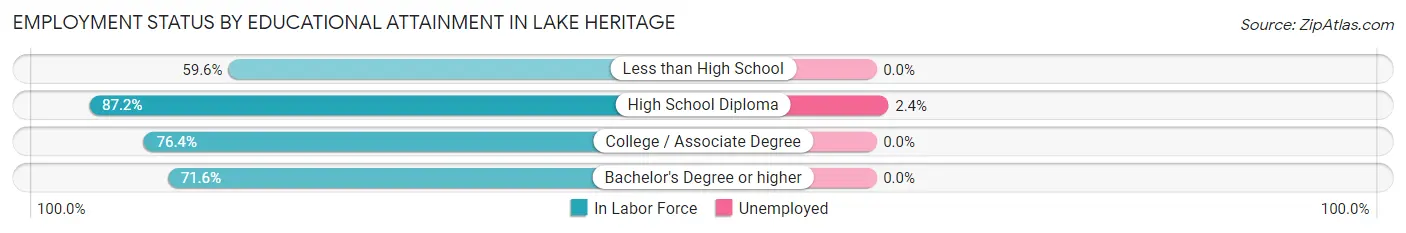
| Educational Attainment | In Labor Force | Unemployed |
| Less than High School | 28 (59.6%) | 0 (0.0%) |
| High School Diploma | 251 (87.2%) | 7 (2.4%) |
| College / Associate Degree | 201 (76.4%) | 0 (0.0%) |
| Bachelor's Degree or higher | 541 (71.6%) | 0 (0.0%) |
| Total | 1,021 (75.4%) | 8 (0.6%) |
Employment Occupations by Sex in Lake Heritage
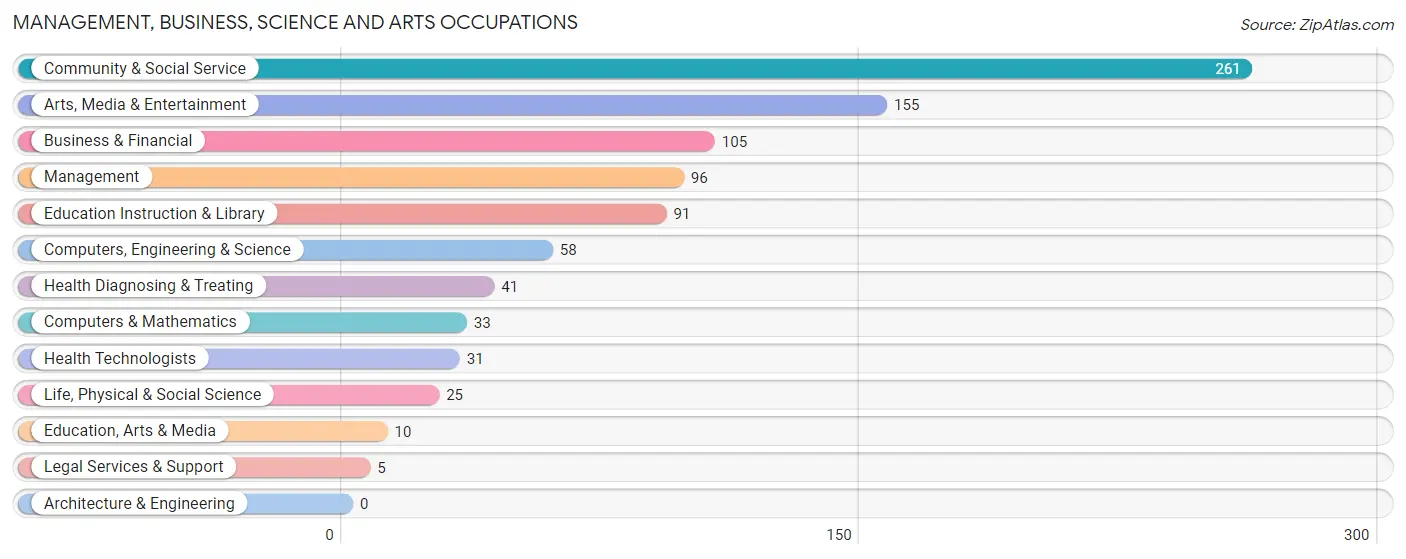
Management, Business, Science and Arts Occupations
The most common Management, Business, Science and Arts occupations in Lake Heritage are Community & Social Service (261 | 19.2%), Arts, Media & Entertainment (155 | 11.4%), Business & Financial (105 | 7.7%), Management (96 | 7.1%), and Education Instruction & Library (91 | 6.7%).
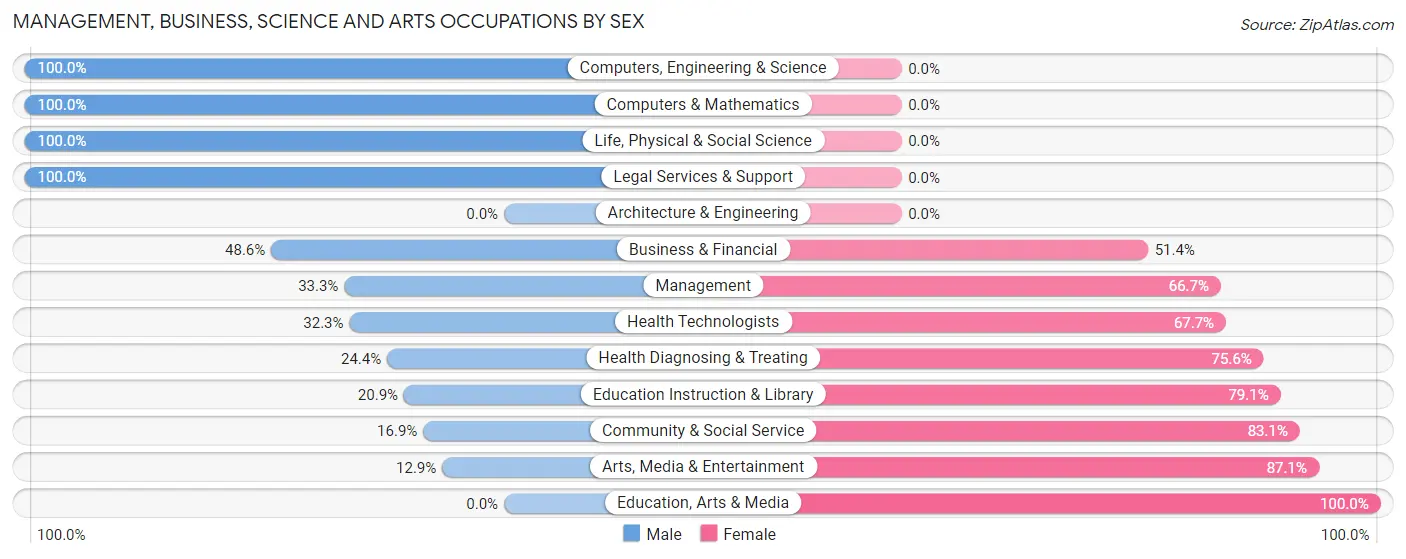
Management, Business, Science and Arts Occupations by Sex
Within the Management, Business, Science and Arts occupations in Lake Heritage, the most male-oriented occupations are Computers, Engineering & Science (100.0%), Computers & Mathematics (100.0%), and Life, Physical & Social Science (100.0%), while the most female-oriented occupations are Education, Arts & Media (100.0%), Arts, Media & Entertainment (87.1%), and Community & Social Service (83.1%).
| Occupation | Male | Female |
| Management | 32 (33.3%) | 64 (66.7%) |
| Business & Financial | 51 (48.6%) | 54 (51.4%) |
| Computers, Engineering & Science | 58 (100.0%) | 0 (0.0%) |
| Computers & Mathematics | 33 (100.0%) | 0 (0.0%) |
| Architecture & Engineering | 0 (0.0%) | 0 (0.0%) |
| Life, Physical & Social Science | 25 (100.0%) | 0 (0.0%) |
| Community & Social Service | 44 (16.9%) | 217 (83.1%) |
| Education, Arts & Media | 0 (0.0%) | 10 (100.0%) |
| Legal Services & Support | 5 (100.0%) | 0 (0.0%) |
| Education Instruction & Library | 19 (20.9%) | 72 (79.1%) |
| Arts, Media & Entertainment | 20 (12.9%) | 135 (87.1%) |
| Health Diagnosing & Treating | 10 (24.4%) | 31 (75.6%) |
| Health Technologists | 10 (32.3%) | 21 (67.7%) |
| Total (Category) | 195 (34.8%) | 366 (65.2%) |
| Total (Overall) | 669 (49.2%) | 691 (50.8%) |
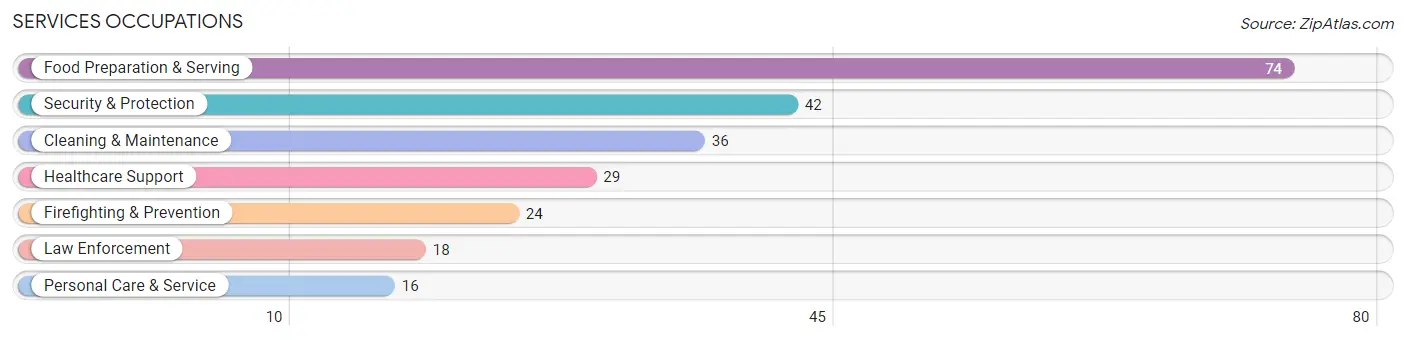
Services Occupations
The most common Services occupations in Lake Heritage are Food Preparation & Serving (74 | 5.4%), Security & Protection (42 | 3.1%), Cleaning & Maintenance (36 | 2.6%), Healthcare Support (29 | 2.1%), and Firefighting & Prevention (24 | 1.8%).
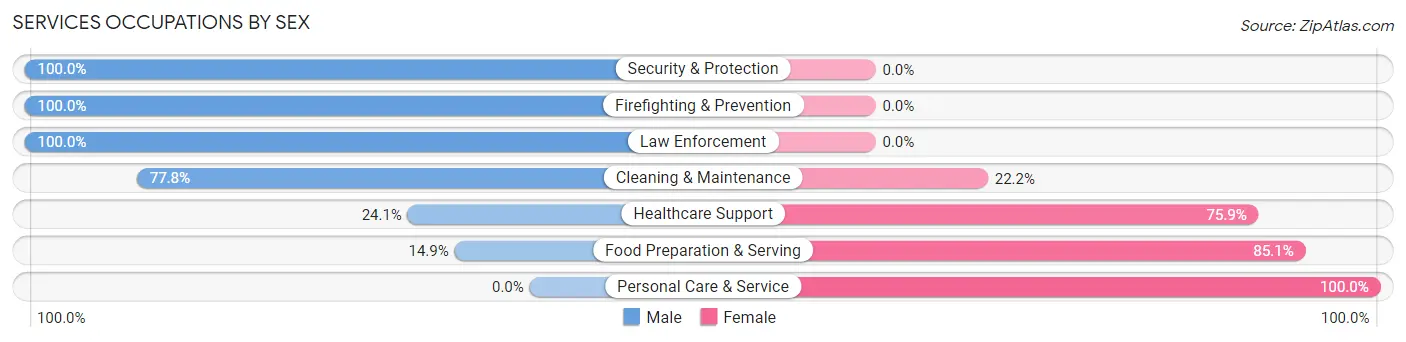
Services Occupations by Sex
Within the Services occupations in Lake Heritage, the most male-oriented occupations are Security & Protection (100.0%), Firefighting & Prevention (100.0%), and Law Enforcement (100.0%), while the most female-oriented occupations are Personal Care & Service (100.0%), Food Preparation & Serving (85.1%), and Healthcare Support (75.9%).
| Occupation | Male | Female |
| Healthcare Support | 7 (24.1%) | 22 (75.9%) |
| Security & Protection | 42 (100.0%) | 0 (0.0%) |
| Firefighting & Prevention | 24 (100.0%) | 0 (0.0%) |
| Law Enforcement | 18 (100.0%) | 0 (0.0%) |
| Food Preparation & Serving | 11 (14.9%) | 63 (85.1%) |
| Cleaning & Maintenance | 28 (77.8%) | 8 (22.2%) |
| Personal Care & Service | 0 (0.0%) | 16 (100.0%) |
| Total (Category) | 88 (44.7%) | 109 (55.3%) |
| Total (Overall) | 669 (49.2%) | 691 (50.8%) |
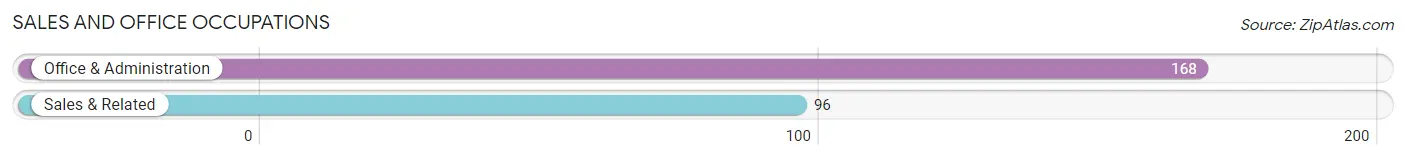
Sales and Office Occupations
The most common Sales and Office occupations in Lake Heritage are Office & Administration (168 | 12.3%), and Sales & Related (96 | 7.1%).
Sales and Office Occupations by Sex
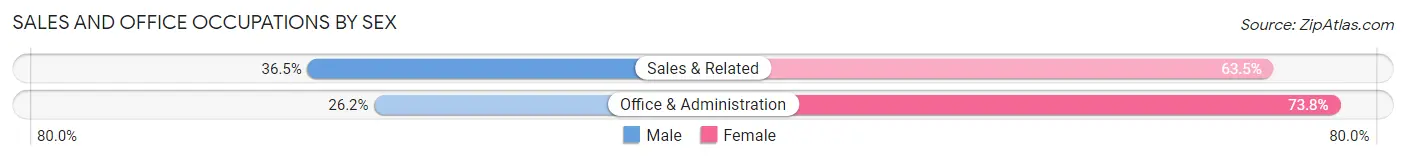
| Occupation | Male | Female |
| Sales & Related | 35 (36.5%) | 61 (63.5%) |
| Office & Administration | 44 (26.2%) | 124 (73.8%) |
| Total (Category) | 79 (29.9%) | 185 (70.1%) |
| Total (Overall) | 669 (49.2%) | 691 (50.8%) |
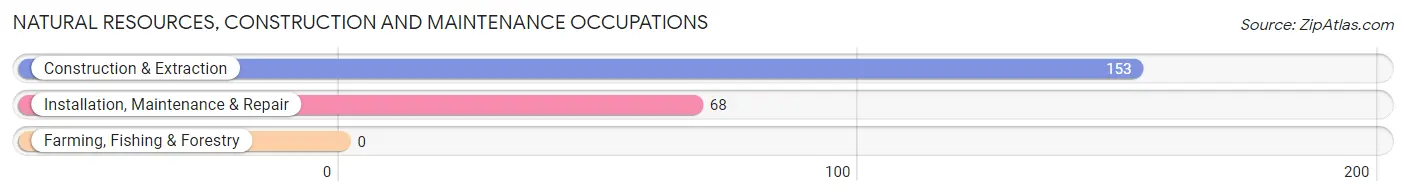
Natural Resources, Construction and Maintenance Occupations
The most common Natural Resources, Construction and Maintenance occupations in Lake Heritage are Construction & Extraction (153 | 11.3%), and Installation, Maintenance & Repair (68 | 5.0%).
Natural Resources, Construction and Maintenance Occupations by Sex
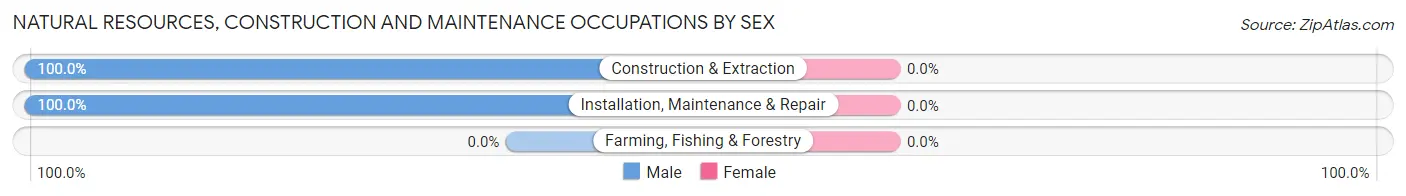
| Occupation | Male | Female |
| Farming, Fishing & Forestry | 0 (0.0%) | 0 (0.0%) |
| Construction & Extraction | 153 (100.0%) | 0 (0.0%) |
| Installation, Maintenance & Repair | 68 (100.0%) | 0 (0.0%) |
| Total (Category) | 221 (100.0%) | 0 (0.0%) |
| Total (Overall) | 669 (49.2%) | 691 (50.8%) |
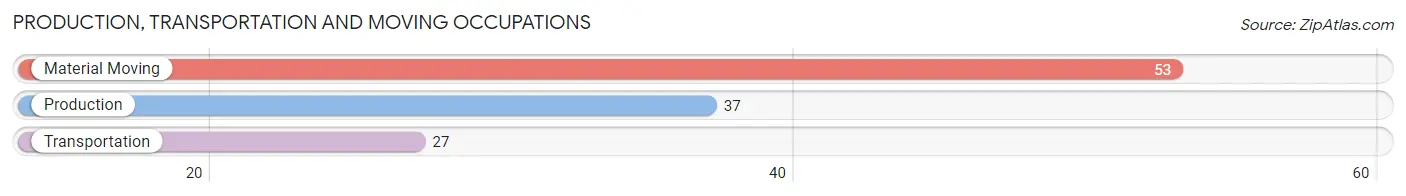
Production, Transportation and Moving Occupations
The most common Production, Transportation and Moving occupations in Lake Heritage are Material Moving (53 | 3.9%), Production (37 | 2.7%), and Transportation (27 | 2.0%).
Production, Transportation and Moving Occupations by Sex
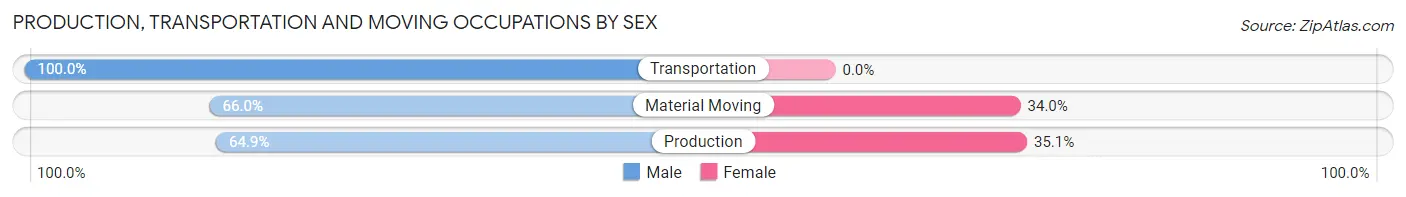
| Occupation | Male | Female |
| Production | 24 (64.9%) | 13 (35.1%) |
| Transportation | 27 (100.0%) | 0 (0.0%) |
| Material Moving | 35 (66.0%) | 18 (34.0%) |
| Total (Category) | 86 (73.5%) | 31 (26.5%) |
| Total (Overall) | 669 (49.2%) | 691 (50.8%) |
Employment Industries by Sex in Lake Heritage
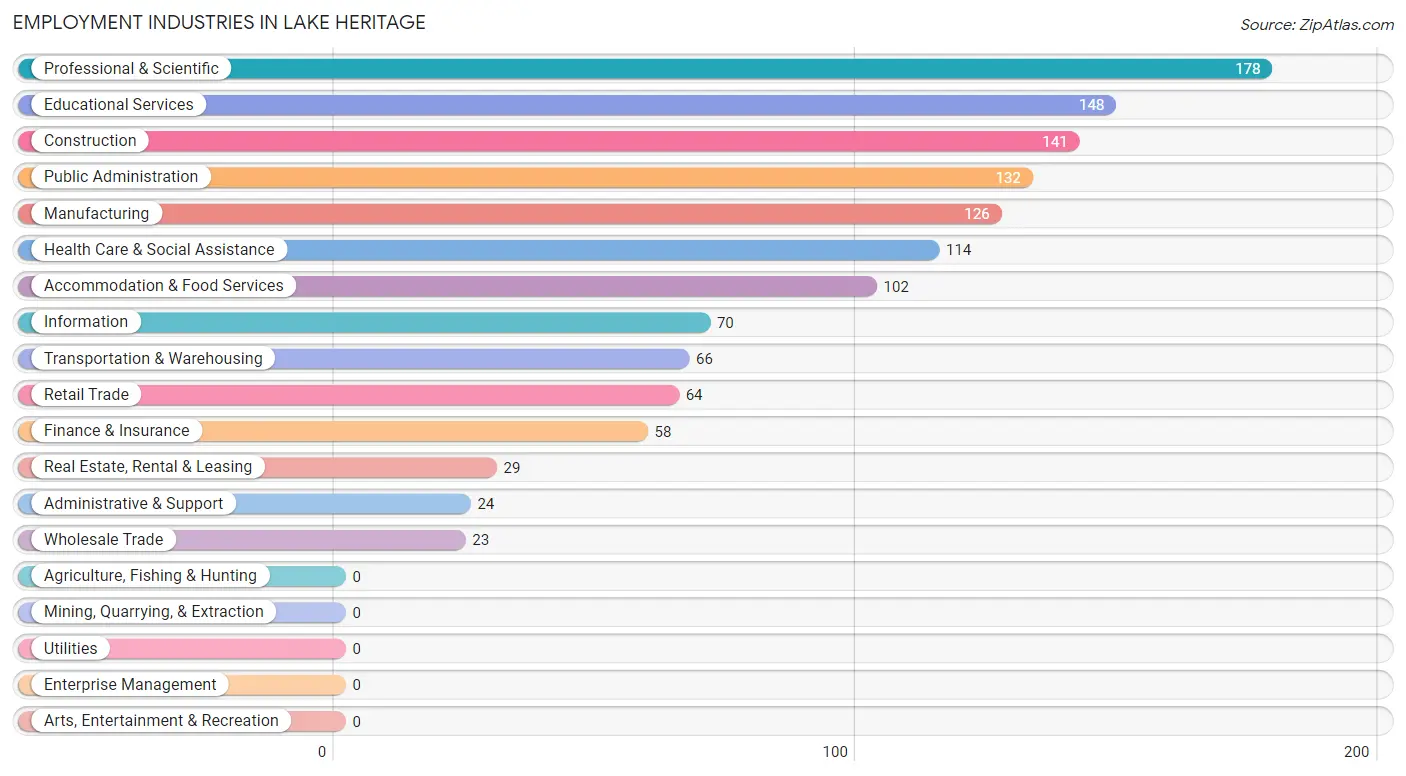
Employment Industries in Lake Heritage
The major employment industries in Lake Heritage include Professional & Scientific (178 | 13.1%), Educational Services (148 | 10.9%), Construction (141 | 10.4%), Public Administration (132 | 9.7%), and Manufacturing (126 | 9.3%).
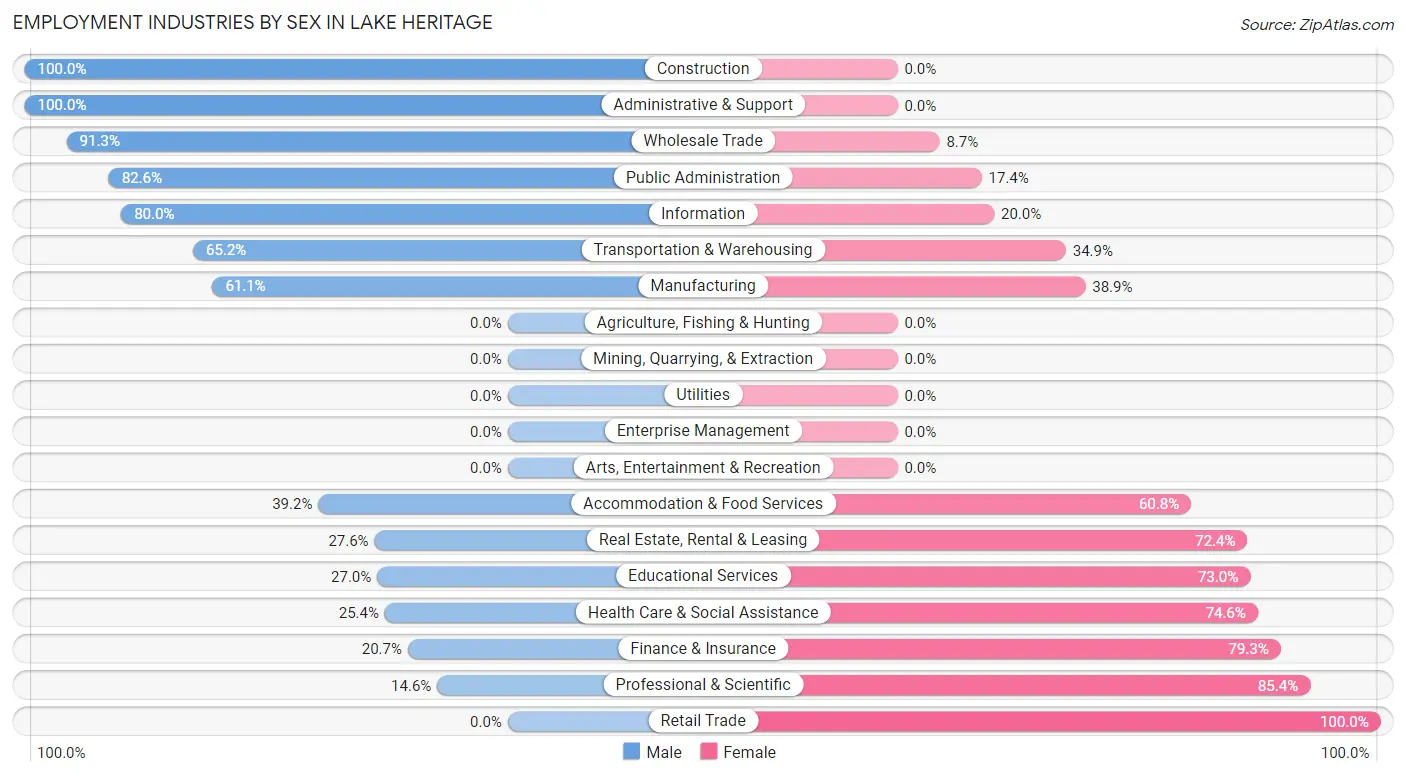
Employment Industries by Sex in Lake Heritage
The Lake Heritage industries that see more men than women are Construction (100.0%), Administrative & Support (100.0%), and Wholesale Trade (91.3%), whereas the industries that tend to have a higher number of women are Retail Trade (100.0%), Professional & Scientific (85.4%), and Finance & Insurance (79.3%).
| Industry | Male | Female |
| Agriculture, Fishing & Hunting | 0 (0.0%) | 0 (0.0%) |
| Mining, Quarrying, & Extraction | 0 (0.0%) | 0 (0.0%) |
| Construction | 141 (100.0%) | 0 (0.0%) |
| Manufacturing | 77 (61.1%) | 49 (38.9%) |
| Wholesale Trade | 21 (91.3%) | 2 (8.7%) |
| Retail Trade | 0 (0.0%) | 64 (100.0%) |
| Transportation & Warehousing | 43 (65.1%) | 23 (34.8%) |
| Utilities | 0 (0.0%) | 0 (0.0%) |
| Information | 56 (80.0%) | 14 (20.0%) |
| Finance & Insurance | 12 (20.7%) | 46 (79.3%) |
| Real Estate, Rental & Leasing | 8 (27.6%) | 21 (72.4%) |
| Professional & Scientific | 26 (14.6%) | 152 (85.4%) |
| Enterprise Management | 0 (0.0%) | 0 (0.0%) |
| Administrative & Support | 24 (100.0%) | 0 (0.0%) |
| Educational Services | 40 (27.0%) | 108 (73.0%) |
| Health Care & Social Assistance | 29 (25.4%) | 85 (74.6%) |
| Arts, Entertainment & Recreation | 0 (0.0%) | 0 (0.0%) |
| Accommodation & Food Services | 40 (39.2%) | 62 (60.8%) |
| Public Administration | 109 (82.6%) | 23 (17.4%) |
| Total | 669 (49.2%) | 691 (50.8%) |
Education in Lake Heritage
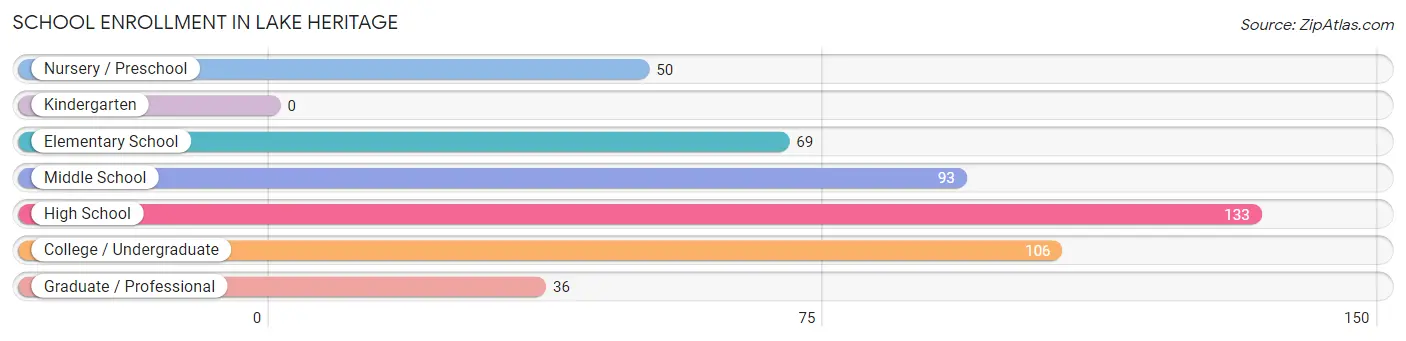
School Enrollment in Lake Heritage
The most common levels of schooling among the 487 students in Lake Heritage are high school (133 | 27.3%), college / undergraduate (106 | 21.8%), and middle school (93 | 19.1%).
| School Level | # Students | % Students |
| Nursery / Preschool | 50 | 10.3% |
| Kindergarten | 0 | 0.0% |
| Elementary School | 69 | 14.2% |
| Middle School | 93 | 19.1% |
| High School | 133 | 27.3% |
| College / Undergraduate | 106 | 21.8% |
| Graduate / Professional | 36 | 7.4% |
| Total | 487 | 100.0% |
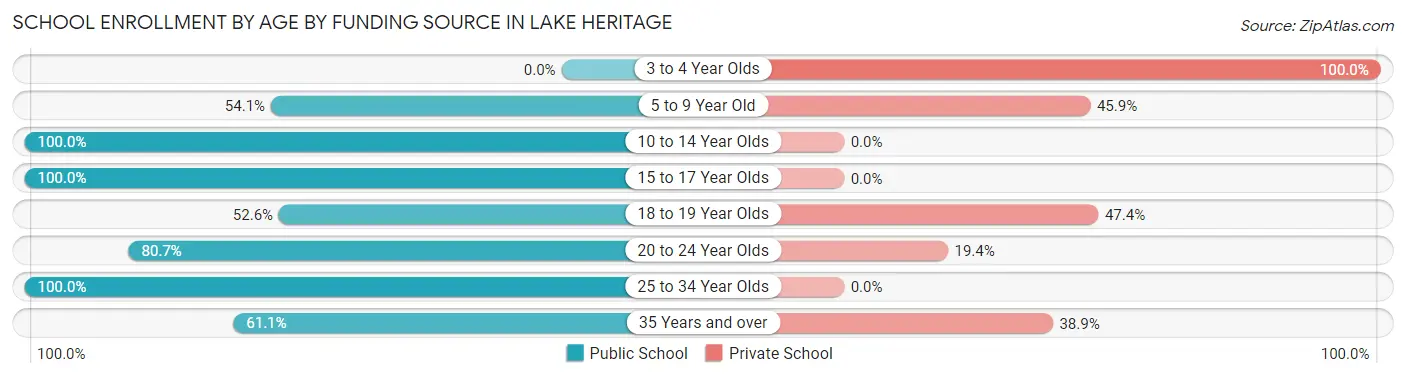
School Enrollment by Age by Funding Source in Lake Heritage
Out of a total of 487 students who are enrolled in schools in Lake Heritage, 102 (20.9%) attend a private institution, while the remaining 385 (79.1%) are enrolled in public schools. The age group of 3 to 4 year olds has the highest likelihood of being enrolled in private schools, with 19 (100.0% in the age bracket) enrolled. Conversely, the age group of 10 to 14 year olds has the lowest likelihood of being enrolled in a private school, with 124 (100.0% in the age bracket) attending a public institution.
| Age Bracket | Public School | Private School |
| 3 to 4 Year Olds | 0 (0.0%) | 19 (100.0%) |
| 5 to 9 Year Old | 46 (54.1%) | 39 (45.9%) |
| 10 to 14 Year Olds | 124 (100.0%) | 0 (0.0%) |
| 15 to 17 Year Olds | 110 (100.0%) | 0 (0.0%) |
| 18 to 19 Year Olds | 20 (52.6%) | 18 (47.4%) |
| 20 to 24 Year Olds | 50 (80.6%) | 12 (19.4%) |
| 25 to 34 Year Olds | 13 (100.0%) | 0 (0.0%) |
| 35 Years and over | 22 (61.1%) | 14 (38.9%) |
| Total | 385 (79.1%) | 102 (20.9%) |
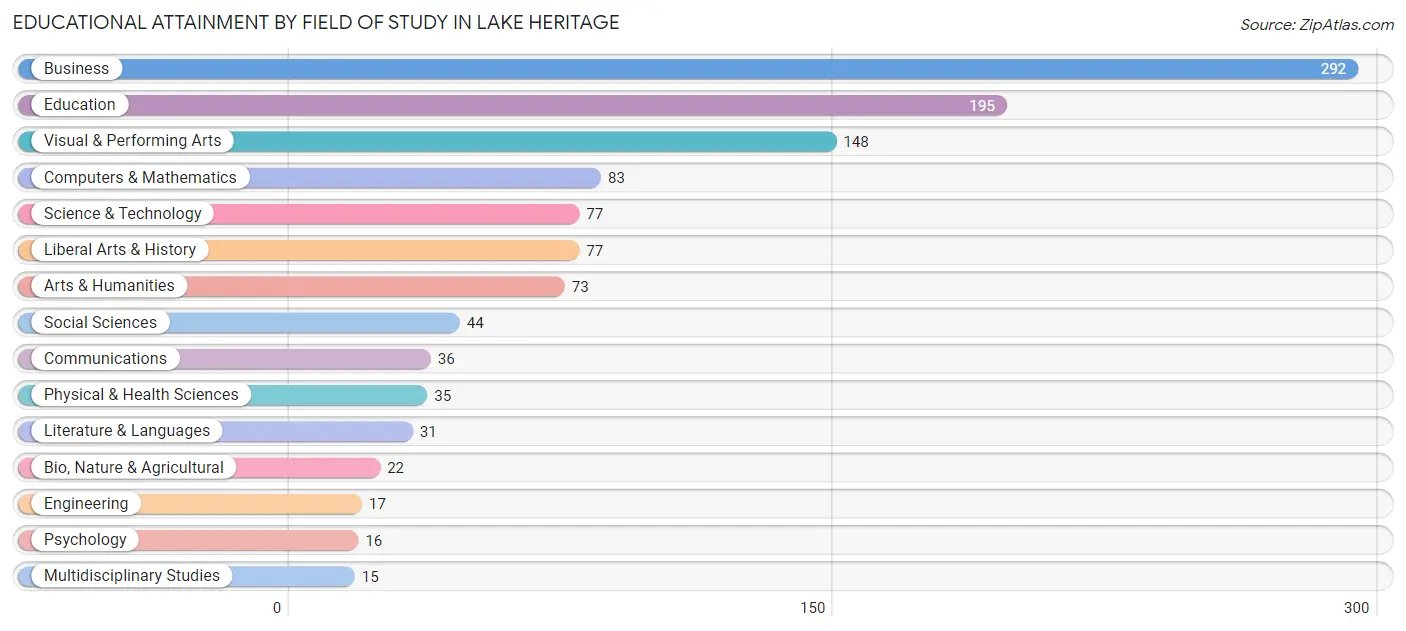
Educational Attainment by Field of Study in Lake Heritage
Business (292 | 25.2%), education (195 | 16.8%), visual & performing arts (148 | 12.8%), computers & mathematics (83 | 7.1%), and science & technology (77 | 6.6%) are the most common fields of study among 1,161 individuals in Lake Heritage who have obtained a bachelor's degree or higher.
| Field of Study | # Graduates | % Graduates |
| Computers & Mathematics | 83 | 7.1% |
| Bio, Nature & Agricultural | 22 | 1.9% |
| Physical & Health Sciences | 35 | 3.0% |
| Psychology | 16 | 1.4% |
| Social Sciences | 44 | 3.8% |
| Engineering | 17 | 1.5% |
| Multidisciplinary Studies | 15 | 1.3% |
| Science & Technology | 77 | 6.6% |
| Business | 292 | 25.2% |
| Education | 195 | 16.8% |
| Literature & Languages | 31 | 2.7% |
| Liberal Arts & History | 77 | 6.6% |
| Visual & Performing Arts | 148 | 12.8% |
| Communications | 36 | 3.1% |
| Arts & Humanities | 73 | 6.3% |
| Total | 1,161 | 100.0% |
Transportation & Commute in Lake Heritage
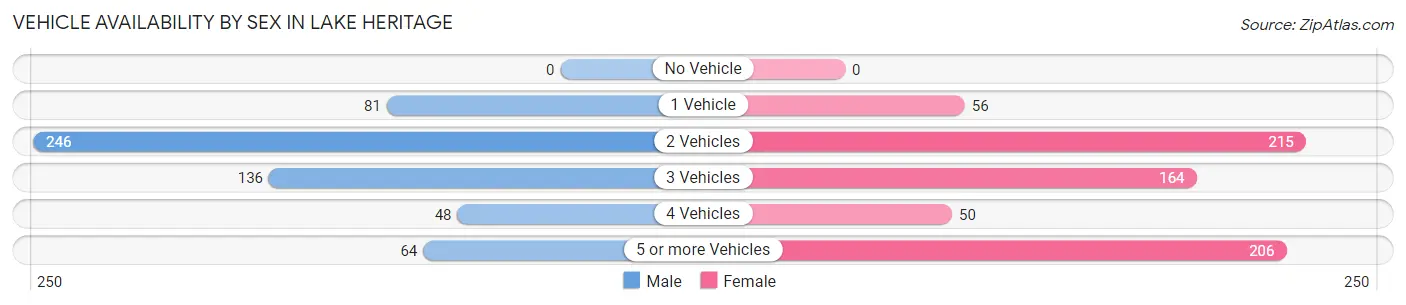
Vehicle Availability by Sex in Lake Heritage
The most prevalent vehicle ownership categories in Lake Heritage are males with 2 vehicles (246, accounting for 42.8%) and females with 2 vehicles (215, making up 35.6%).
| Vehicles Available | Male | Female |
| No Vehicle | 0 (0.0%) | 0 (0.0%) |
| 1 Vehicle | 81 (14.1%) | 56 (8.1%) |
| 2 Vehicles | 246 (42.8%) | 215 (31.1%) |
| 3 Vehicles | 136 (23.6%) | 164 (23.7%) |
| 4 Vehicles | 48 (8.4%) | 50 (7.2%) |
| 5 or more Vehicles | 64 (11.1%) | 206 (29.8%) |
| Total | 575 (100.0%) | 691 (100.0%) |
Commute Time in Lake Heritage
The most frequently occuring commute durations in Lake Heritage are 20 to 24 minutes (183 commuters, 15.3%), 15 to 19 minutes (168 commuters, 14.1%), and 10 to 14 minutes (149 commuters, 12.5%).
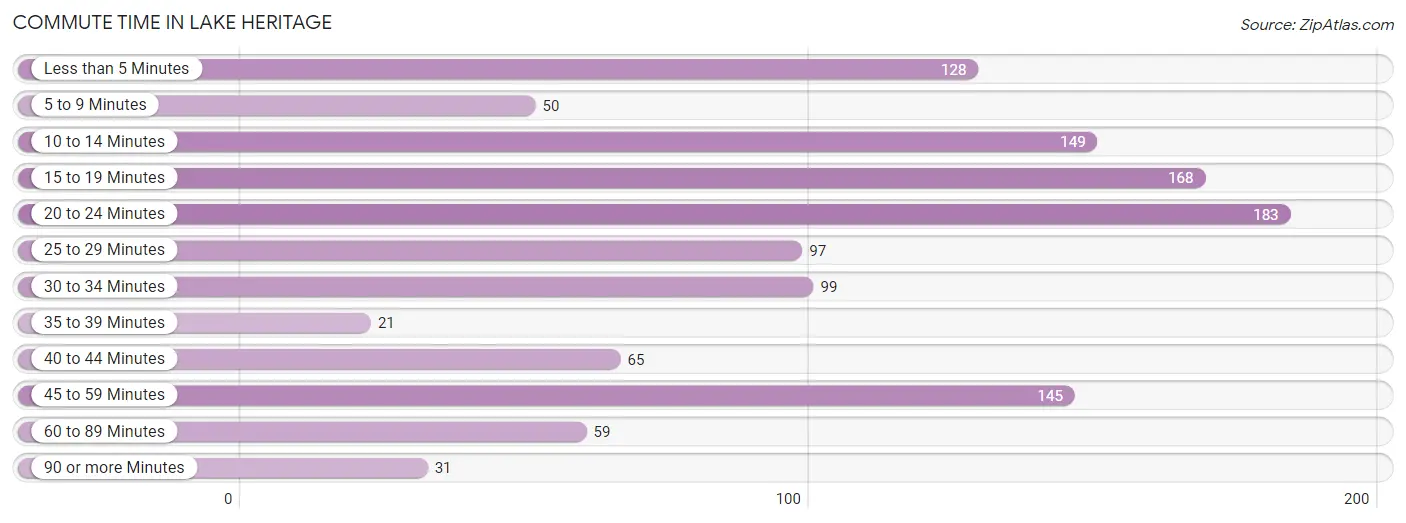
| Commute Time | # Commuters | % Commuters |
| Less than 5 Minutes | 128 | 10.7% |
| 5 to 9 Minutes | 50 | 4.2% |
| 10 to 14 Minutes | 149 | 12.5% |
| 15 to 19 Minutes | 168 | 14.1% |
| 20 to 24 Minutes | 183 | 15.3% |
| 25 to 29 Minutes | 97 | 8.1% |
| 30 to 34 Minutes | 99 | 8.3% |
| 35 to 39 Minutes | 21 | 1.8% |
| 40 to 44 Minutes | 65 | 5.4% |
| 45 to 59 Minutes | 145 | 12.1% |
| 60 to 89 Minutes | 59 | 4.9% |
| 90 or more Minutes | 31 | 2.6% |
Commute Time by Sex in Lake Heritage
The most common commute times in Lake Heritage are 20 to 24 minutes (121 commuters, 22.3%) for males and less than 5 minutes (128 commuters, 19.6%) for females.
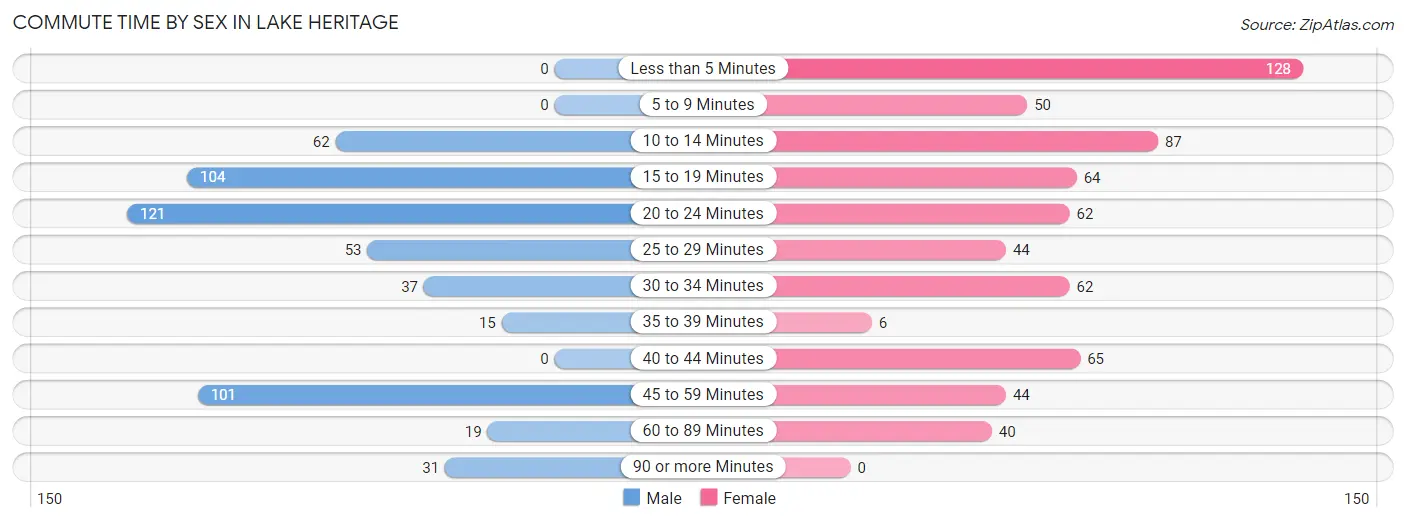
| Commute Time | Male | Female |
| Less than 5 Minutes | 0 (0.0%) | 128 (19.6%) |
| 5 to 9 Minutes | 0 (0.0%) | 50 (7.7%) |
| 10 to 14 Minutes | 62 (11.4%) | 87 (13.3%) |
| 15 to 19 Minutes | 104 (19.2%) | 64 (9.8%) |
| 20 to 24 Minutes | 121 (22.3%) | 62 (9.5%) |
| 25 to 29 Minutes | 53 (9.8%) | 44 (6.8%) |
| 30 to 34 Minutes | 37 (6.8%) | 62 (9.5%) |
| 35 to 39 Minutes | 15 (2.8%) | 6 (0.9%) |
| 40 to 44 Minutes | 0 (0.0%) | 65 (10.0%) |
| 45 to 59 Minutes | 101 (18.6%) | 44 (6.8%) |
| 60 to 89 Minutes | 19 (3.5%) | 40 (6.1%) |
| 90 or more Minutes | 31 (5.7%) | 0 (0.0%) |
Time of Departure to Work by Sex in Lake Heritage
The most frequent times of departure to work in Lake Heritage are 12:00 AM to 4:59 AM (104, 19.2%) for males and 9:00 AM to 9:59 AM (143, 21.9%) for females.
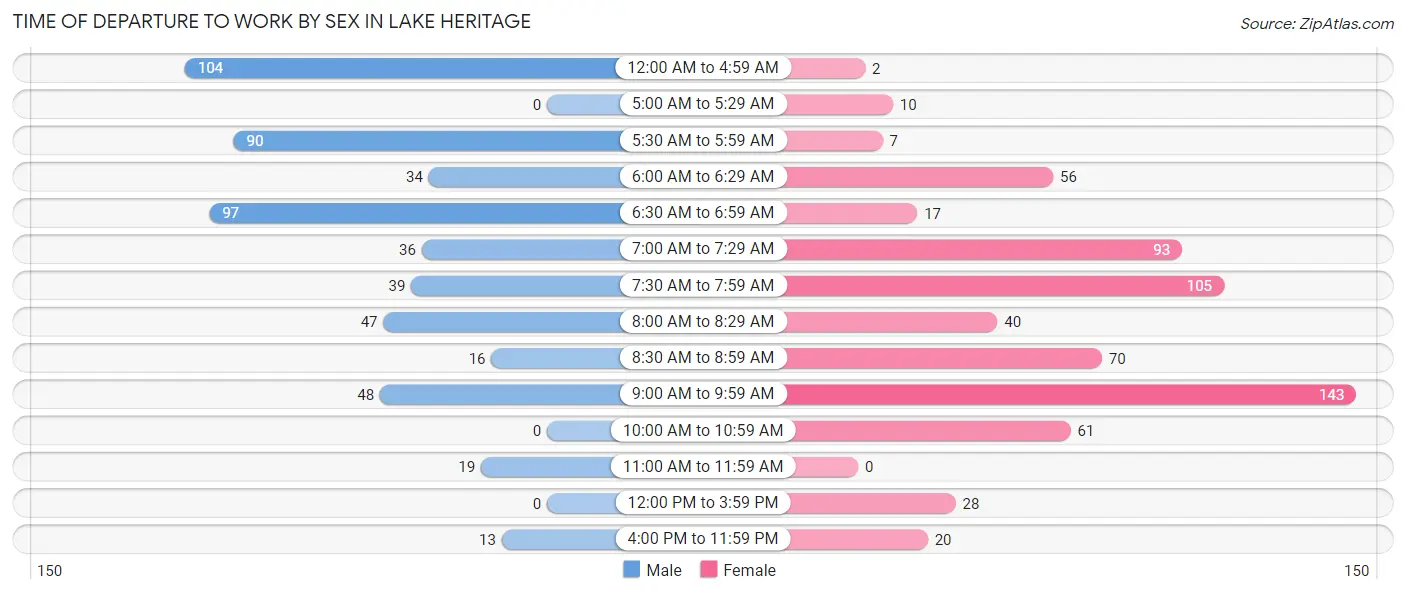
| Time of Departure | Male | Female |
| 12:00 AM to 4:59 AM | 104 (19.2%) | 2 (0.3%) |
| 5:00 AM to 5:29 AM | 0 (0.0%) | 10 (1.5%) |
| 5:30 AM to 5:59 AM | 90 (16.6%) | 7 (1.1%) |
| 6:00 AM to 6:29 AM | 34 (6.3%) | 56 (8.6%) |
| 6:30 AM to 6:59 AM | 97 (17.9%) | 17 (2.6%) |
| 7:00 AM to 7:29 AM | 36 (6.6%) | 93 (14.3%) |
| 7:30 AM to 7:59 AM | 39 (7.2%) | 105 (16.1%) |
| 8:00 AM to 8:29 AM | 47 (8.7%) | 40 (6.1%) |
| 8:30 AM to 8:59 AM | 16 (2.9%) | 70 (10.7%) |
| 9:00 AM to 9:59 AM | 48 (8.8%) | 143 (21.9%) |
| 10:00 AM to 10:59 AM | 0 (0.0%) | 61 (9.4%) |
| 11:00 AM to 11:59 AM | 19 (3.5%) | 0 (0.0%) |
| 12:00 PM to 3:59 PM | 0 (0.0%) | 28 (4.3%) |
| 4:00 PM to 11:59 PM | 13 (2.4%) | 20 (3.1%) |
| Total | 543 (100.0%) | 652 (100.0%) |
Housing Occupancy in Lake Heritage
Occupancy by Ownership in Lake Heritage
Of the total 1,039 dwellings in Lake Heritage, owner-occupied units account for 987 (95.0%), while renter-occupied units make up 52 (5.0%).
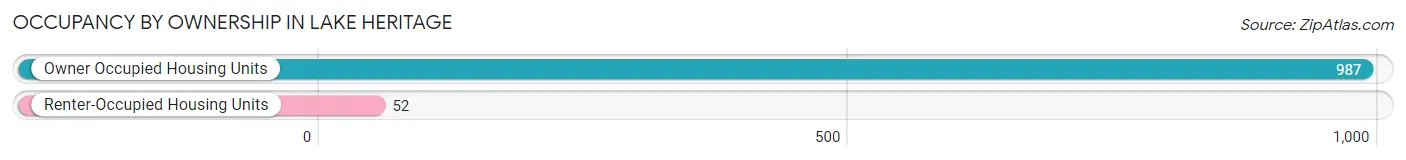
| Occupancy | # Housing Units | % Housing Units |
| Owner Occupied Housing Units | 987 | 95.0% |
| Renter-Occupied Housing Units | 52 | 5.0% |
| Total Occupied Housing Units | 1,039 | 100.0% |
Occupancy by Household Size in Lake Heritage
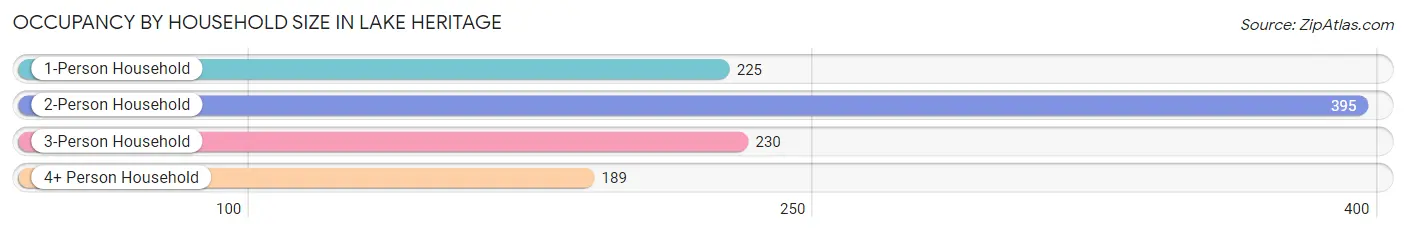
| Household Size | # Housing Units | % Housing Units |
| 1-Person Household | 225 | 21.7% |
| 2-Person Household | 395 | 38.0% |
| 3-Person Household | 230 | 22.1% |
| 4+ Person Household | 189 | 18.2% |
| Total Housing Units | 1,039 | 100.0% |
Occupancy by Ownership by Household Size in Lake Heritage
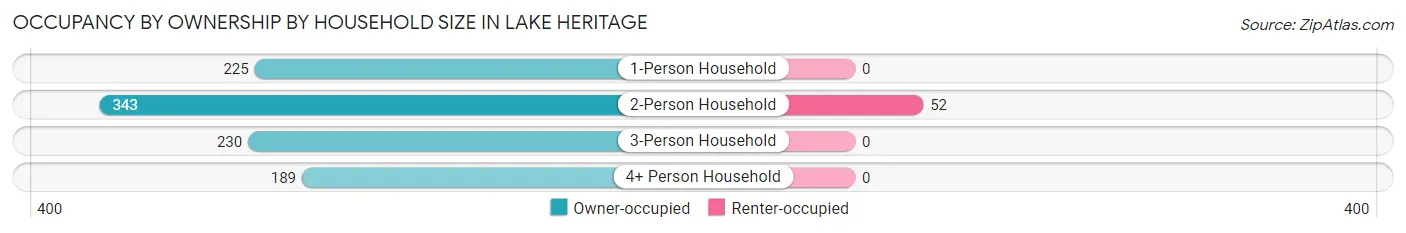
| Household Size | Owner-occupied | Renter-occupied |
| 1-Person Household | 225 (100.0%) | 0 (0.0%) |
| 2-Person Household | 343 (86.8%) | 52 (13.2%) |
| 3-Person Household | 230 (100.0%) | 0 (0.0%) |
| 4+ Person Household | 189 (100.0%) | 0 (0.0%) |
| Total Housing Units | 987 (95.0%) | 52 (5.0%) |
Occupancy by Educational Attainment in Lake Heritage
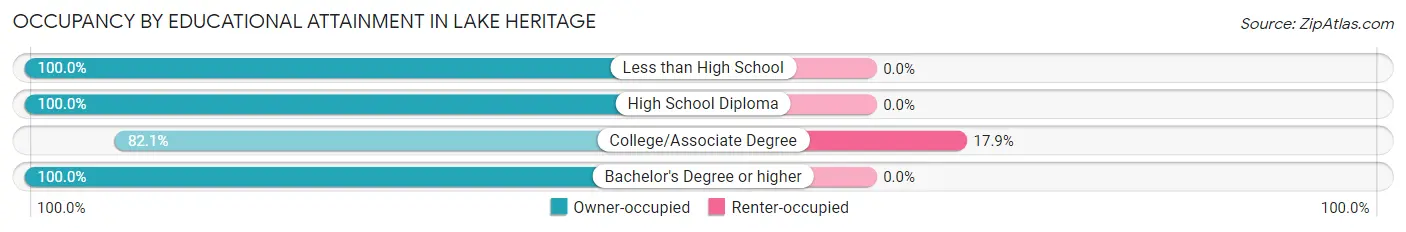
| Household Size | Owner-occupied | Renter-occupied |
| Less than High School | 30 (100.0%) | 0 (0.0%) |
| High School Diploma | 157 (100.0%) | 0 (0.0%) |
| College/Associate Degree | 238 (82.1%) | 52 (17.9%) |
| Bachelor's Degree or higher | 562 (100.0%) | 0 (0.0%) |
Occupancy by Age of Householder in Lake Heritage
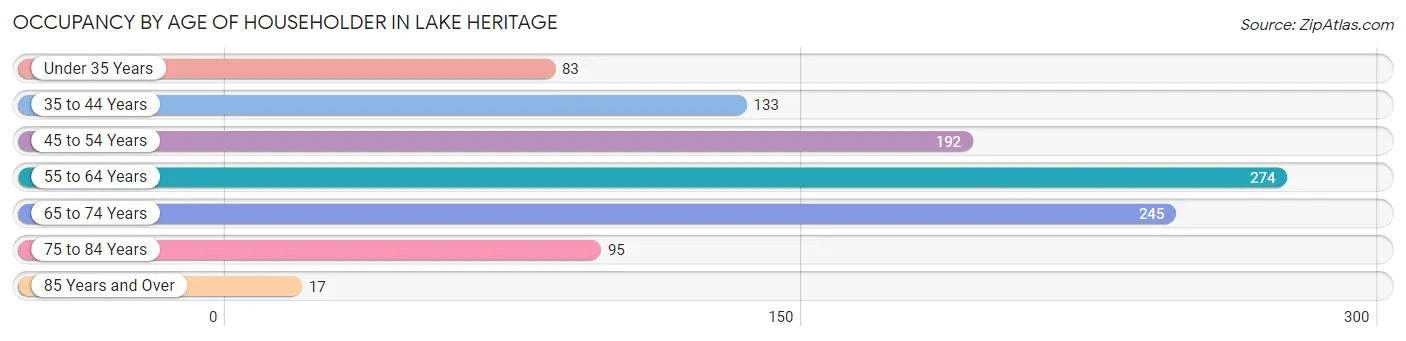
| Age Bracket | # Households | % Households |
| Under 35 Years | 83 | 8.0% |
| 35 to 44 Years | 133 | 12.8% |
| 45 to 54 Years | 192 | 18.5% |
| 55 to 64 Years | 274 | 26.4% |
| 65 to 74 Years | 245 | 23.6% |
| 75 to 84 Years | 95 | 9.1% |
| 85 Years and Over | 17 | 1.6% |
| Total | 1,039 | 100.0% |
Housing Finances in Lake Heritage
Median Income by Occupancy in Lake Heritage
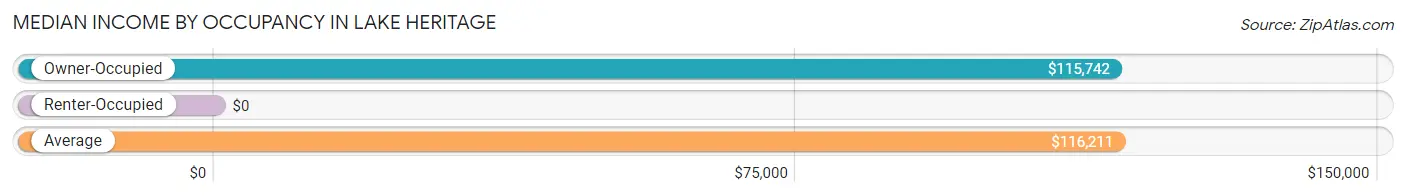
| Occupancy Type | # Households | Median Income |
| Owner-Occupied | 987 (95.0%) | $115,742 |
| Renter-Occupied | 52 (5.0%) | $0 |
| Average | 1,039 (100.0%) | $116,211 |
Occupancy by Householder Income Bracket in Lake Heritage
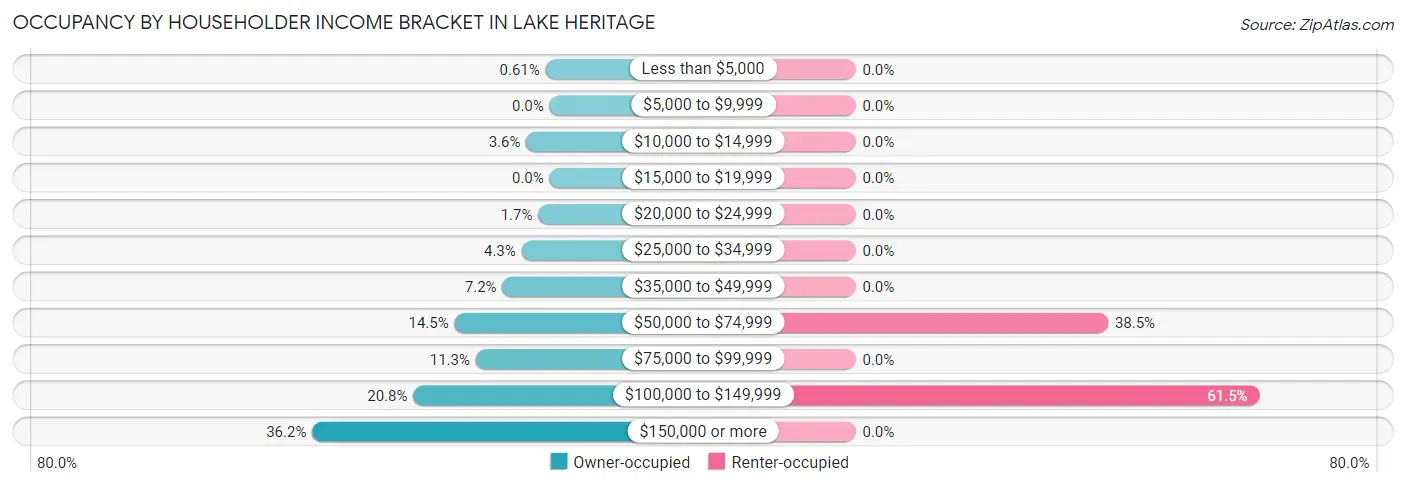
| Income Bracket | Owner-occupied | Renter-occupied |
| Less than $5,000 | 6 (0.6%) | 0 (0.0%) |
| $5,000 to $9,999 | 0 (0.0%) | 0 (0.0%) |
| $10,000 to $14,999 | 35 (3.5%) | 0 (0.0%) |
| $15,000 to $19,999 | 0 (0.0%) | 0 (0.0%) |
| $20,000 to $24,999 | 17 (1.7%) | 0 (0.0%) |
| $25,000 to $34,999 | 42 (4.3%) | 0 (0.0%) |
| $35,000 to $49,999 | 71 (7.2%) | 0 (0.0%) |
| $50,000 to $74,999 | 143 (14.5%) | 20 (38.5%) |
| $75,000 to $99,999 | 111 (11.3%) | 0 (0.0%) |
| $100,000 to $149,999 | 205 (20.8%) | 32 (61.5%) |
| $150,000 or more | 357 (36.2%) | 0 (0.0%) |
| Total | 987 (100.0%) | 52 (100.0%) |
Monthly Housing Cost Tiers in Lake Heritage
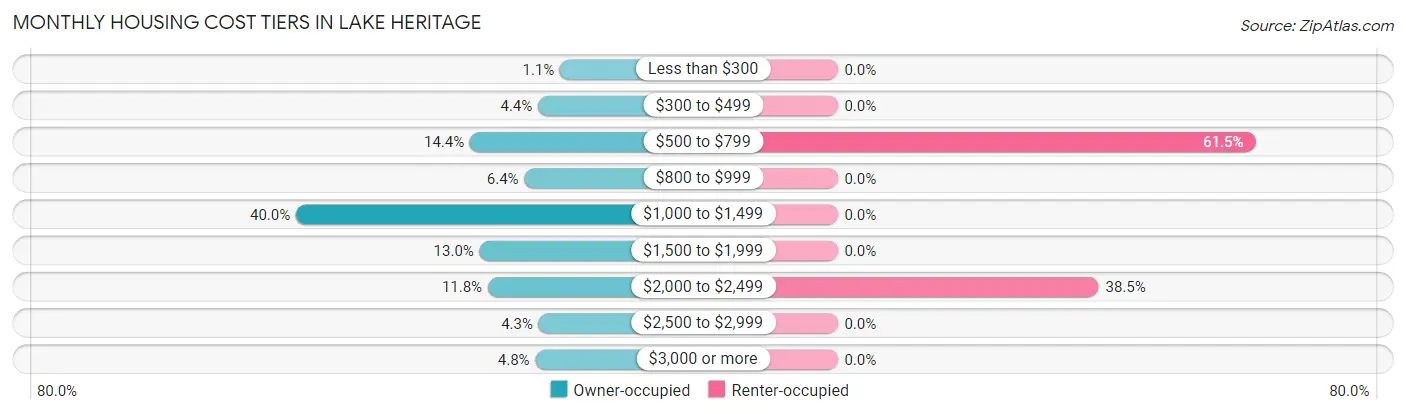
| Monthly Cost | Owner-occupied | Renter-occupied |
| Less than $300 | 11 (1.1%) | 0 (0.0%) |
| $300 to $499 | 43 (4.4%) | 0 (0.0%) |
| $500 to $799 | 142 (14.4%) | 32 (61.5%) |
| $800 to $999 | 63 (6.4%) | 0 (0.0%) |
| $1,000 to $1,499 | 395 (40.0%) | 0 (0.0%) |
| $1,500 to $1,999 | 128 (13.0%) | 0 (0.0%) |
| $2,000 to $2,499 | 116 (11.7%) | 20 (38.5%) |
| $2,500 to $2,999 | 42 (4.3%) | 0 (0.0%) |
| $3,000 or more | 47 (4.8%) | 0 (0.0%) |
| Total | 987 (100.0%) | 52 (100.0%) |
Physical Housing Characteristics in Lake Heritage
Housing Structures in Lake Heritage
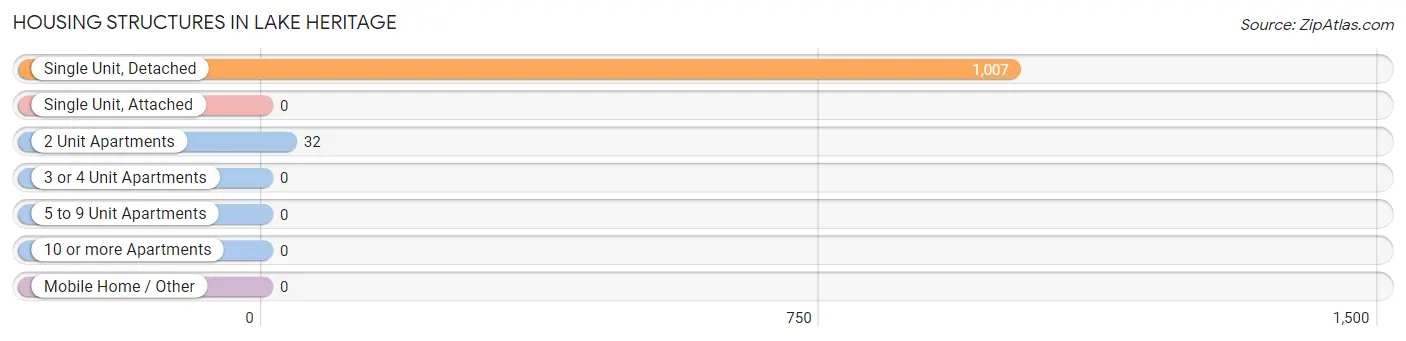
| Structure Type | # Housing Units | % Housing Units |
| Single Unit, Detached | 1,007 | 96.9% |
| Single Unit, Attached | 0 | 0.0% |
| 2 Unit Apartments | 32 | 3.1% |
| 3 or 4 Unit Apartments | 0 | 0.0% |
| 5 to 9 Unit Apartments | 0 | 0.0% |
| 10 or more Apartments | 0 | 0.0% |
| Mobile Home / Other | 0 | 0.0% |
| Total | 1,039 | 100.0% |
Housing Structures by Occupancy in Lake Heritage
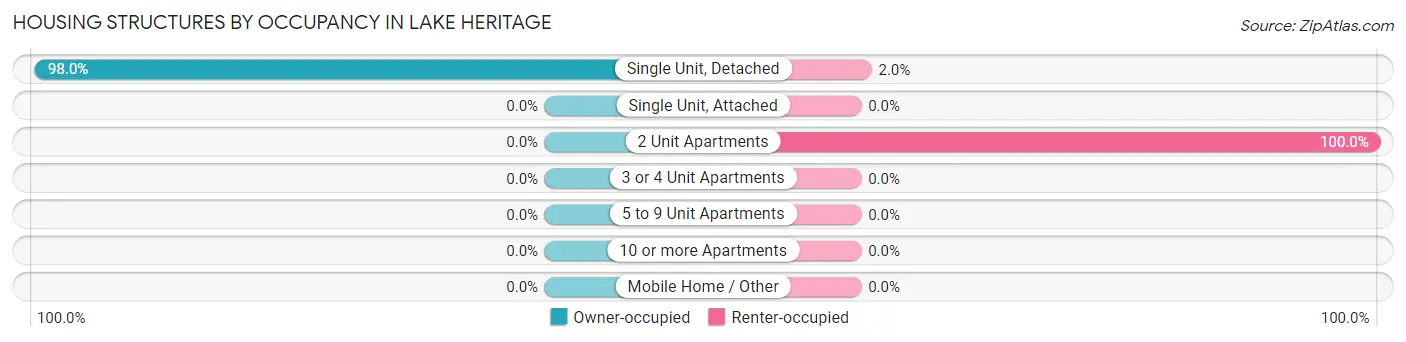
| Structure Type | Owner-occupied | Renter-occupied |
| Single Unit, Detached | 987 (98.0%) | 20 (2.0%) |
| Single Unit, Attached | 0 (0.0%) | 0 (0.0%) |
| 2 Unit Apartments | 0 (0.0%) | 32 (100.0%) |
| 3 or 4 Unit Apartments | 0 (0.0%) | 0 (0.0%) |
| 5 to 9 Unit Apartments | 0 (0.0%) | 0 (0.0%) |
| 10 or more Apartments | 0 (0.0%) | 0 (0.0%) |
| Mobile Home / Other | 0 (0.0%) | 0 (0.0%) |
| Total | 987 (95.0%) | 52 (5.0%) |
Housing Structures by Number of Rooms in Lake Heritage
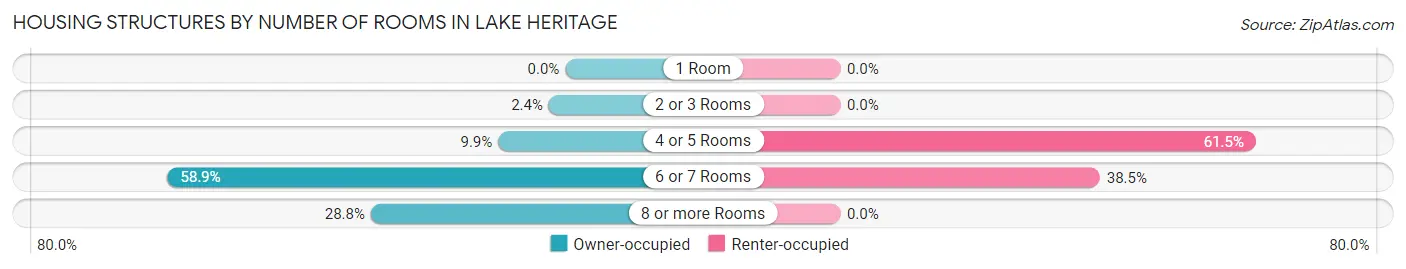
| Number of Rooms | Owner-occupied | Renter-occupied |
| 1 Room | 0 (0.0%) | 0 (0.0%) |
| 2 or 3 Rooms | 24 (2.4%) | 0 (0.0%) |
| 4 or 5 Rooms | 98 (9.9%) | 32 (61.5%) |
| 6 or 7 Rooms | 581 (58.9%) | 20 (38.5%) |
| 8 or more Rooms | 284 (28.8%) | 0 (0.0%) |
| Total | 987 (100.0%) | 52 (100.0%) |
Housing Structure by Heating Type in Lake Heritage
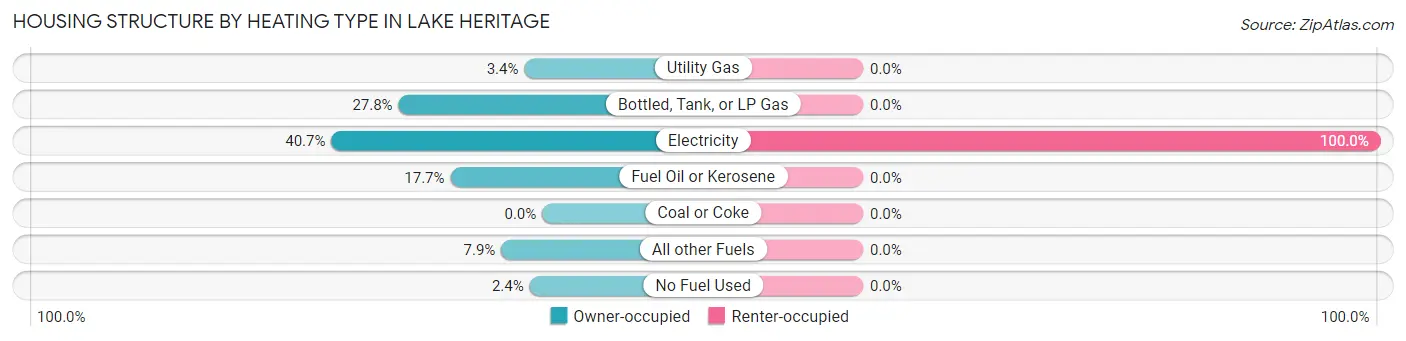
| Heating Type | Owner-occupied | Renter-occupied |
| Utility Gas | 34 (3.4%) | 0 (0.0%) |
| Bottled, Tank, or LP Gas | 274 (27.8%) | 0 (0.0%) |
| Electricity | 402 (40.7%) | 52 (100.0%) |
| Fuel Oil or Kerosene | 175 (17.7%) | 0 (0.0%) |
| Coal or Coke | 0 (0.0%) | 0 (0.0%) |
| All other Fuels | 78 (7.9%) | 0 (0.0%) |
| No Fuel Used | 24 (2.4%) | 0 (0.0%) |
| Total | 987 (100.0%) | 52 (100.0%) |
Household Vehicle Usage in Lake Heritage
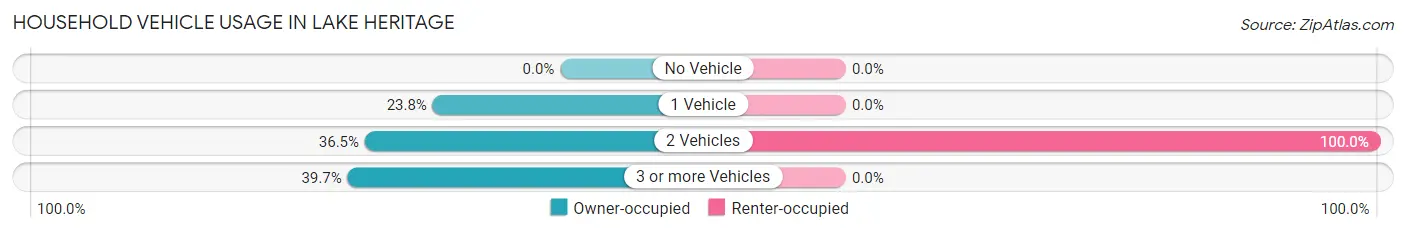
| Vehicles per Household | Owner-occupied | Renter-occupied |
| No Vehicle | 0 (0.0%) | 0 (0.0%) |
| 1 Vehicle | 235 (23.8%) | 0 (0.0%) |
| 2 Vehicles | 360 (36.5%) | 52 (100.0%) |
| 3 or more Vehicles | 392 (39.7%) | 0 (0.0%) |
| Total | 987 (100.0%) | 52 (100.0%) |
Real Estate & Mortgages in Lake Heritage
Real Estate and Mortgage Overview in Lake Heritage
| Characteristic | Without Mortgage | With Mortgage |
| Housing Units | 492 | 495 |
| Median Property Value | $339,600 | $267,800 |
| Median Household Income | $92,857 | $185 |
| Monthly Housing Costs | $1,004 | $47 |
| Real Estate Taxes | $4,677 | $0 |
Property Value by Mortgage Status in Lake Heritage
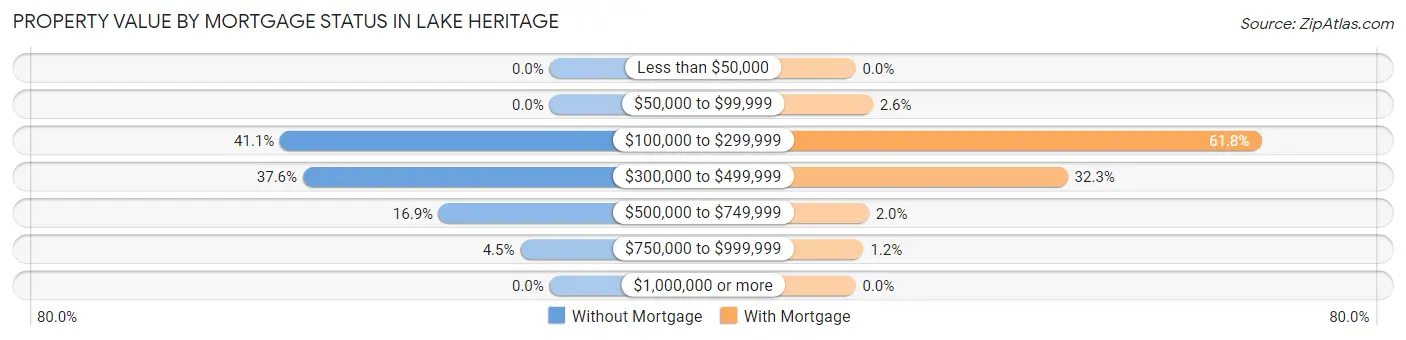
| Property Value | Without Mortgage | With Mortgage |
| Less than $50,000 | 0 (0.0%) | 0 (0.0%) |
| $50,000 to $99,999 | 0 (0.0%) | 13 (2.6%) |
| $100,000 to $299,999 | 202 (41.1%) | 306 (61.8%) |
| $300,000 to $499,999 | 185 (37.6%) | 160 (32.3%) |
| $500,000 to $749,999 | 83 (16.9%) | 10 (2.0%) |
| $750,000 to $999,999 | 22 (4.5%) | 6 (1.2%) |
| $1,000,000 or more | 0 (0.0%) | 0 (0.0%) |
| Total | 492 (100.0%) | 495 (100.0%) |
Household Income by Mortgage Status in Lake Heritage
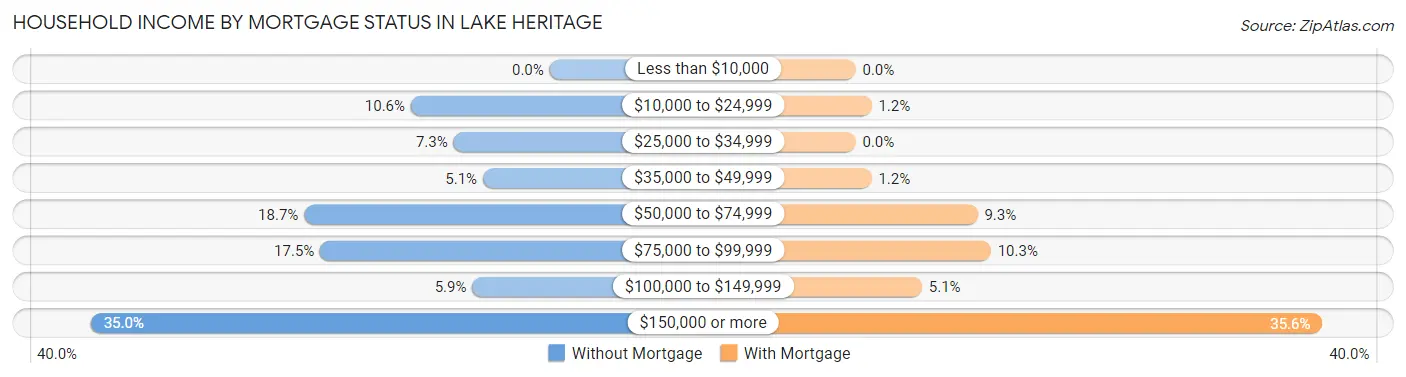
| Household Income | Without Mortgage | With Mortgage |
| Less than $10,000 | 0 (0.0%) | 0 (0.0%) |
| $10,000 to $24,999 | 52 (10.6%) | 6 (1.2%) |
| $25,000 to $34,999 | 36 (7.3%) | 0 (0.0%) |
| $35,000 to $49,999 | 25 (5.1%) | 6 (1.2%) |
| $50,000 to $74,999 | 92 (18.7%) | 46 (9.3%) |
| $75,000 to $99,999 | 86 (17.5%) | 51 (10.3%) |
| $100,000 to $149,999 | 29 (5.9%) | 25 (5.1%) |
| $150,000 or more | 172 (35.0%) | 176 (35.6%) |
| Total | 492 (100.0%) | 495 (100.0%) |
Property Value to Household Income Ratio in Lake Heritage
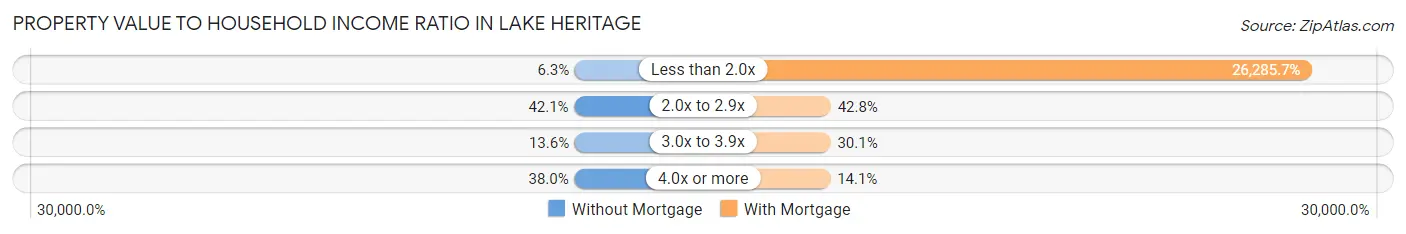
| Value-to-Income Ratio | Without Mortgage | With Mortgage |
| Less than 2.0x | 31 (6.3%) | 130,114 (26,285.7%) |
| 2.0x to 2.9x | 207 (42.1%) | 212 (42.8%) |
| 3.0x to 3.9x | 67 (13.6%) | 149 (30.1%) |
| 4.0x or more | 187 (38.0%) | 70 (14.1%) |
| Total | 492 (100.0%) | 495 (100.0%) |
Real Estate Taxes by Mortgage Status in Lake Heritage
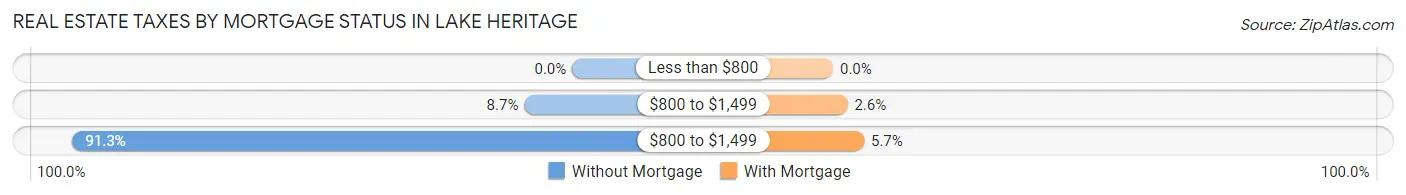
| Property Taxes | Without Mortgage | With Mortgage |
| Less than $800 | 0 (0.0%) | 0 (0.0%) |
| $800 to $1,499 | 43 (8.7%) | 13 (2.6%) |
| $800 to $1,499 | 449 (91.3%) | 28 (5.7%) |
| Total | 492 (100.0%) | 495 (100.0%) |
Health & Disability in Lake Heritage
Health Insurance Coverage by Age in Lake Heritage
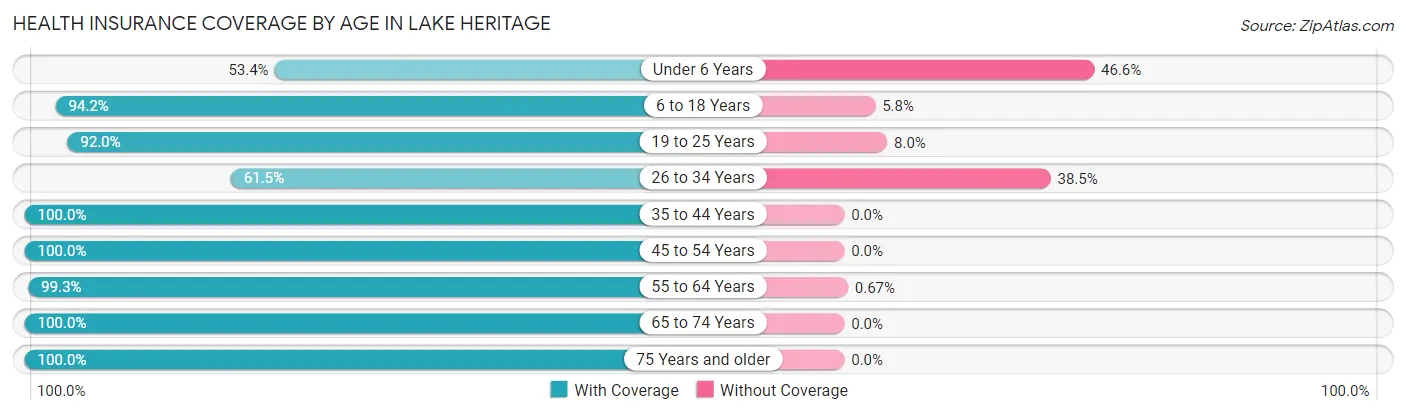
| Age Bracket | With Coverage | Without Coverage |
| Under 6 Years | 94 (53.4%) | 82 (46.6%) |
| 6 to 18 Years | 278 (94.2%) | 17 (5.8%) |
| 19 to 25 Years | 196 (92.0%) | 17 (8.0%) |
| 26 to 34 Years | 56 (61.5%) | 35 (38.5%) |
| 35 to 44 Years | 360 (100.0%) | 0 (0.0%) |
| 45 to 54 Years | 432 (100.0%) | 0 (0.0%) |
| 55 to 64 Years | 443 (99.3%) | 3 (0.7%) |
| 65 to 74 Years | 564 (100.0%) | 0 (0.0%) |
| 75 Years and older | 154 (100.0%) | 0 (0.0%) |
| Total | 2,577 (94.4%) | 154 (5.6%) |
Health Insurance Coverage by Citizenship Status in Lake Heritage
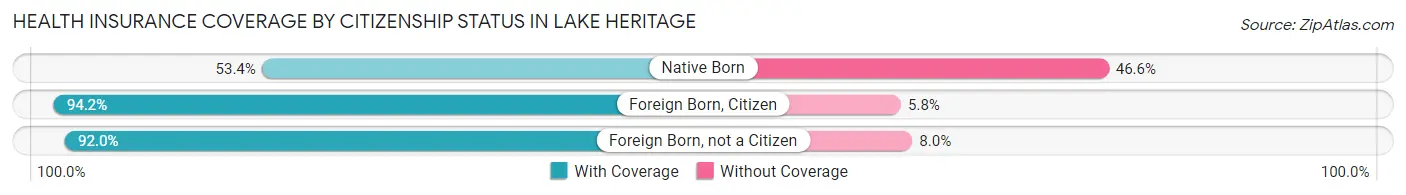
| Citizenship Status | With Coverage | Without Coverage |
| Native Born | 94 (53.4%) | 82 (46.6%) |
| Foreign Born, Citizen | 278 (94.2%) | 17 (5.8%) |
| Foreign Born, not a Citizen | 196 (92.0%) | 17 (8.0%) |
Health Insurance Coverage by Household Income in Lake Heritage
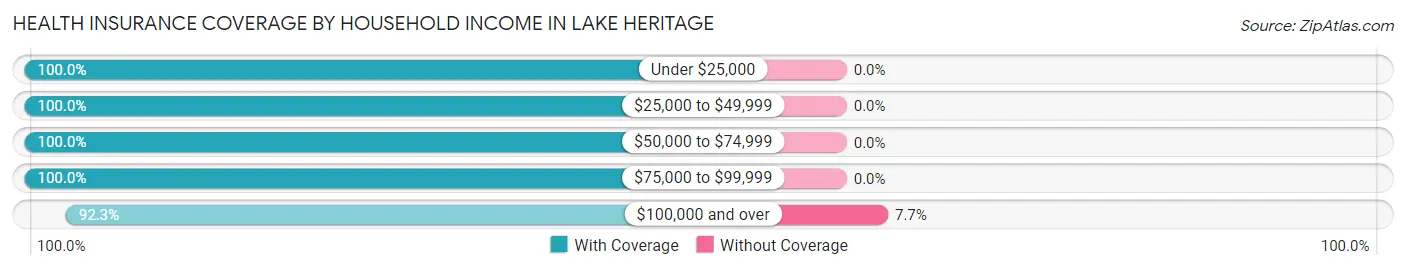
| Household Income | With Coverage | Without Coverage |
| Under $25,000 | 76 (100.0%) | 0 (0.0%) |
| $25,000 to $49,999 | 190 (100.0%) | 0 (0.0%) |
| $50,000 to $74,999 | 266 (100.0%) | 0 (0.0%) |
| $75,000 to $99,999 | 208 (100.0%) | 0 (0.0%) |
| $100,000 and over | 1,837 (92.3%) | 154 (7.7%) |
Public vs Private Health Insurance Coverage by Age in Lake Heritage
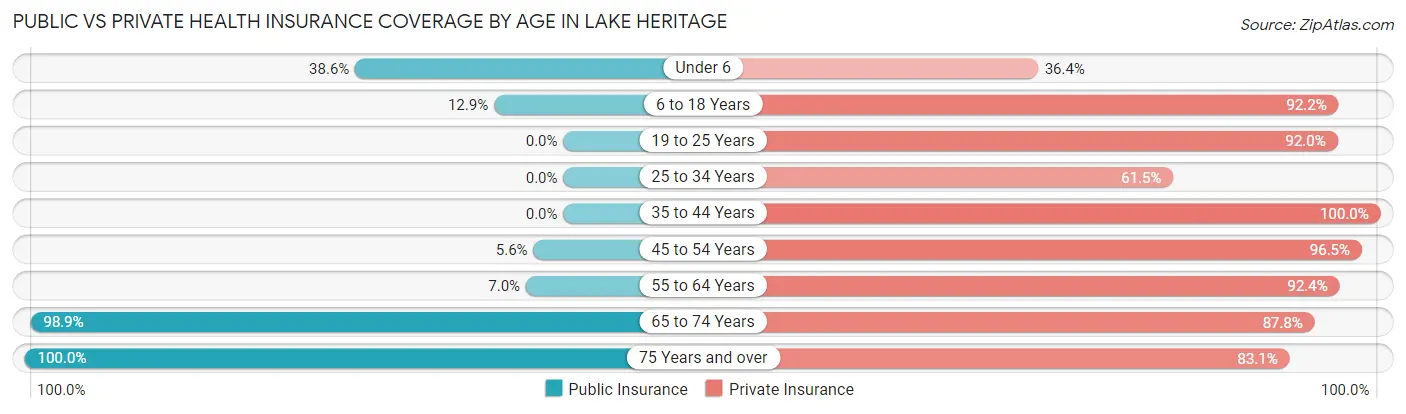
| Age Bracket | Public Insurance | Private Insurance |
| Under 6 | 68 (38.6%) | 64 (36.4%) |
| 6 to 18 Years | 38 (12.9%) | 272 (92.2%) |
| 19 to 25 Years | 0 (0.0%) | 196 (92.0%) |
| 25 to 34 Years | 0 (0.0%) | 56 (61.5%) |
| 35 to 44 Years | 0 (0.0%) | 360 (100.0%) |
| 45 to 54 Years | 24 (5.6%) | 417 (96.5%) |
| 55 to 64 Years | 31 (7.0%) | 412 (92.4%) |
| 65 to 74 Years | 558 (98.9%) | 495 (87.8%) |
| 75 Years and over | 154 (100.0%) | 128 (83.1%) |
| Total | 873 (32.0%) | 2,400 (87.9%) |
Disability Status by Sex by Age in Lake Heritage
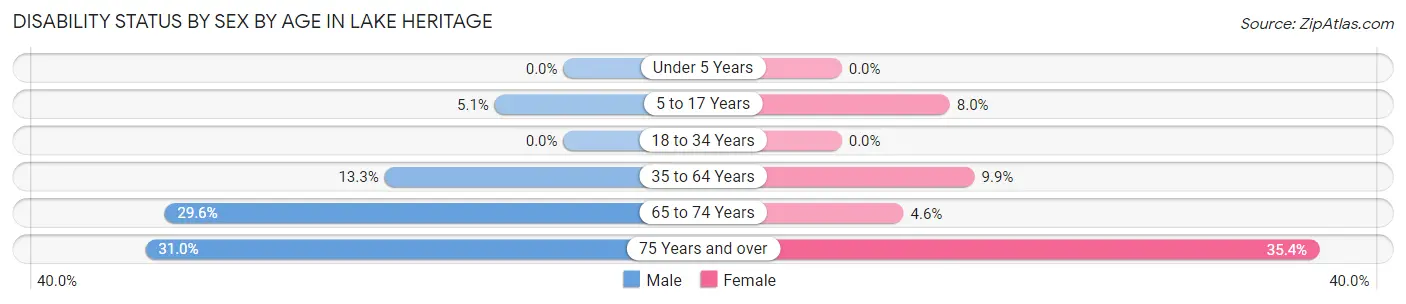
| Age Bracket | Male | Female |
| Under 5 Years | 0 (0.0%) | 0 (0.0%) |
| 5 to 17 Years | 8 (5.1%) | 13 (8.0%) |
| 18 to 34 Years | 0 (0.0%) | 0 (0.0%) |
| 35 to 64 Years | 62 (13.3%) | 76 (9.9%) |
| 65 to 74 Years | 109 (29.6%) | 9 (4.6%) |
| 75 Years and over | 18 (31.0%) | 34 (35.4%) |
Disability Class by Sex by Age in Lake Heritage
Disability Class: Hearing Difficulty
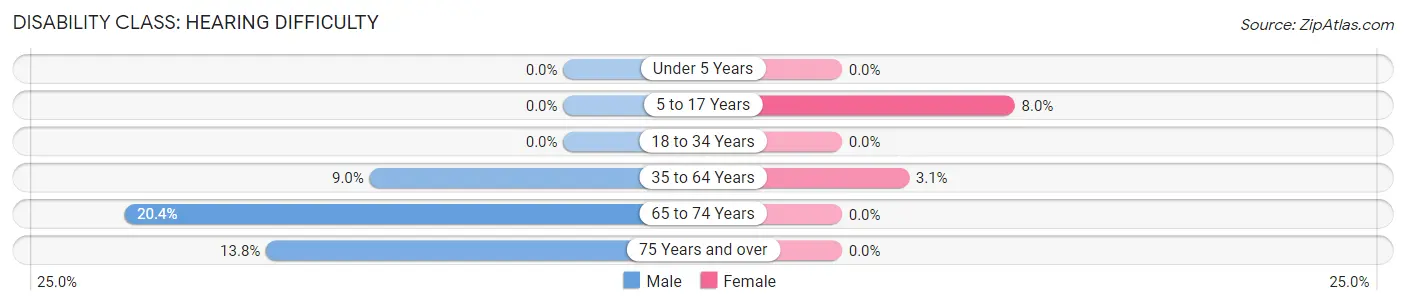
| Age Bracket | Male | Female |
| Under 5 Years | 0 (0.0%) | 0 (0.0%) |
| 5 to 17 Years | 0 (0.0%) | 13 (8.0%) |
| 18 to 34 Years | 0 (0.0%) | 0 (0.0%) |
| 35 to 64 Years | 42 (9.0%) | 24 (3.1%) |
| 65 to 74 Years | 75 (20.4%) | 0 (0.0%) |
| 75 Years and over | 8 (13.8%) | 0 (0.0%) |
Disability Class: Vision Difficulty
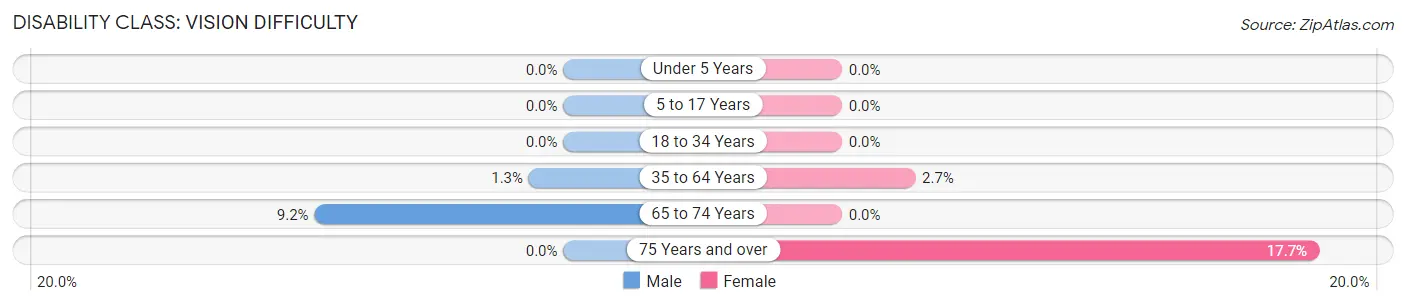
| Age Bracket | Male | Female |
| Under 5 Years | 0 (0.0%) | 0 (0.0%) |
| 5 to 17 Years | 0 (0.0%) | 0 (0.0%) |
| 18 to 34 Years | 0 (0.0%) | 0 (0.0%) |
| 35 to 64 Years | 6 (1.3%) | 21 (2.7%) |
| 65 to 74 Years | 34 (9.2%) | 0 (0.0%) |
| 75 Years and over | 0 (0.0%) | 17 (17.7%) |
Disability Class: Cognitive Difficulty
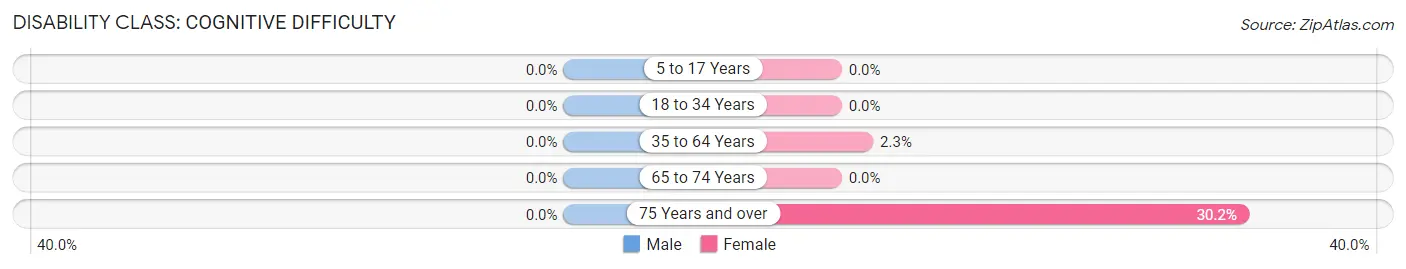
| Age Bracket | Male | Female |
| 5 to 17 Years | 0 (0.0%) | 0 (0.0%) |
| 18 to 34 Years | 0 (0.0%) | 0 (0.0%) |
| 35 to 64 Years | 0 (0.0%) | 18 (2.3%) |
| 65 to 74 Years | 0 (0.0%) | 0 (0.0%) |
| 75 Years and over | 0 (0.0%) | 29 (30.2%) |
Disability Class: Ambulatory Difficulty
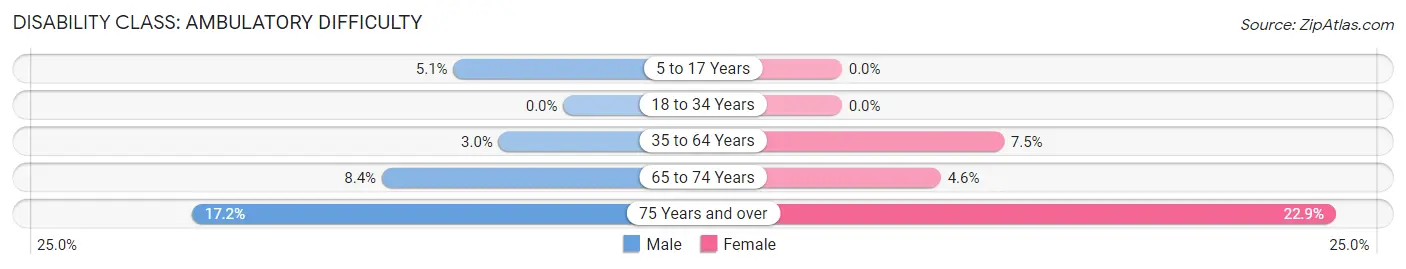
| Age Bracket | Male | Female |
| 5 to 17 Years | 8 (5.1%) | 0 (0.0%) |
| 18 to 34 Years | 0 (0.0%) | 0 (0.0%) |
| 35 to 64 Years | 14 (3.0%) | 58 (7.5%) |
| 65 to 74 Years | 31 (8.4%) | 9 (4.6%) |
| 75 Years and over | 10 (17.2%) | 22 (22.9%) |
Disability Class: Self-Care Difficulty
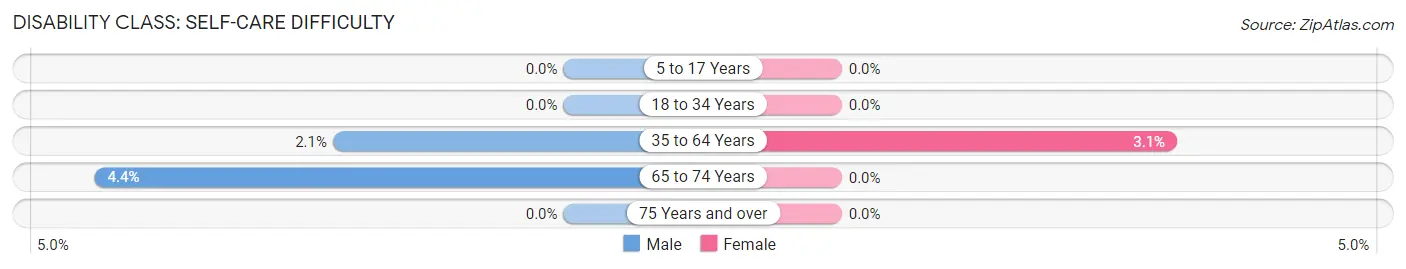
| Age Bracket | Male | Female |
| 5 to 17 Years | 0 (0.0%) | 0 (0.0%) |
| 18 to 34 Years | 0 (0.0%) | 0 (0.0%) |
| 35 to 64 Years | 10 (2.1%) | 24 (3.1%) |
| 65 to 74 Years | 16 (4.3%) | 0 (0.0%) |
| 75 Years and over | 0 (0.0%) | 0 (0.0%) |
Technology Access in Lake Heritage
Computing Device Access in Lake Heritage
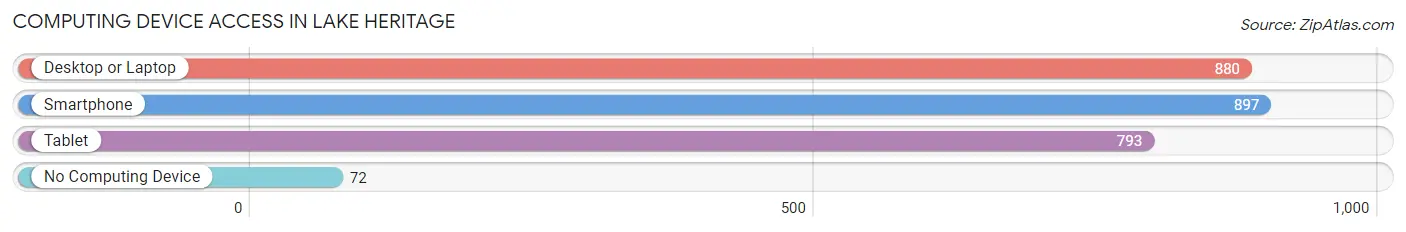
| Device Type | # Households | % Households |
| Desktop or Laptop | 880 | 84.7% |
| Smartphone | 897 | 86.3% |
| Tablet | 793 | 76.3% |
| No Computing Device | 72 | 6.9% |
| Total | 1,039 | 100.0% |
Internet Access in Lake Heritage
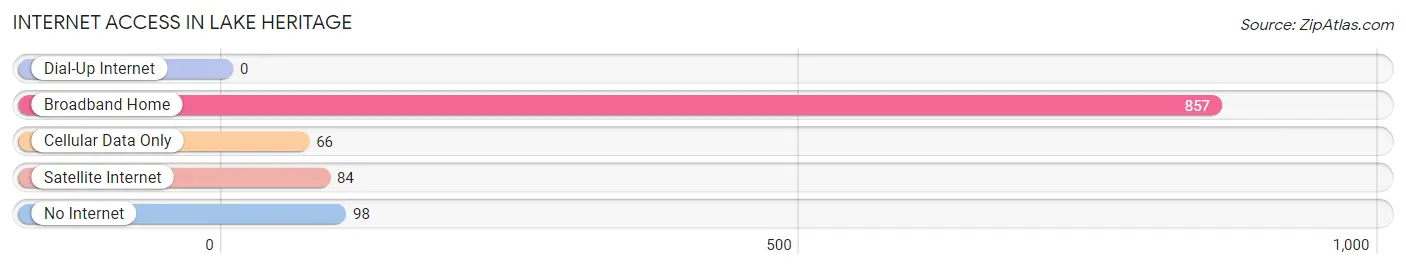
| Internet Type | # Households | % Households |
| Dial-Up Internet | 0 | 0.0% |
| Broadband Home | 857 | 82.5% |
| Cellular Data Only | 66 | 6.4% |
| Satellite Internet | 84 | 8.1% |
| No Internet | 98 | 9.4% |
| Total | 1,039 | 100.0% |
Lake Heritage Summary
Lake Heritage is a small, unincorporated community located in the south-central part of Pennsylvania, in the United States. It is situated in the northern part of York County, approximately 10 miles south of the state capital of Harrisburg. The community is located along the Susquehanna River, and is bordered by the towns of York Haven, Newberrytown, and Lewisberry.
History
The area that is now Lake Heritage was first settled in the late 1700s by German immigrants. The community was originally known as “Friedensburg”, and was a small farming community. In the early 1800s, the area was renamed “Lake Heritage”, after the nearby lake. The lake was created in 1820, when a dam was built on the Susquehanna River. The lake was used for recreational activities, such as fishing and boating.
In the late 1800s, the area began to develop into a resort community. Several hotels and resorts were built along the lake, and the area became a popular destination for vacationers. The lake was also used for ice harvesting, and the ice was shipped to nearby cities.
In the early 1900s, the area began to decline in popularity as a resort destination. The hotels and resorts closed, and the area became a quiet, rural community. In the 1950s, the area began to experience a resurgence in popularity, as people began to move to the area for its natural beauty and recreational opportunities.
Geography
Lake Heritage is located in the northern part of York County, in south-central Pennsylvania. The community is situated along the Susquehanna River, and is bordered by the towns of York Haven, Newberrytown, and Lewisberry. The area is mostly rural, with rolling hills and forests. The lake is the centerpiece of the community, and is a popular destination for fishing, boating, and other recreational activities.
Economy
The economy of Lake Heritage is largely based on tourism and recreation. The lake is a popular destination for fishing, boating, and other recreational activities. There are several resorts and hotels in the area, as well as restaurants and other businesses catering to tourists. The area is also home to several small farms, which produce a variety of crops and livestock.
Demographics
As of the 2010 census, the population of Lake Heritage was 1,845. The population is mostly white (94.3%), with a small percentage of African Americans (2.2%) and Hispanics (2.5%). The median household income is $50,945, and the median home value is $179,400. The unemployment rate is 4.2%.
Conclusion
Lake Heritage is a small, unincorporated community located in the south-central part of Pennsylvania. The area was first settled in the late 1700s, and was originally known as “Friedensburg”. In the early 1800s, the area was renamed “Lake Heritage”, after the nearby lake. The economy of the area is largely based on tourism and recreation, and the population is mostly white. The area is a popular destination for fishing, boating, and other recreational activities.
Common Questions
What is the Total Population of Lake Heritage?
Total Population of Lake Heritage is 2,731.
What is the Total Male Population of Lake Heritage?
Total Male Population of Lake Heritage is 1,225.
What is the Total Female Population of Lake Heritage?
Total Female Population of Lake Heritage is 1,506.
What is the Ratio of Males per 100 Females in Lake Heritage?
There are 81.34 Males per 100 Females in Lake Heritage.
What is the Ratio of Females per 100 Males in Lake Heritage?
There are 122.94 Females per 100 Males in Lake Heritage.
What is the Median Population Age in Lake Heritage?
Median Population Age in Lake Heritage is 48.8 Years.
What is the Average Family Size in Lake Heritage
Average Family Size in Lake Heritage is 3.1 People.
What is the Average Household Size in Lake Heritage
Average Household Size in Lake Heritage is 2.6 People.
What is Per Capita Income in Lake Heritage?
Per Capita income in Lake Heritage is $47,366.
What is the Median Family Income in Lake Heritage?
Median Family Income in Lake Heritage is $132,159.
What is the Median Household income in Lake Heritage?
Median Household Income in Lake Heritage is $116,211.
What is Income or Wage Gap in Lake Heritage?
Income or Wage Gap in Lake Heritage is 51.5%.
Women in Lake Heritage earn 48.5 cents for every dollar earned by a man.
What is Inequality or Gini Index in Lake Heritage?
Inequality or Gini Index in Lake Heritage is 0.33.
How Large is the Labor Force in Lake Heritage?
There are 1,397 People in the Labor Forcein in Lake Heritage.
What is the Percentage of People in the Labor Force in Lake Heritage?
59.3% of People are in the Labor Force in Lake Heritage.
What is the Unemployment Rate in Lake Heritage?
Unemployment Rate in Lake Heritage is 2.6%.