California borough, PA
California borough Overview
5,328
TOTAL POPULATION
2,499
MALE POPULATION
2,829
FEMALE POPULATION
88.34
MALES / 100 FEMALES
113.21
FEMALES / 100 MALES
21.9
MEDIAN AGE
2.9
AVG FAMILY SIZE
2.2
AVG HOUSEHOLD SIZE
$21,658
PER CAPITA INCOME
$76,103
AVG FAMILY INCOME
$46,471
AVG HOUSEHOLD INCOME
5.6%
WAGE / INCOME GAP [ % ]
94.4¢/ $1
WAGE / INCOME GAP [ $ ]
0.45
INEQUALITY / GINI INDEX
2,823
LABOR FORCE [ PEOPLE ]
59.6%
PERCENT IN LABOR FORCE
10.2%
UNEMPLOYMENT RATE
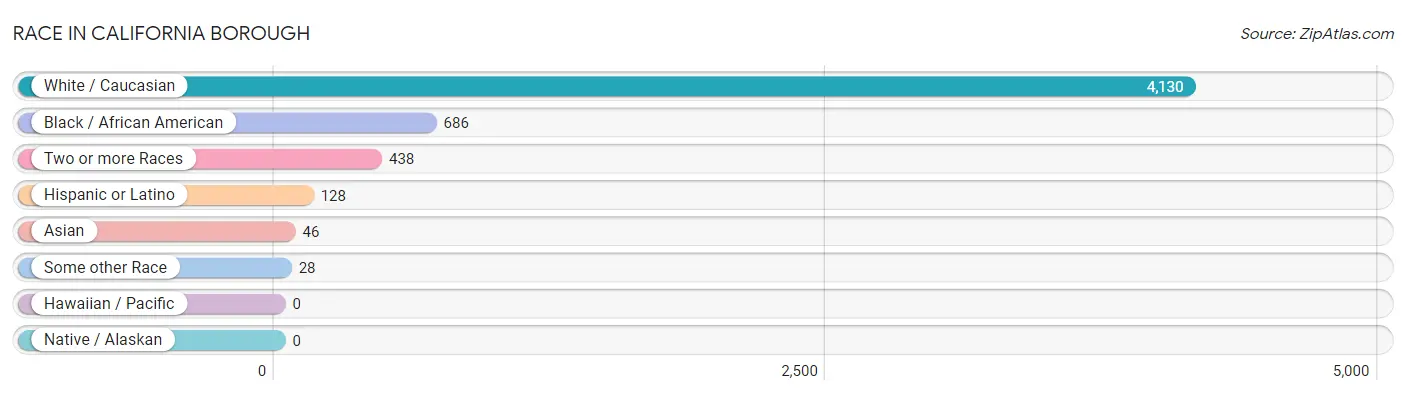
Race in California borough
The most populous races in California borough are White / Caucasian (4,130 | 77.5%), Black / African American (686 | 12.9%), and Two or more Races (438 | 8.2%).
| Race | # Population | % Population |
| Asian | 46 | 0.9% |
| Black / African American | 686 | 12.9% |
| Hawaiian / Pacific | 0 | 0.0% |
| Hispanic or Latino | 128 | 2.4% |
| Native / Alaskan | 0 | 0.0% |
| White / Caucasian | 4,130 | 77.5% |
| Two or more Races | 438 | 8.2% |
| Some other Race | 28 | 0.5% |
| Total | 5,328 | 100.0% |
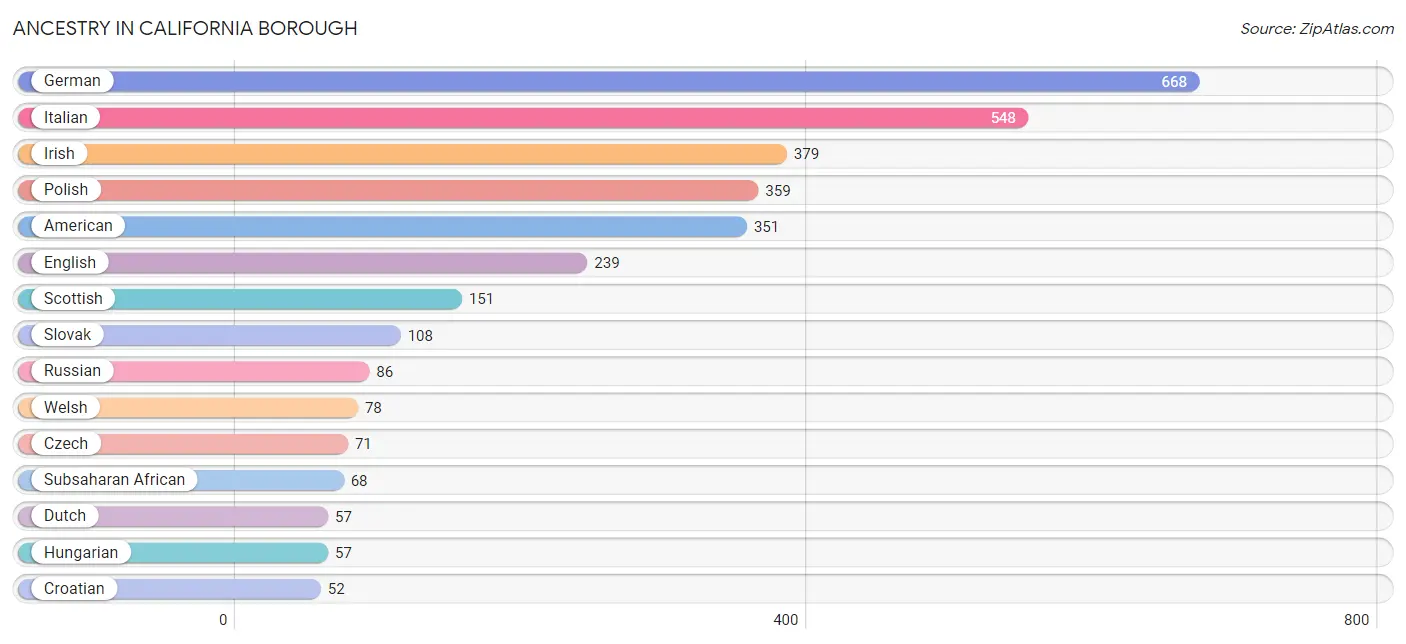
Ancestry in California borough
The most populous ancestries reported in California borough are German (668 | 12.5%), Italian (548 | 10.3%), Irish (379 | 7.1%), Polish (359 | 6.7%), and American (351 | 6.6%), together accounting for 43.3% of all California borough residents.
| Ancestry | # Population | % Population |
| African | 23 | 0.4% |
| American | 351 | 6.6% |
| Arab | 18 | 0.3% |
| Austrian | 10 | 0.2% |
| Belgian | 4 | 0.1% |
| British | 32 | 0.6% |
| British West Indian | 1 | 0.0% |
| Cajun | 12 | 0.2% |
| Cambodian | 8 | 0.2% |
| Canadian | 8 | 0.2% |
| Central American | 32 | 0.6% |
| Cherokee | 19 | 0.4% |
| Croatian | 52 | 1.0% |
| Cuban | 9 | 0.2% |
| Czech | 71 | 1.3% |
| Delaware | 4 | 0.1% |
| Dominican | 5 | 0.1% |
| Dutch | 57 | 1.1% |
| English | 239 | 4.5% |
| Ethiopian | 13 | 0.2% |
| European | 13 | 0.2% |
| Finnish | 32 | 0.6% |
| French | 47 | 0.9% |
| German | 668 | 12.5% |
| Greek | 29 | 0.5% |
| Guatemalan | 32 | 0.6% |
| Guyanese | 11 | 0.2% |
| Hungarian | 57 | 1.1% |
| Indian (Asian) | 29 | 0.5% |
| Irish | 379 | 7.1% |
| Italian | 548 | 10.3% |
| Jamaican | 19 | 0.4% |
| Korean | 25 | 0.5% |
| Liberian | 5 | 0.1% |
| Lithuanian | 21 | 0.4% |
| Mexican | 52 | 1.0% |
| Navajo | 3 | 0.1% |
| Norwegian | 30 | 0.6% |
| Polish | 359 | 6.7% |
| Puerto Rican | 22 | 0.4% |
| Russian | 86 | 1.6% |
| Scotch-Irish | 43 | 0.8% |
| Scottish | 151 | 2.8% |
| Serbian | 4 | 0.1% |
| Slovak | 108 | 2.0% |
| Spanish | 8 | 0.2% |
| Sri Lankan | 13 | 0.2% |
| Subsaharan African | 68 | 1.3% |
| Swedish | 7 | 0.1% |
| Swiss | 23 | 0.4% |
| Syrian | 18 | 0.3% |
| Thai | 8 | 0.2% |
| Turkish | 1 | 0.0% |
| Ukrainian | 38 | 0.7% |
| Welsh | 78 | 1.5% | View All 55 Rows |
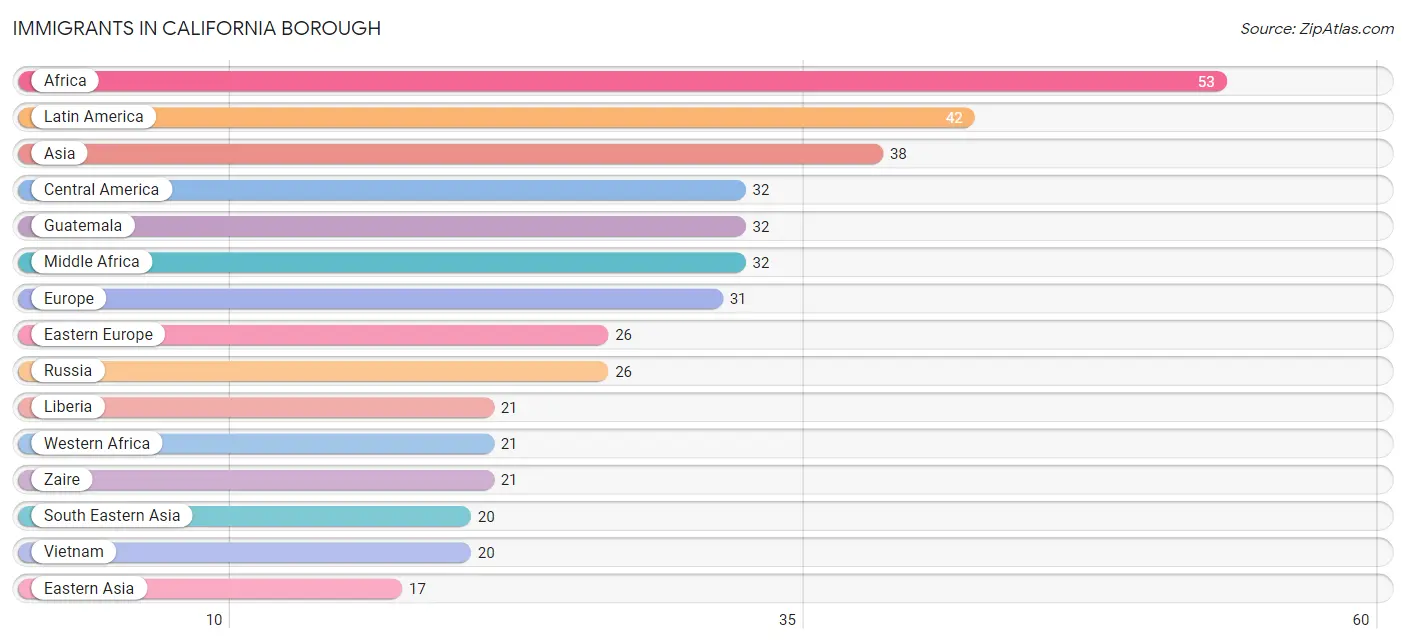
Immigrants in California borough
The most numerous immigrant groups reported in California borough came from Africa (53 | 1.0%), Latin America (42 | 0.8%), Asia (38 | 0.7%), Central America (32 | 0.6%), and Guatemala (32 | 0.6%), together accounting for 3.7% of all California borough residents.
| Immigration Origin | # Population | % Population |
| Africa | 53 | 1.0% |
| Asia | 38 | 0.7% |
| Caribbean | 10 | 0.2% |
| Central America | 32 | 0.6% |
| China | 9 | 0.2% |
| Eastern Asia | 17 | 0.3% |
| Eastern Europe | 26 | 0.5% |
| Europe | 31 | 0.6% |
| Guatemala | 32 | 0.6% |
| Jamaica | 10 | 0.2% |
| Latin America | 42 | 0.8% |
| Liberia | 21 | 0.4% |
| Middle Africa | 32 | 0.6% |
| Netherlands | 5 | 0.1% |
| Russia | 26 | 0.5% |
| South Eastern Asia | 20 | 0.4% |
| Turkey | 1 | 0.0% |
| Vietnam | 20 | 0.4% |
| Western Africa | 21 | 0.4% |
| Western Asia | 1 | 0.0% |
| Western Europe | 5 | 0.1% |
| Zaire | 21 | 0.4% | View All 22 Rows |
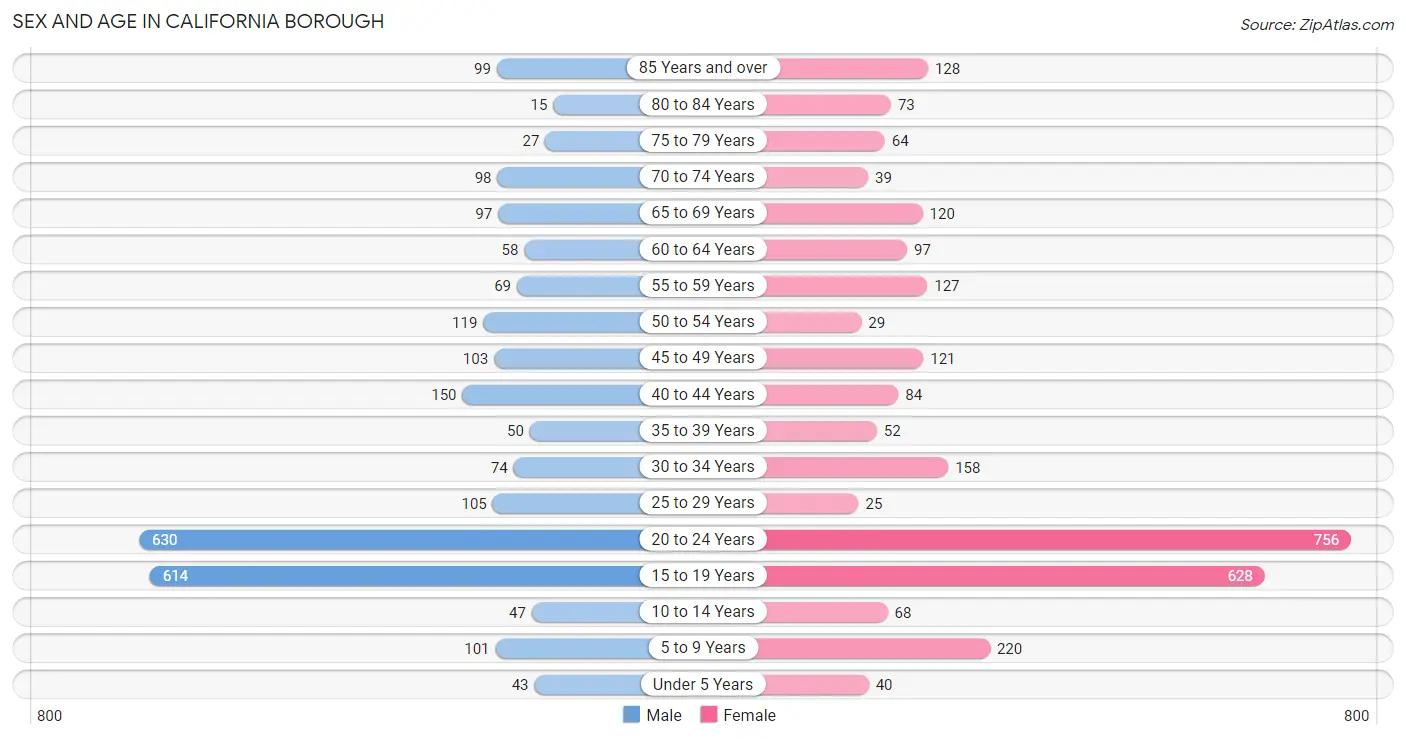
Sex and Age in California borough
Sex and Age in California borough
The most populous age groups in California borough are 20 to 24 Years (630 | 25.2%) for men and 20 to 24 Years (756 | 26.7%) for women.
| Age Bracket | Male | Female |
| Under 5 Years | 43 (1.7%) | 40 (1.4%) |
| 5 to 9 Years | 101 (4.0%) | 220 (7.8%) |
| 10 to 14 Years | 47 (1.9%) | 68 (2.4%) |
| 15 to 19 Years | 614 (24.6%) | 628 (22.2%) |
| 20 to 24 Years | 630 (25.2%) | 756 (26.7%) |
| 25 to 29 Years | 105 (4.2%) | 25 (0.9%) |
| 30 to 34 Years | 74 (3.0%) | 158 (5.6%) |
| 35 to 39 Years | 50 (2.0%) | 52 (1.8%) |
| 40 to 44 Years | 150 (6.0%) | 84 (3.0%) |
| 45 to 49 Years | 103 (4.1%) | 121 (4.3%) |
| 50 to 54 Years | 119 (4.8%) | 29 (1.0%) |
| 55 to 59 Years | 69 (2.8%) | 127 (4.5%) |
| 60 to 64 Years | 58 (2.3%) | 97 (3.4%) |
| 65 to 69 Years | 97 (3.9%) | 120 (4.2%) |
| 70 to 74 Years | 98 (3.9%) | 39 (1.4%) |
| 75 to 79 Years | 27 (1.1%) | 64 (2.3%) |
| 80 to 84 Years | 15 (0.6%) | 73 (2.6%) |
| 85 Years and over | 99 (4.0%) | 128 (4.5%) |
| Total | 2,499 (100.0%) | 2,829 (100.0%) |
Families and Households in California borough
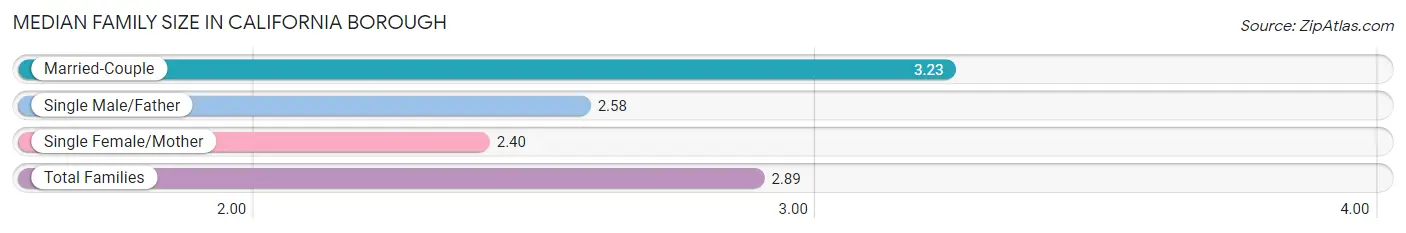
Median Family Size in California borough
The median family size in California borough is 2.89 persons per family, with married-couple families (464 | 58.4%) accounting for the largest median family size of 3.23 persons per family. On the other hand, single female/mother families (307 | 38.6%) represent the smallest median family size with 2.40 persons per family.
| Family Type | # Families | Family Size |
| Married-Couple | 464 (58.4%) | 3.23 |
| Single Male/Father | 24 (3.0%) | 2.58 |
| Single Female/Mother | 307 (38.6%) | 2.40 |
| Total Families | 795 (100.0%) | 2.89 |
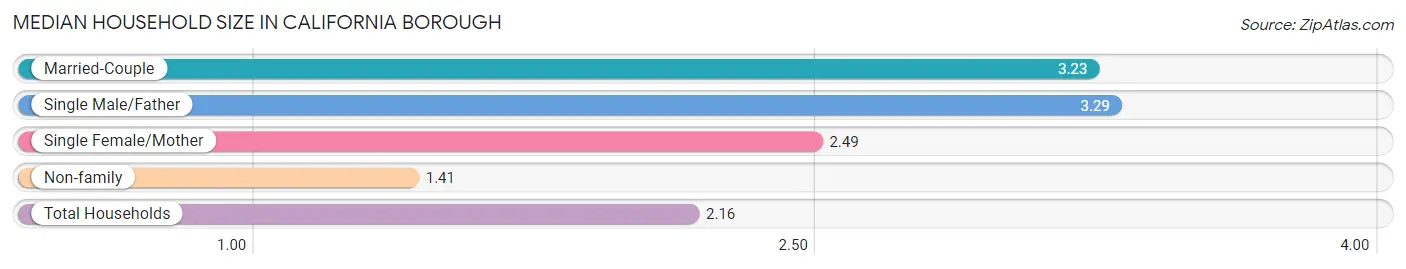
Median Household Size in California borough
The median household size in California borough is 2.16 persons per household, with single male/father households (24 | 1.5%) accounting for the largest median household size of 3.29 persons per household. non-family households (839 | 51.3%) represent the smallest median household size with 1.41 persons per household.
| Household Type | # Households | Household Size |
| Married-Couple | 464 (28.4%) | 3.23 |
| Single Male/Father | 24 (1.5%) | 3.29 |
| Single Female/Mother | 307 (18.8%) | 2.49 |
| Non-family | 839 (51.3%) | 1.41 |
| Total Households | 1,634 (100.0%) | 2.16 |
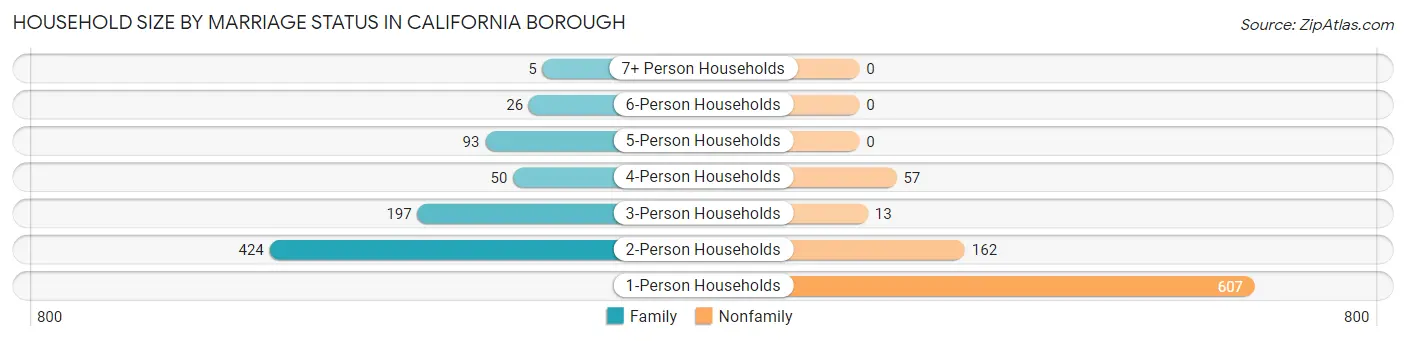
Household Size by Marriage Status in California borough
Out of a total of 1,634 households in California borough, 795 (48.6%) are family households, while 839 (51.3%) are nonfamily households. The most numerous type of family households are 2-person households, comprising 424, and the most common type of nonfamily households are 1-person households, comprising 607.
| Household Size | Family Households | Nonfamily Households |
| 1-Person Households | - | 607 (37.1%) |
| 2-Person Households | 424 (26.0%) | 162 (9.9%) |
| 3-Person Households | 197 (12.1%) | 13 (0.8%) |
| 4-Person Households | 50 (3.1%) | 57 (3.5%) |
| 5-Person Households | 93 (5.7%) | 0 (0.0%) |
| 6-Person Households | 26 (1.6%) | 0 (0.0%) |
| 7+ Person Households | 5 (0.3%) | 0 (0.0%) |
| Total | 795 (48.6%) | 839 (51.3%) |
Female Fertility in California borough
Fertility by Age in California borough
| Age Bracket | Women with Births | Births / 1,000 Women |
| 15 to 19 years | 0 (0.0%) | 0.0 |
| 20 to 34 years | 0 (0.0%) | 0.0 |
| 35 to 50 years | 0 (0.0%) | 0.0 |
| Total | 0 (0.0%) | 0.0 |
Fertility by Age by Marriage Status in California borough
| Age Bracket | Married | Unmarried |
| 15 to 19 years | 0 (0.0%) | 0 (0.0%) |
| 20 to 34 years | 0 (0.0%) | 0 (0.0%) |
| 35 to 50 years | 0 (0.0%) | 0 (0.0%) |
| Total | 0 (0.0%) | 0 (0.0%) |
Fertility by Education in California borough
| Educational Attainment | Women with Births | Births / 1,000 Women |
| Less than High School | 0 (0.0%) | 0.0 |
| High School Diploma | 0 (0.0%) | 0.0 |
| College or Associate's Degree | 0 (0.0%) | 0.0 |
| Bachelor's Degree | 0 (0.0%) | 0.0 |
| Graduate Degree | 0 (0.0%) | 0.0 |
| Total | 0 (0.0%) | 0.0 |
Fertility by Education by Marriage Status in California borough
| Educational Attainment | Married | Unmarried |
| Less than High School | 0 (0.0%) | 0 (0.0%) |
| High School Diploma | 0 (0.0%) | 0 (0.0%) |
| College or Associate's Degree | 0 (0.0%) | 0 (0.0%) |
| Bachelor's Degree | 0 (0.0%) | 0 (0.0%) |
| Graduate Degree | 0 (0.0%) | 0 (0.0%) |
| Total | 0 (0.0%) | 0 (0.0%) |
Income in California borough
Income Overview in California borough
Per Capita Income in California borough is $21,658, while median incomes of families and households are $76,103 and $46,471 respectively.
| Characteristic | Number | Measure |
| Per Capita Income | 5,328 | $21,658 |
| Median Family Income | 795 | $76,103 |
| Mean Family Income | 795 | $85,871 |
| Median Household Income | 1,634 | $46,471 |
| Mean Household Income | 1,634 | $63,006 |
| Income Deficit | 795 | $0 |
| Wage / Income Gap (%) | 5,328 | 5.63% |
| Wage / Income Gap ($) | 5,328 | 94.37¢ per $1 |
| Gini / Inequality Index | 5,328 | 0.45 |
Earnings by Sex in California borough
Average Earnings in California borough are $10,461, $10,082 for men and $10,683 for women, a difference of 5.6%.
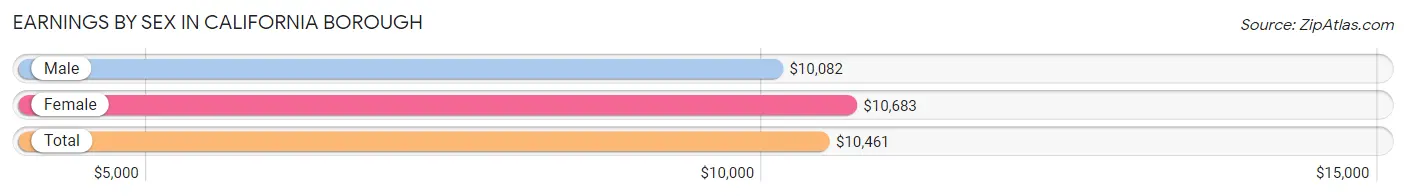
| Sex | Number | Average Earnings |
| Male | 1,549 (48.8%) | $10,082 |
| Female | 1,623 (51.2%) | $10,683 |
| Total | 3,172 (100.0%) | $10,461 |
Earnings by Sex by Income Bracket in California borough
The most common earnings brackets in California borough are $2,499 or less for men (354 | 22.9%) and $2,499 or less for women (262 | 16.1%).
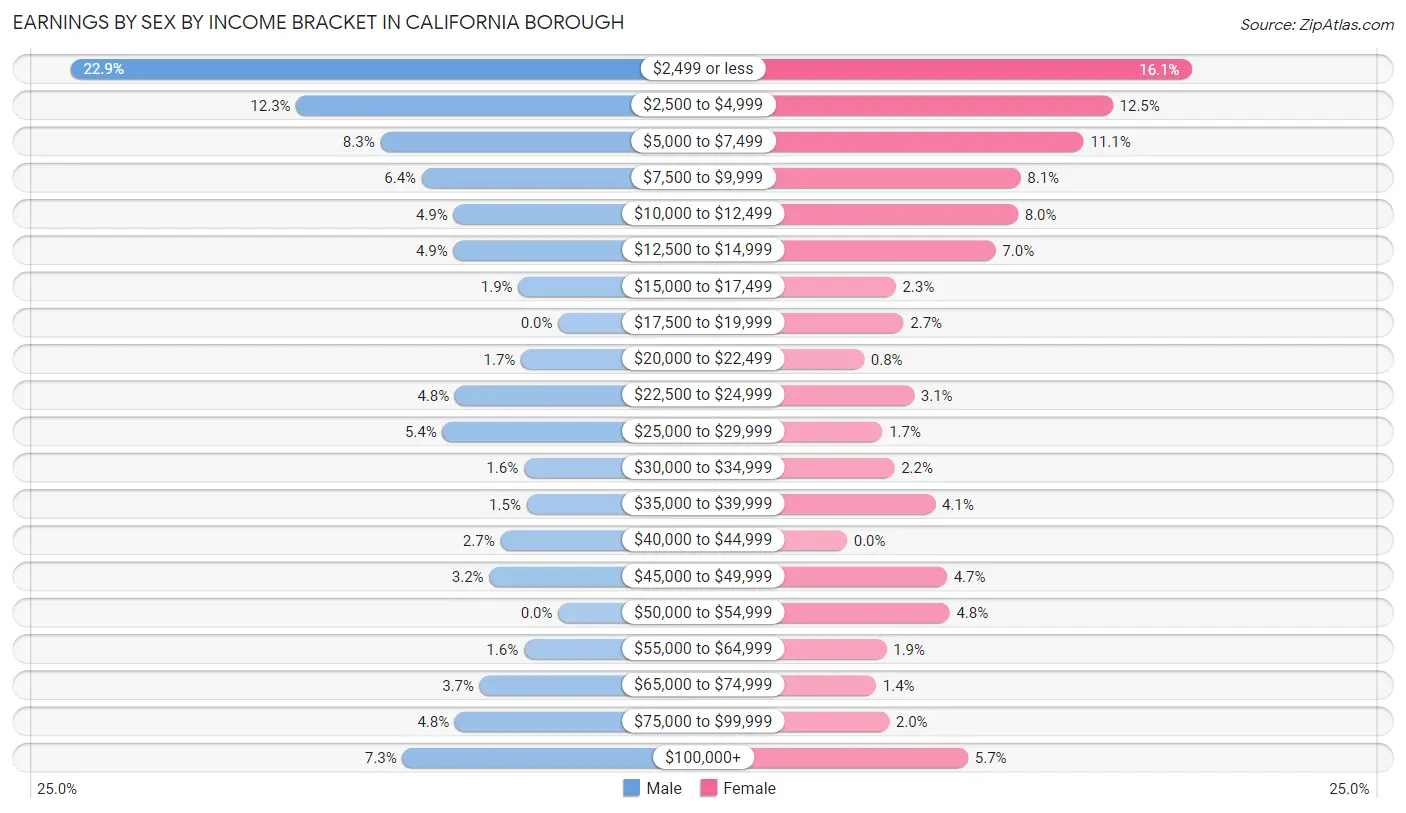
| Income | Male | Female |
| $2,499 or less | 354 (22.9%) | 262 (16.1%) |
| $2,500 to $4,999 | 190 (12.3%) | 202 (12.4%) |
| $5,000 to $7,499 | 129 (8.3%) | 180 (11.1%) |
| $7,500 to $9,999 | 99 (6.4%) | 132 (8.1%) |
| $10,000 to $12,499 | 76 (4.9%) | 130 (8.0%) |
| $12,500 to $14,999 | 76 (4.9%) | 113 (7.0%) |
| $15,000 to $17,499 | 29 (1.9%) | 37 (2.3%) |
| $17,500 to $19,999 | 0 (0.0%) | 43 (2.6%) |
| $20,000 to $22,499 | 27 (1.7%) | 13 (0.8%) |
| $22,500 to $24,999 | 75 (4.8%) | 51 (3.1%) |
| $25,000 to $29,999 | 84 (5.4%) | 27 (1.7%) |
| $30,000 to $34,999 | 25 (1.6%) | 36 (2.2%) |
| $35,000 to $39,999 | 23 (1.5%) | 67 (4.1%) |
| $40,000 to $44,999 | 42 (2.7%) | 0 (0.0%) |
| $45,000 to $49,999 | 50 (3.2%) | 76 (4.7%) |
| $50,000 to $54,999 | 0 (0.0%) | 78 (4.8%) |
| $55,000 to $64,999 | 25 (1.6%) | 30 (1.8%) |
| $65,000 to $74,999 | 57 (3.7%) | 22 (1.4%) |
| $75,000 to $99,999 | 75 (4.8%) | 32 (2.0%) |
| $100,000+ | 113 (7.3%) | 92 (5.7%) |
| Total | 1,549 (100.0%) | 1,623 (100.0%) |
Earnings by Sex by Educational Attainment in California borough
Average earnings in California borough are $45,625 for men and $49,042 for women, a difference of 7.0%. Men with an educational attainment of bachelor's degree enjoy the highest average annual earnings of $69,625, while those with high school diploma education earn the least with $33,250. Women with an educational attainment of graduate degree earn the most with the average annual earnings of $100,135, while those with less than high school education have the smallest earnings of $19,191.
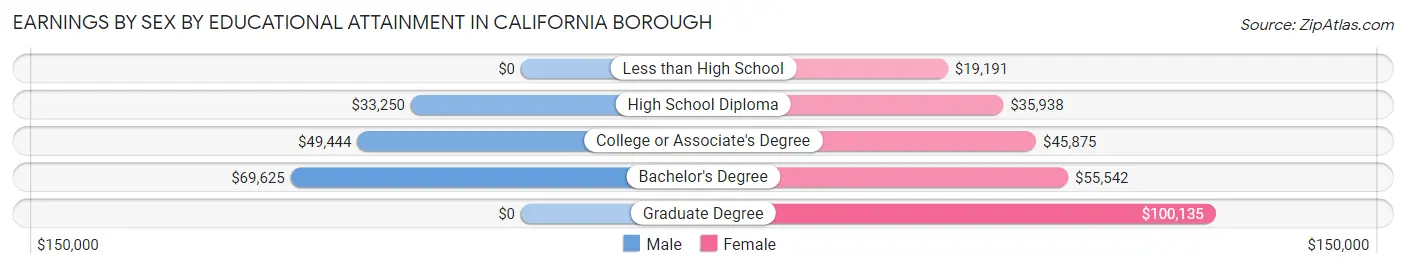
| Educational Attainment | Male Income | Female Income |
| Less than High School | - | - |
| High School Diploma | $33,250 | $35,938 |
| College or Associate's Degree | $49,444 | $45,875 |
| Bachelor's Degree | $69,625 | $55,542 |
| Graduate Degree | - | - |
| Total | $45,625 | $49,042 |
Family Income in California borough
Family Income Brackets in California borough
According to the California borough family income data, there are 163 families falling into the $75,000 to $99,999 income range, which is the most common income bracket and makes up 20.5% of all families. Conversely, the less than $10,000 income bracket is the least frequent group with only 8 families (1.0%) belonging to this category.
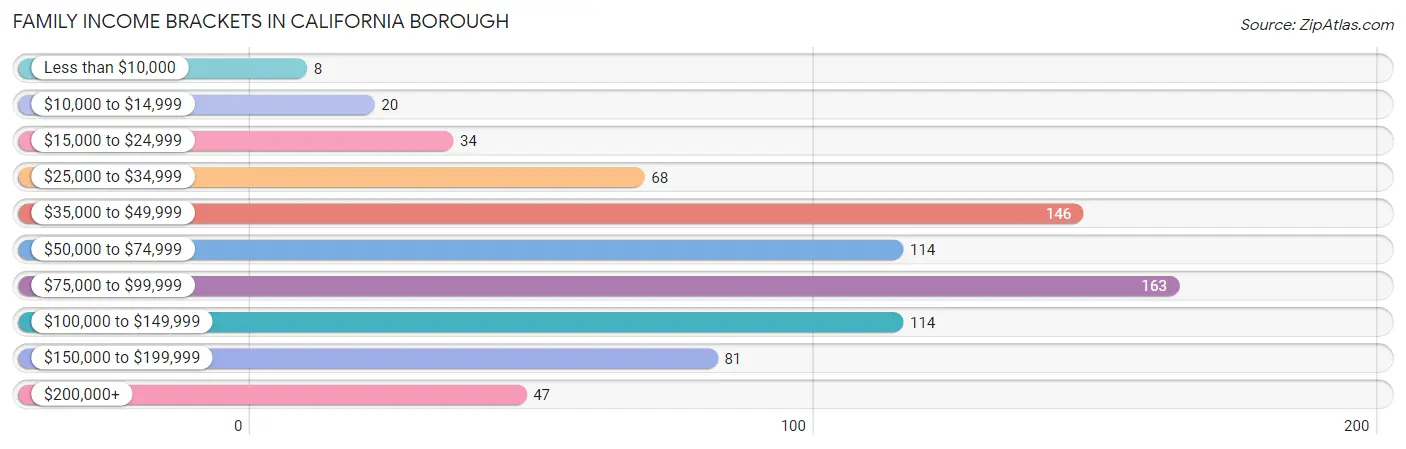
| Income Bracket | # Families | % Families |
| Less than $10,000 | 8 | 1.0% |
| $10,000 to $14,999 | 20 | 2.5% |
| $15,000 to $24,999 | 34 | 4.3% |
| $25,000 to $34,999 | 68 | 8.6% |
| $35,000 to $49,999 | 146 | 18.4% |
| $50,000 to $74,999 | 114 | 14.3% |
| $75,000 to $99,999 | 163 | 20.5% |
| $100,000 to $149,999 | 114 | 14.3% |
| $150,000 to $199,999 | 81 | 10.2% |
| $200,000+ | 47 | 5.9% |
Family Income by Famaliy Size in California borough
4-person families (57 | 7.2%) account for the highest median family income in California borough with $205,170 per family, while 4-person families (57 | 7.2%) have the highest median income of $51,292 per family member.
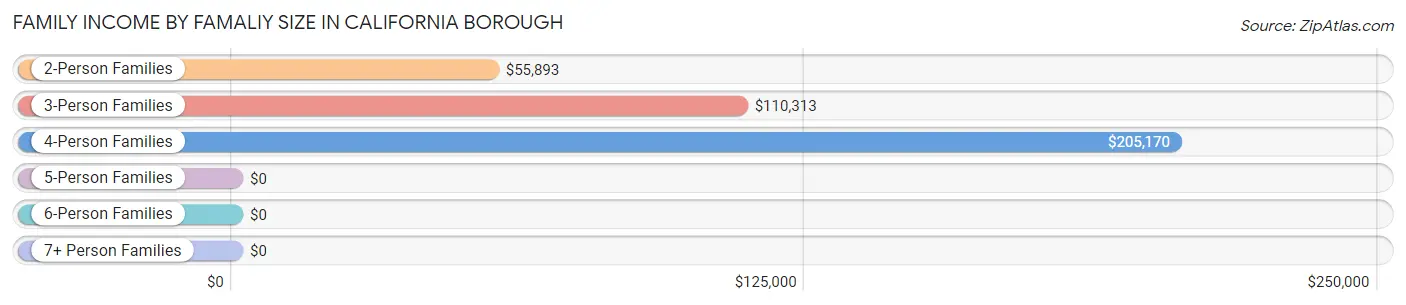
| Income Bracket | # Families | Median Income |
| 2-Person Families | 437 (55.0%) | $55,893 |
| 3-Person Families | 184 (23.1%) | $110,313 |
| 4-Person Families | 57 (7.2%) | $205,170 |
| 5-Person Families | 104 (13.1%) | $0 |
| 6-Person Families | 8 (1.0%) | $0 |
| 7+ Person Families | 5 (0.6%) | $0 |
| Total | 795 (100.0%) | $76,103 |
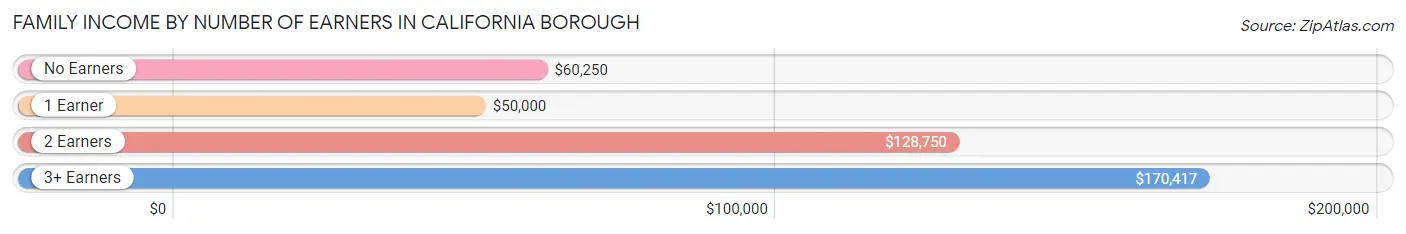
Family Income by Number of Earners in California borough
The median family income in California borough is $76,103, with families comprising 3+ earners (64) having the highest median family income of $170,417, while families with 1 earner (364) have the lowest median family income of $50,000, accounting for 8.1% and 45.8% of families, respectively.
| Number of Earners | # Families | Median Income |
| No Earners | 191 (24.0%) | $60,250 |
| 1 Earner | 364 (45.8%) | $50,000 |
| 2 Earners | 176 (22.1%) | $128,750 |
| 3+ Earners | 64 (8.1%) | $170,417 |
| Total | 795 (100.0%) | $76,103 |
Household Income in California borough
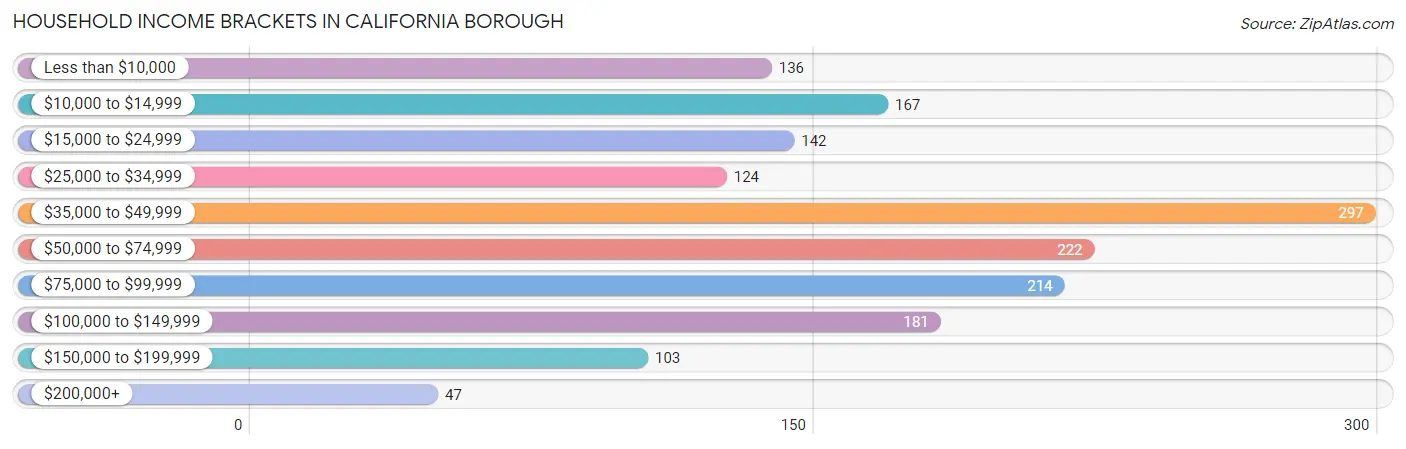
Household Income Brackets in California borough
With 297 households falling in the category, the $35,000 to $49,999 income range is the most frequent in California borough, accounting for 18.2% of all households. In contrast, only 47 households (2.9%) fall into the $200,000+ income bracket, making it the least populous group.
| Income Bracket | # Households | % Households |
| Less than $10,000 | 136 | 8.3% |
| $10,000 to $14,999 | 167 | 10.2% |
| $15,000 to $24,999 | 142 | 8.7% |
| $25,000 to $34,999 | 124 | 7.6% |
| $35,000 to $49,999 | 297 | 18.2% |
| $50,000 to $74,999 | 222 | 13.6% |
| $75,000 to $99,999 | 214 | 13.1% |
| $100,000 to $149,999 | 181 | 11.1% |
| $150,000 to $199,999 | 103 | 6.3% |
| $200,000+ | 47 | 2.9% |
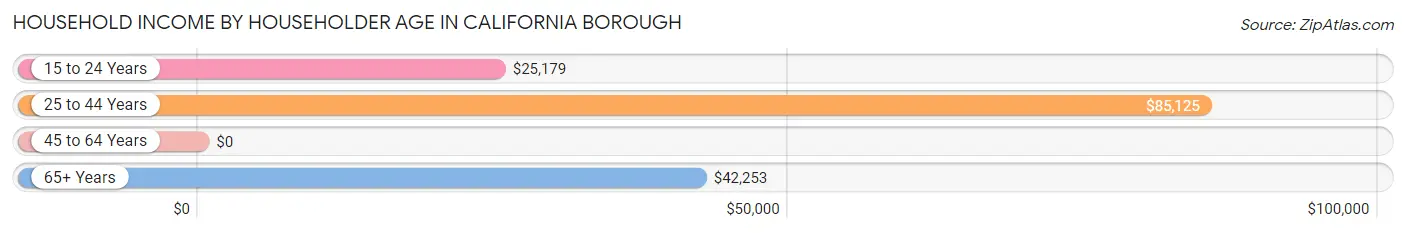
Household Income by Householder Age in California borough
The median household income in California borough is $46,471, with the highest median household income of $85,125 found in the 25 to 44 years age bracket for the primary householder. A total of 361 households (22.1%) fall into this category. Meanwhile, the 45 to 64 years age bracket for the primary householder has the lowest median household income of $0, with 450 households (27.5%) in this group.
| Income Bracket | # Households | Median Income |
| 15 to 24 Years | 260 (15.9%) | $25,179 |
| 25 to 44 Years | 361 (22.1%) | $85,125 |
| 45 to 64 Years | 450 (27.5%) | $0 |
| 65+ Years | 563 (34.5%) | $42,253 |
| Total | 1,634 (100.0%) | $46,471 |
Poverty in California borough
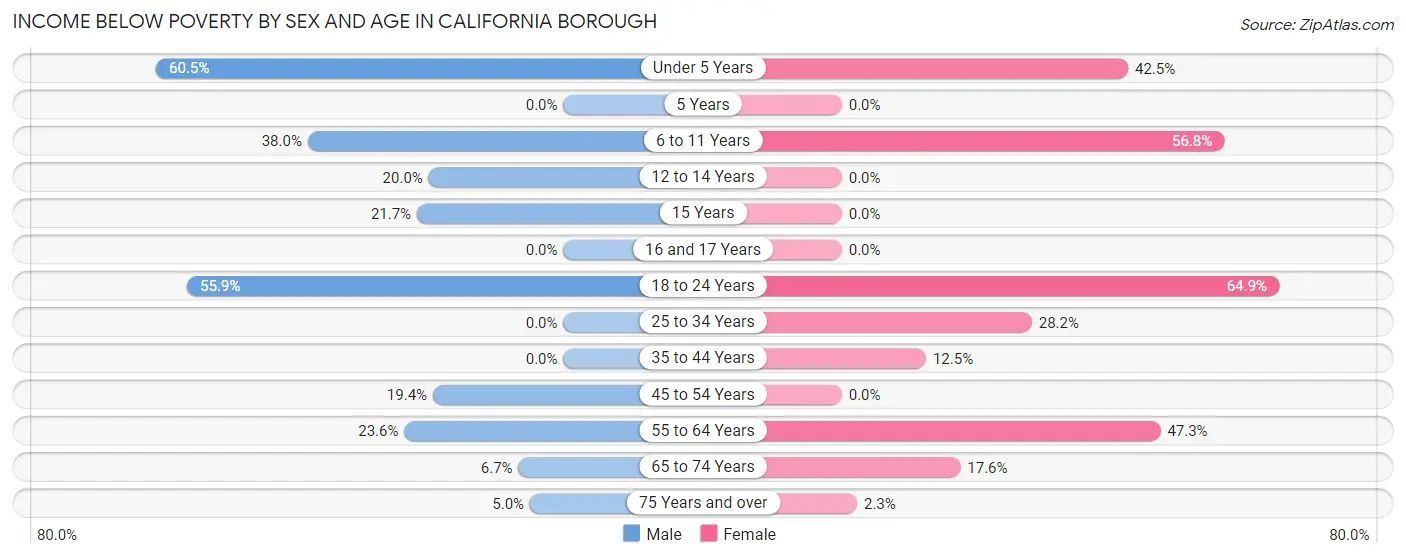
Income Below Poverty by Sex and Age in California borough
With 21.1% poverty level for males and 31.9% for females among the residents of California borough, under 5 year old males and 18 to 24 year old females are the most vulnerable to poverty, with 26 males (60.5%) and 270 females (64.9%) in their respective age groups living below the poverty level.
| Age Bracket | Male | Female |
| Under 5 Years | 26 (60.5%) | 17 (42.5%) |
| 5 Years | 0 (0.0%) | 0 (0.0%) |
| 6 to 11 Years | 41 (38.0%) | 126 (56.8%) |
| 12 to 14 Years | 8 (20.0%) | 0 (0.0%) |
| 15 Years | 10 (21.7%) | 0 (0.0%) |
| 16 and 17 Years | 0 (0.0%) | 0 (0.0%) |
| 18 to 24 Years | 162 (55.9%) | 270 (64.9%) |
| 25 to 34 Years | 0 (0.0%) | 44 (28.2%) |
| 35 to 44 Years | 0 (0.0%) | 17 (12.5%) |
| 45 to 54 Years | 43 (19.4%) | 0 (0.0%) |
| 55 to 64 Years | 30 (23.6%) | 106 (47.3%) |
| 65 to 74 Years | 13 (6.7%) | 28 (17.6%) |
| 75 Years and over | 7 (5.0%) | 6 (2.3%) |
| Total | 340 (21.1%) | 614 (31.9%) |
Income Above Poverty by Sex and Age in California borough
According to the poverty statistics in California borough, males aged 16 and 17 years and females aged 5 years are the age groups that are most secure financially, with 100.0% of males and 100.0% of females in these age groups living above the poverty line.
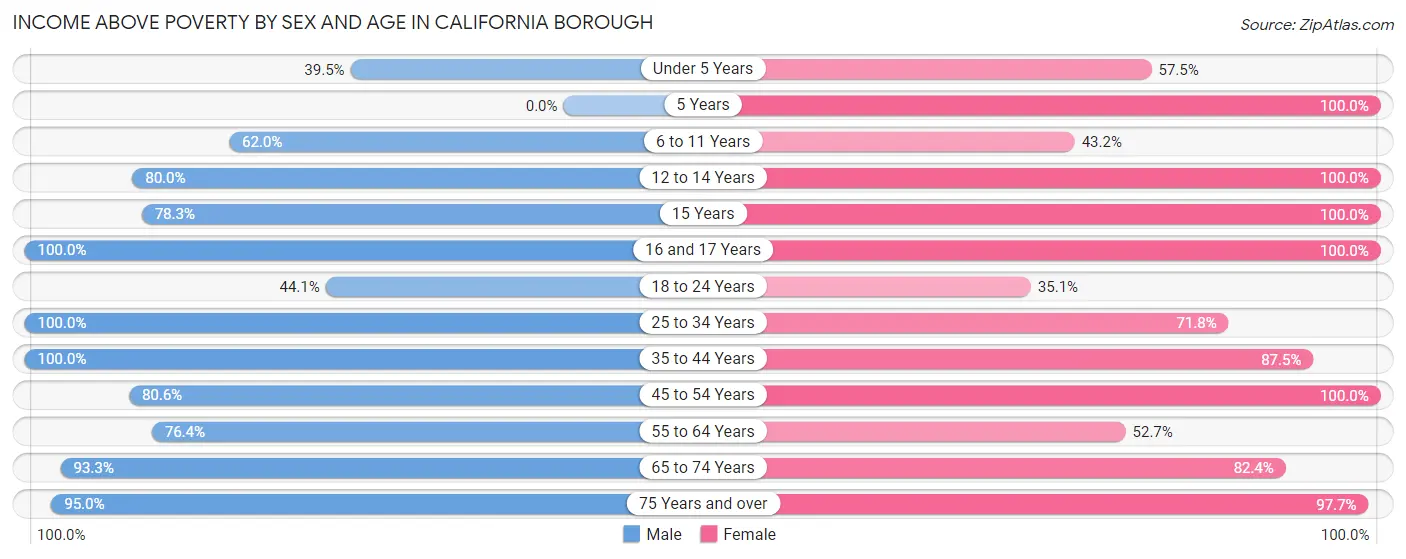
| Age Bracket | Male | Female |
| Under 5 Years | 17 (39.5%) | 23 (57.5%) |
| 5 Years | 0 (0.0%) | 14 (100.0%) |
| 6 to 11 Years | 67 (62.0%) | 96 (43.2%) |
| 12 to 14 Years | 32 (80.0%) | 52 (100.0%) |
| 15 Years | 36 (78.3%) | 27 (100.0%) |
| 16 and 17 Years | 41 (100.0%) | 62 (100.0%) |
| 18 to 24 Years | 128 (44.1%) | 146 (35.1%) |
| 25 to 34 Years | 159 (100.0%) | 112 (71.8%) |
| 35 to 44 Years | 200 (100.0%) | 119 (87.5%) |
| 45 to 54 Years | 179 (80.6%) | 150 (100.0%) |
| 55 to 64 Years | 97 (76.4%) | 118 (52.7%) |
| 65 to 74 Years | 182 (93.3%) | 131 (82.4%) |
| 75 Years and over | 134 (95.0%) | 259 (97.7%) |
| Total | 1,272 (78.9%) | 1,309 (68.1%) |
Income Below Poverty Among Married-Couple Families in California borough
The poverty statistics for married-couple families in California borough show that 7.3% or 34 of the total 464 families live below the poverty line. Families with 3 or 4 children have the highest poverty rate of 45.3%, comprising of 34 families. On the other hand, families with no children have the lowest poverty rate of 0.0%, which includes 0 families.
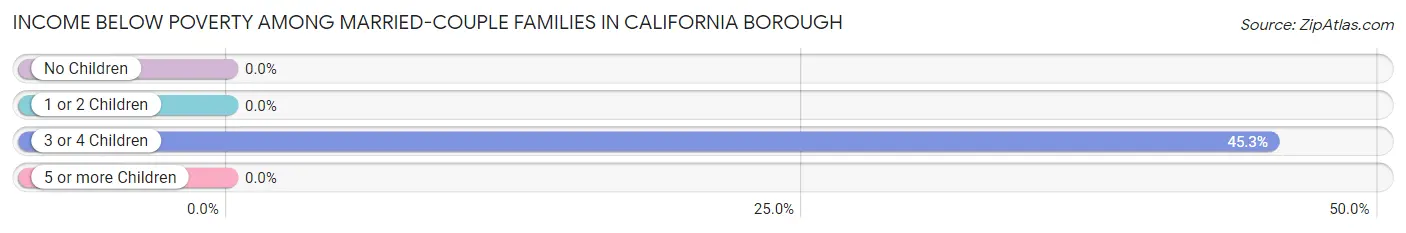
| Children | Above Poverty | Below Poverty |
| No Children | 255 (100.0%) | 0 (0.0%) |
| 1 or 2 Children | 134 (100.0%) | 0 (0.0%) |
| 3 or 4 Children | 41 (54.7%) | 34 (45.3%) |
| 5 or more Children | 0 (0.0%) | 0 (0.0%) |
| Total | 430 (92.7%) | 34 (7.3%) |
Income Below Poverty Among Single-Parent Households in California borough
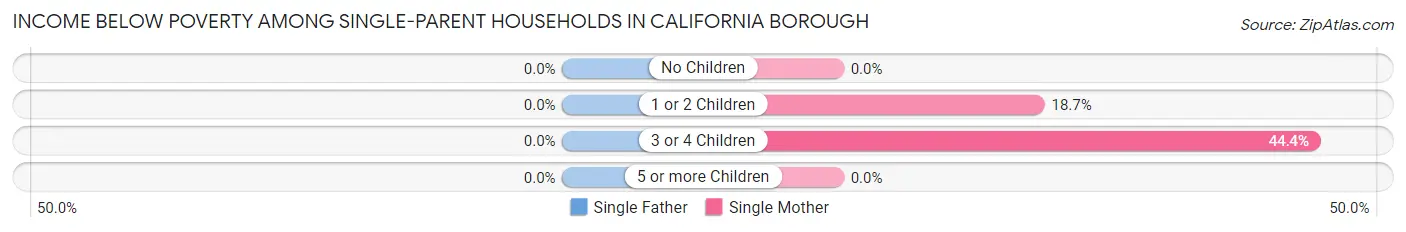
| Children | Single Father | Single Mother |
| No Children | 0 (0.0%) | 0 (0.0%) |
| 1 or 2 Children | 0 (0.0%) | 29 (18.7%) |
| 3 or 4 Children | 0 (0.0%) | 8 (44.4%) |
| 5 or more Children | 0 (0.0%) | 0 (0.0%) |
| Total | 0 (0.0%) | 37 (12.0%) |
Income Below Poverty Among Married-Couple vs Single-Parent Households in California borough
The poverty data for California borough shows that 34 of the married-couple family households (7.3%) and 37 of the single-parent households (11.2%) are living below the poverty level. Within the married-couple family households, those with 3 or 4 children have the highest poverty rate, with 34 households (45.3%) falling below the poverty line. Among the single-parent households, those with 3 or 4 children have the highest poverty rate, with 8 household (44.4%) living below poverty.
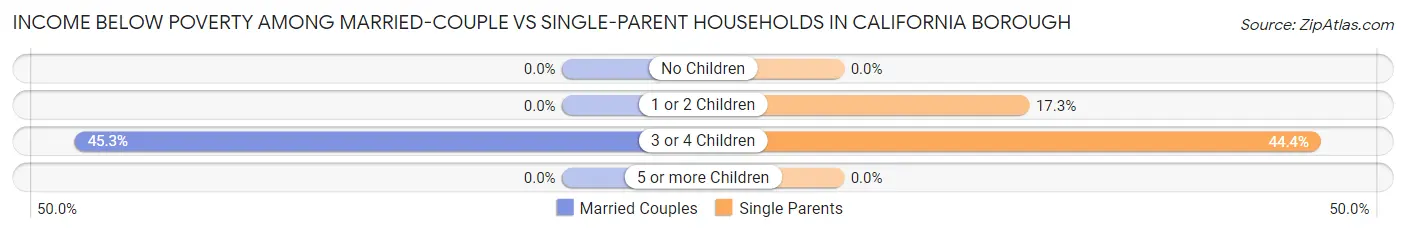
| Children | Married-Couple Families | Single-Parent Households |
| No Children | 0 (0.0%) | 0 (0.0%) |
| 1 or 2 Children | 0 (0.0%) | 29 (17.3%) |
| 3 or 4 Children | 34 (45.3%) | 8 (44.4%) |
| 5 or more Children | 0 (0.0%) | 0 (0.0%) |
| Total | 34 (7.3%) | 37 (11.2%) |
Employment Characteristics in California borough
Employment by Class of Employer in California borough
Among the 2,422 employed individuals in California borough, private company employees (1,421 | 58.7%), not-for-profit organizations (701 | 28.9%), and self-employed (incorporated) (103 | 4.3%) make up the most common classes of employment.
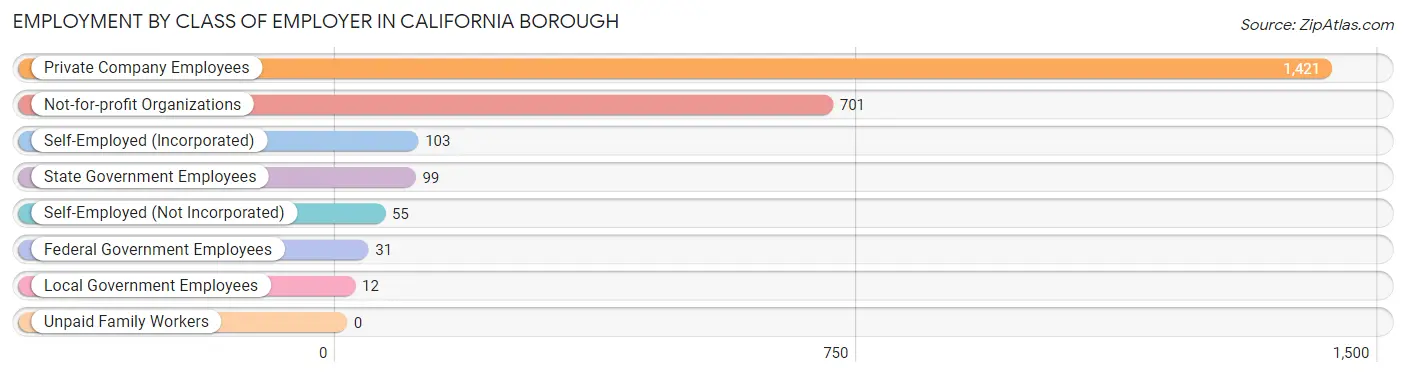
| Employer Class | # Employees | % Employees |
| Private Company Employees | 1,421 | 58.7% |
| Self-Employed (Incorporated) | 103 | 4.3% |
| Self-Employed (Not Incorporated) | 55 | 2.3% |
| Not-for-profit Organizations | 701 | 28.9% |
| Local Government Employees | 12 | 0.5% |
| State Government Employees | 99 | 4.1% |
| Federal Government Employees | 31 | 1.3% |
| Unpaid Family Workers | 0 | 0.0% |
| Total | 2,422 | 100.0% |
Employment Status by Age in California borough
According to the labor force statistics for California borough, out of the total population over 16 years of age (4,736), 59.6% or 2,823 individuals are in the labor force, with 10.2% or 288 of them unemployed. The age group with the highest labor force participation rate is 30 to 34 years, with 92.7% or 215 individuals in the labor force. Within the labor force, the 75 years and over age range has the highest percentage of unemployed individuals, with 100.0% or 3 of them being unemployed.
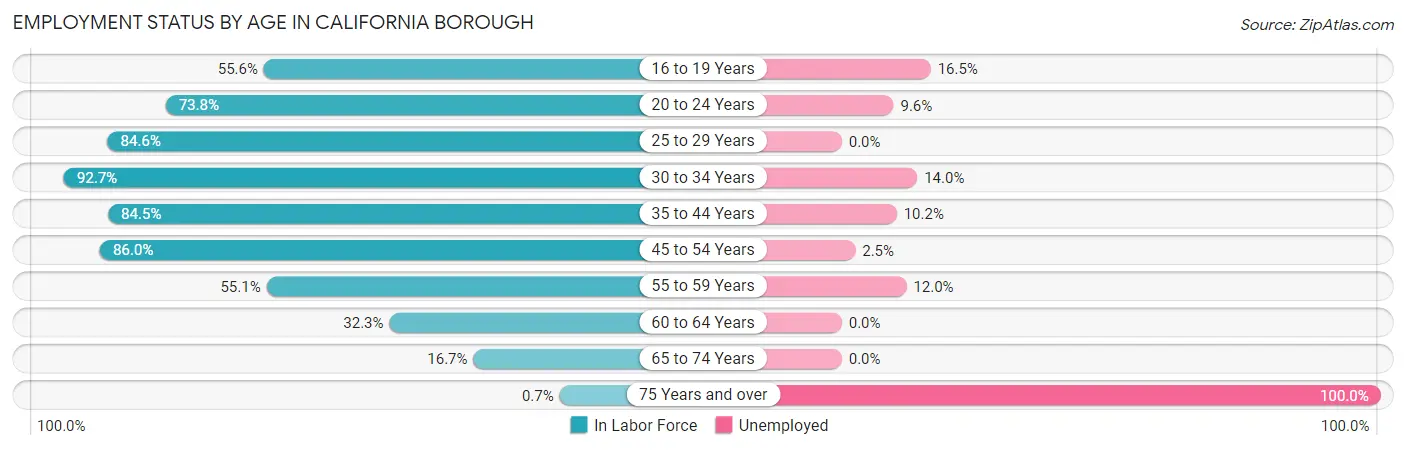
| Age Bracket | In Labor Force | Unemployed |
| 16 to 19 Years | 650 (55.6%) | 107 (16.5%) |
| 20 to 24 Years | 1,023 (73.8%) | 98 (9.6%) |
| 25 to 29 Years | 110 (84.6%) | 0 (0.0%) |
| 30 to 34 Years | 215 (92.7%) | 30 (14.0%) |
| 35 to 44 Years | 284 (84.5%) | 29 (10.2%) |
| 45 to 54 Years | 320 (86.0%) | 8 (2.5%) |
| 55 to 59 Years | 108 (55.1%) | 13 (12.0%) |
| 60 to 64 Years | 50 (32.3%) | 0 (0.0%) |
| 65 to 74 Years | 59 (16.7%) | 0 (0.0%) |
| 75 Years and over | 3 (0.7%) | 3 (100.0%) |
| Total | 2,823 (59.6%) | 288 (10.2%) |
Employment Status by Educational Attainment in California borough
According to labor force statistics for California borough, 76.5% of individuals (1,087) out of the total population between 25 and 64 years of age (1,421) are in the labor force, with 7.4% or 80 of them being unemployed. The group with the highest labor force participation rate are those with the educational attainment of bachelor's degree or higher, with 90.3% or 327 individuals in the labor force. Within the labor force, individuals with college / associate degree education have the highest percentage of unemployment, with 11.3% or 33 of them being unemployed.
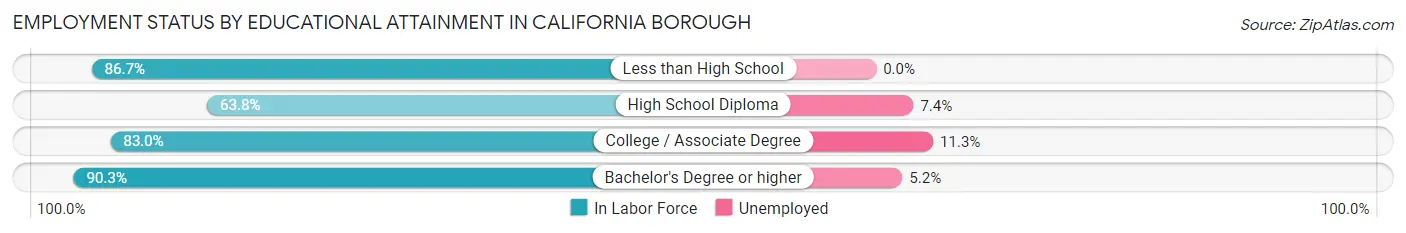
| Educational Attainment | In Labor Force | Unemployed |
| Less than High School | 65 (86.7%) | 0 (0.0%) |
| High School Diploma | 403 (63.8%) | 47 (7.4%) |
| College / Associate Degree | 292 (83.0%) | 40 (11.3%) |
| Bachelor's Degree or higher | 327 (90.3%) | 19 (5.2%) |
| Total | 1,087 (76.5%) | 105 (7.4%) |
Employment Occupations by Sex in California borough
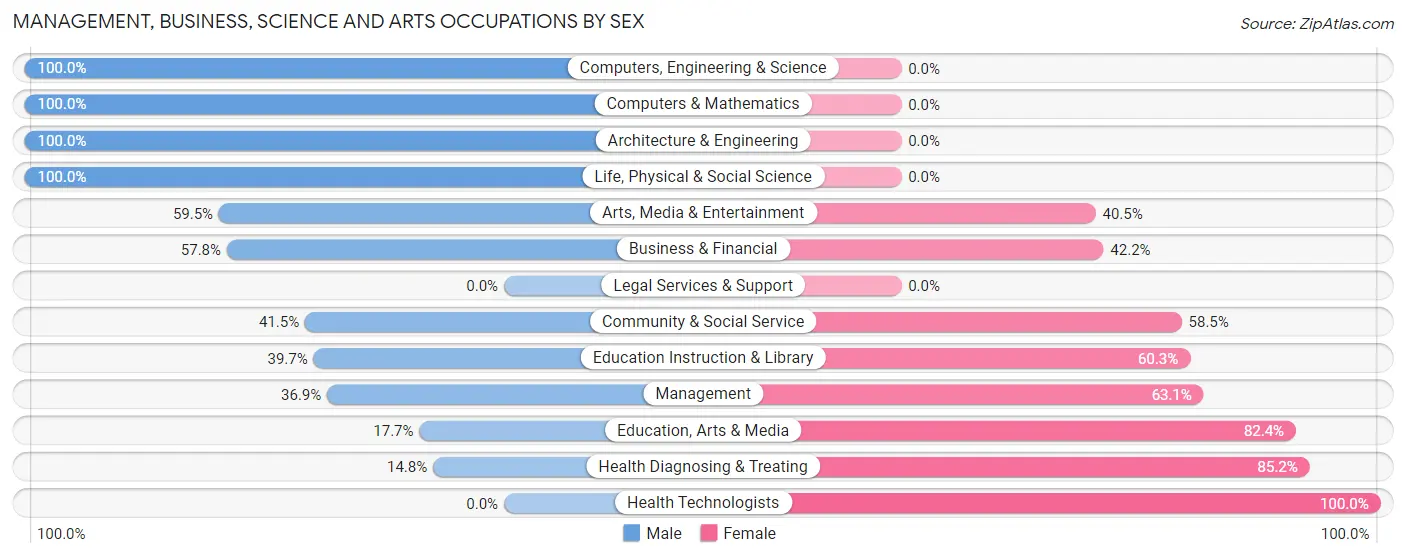
Management, Business, Science and Arts Occupations
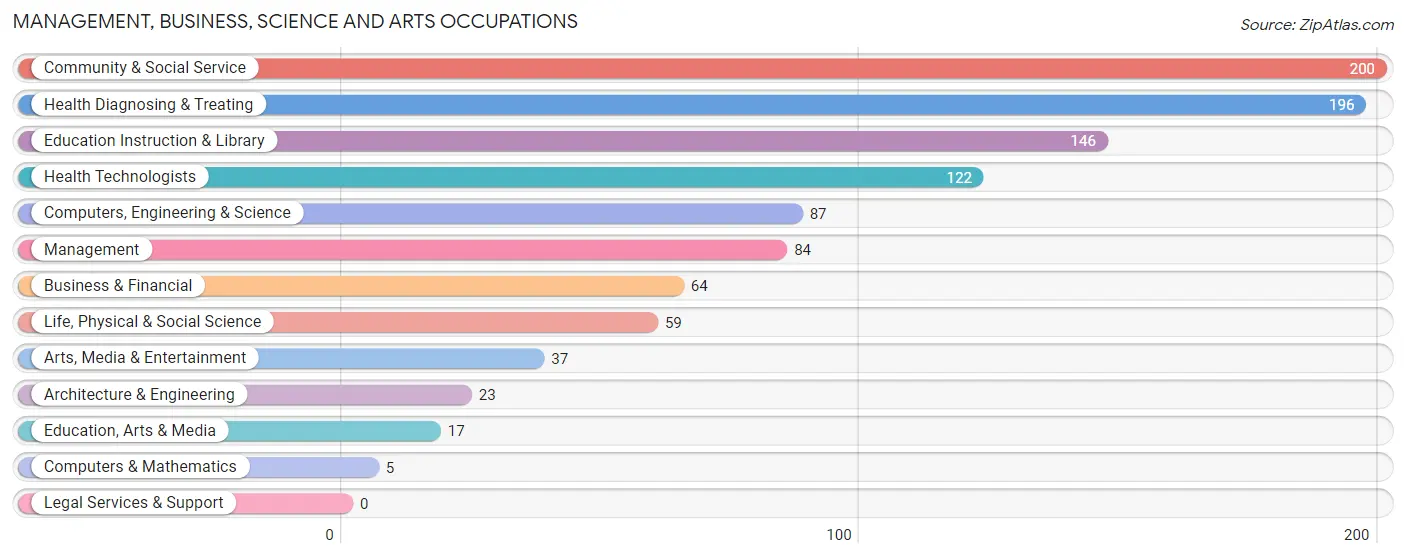
The most common Management, Business, Science and Arts occupations in California borough are Community & Social Service (200 | 7.9%), Health Diagnosing & Treating (196 | 7.7%), Education Instruction & Library (146 | 5.8%), Health Technologists (122 | 4.8%), and Computers, Engineering & Science (87 | 3.4%).
Management, Business, Science and Arts Occupations by Sex
Within the Management, Business, Science and Arts occupations in California borough, the most male-oriented occupations are Computers, Engineering & Science (100.0%), Computers & Mathematics (100.0%), and Architecture & Engineering (100.0%), while the most female-oriented occupations are Health Technologists (100.0%), Health Diagnosing & Treating (85.2%), and Education, Arts & Media (82.4%).
| Occupation | Male | Female |
| Management | 31 (36.9%) | 53 (63.1%) |
| Business & Financial | 37 (57.8%) | 27 (42.2%) |
| Computers, Engineering & Science | 87 (100.0%) | 0 (0.0%) |
| Computers & Mathematics | 5 (100.0%) | 0 (0.0%) |
| Architecture & Engineering | 23 (100.0%) | 0 (0.0%) |
| Life, Physical & Social Science | 59 (100.0%) | 0 (0.0%) |
| Community & Social Service | 83 (41.5%) | 117 (58.5%) |
| Education, Arts & Media | 3 (17.6%) | 14 (82.4%) |
| Legal Services & Support | 0 (0.0%) | 0 (0.0%) |
| Education Instruction & Library | 58 (39.7%) | 88 (60.3%) |
| Arts, Media & Entertainment | 22 (59.5%) | 15 (40.5%) |
| Health Diagnosing & Treating | 29 (14.8%) | 167 (85.2%) |
| Health Technologists | 0 (0.0%) | 122 (100.0%) |
| Total (Category) | 267 (42.3%) | 364 (57.7%) |
| Total (Overall) | 1,135 (44.8%) | 1,399 (55.2%) |
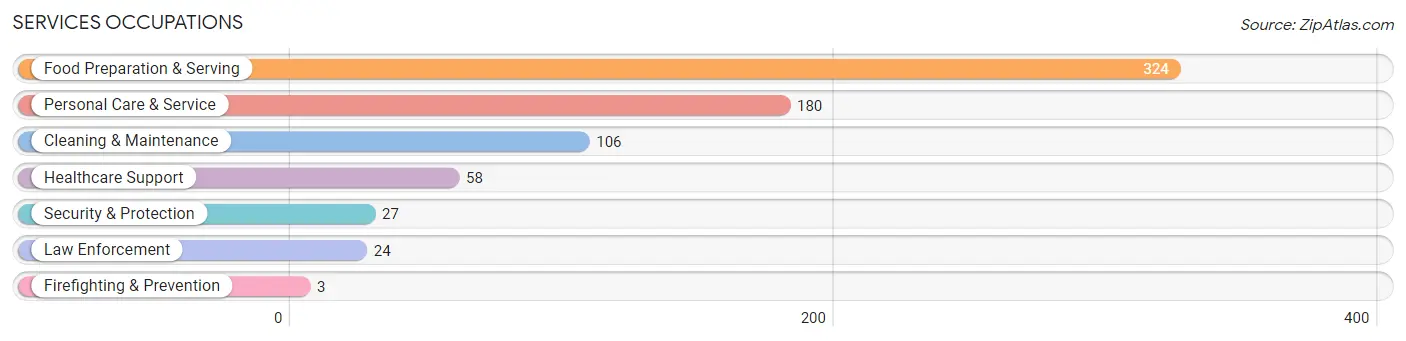
Services Occupations
The most common Services occupations in California borough are Food Preparation & Serving (324 | 12.8%), Personal Care & Service (180 | 7.1%), Cleaning & Maintenance (106 | 4.2%), Healthcare Support (58 | 2.3%), and Security & Protection (27 | 1.1%).
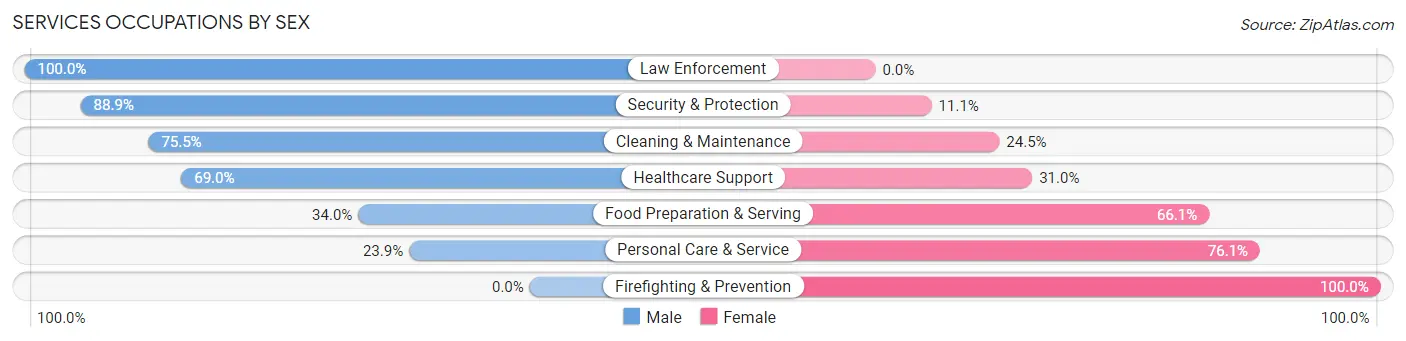
Services Occupations by Sex
Within the Services occupations in California borough, the most male-oriented occupations are Law Enforcement (100.0%), Security & Protection (88.9%), and Cleaning & Maintenance (75.5%), while the most female-oriented occupations are Firefighting & Prevention (100.0%), Personal Care & Service (76.1%), and Food Preparation & Serving (66.0%).
| Occupation | Male | Female |
| Healthcare Support | 40 (69.0%) | 18 (31.0%) |
| Security & Protection | 24 (88.9%) | 3 (11.1%) |
| Firefighting & Prevention | 0 (0.0%) | 3 (100.0%) |
| Law Enforcement | 24 (100.0%) | 0 (0.0%) |
| Food Preparation & Serving | 110 (34.0%) | 214 (66.0%) |
| Cleaning & Maintenance | 80 (75.5%) | 26 (24.5%) |
| Personal Care & Service | 43 (23.9%) | 137 (76.1%) |
| Total (Category) | 297 (42.7%) | 398 (57.3%) |
| Total (Overall) | 1,135 (44.8%) | 1,399 (55.2%) |
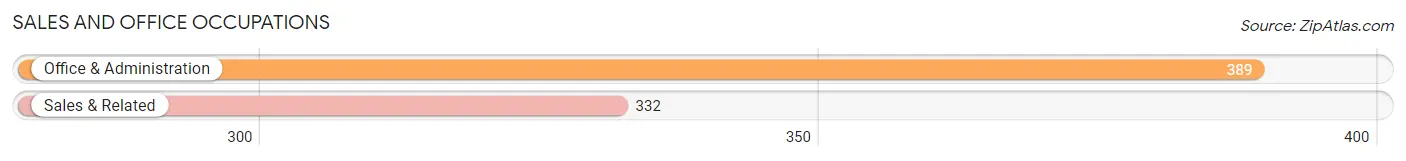
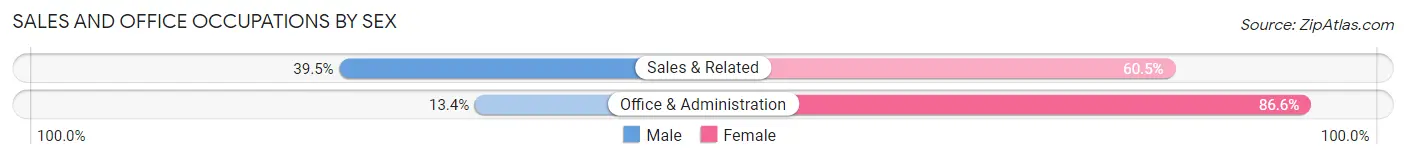
Sales and Office Occupations
The most common Sales and Office occupations in California borough are Office & Administration (389 | 15.3%), and Sales & Related (332 | 13.1%).
Sales and Office Occupations by Sex
| Occupation | Male | Female |
| Sales & Related | 131 (39.5%) | 201 (60.5%) |
| Office & Administration | 52 (13.4%) | 337 (86.6%) |
| Total (Category) | 183 (25.4%) | 538 (74.6%) |
| Total (Overall) | 1,135 (44.8%) | 1,399 (55.2%) |
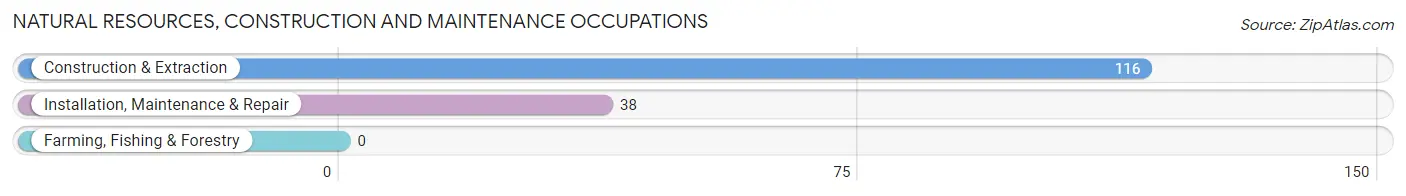
Natural Resources, Construction and Maintenance Occupations
The most common Natural Resources, Construction and Maintenance occupations in California borough are Construction & Extraction (116 | 4.6%), and Installation, Maintenance & Repair (38 | 1.5%).
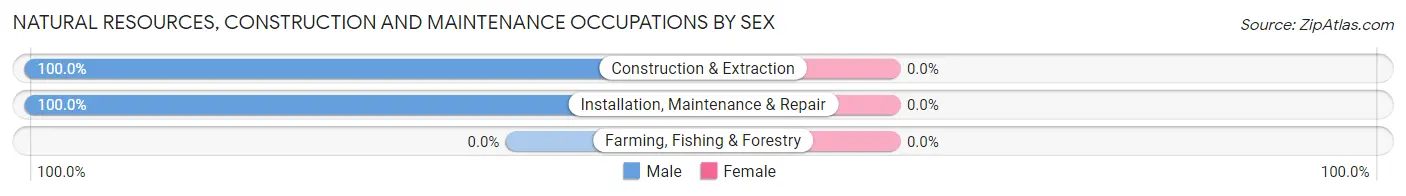
Natural Resources, Construction and Maintenance Occupations by Sex
| Occupation | Male | Female |
| Farming, Fishing & Forestry | 0 (0.0%) | 0 (0.0%) |
| Construction & Extraction | 116 (100.0%) | 0 (0.0%) |
| Installation, Maintenance & Repair | 38 (100.0%) | 0 (0.0%) |
| Total (Category) | 154 (100.0%) | 0 (0.0%) |
| Total (Overall) | 1,135 (44.8%) | 1,399 (55.2%) |
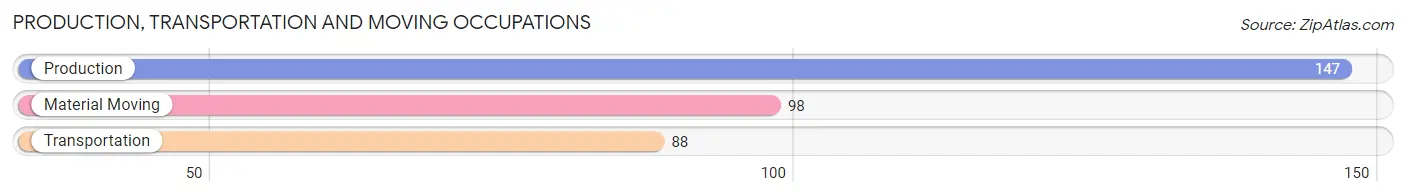
Production, Transportation and Moving Occupations
The most common Production, Transportation and Moving occupations in California borough are Production (147 | 5.8%), Material Moving (98 | 3.9%), and Transportation (88 | 3.5%).
Production, Transportation and Moving Occupations by Sex
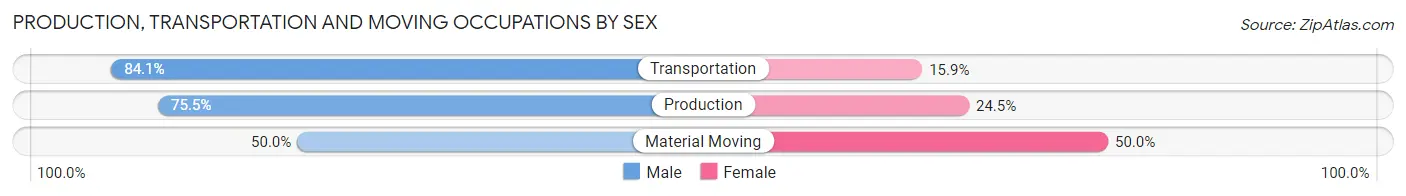
| Occupation | Male | Female |
| Production | 111 (75.5%) | 36 (24.5%) |
| Transportation | 74 (84.1%) | 14 (15.9%) |
| Material Moving | 49 (50.0%) | 49 (50.0%) |
| Total (Category) | 234 (70.3%) | 99 (29.7%) |
| Total (Overall) | 1,135 (44.8%) | 1,399 (55.2%) |
Employment Industries by Sex in California borough
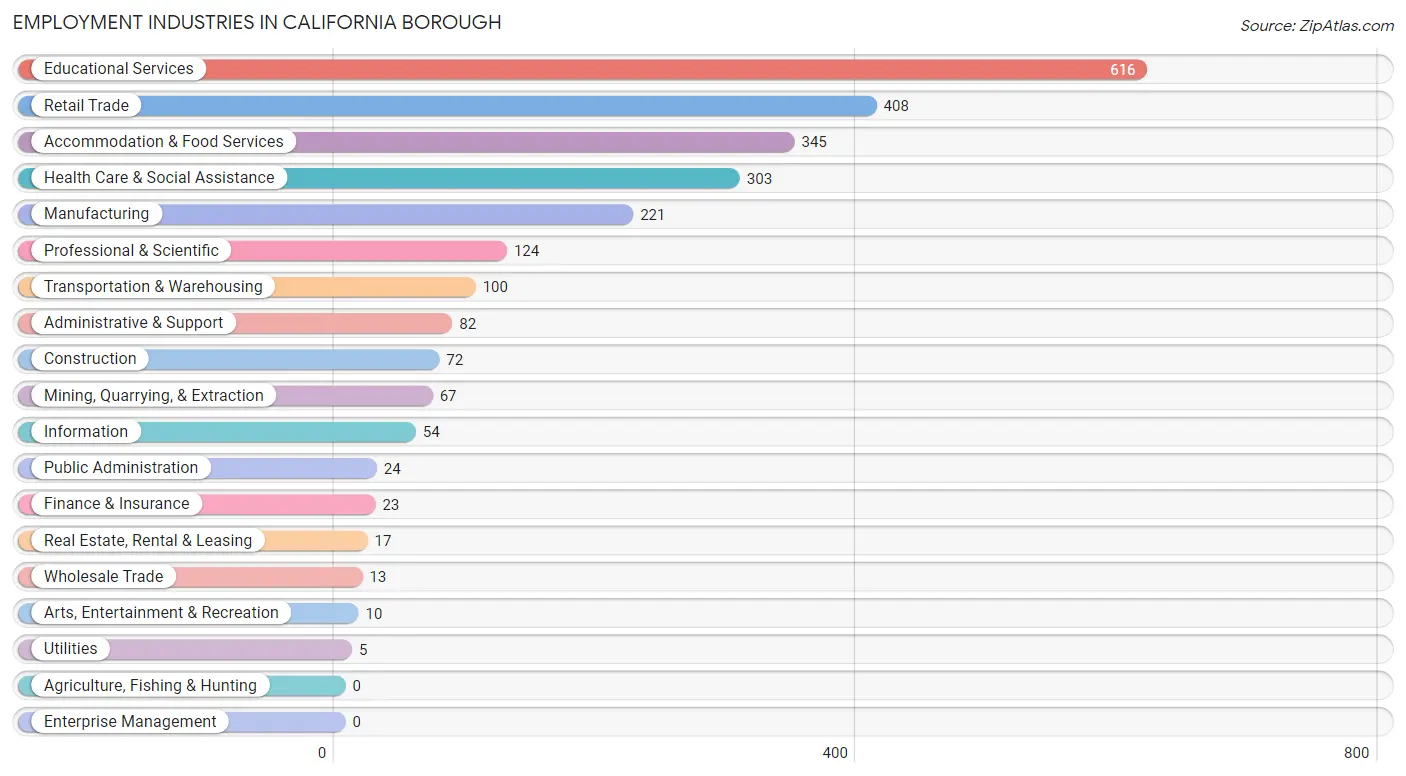
Employment Industries in California borough
The major employment industries in California borough include Educational Services (616 | 24.3%), Retail Trade (408 | 16.1%), Accommodation & Food Services (345 | 13.6%), Health Care & Social Assistance (303 | 12.0%), and Manufacturing (221 | 8.7%).
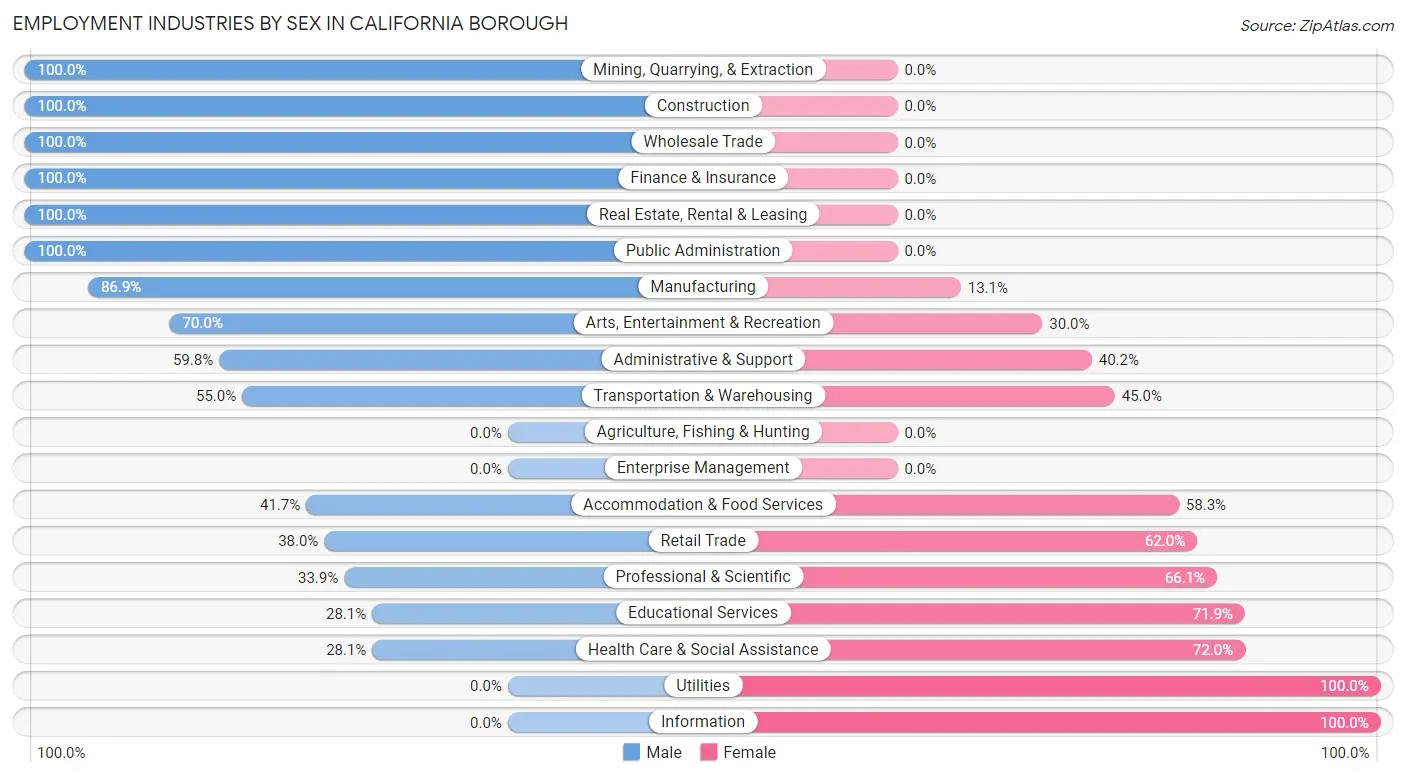
Employment Industries by Sex in California borough
The California borough industries that see more men than women are Mining, Quarrying, & Extraction (100.0%), Construction (100.0%), and Wholesale Trade (100.0%), whereas the industries that tend to have a higher number of women are Utilities (100.0%), Information (100.0%), and Health Care & Social Assistance (72.0%).
| Industry | Male | Female |
| Agriculture, Fishing & Hunting | 0 (0.0%) | 0 (0.0%) |
| Mining, Quarrying, & Extraction | 67 (100.0%) | 0 (0.0%) |
| Construction | 72 (100.0%) | 0 (0.0%) |
| Manufacturing | 192 (86.9%) | 29 (13.1%) |
| Wholesale Trade | 13 (100.0%) | 0 (0.0%) |
| Retail Trade | 155 (38.0%) | 253 (62.0%) |
| Transportation & Warehousing | 55 (55.0%) | 45 (45.0%) |
| Utilities | 0 (0.0%) | 5 (100.0%) |
| Information | 0 (0.0%) | 54 (100.0%) |
| Finance & Insurance | 23 (100.0%) | 0 (0.0%) |
| Real Estate, Rental & Leasing | 17 (100.0%) | 0 (0.0%) |
| Professional & Scientific | 42 (33.9%) | 82 (66.1%) |
| Enterprise Management | 0 (0.0%) | 0 (0.0%) |
| Administrative & Support | 49 (59.8%) | 33 (40.2%) |
| Educational Services | 173 (28.1%) | 443 (71.9%) |
| Health Care & Social Assistance | 85 (28.1%) | 218 (72.0%) |
| Arts, Entertainment & Recreation | 7 (70.0%) | 3 (30.0%) |
| Accommodation & Food Services | 144 (41.7%) | 201 (58.3%) |
| Public Administration | 24 (100.0%) | 0 (0.0%) |
| Total | 1,135 (44.8%) | 1,399 (55.2%) |
Education in California borough
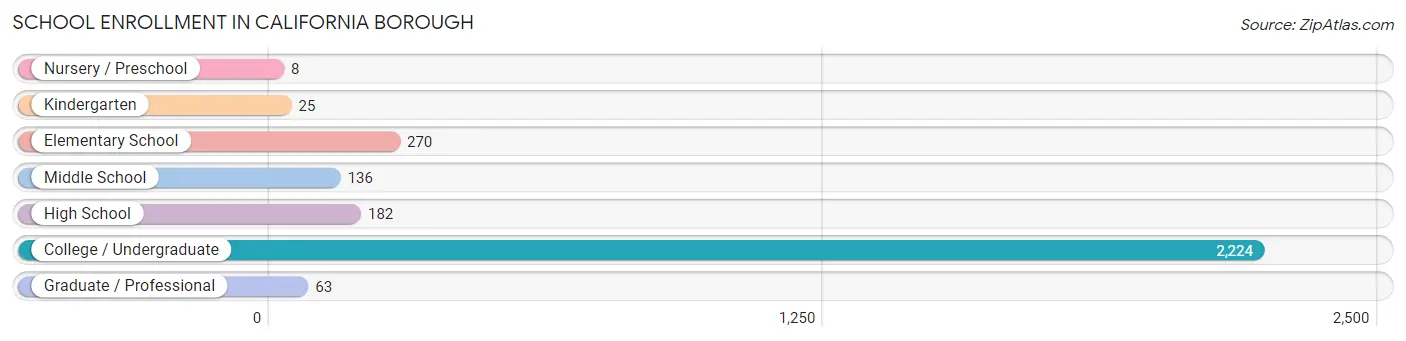
School Enrollment in California borough
The most common levels of schooling among the 2,908 students in California borough are college / undergraduate (2,224 | 76.5%), elementary school (270 | 9.3%), and high school (182 | 6.3%).
| School Level | # Students | % Students |
| Nursery / Preschool | 8 | 0.3% |
| Kindergarten | 25 | 0.9% |
| Elementary School | 270 | 9.3% |
| Middle School | 136 | 4.7% |
| High School | 182 | 6.3% |
| College / Undergraduate | 2,224 | 76.5% |
| Graduate / Professional | 63 | 2.2% |
| Total | 2,908 | 100.0% |
School Enrollment by Age by Funding Source in California borough
Out of a total of 2,908 students who are enrolled in schools in California borough, 311 (10.7%) attend a private institution, while the remaining 2,597 (89.3%) are enrolled in public schools. The age group of 25 to 34 year olds has the highest likelihood of being enrolled in private schools, with 36 (38.7% in the age bracket) enrolled. Conversely, the age group of 3 to 4 year olds has the lowest likelihood of being enrolled in a private school, with 8 (100.0% in the age bracket) attending a public institution.
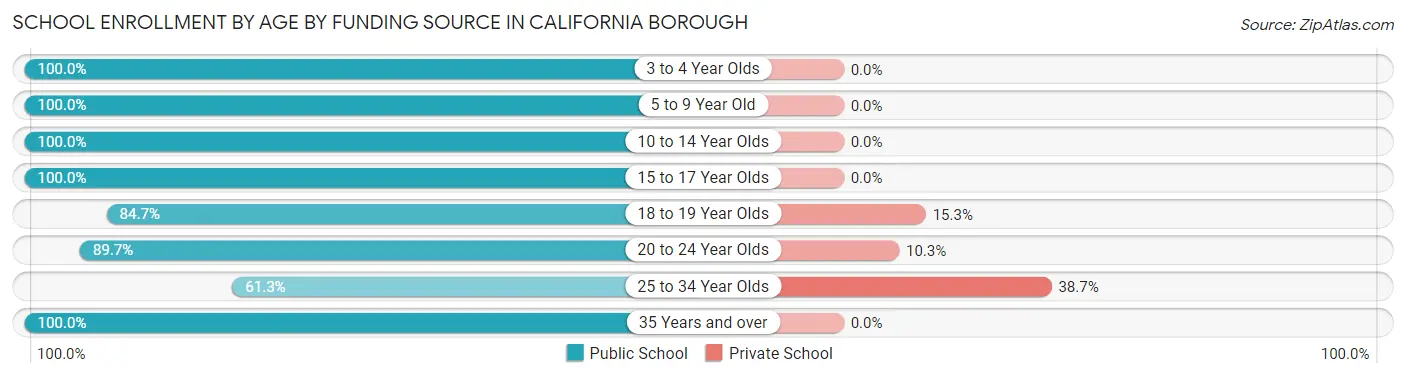
| Age Bracket | Public School | Private School |
| 3 to 4 Year Olds | 8 (100.0%) | 0 (0.0%) |
| 5 to 9 Year Old | 306 (100.0%) | 0 (0.0%) |
| 10 to 14 Year Olds | 115 (100.0%) | 0 (0.0%) |
| 15 to 17 Year Olds | 190 (100.0%) | 0 (0.0%) |
| 18 to 19 Year Olds | 864 (84.7%) | 156 (15.3%) |
| 20 to 24 Year Olds | 1,035 (89.7%) | 119 (10.3%) |
| 25 to 34 Year Olds | 57 (61.3%) | 36 (38.7%) |
| 35 Years and over | 22 (100.0%) | 0 (0.0%) |
| Total | 2,597 (89.3%) | 311 (10.7%) |
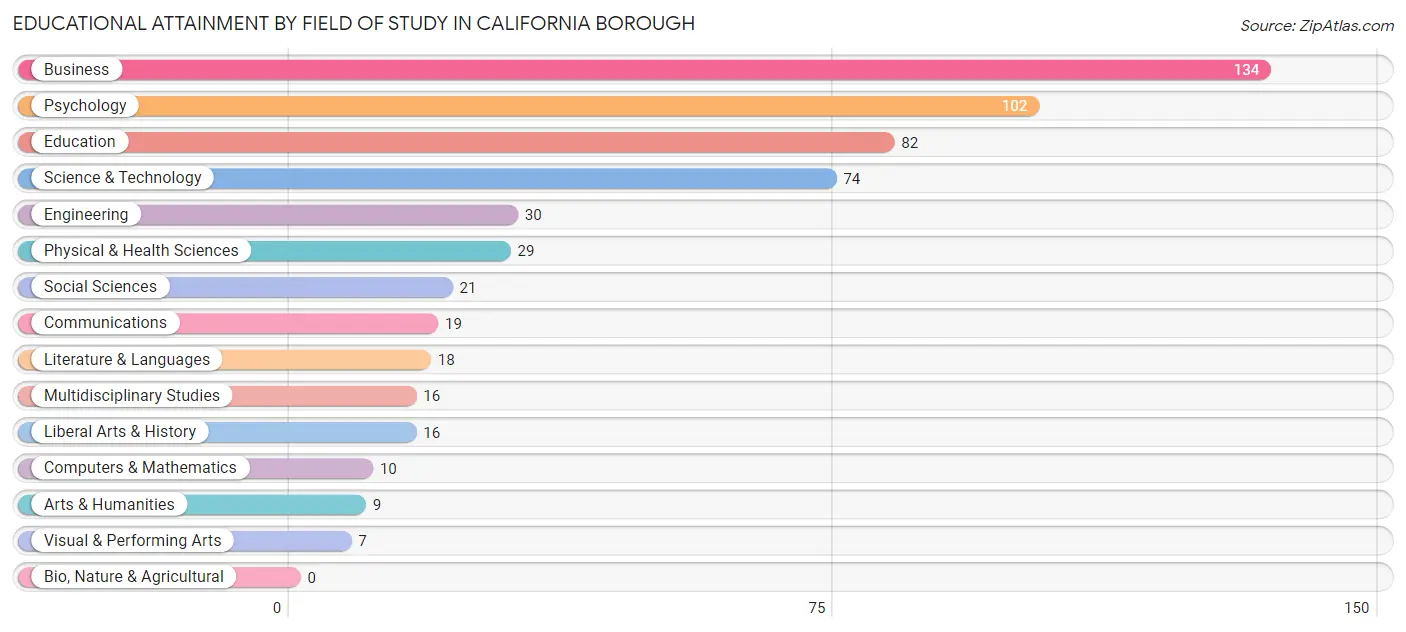
Educational Attainment by Field of Study in California borough
Business (134 | 23.6%), psychology (102 | 18.0%), education (82 | 14.5%), science & technology (74 | 13.1%), and engineering (30 | 5.3%) are the most common fields of study among 567 individuals in California borough who have obtained a bachelor's degree or higher.
| Field of Study | # Graduates | % Graduates |
| Computers & Mathematics | 10 | 1.8% |
| Bio, Nature & Agricultural | 0 | 0.0% |
| Physical & Health Sciences | 29 | 5.1% |
| Psychology | 102 | 18.0% |
| Social Sciences | 21 | 3.7% |
| Engineering | 30 | 5.3% |
| Multidisciplinary Studies | 16 | 2.8% |
| Science & Technology | 74 | 13.1% |
| Business | 134 | 23.6% |
| Education | 82 | 14.5% |
| Literature & Languages | 18 | 3.2% |
| Liberal Arts & History | 16 | 2.8% |
| Visual & Performing Arts | 7 | 1.2% |
| Communications | 19 | 3.4% |
| Arts & Humanities | 9 | 1.6% |
| Total | 567 | 100.0% |
Transportation & Commute in California borough
Vehicle Availability by Sex in California borough
The most prevalent vehicle ownership categories in California borough are males with 2 vehicles (265, accounting for 35.8%) and females with 2 vehicles (181, making up 33.6%).
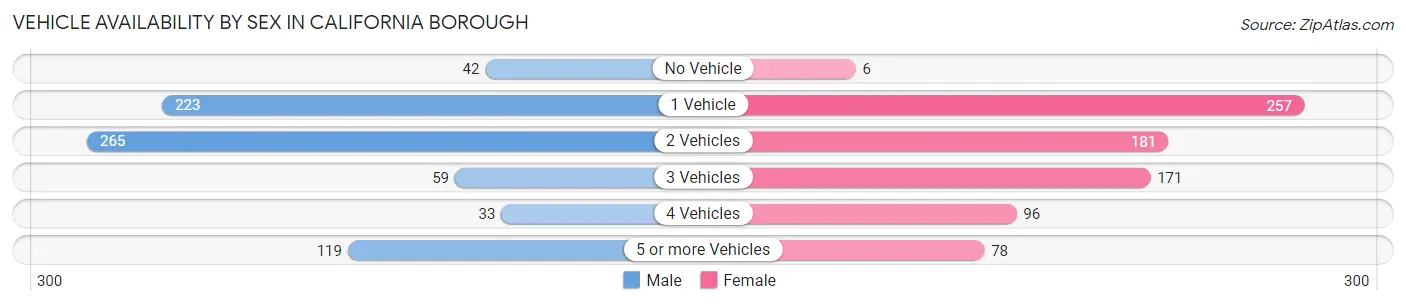
| Vehicles Available | Male | Female |
| No Vehicle | 42 (5.7%) | 6 (0.8%) |
| 1 Vehicle | 223 (30.1%) | 257 (32.6%) |
| 2 Vehicles | 265 (35.8%) | 181 (22.9%) |
| 3 Vehicles | 59 (8.0%) | 171 (21.7%) |
| 4 Vehicles | 33 (4.4%) | 96 (12.2%) |
| 5 or more Vehicles | 119 (16.1%) | 78 (9.9%) |
| Total | 741 (100.0%) | 789 (100.0%) |
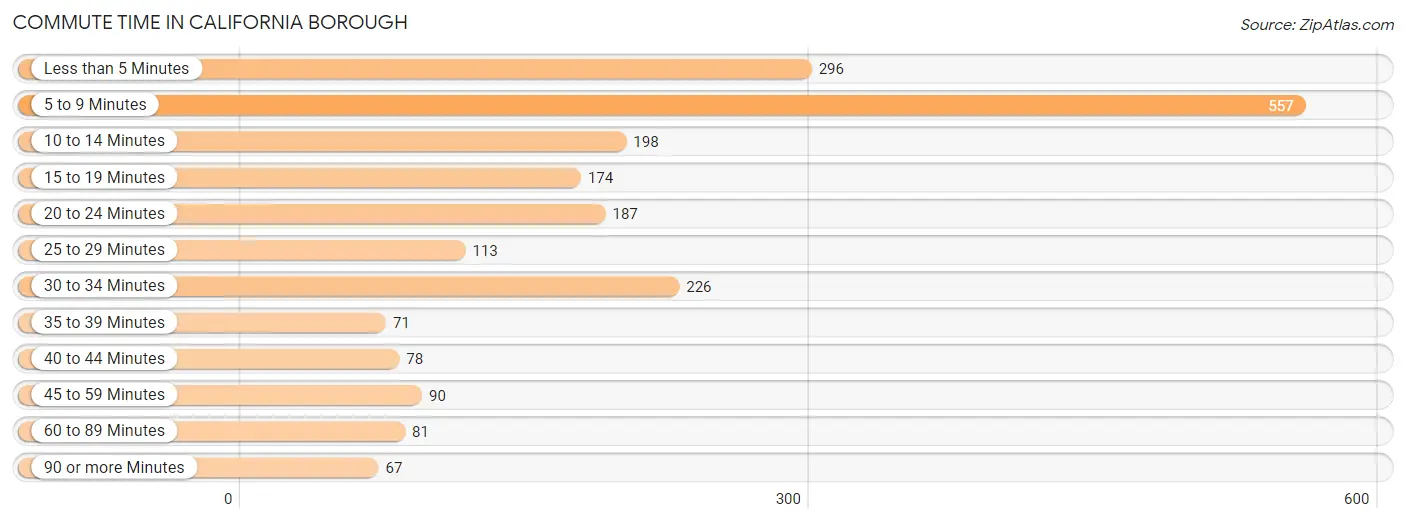
Commute Time in California borough
The most frequently occuring commute durations in California borough are 5 to 9 minutes (557 commuters, 26.1%), less than 5 minutes (296 commuters, 13.8%), and 30 to 34 minutes (226 commuters, 10.6%).
| Commute Time | # Commuters | % Commuters |
| Less than 5 Minutes | 296 | 13.8% |
| 5 to 9 Minutes | 557 | 26.1% |
| 10 to 14 Minutes | 198 | 9.3% |
| 15 to 19 Minutes | 174 | 8.1% |
| 20 to 24 Minutes | 187 | 8.7% |
| 25 to 29 Minutes | 113 | 5.3% |
| 30 to 34 Minutes | 226 | 10.6% |
| 35 to 39 Minutes | 71 | 3.3% |
| 40 to 44 Minutes | 78 | 3.6% |
| 45 to 59 Minutes | 90 | 4.2% |
| 60 to 89 Minutes | 81 | 3.8% |
| 90 or more Minutes | 67 | 3.1% |
Commute Time by Sex in California borough
The most common commute times in California borough are 5 to 9 minutes (206 commuters, 22.6%) for males and 5 to 9 minutes (351 commuters, 28.6%) for females.
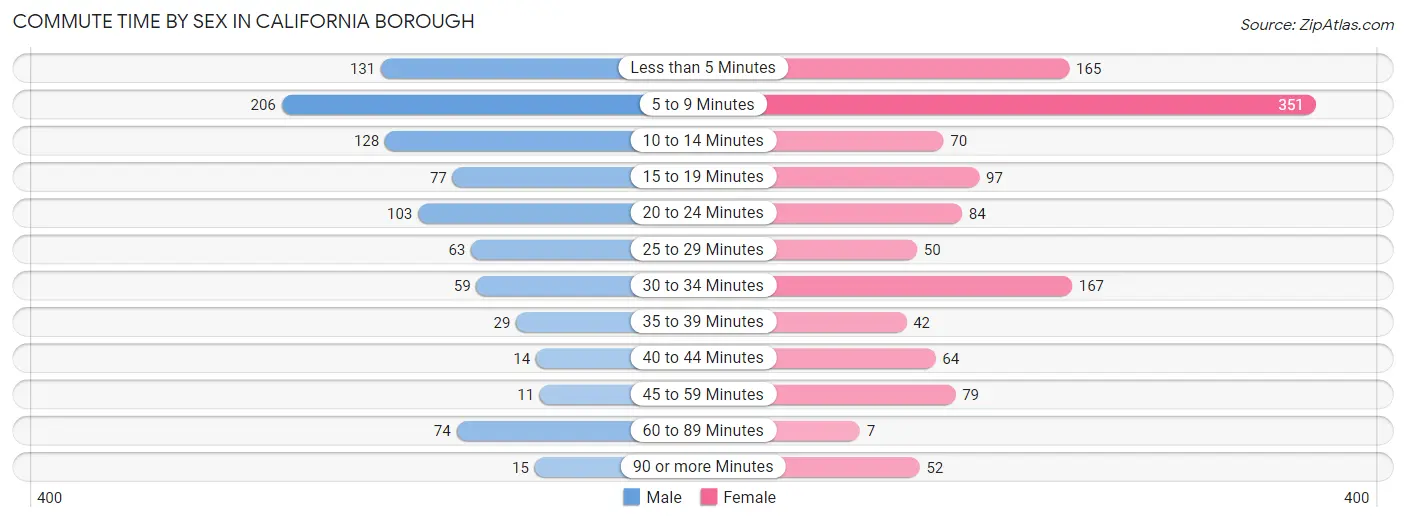
| Commute Time | Male | Female |
| Less than 5 Minutes | 131 (14.4%) | 165 (13.4%) |
| 5 to 9 Minutes | 206 (22.6%) | 351 (28.6%) |
| 10 to 14 Minutes | 128 (14.1%) | 70 (5.7%) |
| 15 to 19 Minutes | 77 (8.5%) | 97 (7.9%) |
| 20 to 24 Minutes | 103 (11.3%) | 84 (6.8%) |
| 25 to 29 Minutes | 63 (6.9%) | 50 (4.1%) |
| 30 to 34 Minutes | 59 (6.5%) | 167 (13.6%) |
| 35 to 39 Minutes | 29 (3.2%) | 42 (3.4%) |
| 40 to 44 Minutes | 14 (1.5%) | 64 (5.2%) |
| 45 to 59 Minutes | 11 (1.2%) | 79 (6.4%) |
| 60 to 89 Minutes | 74 (8.1%) | 7 (0.6%) |
| 90 or more Minutes | 15 (1.7%) | 52 (4.2%) |
Time of Departure to Work by Sex in California borough
The most frequent times of departure to work in California borough are 12:00 PM to 3:59 PM (201, 22.1%) for males and 12:00 PM to 3:59 PM (266, 21.7%) for females.
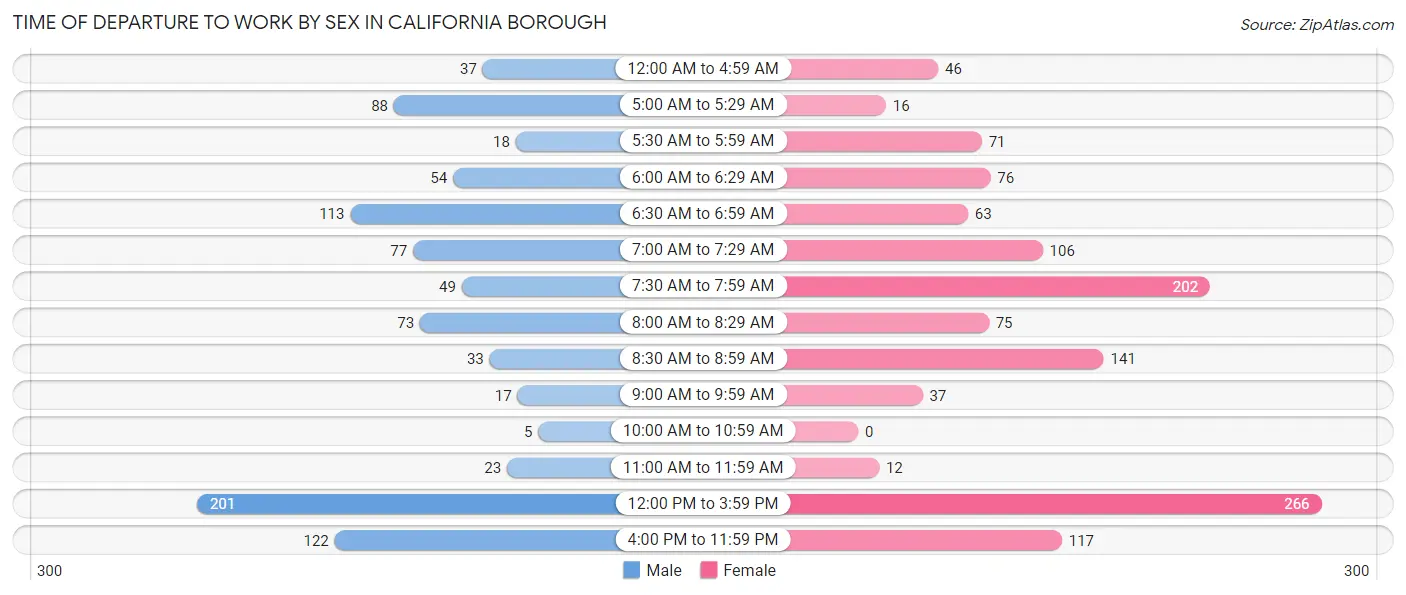
| Time of Departure | Male | Female |
| 12:00 AM to 4:59 AM | 37 (4.1%) | 46 (3.7%) |
| 5:00 AM to 5:29 AM | 88 (9.7%) | 16 (1.3%) |
| 5:30 AM to 5:59 AM | 18 (2.0%) | 71 (5.8%) |
| 6:00 AM to 6:29 AM | 54 (5.9%) | 76 (6.2%) |
| 6:30 AM to 6:59 AM | 113 (12.4%) | 63 (5.1%) |
| 7:00 AM to 7:29 AM | 77 (8.5%) | 106 (8.6%) |
| 7:30 AM to 7:59 AM | 49 (5.4%) | 202 (16.5%) |
| 8:00 AM to 8:29 AM | 73 (8.0%) | 75 (6.1%) |
| 8:30 AM to 8:59 AM | 33 (3.6%) | 141 (11.5%) |
| 9:00 AM to 9:59 AM | 17 (1.9%) | 37 (3.0%) |
| 10:00 AM to 10:59 AM | 5 (0.5%) | 0 (0.0%) |
| 11:00 AM to 11:59 AM | 23 (2.5%) | 12 (1.0%) |
| 12:00 PM to 3:59 PM | 201 (22.1%) | 266 (21.7%) |
| 4:00 PM to 11:59 PM | 122 (13.4%) | 117 (9.5%) |
| Total | 910 (100.0%) | 1,228 (100.0%) |
Housing Occupancy in California borough
Occupancy by Ownership in California borough
Of the total 1,634 dwellings in California borough, owner-occupied units account for 726 (44.4%), while renter-occupied units make up 908 (55.6%).
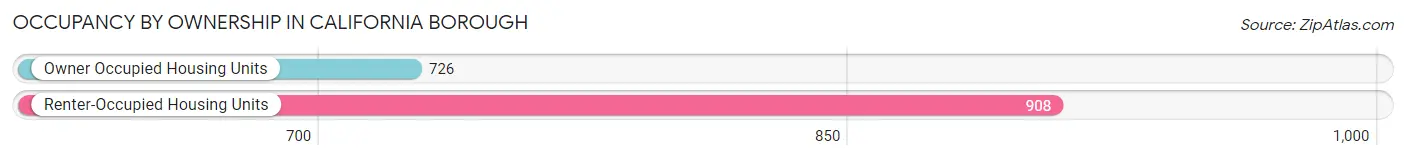
| Occupancy | # Housing Units | % Housing Units |
| Owner Occupied Housing Units | 726 | 44.4% |
| Renter-Occupied Housing Units | 908 | 55.6% |
| Total Occupied Housing Units | 1,634 | 100.0% |
Occupancy by Household Size in California borough
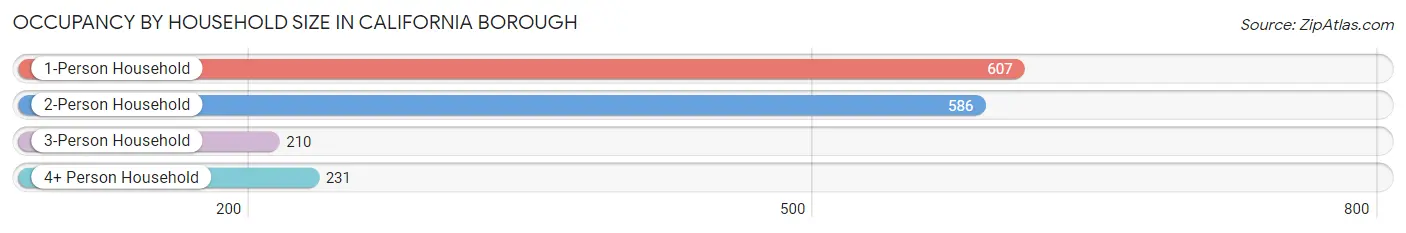
| Household Size | # Housing Units | % Housing Units |
| 1-Person Household | 607 | 37.1% |
| 2-Person Household | 586 | 35.9% |
| 3-Person Household | 210 | 12.9% |
| 4+ Person Household | 231 | 14.1% |
| Total Housing Units | 1,634 | 100.0% |
Occupancy by Ownership by Household Size in California borough
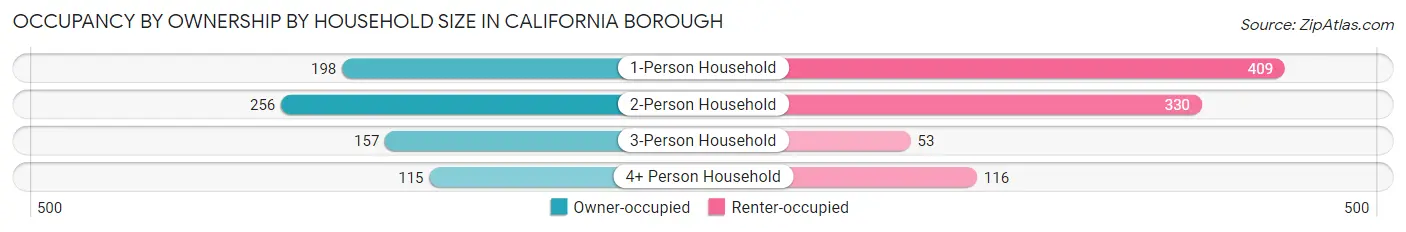
| Household Size | Owner-occupied | Renter-occupied |
| 1-Person Household | 198 (32.6%) | 409 (67.4%) |
| 2-Person Household | 256 (43.7%) | 330 (56.3%) |
| 3-Person Household | 157 (74.8%) | 53 (25.2%) |
| 4+ Person Household | 115 (49.8%) | 116 (50.2%) |
| Total Housing Units | 726 (44.4%) | 908 (55.6%) |
Occupancy by Educational Attainment in California borough
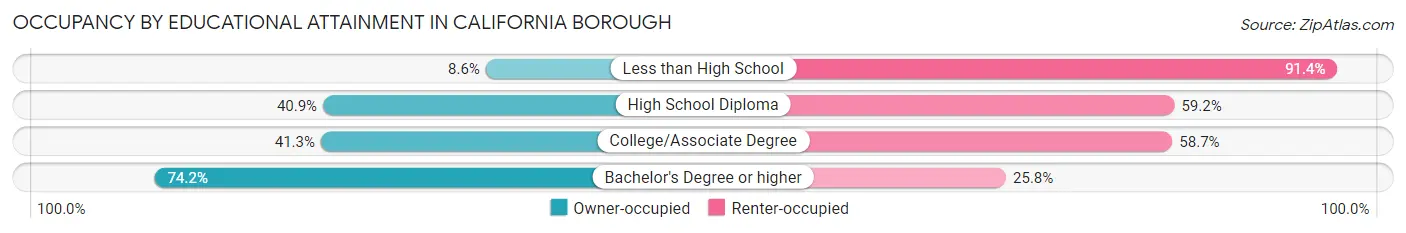
| Household Size | Owner-occupied | Renter-occupied |
| Less than High School | 17 (8.6%) | 181 (91.4%) |
| High School Diploma | 259 (40.8%) | 375 (59.2%) |
| College/Associate Degree | 182 (41.3%) | 259 (58.7%) |
| Bachelor's Degree or higher | 268 (74.2%) | 93 (25.8%) |
Occupancy by Age of Householder in California borough
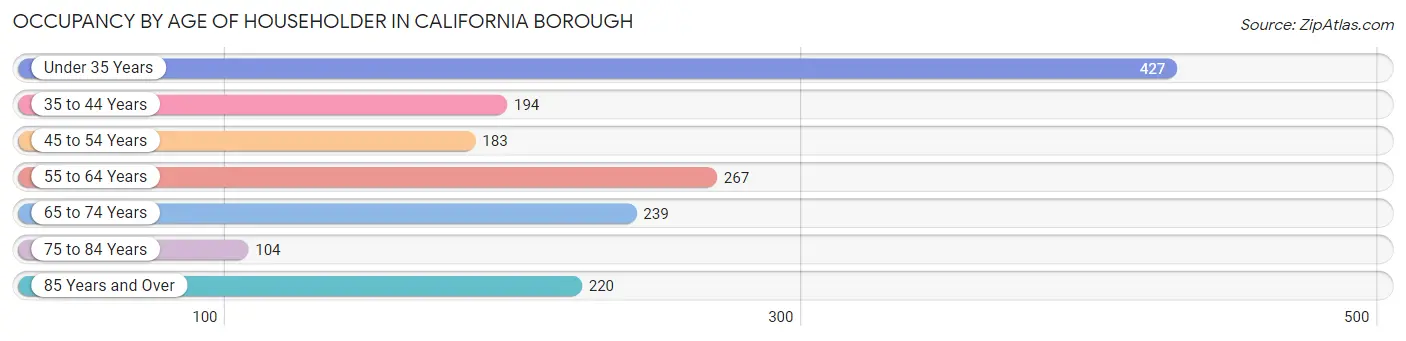
| Age Bracket | # Households | % Households |
| Under 35 Years | 427 | 26.1% |
| 35 to 44 Years | 194 | 11.9% |
| 45 to 54 Years | 183 | 11.2% |
| 55 to 64 Years | 267 | 16.3% |
| 65 to 74 Years | 239 | 14.6% |
| 75 to 84 Years | 104 | 6.4% |
| 85 Years and Over | 220 | 13.5% |
| Total | 1,634 | 100.0% |
Housing Finances in California borough
Median Income by Occupancy in California borough
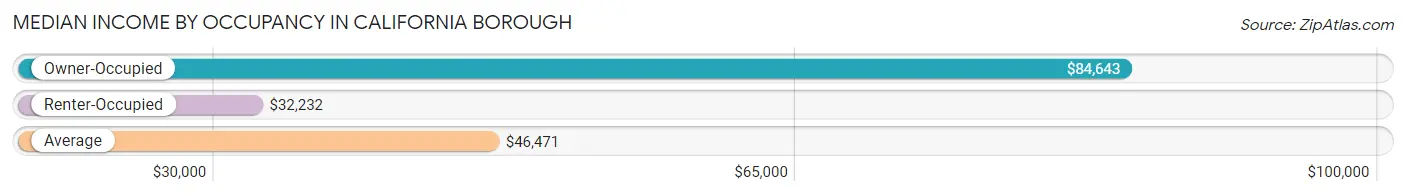
| Occupancy Type | # Households | Median Income |
| Owner-Occupied | 726 (44.4%) | $84,643 |
| Renter-Occupied | 908 (55.6%) | $32,232 |
| Average | 1,634 (100.0%) | $46,471 |
Occupancy by Householder Income Bracket in California borough
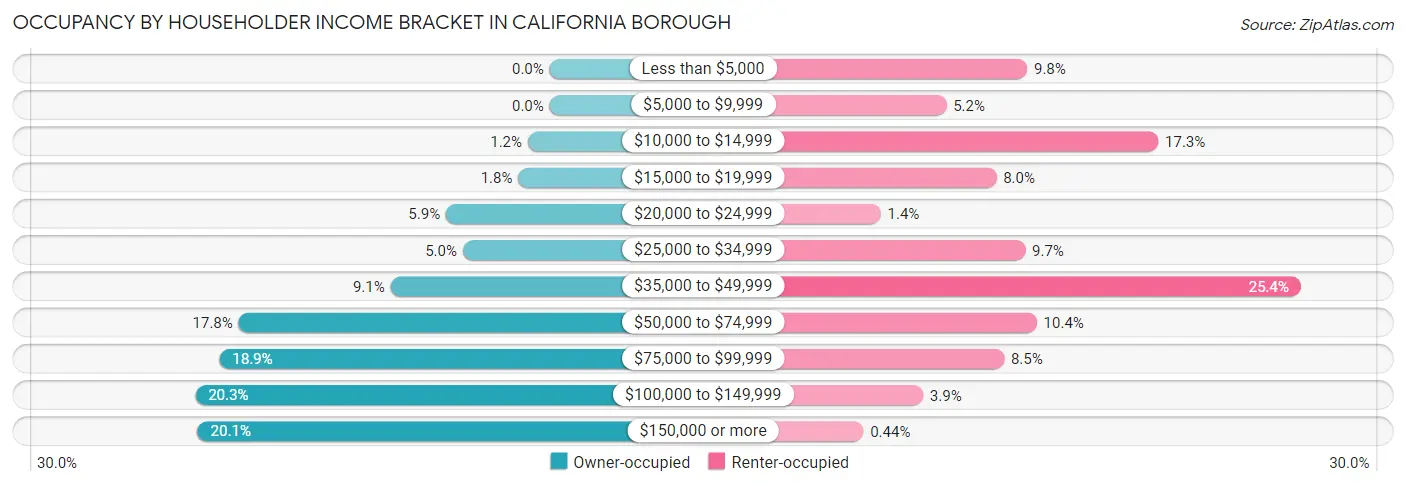
| Income Bracket | Owner-occupied | Renter-occupied |
| Less than $5,000 | 0 (0.0%) | 89 (9.8%) |
| $5,000 to $9,999 | 0 (0.0%) | 47 (5.2%) |
| $10,000 to $14,999 | 9 (1.2%) | 157 (17.3%) |
| $15,000 to $19,999 | 13 (1.8%) | 73 (8.0%) |
| $20,000 to $24,999 | 43 (5.9%) | 13 (1.4%) |
| $25,000 to $34,999 | 36 (5.0%) | 88 (9.7%) |
| $35,000 to $49,999 | 66 (9.1%) | 231 (25.4%) |
| $50,000 to $74,999 | 129 (17.8%) | 94 (10.3%) |
| $75,000 to $99,999 | 137 (18.9%) | 77 (8.5%) |
| $100,000 to $149,999 | 147 (20.3%) | 35 (3.8%) |
| $150,000 or more | 146 (20.1%) | 4 (0.4%) |
| Total | 726 (100.0%) | 908 (100.0%) |
Monthly Housing Cost Tiers in California borough
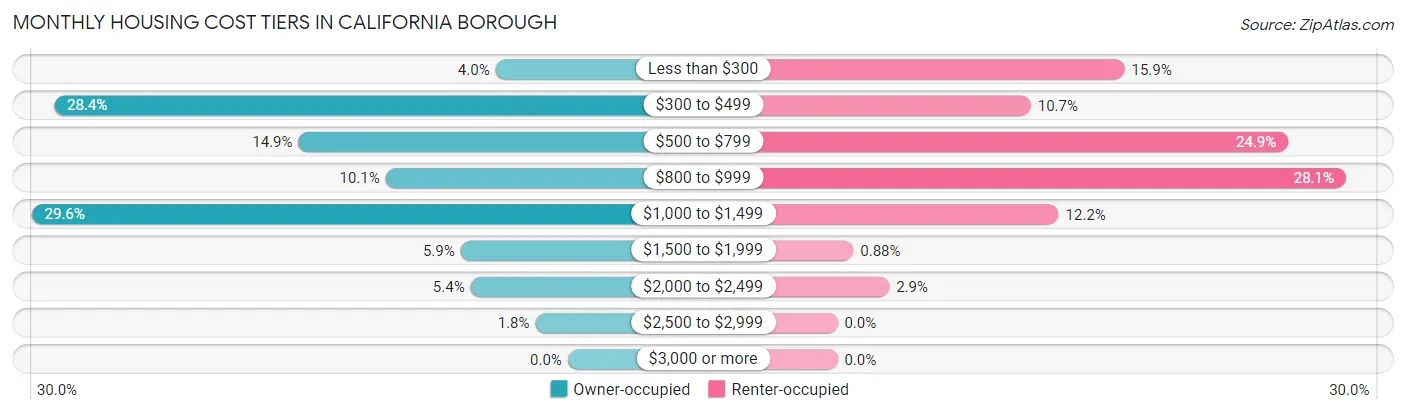
| Monthly Cost | Owner-occupied | Renter-occupied |
| Less than $300 | 29 (4.0%) | 144 (15.9%) |
| $300 to $499 | 206 (28.4%) | 97 (10.7%) |
| $500 to $799 | 108 (14.9%) | 226 (24.9%) |
| $800 to $999 | 73 (10.1%) | 255 (28.1%) |
| $1,000 to $1,499 | 215 (29.6%) | 111 (12.2%) |
| $1,500 to $1,999 | 43 (5.9%) | 8 (0.9%) |
| $2,000 to $2,499 | 39 (5.4%) | 26 (2.9%) |
| $2,500 to $2,999 | 13 (1.8%) | 0 (0.0%) |
| $3,000 or more | 0 (0.0%) | 0 (0.0%) |
| Total | 726 (100.0%) | 908 (100.0%) |
Physical Housing Characteristics in California borough
Housing Structures in California borough
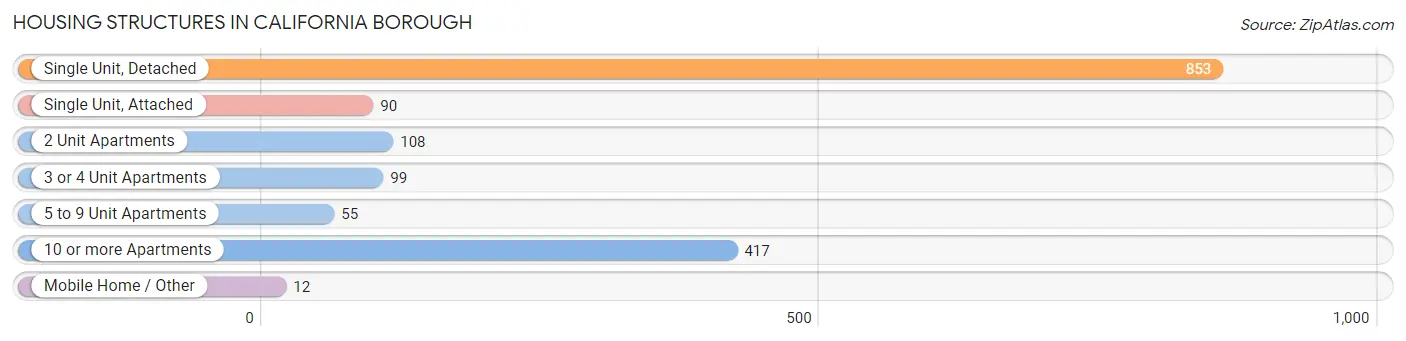
| Structure Type | # Housing Units | % Housing Units |
| Single Unit, Detached | 853 | 52.2% |
| Single Unit, Attached | 90 | 5.5% |
| 2 Unit Apartments | 108 | 6.6% |
| 3 or 4 Unit Apartments | 99 | 6.1% |
| 5 to 9 Unit Apartments | 55 | 3.4% |
| 10 or more Apartments | 417 | 25.5% |
| Mobile Home / Other | 12 | 0.7% |
| Total | 1,634 | 100.0% |
Housing Structures by Occupancy in California borough
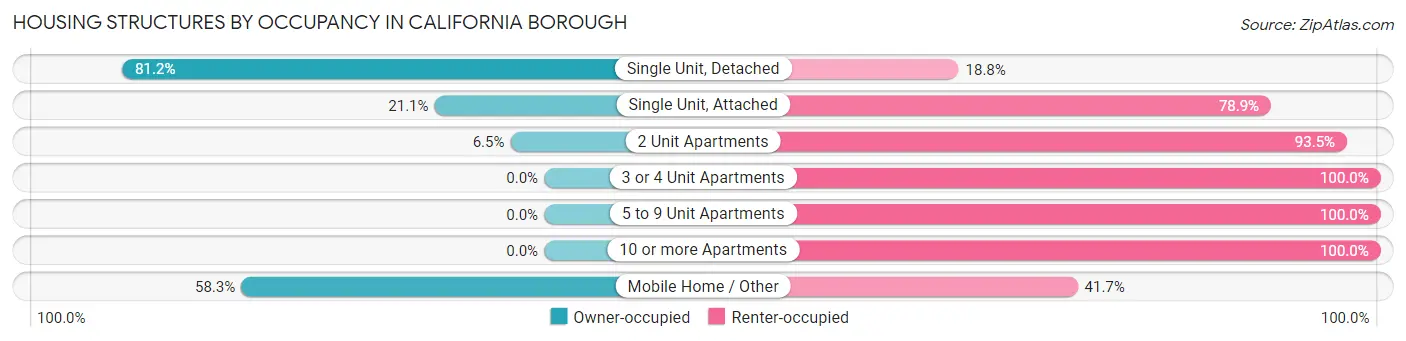
| Structure Type | Owner-occupied | Renter-occupied |
| Single Unit, Detached | 693 (81.2%) | 160 (18.8%) |
| Single Unit, Attached | 19 (21.1%) | 71 (78.9%) |
| 2 Unit Apartments | 7 (6.5%) | 101 (93.5%) |
| 3 or 4 Unit Apartments | 0 (0.0%) | 99 (100.0%) |
| 5 to 9 Unit Apartments | 0 (0.0%) | 55 (100.0%) |
| 10 or more Apartments | 0 (0.0%) | 417 (100.0%) |
| Mobile Home / Other | 7 (58.3%) | 5 (41.7%) |
| Total | 726 (44.4%) | 908 (55.6%) |
Housing Structures by Number of Rooms in California borough
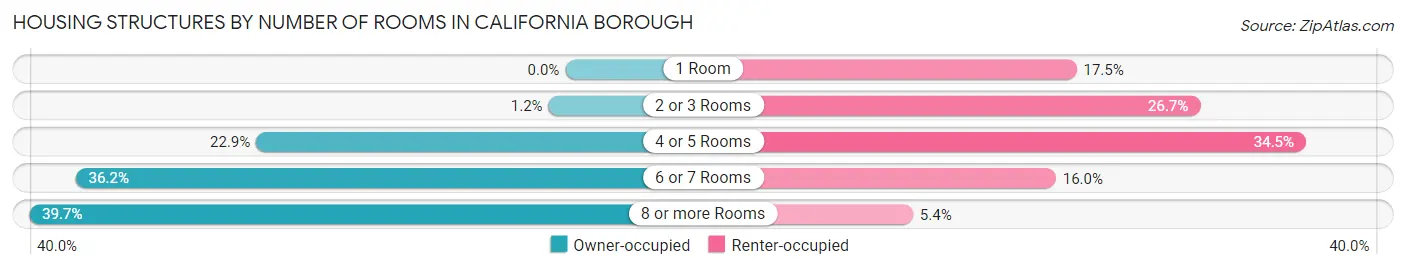
| Number of Rooms | Owner-occupied | Renter-occupied |
| 1 Room | 0 (0.0%) | 159 (17.5%) |
| 2 or 3 Rooms | 9 (1.2%) | 242 (26.7%) |
| 4 or 5 Rooms | 166 (22.9%) | 313 (34.5%) |
| 6 or 7 Rooms | 263 (36.2%) | 145 (16.0%) |
| 8 or more Rooms | 288 (39.7%) | 49 (5.4%) |
| Total | 726 (100.0%) | 908 (100.0%) |
Housing Structure by Heating Type in California borough
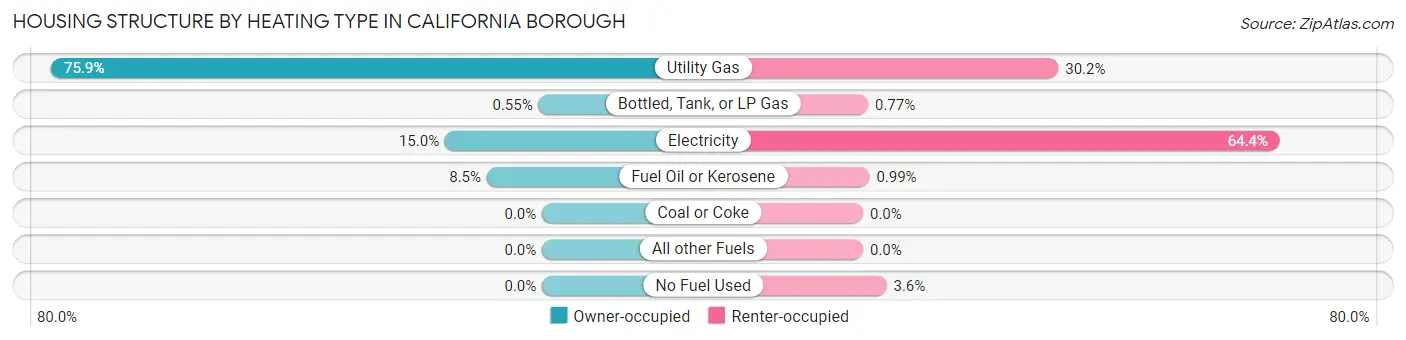
| Heating Type | Owner-occupied | Renter-occupied |
| Utility Gas | 551 (75.9%) | 274 (30.2%) |
| Bottled, Tank, or LP Gas | 4 (0.5%) | 7 (0.8%) |
| Electricity | 109 (15.0%) | 585 (64.4%) |
| Fuel Oil or Kerosene | 62 (8.5%) | 9 (1.0%) |
| Coal or Coke | 0 (0.0%) | 0 (0.0%) |
| All other Fuels | 0 (0.0%) | 0 (0.0%) |
| No Fuel Used | 0 (0.0%) | 33 (3.6%) |
| Total | 726 (100.0%) | 908 (100.0%) |
Household Vehicle Usage in California borough
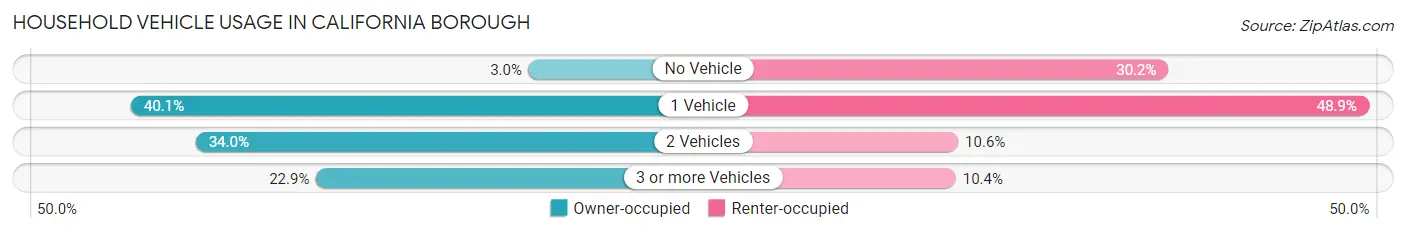
| Vehicles per Household | Owner-occupied | Renter-occupied |
| No Vehicle | 22 (3.0%) | 274 (30.2%) |
| 1 Vehicle | 291 (40.1%) | 444 (48.9%) |
| 2 Vehicles | 247 (34.0%) | 96 (10.6%) |
| 3 or more Vehicles | 166 (22.9%) | 94 (10.3%) |
| Total | 726 (100.0%) | 908 (100.0%) |
Real Estate & Mortgages in California borough
Real Estate and Mortgage Overview in California borough
| Characteristic | Without Mortgage | With Mortgage |
| Housing Units | 363 | 363 |
| Median Property Value | $99,100 | $120,500 |
| Median Household Income | $78,393 | $120 |
| Monthly Housing Costs | $461 | $0 |
| Real Estate Taxes | $878 | $0 |
Property Value by Mortgage Status in California borough
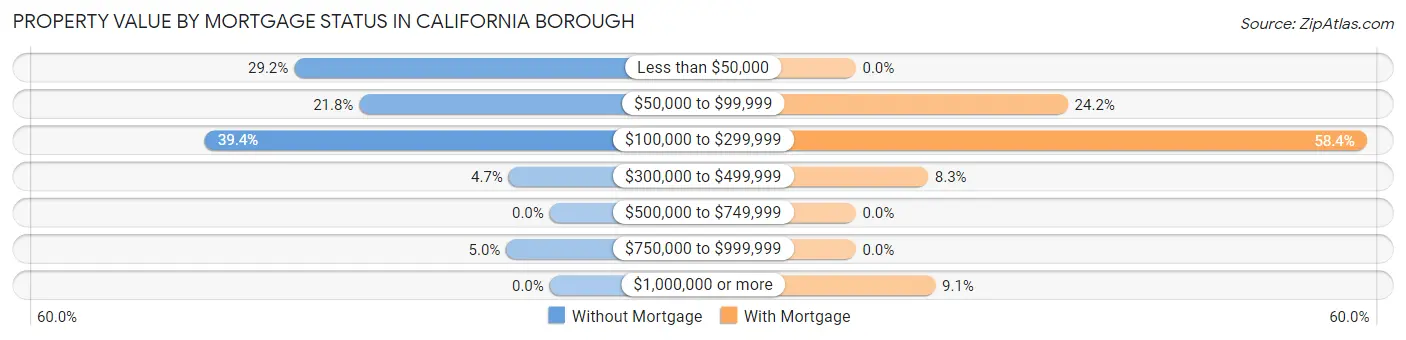
| Property Value | Without Mortgage | With Mortgage |
| Less than $50,000 | 106 (29.2%) | 0 (0.0%) |
| $50,000 to $99,999 | 79 (21.8%) | 88 (24.2%) |
| $100,000 to $299,999 | 143 (39.4%) | 212 (58.4%) |
| $300,000 to $499,999 | 17 (4.7%) | 30 (8.3%) |
| $500,000 to $749,999 | 0 (0.0%) | 0 (0.0%) |
| $750,000 to $999,999 | 18 (5.0%) | 0 (0.0%) |
| $1,000,000 or more | 0 (0.0%) | 33 (9.1%) |
| Total | 363 (100.0%) | 363 (100.0%) |
Household Income by Mortgage Status in California borough
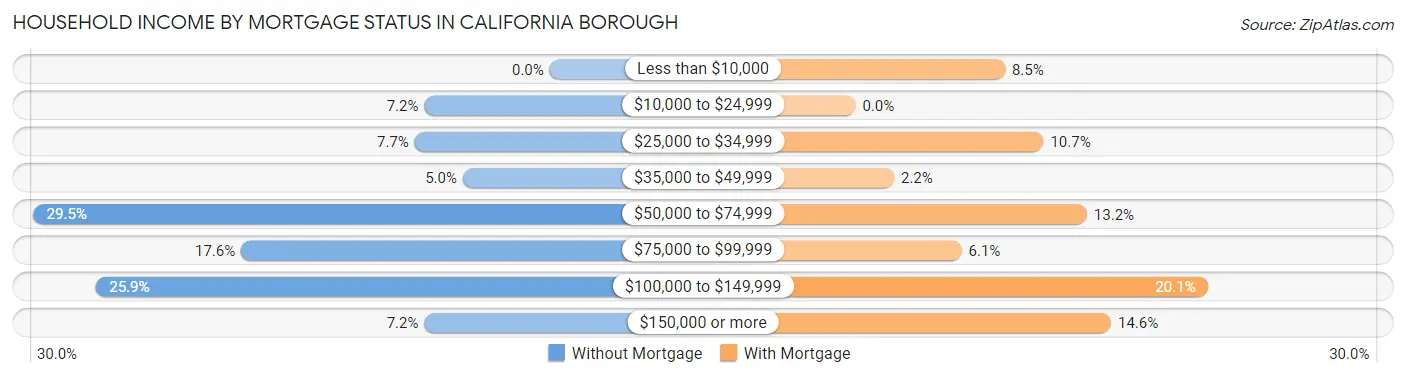
| Household Income | Without Mortgage | With Mortgage |
| Less than $10,000 | 0 (0.0%) | 31 (8.5%) |
| $10,000 to $24,999 | 26 (7.2%) | 0 (0.0%) |
| $25,000 to $34,999 | 28 (7.7%) | 39 (10.7%) |
| $35,000 to $49,999 | 18 (5.0%) | 8 (2.2%) |
| $50,000 to $74,999 | 107 (29.5%) | 48 (13.2%) |
| $75,000 to $99,999 | 64 (17.6%) | 22 (6.1%) |
| $100,000 to $149,999 | 94 (25.9%) | 73 (20.1%) |
| $150,000 or more | 26 (7.2%) | 53 (14.6%) |
| Total | 363 (100.0%) | 363 (100.0%) |
Property Value to Household Income Ratio in California borough
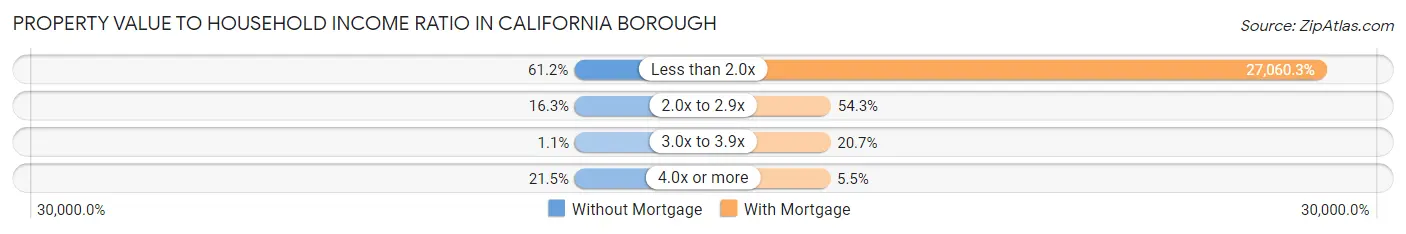
| Value-to-Income Ratio | Without Mortgage | With Mortgage |
| Less than 2.0x | 222 (61.2%) | 98,229 (27,060.3%) |
| 2.0x to 2.9x | 59 (16.3%) | 197 (54.3%) |
| 3.0x to 3.9x | 4 (1.1%) | 75 (20.7%) |
| 4.0x or more | 78 (21.5%) | 20 (5.5%) |
| Total | 363 (100.0%) | 363 (100.0%) |
Real Estate Taxes by Mortgage Status in California borough
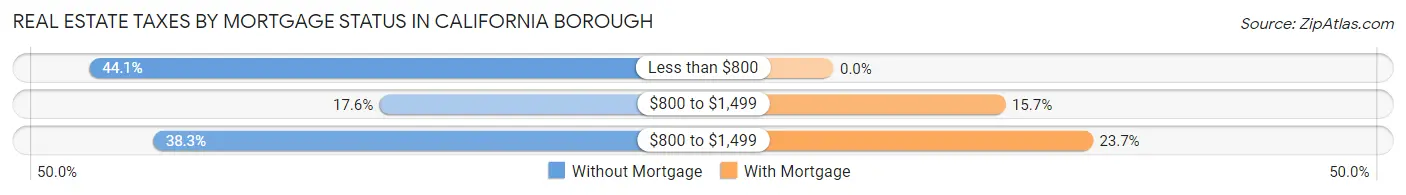
| Property Taxes | Without Mortgage | With Mortgage |
| Less than $800 | 160 (44.1%) | 0 (0.0%) |
| $800 to $1,499 | 64 (17.6%) | 57 (15.7%) |
| $800 to $1,499 | 139 (38.3%) | 86 (23.7%) |
| Total | 363 (100.0%) | 363 (100.0%) |
Health & Disability in California borough
Health Insurance Coverage by Age in California borough
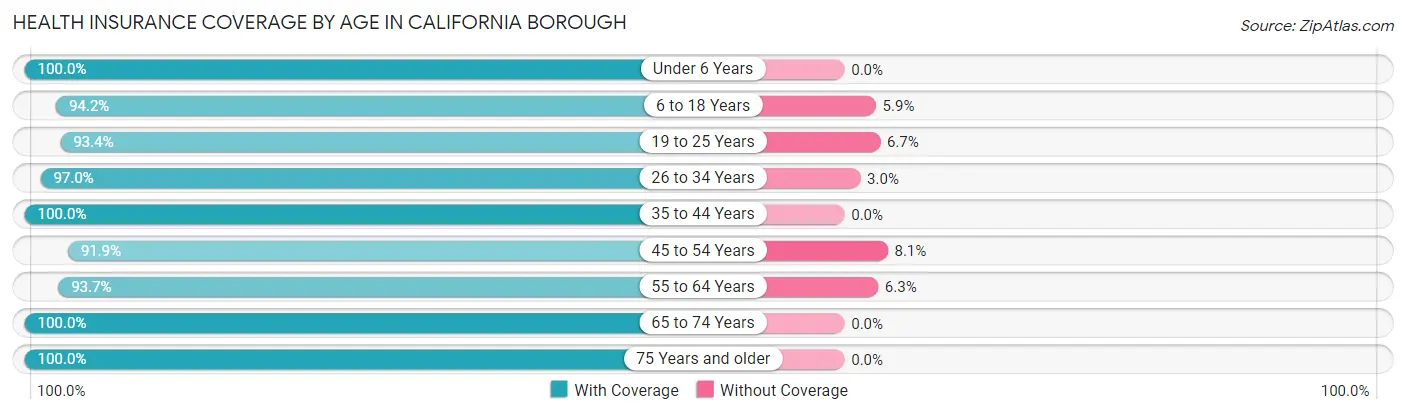
| Age Bracket | With Coverage | Without Coverage |
| Under 6 Years | 97 (100.0%) | 0 (0.0%) |
| 6 to 18 Years | 1,047 (94.2%) | 65 (5.9%) |
| 19 to 25 Years | 1,895 (93.3%) | 135 (6.7%) |
| 26 to 34 Years | 262 (97.0%) | 8 (3.0%) |
| 35 to 44 Years | 336 (100.0%) | 0 (0.0%) |
| 45 to 54 Years | 342 (91.9%) | 30 (8.1%) |
| 55 to 64 Years | 329 (93.7%) | 22 (6.3%) |
| 65 to 74 Years | 354 (100.0%) | 0 (0.0%) |
| 75 Years and older | 406 (100.0%) | 0 (0.0%) |
| Total | 5,068 (95.1%) | 260 (4.9%) |
Health Insurance Coverage by Citizenship Status in California borough
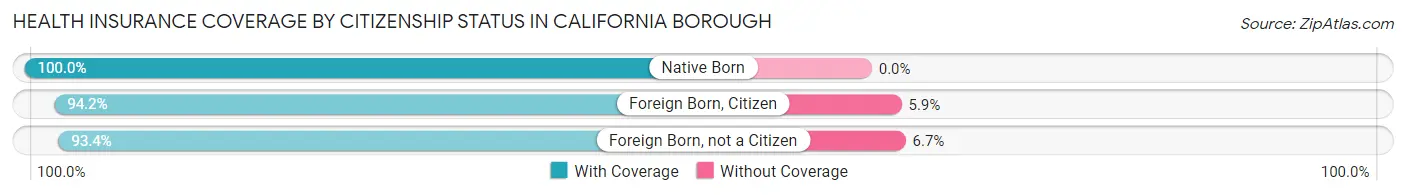
| Citizenship Status | With Coverage | Without Coverage |
| Native Born | 97 (100.0%) | 0 (0.0%) |
| Foreign Born, Citizen | 1,047 (94.2%) | 65 (5.9%) |
| Foreign Born, not a Citizen | 1,895 (93.3%) | 135 (6.7%) |
Health Insurance Coverage by Household Income in California borough
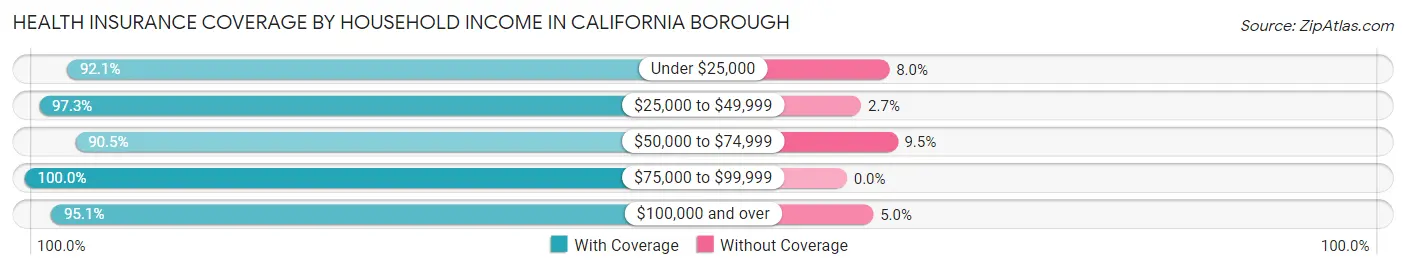
| Household Income | With Coverage | Without Coverage |
| Under $25,000 | 695 (92.0%) | 60 (8.0%) |
| $25,000 to $49,999 | 833 (97.3%) | 23 (2.7%) |
| $50,000 to $74,999 | 391 (90.5%) | 41 (9.5%) |
| $75,000 to $99,999 | 517 (100.0%) | 0 (0.0%) |
| $100,000 and over | 921 (95.1%) | 48 (5.0%) |
Public vs Private Health Insurance Coverage by Age in California borough
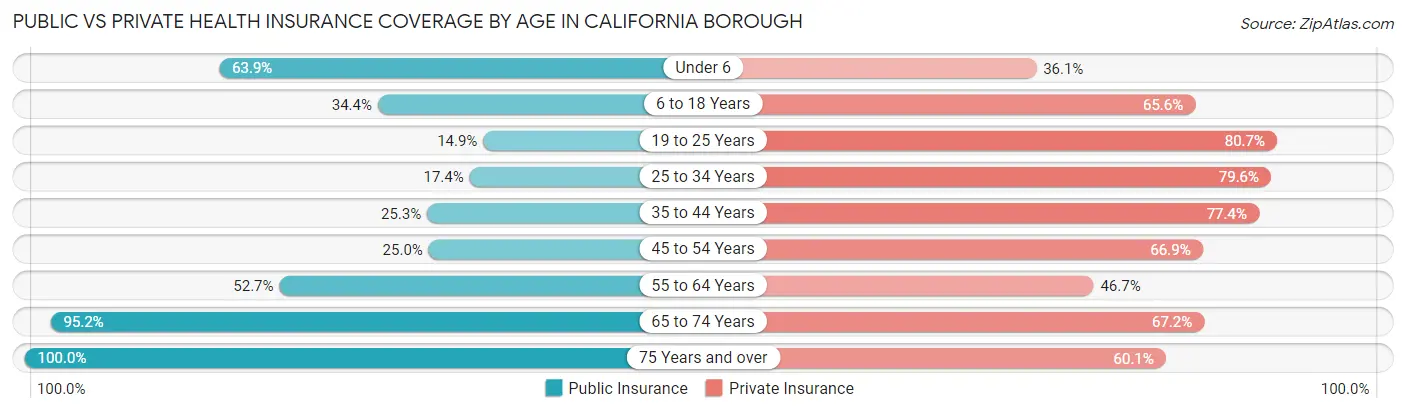
| Age Bracket | Public Insurance | Private Insurance |
| Under 6 | 62 (63.9%) | 35 (36.1%) |
| 6 to 18 Years | 383 (34.4%) | 729 (65.6%) |
| 19 to 25 Years | 302 (14.9%) | 1,639 (80.7%) |
| 25 to 34 Years | 47 (17.4%) | 215 (79.6%) |
| 35 to 44 Years | 85 (25.3%) | 260 (77.4%) |
| 45 to 54 Years | 93 (25.0%) | 249 (66.9%) |
| 55 to 64 Years | 185 (52.7%) | 164 (46.7%) |
| 65 to 74 Years | 337 (95.2%) | 238 (67.2%) |
| 75 Years and over | 406 (100.0%) | 244 (60.1%) |
| Total | 1,900 (35.7%) | 3,773 (70.8%) |
Disability Status by Sex by Age in California borough
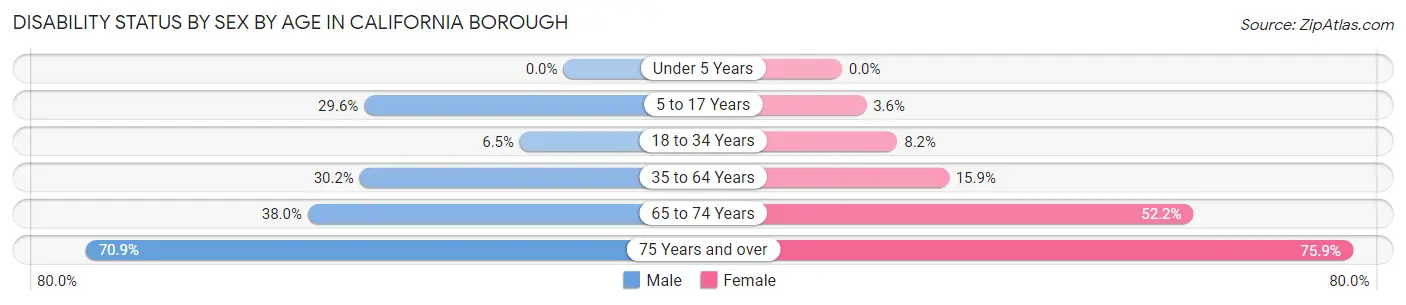
| Age Bracket | Male | Female |
| Under 5 Years | 0 (0.0%) | 0 (0.0%) |
| 5 to 17 Years | 71 (29.6%) | 14 (3.6%) |
| 18 to 34 Years | 86 (6.5%) | 121 (8.2%) |
| 35 to 64 Years | 166 (30.2%) | 81 (15.9%) |
| 65 to 74 Years | 74 (38.0%) | 83 (52.2%) |
| 75 Years and over | 100 (70.9%) | 201 (75.8%) |
Disability Class by Sex by Age in California borough
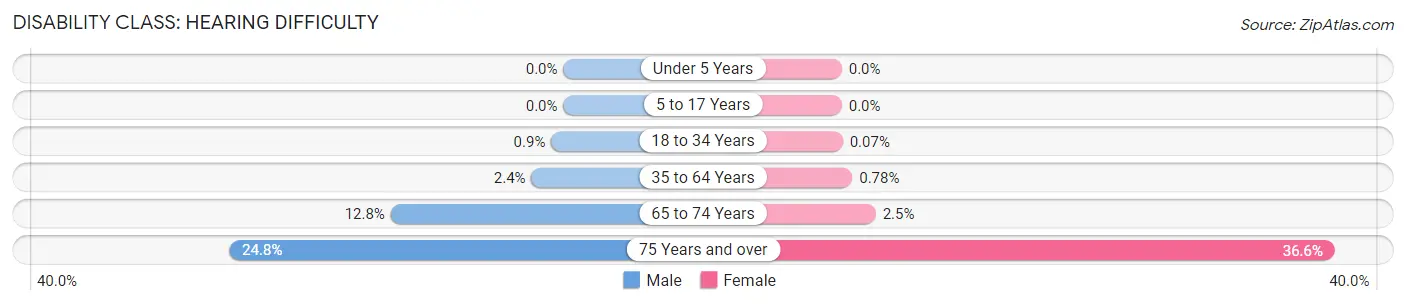
Disability Class: Hearing Difficulty
| Age Bracket | Male | Female |
| Under 5 Years | 0 (0.0%) | 0 (0.0%) |
| 5 to 17 Years | 0 (0.0%) | 0 (0.0%) |
| 18 to 34 Years | 12 (0.9%) | 1 (0.1%) |
| 35 to 64 Years | 13 (2.4%) | 4 (0.8%) |
| 65 to 74 Years | 25 (12.8%) | 4 (2.5%) |
| 75 Years and over | 35 (24.8%) | 97 (36.6%) |
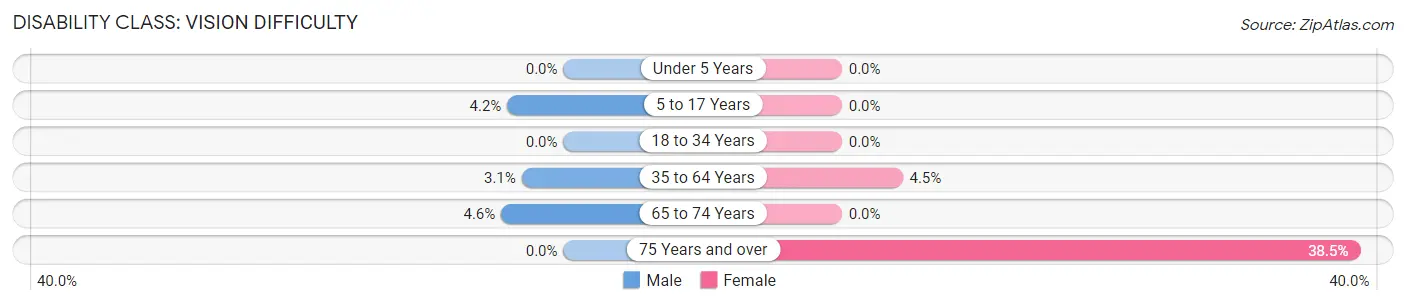
Disability Class: Vision Difficulty
| Age Bracket | Male | Female |
| Under 5 Years | 0 (0.0%) | 0 (0.0%) |
| 5 to 17 Years | 10 (4.2%) | 0 (0.0%) |
| 18 to 34 Years | 0 (0.0%) | 0 (0.0%) |
| 35 to 64 Years | 17 (3.1%) | 23 (4.5%) |
| 65 to 74 Years | 9 (4.6%) | 0 (0.0%) |
| 75 Years and over | 0 (0.0%) | 102 (38.5%) |
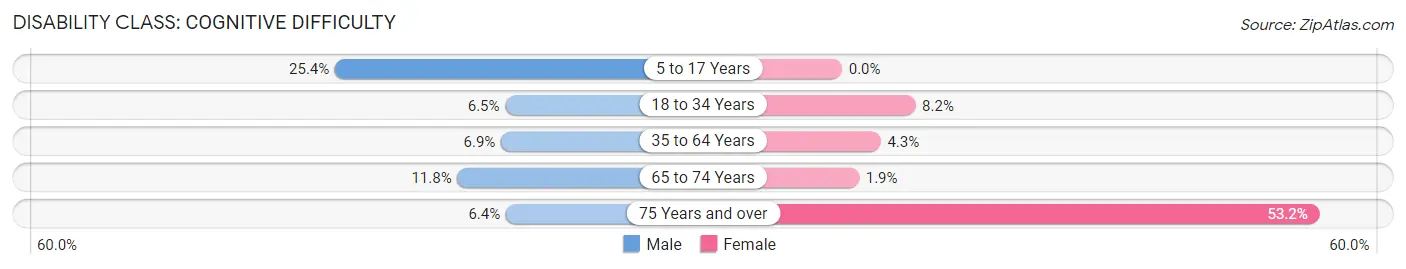
Disability Class: Cognitive Difficulty
| Age Bracket | Male | Female |
| 5 to 17 Years | 61 (25.4%) | 0 (0.0%) |
| 18 to 34 Years | 86 (6.5%) | 120 (8.2%) |
| 35 to 64 Years | 38 (6.9%) | 22 (4.3%) |
| 65 to 74 Years | 23 (11.8%) | 3 (1.9%) |
| 75 Years and over | 9 (6.4%) | 141 (53.2%) |
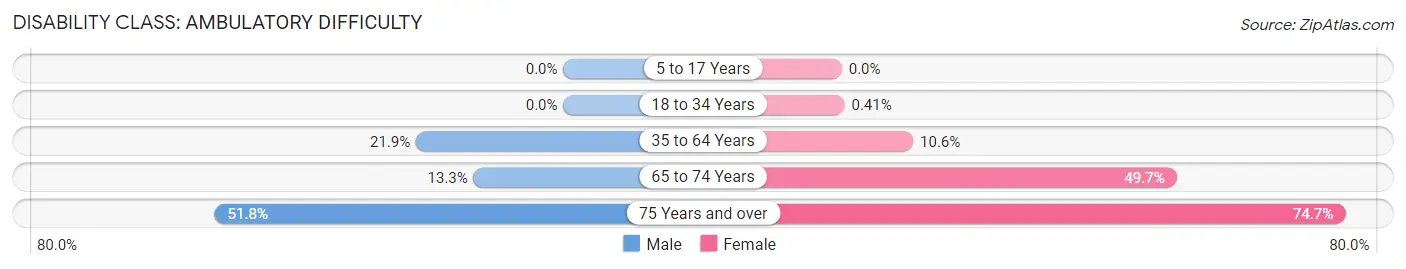
Disability Class: Ambulatory Difficulty
| Age Bracket | Male | Female |
| 5 to 17 Years | 0 (0.0%) | 0 (0.0%) |
| 18 to 34 Years | 0 (0.0%) | 6 (0.4%) |
| 35 to 64 Years | 120 (21.9%) | 54 (10.6%) |
| 65 to 74 Years | 26 (13.3%) | 79 (49.7%) |
| 75 Years and over | 73 (51.8%) | 198 (74.7%) |
Disability Class: Self-Care Difficulty
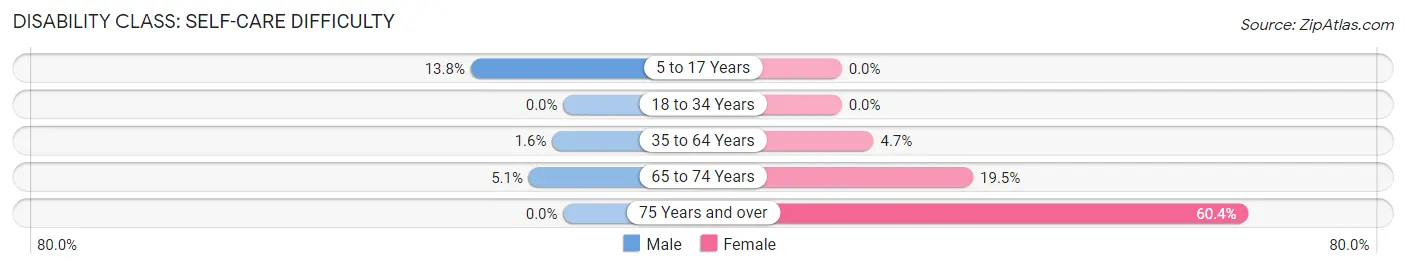
| Age Bracket | Male | Female |
| 5 to 17 Years | 33 (13.8%) | 0 (0.0%) |
| 18 to 34 Years | 0 (0.0%) | 0 (0.0%) |
| 35 to 64 Years | 9 (1.6%) | 24 (4.7%) |
| 65 to 74 Years | 10 (5.1%) | 31 (19.5%) |
| 75 Years and over | 0 (0.0%) | 160 (60.4%) |
Technology Access in California borough
Computing Device Access in California borough
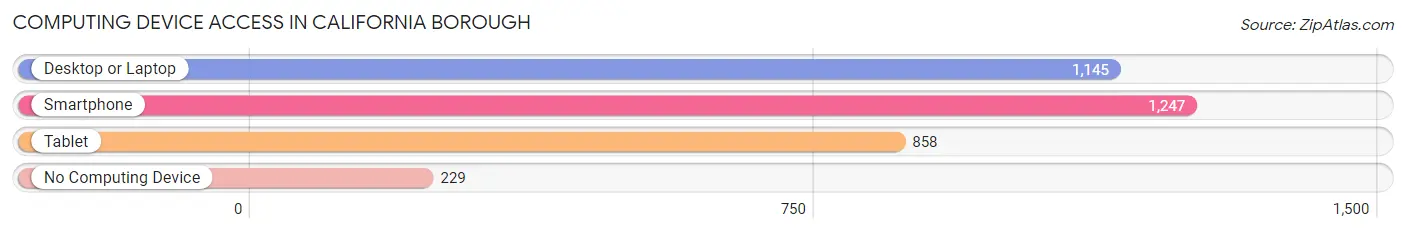
| Device Type | # Households | % Households |
| Desktop or Laptop | 1,145 | 70.1% |
| Smartphone | 1,247 | 76.3% |
| Tablet | 858 | 52.5% |
| No Computing Device | 229 | 14.0% |
| Total | 1,634 | 100.0% |
Internet Access in California borough
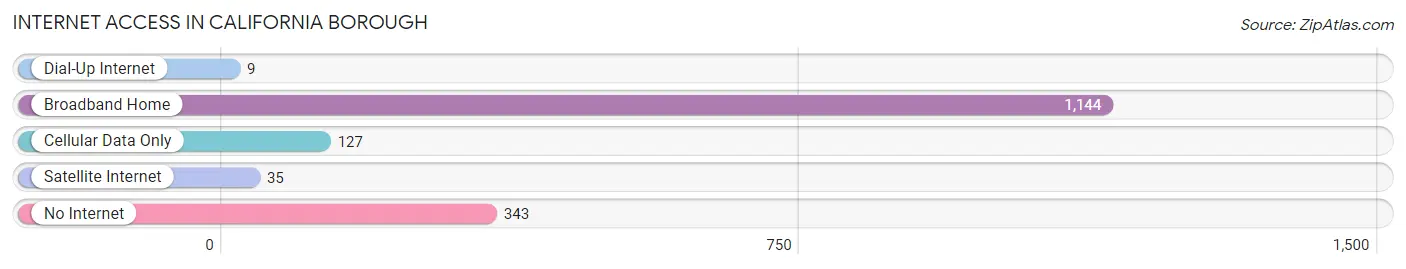
| Internet Type | # Households | % Households |
| Dial-Up Internet | 9 | 0.5% |
| Broadband Home | 1,144 | 70.0% |
| Cellular Data Only | 127 | 7.8% |
| Satellite Internet | 35 | 2.1% |
| No Internet | 343 | 21.0% |
| Total | 1,634 | 100.0% |
California borough Summary
Borough of California, Pennsylvania is a borough located in Washington County, Pennsylvania. It is part of the Pittsburgh metropolitan area. The population was 1,717 at the 2010 census.
History
The area that is now California Borough was first settled in 1769 by a group of Scots-Irish immigrants. The town was originally known as "Falling Spring" due to the abundance of waterfalls in the area. In 1839, the town was renamed "California" after the California Gold Rush.
The town was officially incorporated as a borough in 1868. The town grew rapidly in the late 19th and early 20th centuries due to the coal mining industry. The town was home to several coal mines, including the California Coal Company, which operated from 1872 to 1923.
Geography
California Borough is located at 40°10'25"N 80°10'25"W (40.173611, -80.173611). It is situated along the Monongahela River in western Pennsylvania.
The borough has a total area of 0 9 square miles all of which is land
Economy
The economy of California Borough is largely based on the coal mining industry. The town is home to several coal mines, including the California Coal Company, which operated from 1872 to 1923.
The town is also home to several small businesses, including restaurants, retail stores, and service providers.
Demographics
As of the 2010 census, the population of California Borough was 1,717. The racial makeup of the borough was 97.2% White, 0.9% African American, 0.2% Native American, 0.2% Asian, 0.1% from other races, and 1.4% from two or more races. Hispanic or Latino of any race were 0.7% of the population.
The median income for a household in the borough was $37,917, and the median income for a family was $45,000. The per capita income for the borough was $17,917. About 11.2% of families and 13.2% of the population were below the poverty line, including 17.2% of those under age 18 and 8.2% of those age 65 or over.
Conclusion
California Borough is a small borough located in Washington County, Pennsylvania. It is part of the Pittsburgh metropolitan area and has a population of 1,717 as of the 2010 census. The economy of the borough is largely based on the coal mining industry, and the town is home to several small businesses. The racial makeup of the borough is predominantly White, with a small percentage of African American, Native American, and Asian residents. The median income for a household in the borough is $37,917, and the per capita income is $17,917.
Common Questions
What is the Total Population of California borough?
Total Population of California borough is 5,328.
What is the Total Male Population of California borough?
Total Male Population of California borough is 2,499.
What is the Total Female Population of California borough?
Total Female Population of California borough is 2,829.
What is the Ratio of Males per 100 Females in California borough?
There are 88.34 Males per 100 Females in California borough.
What is the Ratio of Females per 100 Males in California borough?
There are 113.21 Females per 100 Males in California borough.
What is the Median Population Age in California borough?
Median Population Age in California borough is 21.9 Years.
What is the Average Family Size in California borough
Average Family Size in California borough is 2.9 People.
What is the Average Household Size in California borough
Average Household Size in California borough is 2.2 People.
What is Per Capita Income in California borough?
Per Capita income in California borough is $21,658.
What is the Median Family Income in California borough?
Median Family Income in California borough is $76,103.
What is the Median Household income in California borough?
Median Household Income in California borough is $46,471.
What is Income or Wage Gap in California borough?
Income or Wage Gap in California borough is 5.6%.
Women in California borough earn 94.4 cents for every dollar earned by a man.
What is Inequality or Gini Index in California borough?
Inequality or Gini Index in California borough is 0.45.
How Large is the Labor Force in California borough?
There are 2,823 People in the Labor Forcein in California borough.
What is the Percentage of People in the Labor Force in California borough?
59.6% of People are in the Labor Force in California borough.
What is the Unemployment Rate in California borough?
Unemployment Rate in California borough is 10.2%.