Selinsgrove borough, PA
Selinsgrove borough Overview
5,710
TOTAL POPULATION
2,756
MALE POPULATION
2,954
FEMALE POPULATION
93.30
MALES / 100 FEMALES
107.18
FEMALES / 100 MALES
24.0
MEDIAN AGE
2.8
AVG FAMILY SIZE
1.9
AVG HOUSEHOLD SIZE
$24,854
PER CAPITA INCOME
$81,908
AVG FAMILY INCOME
$56,295
AVG HOUSEHOLD INCOME
67.0%
WAGE / INCOME GAP [ % ]
33.0¢/ $1
WAGE / INCOME GAP [ $ ]
0.41
INEQUALITY / GINI INDEX
2,979
LABOR FORCE [ PEOPLE ]
56.7%
PERCENT IN LABOR FORCE
1.5%
UNEMPLOYMENT RATE
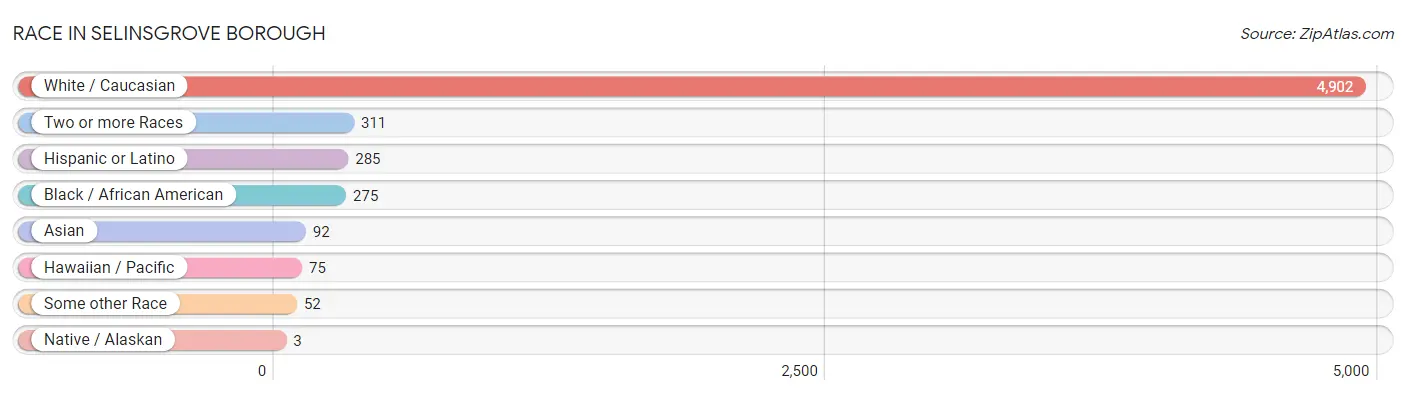
Race in Selinsgrove borough
The most populous races in Selinsgrove borough are White / Caucasian (4,902 | 85.9%), Two or more Races (311 | 5.4%), and Hispanic or Latino (285 | 5.0%).
| Race | # Population | % Population |
| Asian | 92 | 1.6% |
| Black / African American | 275 | 4.8% |
| Hawaiian / Pacific | 75 | 1.3% |
| Hispanic or Latino | 285 | 5.0% |
| Native / Alaskan | 3 | 0.1% |
| White / Caucasian | 4,902 | 85.9% |
| Two or more Races | 311 | 5.4% |
| Some other Race | 52 | 0.9% |
| Total | 5,710 | 100.0% |
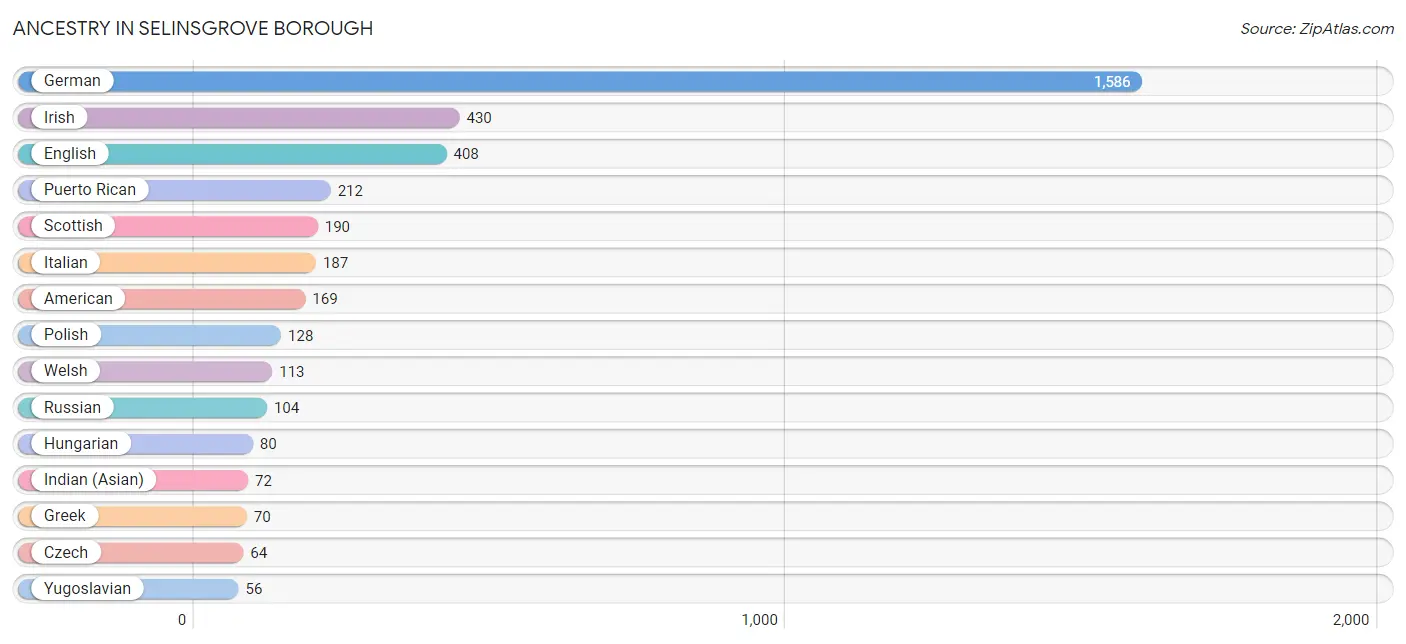
Ancestry in Selinsgrove borough
The most populous ancestries reported in Selinsgrove borough are German (1,586 | 27.8%), Irish (430 | 7.5%), English (408 | 7.1%), Puerto Rican (212 | 3.7%), and Scottish (190 | 3.3%), together accounting for 49.5% of all Selinsgrove borough residents.
| Ancestry | # Population | % Population |
| Albanian | 3 | 0.1% |
| American | 169 | 3.0% |
| Arab | 5 | 0.1% |
| Armenian | 4 | 0.1% |
| Austrian | 9 | 0.2% |
| Belgian | 6 | 0.1% |
| British | 31 | 0.5% |
| Burmese | 28 | 0.5% |
| Cherokee | 3 | 0.1% |
| Cuban | 23 | 0.4% |
| Czech | 64 | 1.1% |
| Czechoslovakian | 3 | 0.1% |
| Danish | 19 | 0.3% |
| Dutch | 51 | 0.9% |
| English | 408 | 7.1% |
| European | 30 | 0.5% |
| French | 38 | 0.7% |
| French Canadian | 36 | 0.6% |
| German | 1,586 | 27.8% |
| Greek | 70 | 1.2% |
| Hungarian | 80 | 1.4% |
| Indian (Asian) | 72 | 1.3% |
| Irish | 430 | 7.5% |
| Iroquois | 1 | 0.0% |
| Italian | 187 | 3.3% |
| Jamaican | 20 | 0.4% |
| Lebanese | 5 | 0.1% |
| Lithuanian | 19 | 0.3% |
| Luxembourger | 14 | 0.3% |
| Mexican | 39 | 0.7% |
| Nigerian | 6 | 0.1% |
| Norwegian | 24 | 0.4% |
| Pennsylvania German | 39 | 0.7% |
| Peruvian | 11 | 0.2% |
| Polish | 128 | 2.2% |
| Portuguese | 19 | 0.3% |
| Puerto Rican | 212 | 3.7% |
| Russian | 104 | 1.8% |
| Scandinavian | 9 | 0.2% |
| Scotch-Irish | 11 | 0.2% |
| Scottish | 190 | 3.3% |
| Slovak | 21 | 0.4% |
| South American | 11 | 0.2% |
| Subsaharan African | 6 | 0.1% |
| Swedish | 21 | 0.4% |
| Swiss | 23 | 0.4% |
| Thai | 17 | 0.3% |
| Ukrainian | 7 | 0.1% |
| Welsh | 113 | 2.0% |
| Yugoslavian | 56 | 1.0% | View All 50 Rows |
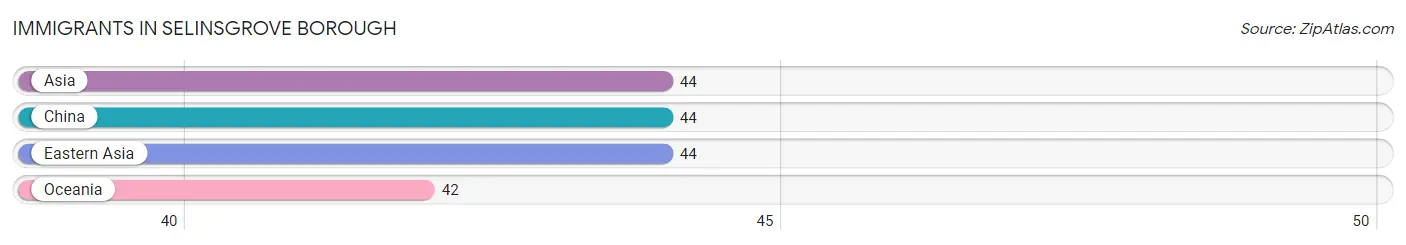
Immigrants in Selinsgrove borough
The most numerous immigrant groups reported in Selinsgrove borough came from Asia (44 | 0.8%), China (44 | 0.8%), Eastern Asia (44 | 0.8%), and Oceania (42 | 0.7%), together accounting for 3.1% of all Selinsgrove borough residents.
| Immigration Origin | # Population | % Population |
| Asia | 44 | 0.8% |
| China | 44 | 0.8% |
| Eastern Asia | 44 | 0.8% |
| Oceania | 42 | 0.7% | View All 4 Rows |
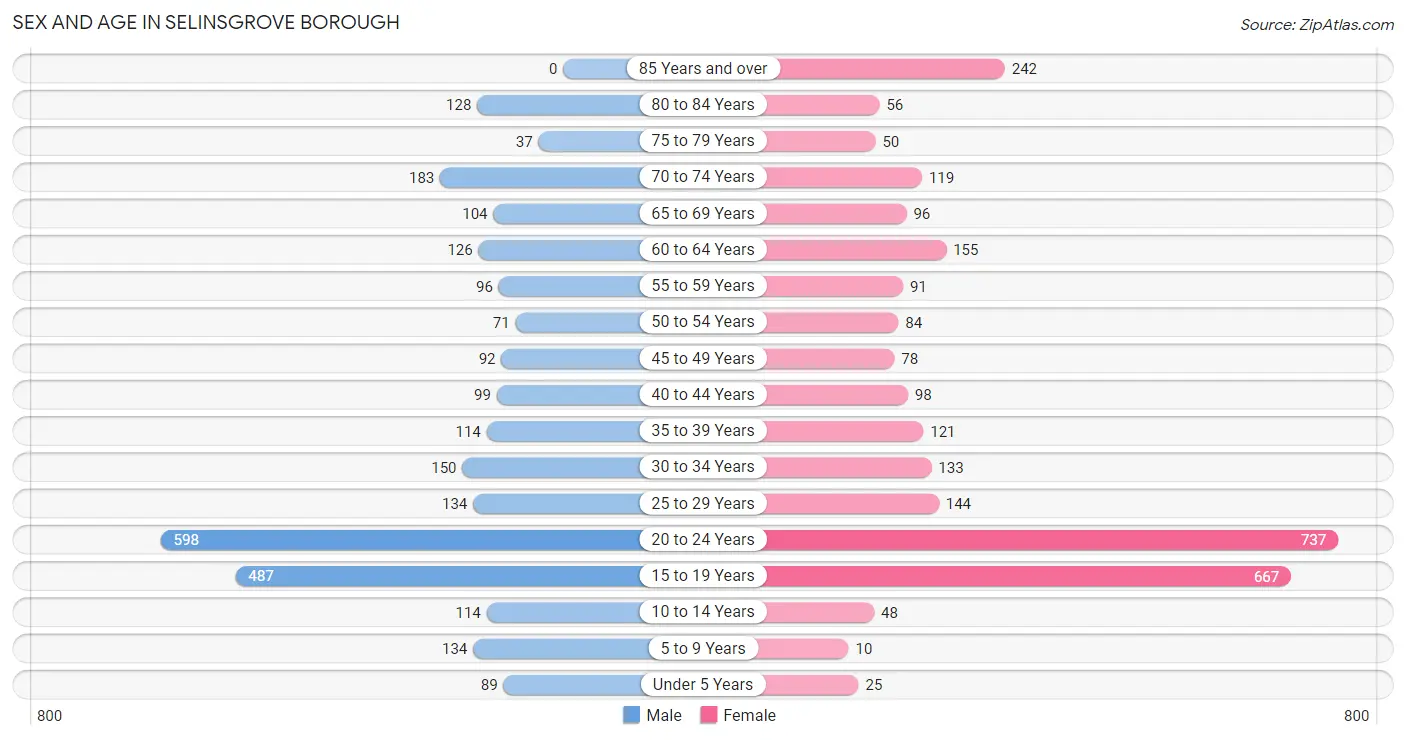
Sex and Age in Selinsgrove borough
Sex and Age in Selinsgrove borough
The most populous age groups in Selinsgrove borough are 20 to 24 Years (598 | 21.7%) for men and 20 to 24 Years (737 | 24.9%) for women.
| Age Bracket | Male | Female |
| Under 5 Years | 89 (3.2%) | 25 (0.9%) |
| 5 to 9 Years | 134 (4.9%) | 10 (0.3%) |
| 10 to 14 Years | 114 (4.1%) | 48 (1.6%) |
| 15 to 19 Years | 487 (17.7%) | 667 (22.6%) |
| 20 to 24 Years | 598 (21.7%) | 737 (24.9%) |
| 25 to 29 Years | 134 (4.9%) | 144 (4.9%) |
| 30 to 34 Years | 150 (5.4%) | 133 (4.5%) |
| 35 to 39 Years | 114 (4.1%) | 121 (4.1%) |
| 40 to 44 Years | 99 (3.6%) | 98 (3.3%) |
| 45 to 49 Years | 92 (3.3%) | 78 (2.6%) |
| 50 to 54 Years | 71 (2.6%) | 84 (2.8%) |
| 55 to 59 Years | 96 (3.5%) | 91 (3.1%) |
| 60 to 64 Years | 126 (4.6%) | 155 (5.2%) |
| 65 to 69 Years | 104 (3.8%) | 96 (3.3%) |
| 70 to 74 Years | 183 (6.6%) | 119 (4.0%) |
| 75 to 79 Years | 37 (1.3%) | 50 (1.7%) |
| 80 to 84 Years | 128 (4.6%) | 56 (1.9%) |
| 85 Years and over | 0 (0.0%) | 242 (8.2%) |
| Total | 2,756 (100.0%) | 2,954 (100.0%) |
Families and Households in Selinsgrove borough
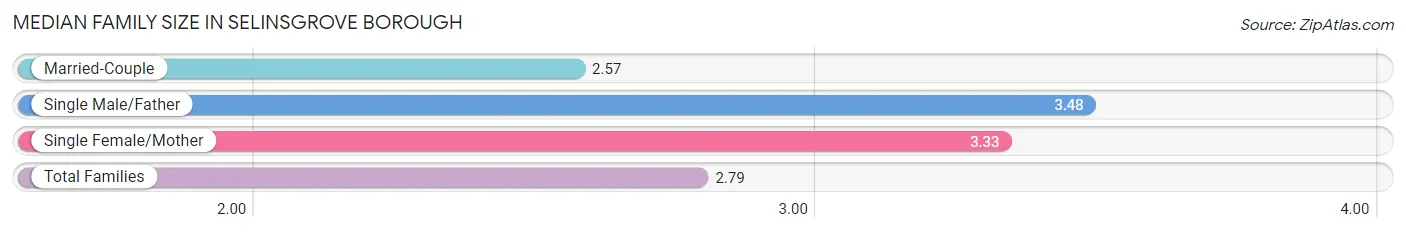
Median Family Size in Selinsgrove borough
The median family size in Selinsgrove borough is 2.79 persons per family, with single male/father families (40 | 5.1%) accounting for the largest median family size of 3.48 persons per family. On the other hand, married-couple families (559 | 71.2%) represent the smallest median family size with 2.57 persons per family.
| Family Type | # Families | Family Size |
| Married-Couple | 559 (71.2%) | 2.57 |
| Single Male/Father | 40 (5.1%) | 3.48 |
| Single Female/Mother | 186 (23.7%) | 3.33 |
| Total Families | 785 (100.0%) | 2.79 |
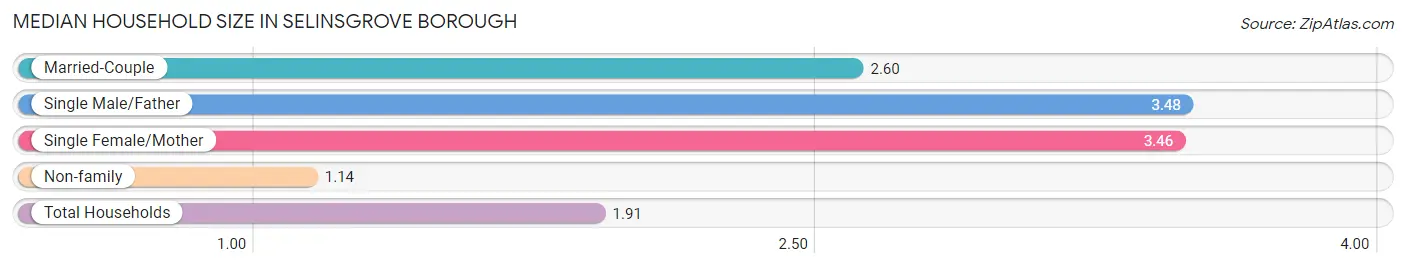
Median Household Size in Selinsgrove borough
The median household size in Selinsgrove borough is 1.91 persons per household, with single male/father households (40 | 2.3%) accounting for the largest median household size of 3.48 persons per household. non-family households (950 | 54.8%) represent the smallest median household size with 1.14 persons per household.
| Household Type | # Households | Household Size |
| Married-Couple | 559 (32.2%) | 2.60 |
| Single Male/Father | 40 (2.3%) | 3.48 |
| Single Female/Mother | 186 (10.7%) | 3.46 |
| Non-family | 950 (54.8%) | 1.14 |
| Total Households | 1,735 (100.0%) | 1.91 |
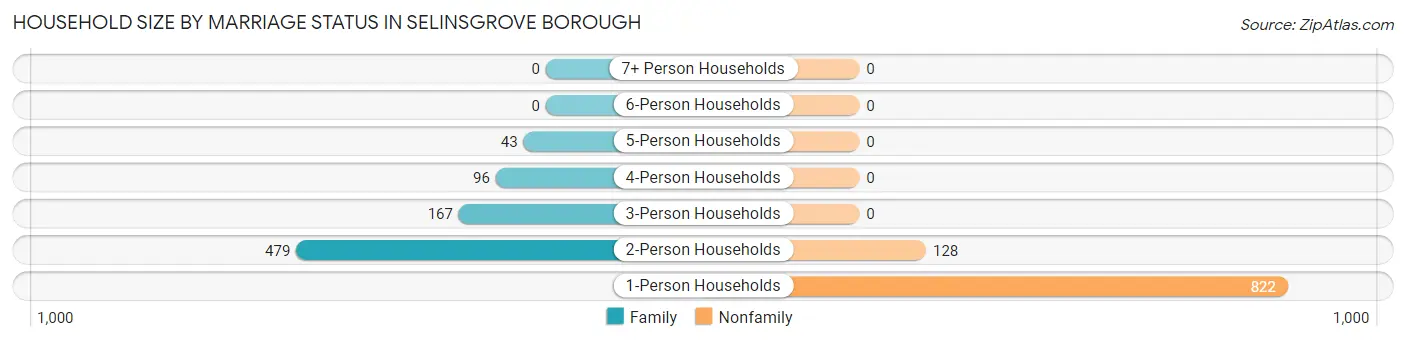
Household Size by Marriage Status in Selinsgrove borough
Out of a total of 1,735 households in Selinsgrove borough, 785 (45.2%) are family households, while 950 (54.8%) are nonfamily households. The most numerous type of family households are 2-person households, comprising 479, and the most common type of nonfamily households are 1-person households, comprising 822.
| Household Size | Family Households | Nonfamily Households |
| 1-Person Households | - | 822 (47.4%) |
| 2-Person Households | 479 (27.6%) | 128 (7.4%) |
| 3-Person Households | 167 (9.6%) | 0 (0.0%) |
| 4-Person Households | 96 (5.5%) | 0 (0.0%) |
| 5-Person Households | 43 (2.5%) | 0 (0.0%) |
| 6-Person Households | 0 (0.0%) | 0 (0.0%) |
| 7+ Person Households | 0 (0.0%) | 0 (0.0%) |
| Total | 785 (45.2%) | 950 (54.8%) |
Female Fertility in Selinsgrove borough
Fertility by Age in Selinsgrove borough
| Age Bracket | Women with Births | Births / 1,000 Women |
| 15 to 19 years | 0 (0.0%) | 0.0 |
| 20 to 34 years | 0 (0.0%) | 0.0 |
| 35 to 50 years | 0 (0.0%) | 0.0 |
| Total | 0 (0.0%) | 0.0 |
Fertility by Age by Marriage Status in Selinsgrove borough
| Age Bracket | Married | Unmarried |
| 15 to 19 years | 0 (0.0%) | 0 (0.0%) |
| 20 to 34 years | 0 (0.0%) | 0 (0.0%) |
| 35 to 50 years | 0 (0.0%) | 0 (0.0%) |
| Total | 0 (0.0%) | 0 (0.0%) |
Fertility by Education in Selinsgrove borough
| Educational Attainment | Women with Births | Births / 1,000 Women |
| Less than High School | 0 (0.0%) | 0.0 |
| High School Diploma | 0 (0.0%) | 0.0 |
| College or Associate's Degree | 0 (0.0%) | 0.0 |
| Bachelor's Degree | 0 (0.0%) | 0.0 |
| Graduate Degree | 0 (0.0%) | 0.0 |
| Total | 0 (0.0%) | 0.0 |
Fertility by Education by Marriage Status in Selinsgrove borough
| Educational Attainment | Married | Unmarried |
| Less than High School | 0 (0.0%) | 0 (0.0%) |
| High School Diploma | 0 (0.0%) | 0 (0.0%) |
| College or Associate's Degree | 0 (0.0%) | 0 (0.0%) |
| Bachelor's Degree | 0 (0.0%) | 0 (0.0%) |
| Graduate Degree | 0 (0.0%) | 0 (0.0%) |
| Total | 0 (0.0%) | 0 (0.0%) |
Income in Selinsgrove borough
Income Overview in Selinsgrove borough
Per Capita Income in Selinsgrove borough is $24,854, while median incomes of families and households are $81,908 and $56,295 respectively.
| Characteristic | Number | Measure |
| Per Capita Income | 5,710 | $24,854 |
| Median Family Income | 785 | $81,908 |
| Mean Family Income | 785 | $90,812 |
| Median Household Income | 1,735 | $56,295 |
| Mean Household Income | 1,735 | $71,515 |
| Income Deficit | 785 | $0 |
| Wage / Income Gap (%) | 5,710 | 66.98% |
| Wage / Income Gap ($) | 5,710 | 33.02¢ per $1 |
| Gini / Inequality Index | 5,710 | 0.41 |
Earnings by Sex in Selinsgrove borough
Average Earnings in Selinsgrove borough are $11,297, $19,744 for men and $6,519 for women, a difference of 67.0%.
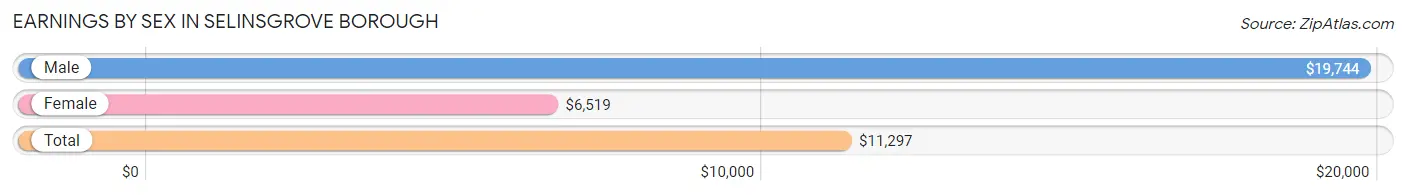
| Sex | Number | Average Earnings |
| Male | 1,864 (48.7%) | $19,744 |
| Female | 1,966 (51.3%) | $6,519 |
| Total | 3,830 (100.0%) | $11,297 |
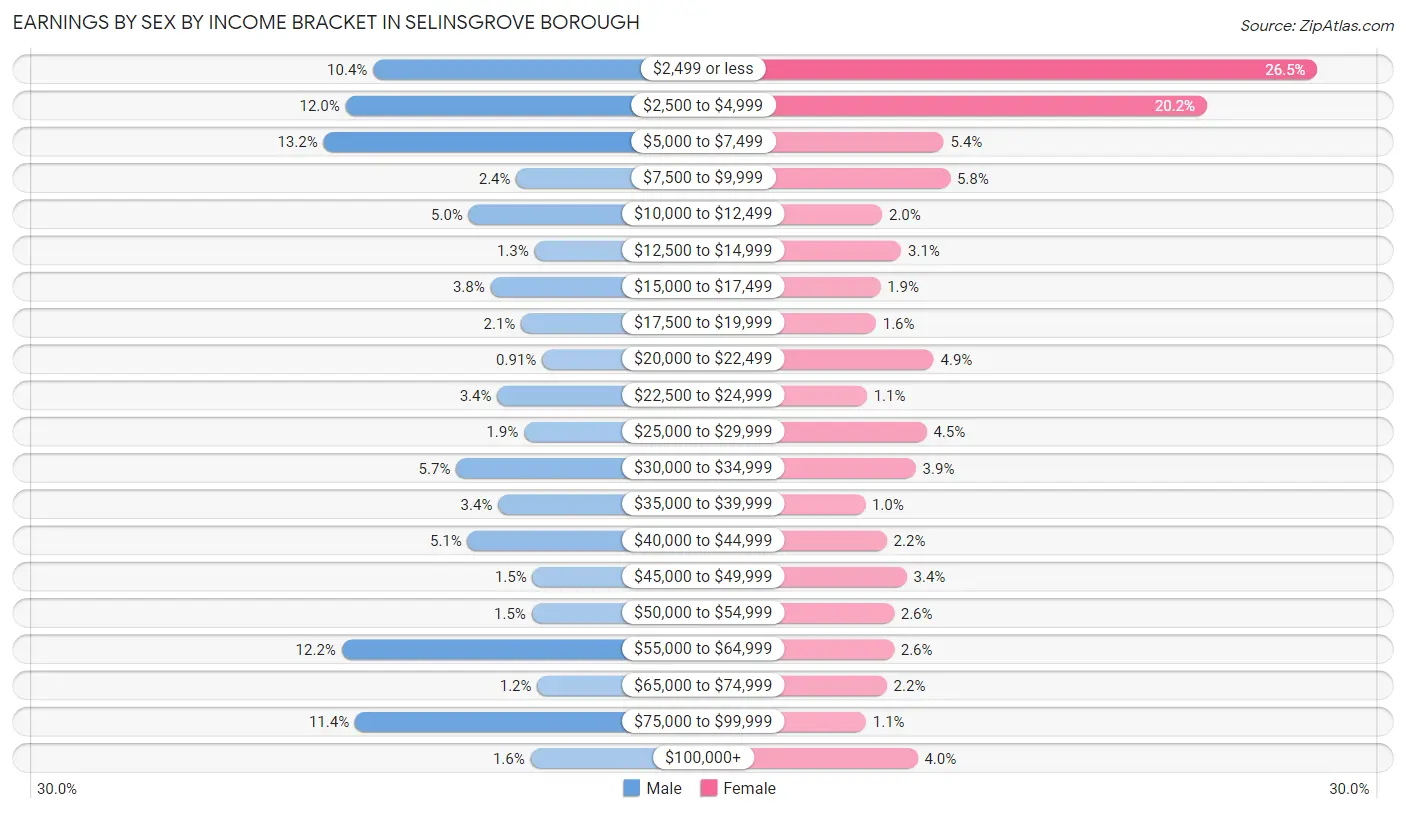
Earnings by Sex by Income Bracket in Selinsgrove borough
The most common earnings brackets in Selinsgrove borough are $5,000 to $7,499 for men (246 | 13.2%) and $2,499 or less for women (520 | 26.5%).
| Income | Male | Female |
| $2,499 or less | 194 (10.4%) | 520 (26.5%) |
| $2,500 to $4,999 | 223 (12.0%) | 398 (20.2%) |
| $5,000 to $7,499 | 246 (13.2%) | 107 (5.4%) |
| $7,500 to $9,999 | 44 (2.4%) | 114 (5.8%) |
| $10,000 to $12,499 | 94 (5.0%) | 39 (2.0%) |
| $12,500 to $14,999 | 25 (1.3%) | 60 (3.0%) |
| $15,000 to $17,499 | 71 (3.8%) | 37 (1.9%) |
| $17,500 to $19,999 | 39 (2.1%) | 32 (1.6%) |
| $20,000 to $22,499 | 17 (0.9%) | 96 (4.9%) |
| $22,500 to $24,999 | 64 (3.4%) | 22 (1.1%) |
| $25,000 to $29,999 | 36 (1.9%) | 88 (4.5%) |
| $30,000 to $34,999 | 107 (5.7%) | 76 (3.9%) |
| $35,000 to $39,999 | 63 (3.4%) | 20 (1.0%) |
| $40,000 to $44,999 | 95 (5.1%) | 44 (2.2%) |
| $45,000 to $49,999 | 27 (1.5%) | 66 (3.4%) |
| $50,000 to $54,999 | 28 (1.5%) | 52 (2.6%) |
| $55,000 to $64,999 | 227 (12.2%) | 52 (2.6%) |
| $65,000 to $74,999 | 22 (1.2%) | 44 (2.2%) |
| $75,000 to $99,999 | 213 (11.4%) | 21 (1.1%) |
| $100,000+ | 29 (1.6%) | 78 (4.0%) |
| Total | 1,864 (100.0%) | 1,966 (100.0%) |
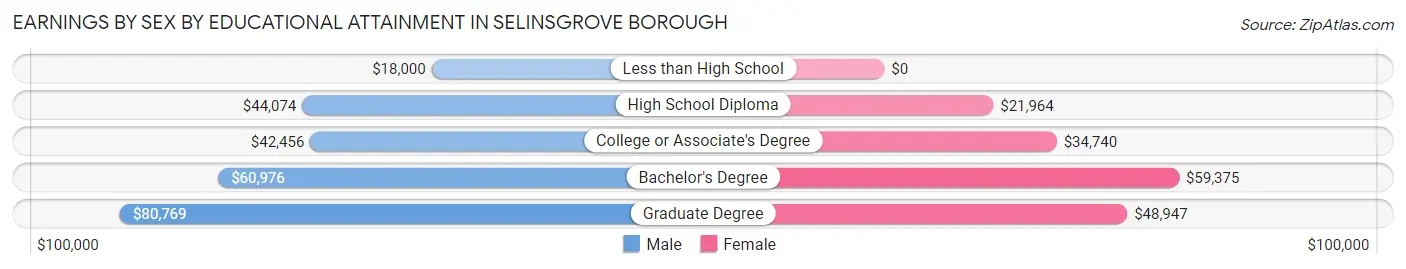
Earnings by Sex by Educational Attainment in Selinsgrove borough
Average earnings in Selinsgrove borough are $54,545 for men and $33,177 for women, a difference of 39.2%. Men with an educational attainment of graduate degree enjoy the highest average annual earnings of $80,769, while those with less than high school education earn the least with $18,000. Women with an educational attainment of bachelor's degree earn the most with the average annual earnings of $59,375, while those with high school diploma education have the smallest earnings of $21,964.
| Educational Attainment | Male Income | Female Income |
| Less than High School | $18,000 | $0 |
| High School Diploma | $44,074 | $21,964 |
| College or Associate's Degree | $42,456 | $34,740 |
| Bachelor's Degree | $60,976 | $59,375 |
| Graduate Degree | $80,769 | $48,947 |
| Total | $54,545 | $33,177 |
Family Income in Selinsgrove borough
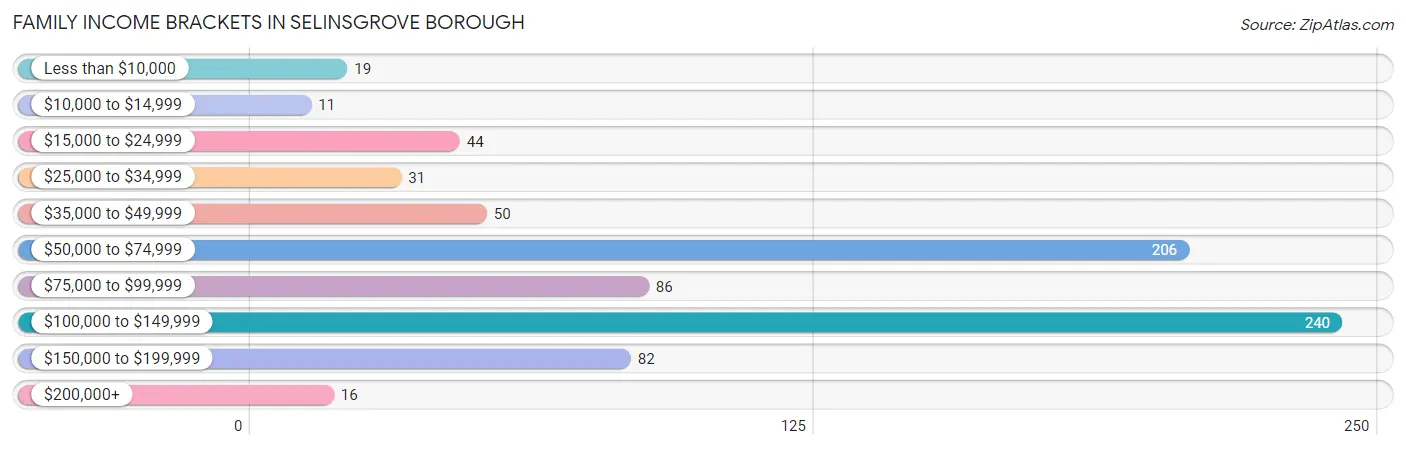
Family Income Brackets in Selinsgrove borough
According to the Selinsgrove borough family income data, there are 240 families falling into the $100,000 to $149,999 income range, which is the most common income bracket and makes up 30.6% of all families. Conversely, the $10,000 to $14,999 income bracket is the least frequent group with only 11 families (1.4%) belonging to this category.
| Income Bracket | # Families | % Families |
| Less than $10,000 | 19 | 2.4% |
| $10,000 to $14,999 | 11 | 1.4% |
| $15,000 to $24,999 | 44 | 5.6% |
| $25,000 to $34,999 | 31 | 3.9% |
| $35,000 to $49,999 | 50 | 6.4% |
| $50,000 to $74,999 | 206 | 26.2% |
| $75,000 to $99,999 | 86 | 11.0% |
| $100,000 to $149,999 | 240 | 30.6% |
| $150,000 to $199,999 | 82 | 10.4% |
| $200,000+ | 16 | 2.0% |
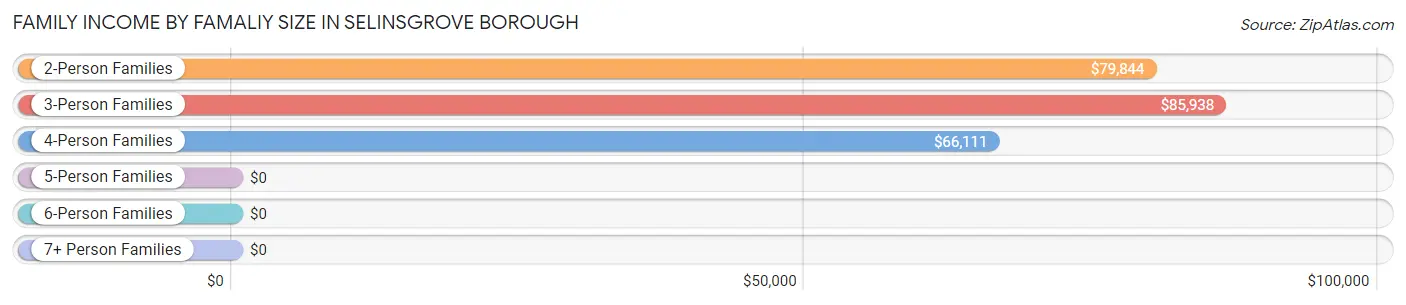
Family Income by Famaliy Size in Selinsgrove borough
3-person families (167 | 21.3%) account for the highest median family income in Selinsgrove borough with $85,938 per family, while 2-person families (483 | 61.5%) have the highest median income of $39,922 per family member.
| Income Bracket | # Families | Median Income |
| 2-Person Families | 483 (61.5%) | $79,844 |
| 3-Person Families | 167 (21.3%) | $85,938 |
| 4-Person Families | 122 (15.5%) | $66,111 |
| 5-Person Families | 13 (1.7%) | $0 |
| 6-Person Families | 0 (0.0%) | $0 |
| 7+ Person Families | 0 (0.0%) | $0 |
| Total | 785 (100.0%) | $81,908 |
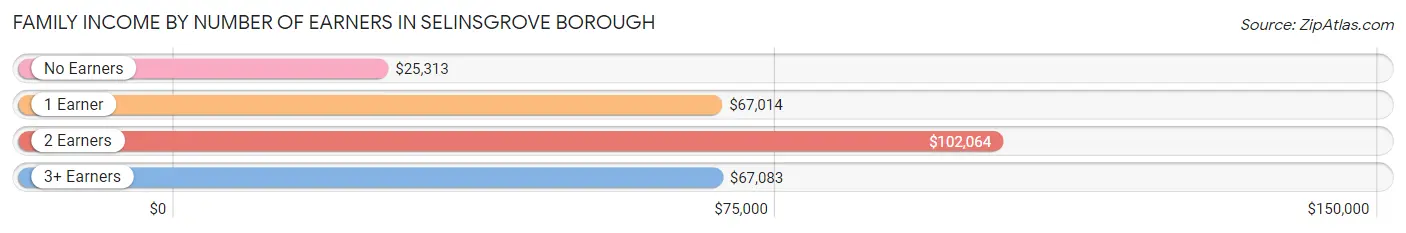
Family Income by Number of Earners in Selinsgrove borough
The median family income in Selinsgrove borough is $81,908, with families comprising 2 earners (385) having the highest median family income of $102,064, while families with no earners (112) have the lowest median family income of $25,313, accounting for 49.0% and 14.3% of families, respectively.
| Number of Earners | # Families | Median Income |
| No Earners | 112 (14.3%) | $25,313 |
| 1 Earner | 233 (29.7%) | $67,014 |
| 2 Earners | 385 (49.0%) | $102,064 |
| 3+ Earners | 55 (7.0%) | $67,083 |
| Total | 785 (100.0%) | $81,908 |
Household Income in Selinsgrove borough
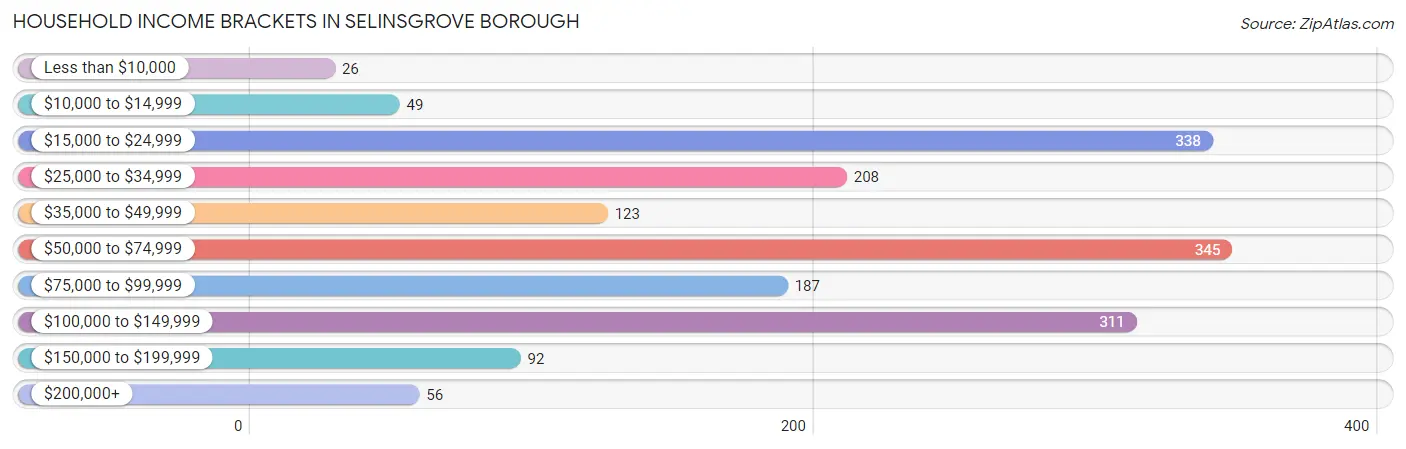
Household Income Brackets in Selinsgrove borough
With 345 households falling in the category, the $50,000 to $74,999 income range is the most frequent in Selinsgrove borough, accounting for 19.9% of all households. In contrast, only 26 households (1.5%) fall into the less than $10,000 income bracket, making it the least populous group.
| Income Bracket | # Households | % Households |
| Less than $10,000 | 26 | 1.5% |
| $10,000 to $14,999 | 49 | 2.8% |
| $15,000 to $24,999 | 338 | 19.5% |
| $25,000 to $34,999 | 208 | 12.0% |
| $35,000 to $49,999 | 123 | 7.1% |
| $50,000 to $74,999 | 345 | 19.9% |
| $75,000 to $99,999 | 187 | 10.8% |
| $100,000 to $149,999 | 311 | 17.9% |
| $150,000 to $199,999 | 92 | 5.3% |
| $200,000+ | 56 | 3.2% |
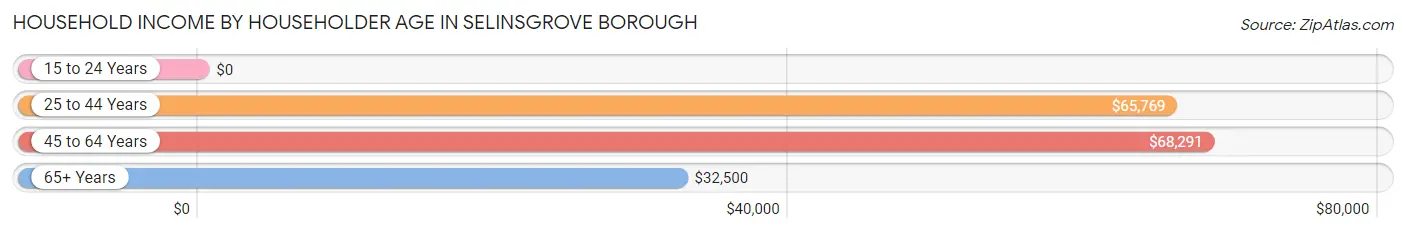
Household Income by Householder Age in Selinsgrove borough
The median household income in Selinsgrove borough is $56,295, with the highest median household income of $68,291 found in the 45 to 64 years age bracket for the primary householder. A total of 499 households (28.8%) fall into this category. Meanwhile, the 15 to 24 years age bracket for the primary householder has the lowest median household income of $0, with 62 households (3.6%) in this group.
| Income Bracket | # Households | Median Income |
| 15 to 24 Years | 62 (3.6%) | $0 |
| 25 to 44 Years | 506 (29.2%) | $65,769 |
| 45 to 64 Years | 499 (28.8%) | $68,291 |
| 65+ Years | 668 (38.5%) | $32,500 |
| Total | 1,735 (100.0%) | $56,295 |
Poverty in Selinsgrove borough
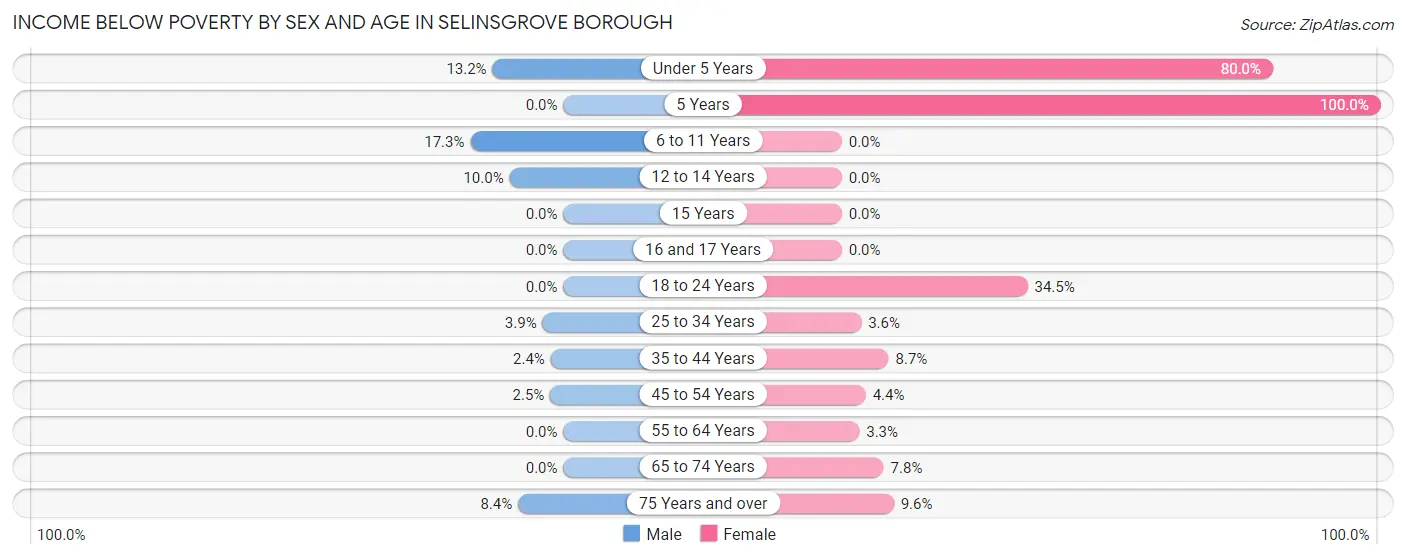
Income Below Poverty by Sex and Age in Selinsgrove borough
With 3.9% poverty level for males and 8.9% for females among the residents of Selinsgrove borough, 6 to 11 year old males and 5 year old females are the most vulnerable to poverty, with 19 males (17.3%) and 10 females (100.0%) in their respective age groups living below the poverty level.
| Age Bracket | Male | Female |
| Under 5 Years | 10 (13.2%) | 20 (80.0%) |
| 5 Years | 0 (0.0%) | 10 (100.0%) |
| 6 to 11 Years | 19 (17.3%) | 0 (0.0%) |
| 12 to 14 Years | 10 (10.0%) | 0 (0.0%) |
| 15 Years | 0 (0.0%) | 0 (0.0%) |
| 16 and 17 Years | 0 (0.0%) | 0 (0.0%) |
| 18 to 24 Years | 0 (0.0%) | 20 (34.5%) |
| 25 to 34 Years | 11 (3.9%) | 10 (3.6%) |
| 35 to 44 Years | 5 (2.4%) | 19 (8.7%) |
| 45 to 54 Years | 4 (2.5%) | 6 (4.4%) |
| 55 to 64 Years | 0 (0.0%) | 8 (3.3%) |
| 65 to 74 Years | 0 (0.0%) | 16 (7.8%) |
| 75 Years and over | 9 (8.4%) | 29 (9.6%) |
| Total | 68 (3.9%) | 138 (8.9%) |
Income Above Poverty by Sex and Age in Selinsgrove borough
According to the poverty statistics in Selinsgrove borough, males aged 5 years and females aged 6 to 11 years are the age groups that are most secure financially, with 100.0% of males and 100.0% of females in these age groups living above the poverty line.
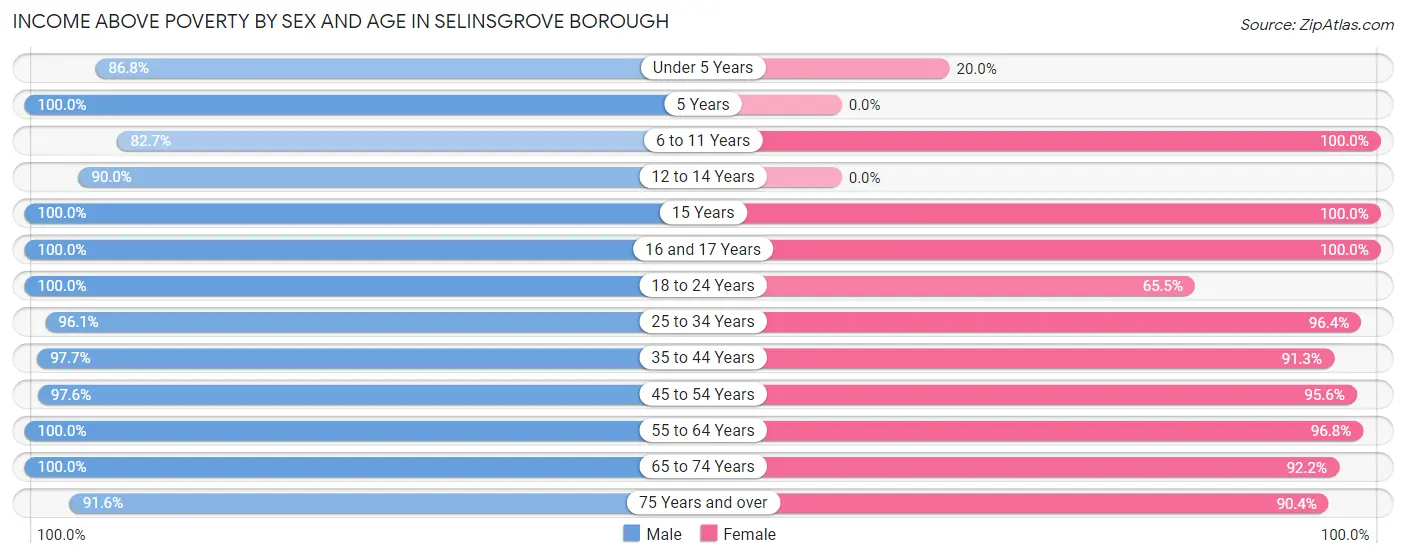
| Age Bracket | Male | Female |
| Under 5 Years | 66 (86.8%) | 5 (20.0%) |
| 5 Years | 31 (100.0%) | 0 (0.0%) |
| 6 to 11 Years | 91 (82.7%) | 48 (100.0%) |
| 12 to 14 Years | 90 (90.0%) | 0 (0.0%) |
| 15 Years | 20 (100.0%) | 16 (100.0%) |
| 16 and 17 Years | 26 (100.0%) | 17 (100.0%) |
| 18 to 24 Years | 125 (100.0%) | 38 (65.5%) |
| 25 to 34 Years | 273 (96.1%) | 267 (96.4%) |
| 35 to 44 Years | 208 (97.7%) | 200 (91.3%) |
| 45 to 54 Years | 159 (97.6%) | 129 (95.6%) |
| 55 to 64 Years | 214 (100.0%) | 238 (96.8%) |
| 65 to 74 Years | 275 (100.0%) | 190 (92.2%) |
| 75 Years and over | 98 (91.6%) | 272 (90.4%) |
| Total | 1,676 (96.1%) | 1,420 (91.1%) |
Income Below Poverty Among Married-Couple Families in Selinsgrove borough
The poverty statistics for married-couple families in Selinsgrove borough show that 3.6% or 20 of the total 559 families live below the poverty line. Families with 1 or 2 children have the highest poverty rate of 7.3%, comprising of 11 families. On the other hand, families with 3 or 4 children have the lowest poverty rate of 0.0%, which includes 0 families.
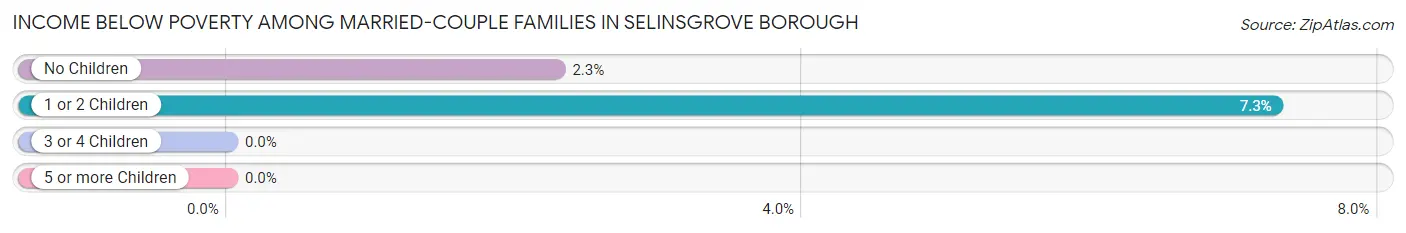
| Children | Above Poverty | Below Poverty |
| No Children | 386 (97.7%) | 9 (2.3%) |
| 1 or 2 Children | 140 (92.7%) | 11 (7.3%) |
| 3 or 4 Children | 13 (100.0%) | 0 (0.0%) |
| 5 or more Children | 0 (0.0%) | 0 (0.0%) |
| Total | 539 (96.4%) | 20 (3.6%) |
Income Below Poverty Among Single-Parent Households in Selinsgrove borough
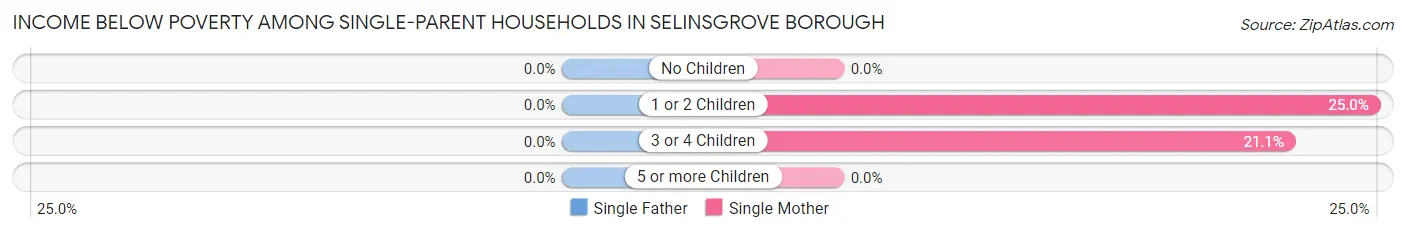
| Children | Single Father | Single Mother |
| No Children | 0 (0.0%) | 0 (0.0%) |
| 1 or 2 Children | 0 (0.0%) | 10 (25.0%) |
| 3 or 4 Children | 0 (0.0%) | 8 (21.0%) |
| 5 or more Children | 0 (0.0%) | 0 (0.0%) |
| Total | 0 (0.0%) | 18 (9.7%) |
Income Below Poverty Among Married-Couple vs Single-Parent Households in Selinsgrove borough
The poverty data for Selinsgrove borough shows that 20 of the married-couple family households (3.6%) and 18 of the single-parent households (8.0%) are living below the poverty level. Within the married-couple family households, those with 1 or 2 children have the highest poverty rate, with 11 households (7.3%) falling below the poverty line. Among the single-parent households, those with 1 or 2 children have the highest poverty rate, with 10 household (17.9%) living below poverty.
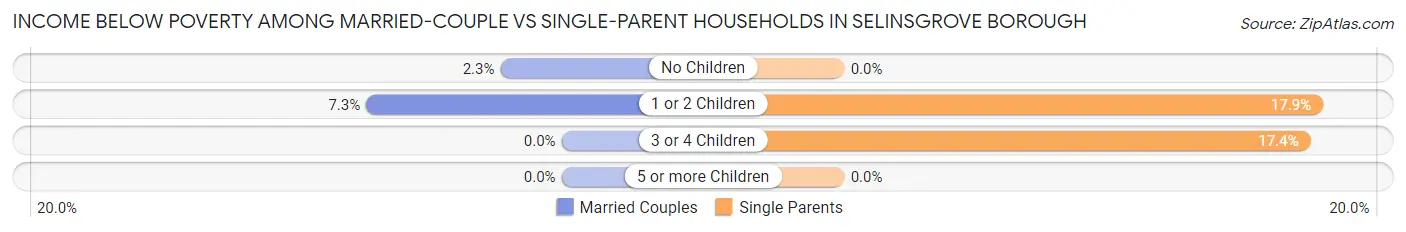
| Children | Married-Couple Families | Single-Parent Households |
| No Children | 9 (2.3%) | 0 (0.0%) |
| 1 or 2 Children | 11 (7.3%) | 10 (17.9%) |
| 3 or 4 Children | 0 (0.0%) | 8 (17.4%) |
| 5 or more Children | 0 (0.0%) | 0 (0.0%) |
| Total | 20 (3.6%) | 18 (8.0%) |
Employment Characteristics in Selinsgrove borough
Employment by Class of Employer in Selinsgrove borough
Among the 2,892 employed individuals in Selinsgrove borough, private company employees (1,962 | 67.8%), not-for-profit organizations (463 | 16.0%), and local government employees (167 | 5.8%) make up the most common classes of employment.
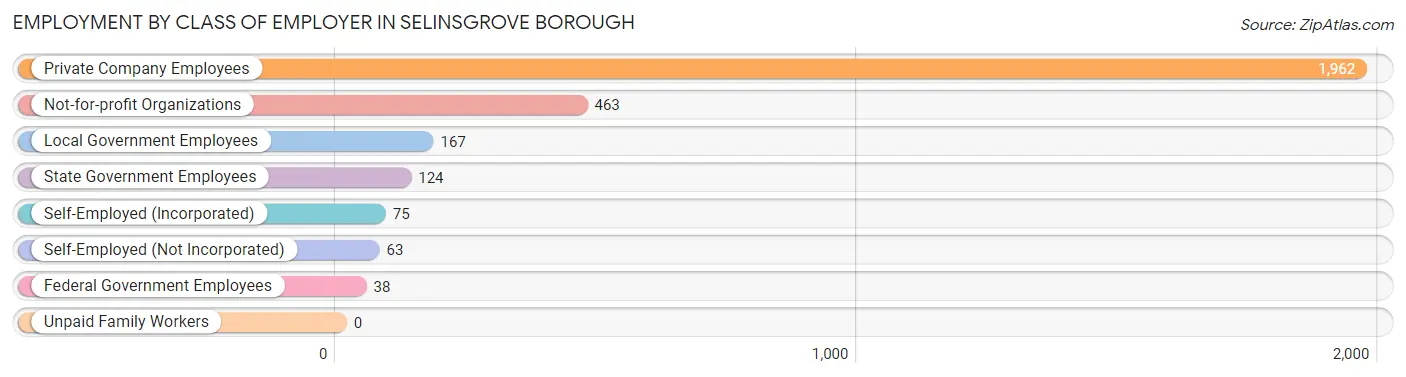
| Employer Class | # Employees | % Employees |
| Private Company Employees | 1,962 | 67.8% |
| Self-Employed (Incorporated) | 75 | 2.6% |
| Self-Employed (Not Incorporated) | 63 | 2.2% |
| Not-for-profit Organizations | 463 | 16.0% |
| Local Government Employees | 167 | 5.8% |
| State Government Employees | 124 | 4.3% |
| Federal Government Employees | 38 | 1.3% |
| Unpaid Family Workers | 0 | 0.0% |
| Total | 2,892 | 100.0% |
Employment Status by Age in Selinsgrove borough
According to the labor force statistics for Selinsgrove borough, out of the total population over 16 years of age (5,254), 56.7% or 2,979 individuals are in the labor force, with 1.5% or 45 of them unemployed. The age group with the highest labor force participation rate is 25 to 29 years, with 100.0% or 278 individuals in the labor force. Within the labor force, the 25 to 29 years age range has the highest percentage of unemployed individuals, with 4.7% or 13 of them being unemployed.
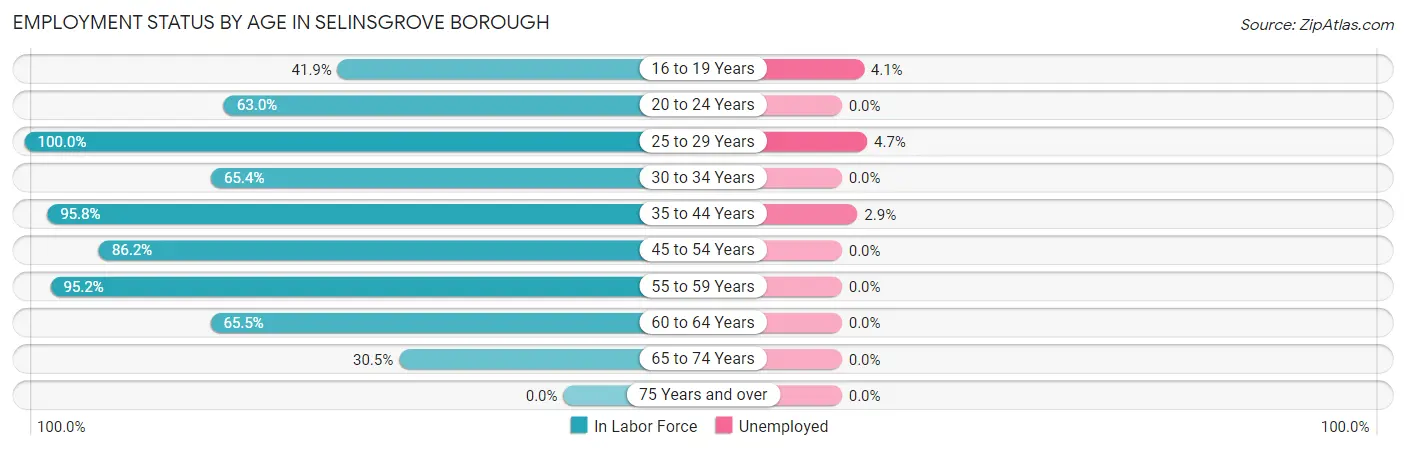
| Age Bracket | In Labor Force | Unemployed |
| 16 to 19 Years | 468 (41.9%) | 19 (4.1%) |
| 20 to 24 Years | 841 (63.0%) | 0 (0.0%) |
| 25 to 29 Years | 278 (100.0%) | 13 (4.7%) |
| 30 to 34 Years | 185 (65.4%) | 0 (0.0%) |
| 35 to 44 Years | 414 (95.8%) | 12 (2.9%) |
| 45 to 54 Years | 280 (86.2%) | 0 (0.0%) |
| 55 to 59 Years | 178 (95.2%) | 0 (0.0%) |
| 60 to 64 Years | 184 (65.5%) | 0 (0.0%) |
| 65 to 74 Years | 153 (30.5%) | 0 (0.0%) |
| 75 Years and over | 0 (0.0%) | 0 (0.0%) |
| Total | 2,979 (56.7%) | 45 (1.5%) |
Employment Status by Educational Attainment in Selinsgrove borough
According to labor force statistics for Selinsgrove borough, 85.1% of individuals (1,520) out of the total population between 25 and 64 years of age (1,786) are in the labor force, with 1.7% or 26 of them being unemployed. The group with the highest labor force participation rate are those with the educational attainment of high school diploma, with 90.9% or 378 individuals in the labor force. Within the labor force, individuals with less than high school education have the highest percentage of unemployment, with 22.6% or 12 of them being unemployed.
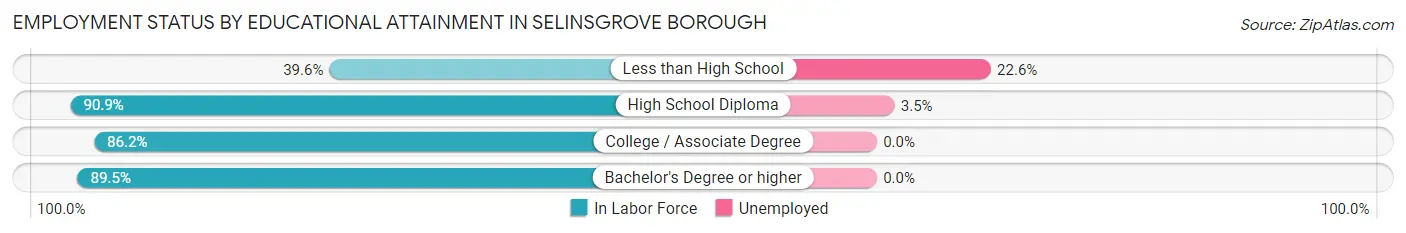
| Educational Attainment | In Labor Force | Unemployed |
| Less than High School | 53 (39.6%) | 30 (22.6%) |
| High School Diploma | 378 (90.9%) | 15 (3.5%) |
| College / Associate Degree | 489 (86.2%) | 0 (0.0%) |
| Bachelor's Degree or higher | 599 (89.5%) | 0 (0.0%) |
| Total | 1,520 (85.1%) | 30 (1.7%) |
Employment Occupations by Sex in Selinsgrove borough
Management, Business, Science and Arts Occupations
The most common Management, Business, Science and Arts occupations in Selinsgrove borough are Community & Social Service (661 | 22.6%), Education Instruction & Library (409 | 14.0%), Computers, Engineering & Science (184 | 6.3%), Management (181 | 6.2%), and Arts, Media & Entertainment (152 | 5.2%).
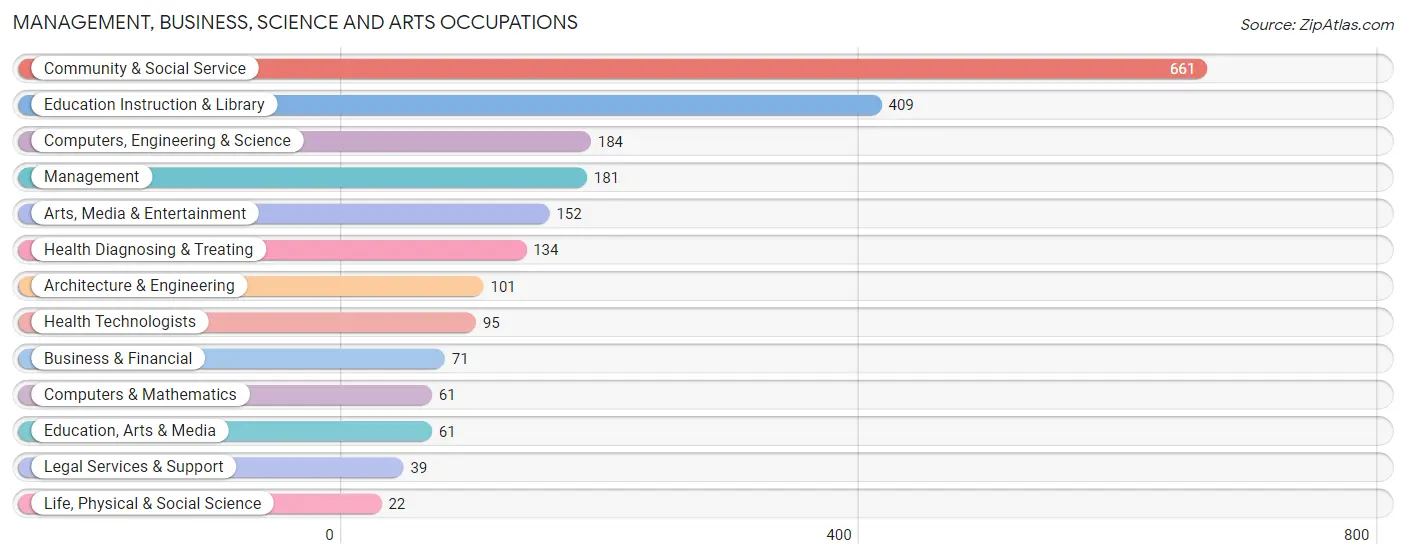
Management, Business, Science and Arts Occupations by Sex
Within the Management, Business, Science and Arts occupations in Selinsgrove borough, the most male-oriented occupations are Architecture & Engineering (92.1%), Computers, Engineering & Science (81.5%), and Computers & Mathematics (78.7%), while the most female-oriented occupations are Health Diagnosing & Treating (100.0%), Health Technologists (100.0%), and Legal Services & Support (79.5%).
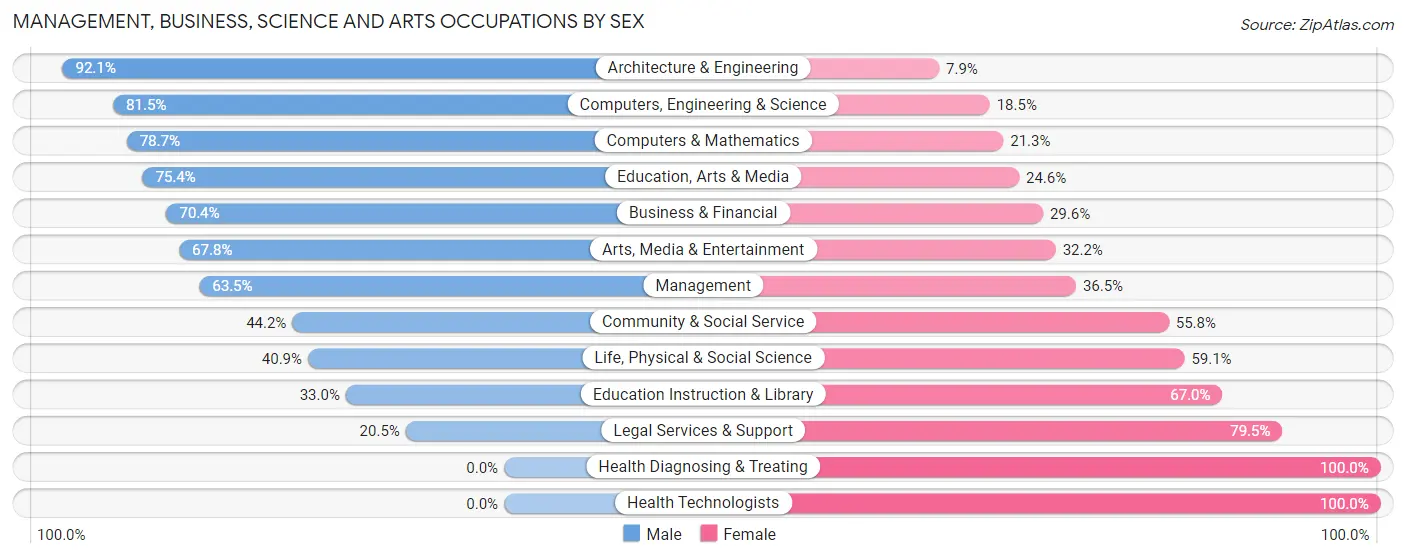
| Occupation | Male | Female |
| Management | 115 (63.5%) | 66 (36.5%) |
| Business & Financial | 50 (70.4%) | 21 (29.6%) |
| Computers, Engineering & Science | 150 (81.5%) | 34 (18.5%) |
| Computers & Mathematics | 48 (78.7%) | 13 (21.3%) |
| Architecture & Engineering | 93 (92.1%) | 8 (7.9%) |
| Life, Physical & Social Science | 9 (40.9%) | 13 (59.1%) |
| Community & Social Service | 292 (44.2%) | 369 (55.8%) |
| Education, Arts & Media | 46 (75.4%) | 15 (24.6%) |
| Legal Services & Support | 8 (20.5%) | 31 (79.5%) |
| Education Instruction & Library | 135 (33.0%) | 274 (67.0%) |
| Arts, Media & Entertainment | 103 (67.8%) | 49 (32.2%) |
| Health Diagnosing & Treating | 0 (0.0%) | 134 (100.0%) |
| Health Technologists | 0 (0.0%) | 95 (100.0%) |
| Total (Category) | 607 (49.3%) | 624 (50.7%) |
| Total (Overall) | 1,462 (49.9%) | 1,466 (50.1%) |
Services Occupations
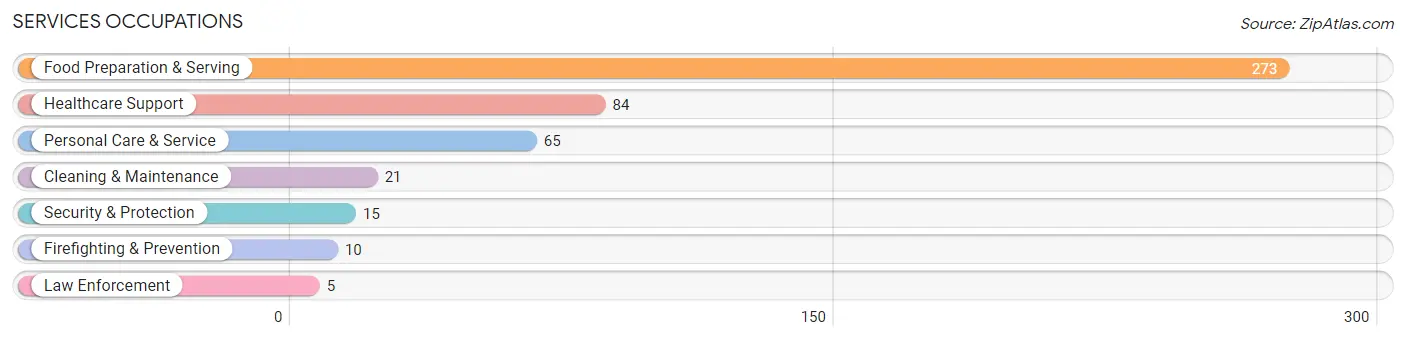
The most common Services occupations in Selinsgrove borough are Food Preparation & Serving (273 | 9.3%), Healthcare Support (84 | 2.9%), Personal Care & Service (65 | 2.2%), Cleaning & Maintenance (21 | 0.7%), and Security & Protection (15 | 0.5%).
Services Occupations by Sex
Within the Services occupations in Selinsgrove borough, the most male-oriented occupations are Law Enforcement (100.0%), Personal Care & Service (66.1%), and Security & Protection (40.0%), while the most female-oriented occupations are Firefighting & Prevention (90.0%), Healthcare Support (88.1%), and Cleaning & Maintenance (80.9%).
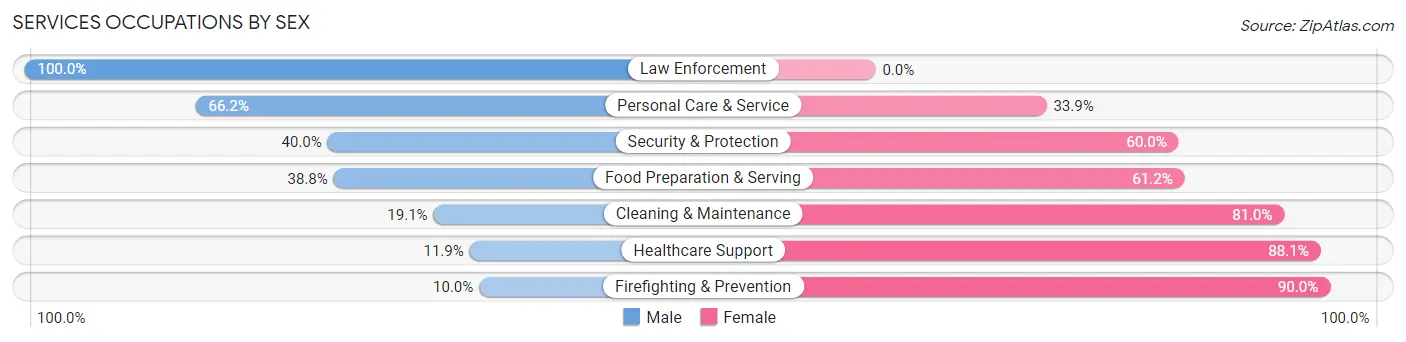
| Occupation | Male | Female |
| Healthcare Support | 10 (11.9%) | 74 (88.1%) |
| Security & Protection | 6 (40.0%) | 9 (60.0%) |
| Firefighting & Prevention | 1 (10.0%) | 9 (90.0%) |
| Law Enforcement | 5 (100.0%) | 0 (0.0%) |
| Food Preparation & Serving | 106 (38.8%) | 167 (61.2%) |
| Cleaning & Maintenance | 4 (19.1%) | 17 (80.9%) |
| Personal Care & Service | 43 (66.1%) | 22 (33.9%) |
| Total (Category) | 169 (36.9%) | 289 (63.1%) |
| Total (Overall) | 1,462 (49.9%) | 1,466 (50.1%) |
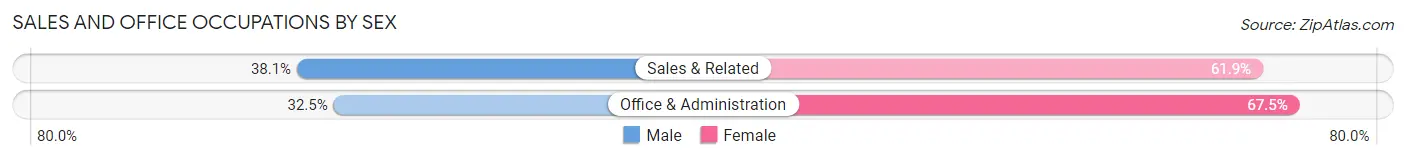
Sales and Office Occupations
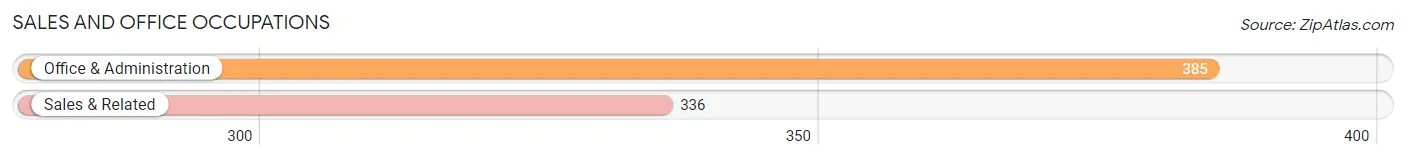
The most common Sales and Office occupations in Selinsgrove borough are Office & Administration (385 | 13.2%), and Sales & Related (336 | 11.5%).
Sales and Office Occupations by Sex
| Occupation | Male | Female |
| Sales & Related | 128 (38.1%) | 208 (61.9%) |
| Office & Administration | 125 (32.5%) | 260 (67.5%) |
| Total (Category) | 253 (35.1%) | 468 (64.9%) |
| Total (Overall) | 1,462 (49.9%) | 1,466 (50.1%) |
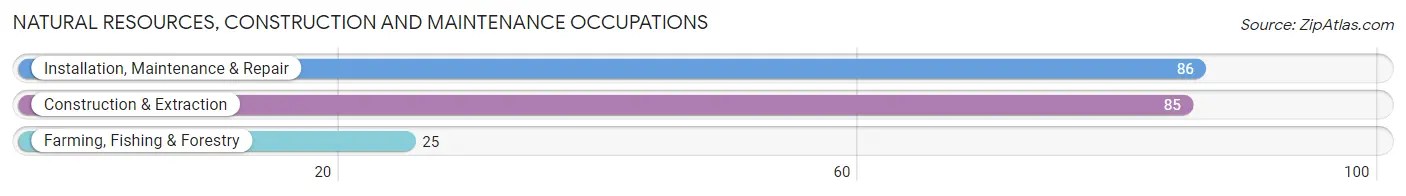
Natural Resources, Construction and Maintenance Occupations
The most common Natural Resources, Construction and Maintenance occupations in Selinsgrove borough are Installation, Maintenance & Repair (86 | 2.9%), Construction & Extraction (85 | 2.9%), and Farming, Fishing & Forestry (25 | 0.9%).
Natural Resources, Construction and Maintenance Occupations by Sex

| Occupation | Male | Female |
| Farming, Fishing & Forestry | 25 (100.0%) | 0 (0.0%) |
| Construction & Extraction | 85 (100.0%) | 0 (0.0%) |
| Installation, Maintenance & Repair | 86 (100.0%) | 0 (0.0%) |
| Total (Category) | 196 (100.0%) | 0 (0.0%) |
| Total (Overall) | 1,462 (49.9%) | 1,466 (50.1%) |
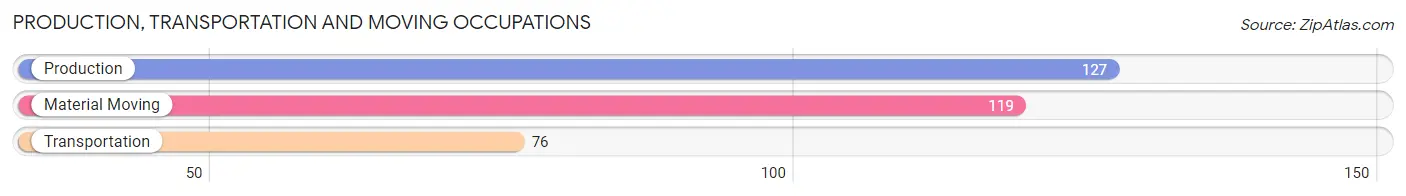
Production, Transportation and Moving Occupations
The most common Production, Transportation and Moving occupations in Selinsgrove borough are Production (127 | 4.3%), Material Moving (119 | 4.1%), and Transportation (76 | 2.6%).
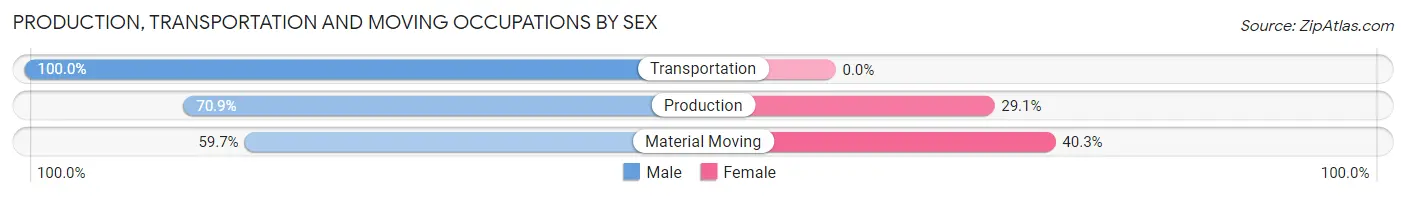
Production, Transportation and Moving Occupations by Sex
| Occupation | Male | Female |
| Production | 90 (70.9%) | 37 (29.1%) |
| Transportation | 76 (100.0%) | 0 (0.0%) |
| Material Moving | 71 (59.7%) | 48 (40.3%) |
| Total (Category) | 237 (73.6%) | 85 (26.4%) |
| Total (Overall) | 1,462 (49.9%) | 1,466 (50.1%) |
Employment Industries by Sex in Selinsgrove borough
Employment Industries in Selinsgrove borough
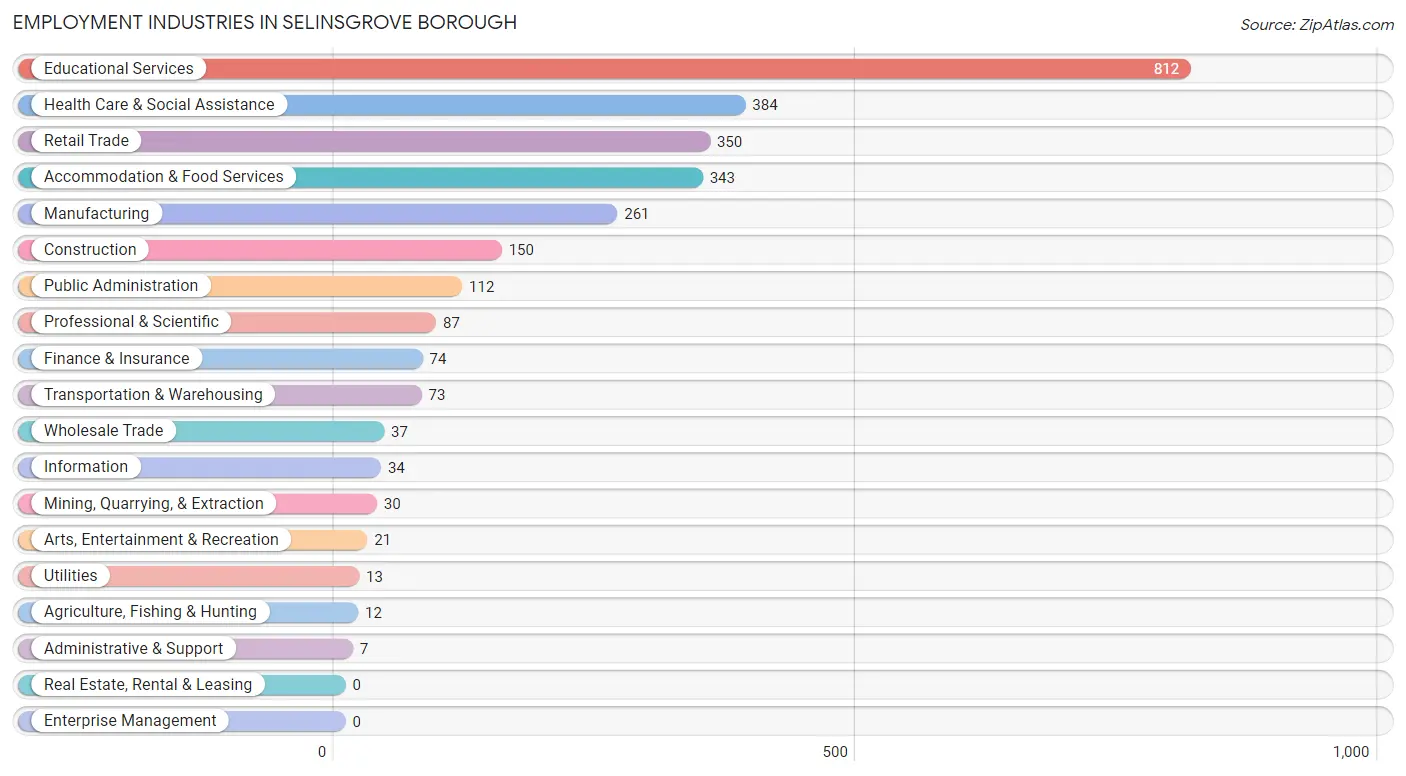
The major employment industries in Selinsgrove borough include Educational Services (812 | 27.7%), Health Care & Social Assistance (384 | 13.1%), Retail Trade (350 | 11.9%), Accommodation & Food Services (343 | 11.7%), and Manufacturing (261 | 8.9%).
Employment Industries by Sex in Selinsgrove borough
The Selinsgrove borough industries that see more men than women are Agriculture, Fishing & Hunting (100.0%), Construction (100.0%), and Utilities (100.0%), whereas the industries that tend to have a higher number of women are Health Care & Social Assistance (81.2%), Public Administration (65.2%), and Retail Trade (61.4%).
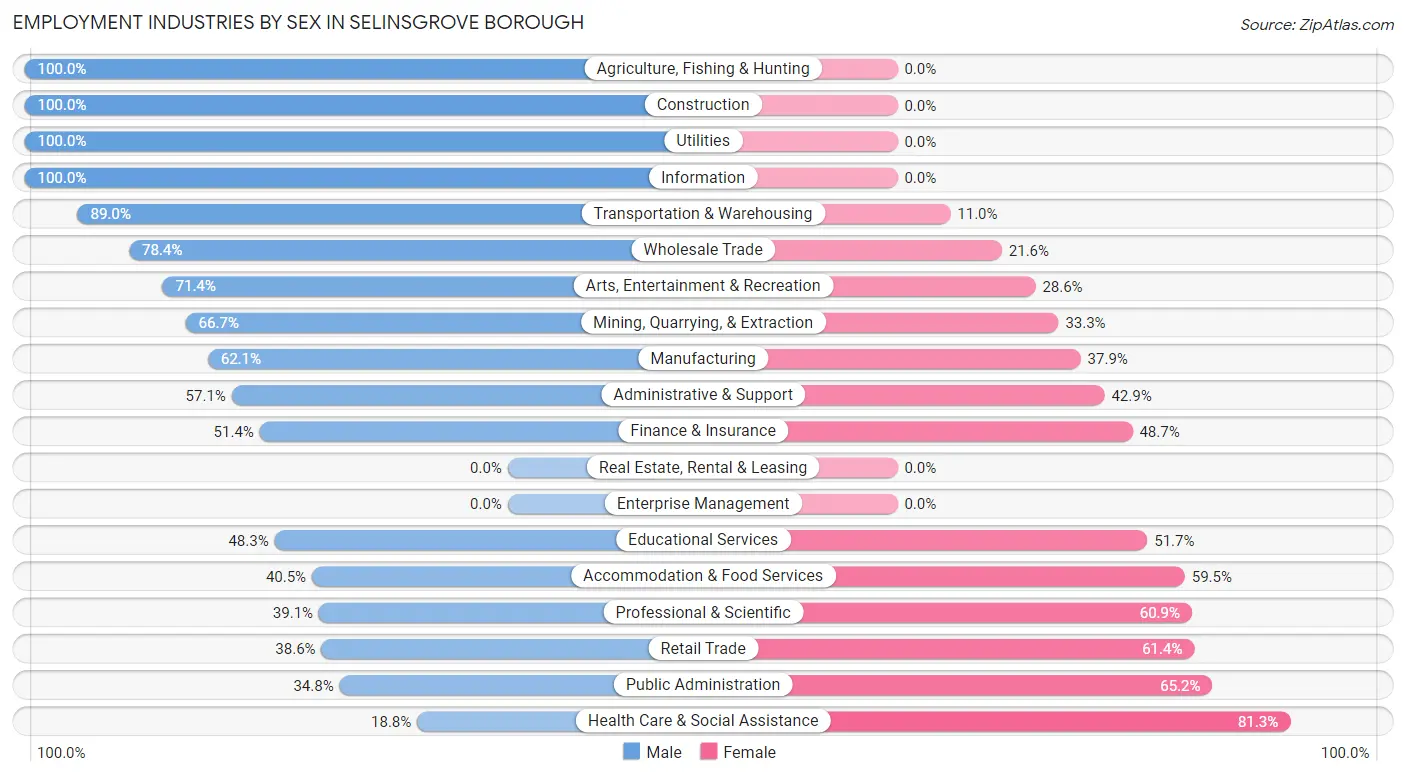
| Industry | Male | Female |
| Agriculture, Fishing & Hunting | 12 (100.0%) | 0 (0.0%) |
| Mining, Quarrying, & Extraction | 20 (66.7%) | 10 (33.3%) |
| Construction | 150 (100.0%) | 0 (0.0%) |
| Manufacturing | 162 (62.1%) | 99 (37.9%) |
| Wholesale Trade | 29 (78.4%) | 8 (21.6%) |
| Retail Trade | 135 (38.6%) | 215 (61.4%) |
| Transportation & Warehousing | 65 (89.0%) | 8 (11.0%) |
| Utilities | 13 (100.0%) | 0 (0.0%) |
| Information | 34 (100.0%) | 0 (0.0%) |
| Finance & Insurance | 38 (51.3%) | 36 (48.6%) |
| Real Estate, Rental & Leasing | 0 (0.0%) | 0 (0.0%) |
| Professional & Scientific | 34 (39.1%) | 53 (60.9%) |
| Enterprise Management | 0 (0.0%) | 0 (0.0%) |
| Administrative & Support | 4 (57.1%) | 3 (42.9%) |
| Educational Services | 392 (48.3%) | 420 (51.7%) |
| Health Care & Social Assistance | 72 (18.8%) | 312 (81.2%) |
| Arts, Entertainment & Recreation | 15 (71.4%) | 6 (28.6%) |
| Accommodation & Food Services | 139 (40.5%) | 204 (59.5%) |
| Public Administration | 39 (34.8%) | 73 (65.2%) |
| Total | 1,462 (49.9%) | 1,466 (50.1%) |
Education in Selinsgrove borough
School Enrollment in Selinsgrove borough
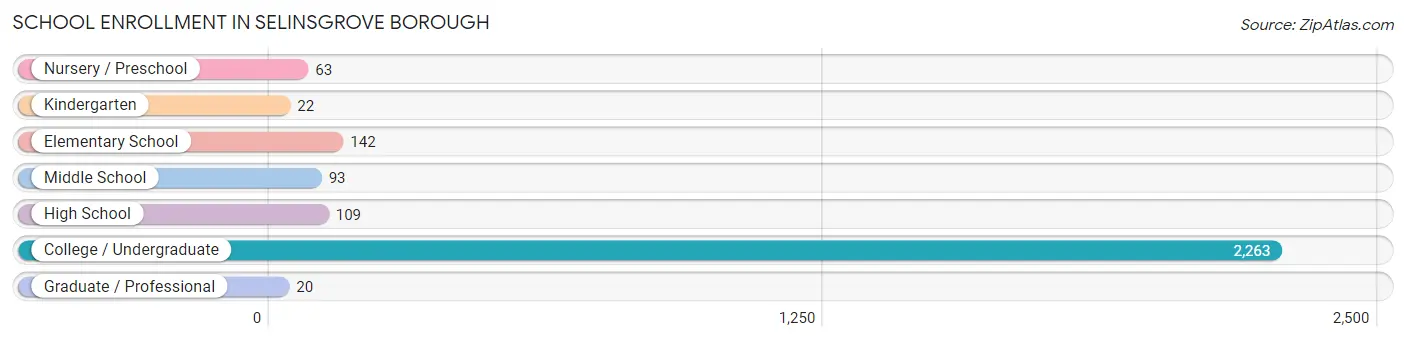
The most common levels of schooling among the 2,712 students in Selinsgrove borough are college / undergraduate (2,263 | 83.4%), elementary school (142 | 5.2%), and high school (109 | 4.0%).
| School Level | # Students | % Students |
| Nursery / Preschool | 63 | 2.3% |
| Kindergarten | 22 | 0.8% |
| Elementary School | 142 | 5.2% |
| Middle School | 93 | 3.4% |
| High School | 109 | 4.0% |
| College / Undergraduate | 2,263 | 83.4% |
| Graduate / Professional | 20 | 0.7% |
| Total | 2,712 | 100.0% |
School Enrollment by Age by Funding Source in Selinsgrove borough
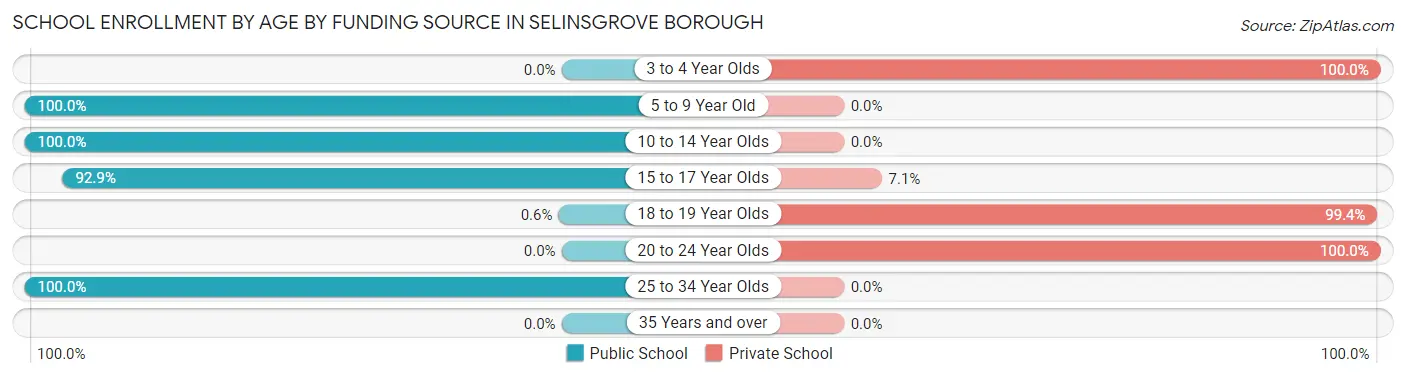
Out of a total of 2,712 students who are enrolled in schools in Selinsgrove borough, 2,305 (85.0%) attend a private institution, while the remaining 407 (15.0%) are enrolled in public schools. The age group of 3 to 4 year olds has the highest likelihood of being enrolled in private schools, with 63 (100.0% in the age bracket) enrolled. Conversely, the age group of 5 to 9 year old has the lowest likelihood of being enrolled in a private school, with 125 (100.0% in the age bracket) attending a public institution.
| Age Bracket | Public School | Private School |
| 3 to 4 Year Olds | 0 (0.0%) | 63 (100.0%) |
| 5 to 9 Year Old | 125 (100.0%) | 0 (0.0%) |
| 10 to 14 Year Olds | 162 (100.0%) | 0 (0.0%) |
| 15 to 17 Year Olds | 79 (92.9%) | 6 (7.1%) |
| 18 to 19 Year Olds | 6 (0.6%) | 997 (99.4%) |
| 20 to 24 Year Olds | 0 (0.0%) | 1,238 (100.0%) |
| 25 to 34 Year Olds | 36 (100.0%) | 0 (0.0%) |
| 35 Years and over | 0 (0.0%) | 0 (0.0%) |
| Total | 407 (15.0%) | 2,305 (85.0%) |
Educational Attainment by Field of Study in Selinsgrove borough
Education (207 | 18.8%), science & technology (163 | 14.8%), arts & humanities (152 | 13.8%), business (111 | 10.1%), and psychology (86 | 7.8%) are the most common fields of study among 1,103 individuals in Selinsgrove borough who have obtained a bachelor's degree or higher.
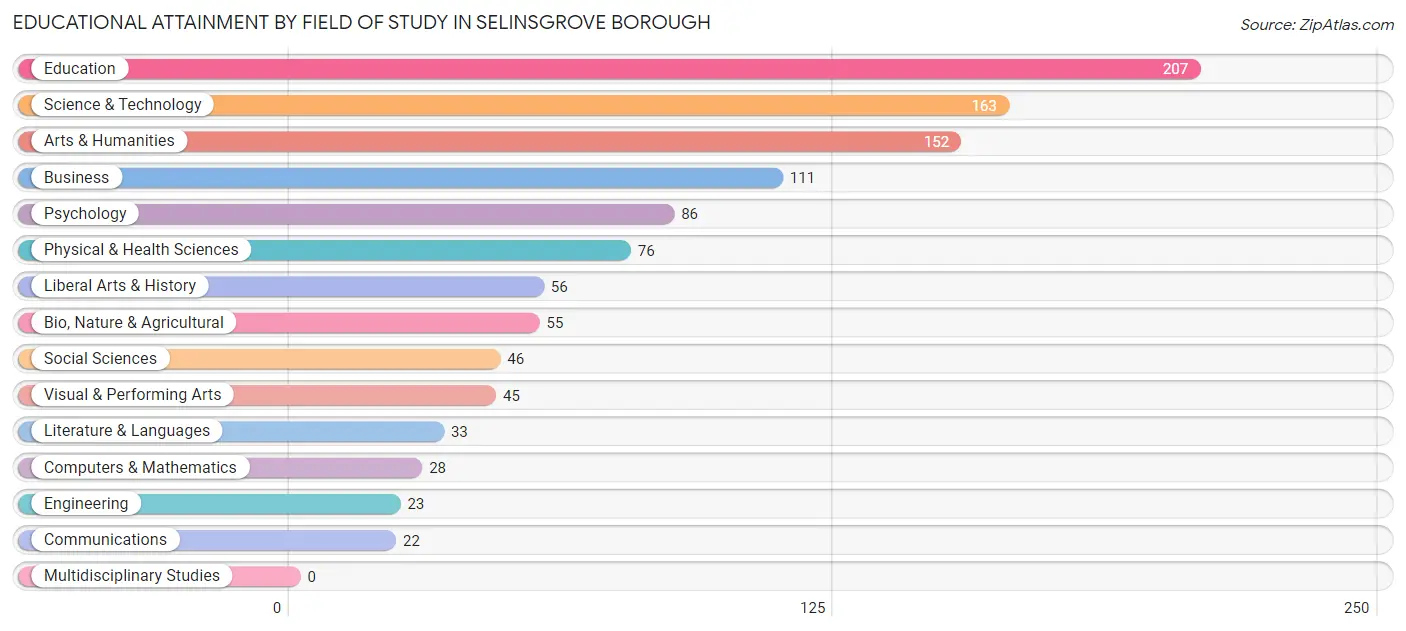
| Field of Study | # Graduates | % Graduates |
| Computers & Mathematics | 28 | 2.5% |
| Bio, Nature & Agricultural | 55 | 5.0% |
| Physical & Health Sciences | 76 | 6.9% |
| Psychology | 86 | 7.8% |
| Social Sciences | 46 | 4.2% |
| Engineering | 23 | 2.1% |
| Multidisciplinary Studies | 0 | 0.0% |
| Science & Technology | 163 | 14.8% |
| Business | 111 | 10.1% |
| Education | 207 | 18.8% |
| Literature & Languages | 33 | 3.0% |
| Liberal Arts & History | 56 | 5.1% |
| Visual & Performing Arts | 45 | 4.1% |
| Communications | 22 | 2.0% |
| Arts & Humanities | 152 | 13.8% |
| Total | 1,103 | 100.0% |
Transportation & Commute in Selinsgrove borough
Vehicle Availability by Sex in Selinsgrove borough
The most prevalent vehicle ownership categories in Selinsgrove borough are males with 2 vehicles (523, accounting for 53.5%) and females with 2 vehicles (392, making up 61.8%).
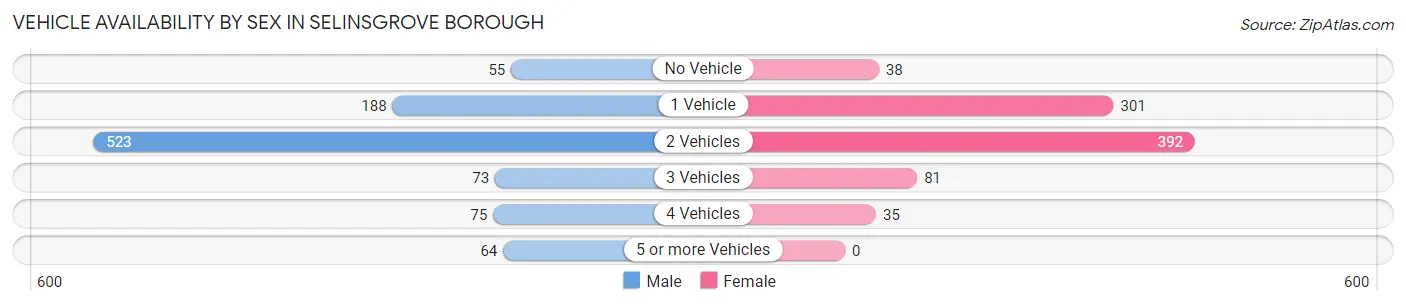
| Vehicles Available | Male | Female |
| No Vehicle | 55 (5.6%) | 38 (4.5%) |
| 1 Vehicle | 188 (19.2%) | 301 (35.5%) |
| 2 Vehicles | 523 (53.5%) | 392 (46.3%) |
| 3 Vehicles | 73 (7.5%) | 81 (9.6%) |
| 4 Vehicles | 75 (7.7%) | 35 (4.1%) |
| 5 or more Vehicles | 64 (6.5%) | 0 (0.0%) |
| Total | 978 (100.0%) | 847 (100.0%) |
Commute Time in Selinsgrove borough
The most frequently occuring commute durations in Selinsgrove borough are 5 to 9 minutes (904 commuters, 34.1%), 20 to 24 minutes (398 commuters, 15.0%), and 10 to 14 minutes (385 commuters, 14.5%).
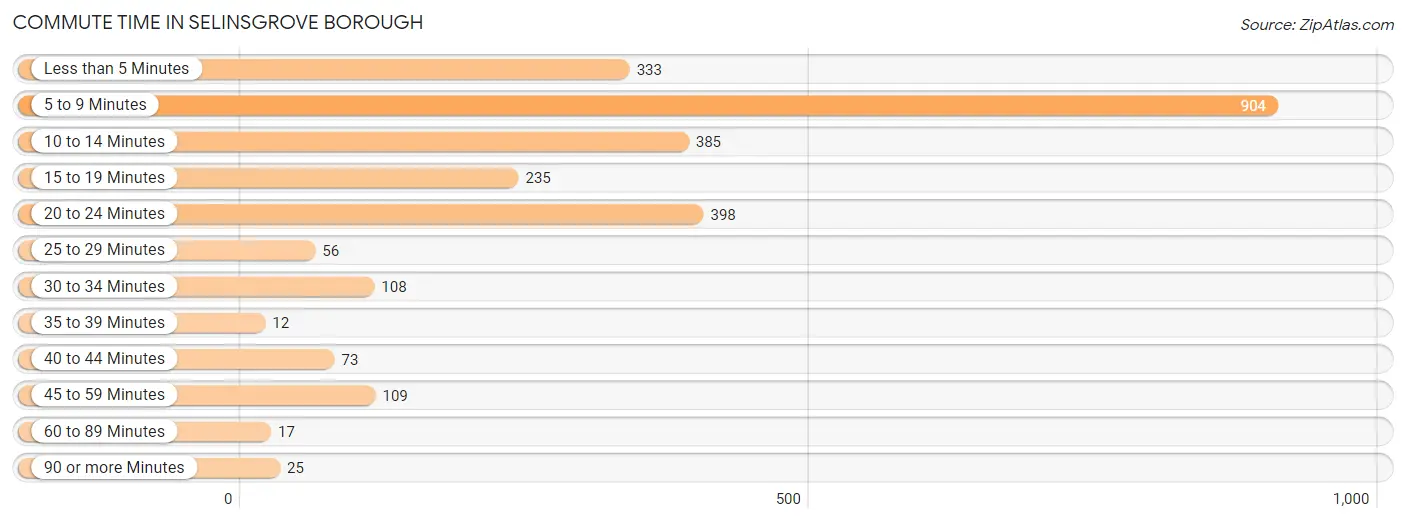
| Commute Time | # Commuters | % Commuters |
| Less than 5 Minutes | 333 | 12.5% |
| 5 to 9 Minutes | 904 | 34.1% |
| 10 to 14 Minutes | 385 | 14.5% |
| 15 to 19 Minutes | 235 | 8.8% |
| 20 to 24 Minutes | 398 | 15.0% |
| 25 to 29 Minutes | 56 | 2.1% |
| 30 to 34 Minutes | 108 | 4.1% |
| 35 to 39 Minutes | 12 | 0.4% |
| 40 to 44 Minutes | 73 | 2.8% |
| 45 to 59 Minutes | 109 | 4.1% |
| 60 to 89 Minutes | 17 | 0.6% |
| 90 or more Minutes | 25 | 0.9% |
Commute Time by Sex in Selinsgrove borough
The most common commute times in Selinsgrove borough are 5 to 9 minutes (516 commuters, 39.9%) for males and 5 to 9 minutes (388 commuters, 28.5%) for females.
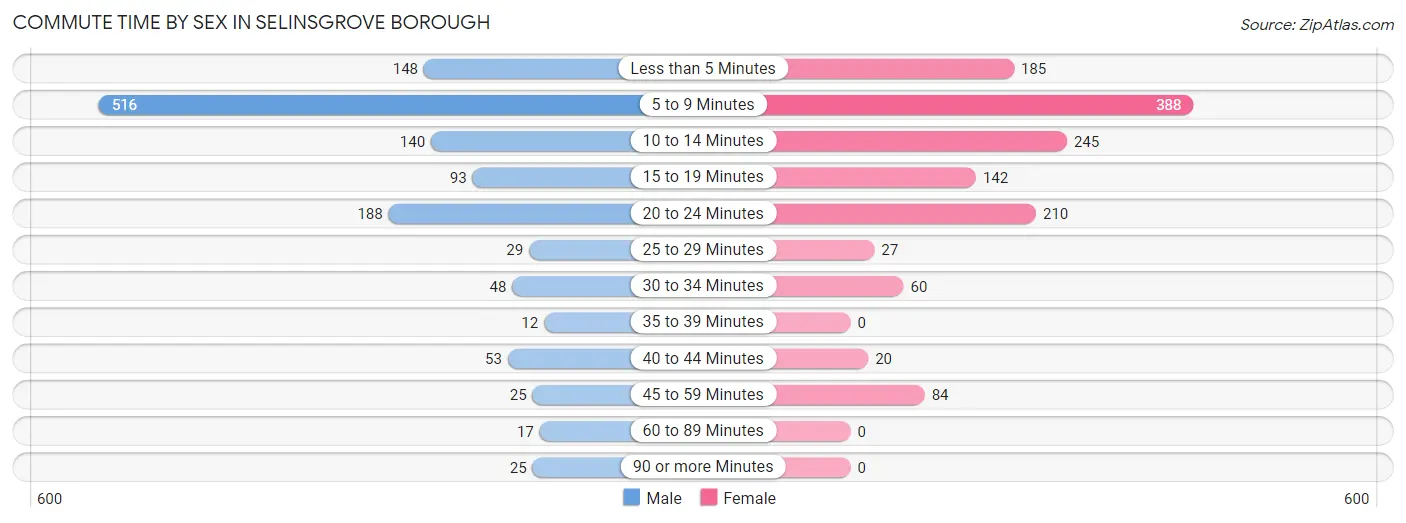
| Commute Time | Male | Female |
| Less than 5 Minutes | 148 (11.4%) | 185 (13.6%) |
| 5 to 9 Minutes | 516 (39.9%) | 388 (28.5%) |
| 10 to 14 Minutes | 140 (10.8%) | 245 (18.0%) |
| 15 to 19 Minutes | 93 (7.2%) | 142 (10.4%) |
| 20 to 24 Minutes | 188 (14.5%) | 210 (15.4%) |
| 25 to 29 Minutes | 29 (2.2%) | 27 (2.0%) |
| 30 to 34 Minutes | 48 (3.7%) | 60 (4.4%) |
| 35 to 39 Minutes | 12 (0.9%) | 0 (0.0%) |
| 40 to 44 Minutes | 53 (4.1%) | 20 (1.5%) |
| 45 to 59 Minutes | 25 (1.9%) | 84 (6.2%) |
| 60 to 89 Minutes | 17 (1.3%) | 0 (0.0%) |
| 90 or more Minutes | 25 (1.9%) | 0 (0.0%) |
Time of Departure to Work by Sex in Selinsgrove borough
The most frequent times of departure to work in Selinsgrove borough are 12:00 PM to 3:59 PM (226, 17.5%) for males and 12:00 PM to 3:59 PM (304, 22.3%) for females.
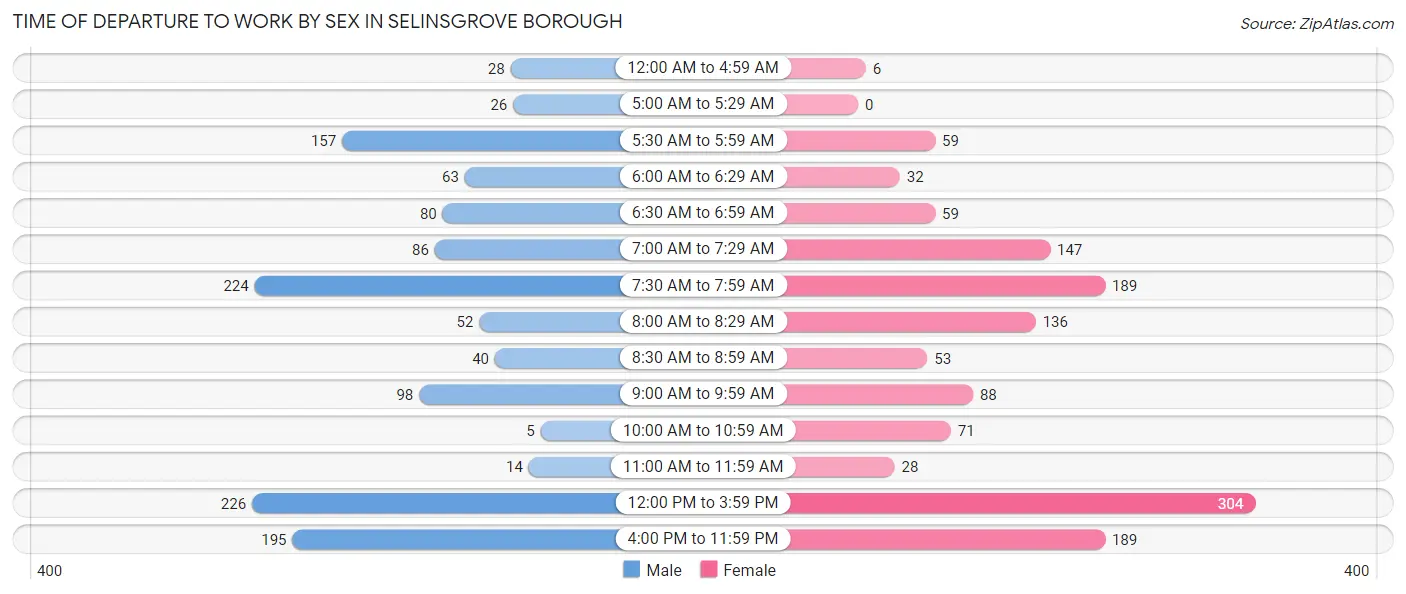
| Time of Departure | Male | Female |
| 12:00 AM to 4:59 AM | 28 (2.2%) | 6 (0.4%) |
| 5:00 AM to 5:29 AM | 26 (2.0%) | 0 (0.0%) |
| 5:30 AM to 5:59 AM | 157 (12.1%) | 59 (4.3%) |
| 6:00 AM to 6:29 AM | 63 (4.9%) | 32 (2.4%) |
| 6:30 AM to 6:59 AM | 80 (6.2%) | 59 (4.3%) |
| 7:00 AM to 7:29 AM | 86 (6.7%) | 147 (10.8%) |
| 7:30 AM to 7:59 AM | 224 (17.3%) | 189 (13.9%) |
| 8:00 AM to 8:29 AM | 52 (4.0%) | 136 (10.0%) |
| 8:30 AM to 8:59 AM | 40 (3.1%) | 53 (3.9%) |
| 9:00 AM to 9:59 AM | 98 (7.6%) | 88 (6.5%) |
| 10:00 AM to 10:59 AM | 5 (0.4%) | 71 (5.2%) |
| 11:00 AM to 11:59 AM | 14 (1.1%) | 28 (2.1%) |
| 12:00 PM to 3:59 PM | 226 (17.5%) | 304 (22.3%) |
| 4:00 PM to 11:59 PM | 195 (15.1%) | 189 (13.9%) |
| Total | 1,294 (100.0%) | 1,361 (100.0%) |
Housing Occupancy in Selinsgrove borough
Occupancy by Ownership in Selinsgrove borough
Of the total 1,735 dwellings in Selinsgrove borough, owner-occupied units account for 875 (50.4%), while renter-occupied units make up 860 (49.6%).
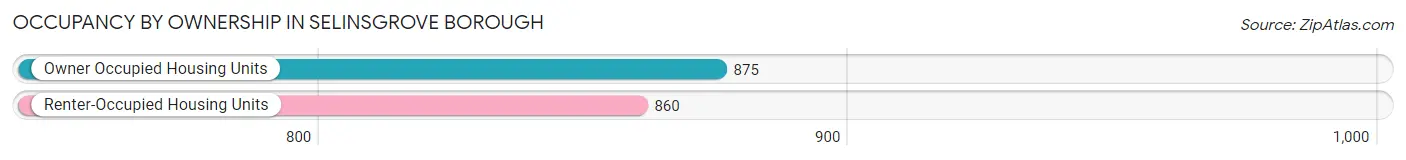
| Occupancy | # Housing Units | % Housing Units |
| Owner Occupied Housing Units | 875 | 50.4% |
| Renter-Occupied Housing Units | 860 | 49.6% |
| Total Occupied Housing Units | 1,735 | 100.0% |
Occupancy by Household Size in Selinsgrove borough
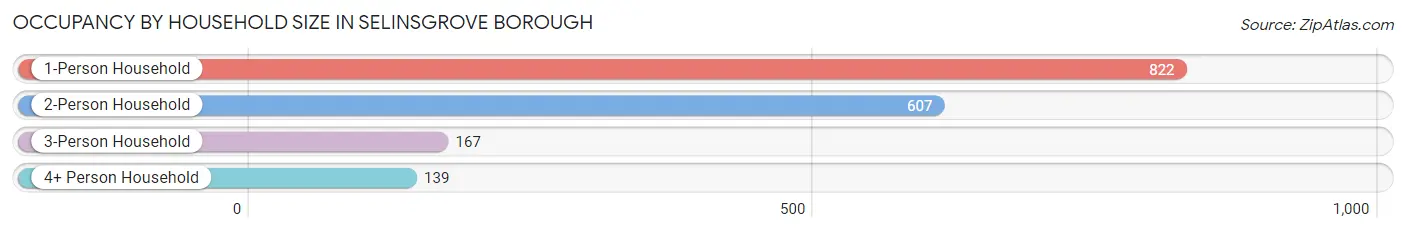
| Household Size | # Housing Units | % Housing Units |
| 1-Person Household | 822 | 47.4% |
| 2-Person Household | 607 | 35.0% |
| 3-Person Household | 167 | 9.6% |
| 4+ Person Household | 139 | 8.0% |
| Total Housing Units | 1,735 | 100.0% |
Occupancy by Ownership by Household Size in Selinsgrove borough
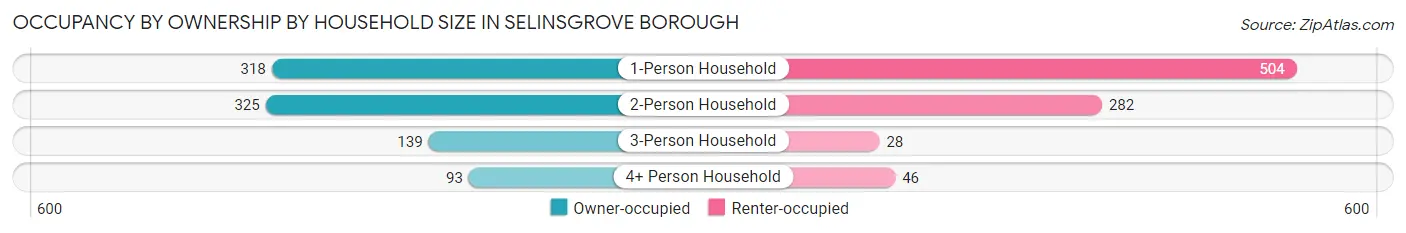
| Household Size | Owner-occupied | Renter-occupied |
| 1-Person Household | 318 (38.7%) | 504 (61.3%) |
| 2-Person Household | 325 (53.5%) | 282 (46.5%) |
| 3-Person Household | 139 (83.2%) | 28 (16.8%) |
| 4+ Person Household | 93 (66.9%) | 46 (33.1%) |
| Total Housing Units | 875 (50.4%) | 860 (49.6%) |
Occupancy by Educational Attainment in Selinsgrove borough
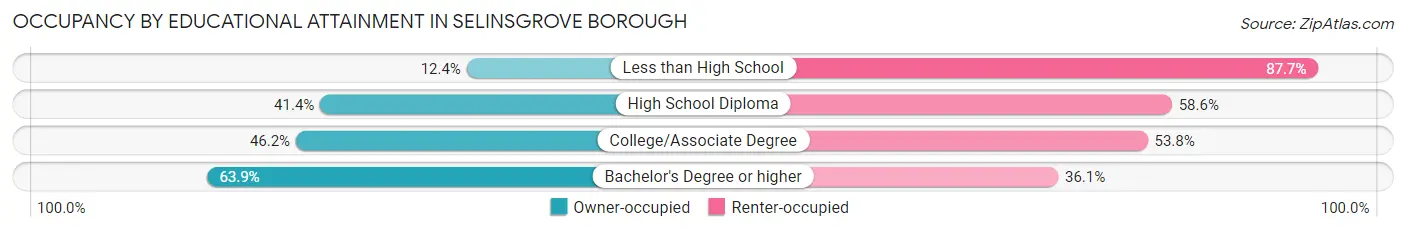
| Household Size | Owner-occupied | Renter-occupied |
| Less than High School | 10 (12.3%) | 71 (87.6%) |
| High School Diploma | 195 (41.4%) | 276 (58.6%) |
| College/Associate Degree | 225 (46.2%) | 262 (53.8%) |
| Bachelor's Degree or higher | 445 (63.9%) | 251 (36.1%) |
Occupancy by Age of Householder in Selinsgrove borough
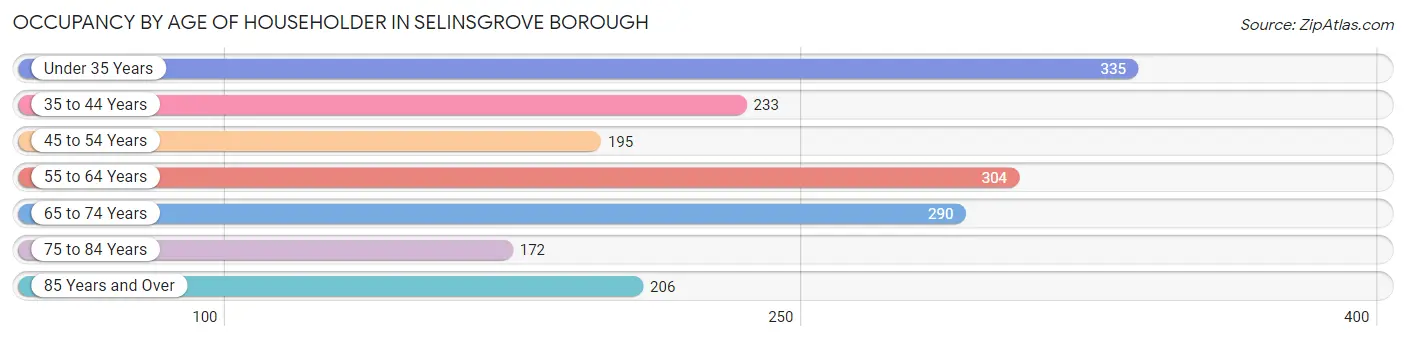
| Age Bracket | # Households | % Households |
| Under 35 Years | 335 | 19.3% |
| 35 to 44 Years | 233 | 13.4% |
| 45 to 54 Years | 195 | 11.2% |
| 55 to 64 Years | 304 | 17.5% |
| 65 to 74 Years | 290 | 16.7% |
| 75 to 84 Years | 172 | 9.9% |
| 85 Years and Over | 206 | 11.9% |
| Total | 1,735 | 100.0% |
Housing Finances in Selinsgrove borough
Median Income by Occupancy in Selinsgrove borough
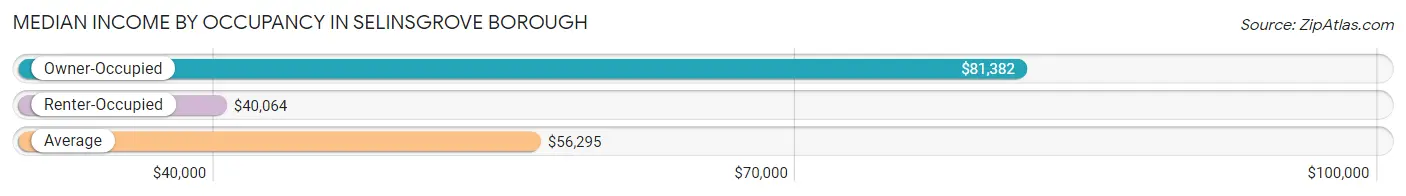
| Occupancy Type | # Households | Median Income |
| Owner-Occupied | 875 (50.4%) | $81,382 |
| Renter-Occupied | 860 (49.6%) | $40,064 |
| Average | 1,735 (100.0%) | $56,295 |
Occupancy by Householder Income Bracket in Selinsgrove borough
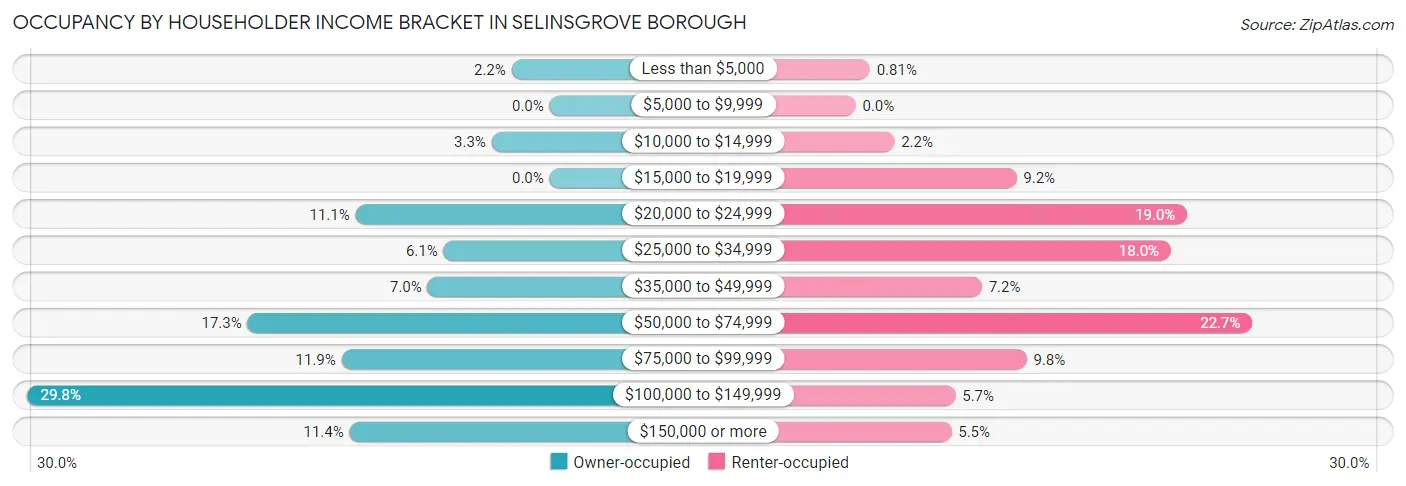
| Income Bracket | Owner-occupied | Renter-occupied |
| Less than $5,000 | 19 (2.2%) | 7 (0.8%) |
| $5,000 to $9,999 | 0 (0.0%) | 0 (0.0%) |
| $10,000 to $14,999 | 29 (3.3%) | 19 (2.2%) |
| $15,000 to $19,999 | 0 (0.0%) | 79 (9.2%) |
| $20,000 to $24,999 | 97 (11.1%) | 163 (19.0%) |
| $25,000 to $34,999 | 53 (6.1%) | 155 (18.0%) |
| $35,000 to $49,999 | 61 (7.0%) | 62 (7.2%) |
| $50,000 to $74,999 | 151 (17.3%) | 195 (22.7%) |
| $75,000 to $99,999 | 104 (11.9%) | 84 (9.8%) |
| $100,000 to $149,999 | 261 (29.8%) | 49 (5.7%) |
| $150,000 or more | 100 (11.4%) | 47 (5.5%) |
| Total | 875 (100.0%) | 860 (100.0%) |
Monthly Housing Cost Tiers in Selinsgrove borough
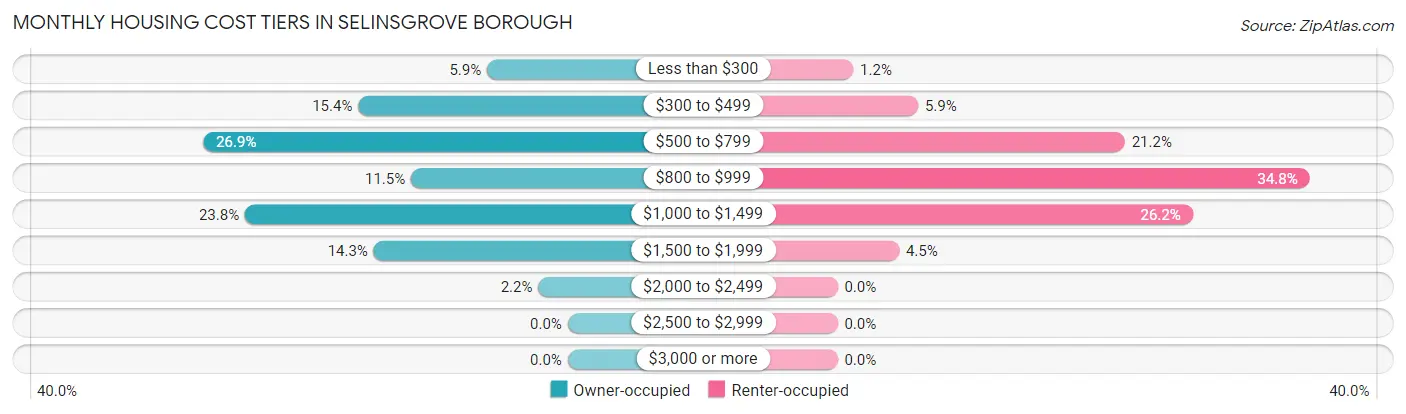
| Monthly Cost | Owner-occupied | Renter-occupied |
| Less than $300 | 52 (5.9%) | 10 (1.2%) |
| $300 to $499 | 135 (15.4%) | 51 (5.9%) |
| $500 to $799 | 235 (26.9%) | 182 (21.2%) |
| $800 to $999 | 101 (11.5%) | 299 (34.8%) |
| $1,000 to $1,499 | 208 (23.8%) | 225 (26.2%) |
| $1,500 to $1,999 | 125 (14.3%) | 39 (4.5%) |
| $2,000 to $2,499 | 19 (2.2%) | 0 (0.0%) |
| $2,500 to $2,999 | 0 (0.0%) | 0 (0.0%) |
| $3,000 or more | 0 (0.0%) | 0 (0.0%) |
| Total | 875 (100.0%) | 860 (100.0%) |
Physical Housing Characteristics in Selinsgrove borough
Housing Structures in Selinsgrove borough
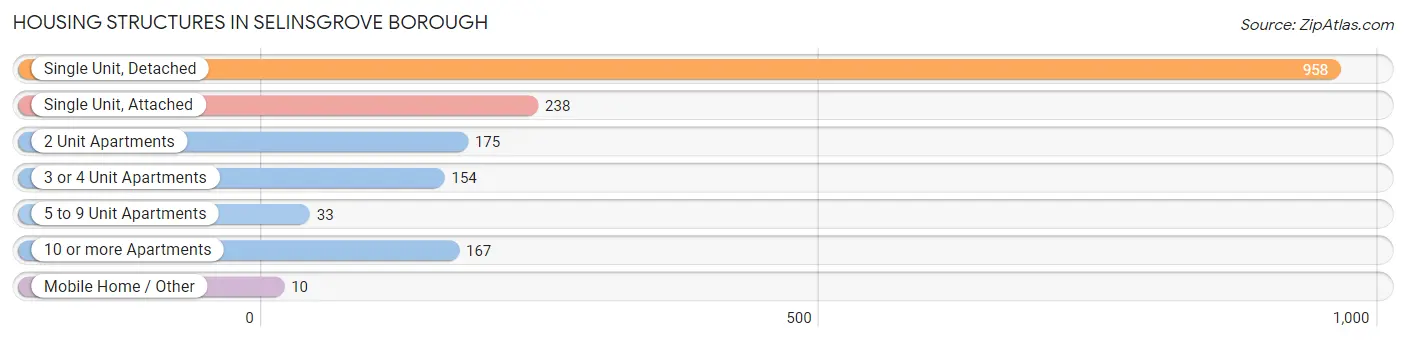
| Structure Type | # Housing Units | % Housing Units |
| Single Unit, Detached | 958 | 55.2% |
| Single Unit, Attached | 238 | 13.7% |
| 2 Unit Apartments | 175 | 10.1% |
| 3 or 4 Unit Apartments | 154 | 8.9% |
| 5 to 9 Unit Apartments | 33 | 1.9% |
| 10 or more Apartments | 167 | 9.6% |
| Mobile Home / Other | 10 | 0.6% |
| Total | 1,735 | 100.0% |
Housing Structures by Occupancy in Selinsgrove borough
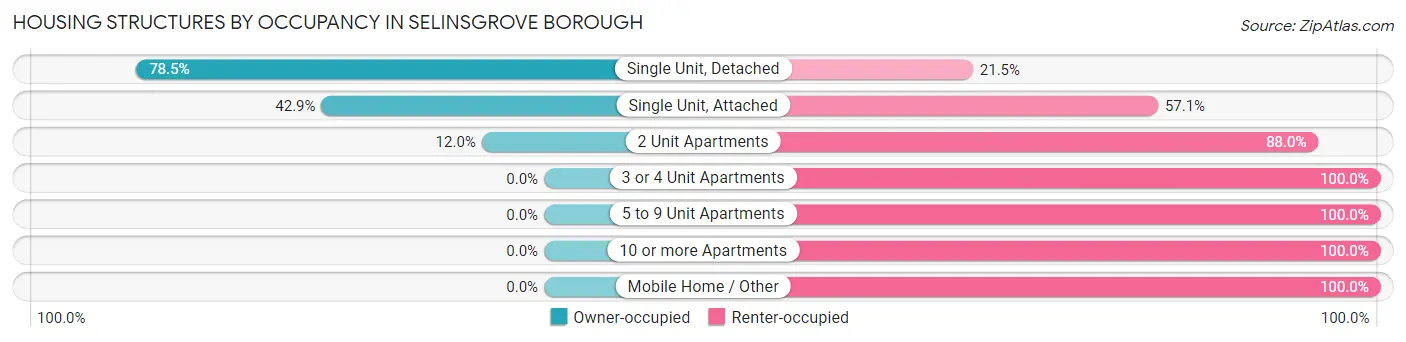
| Structure Type | Owner-occupied | Renter-occupied |
| Single Unit, Detached | 752 (78.5%) | 206 (21.5%) |
| Single Unit, Attached | 102 (42.9%) | 136 (57.1%) |
| 2 Unit Apartments | 21 (12.0%) | 154 (88.0%) |
| 3 or 4 Unit Apartments | 0 (0.0%) | 154 (100.0%) |
| 5 to 9 Unit Apartments | 0 (0.0%) | 33 (100.0%) |
| 10 or more Apartments | 0 (0.0%) | 167 (100.0%) |
| Mobile Home / Other | 0 (0.0%) | 10 (100.0%) |
| Total | 875 (50.4%) | 860 (49.6%) |
Housing Structures by Number of Rooms in Selinsgrove borough
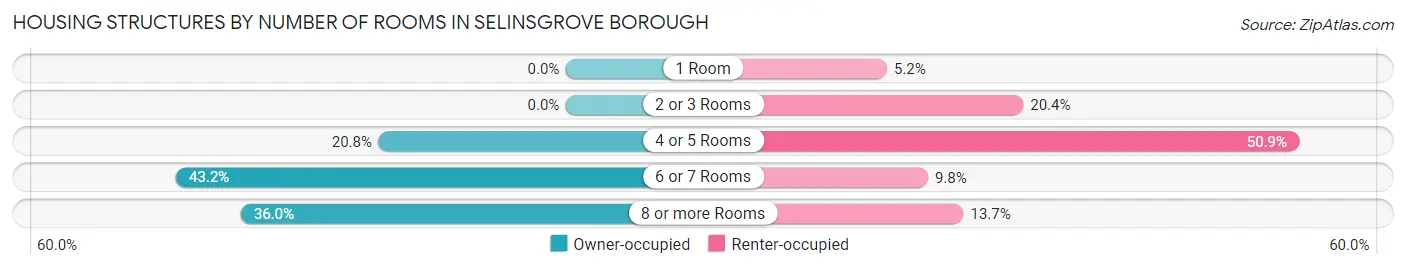
| Number of Rooms | Owner-occupied | Renter-occupied |
| 1 Room | 0 (0.0%) | 45 (5.2%) |
| 2 or 3 Rooms | 0 (0.0%) | 175 (20.3%) |
| 4 or 5 Rooms | 182 (20.8%) | 438 (50.9%) |
| 6 or 7 Rooms | 378 (43.2%) | 84 (9.8%) |
| 8 or more Rooms | 315 (36.0%) | 118 (13.7%) |
| Total | 875 (100.0%) | 860 (100.0%) |
Housing Structure by Heating Type in Selinsgrove borough
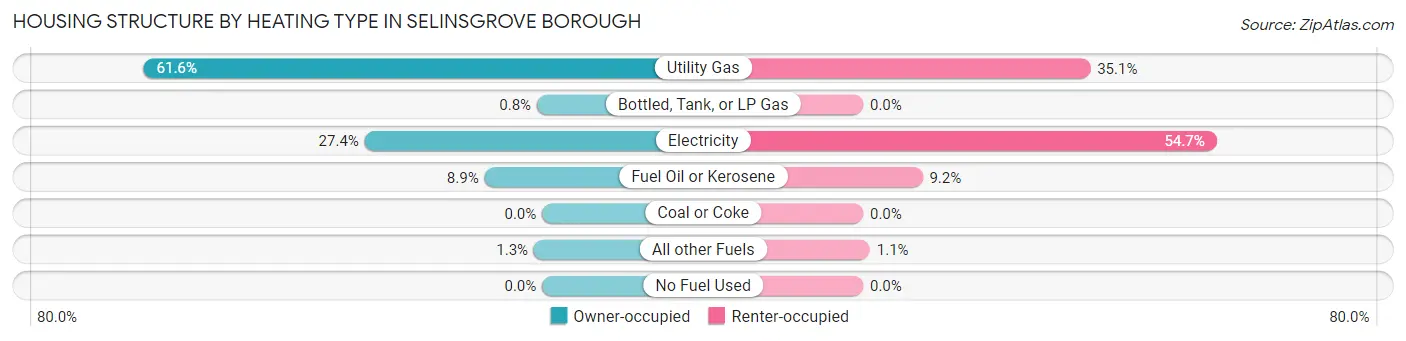
| Heating Type | Owner-occupied | Renter-occupied |
| Utility Gas | 539 (61.6%) | 302 (35.1%) |
| Bottled, Tank, or LP Gas | 7 (0.8%) | 0 (0.0%) |
| Electricity | 240 (27.4%) | 470 (54.6%) |
| Fuel Oil or Kerosene | 78 (8.9%) | 79 (9.2%) |
| Coal or Coke | 0 (0.0%) | 0 (0.0%) |
| All other Fuels | 11 (1.3%) | 9 (1.1%) |
| No Fuel Used | 0 (0.0%) | 0 (0.0%) |
| Total | 875 (100.0%) | 860 (100.0%) |
Household Vehicle Usage in Selinsgrove borough
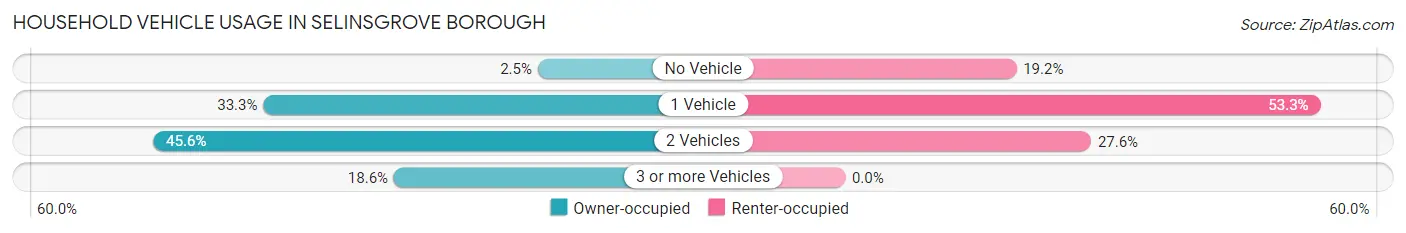
| Vehicles per Household | Owner-occupied | Renter-occupied |
| No Vehicle | 22 (2.5%) | 165 (19.2%) |
| 1 Vehicle | 291 (33.3%) | 458 (53.3%) |
| 2 Vehicles | 399 (45.6%) | 237 (27.6%) |
| 3 or more Vehicles | 163 (18.6%) | 0 (0.0%) |
| Total | 875 (100.0%) | 860 (100.0%) |
Real Estate & Mortgages in Selinsgrove borough
Real Estate and Mortgage Overview in Selinsgrove borough
| Characteristic | Without Mortgage | With Mortgage |
| Housing Units | 436 | 439 |
| Median Property Value | $198,300 | $187,500 |
| Median Household Income | $56,250 | $60 |
| Monthly Housing Costs | $563 | $0 |
| Real Estate Taxes | $2,244 | $0 |
Property Value by Mortgage Status in Selinsgrove borough
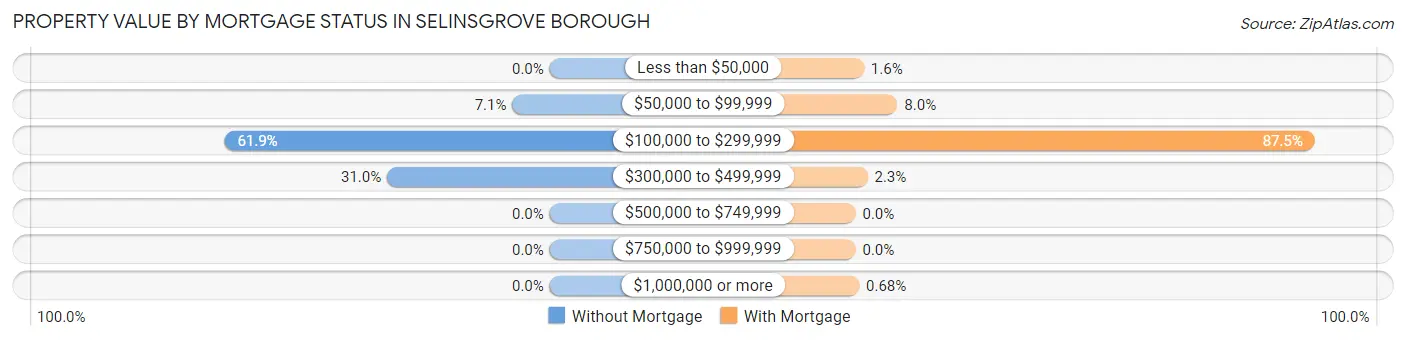
| Property Value | Without Mortgage | With Mortgage |
| Less than $50,000 | 0 (0.0%) | 7 (1.6%) |
| $50,000 to $99,999 | 31 (7.1%) | 35 (8.0%) |
| $100,000 to $299,999 | 270 (61.9%) | 384 (87.5%) |
| $300,000 to $499,999 | 135 (31.0%) | 10 (2.3%) |
| $500,000 to $749,999 | 0 (0.0%) | 0 (0.0%) |
| $750,000 to $999,999 | 0 (0.0%) | 0 (0.0%) |
| $1,000,000 or more | 0 (0.0%) | 3 (0.7%) |
| Total | 436 (100.0%) | 439 (100.0%) |
Household Income by Mortgage Status in Selinsgrove borough
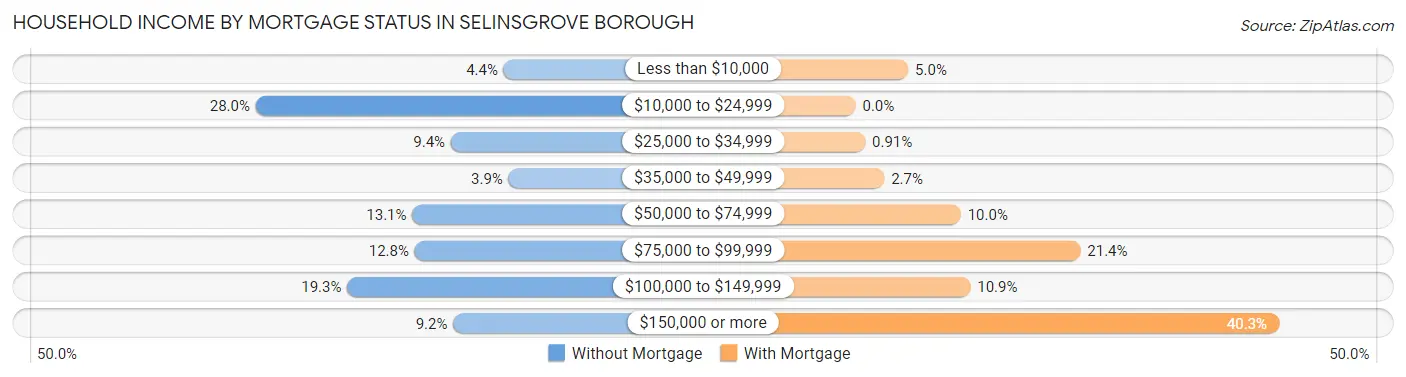
| Household Income | Without Mortgage | With Mortgage |
| Less than $10,000 | 19 (4.4%) | 22 (5.0%) |
| $10,000 to $24,999 | 122 (28.0%) | 0 (0.0%) |
| $25,000 to $34,999 | 41 (9.4%) | 4 (0.9%) |
| $35,000 to $49,999 | 17 (3.9%) | 12 (2.7%) |
| $50,000 to $74,999 | 57 (13.1%) | 44 (10.0%) |
| $75,000 to $99,999 | 56 (12.8%) | 94 (21.4%) |
| $100,000 to $149,999 | 84 (19.3%) | 48 (10.9%) |
| $150,000 or more | 40 (9.2%) | 177 (40.3%) |
| Total | 436 (100.0%) | 439 (100.0%) |
Property Value to Household Income Ratio in Selinsgrove borough
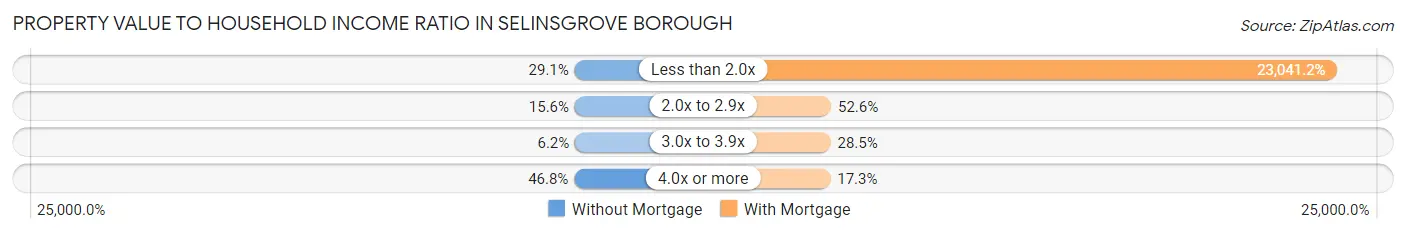
| Value-to-Income Ratio | Without Mortgage | With Mortgage |
| Less than 2.0x | 127 (29.1%) | 101,151 (23,041.2%) |
| 2.0x to 2.9x | 68 (15.6%) | 231 (52.6%) |
| 3.0x to 3.9x | 27 (6.2%) | 125 (28.5%) |
| 4.0x or more | 204 (46.8%) | 76 (17.3%) |
| Total | 436 (100.0%) | 439 (100.0%) |
Real Estate Taxes by Mortgage Status in Selinsgrove borough
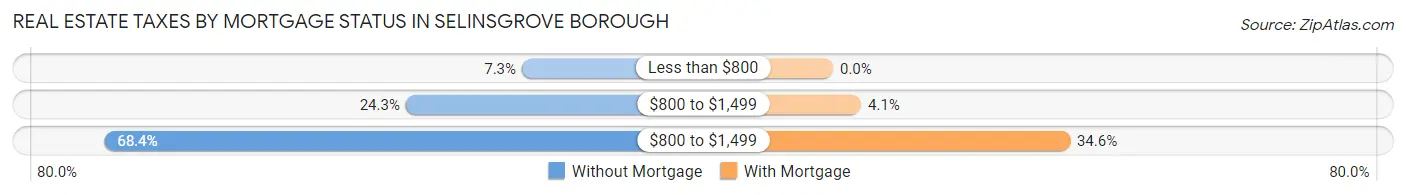
| Property Taxes | Without Mortgage | With Mortgage |
| Less than $800 | 32 (7.3%) | 0 (0.0%) |
| $800 to $1,499 | 106 (24.3%) | 18 (4.1%) |
| $800 to $1,499 | 298 (68.3%) | 152 (34.6%) |
| Total | 436 (100.0%) | 439 (100.0%) |
Health & Disability in Selinsgrove borough
Health Insurance Coverage by Age in Selinsgrove borough
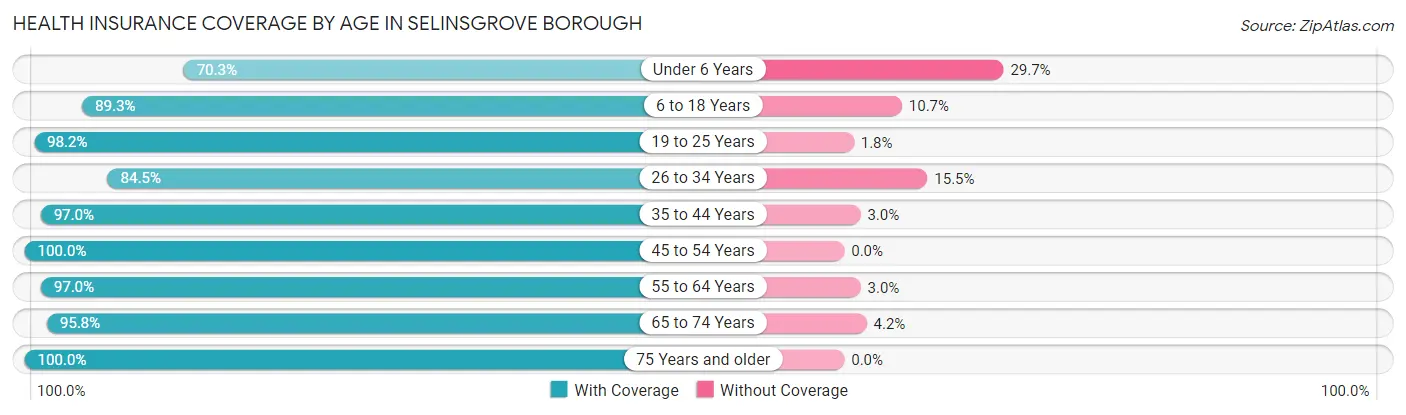
| Age Bracket | With Coverage | Without Coverage |
| Under 6 Years | 109 (70.3%) | 46 (29.7%) |
| 6 to 18 Years | 723 (89.3%) | 87 (10.7%) |
| 19 to 25 Years | 1,947 (98.2%) | 35 (1.8%) |
| 26 to 34 Years | 442 (84.5%) | 81 (15.5%) |
| 35 to 44 Years | 419 (97.0%) | 13 (3.0%) |
| 45 to 54 Years | 289 (100.0%) | 0 (0.0%) |
| 55 to 64 Years | 446 (97.0%) | 14 (3.0%) |
| 65 to 74 Years | 461 (95.8%) | 20 (4.2%) |
| 75 Years and older | 408 (100.0%) | 0 (0.0%) |
| Total | 5,244 (94.7%) | 296 (5.3%) |
Health Insurance Coverage by Citizenship Status in Selinsgrove borough
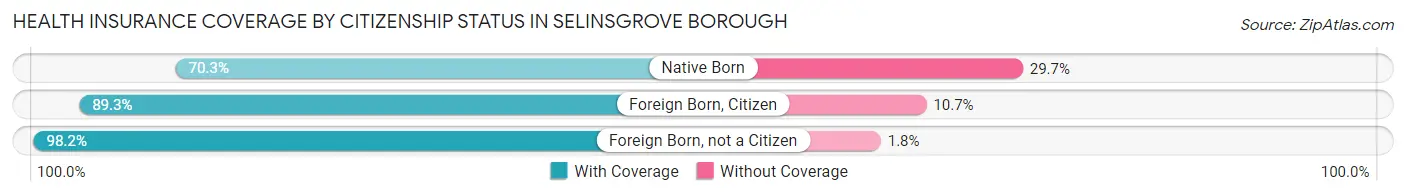
| Citizenship Status | With Coverage | Without Coverage |
| Native Born | 109 (70.3%) | 46 (29.7%) |
| Foreign Born, Citizen | 723 (89.3%) | 87 (10.7%) |
| Foreign Born, not a Citizen | 1,947 (98.2%) | 35 (1.8%) |
Health Insurance Coverage by Household Income in Selinsgrove borough
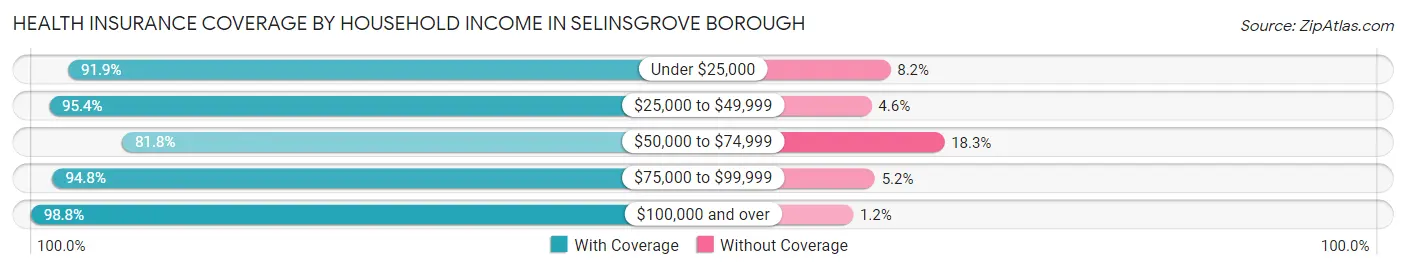
| Household Income | With Coverage | Without Coverage |
| Under $25,000 | 496 (91.8%) | 44 (8.2%) |
| $25,000 to $49,999 | 435 (95.4%) | 21 (4.6%) |
| $50,000 to $74,999 | 663 (81.8%) | 148 (18.2%) |
| $75,000 to $99,999 | 362 (94.8%) | 20 (5.2%) |
| $100,000 and over | 1,107 (98.8%) | 13 (1.2%) |
Public vs Private Health Insurance Coverage by Age in Selinsgrove borough
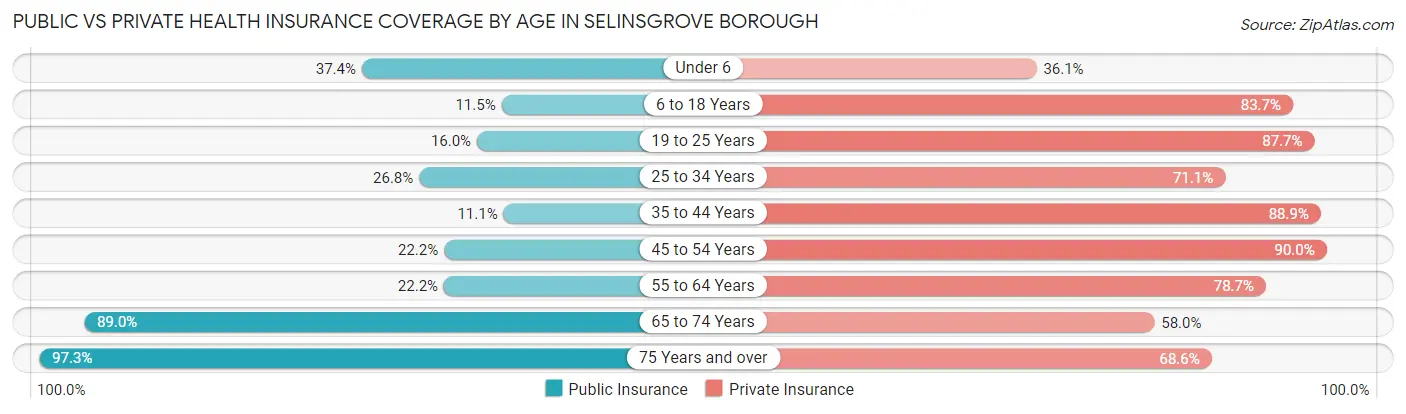
| Age Bracket | Public Insurance | Private Insurance |
| Under 6 | 58 (37.4%) | 56 (36.1%) |
| 6 to 18 Years | 93 (11.5%) | 678 (83.7%) |
| 19 to 25 Years | 318 (16.0%) | 1,738 (87.7%) |
| 25 to 34 Years | 140 (26.8%) | 372 (71.1%) |
| 35 to 44 Years | 48 (11.1%) | 384 (88.9%) |
| 45 to 54 Years | 64 (22.2%) | 260 (90.0%) |
| 55 to 64 Years | 102 (22.2%) | 362 (78.7%) |
| 65 to 74 Years | 428 (89.0%) | 279 (58.0%) |
| 75 Years and over | 397 (97.3%) | 280 (68.6%) |
| Total | 1,648 (29.7%) | 4,409 (79.6%) |
Disability Status by Sex by Age in Selinsgrove borough
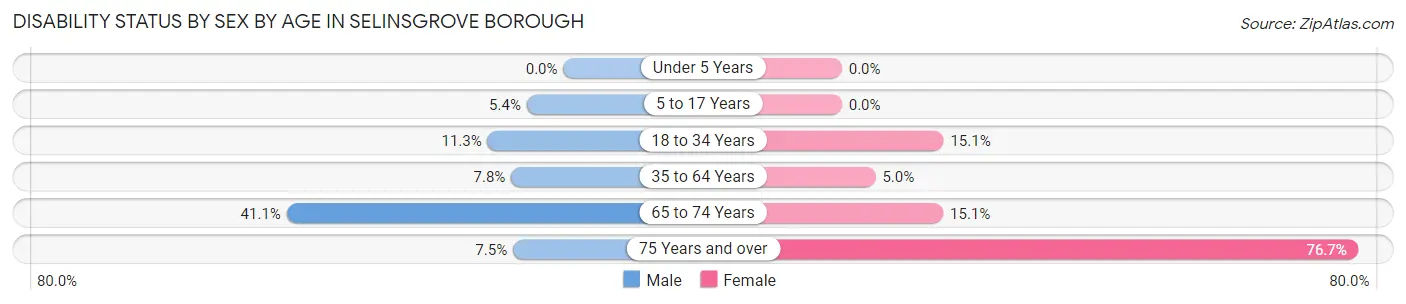
| Age Bracket | Male | Female |
| Under 5 Years | 0 (0.0%) | 0 (0.0%) |
| 5 to 17 Years | 16 (5.4%) | 0 (0.0%) |
| 18 to 34 Years | 149 (11.3%) | 248 (15.1%) |
| 35 to 64 Years | 45 (7.7%) | 30 (5.0%) |
| 65 to 74 Years | 113 (41.1%) | 31 (15.0%) |
| 75 Years and over | 8 (7.5%) | 231 (76.7%) |
Disability Class by Sex by Age in Selinsgrove borough
Disability Class: Hearing Difficulty
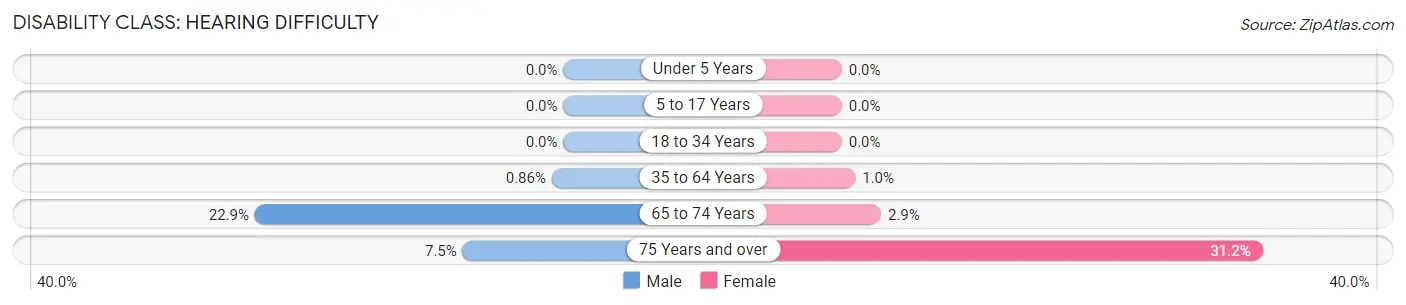
| Age Bracket | Male | Female |
| Under 5 Years | 0 (0.0%) | 0 (0.0%) |
| 5 to 17 Years | 0 (0.0%) | 0 (0.0%) |
| 18 to 34 Years | 0 (0.0%) | 0 (0.0%) |
| 35 to 64 Years | 5 (0.9%) | 6 (1.0%) |
| 65 to 74 Years | 63 (22.9%) | 6 (2.9%) |
| 75 Years and over | 8 (7.5%) | 94 (31.2%) |
Disability Class: Vision Difficulty
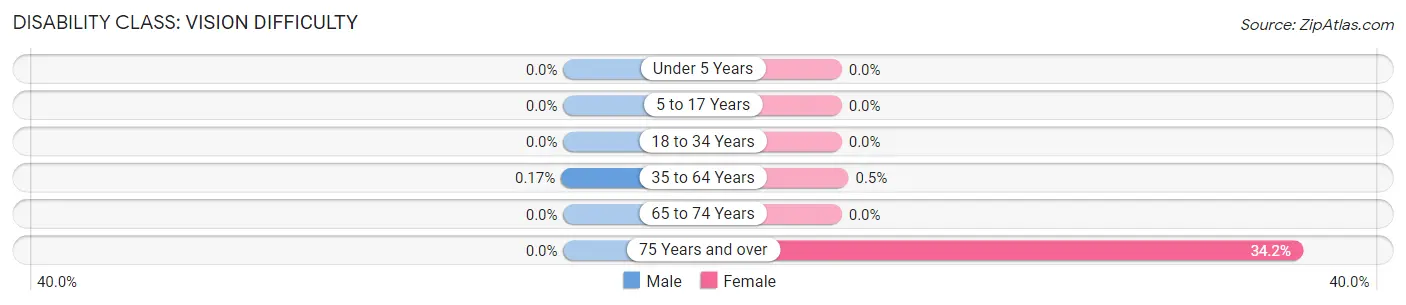
| Age Bracket | Male | Female |
| Under 5 Years | 0 (0.0%) | 0 (0.0%) |
| 5 to 17 Years | 0 (0.0%) | 0 (0.0%) |
| 18 to 34 Years | 0 (0.0%) | 0 (0.0%) |
| 35 to 64 Years | 1 (0.2%) | 3 (0.5%) |
| 65 to 74 Years | 0 (0.0%) | 0 (0.0%) |
| 75 Years and over | 0 (0.0%) | 103 (34.2%) |
Disability Class: Cognitive Difficulty
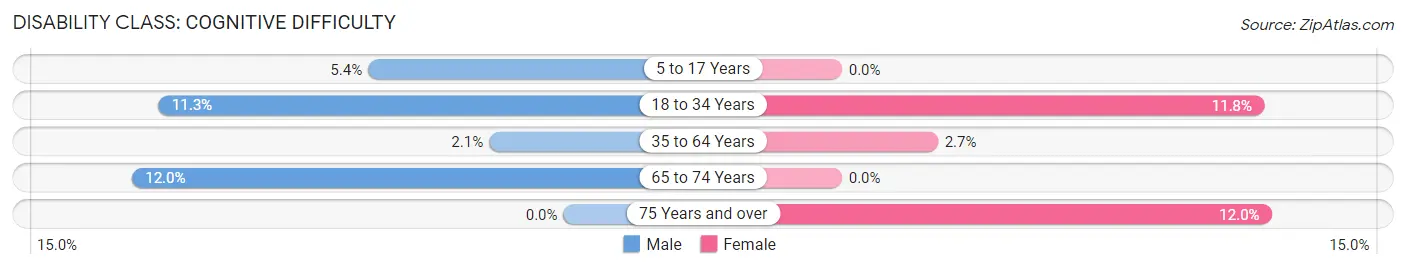
| Age Bracket | Male | Female |
| 5 to 17 Years | 16 (5.4%) | 0 (0.0%) |
| 18 to 34 Years | 149 (11.3%) | 193 (11.7%) |
| 35 to 64 Years | 12 (2.1%) | 16 (2.7%) |
| 65 to 74 Years | 33 (12.0%) | 0 (0.0%) |
| 75 Years and over | 0 (0.0%) | 36 (12.0%) |
Disability Class: Ambulatory Difficulty
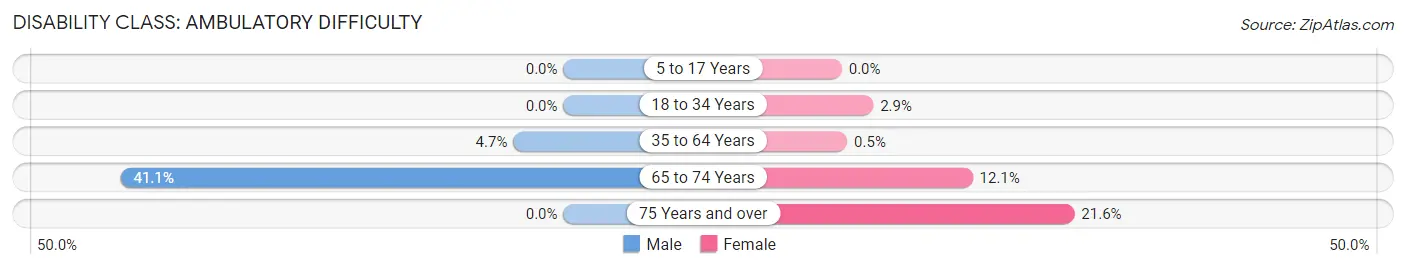
| Age Bracket | Male | Female |
| 5 to 17 Years | 0 (0.0%) | 0 (0.0%) |
| 18 to 34 Years | 0 (0.0%) | 48 (2.9%) |
| 35 to 64 Years | 27 (4.6%) | 3 (0.5%) |
| 65 to 74 Years | 113 (41.1%) | 25 (12.1%) |
| 75 Years and over | 0 (0.0%) | 65 (21.6%) |
Disability Class: Self-Care Difficulty
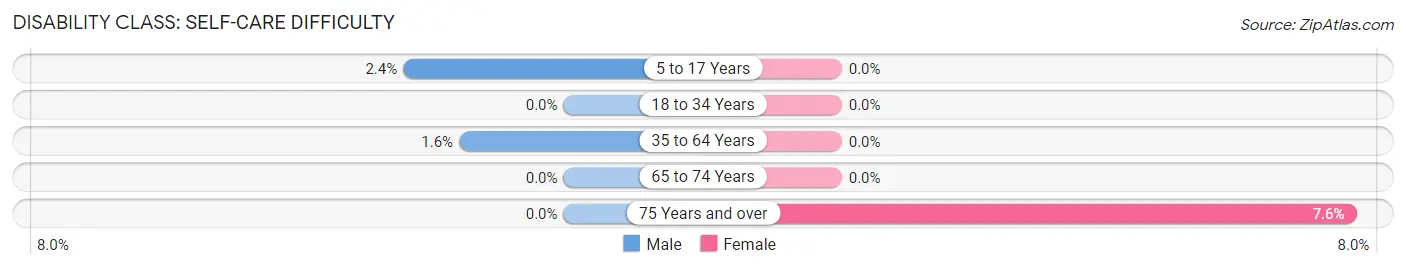
| Age Bracket | Male | Female |
| 5 to 17 Years | 7 (2.4%) | 0 (0.0%) |
| 18 to 34 Years | 0 (0.0%) | 0 (0.0%) |
| 35 to 64 Years | 9 (1.5%) | 0 (0.0%) |
| 65 to 74 Years | 0 (0.0%) | 0 (0.0%) |
| 75 Years and over | 0 (0.0%) | 23 (7.6%) |
Technology Access in Selinsgrove borough
Computing Device Access in Selinsgrove borough
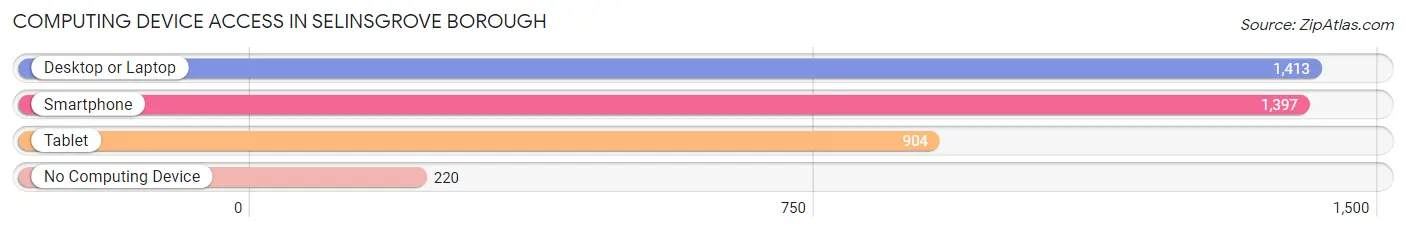
| Device Type | # Households | % Households |
| Desktop or Laptop | 1,413 | 81.4% |
| Smartphone | 1,397 | 80.5% |
| Tablet | 904 | 52.1% |
| No Computing Device | 220 | 12.7% |
| Total | 1,735 | 100.0% |
Internet Access in Selinsgrove borough
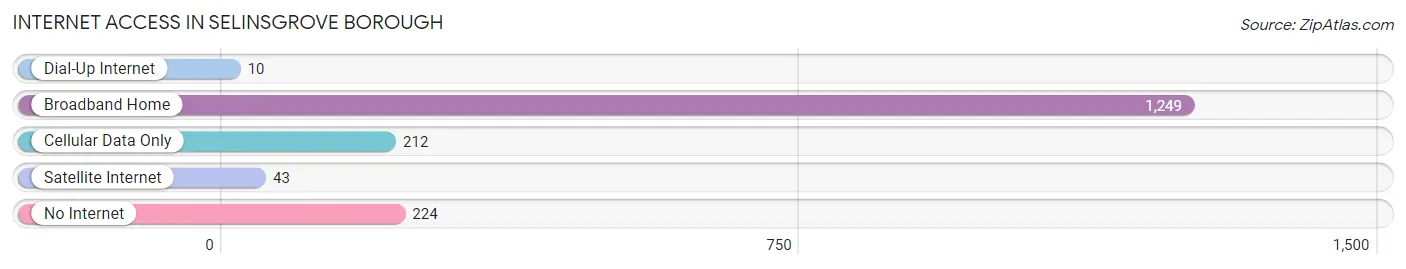
| Internet Type | # Households | % Households |
| Dial-Up Internet | 10 | 0.6% |
| Broadband Home | 1,249 | 72.0% |
| Cellular Data Only | 212 | 12.2% |
| Satellite Internet | 43 | 2.5% |
| No Internet | 224 | 12.9% |
| Total | 1,735 | 100.0% |
Selinsgrove borough Summary
Selinsgrove Borough is a small borough located in Snyder County, Pennsylvania. It is situated along the Susquehanna River, approximately 10 miles south of the state capital of Harrisburg. The borough has a population of 5,383 as of the 2010 census, making it the largest borough in Snyder County.
History
The area that is now Selinsgrove Borough was first settled in 1773 by John Selin, a German immigrant. Selin purchased a tract of land along the Susquehanna River and established a ferry service across the river. The settlement that grew up around the ferry service was initially known as Selin’s Grove, and was later shortened to Selinsgrove.
In 1814, the borough was officially incorporated as a borough. The borough was named after John Selin, and the name was officially changed to Selinsgrove in 1817.
In the 19th century, Selinsgrove was an important transportation hub. The Susquehanna River was a major transportation route, and the borough was the site of several ferries and bridges. The Pennsylvania Canal, which connected Philadelphia to Pittsburgh, also ran through the borough.
The borough was also an important industrial center in the 19th century. Several mills and factories were established in the borough, including a paper mill, a tannery, and a foundry.
Geography
Selinsgrove Borough is located in Snyder County, Pennsylvania. It is situated along the Susquehanna River, approximately 10 miles south of the state capital of Harrisburg. The borough has a total area of 1.2 square miles, all of which is land.
The borough is located in the Ridge and Valley physiographic province, which is characterized by long, narrow ridges and valleys. The borough is located on the western edge of the Great Valley, which is a large valley that runs along the eastern edge of the Appalachian Mountains.
Economy
Selinsgrove Borough’s economy is largely based on tourism and retail. The borough is home to several tourist attractions, including the Susquehanna Riverwalk, the Selinsgrove Speedway, and the Selinsgrove Historic District. The borough is also home to several retail stores, including a Walmart Supercenter and a Lowe’s Home Improvement store.
The borough is also home to several manufacturing companies, including a paper mill, a tannery, and a foundry. The borough is also home to several educational institutions, including Susquehanna University and the Central Susquehanna Intermediate Unit.
Demographics
As of the 2010 census, Selinsgrove Borough had a population of 5,383. The racial makeup of the borough was 95.2% White, 1.2% African American, 0.3% Native American, 0.9% Asian, 0.1% Pacific Islander, 0.7% from other races, and 1.6% from two or more races. Hispanic or Latino of any race were 2.2% of the population.
The median household income in the borough was $41,944, and the median family income was $50,938. The per capita income in the borough was $20,945. About 8.2% of families and 11.2% of the population were below the poverty line, including 15.2% of those under age 18 and 8.2% of those age 65 or over.
Common Questions
What is the Total Population of Selinsgrove borough?
Total Population of Selinsgrove borough is 5,710.
What is the Total Male Population of Selinsgrove borough?
Total Male Population of Selinsgrove borough is 2,756.
What is the Total Female Population of Selinsgrove borough?
Total Female Population of Selinsgrove borough is 2,954.
What is the Ratio of Males per 100 Females in Selinsgrove borough?
There are 93.30 Males per 100 Females in Selinsgrove borough.
What is the Ratio of Females per 100 Males in Selinsgrove borough?
There are 107.18 Females per 100 Males in Selinsgrove borough.
What is the Median Population Age in Selinsgrove borough?
Median Population Age in Selinsgrove borough is 24.0 Years.
What is the Average Family Size in Selinsgrove borough
Average Family Size in Selinsgrove borough is 2.8 People.
What is the Average Household Size in Selinsgrove borough
Average Household Size in Selinsgrove borough is 1.9 People.
What is Per Capita Income in Selinsgrove borough?
Per Capita income in Selinsgrove borough is $24,854.
What is the Median Family Income in Selinsgrove borough?
Median Family Income in Selinsgrove borough is $81,908.
What is the Median Household income in Selinsgrove borough?
Median Household Income in Selinsgrove borough is $56,295.
What is Income or Wage Gap in Selinsgrove borough?
Income or Wage Gap in Selinsgrove borough is 67.0%.
Women in Selinsgrove borough earn 33.0 cents for every dollar earned by a man.
What is Inequality or Gini Index in Selinsgrove borough?
Inequality or Gini Index in Selinsgrove borough is 0.41.
How Large is the Labor Force in Selinsgrove borough?
There are 2,979 People in the Labor Forcein in Selinsgrove borough.
What is the Percentage of People in the Labor Force in Selinsgrove borough?
56.7% of People are in the Labor Force in Selinsgrove borough.
What is the Unemployment Rate in Selinsgrove borough?
Unemployment Rate in Selinsgrove borough is 1.5%.