Zion, PA
Zion Map
Zion Overview
2,273
TOTAL POPULATION
1,194
MALE POPULATION
1,079
FEMALE POPULATION
110.66
MALES / 100 FEMALES
90.37
FEMALES / 100 MALES
51.3
MEDIAN AGE
2.3
AVG FAMILY SIZE
2.1
AVG HOUSEHOLD SIZE
$54,452
PER CAPITA INCOME
$111,696
AVG FAMILY INCOME
$96,083
AVG HOUSEHOLD INCOME
22.1%
WAGE / INCOME GAP [ % ]
77.9¢/ $1
WAGE / INCOME GAP [ $ ]
0.35
INEQUALITY / GINI INDEX
1,531
LABOR FORCE [ PEOPLE ]
74.9%
PERCENT IN LABOR FORCE
9.6%
UNEMPLOYMENT RATE
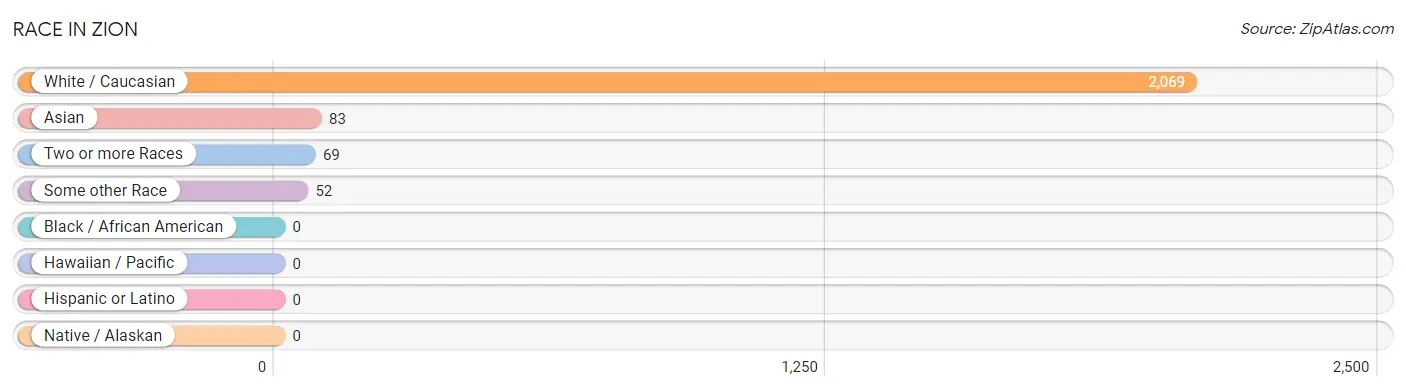
Race in Zion
The most populous races in Zion are White / Caucasian (2,069 | 91.0%), Asian (83 | 3.6%), and Two or more Races (69 | 3.0%).
| Race | # Population | % Population |
| Asian | 83 | 3.6% |
| Black / African American | 0 | 0.0% |
| Hawaiian / Pacific | 0 | 0.0% |
| Hispanic or Latino | 0 | 0.0% |
| Native / Alaskan | 0 | 0.0% |
| White / Caucasian | 2,069 | 91.0% |
| Two or more Races | 69 | 3.0% |
| Some other Race | 52 | 2.3% |
| Total | 2,273 | 100.0% |
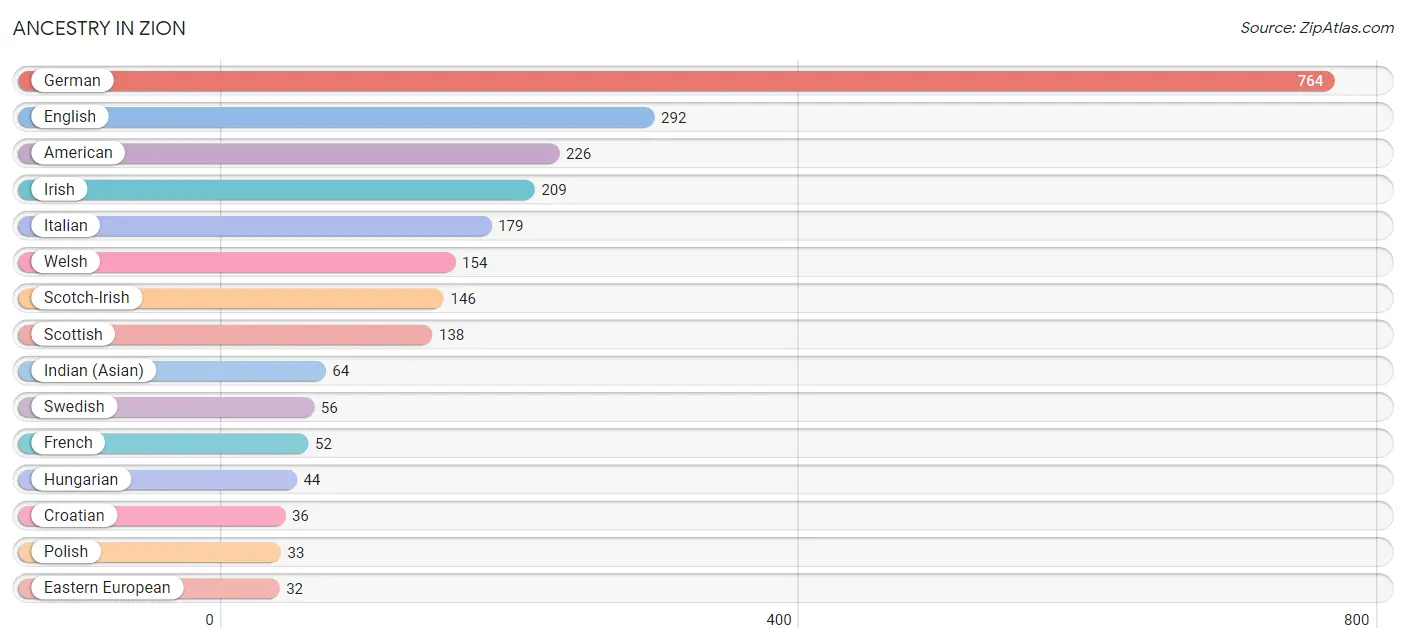
Ancestry in Zion
The most populous ancestries reported in Zion are German (764 | 33.6%), English (292 | 12.9%), American (226 | 9.9%), Irish (209 | 9.2%), and Italian (179 | 7.9%), together accounting for 73.5% of all Zion residents.
| Ancestry | # Population | % Population |
| American | 226 | 9.9% |
| Chippewa | 7 | 0.3% |
| Croatian | 36 | 1.6% |
| Dutch | 14 | 0.6% |
| Eastern European | 32 | 1.4% |
| English | 292 | 12.9% |
| European | 22 | 1.0% |
| Finnish | 14 | 0.6% |
| French | 52 | 2.3% |
| German | 764 | 33.6% |
| Hungarian | 44 | 1.9% |
| Indian (Asian) | 64 | 2.8% |
| Irish | 209 | 9.2% |
| Italian | 179 | 7.9% |
| Korean | 19 | 0.8% |
| Lithuanian | 19 | 0.8% |
| Polish | 33 | 1.5% |
| Scotch-Irish | 146 | 6.4% |
| Scottish | 138 | 6.1% |
| Slovak | 28 | 1.2% |
| Swedish | 56 | 2.5% |
| Ukrainian | 27 | 1.2% |
| Welsh | 154 | 6.8% | View All 23 Rows |
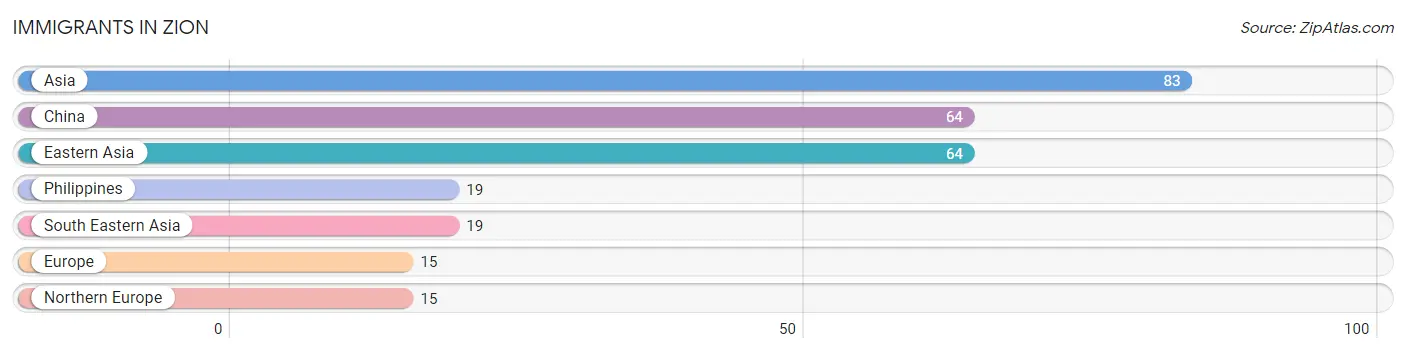
Immigrants in Zion
The most numerous immigrant groups reported in Zion came from Asia (83 | 3.6%), China (64 | 2.8%), Eastern Asia (64 | 2.8%), Philippines (19 | 0.8%), and South Eastern Asia (19 | 0.8%), together accounting for 11.0% of all Zion residents.
| Immigration Origin | # Population | % Population |
| Asia | 83 | 3.6% |
| China | 64 | 2.8% |
| Eastern Asia | 64 | 2.8% |
| Europe | 15 | 0.7% |
| Northern Europe | 15 | 0.7% |
| Philippines | 19 | 0.8% |
| South Eastern Asia | 19 | 0.8% | View All 7 Rows |
Sex and Age in Zion
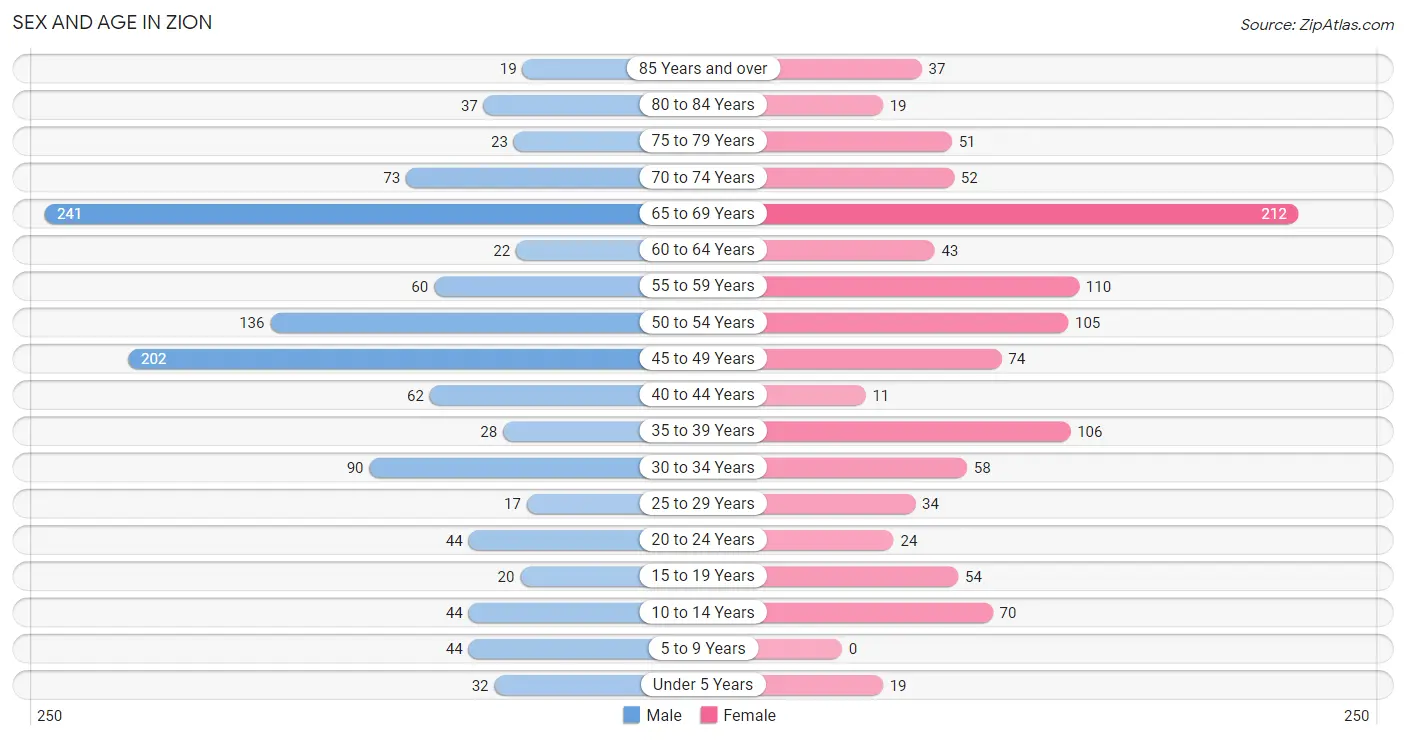
Sex and Age in Zion
The most populous age groups in Zion are 65 to 69 Years (241 | 20.2%) for men and 65 to 69 Years (212 | 19.7%) for women.
| Age Bracket | Male | Female |
| Under 5 Years | 32 (2.7%) | 19 (1.8%) |
| 5 to 9 Years | 44 (3.7%) | 0 (0.0%) |
| 10 to 14 Years | 44 (3.7%) | 70 (6.5%) |
| 15 to 19 Years | 20 (1.7%) | 54 (5.0%) |
| 20 to 24 Years | 44 (3.7%) | 24 (2.2%) |
| 25 to 29 Years | 17 (1.4%) | 34 (3.2%) |
| 30 to 34 Years | 90 (7.5%) | 58 (5.4%) |
| 35 to 39 Years | 28 (2.4%) | 106 (9.8%) |
| 40 to 44 Years | 62 (5.2%) | 11 (1.0%) |
| 45 to 49 Years | 202 (16.9%) | 74 (6.9%) |
| 50 to 54 Years | 136 (11.4%) | 105 (9.7%) |
| 55 to 59 Years | 60 (5.0%) | 110 (10.2%) |
| 60 to 64 Years | 22 (1.8%) | 43 (4.0%) |
| 65 to 69 Years | 241 (20.2%) | 212 (19.7%) |
| 70 to 74 Years | 73 (6.1%) | 52 (4.8%) |
| 75 to 79 Years | 23 (1.9%) | 51 (4.7%) |
| 80 to 84 Years | 37 (3.1%) | 19 (1.8%) |
| 85 Years and over | 19 (1.6%) | 37 (3.4%) |
| Total | 1,194 (100.0%) | 1,079 (100.0%) |
Families and Households in Zion
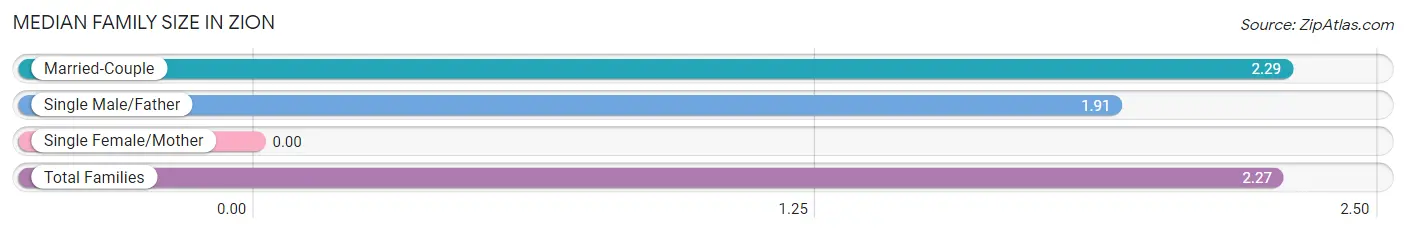
Median Family Size in Zion
| Family Type | # Families | Family Size |
| Married-Couple | 851 (94.0%) | 2.29 |
| Single Male/Father | 54 (6.0%) | 1.91 |
| Single Female/Mother | 0 (0.0%) | - |
| Total Families | 905 (100.0%) | 2.27 |
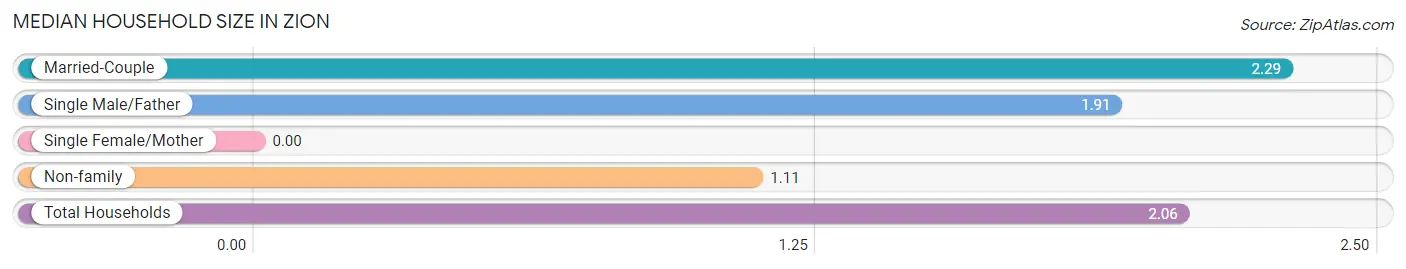
Median Household Size in Zion
| Household Type | # Households | Household Size |
| Married-Couple | 851 (77.6%) | 2.29 |
| Single Male/Father | 54 (4.9%) | 1.91 |
| Single Female/Mother | 0 (0.0%) | - |
| Non-family | 192 (17.5%) | 1.11 |
| Total Households | 1,097 (100.0%) | 2.06 |
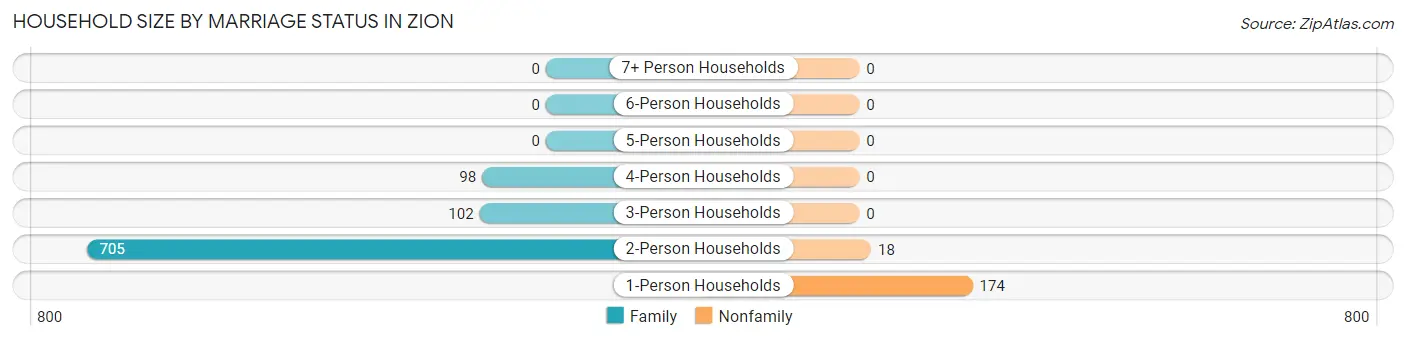
Household Size by Marriage Status in Zion
Out of a total of 1,097 households in Zion, 905 (82.5%) are family households, while 192 (17.5%) are nonfamily households. The most numerous type of family households are 2-person households, comprising 705, and the most common type of nonfamily households are 1-person households, comprising 174.
| Household Size | Family Households | Nonfamily Households |
| 1-Person Households | - | 174 (15.9%) |
| 2-Person Households | 705 (64.3%) | 18 (1.6%) |
| 3-Person Households | 102 (9.3%) | 0 (0.0%) |
| 4-Person Households | 98 (8.9%) | 0 (0.0%) |
| 5-Person Households | 0 (0.0%) | 0 (0.0%) |
| 6-Person Households | 0 (0.0%) | 0 (0.0%) |
| 7+ Person Households | 0 (0.0%) | 0 (0.0%) |
| Total | 905 (82.5%) | 192 (17.5%) |
Female Fertility in Zion
Fertility by Age in Zion
| Age Bracket | Women with Births | Births / 1,000 Women |
| 15 to 19 years | 0 (0.0%) | 0.0 |
| 20 to 34 years | 0 (0.0%) | 0.0 |
| 35 to 50 years | 0 (0.0%) | 0.0 |
| Total | 0 (0.0%) | 0.0 |
Fertility by Age by Marriage Status in Zion
| Age Bracket | Married | Unmarried |
| 15 to 19 years | 0 (0.0%) | 0 (0.0%) |
| 20 to 34 years | 0 (0.0%) | 0 (0.0%) |
| 35 to 50 years | 0 (0.0%) | 0 (0.0%) |
| Total | 0 (0.0%) | 0 (0.0%) |
Fertility by Education in Zion
| Educational Attainment | Women with Births | Births / 1,000 Women |
| Less than High School | 0 (0.0%) | 0.0 |
| High School Diploma | 0 (0.0%) | 0.0 |
| College or Associate's Degree | 0 (0.0%) | 0.0 |
| Bachelor's Degree | 0 (0.0%) | 0.0 |
| Graduate Degree | 0 (0.0%) | 0.0 |
| Total | 0 (0.0%) | 0.0 |
Fertility by Education by Marriage Status in Zion
| Educational Attainment | Married | Unmarried |
| Less than High School | 0 (0.0%) | 0 (0.0%) |
| High School Diploma | 0 (0.0%) | 0 (0.0%) |
| College or Associate's Degree | 0 (0.0%) | 0 (0.0%) |
| Bachelor's Degree | 0 (0.0%) | 0 (0.0%) |
| Graduate Degree | 0 (0.0%) | 0 (0.0%) |
| Total | 0 (0.0%) | 0 (0.0%) |
Income in Zion
Income Overview in Zion
Per Capita Income in Zion is $54,452, while median incomes of families and households are $111,696 and $96,083 respectively.
| Characteristic | Number | Measure |
| Per Capita Income | 2,273 | $54,452 |
| Median Family Income | 905 | $111,696 |
| Mean Family Income | 905 | $131,330 |
| Median Household Income | 1,097 | $96,083 |
| Mean Household Income | 1,097 | $116,694 |
| Income Deficit | 905 | $0 |
| Wage / Income Gap (%) | 2,273 | 22.12% |
| Wage / Income Gap ($) | 2,273 | 77.88¢ per $1 |
| Gini / Inequality Index | 2,273 | 0.35 |
Earnings by Sex in Zion
Average Earnings in Zion are $47,857, $56,250 for men and $43,810 for women, a difference of 22.1%.
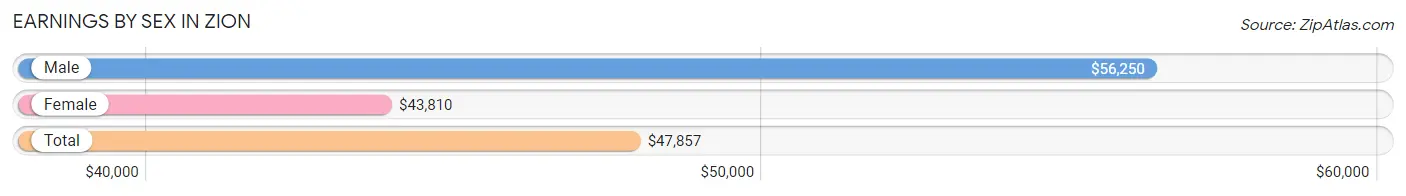
| Sex | Number | Average Earnings |
| Male | 793 (52.7%) | $56,250 |
| Female | 711 (47.3%) | $43,810 |
| Total | 1,504 (100.0%) | $47,857 |
Earnings by Sex by Income Bracket in Zion
The most common earnings brackets in Zion are $100,000+ for men (213 | 26.9%) and $75,000 to $99,999 for women (152 | 21.4%).
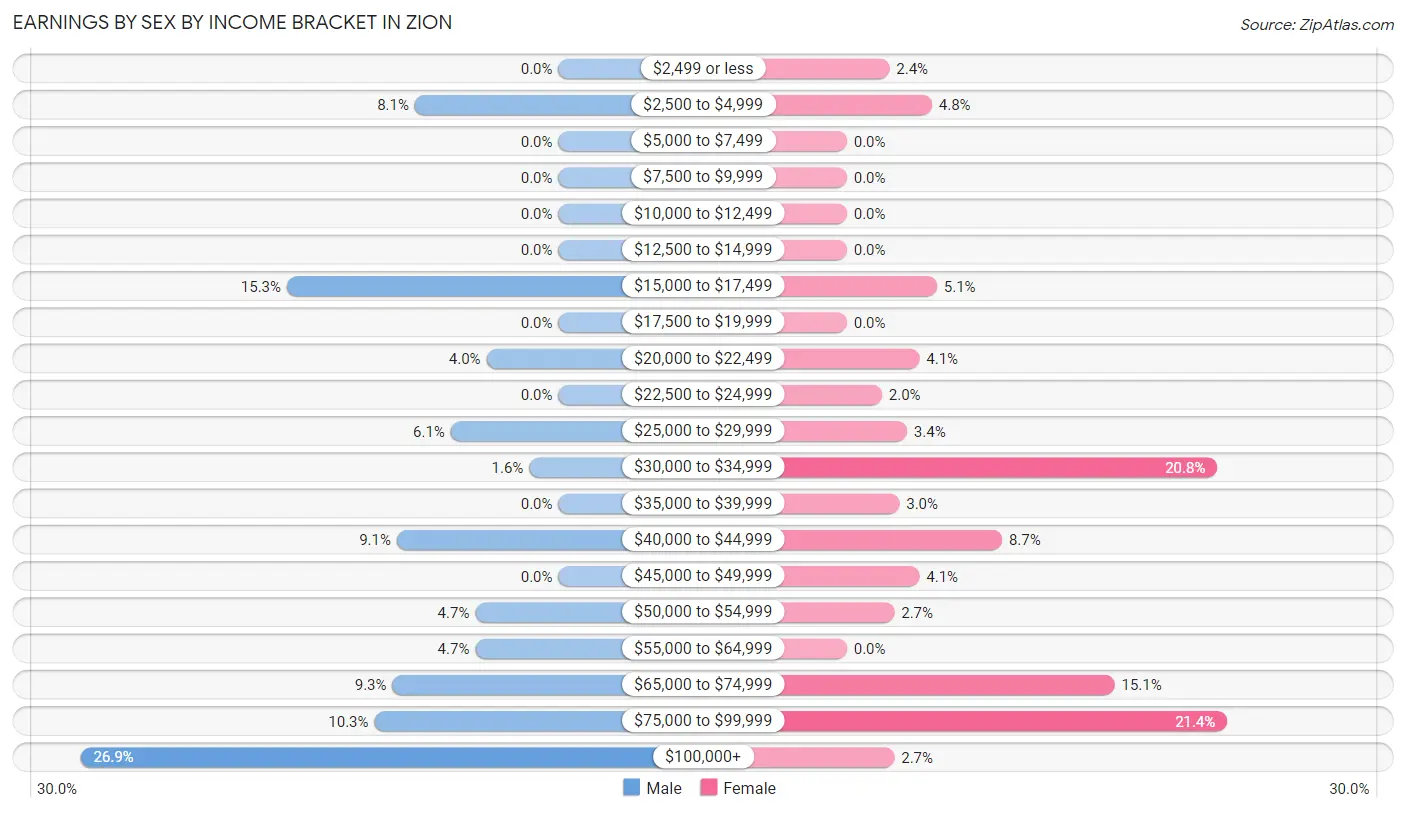
| Income | Male | Female |
| $2,499 or less | 0 (0.0%) | 17 (2.4%) |
| $2,500 to $4,999 | 64 (8.1%) | 34 (4.8%) |
| $5,000 to $7,499 | 0 (0.0%) | 0 (0.0%) |
| $7,500 to $9,999 | 0 (0.0%) | 0 (0.0%) |
| $10,000 to $12,499 | 0 (0.0%) | 0 (0.0%) |
| $12,500 to $14,999 | 0 (0.0%) | 0 (0.0%) |
| $15,000 to $17,499 | 121 (15.3%) | 36 (5.1%) |
| $17,500 to $19,999 | 0 (0.0%) | 0 (0.0%) |
| $20,000 to $22,499 | 32 (4.0%) | 29 (4.1%) |
| $22,500 to $24,999 | 0 (0.0%) | 14 (2.0%) |
| $25,000 to $29,999 | 48 (6.0%) | 24 (3.4%) |
| $30,000 to $34,999 | 13 (1.6%) | 148 (20.8%) |
| $35,000 to $39,999 | 0 (0.0%) | 21 (2.9%) |
| $40,000 to $44,999 | 72 (9.1%) | 62 (8.7%) |
| $45,000 to $49,999 | 0 (0.0%) | 29 (4.1%) |
| $50,000 to $54,999 | 37 (4.7%) | 19 (2.7%) |
| $55,000 to $64,999 | 37 (4.7%) | 0 (0.0%) |
| $65,000 to $74,999 | 74 (9.3%) | 107 (15.0%) |
| $75,000 to $99,999 | 82 (10.3%) | 152 (21.4%) |
| $100,000+ | 213 (26.9%) | 19 (2.7%) |
| Total | 793 (100.0%) | 711 (100.0%) |
Earnings by Sex by Educational Attainment in Zion
Average earnings in Zion are $58,819 for men and $44,980 for women, a difference of 23.5%. Men with an educational attainment of college or associate's degree enjoy the highest average annual earnings of $105,236, while those with high school diploma education earn the least with $40,903. Women with an educational attainment of college or associate's degree earn the most with the average annual earnings of $72,500, while those with high school diploma education have the smallest earnings of $33,992.
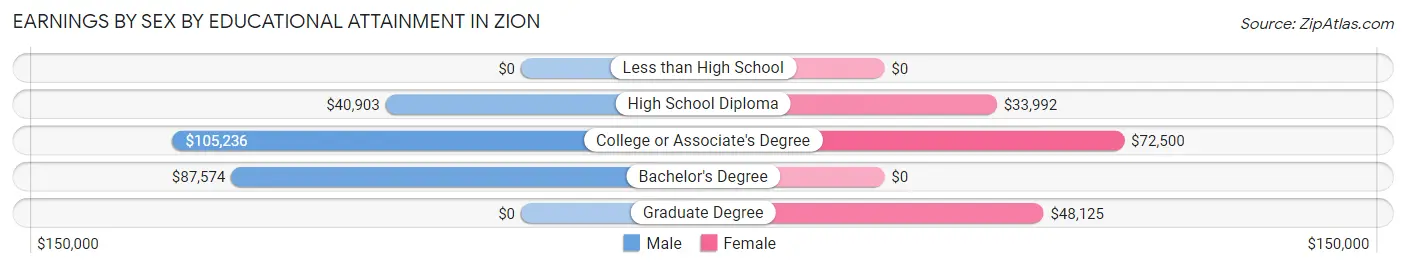
| Educational Attainment | Male Income | Female Income |
| Less than High School | - | - |
| High School Diploma | $40,903 | $33,992 |
| College or Associate's Degree | $105,236 | $72,500 |
| Bachelor's Degree | $87,574 | $0 |
| Graduate Degree | - | - |
| Total | $58,819 | $44,980 |
Family Income in Zion
Family Income Brackets in Zion
According to the Zion family income data, there are 306 families falling into the $100,000 to $149,999 income range, which is the most common income bracket and makes up 33.8% of all families.
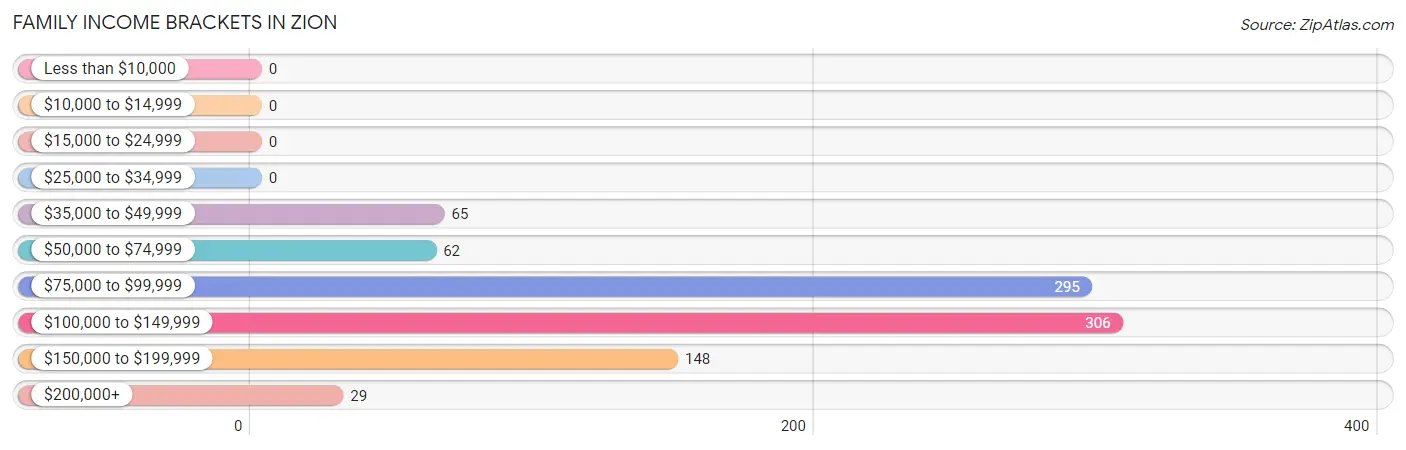
| Income Bracket | # Families | % Families |
| Less than $10,000 | 0 | 0.0% |
| $10,000 to $14,999 | 0 | 0.0% |
| $15,000 to $24,999 | 0 | 0.0% |
| $25,000 to $34,999 | 0 | 0.0% |
| $35,000 to $49,999 | 65 | 7.2% |
| $50,000 to $74,999 | 62 | 6.9% |
| $75,000 to $99,999 | 295 | 32.6% |
| $100,000 to $149,999 | 306 | 33.8% |
| $150,000 to $199,999 | 148 | 16.4% |
| $200,000+ | 29 | 3.2% |
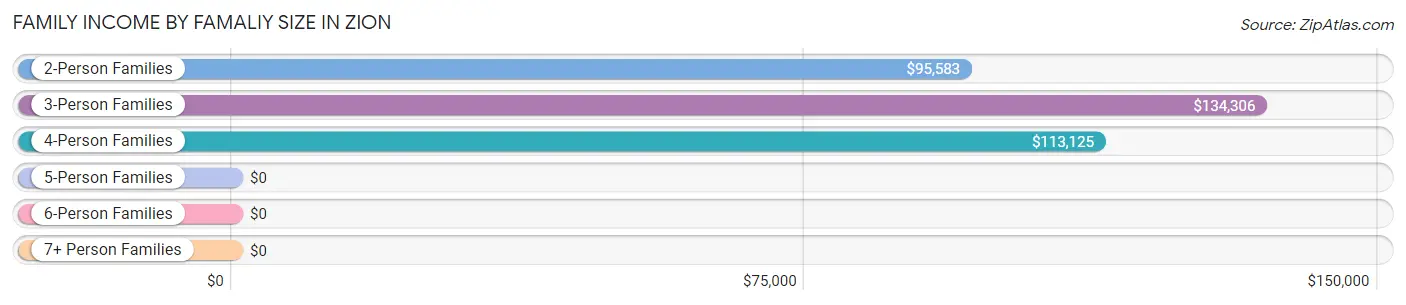
Family Income by Famaliy Size in Zion
3-person families (102 | 11.3%) account for the highest median family income in Zion with $134,306 per family, while 2-person families (705 | 77.9%) have the highest median income of $47,792 per family member.
| Income Bracket | # Families | Median Income |
| 2-Person Families | 705 (77.9%) | $95,583 |
| 3-Person Families | 102 (11.3%) | $134,306 |
| 4-Person Families | 98 (10.8%) | $113,125 |
| 5-Person Families | 0 (0.0%) | $0 |
| 6-Person Families | 0 (0.0%) | $0 |
| 7+ Person Families | 0 (0.0%) | $0 |
| Total | 905 (100.0%) | $111,696 |
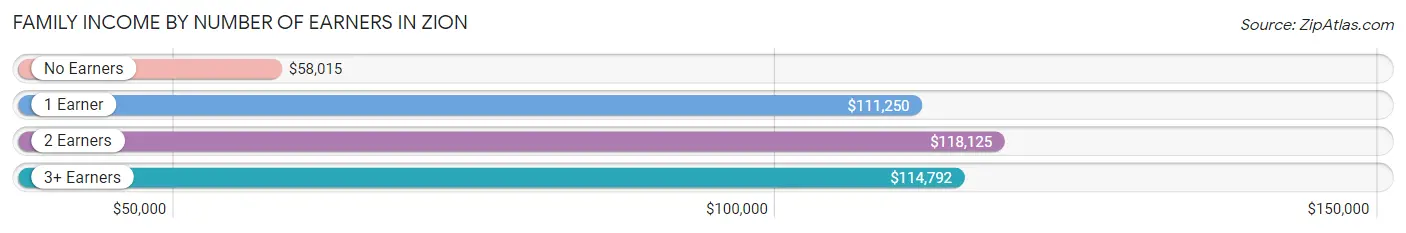
Family Income by Number of Earners in Zion
The median family income in Zion is $111,696, with families comprising 2 earners (512) having the highest median family income of $118,125, while families with no earners (137) have the lowest median family income of $58,015, accounting for 56.6% and 15.1% of families, respectively.
| Number of Earners | # Families | Median Income |
| No Earners | 137 (15.1%) | $58,015 |
| 1 Earner | 190 (21.0%) | $111,250 |
| 2 Earners | 512 (56.6%) | $118,125 |
| 3+ Earners | 66 (7.3%) | $114,792 |
| Total | 905 (100.0%) | $111,696 |
Household Income in Zion
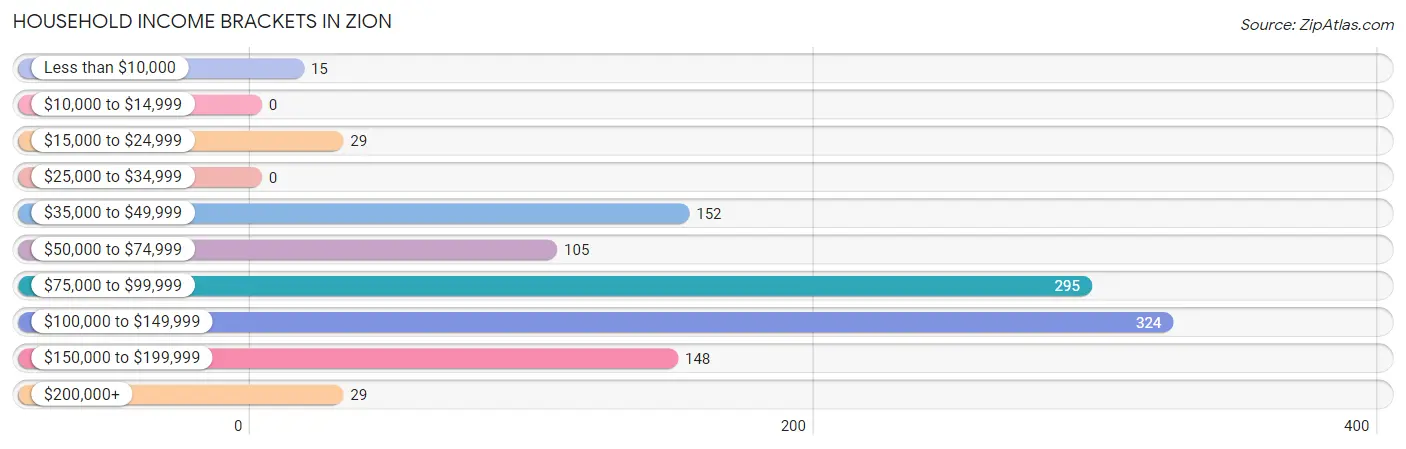
Household Income Brackets in Zion
With 324 households falling in the category, the $100,000 to $149,999 income range is the most frequent in Zion, accounting for 29.5% of all households.
| Income Bracket | # Households | % Households |
| Less than $10,000 | 15 | 1.4% |
| $10,000 to $14,999 | 0 | 0.0% |
| $15,000 to $24,999 | 29 | 2.6% |
| $25,000 to $34,999 | 0 | 0.0% |
| $35,000 to $49,999 | 152 | 13.9% |
| $50,000 to $74,999 | 105 | 9.6% |
| $75,000 to $99,999 | 295 | 26.9% |
| $100,000 to $149,999 | 324 | 29.5% |
| $150,000 to $199,999 | 148 | 13.5% |
| $200,000+ | 29 | 2.6% |
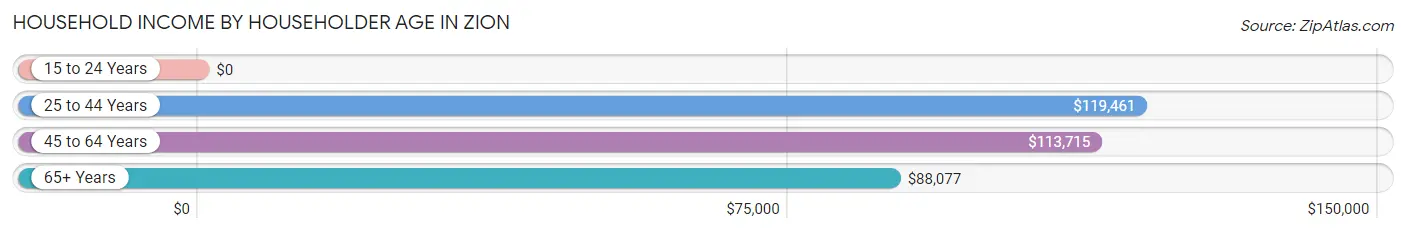
Household Income by Householder Age in Zion
The median household income in Zion is $96,083, with the highest median household income of $119,461 found in the 25 to 44 years age bracket for the primary householder. A total of 201 households (18.3%) fall into this category.
| Income Bracket | # Households | Median Income |
| 15 to 24 Years | 0 (0.0%) | $0 |
| 25 to 44 Years | 201 (18.3%) | $119,461 |
| 45 to 64 Years | 469 (42.7%) | $113,715 |
| 65+ Years | 427 (38.9%) | $88,077 |
| Total | 1,097 (100.0%) | $96,083 |
Poverty in Zion
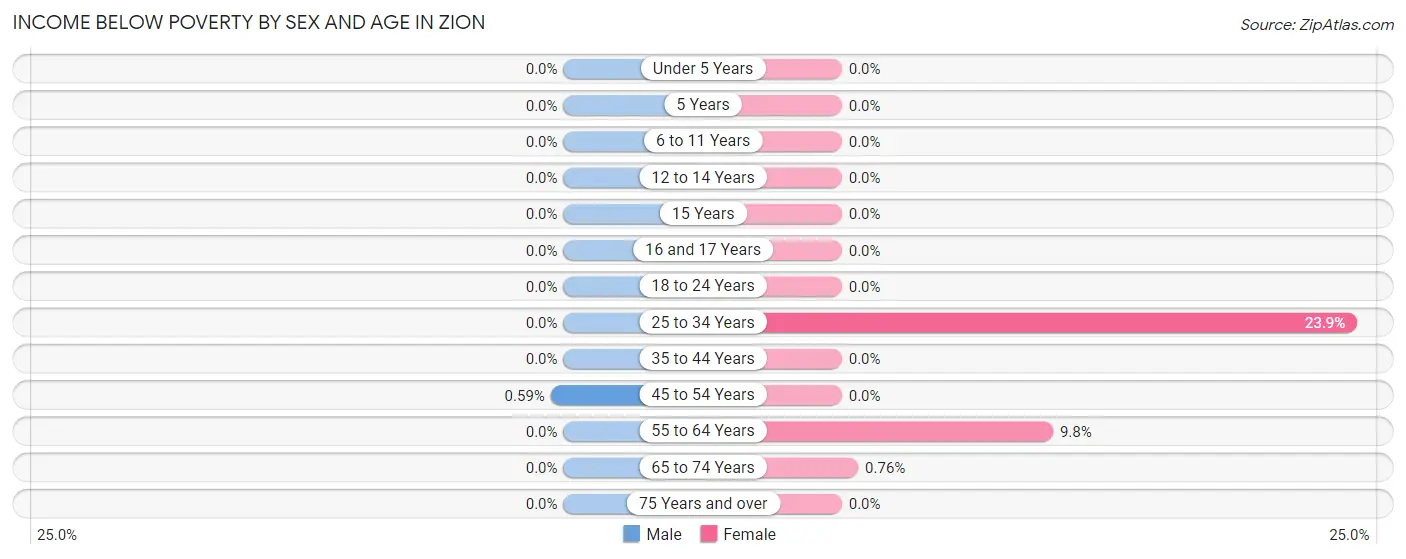
Income Below Poverty by Sex and Age in Zion
With 0.2% poverty level for males and 3.6% for females among the residents of Zion, 45 to 54 year old males and 25 to 34 year old females are the most vulnerable to poverty, with 2 males (0.6%) and 22 females (23.9%) in their respective age groups living below the poverty level.
| Age Bracket | Male | Female |
| Under 5 Years | 0 (0.0%) | 0 (0.0%) |
| 5 Years | 0 (0.0%) | 0 (0.0%) |
| 6 to 11 Years | 0 (0.0%) | 0 (0.0%) |
| 12 to 14 Years | 0 (0.0%) | 0 (0.0%) |
| 15 Years | 0 (0.0%) | 0 (0.0%) |
| 16 and 17 Years | 0 (0.0%) | 0 (0.0%) |
| 18 to 24 Years | 0 (0.0%) | 0 (0.0%) |
| 25 to 34 Years | 0 (0.0%) | 22 (23.9%) |
| 35 to 44 Years | 0 (0.0%) | 0 (0.0%) |
| 45 to 54 Years | 2 (0.6%) | 0 (0.0%) |
| 55 to 64 Years | 0 (0.0%) | 15 (9.8%) |
| 65 to 74 Years | 0 (0.0%) | 2 (0.8%) |
| 75 Years and over | 0 (0.0%) | 0 (0.0%) |
| Total | 2 (0.2%) | 39 (3.6%) |
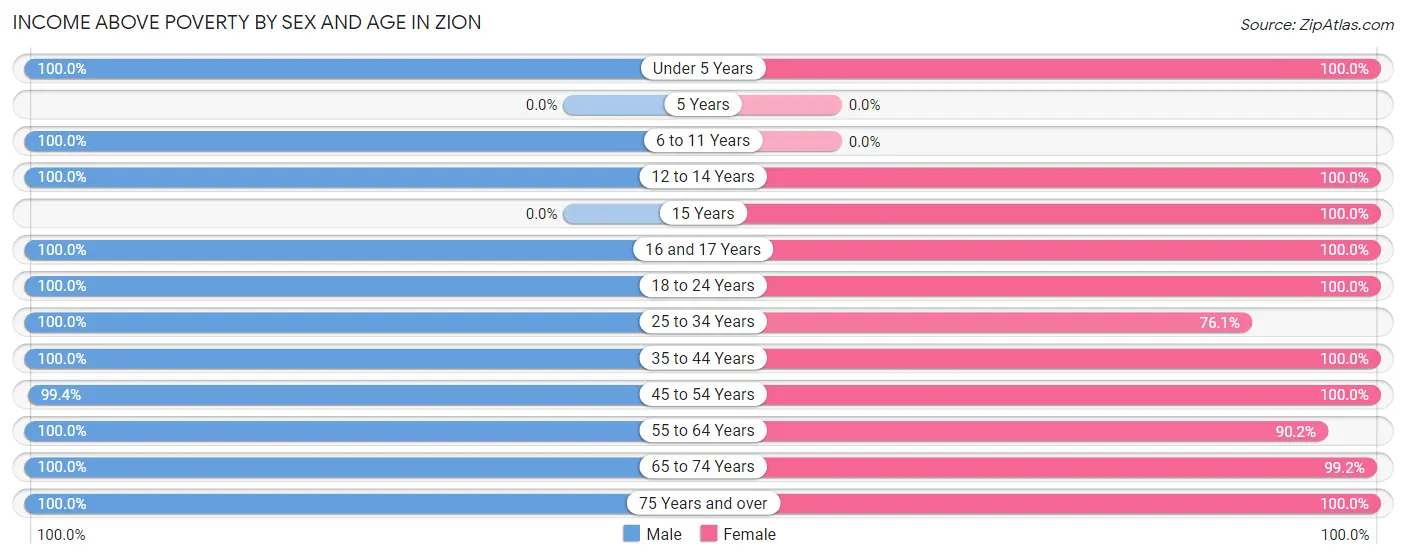
Income Above Poverty by Sex and Age in Zion
According to the poverty statistics in Zion, males aged under 5 years and females aged under 5 years are the age groups that are most secure financially, with 100.0% of males and 100.0% of females in these age groups living above the poverty line.
| Age Bracket | Male | Female |
| Under 5 Years | 32 (100.0%) | 19 (100.0%) |
| 5 Years | 0 (0.0%) | 0 (0.0%) |
| 6 to 11 Years | 44 (100.0%) | 0 (0.0%) |
| 12 to 14 Years | 44 (100.0%) | 70 (100.0%) |
| 15 Years | 0 (0.0%) | 20 (100.0%) |
| 16 and 17 Years | 20 (100.0%) | 34 (100.0%) |
| 18 to 24 Years | 44 (100.0%) | 24 (100.0%) |
| 25 to 34 Years | 107 (100.0%) | 70 (76.1%) |
| 35 to 44 Years | 90 (100.0%) | 117 (100.0%) |
| 45 to 54 Years | 336 (99.4%) | 179 (100.0%) |
| 55 to 64 Years | 82 (100.0%) | 138 (90.2%) |
| 65 to 74 Years | 314 (100.0%) | 262 (99.2%) |
| 75 Years and over | 79 (100.0%) | 107 (100.0%) |
| Total | 1,192 (99.8%) | 1,040 (96.4%) |
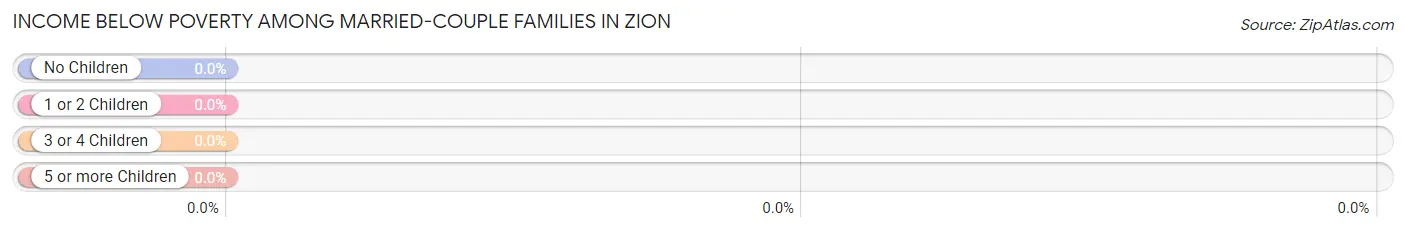
Income Below Poverty Among Married-Couple Families in Zion
| Children | Above Poverty | Below Poverty |
| No Children | 689 (100.0%) | 0 (0.0%) |
| 1 or 2 Children | 162 (100.0%) | 0 (0.0%) |
| 3 or 4 Children | 0 (0.0%) | 0 (0.0%) |
| 5 or more Children | 0 (0.0%) | 0 (0.0%) |
| Total | 851 (100.0%) | 0 (0.0%) |
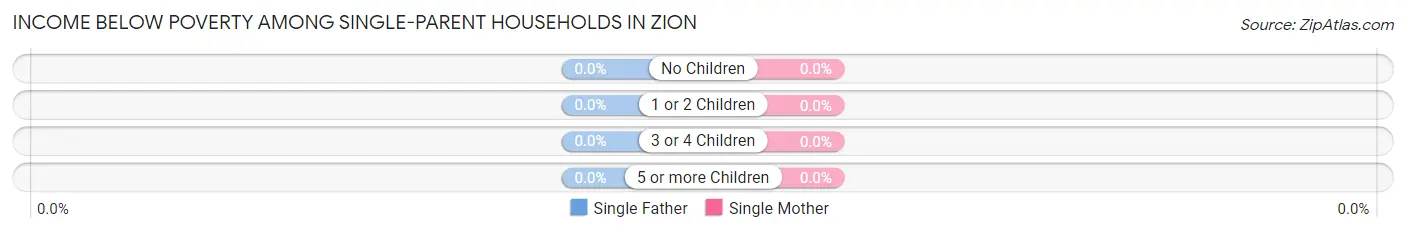
Income Below Poverty Among Single-Parent Households in Zion
| Children | Single Father | Single Mother |
| No Children | 0 (0.0%) | 0 (0.0%) |
| 1 or 2 Children | 0 (0.0%) | 0 (0.0%) |
| 3 or 4 Children | 0 (0.0%) | 0 (0.0%) |
| 5 or more Children | 0 (0.0%) | 0 (0.0%) |
| Total | 0 (0.0%) | 0 (0.0%) |
Income Below Poverty Among Married-Couple vs Single-Parent Households in Zion
| Children | Married-Couple Families | Single-Parent Households |
| No Children | 0 (0.0%) | 0 (0.0%) |
| 1 or 2 Children | 0 (0.0%) | 0 (0.0%) |
| 3 or 4 Children | 0 (0.0%) | 0 (0.0%) |
| 5 or more Children | 0 (0.0%) | 0 (0.0%) |
| Total | 0 (0.0%) | 0 (0.0%) |
Employment Characteristics in Zion
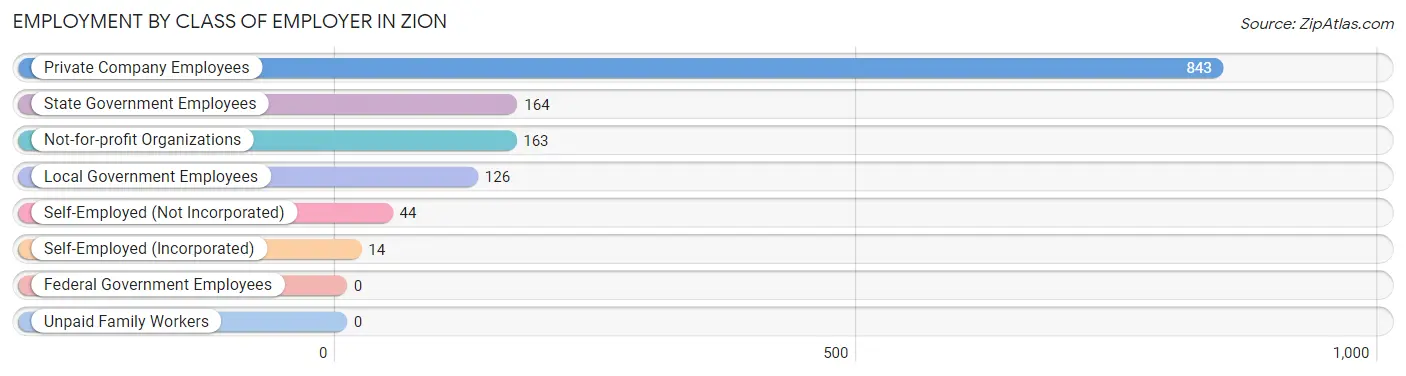
Employment by Class of Employer in Zion
Among the 1,354 employed individuals in Zion, private company employees (843 | 62.3%), state government employees (164 | 12.1%), and not-for-profit organizations (163 | 12.0%) make up the most common classes of employment.
| Employer Class | # Employees | % Employees |
| Private Company Employees | 843 | 62.3% |
| Self-Employed (Incorporated) | 14 | 1.0% |
| Self-Employed (Not Incorporated) | 44 | 3.3% |
| Not-for-profit Organizations | 163 | 12.0% |
| Local Government Employees | 126 | 9.3% |
| State Government Employees | 164 | 12.1% |
| Federal Government Employees | 0 | 0.0% |
| Unpaid Family Workers | 0 | 0.0% |
| Total | 1,354 | 100.0% |
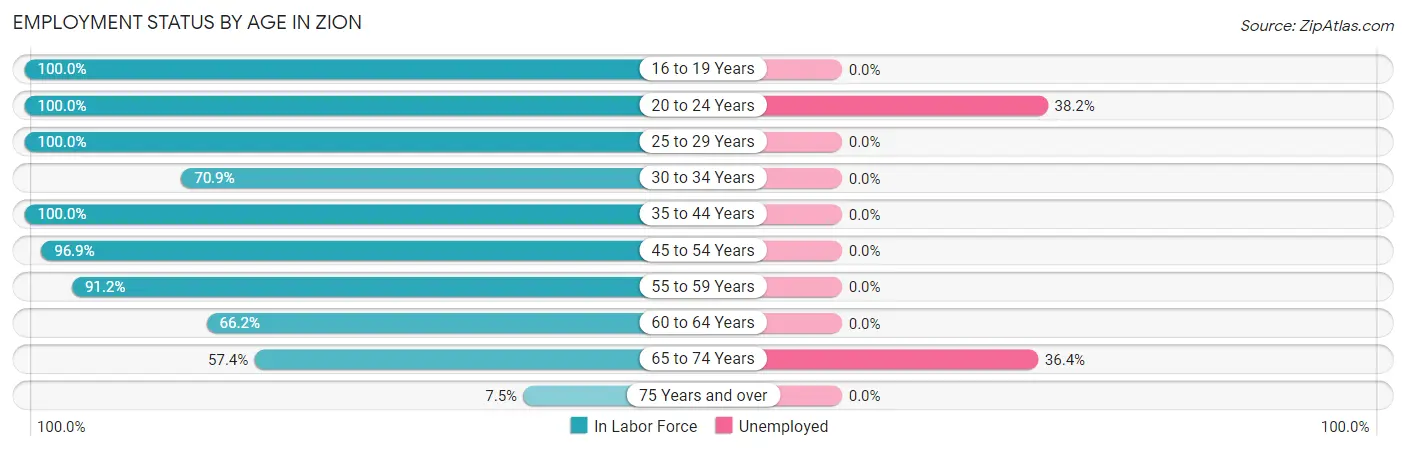
Employment Status by Age in Zion
According to the labor force statistics for Zion, out of the total population over 16 years of age (2,044), 74.9% or 1,531 individuals are in the labor force, with 9.6% or 147 of them unemployed. The age group with the highest labor force participation rate is 16 to 19 years, with 100.0% or 54 individuals in the labor force. Within the labor force, the 20 to 24 years age range has the highest percentage of unemployed individuals, with 38.2% or 26 of them being unemployed.
| Age Bracket | In Labor Force | Unemployed |
| 16 to 19 Years | 54 (100.0%) | 0 (0.0%) |
| 20 to 24 Years | 68 (100.0%) | 26 (38.2%) |
| 25 to 29 Years | 51 (100.0%) | 0 (0.0%) |
| 30 to 34 Years | 105 (70.9%) | 0 (0.0%) |
| 35 to 44 Years | 207 (100.0%) | 0 (0.0%) |
| 45 to 54 Years | 501 (96.9%) | 0 (0.0%) |
| 55 to 59 Years | 155 (91.2%) | 0 (0.0%) |
| 60 to 64 Years | 43 (66.2%) | 0 (0.0%) |
| 65 to 74 Years | 332 (57.4%) | 121 (36.4%) |
| 75 Years and over | 14 (7.5%) | 0 (0.0%) |
| Total | 1,531 (74.9%) | 147 (9.6%) |
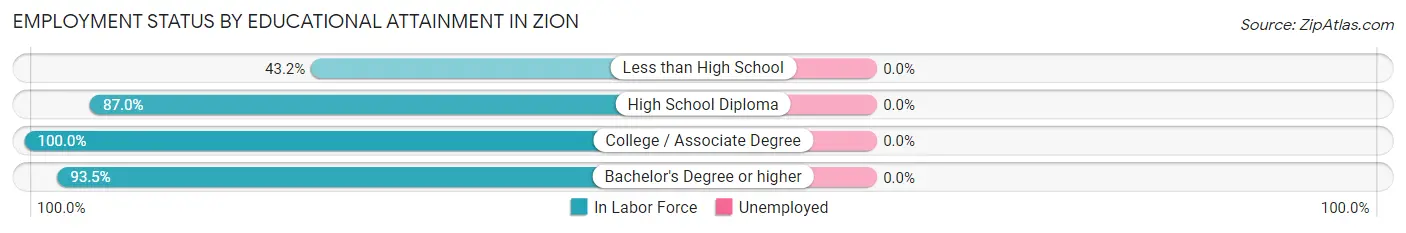
Employment Status by Educational Attainment in Zion
| Educational Attainment | In Labor Force | Unemployed |
| Less than High School | 16 (43.2%) | 0 (0.0%) |
| High School Diploma | 240 (87.0%) | 0 (0.0%) |
| College / Associate Degree | 245 (100.0%) | 0 (0.0%) |
| Bachelor's Degree or higher | 561 (93.5%) | 0 (0.0%) |
| Total | 1,062 (91.7%) | 0 (0.0%) |
Employment Occupations by Sex in Zion
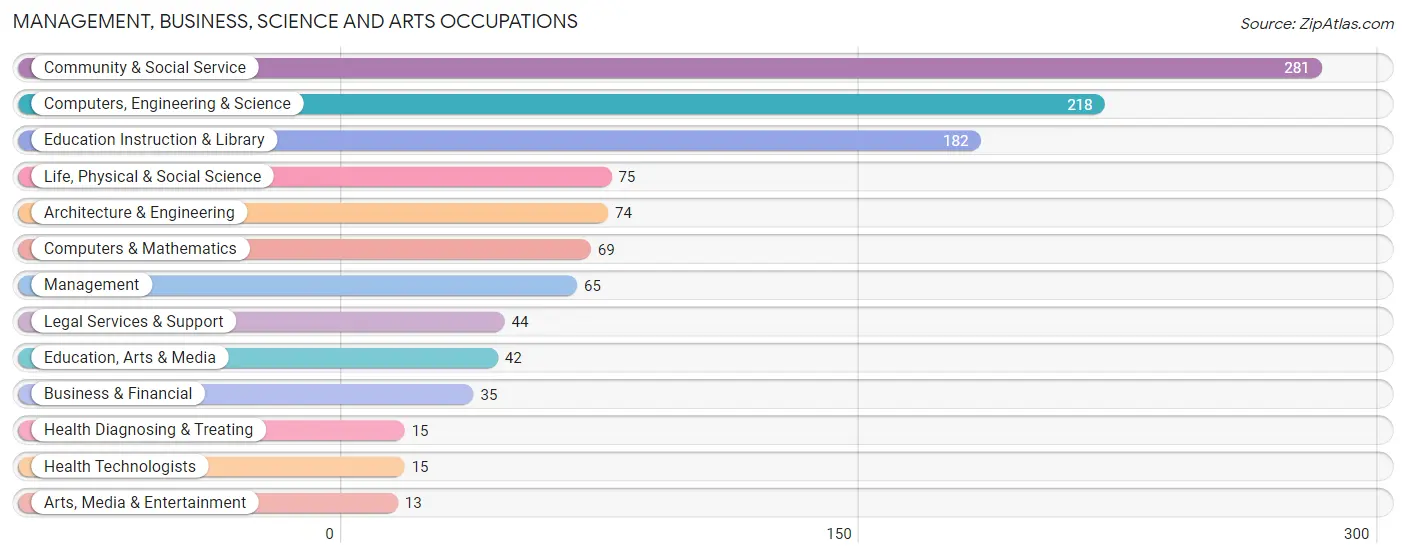
Management, Business, Science and Arts Occupations
The most common Management, Business, Science and Arts occupations in Zion are Community & Social Service (281 | 20.3%), Computers, Engineering & Science (218 | 15.8%), Education Instruction & Library (182 | 13.2%), Life, Physical & Social Science (75 | 5.4%), and Architecture & Engineering (74 | 5.3%).
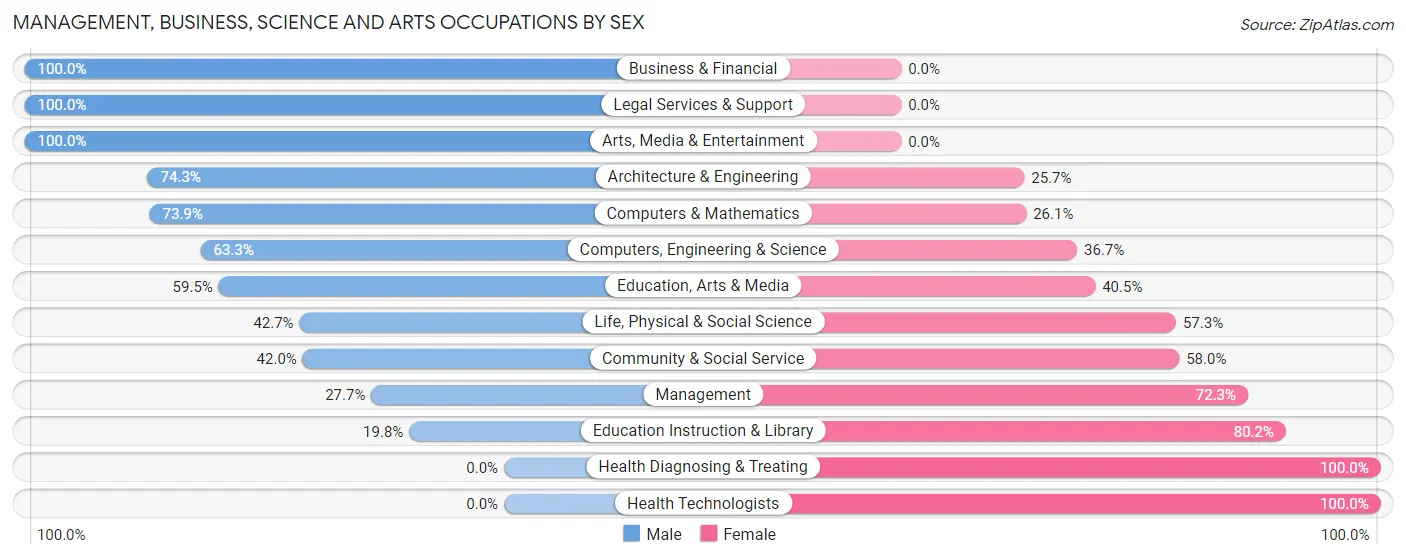
Management, Business, Science and Arts Occupations by Sex
Within the Management, Business, Science and Arts occupations in Zion, the most male-oriented occupations are Business & Financial (100.0%), Legal Services & Support (100.0%), and Arts, Media & Entertainment (100.0%), while the most female-oriented occupations are Health Diagnosing & Treating (100.0%), Health Technologists (100.0%), and Education Instruction & Library (80.2%).
| Occupation | Male | Female |
| Management | 18 (27.7%) | 47 (72.3%) |
| Business & Financial | 35 (100.0%) | 0 (0.0%) |
| Computers, Engineering & Science | 138 (63.3%) | 80 (36.7%) |
| Computers & Mathematics | 51 (73.9%) | 18 (26.1%) |
| Architecture & Engineering | 55 (74.3%) | 19 (25.7%) |
| Life, Physical & Social Science | 32 (42.7%) | 43 (57.3%) |
| Community & Social Service | 118 (42.0%) | 163 (58.0%) |
| Education, Arts & Media | 25 (59.5%) | 17 (40.5%) |
| Legal Services & Support | 44 (100.0%) | 0 (0.0%) |
| Education Instruction & Library | 36 (19.8%) | 146 (80.2%) |
| Arts, Media & Entertainment | 13 (100.0%) | 0 (0.0%) |
| Health Diagnosing & Treating | 0 (0.0%) | 15 (100.0%) |
| Health Technologists | 0 (0.0%) | 15 (100.0%) |
| Total (Category) | 309 (50.3%) | 305 (49.7%) |
| Total (Overall) | 672 (48.6%) | 711 (51.4%) |
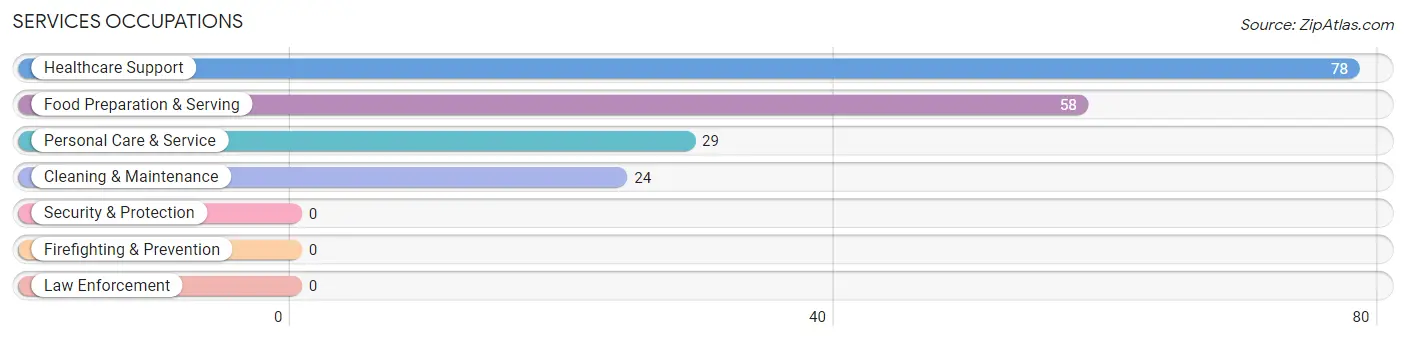
Services Occupations
The most common Services occupations in Zion are Healthcare Support (78 | 5.6%), Food Preparation & Serving (58 | 4.2%), Personal Care & Service (29 | 2.1%), and Cleaning & Maintenance (24 | 1.7%).
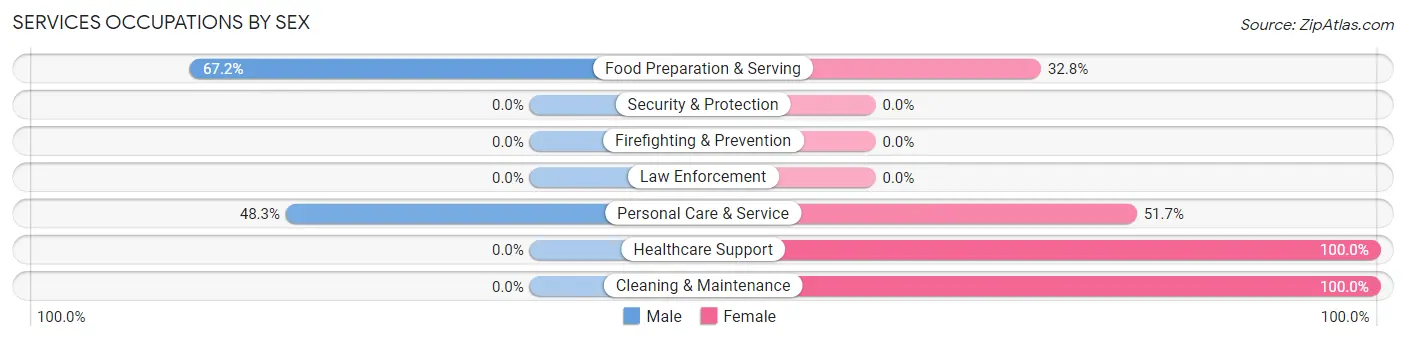
Services Occupations by Sex
Within the Services occupations in Zion, the most male-oriented occupations are Food Preparation & Serving (67.2%), and Personal Care & Service (48.3%), while the most female-oriented occupations are Healthcare Support (100.0%), Cleaning & Maintenance (100.0%), and Personal Care & Service (51.7%).
| Occupation | Male | Female |
| Healthcare Support | 0 (0.0%) | 78 (100.0%) |
| Security & Protection | 0 (0.0%) | 0 (0.0%) |
| Firefighting & Prevention | 0 (0.0%) | 0 (0.0%) |
| Law Enforcement | 0 (0.0%) | 0 (0.0%) |
| Food Preparation & Serving | 39 (67.2%) | 19 (32.8%) |
| Cleaning & Maintenance | 0 (0.0%) | 24 (100.0%) |
| Personal Care & Service | 14 (48.3%) | 15 (51.7%) |
| Total (Category) | 53 (28.0%) | 136 (72.0%) |
| Total (Overall) | 672 (48.6%) | 711 (51.4%) |
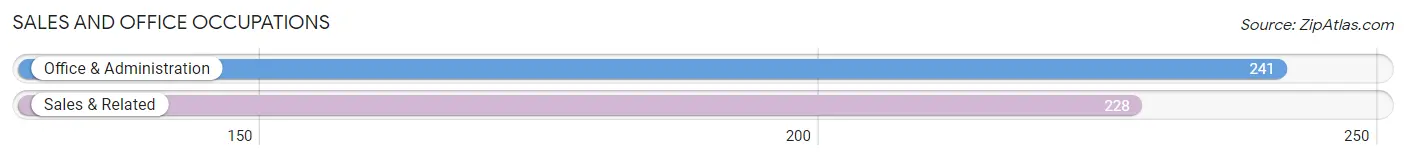
Sales and Office Occupations
The most common Sales and Office occupations in Zion are Office & Administration (241 | 17.4%), and Sales & Related (228 | 16.5%).
Sales and Office Occupations by Sex
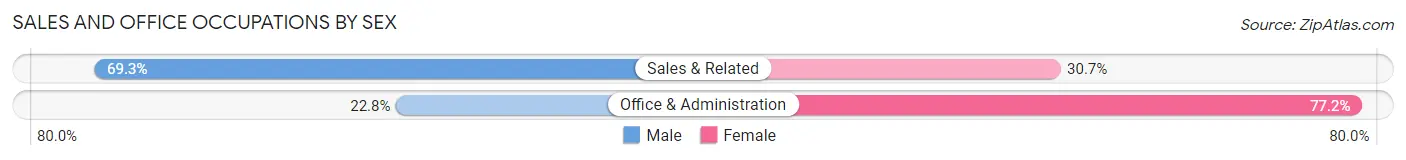
| Occupation | Male | Female |
| Sales & Related | 158 (69.3%) | 70 (30.7%) |
| Office & Administration | 55 (22.8%) | 186 (77.2%) |
| Total (Category) | 213 (45.4%) | 256 (54.6%) |
| Total (Overall) | 672 (48.6%) | 711 (51.4%) |
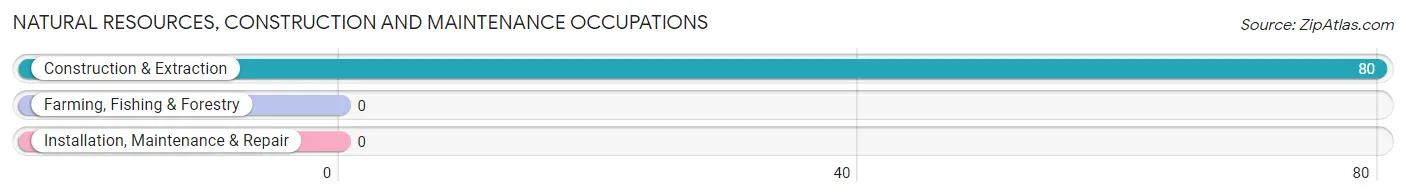
Natural Resources, Construction and Maintenance Occupations
The most common Natural Resources, Construction and Maintenance occupations in Zion are , and Construction & Extraction (80 | 5.8%).
Natural Resources, Construction and Maintenance Occupations by Sex
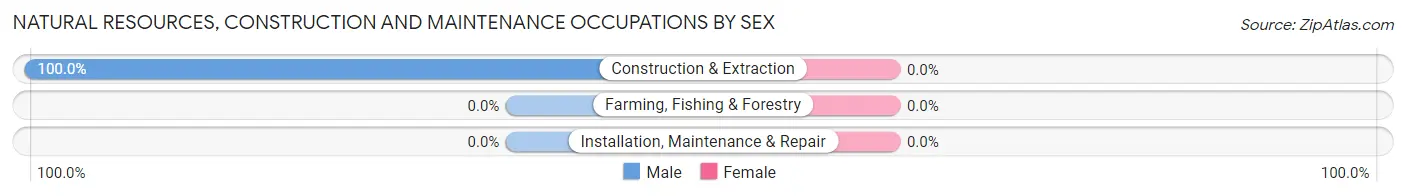
| Occupation | Male | Female |
| Farming, Fishing & Forestry | 0 (0.0%) | 0 (0.0%) |
| Construction & Extraction | 80 (100.0%) | 0 (0.0%) |
| Installation, Maintenance & Repair | 0 (0.0%) | 0 (0.0%) |
| Total (Category) | 80 (100.0%) | 0 (0.0%) |
| Total (Overall) | 672 (48.6%) | 711 (51.4%) |
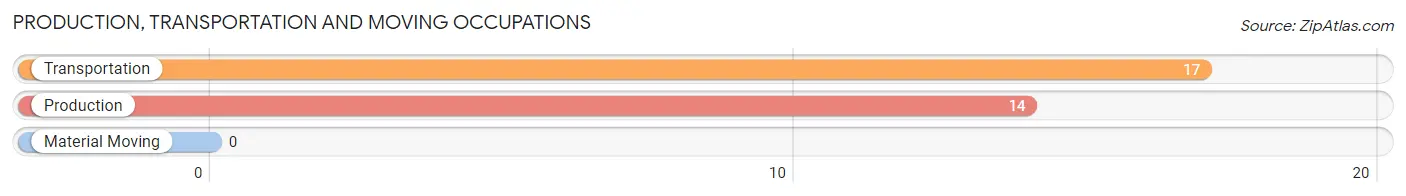
Production, Transportation and Moving Occupations
The most common Production, Transportation and Moving occupations in Zion are Transportation (17 | 1.2%), and Production (14 | 1.0%).
Production, Transportation and Moving Occupations by Sex
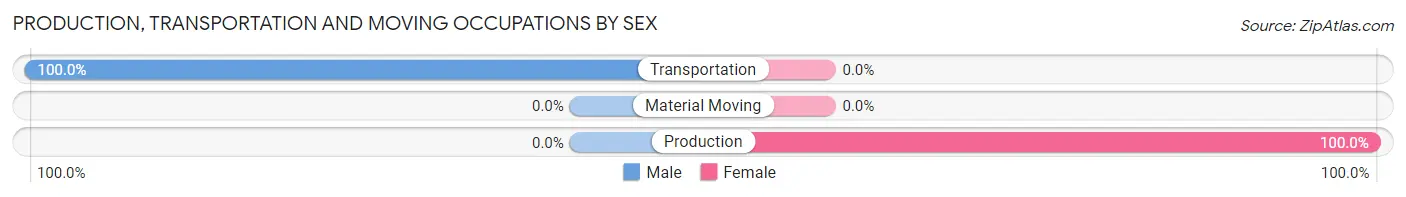
| Occupation | Male | Female |
| Production | 0 (0.0%) | 14 (100.0%) |
| Transportation | 17 (100.0%) | 0 (0.0%) |
| Material Moving | 0 (0.0%) | 0 (0.0%) |
| Total (Category) | 17 (54.8%) | 14 (45.2%) |
| Total (Overall) | 672 (48.6%) | 711 (51.4%) |
Employment Industries by Sex in Zion
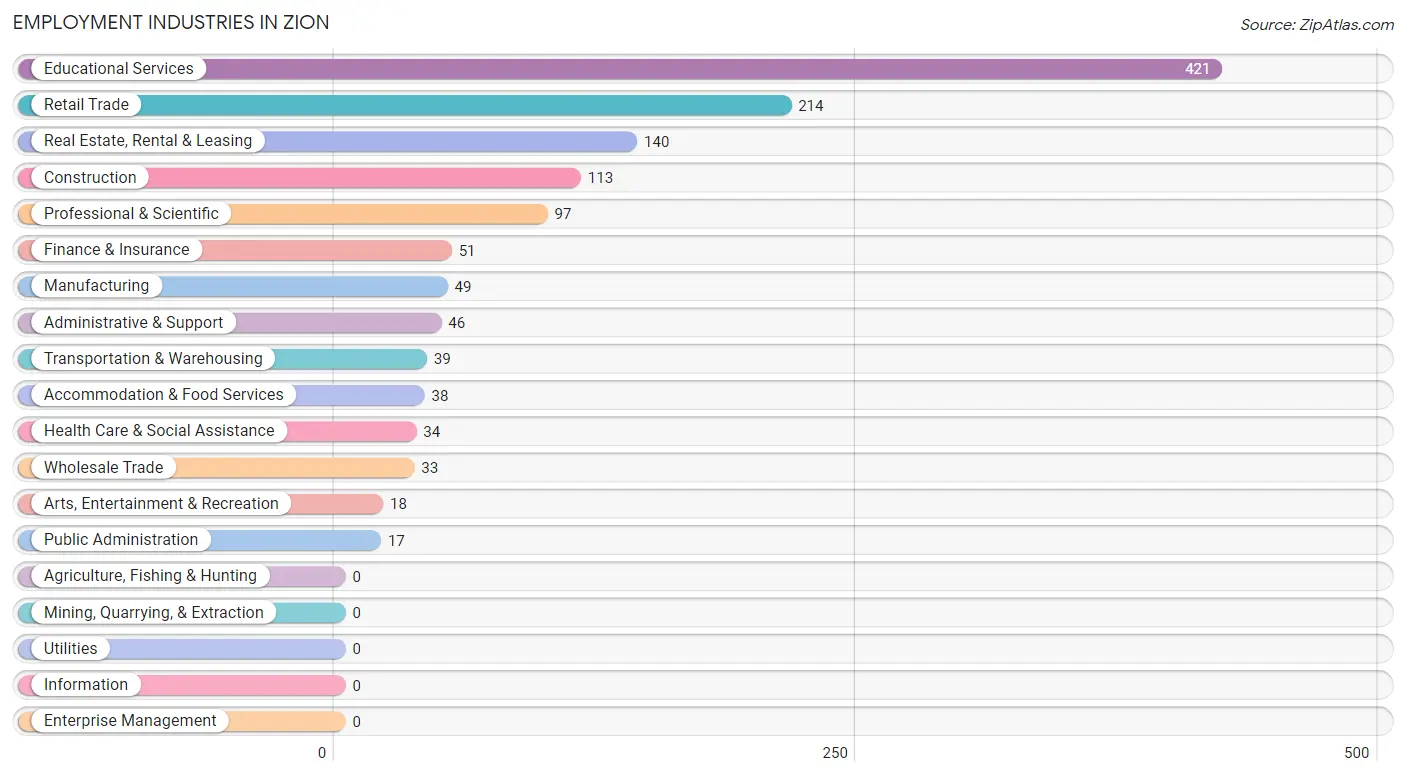
Employment Industries in Zion
The major employment industries in Zion include Educational Services (421 | 30.4%), Retail Trade (214 | 15.5%), Real Estate, Rental & Leasing (140 | 10.1%), Construction (113 | 8.2%), and Professional & Scientific (97 | 7.0%).
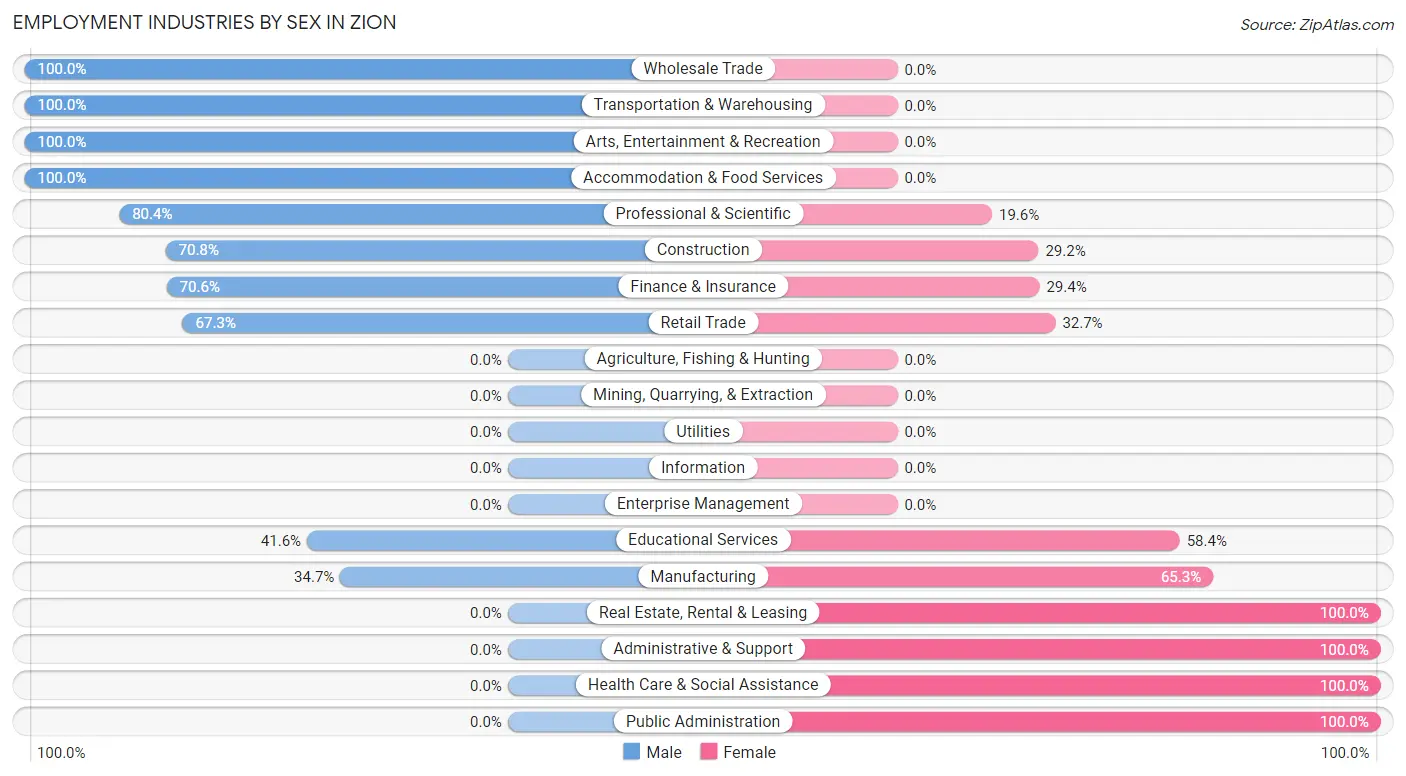
Employment Industries by Sex in Zion
The Zion industries that see more men than women are Wholesale Trade (100.0%), Transportation & Warehousing (100.0%), and Arts, Entertainment & Recreation (100.0%), whereas the industries that tend to have a higher number of women are Real Estate, Rental & Leasing (100.0%), Administrative & Support (100.0%), and Health Care & Social Assistance (100.0%).
| Industry | Male | Female |
| Agriculture, Fishing & Hunting | 0 (0.0%) | 0 (0.0%) |
| Mining, Quarrying, & Extraction | 0 (0.0%) | 0 (0.0%) |
| Construction | 80 (70.8%) | 33 (29.2%) |
| Manufacturing | 17 (34.7%) | 32 (65.3%) |
| Wholesale Trade | 33 (100.0%) | 0 (0.0%) |
| Retail Trade | 144 (67.3%) | 70 (32.7%) |
| Transportation & Warehousing | 39 (100.0%) | 0 (0.0%) |
| Utilities | 0 (0.0%) | 0 (0.0%) |
| Information | 0 (0.0%) | 0 (0.0%) |
| Finance & Insurance | 36 (70.6%) | 15 (29.4%) |
| Real Estate, Rental & Leasing | 0 (0.0%) | 140 (100.0%) |
| Professional & Scientific | 78 (80.4%) | 19 (19.6%) |
| Enterprise Management | 0 (0.0%) | 0 (0.0%) |
| Administrative & Support | 0 (0.0%) | 46 (100.0%) |
| Educational Services | 175 (41.6%) | 246 (58.4%) |
| Health Care & Social Assistance | 0 (0.0%) | 34 (100.0%) |
| Arts, Entertainment & Recreation | 18 (100.0%) | 0 (0.0%) |
| Accommodation & Food Services | 38 (100.0%) | 0 (0.0%) |
| Public Administration | 0 (0.0%) | 17 (100.0%) |
| Total | 672 (48.6%) | 711 (51.4%) |
Education in Zion
School Enrollment in Zion
The most common levels of schooling among the 330 students in Zion are middle school (114 | 34.5%), graduate / professional (81 | 24.5%), and high school (74 | 22.4%).
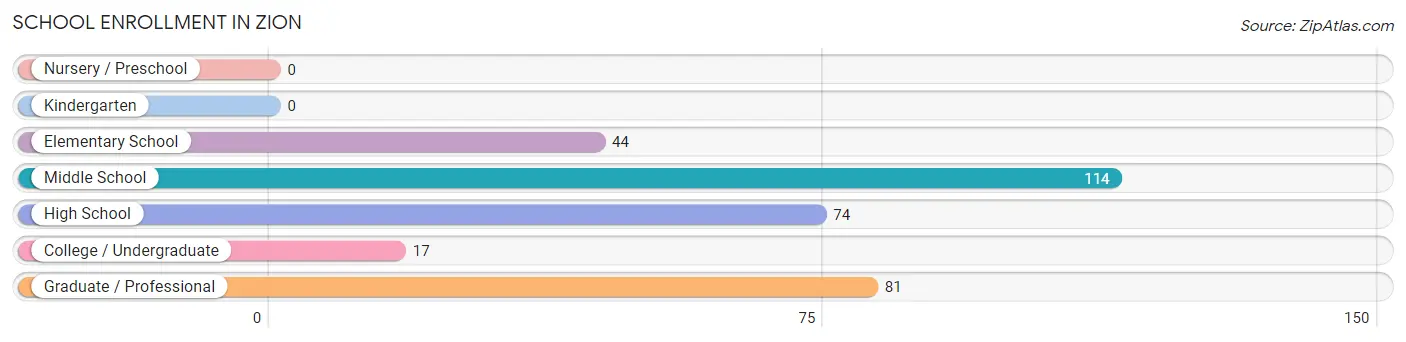
| School Level | # Students | % Students |
| Nursery / Preschool | 0 | 0.0% |
| Kindergarten | 0 | 0.0% |
| Elementary School | 44 | 13.3% |
| Middle School | 114 | 34.5% |
| High School | 74 | 22.4% |
| College / Undergraduate | 17 | 5.1% |
| Graduate / Professional | 81 | 24.5% |
| Total | 330 | 100.0% |
School Enrollment by Age by Funding Source in Zion
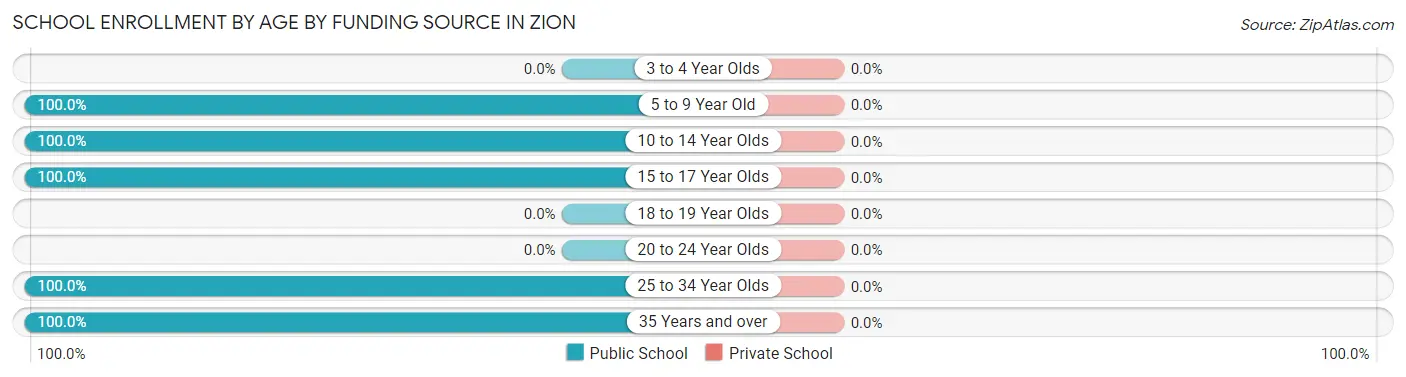
| Age Bracket | Public School | Private School |
| 3 to 4 Year Olds | 0 (0.0%) | 0 (0.0%) |
| 5 to 9 Year Old | 44 (100.0%) | 0 (0.0%) |
| 10 to 14 Year Olds | 114 (100.0%) | 0 (0.0%) |
| 15 to 17 Year Olds | 74 (100.0%) | 0 (0.0%) |
| 18 to 19 Year Olds | 0 (0.0%) | 0 (0.0%) |
| 20 to 24 Year Olds | 0 (0.0%) | 0 (0.0%) |
| 25 to 34 Year Olds | 41 (100.0%) | 0 (0.0%) |
| 35 Years and over | 57 (100.0%) | 0 (0.0%) |
| Total | 330 (100.0%) | 0 (0.0%) |
Educational Attainment by Field of Study in Zion
Education (177 | 20.8%), business (120 | 14.1%), arts & humanities (114 | 13.4%), science & technology (77 | 9.0%), and engineering (74 | 8.7%) are the most common fields of study among 851 individuals in Zion who have obtained a bachelor's degree or higher.
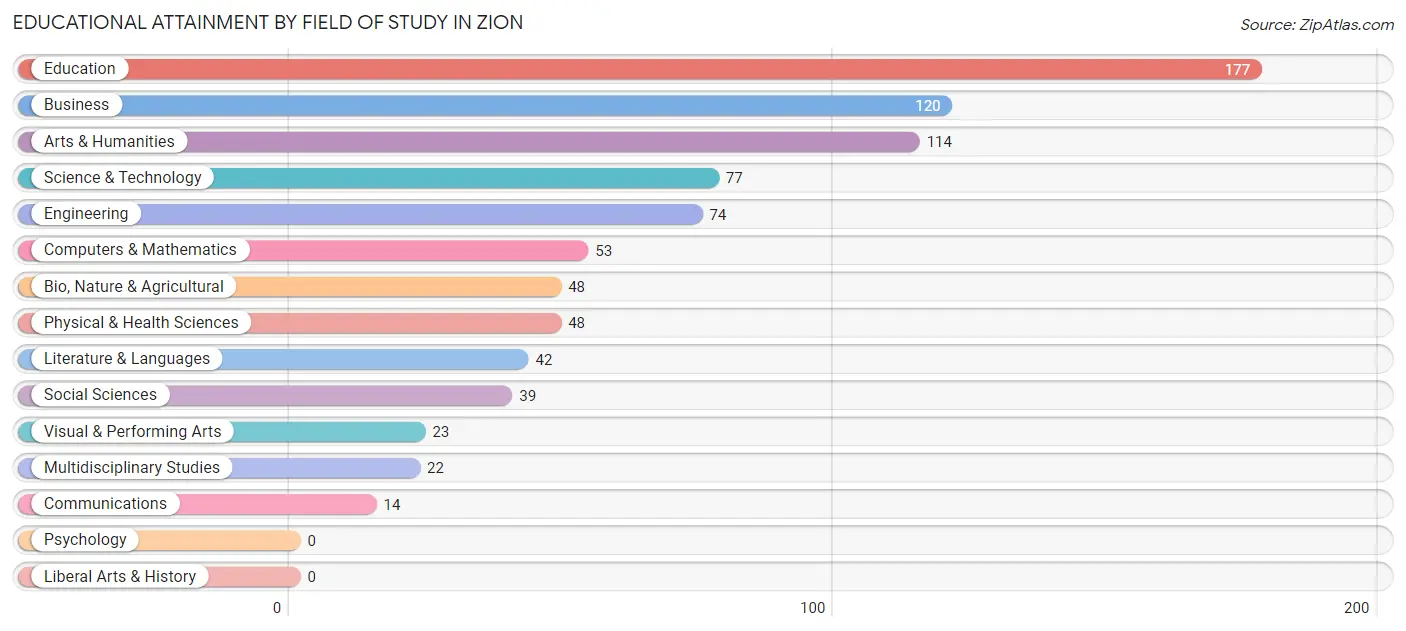
| Field of Study | # Graduates | % Graduates |
| Computers & Mathematics | 53 | 6.2% |
| Bio, Nature & Agricultural | 48 | 5.6% |
| Physical & Health Sciences | 48 | 5.6% |
| Psychology | 0 | 0.0% |
| Social Sciences | 39 | 4.6% |
| Engineering | 74 | 8.7% |
| Multidisciplinary Studies | 22 | 2.6% |
| Science & Technology | 77 | 9.0% |
| Business | 120 | 14.1% |
| Education | 177 | 20.8% |
| Literature & Languages | 42 | 4.9% |
| Liberal Arts & History | 0 | 0.0% |
| Visual & Performing Arts | 23 | 2.7% |
| Communications | 14 | 1.7% |
| Arts & Humanities | 114 | 13.4% |
| Total | 851 | 100.0% |
Transportation & Commute in Zion
Vehicle Availability by Sex in Zion
The most prevalent vehicle ownership categories in Zion are males with 2 vehicles (426, accounting for 64.7%) and females with 2 vehicles (457, making up 61.2%).
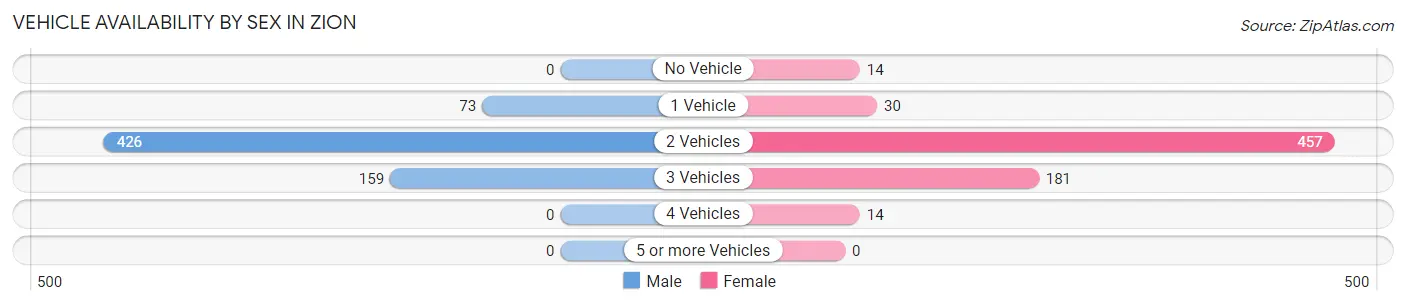
| Vehicles Available | Male | Female |
| No Vehicle | 0 (0.0%) | 14 (2.0%) |
| 1 Vehicle | 73 (11.1%) | 30 (4.3%) |
| 2 Vehicles | 426 (64.7%) | 457 (65.7%) |
| 3 Vehicles | 159 (24.2%) | 181 (26.0%) |
| 4 Vehicles | 0 (0.0%) | 14 (2.0%) |
| 5 or more Vehicles | 0 (0.0%) | 0 (0.0%) |
| Total | 658 (100.0%) | 696 (100.0%) |
Commute Time in Zion
The most frequently occuring commute durations in Zion are 25 to 29 minutes (342 commuters, 29.8%), 20 to 24 minutes (192 commuters, 16.7%), and 15 to 19 minutes (125 commuters, 10.9%).
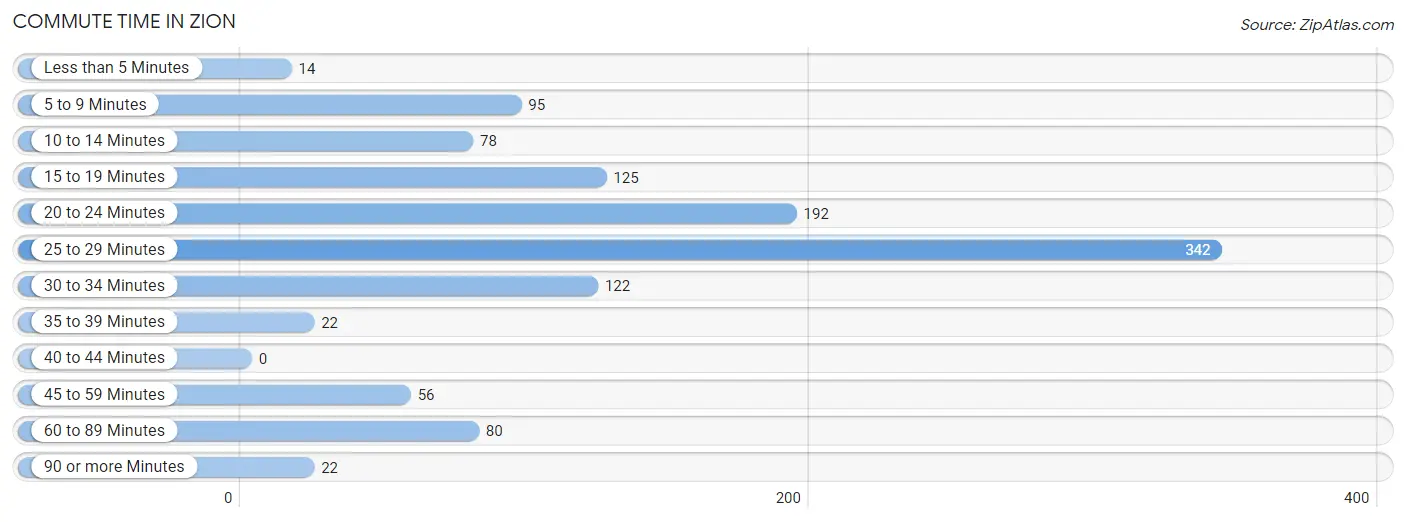
| Commute Time | # Commuters | % Commuters |
| Less than 5 Minutes | 14 | 1.2% |
| 5 to 9 Minutes | 95 | 8.3% |
| 10 to 14 Minutes | 78 | 6.8% |
| 15 to 19 Minutes | 125 | 10.9% |
| 20 to 24 Minutes | 192 | 16.7% |
| 25 to 29 Minutes | 342 | 29.8% |
| 30 to 34 Minutes | 122 | 10.6% |
| 35 to 39 Minutes | 22 | 1.9% |
| 40 to 44 Minutes | 0 | 0.0% |
| 45 to 59 Minutes | 56 | 4.9% |
| 60 to 89 Minutes | 80 | 7.0% |
| 90 or more Minutes | 22 | 1.9% |
Commute Time by Sex in Zion
The most common commute times in Zion are 25 to 29 minutes (133 commuters, 25.7%) for males and 25 to 29 minutes (209 commuters, 33.1%) for females.
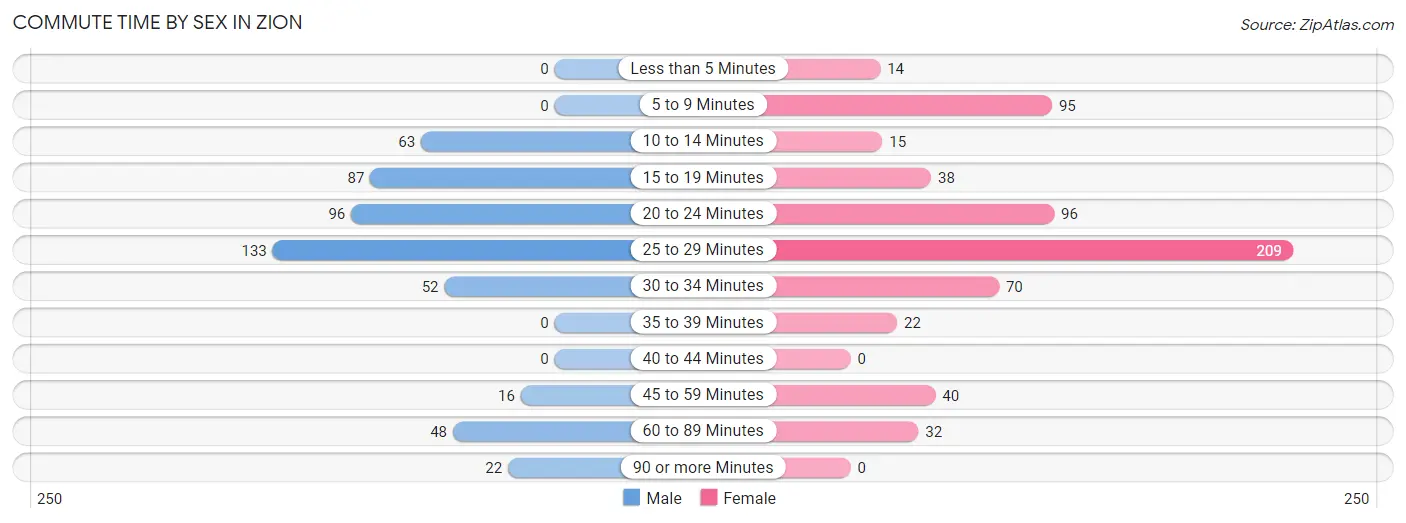
| Commute Time | Male | Female |
| Less than 5 Minutes | 0 (0.0%) | 14 (2.2%) |
| 5 to 9 Minutes | 0 (0.0%) | 95 (15.1%) |
| 10 to 14 Minutes | 63 (12.2%) | 15 (2.4%) |
| 15 to 19 Minutes | 87 (16.8%) | 38 (6.0%) |
| 20 to 24 Minutes | 96 (18.6%) | 96 (15.2%) |
| 25 to 29 Minutes | 133 (25.7%) | 209 (33.1%) |
| 30 to 34 Minutes | 52 (10.1%) | 70 (11.1%) |
| 35 to 39 Minutes | 0 (0.0%) | 22 (3.5%) |
| 40 to 44 Minutes | 0 (0.0%) | 0 (0.0%) |
| 45 to 59 Minutes | 16 (3.1%) | 40 (6.3%) |
| 60 to 89 Minutes | 48 (9.3%) | 32 (5.1%) |
| 90 or more Minutes | 22 (4.3%) | 0 (0.0%) |
Time of Departure to Work by Sex in Zion
The most frequent times of departure to work in Zion are 6:00 AM to 6:29 AM (132, 25.5%) for males and 7:30 AM to 7:59 AM (298, 47.2%) for females.
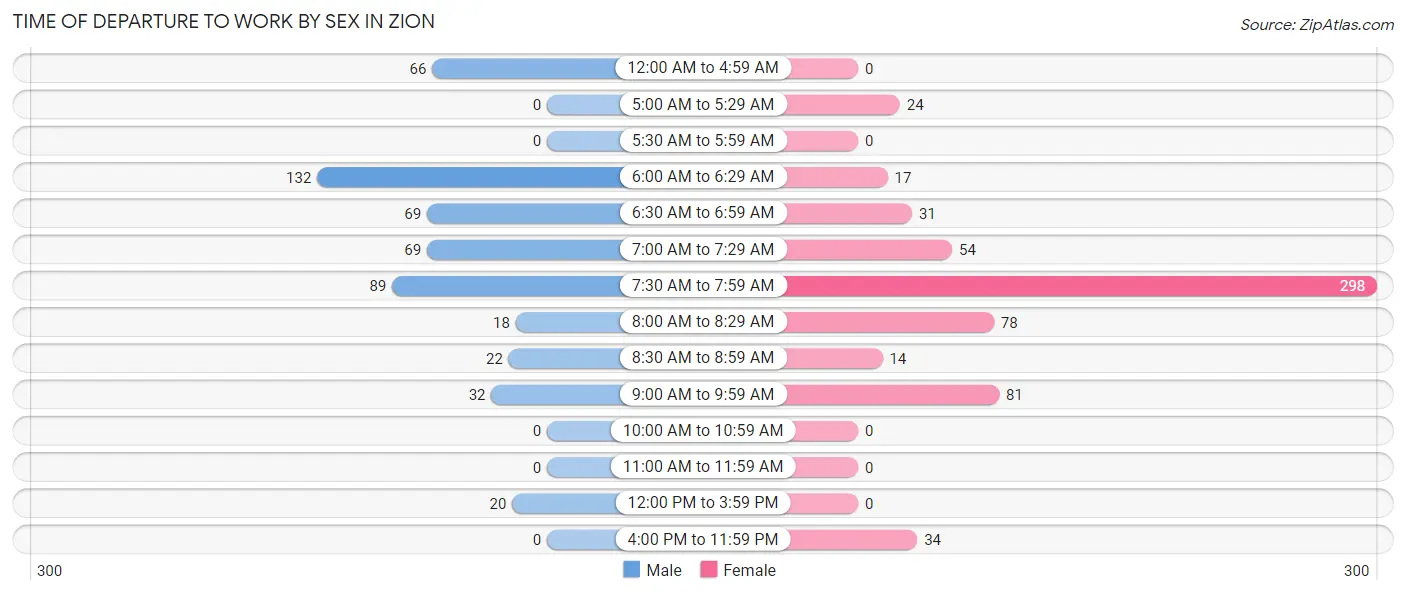
| Time of Departure | Male | Female |
| 12:00 AM to 4:59 AM | 66 (12.8%) | 0 (0.0%) |
| 5:00 AM to 5:29 AM | 0 (0.0%) | 24 (3.8%) |
| 5:30 AM to 5:59 AM | 0 (0.0%) | 0 (0.0%) |
| 6:00 AM to 6:29 AM | 132 (25.5%) | 17 (2.7%) |
| 6:30 AM to 6:59 AM | 69 (13.4%) | 31 (4.9%) |
| 7:00 AM to 7:29 AM | 69 (13.4%) | 54 (8.6%) |
| 7:30 AM to 7:59 AM | 89 (17.2%) | 298 (47.2%) |
| 8:00 AM to 8:29 AM | 18 (3.5%) | 78 (12.4%) |
| 8:30 AM to 8:59 AM | 22 (4.3%) | 14 (2.2%) |
| 9:00 AM to 9:59 AM | 32 (6.2%) | 81 (12.8%) |
| 10:00 AM to 10:59 AM | 0 (0.0%) | 0 (0.0%) |
| 11:00 AM to 11:59 AM | 0 (0.0%) | 0 (0.0%) |
| 12:00 PM to 3:59 PM | 20 (3.9%) | 0 (0.0%) |
| 4:00 PM to 11:59 PM | 0 (0.0%) | 34 (5.4%) |
| Total | 517 (100.0%) | 631 (100.0%) |
Housing Occupancy in Zion
Occupancy by Ownership in Zion
Of the total 1,097 dwellings in Zion, owner-occupied units account for 1,044 (95.2%), while renter-occupied units make up 53 (4.8%).
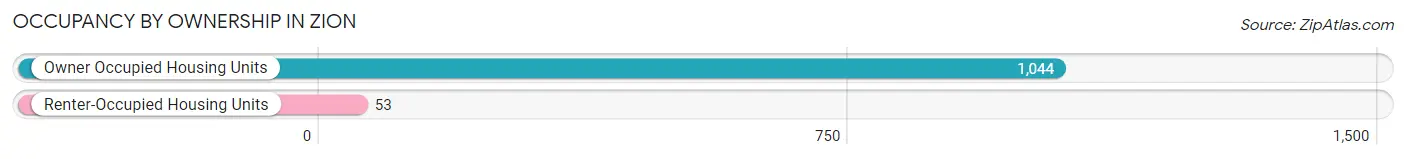
| Occupancy | # Housing Units | % Housing Units |
| Owner Occupied Housing Units | 1,044 | 95.2% |
| Renter-Occupied Housing Units | 53 | 4.8% |
| Total Occupied Housing Units | 1,097 | 100.0% |
Occupancy by Household Size in Zion
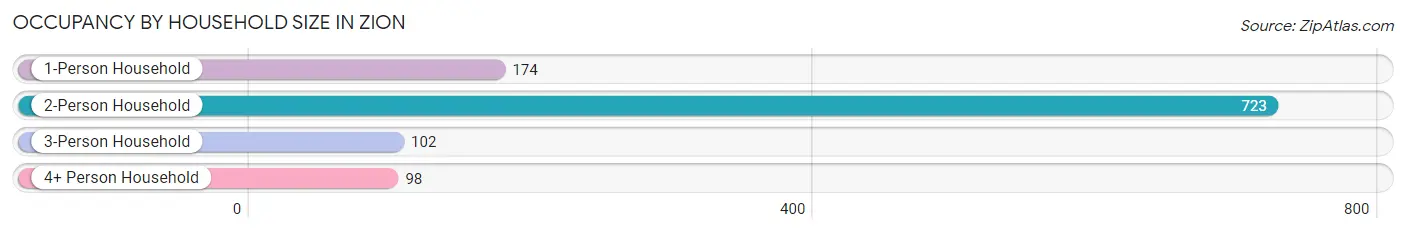
| Household Size | # Housing Units | % Housing Units |
| 1-Person Household | 174 | 15.9% |
| 2-Person Household | 723 | 65.9% |
| 3-Person Household | 102 | 9.3% |
| 4+ Person Household | 98 | 8.9% |
| Total Housing Units | 1,097 | 100.0% |
Occupancy by Ownership by Household Size in Zion
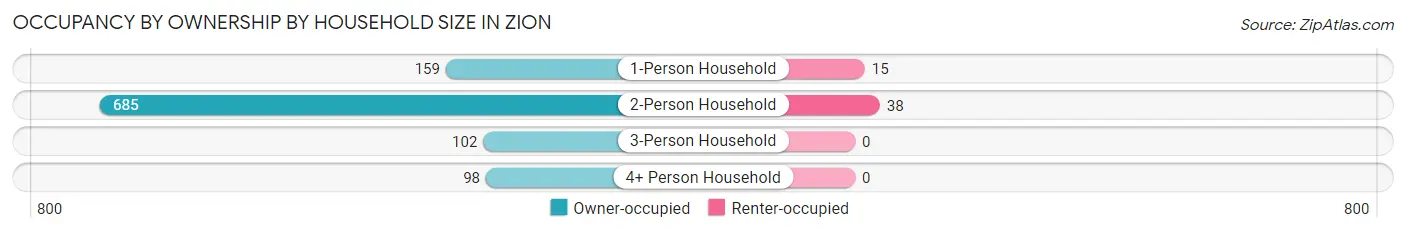
| Household Size | Owner-occupied | Renter-occupied |
| 1-Person Household | 159 (91.4%) | 15 (8.6%) |
| 2-Person Household | 685 (94.7%) | 38 (5.3%) |
| 3-Person Household | 102 (100.0%) | 0 (0.0%) |
| 4+ Person Household | 98 (100.0%) | 0 (0.0%) |
| Total Housing Units | 1,044 (95.2%) | 53 (4.8%) |
Occupancy by Educational Attainment in Zion
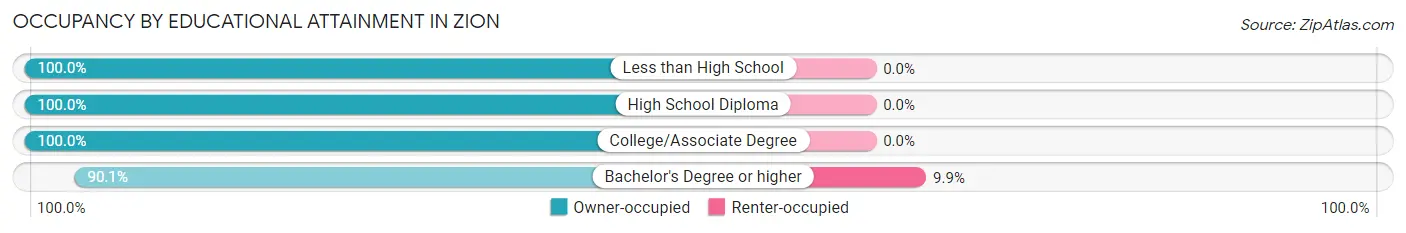
| Household Size | Owner-occupied | Renter-occupied |
| Less than High School | 16 (100.0%) | 0 (0.0%) |
| High School Diploma | 352 (100.0%) | 0 (0.0%) |
| College/Associate Degree | 194 (100.0%) | 0 (0.0%) |
| Bachelor's Degree or higher | 482 (90.1%) | 53 (9.9%) |
Occupancy by Age of Householder in Zion
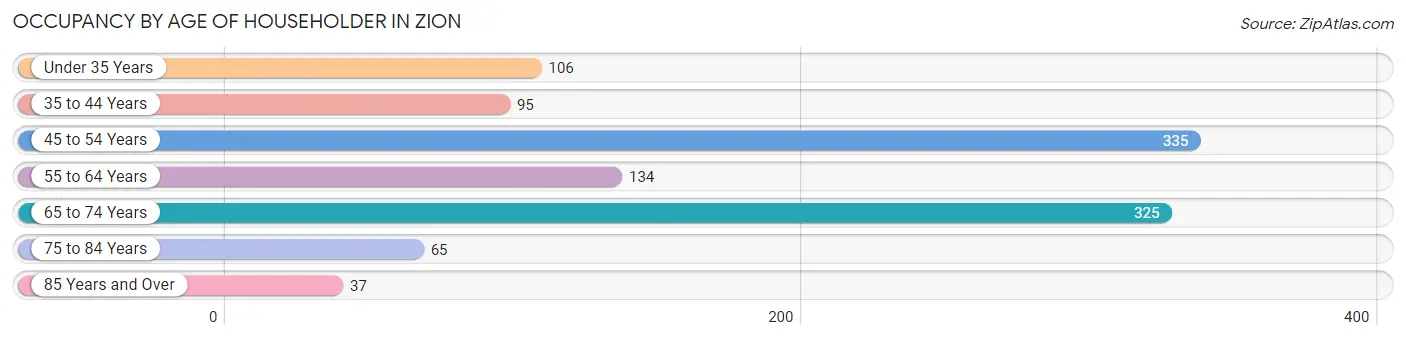
| Age Bracket | # Households | % Households |
| Under 35 Years | 106 | 9.7% |
| 35 to 44 Years | 95 | 8.7% |
| 45 to 54 Years | 335 | 30.5% |
| 55 to 64 Years | 134 | 12.2% |
| 65 to 74 Years | 325 | 29.6% |
| 75 to 84 Years | 65 | 5.9% |
| 85 Years and Over | 37 | 3.4% |
| Total | 1,097 | 100.0% |
Housing Finances in Zion
Median Income by Occupancy in Zion
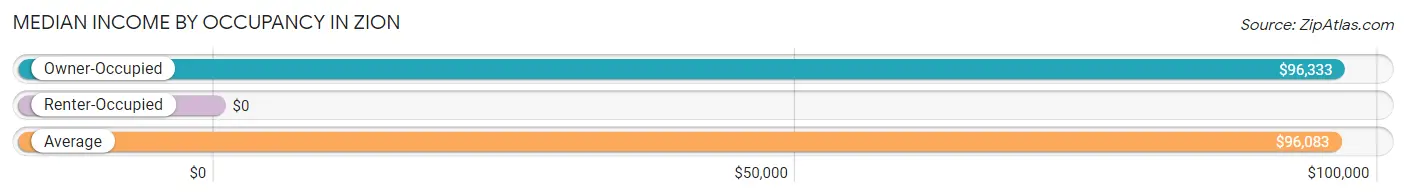
| Occupancy Type | # Households | Median Income |
| Owner-Occupied | 1,044 (95.2%) | $96,333 |
| Renter-Occupied | 53 (4.8%) | $0 |
| Average | 1,097 (100.0%) | $96,083 |
Occupancy by Householder Income Bracket in Zion
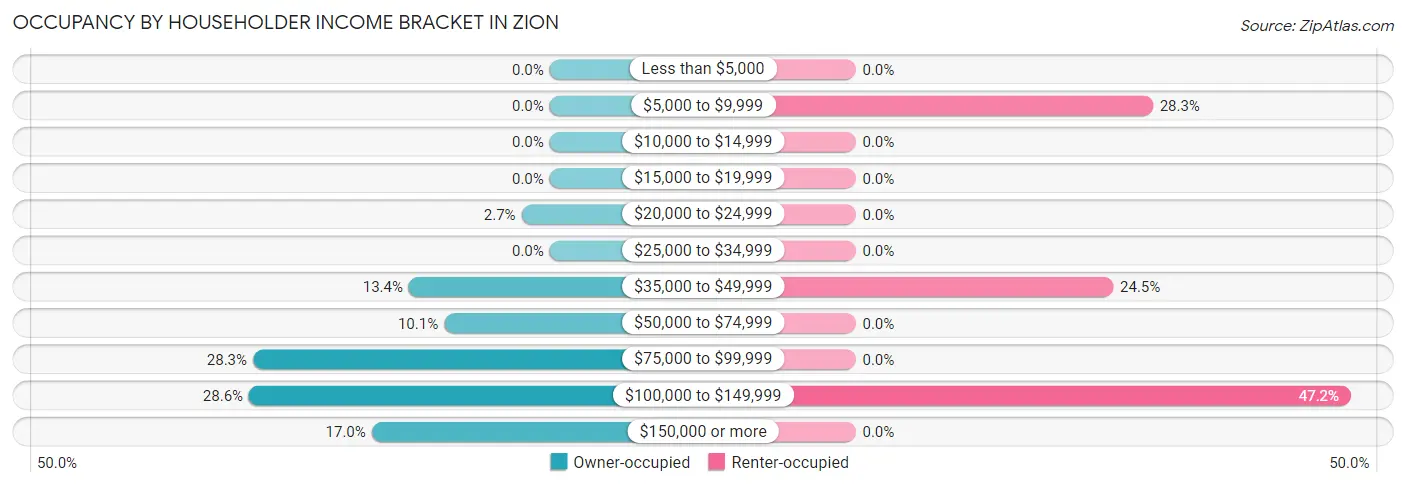
| Income Bracket | Owner-occupied | Renter-occupied |
| Less than $5,000 | 0 (0.0%) | 0 (0.0%) |
| $5,000 to $9,999 | 0 (0.0%) | 15 (28.3%) |
| $10,000 to $14,999 | 0 (0.0%) | 0 (0.0%) |
| $15,000 to $19,999 | 0 (0.0%) | 0 (0.0%) |
| $20,000 to $24,999 | 28 (2.7%) | 0 (0.0%) |
| $25,000 to $34,999 | 0 (0.0%) | 0 (0.0%) |
| $35,000 to $49,999 | 140 (13.4%) | 13 (24.5%) |
| $50,000 to $74,999 | 105 (10.1%) | 0 (0.0%) |
| $75,000 to $99,999 | 295 (28.3%) | 0 (0.0%) |
| $100,000 to $149,999 | 299 (28.6%) | 25 (47.2%) |
| $150,000 or more | 177 (17.0%) | 0 (0.0%) |
| Total | 1,044 (100.0%) | 53 (100.0%) |
Monthly Housing Cost Tiers in Zion
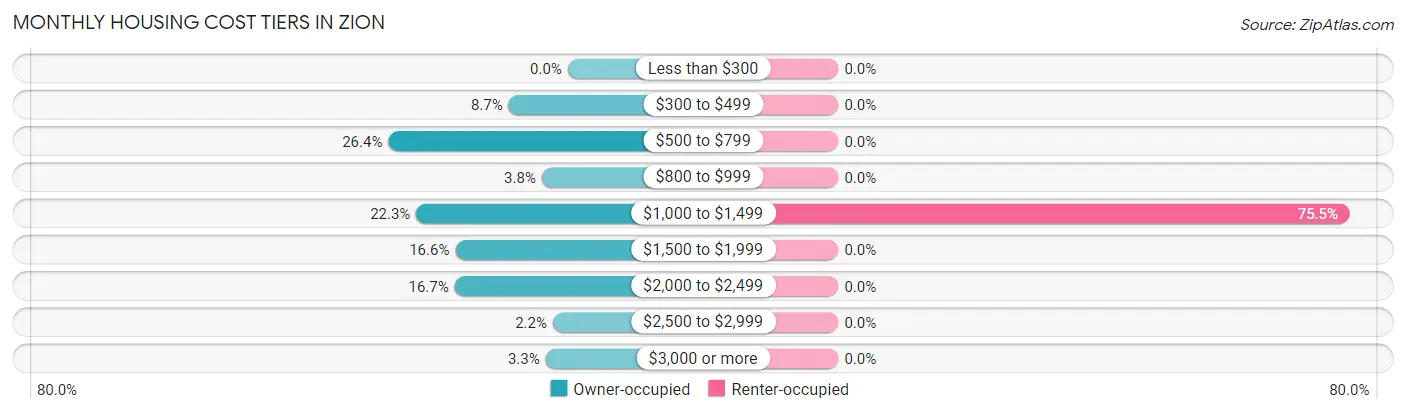
| Monthly Cost | Owner-occupied | Renter-occupied |
| Less than $300 | 0 (0.0%) | 0 (0.0%) |
| $300 to $499 | 91 (8.7%) | 0 (0.0%) |
| $500 to $799 | 276 (26.4%) | 0 (0.0%) |
| $800 to $999 | 40 (3.8%) | 0 (0.0%) |
| $1,000 to $1,499 | 233 (22.3%) | 40 (75.5%) |
| $1,500 to $1,999 | 173 (16.6%) | 0 (0.0%) |
| $2,000 to $2,499 | 174 (16.7%) | 0 (0.0%) |
| $2,500 to $2,999 | 23 (2.2%) | 0 (0.0%) |
| $3,000 or more | 34 (3.3%) | 0 (0.0%) |
| Total | 1,044 (100.0%) | 53 (100.0%) |
Physical Housing Characteristics in Zion
Housing Structures in Zion
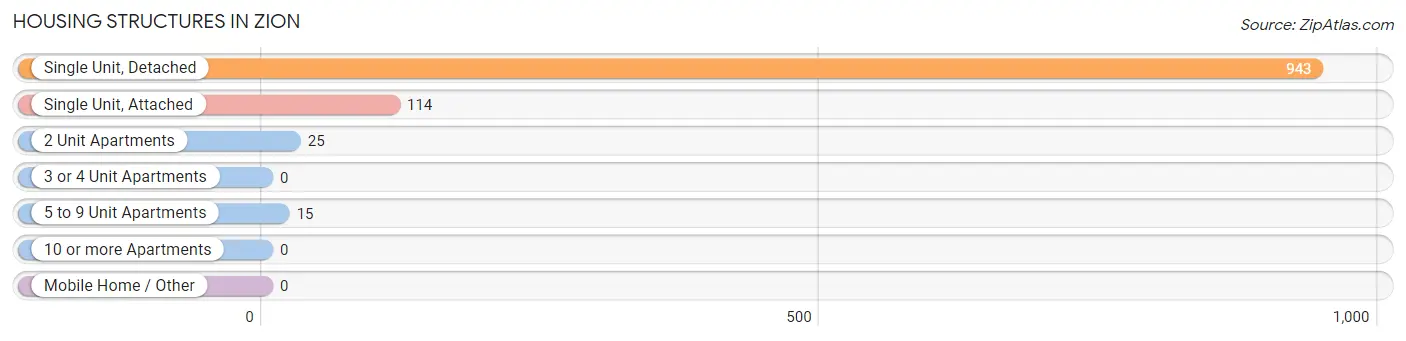
| Structure Type | # Housing Units | % Housing Units |
| Single Unit, Detached | 943 | 86.0% |
| Single Unit, Attached | 114 | 10.4% |
| 2 Unit Apartments | 25 | 2.3% |
| 3 or 4 Unit Apartments | 0 | 0.0% |
| 5 to 9 Unit Apartments | 15 | 1.4% |
| 10 or more Apartments | 0 | 0.0% |
| Mobile Home / Other | 0 | 0.0% |
| Total | 1,097 | 100.0% |
Housing Structures by Occupancy in Zion
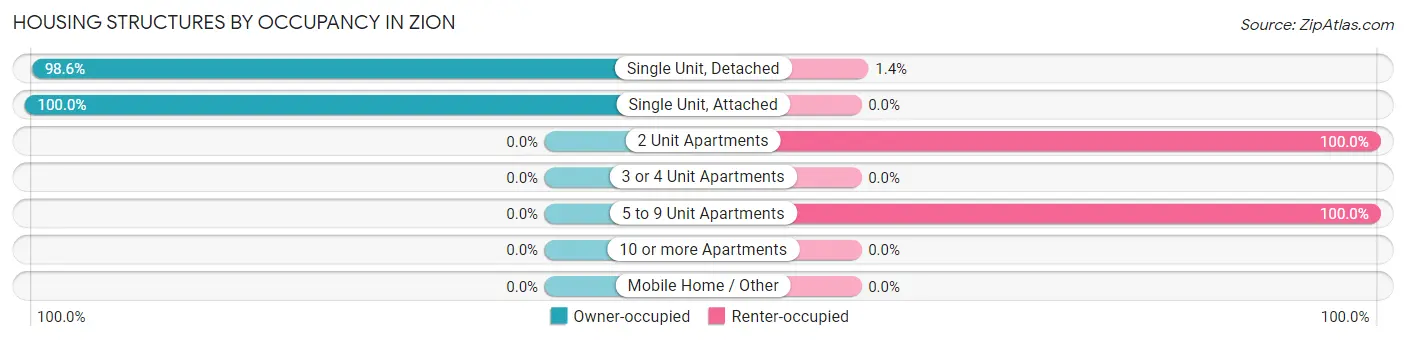
| Structure Type | Owner-occupied | Renter-occupied |
| Single Unit, Detached | 930 (98.6%) | 13 (1.4%) |
| Single Unit, Attached | 114 (100.0%) | 0 (0.0%) |
| 2 Unit Apartments | 0 (0.0%) | 25 (100.0%) |
| 3 or 4 Unit Apartments | 0 (0.0%) | 0 (0.0%) |
| 5 to 9 Unit Apartments | 0 (0.0%) | 15 (100.0%) |
| 10 or more Apartments | 0 (0.0%) | 0 (0.0%) |
| Mobile Home / Other | 0 (0.0%) | 0 (0.0%) |
| Total | 1,044 (95.2%) | 53 (4.8%) |
Housing Structures by Number of Rooms in Zion
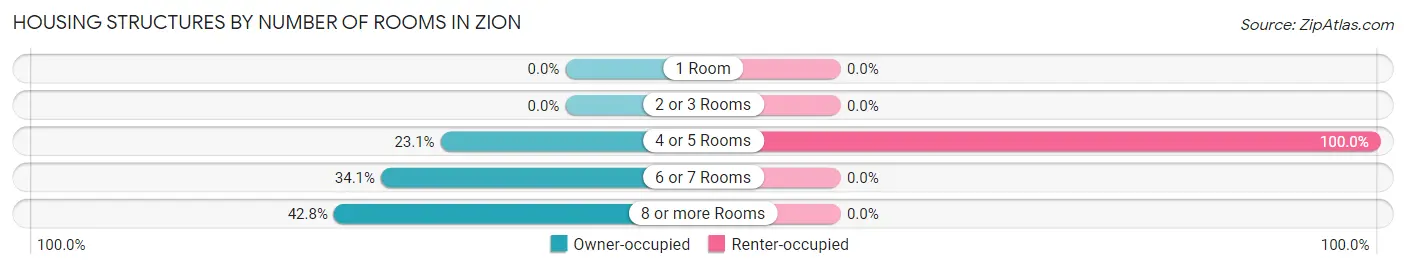
| Number of Rooms | Owner-occupied | Renter-occupied |
| 1 Room | 0 (0.0%) | 0 (0.0%) |
| 2 or 3 Rooms | 0 (0.0%) | 0 (0.0%) |
| 4 or 5 Rooms | 241 (23.1%) | 53 (100.0%) |
| 6 or 7 Rooms | 356 (34.1%) | 0 (0.0%) |
| 8 or more Rooms | 447 (42.8%) | 0 (0.0%) |
| Total | 1,044 (100.0%) | 53 (100.0%) |
Housing Structure by Heating Type in Zion
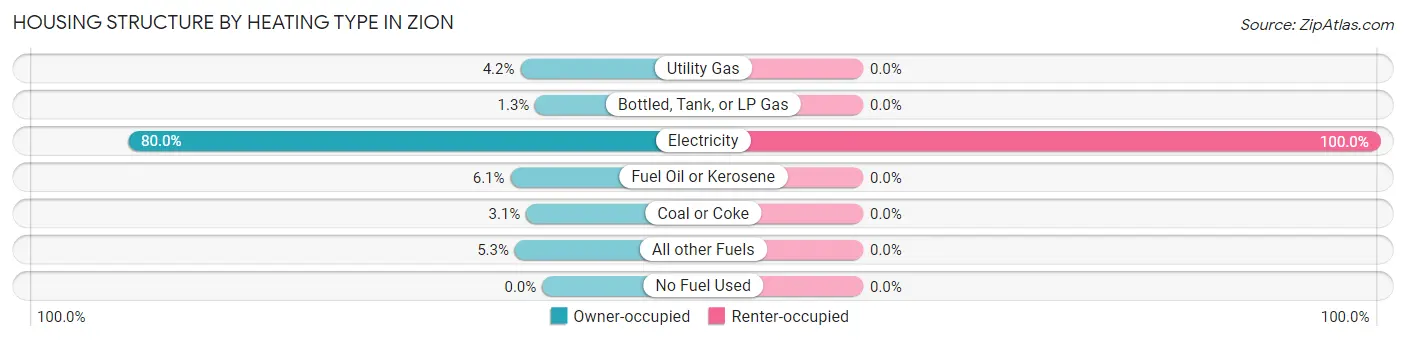
| Heating Type | Owner-occupied | Renter-occupied |
| Utility Gas | 44 (4.2%) | 0 (0.0%) |
| Bottled, Tank, or LP Gas | 14 (1.3%) | 0 (0.0%) |
| Electricity | 835 (80.0%) | 53 (100.0%) |
| Fuel Oil or Kerosene | 64 (6.1%) | 0 (0.0%) |
| Coal or Coke | 32 (3.1%) | 0 (0.0%) |
| All other Fuels | 55 (5.3%) | 0 (0.0%) |
| No Fuel Used | 0 (0.0%) | 0 (0.0%) |
| Total | 1,044 (100.0%) | 53 (100.0%) |
Household Vehicle Usage in Zion
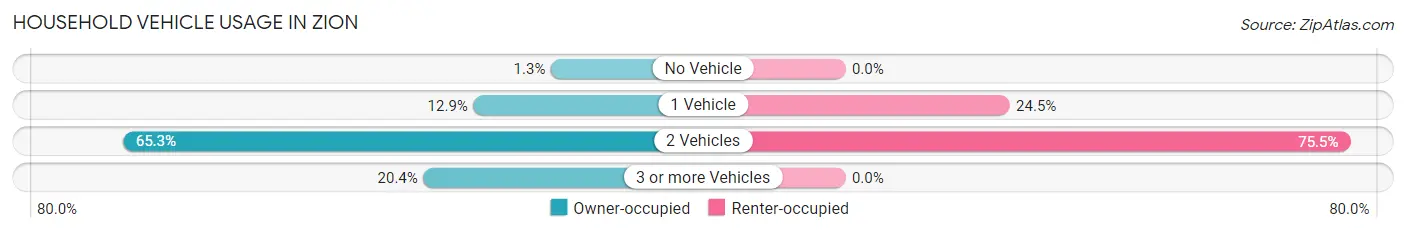
| Vehicles per Household | Owner-occupied | Renter-occupied |
| No Vehicle | 14 (1.3%) | 0 (0.0%) |
| 1 Vehicle | 135 (12.9%) | 13 (24.5%) |
| 2 Vehicles | 682 (65.3%) | 40 (75.5%) |
| 3 or more Vehicles | 213 (20.4%) | 0 (0.0%) |
| Total | 1,044 (100.0%) | 53 (100.0%) |
Real Estate & Mortgages in Zion
Real Estate and Mortgage Overview in Zion
| Characteristic | Without Mortgage | With Mortgage |
| Housing Units | 375 | 669 |
| Median Property Value | $244,800 | $344,500 |
| Median Household Income | $68,250 | $148 |
| Monthly Housing Costs | $570 | $34 |
| Real Estate Taxes | $3,943 | $0 |
Property Value by Mortgage Status in Zion
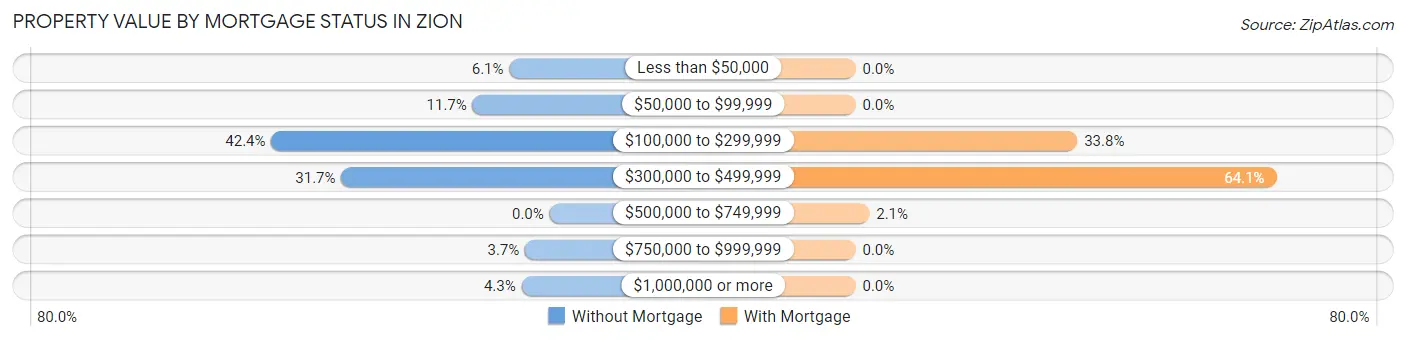
| Property Value | Without Mortgage | With Mortgage |
| Less than $50,000 | 23 (6.1%) | 0 (0.0%) |
| $50,000 to $99,999 | 44 (11.7%) | 0 (0.0%) |
| $100,000 to $299,999 | 159 (42.4%) | 226 (33.8%) |
| $300,000 to $499,999 | 119 (31.7%) | 429 (64.1%) |
| $500,000 to $749,999 | 0 (0.0%) | 14 (2.1%) |
| $750,000 to $999,999 | 14 (3.7%) | 0 (0.0%) |
| $1,000,000 or more | 16 (4.3%) | 0 (0.0%) |
| Total | 375 (100.0%) | 669 (100.0%) |
Household Income by Mortgage Status in Zion
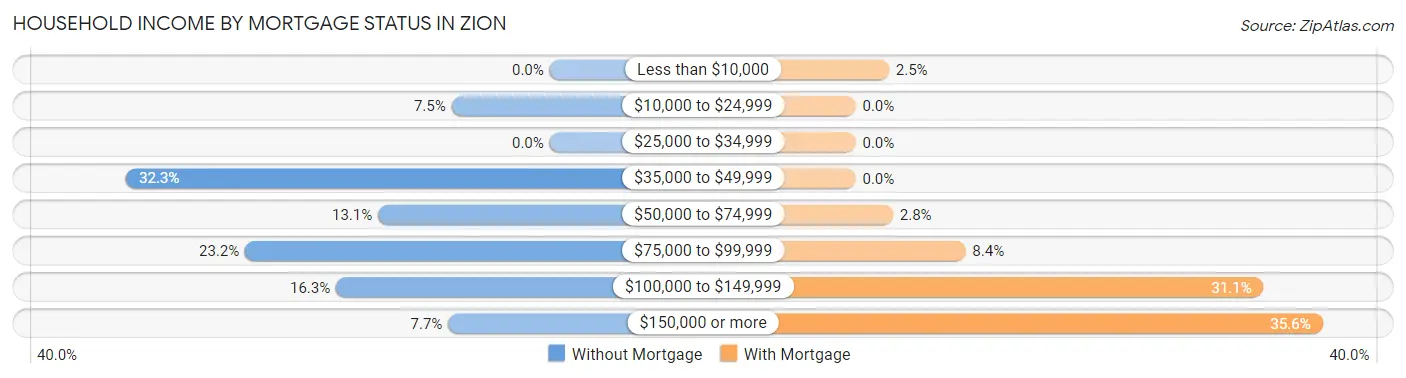
| Household Income | Without Mortgage | With Mortgage |
| Less than $10,000 | 0 (0.0%) | 17 (2.5%) |
| $10,000 to $24,999 | 28 (7.5%) | 0 (0.0%) |
| $25,000 to $34,999 | 0 (0.0%) | 0 (0.0%) |
| $35,000 to $49,999 | 121 (32.3%) | 0 (0.0%) |
| $50,000 to $74,999 | 49 (13.1%) | 19 (2.8%) |
| $75,000 to $99,999 | 87 (23.2%) | 56 (8.4%) |
| $100,000 to $149,999 | 61 (16.3%) | 208 (31.1%) |
| $150,000 or more | 29 (7.7%) | 238 (35.6%) |
| Total | 375 (100.0%) | 669 (100.0%) |
Property Value to Household Income Ratio in Zion
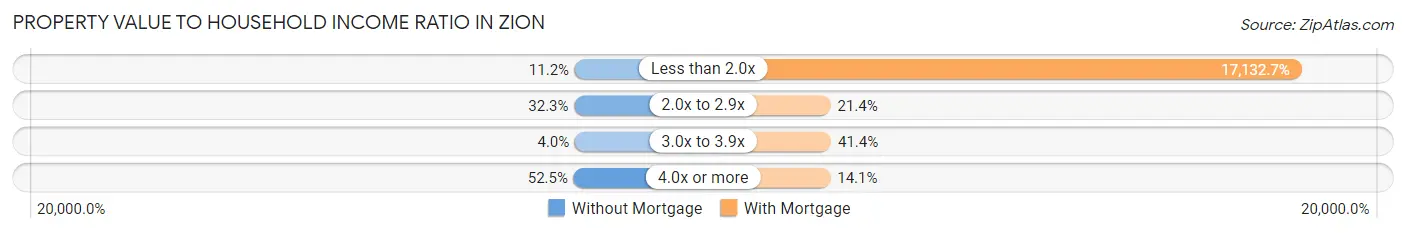
| Value-to-Income Ratio | Without Mortgage | With Mortgage |
| Less than 2.0x | 42 (11.2%) | 114,618 (17,132.7%) |
| 2.0x to 2.9x | 121 (32.3%) | 143 (21.4%) |
| 3.0x to 3.9x | 15 (4.0%) | 277 (41.4%) |
| 4.0x or more | 197 (52.5%) | 94 (14.1%) |
| Total | 375 (100.0%) | 669 (100.0%) |
Real Estate Taxes by Mortgage Status in Zion
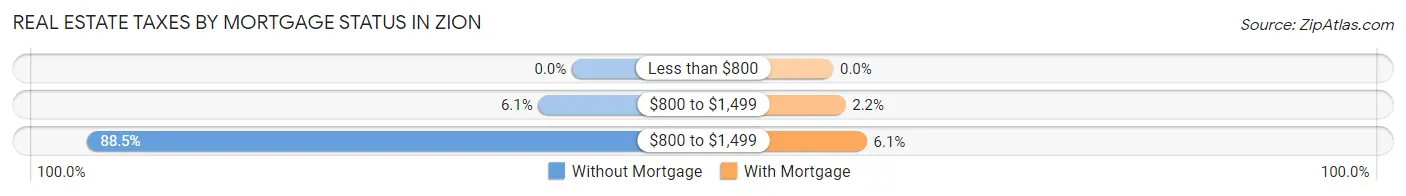
| Property Taxes | Without Mortgage | With Mortgage |
| Less than $800 | 0 (0.0%) | 0 (0.0%) |
| $800 to $1,499 | 23 (6.1%) | 15 (2.2%) |
| $800 to $1,499 | 332 (88.5%) | 41 (6.1%) |
| Total | 375 (100.0%) | 669 (100.0%) |
Health & Disability in Zion
Health Insurance Coverage by Age in Zion
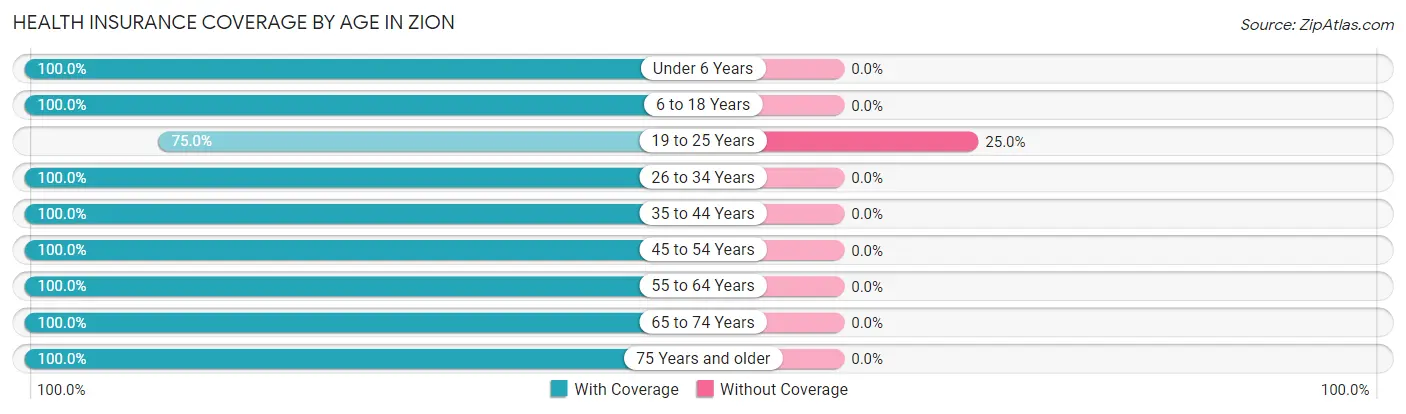
| Age Bracket | With Coverage | Without Coverage |
| Under 6 Years | 51 (100.0%) | 0 (0.0%) |
| 6 to 18 Years | 232 (100.0%) | 0 (0.0%) |
| 19 to 25 Years | 78 (75.0%) | 26 (25.0%) |
| 26 to 34 Years | 163 (100.0%) | 0 (0.0%) |
| 35 to 44 Years | 207 (100.0%) | 0 (0.0%) |
| 45 to 54 Years | 517 (100.0%) | 0 (0.0%) |
| 55 to 64 Years | 235 (100.0%) | 0 (0.0%) |
| 65 to 74 Years | 578 (100.0%) | 0 (0.0%) |
| 75 Years and older | 186 (100.0%) | 0 (0.0%) |
| Total | 2,247 (98.9%) | 26 (1.1%) |
Health Insurance Coverage by Citizenship Status in Zion
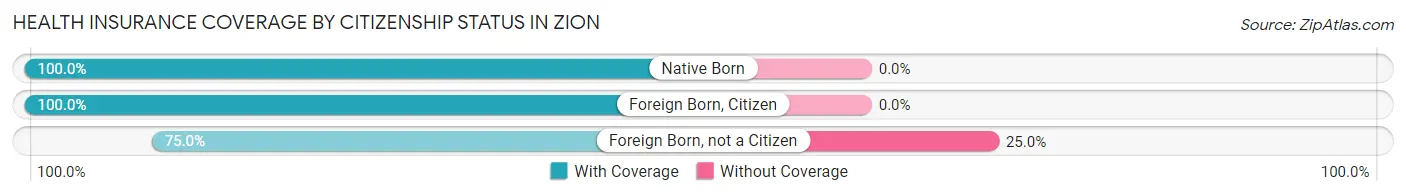
| Citizenship Status | With Coverage | Without Coverage |
| Native Born | 51 (100.0%) | 0 (0.0%) |
| Foreign Born, Citizen | 232 (100.0%) | 0 (0.0%) |
| Foreign Born, not a Citizen | 78 (75.0%) | 26 (25.0%) |
Health Insurance Coverage by Household Income in Zion
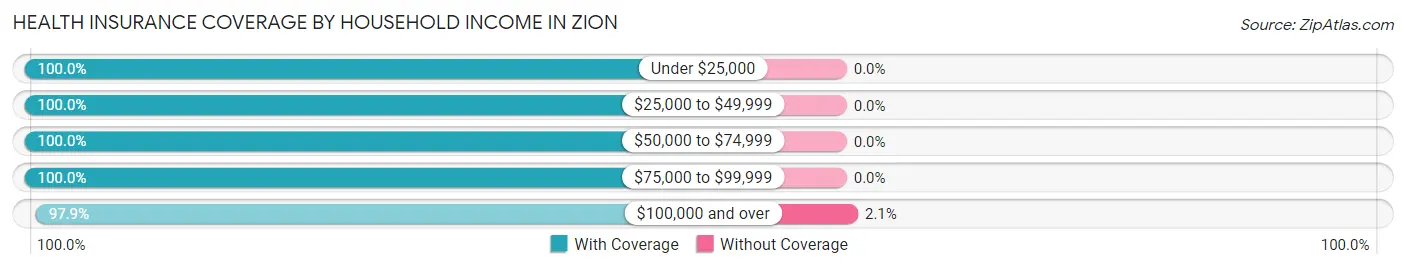
| Household Income | With Coverage | Without Coverage |
| Under $25,000 | 43 (100.0%) | 0 (0.0%) |
| $25,000 to $49,999 | 210 (100.0%) | 0 (0.0%) |
| $50,000 to $74,999 | 210 (100.0%) | 0 (0.0%) |
| $75,000 to $99,999 | 568 (100.0%) | 0 (0.0%) |
| $100,000 and over | 1,207 (97.9%) | 26 (2.1%) |
Public vs Private Health Insurance Coverage by Age in Zion
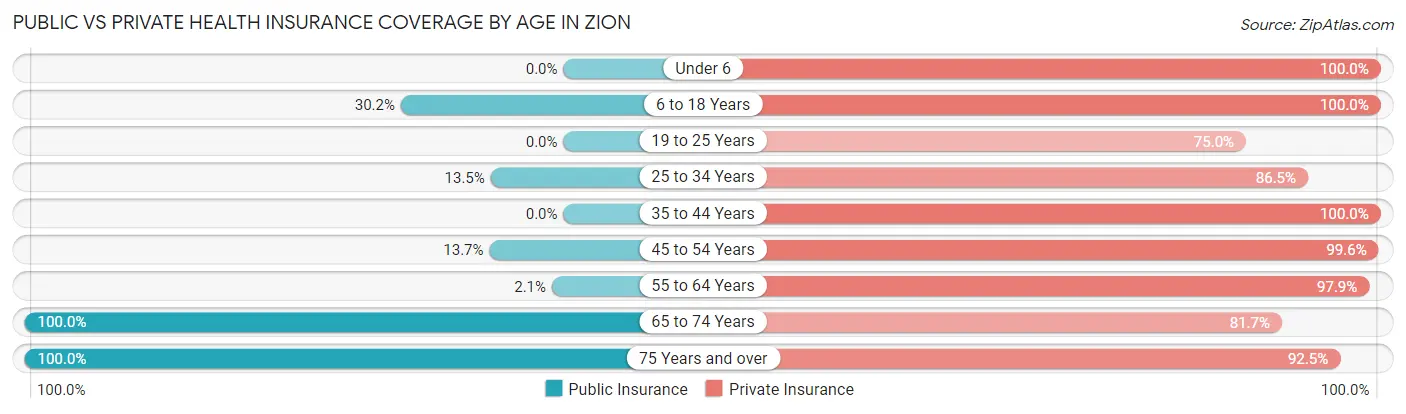
| Age Bracket | Public Insurance | Private Insurance |
| Under 6 | 0 (0.0%) | 51 (100.0%) |
| 6 to 18 Years | 70 (30.2%) | 232 (100.0%) |
| 19 to 25 Years | 0 (0.0%) | 78 (75.0%) |
| 25 to 34 Years | 22 (13.5%) | 141 (86.5%) |
| 35 to 44 Years | 0 (0.0%) | 207 (100.0%) |
| 45 to 54 Years | 71 (13.7%) | 515 (99.6%) |
| 55 to 64 Years | 5 (2.1%) | 230 (97.9%) |
| 65 to 74 Years | 578 (100.0%) | 472 (81.7%) |
| 75 Years and over | 186 (100.0%) | 172 (92.5%) |
| Total | 932 (41.0%) | 2,098 (92.3%) |
Disability Status by Sex by Age in Zion
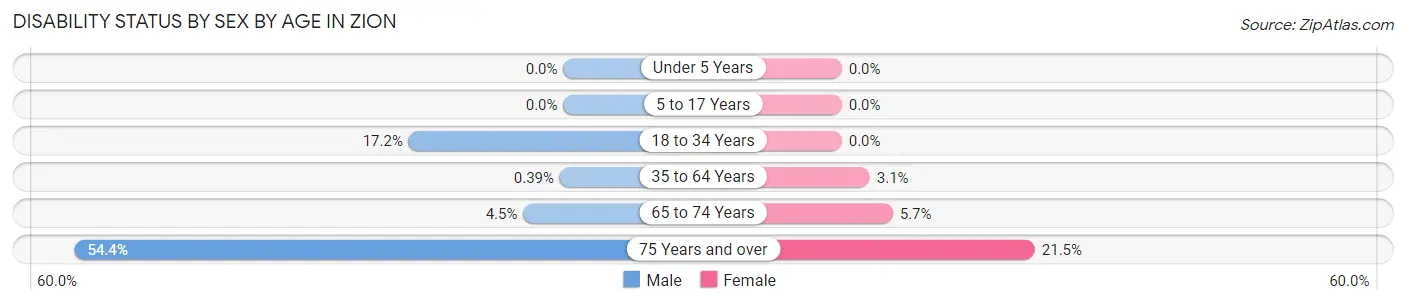
| Age Bracket | Male | Female |
| Under 5 Years | 0 (0.0%) | 0 (0.0%) |
| 5 to 17 Years | 0 (0.0%) | 0 (0.0%) |
| 18 to 34 Years | 26 (17.2%) | 0 (0.0%) |
| 35 to 64 Years | 2 (0.4%) | 14 (3.1%) |
| 65 to 74 Years | 14 (4.5%) | 15 (5.7%) |
| 75 Years and over | 43 (54.4%) | 23 (21.5%) |
Disability Class by Sex by Age in Zion
Disability Class: Hearing Difficulty
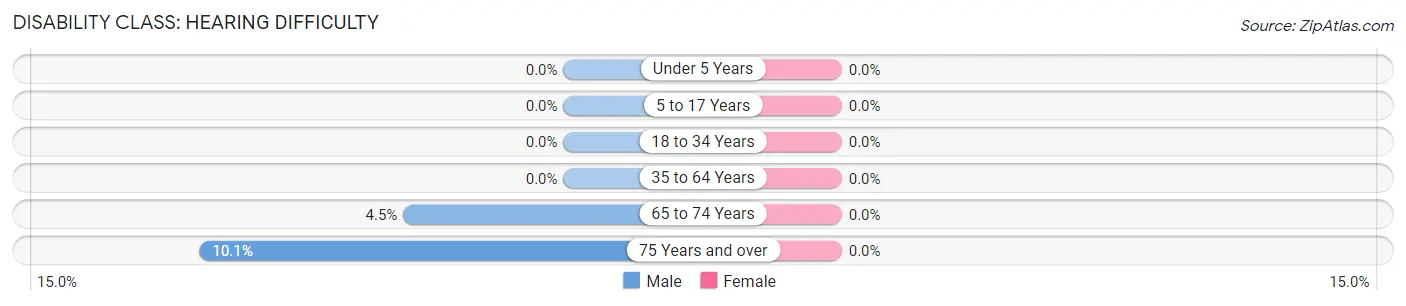
| Age Bracket | Male | Female |
| Under 5 Years | 0 (0.0%) | 0 (0.0%) |
| 5 to 17 Years | 0 (0.0%) | 0 (0.0%) |
| 18 to 34 Years | 0 (0.0%) | 0 (0.0%) |
| 35 to 64 Years | 0 (0.0%) | 0 (0.0%) |
| 65 to 74 Years | 14 (4.5%) | 0 (0.0%) |
| 75 Years and over | 8 (10.1%) | 0 (0.0%) |
Disability Class: Vision Difficulty
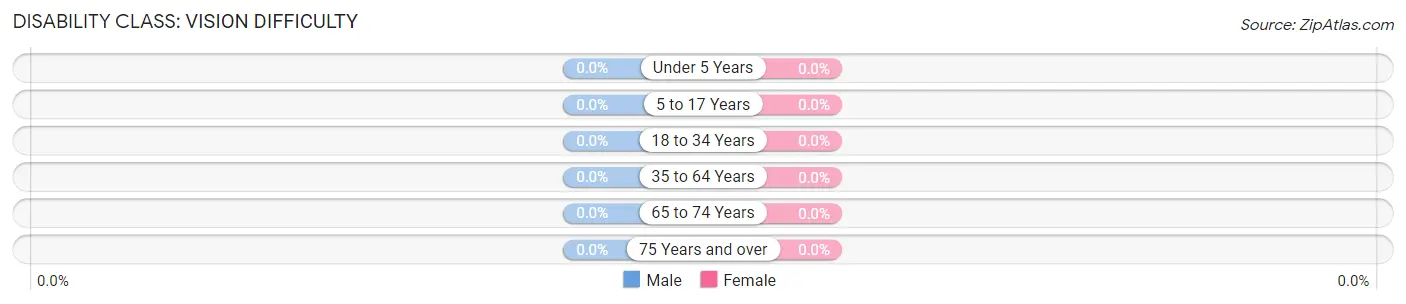
| Age Bracket | Male | Female |
| Under 5 Years | 0 (0.0%) | 0 (0.0%) |
| 5 to 17 Years | 0 (0.0%) | 0 (0.0%) |
| 18 to 34 Years | 0 (0.0%) | 0 (0.0%) |
| 35 to 64 Years | 0 (0.0%) | 0 (0.0%) |
| 65 to 74 Years | 0 (0.0%) | 0 (0.0%) |
| 75 Years and over | 0 (0.0%) | 0 (0.0%) |
Disability Class: Cognitive Difficulty
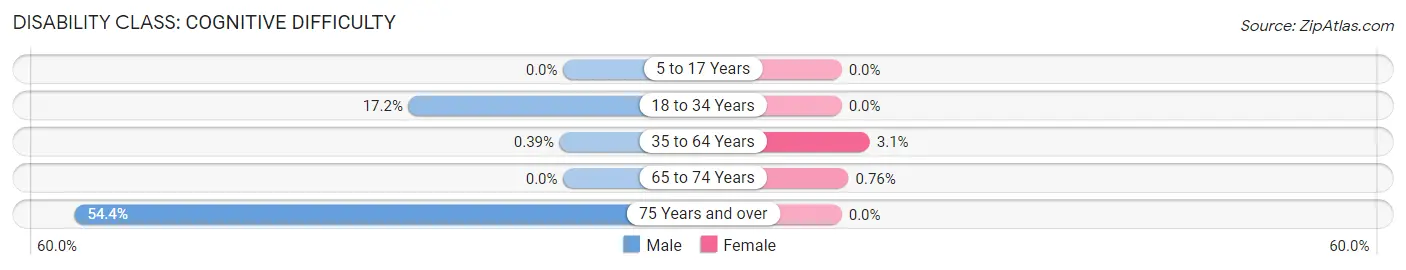
| Age Bracket | Male | Female |
| 5 to 17 Years | 0 (0.0%) | 0 (0.0%) |
| 18 to 34 Years | 26 (17.2%) | 0 (0.0%) |
| 35 to 64 Years | 2 (0.4%) | 14 (3.1%) |
| 65 to 74 Years | 0 (0.0%) | 2 (0.8%) |
| 75 Years and over | 43 (54.4%) | 0 (0.0%) |
Disability Class: Ambulatory Difficulty
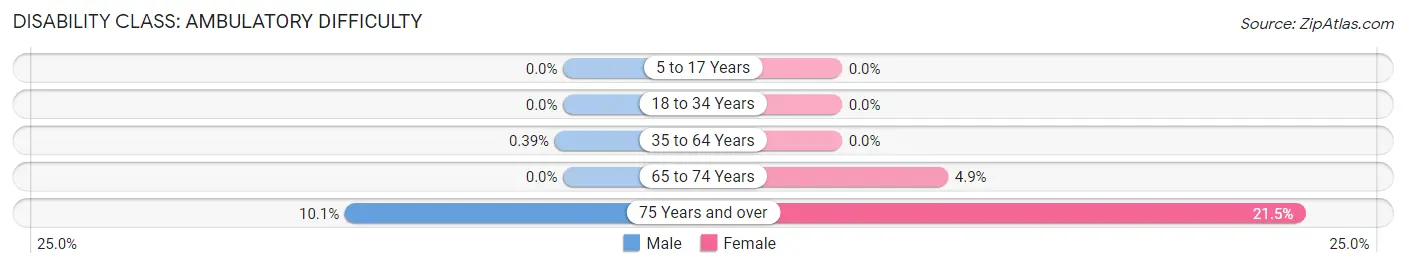
| Age Bracket | Male | Female |
| 5 to 17 Years | 0 (0.0%) | 0 (0.0%) |
| 18 to 34 Years | 0 (0.0%) | 0 (0.0%) |
| 35 to 64 Years | 2 (0.4%) | 0 (0.0%) |
| 65 to 74 Years | 0 (0.0%) | 13 (4.9%) |
| 75 Years and over | 8 (10.1%) | 23 (21.5%) |
Disability Class: Self-Care Difficulty
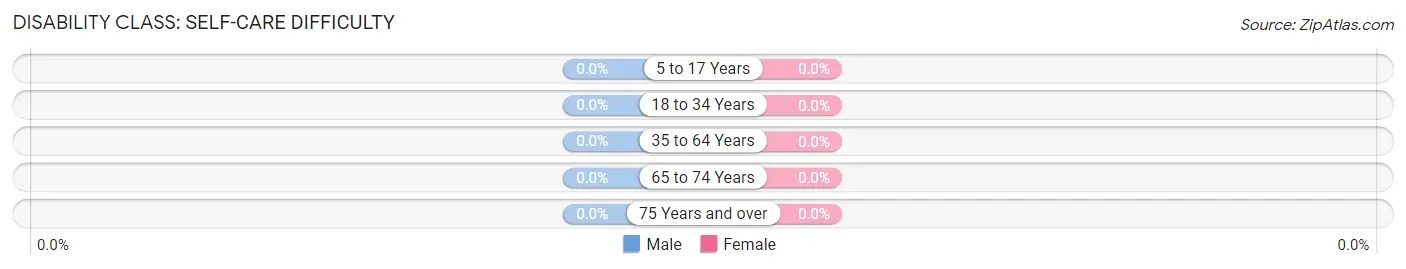
| Age Bracket | Male | Female |
| 5 to 17 Years | 0 (0.0%) | 0 (0.0%) |
| 18 to 34 Years | 0 (0.0%) | 0 (0.0%) |
| 35 to 64 Years | 0 (0.0%) | 0 (0.0%) |
| 65 to 74 Years | 0 (0.0%) | 0 (0.0%) |
| 75 Years and over | 0 (0.0%) | 0 (0.0%) |
Technology Access in Zion
Computing Device Access in Zion
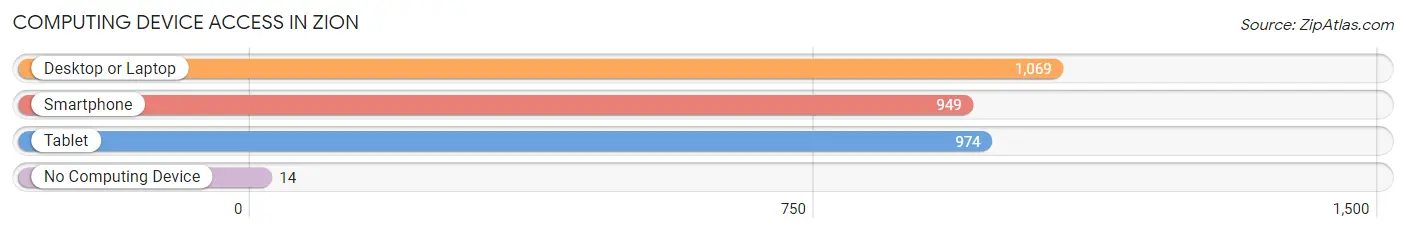
| Device Type | # Households | % Households |
| Desktop or Laptop | 1,069 | 97.5% |
| Smartphone | 949 | 86.5% |
| Tablet | 974 | 88.8% |
| No Computing Device | 14 | 1.3% |
| Total | 1,097 | 100.0% |
Internet Access in Zion
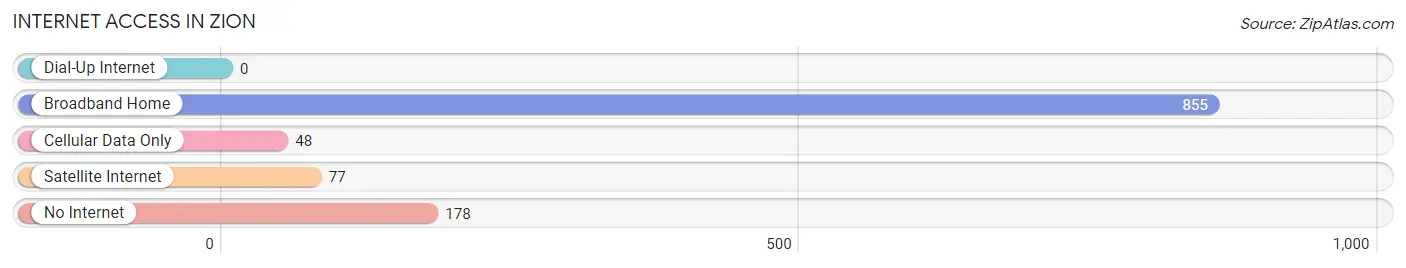
| Internet Type | # Households | % Households |
| Dial-Up Internet | 0 | 0.0% |
| Broadband Home | 855 | 77.9% |
| Cellular Data Only | 48 | 4.4% |
| Satellite Internet | 77 | 7.0% |
| No Internet | 178 | 16.2% |
| Total | 1,097 | 100.0% |
Zion Summary
Zion is a small borough located in Northampton County, Pennsylvania. It is situated in the Lehigh Valley region of the state, approximately 10 miles north of Easton and about 20 miles west of Allentown. The borough is bordered by the townships of Lower Nazareth, Upper Nazareth, and Bushkill. As of the 2010 census, the population of Zion was 1,845.
History
The area that is now Zion was originally inhabited by the Lenape Native Americans. The first European settlers arrived in the area in the late 1700s. The borough was officially established in 1845 and was named after the biblical city of Zion.
Geography
Zion is located at 40°41'N 75°20'W. It has a total area of 0.7 square miles, all of which is land. The borough is situated in the Lehigh Valley region of Pennsylvania, approximately 10 miles north of Easton and about 20 miles west of Allentown. It is bordered by the townships of Lower Nazareth, Upper Nazareth, and Bushkill.
Economy
The economy of Zion is largely based on agriculture and light manufacturing. The borough is home to several small businesses, including a few restaurants, a grocery store, and a hardware store. The local economy is also supported by the nearby Lehigh Valley International Airport, which is located just outside of the borough.
Demographics
As of the 2010 census, the population of Zion was 1,845. The racial makeup of the borough was 94.3% White, 1.7% African American, 0.2% Native American, 0.7% Asian, 0.1% Pacific Islander, 1.2% from other races, and 1.9% from two or more races. Hispanic or Latino of any race were 3.7% of the population.
The median household income in Zion was $50,938, and the median family income was $60,938. The per capita income for the borough was $22,938. About 4.3% of families and 5.7% of the population were below the poverty line, including 8.3% of those under age 18 and 4.3% of those age 65 or over.
Common Questions
What is the Total Population of Zion?
Total Population of Zion is 2,273.
What is the Total Male Population of Zion?
Total Male Population of Zion is 1,194.
What is the Total Female Population of Zion?
Total Female Population of Zion is 1,079.
What is the Ratio of Males per 100 Females in Zion?
There are 110.66 Males per 100 Females in Zion.
What is the Ratio of Females per 100 Males in Zion?
There are 90.37 Females per 100 Males in Zion.
What is the Median Population Age in Zion?
Median Population Age in Zion is 51.3 Years.
What is the Average Family Size in Zion
Average Family Size in Zion is 2.3 People.
What is the Average Household Size in Zion
Average Household Size in Zion is 2.1 People.
What is Per Capita Income in Zion?
Per Capita income in Zion is $54,452.
What is the Median Family Income in Zion?
Median Family Income in Zion is $111,696.
What is the Median Household income in Zion?
Median Household Income in Zion is $96,083.
What is Income or Wage Gap in Zion?
Income or Wage Gap in Zion is 22.1%.
Women in Zion earn 77.9 cents for every dollar earned by a man.
What is Inequality or Gini Index in Zion?
Inequality or Gini Index in Zion is 0.35.
How Large is the Labor Force in Zion?
There are 1,531 People in the Labor Forcein in Zion.
What is the Percentage of People in the Labor Force in Zion?
74.9% of People are in the Labor Force in Zion.
What is the Unemployment Rate in Zion?
Unemployment Rate in Zion is 9.6%.