Landingville borough, PA
Landingville borough Overview
252
TOTAL POPULATION
130
MALE POPULATION
122
FEMALE POPULATION
106.56
MALES / 100 FEMALES
93.85
FEMALES / 100 MALES
43.2
MEDIAN AGE
4.3
AVG FAMILY SIZE
3.9
AVG HOUSEHOLD SIZE
$25,941
PER CAPITA INCOME
$97,500
AVG FAMILY INCOME
$84,063
AVG HOUSEHOLD INCOME
13.2%
WAGE / INCOME GAP [ % ]
86.8¢/ $1
WAGE / INCOME GAP [ $ ]
$1,640
FAMILY INCOME DEFICIT
0.36
INEQUALITY / GINI INDEX
92
LABOR FORCE [ PEOPLE ]
50.3%
PERCENT IN LABOR FORCE
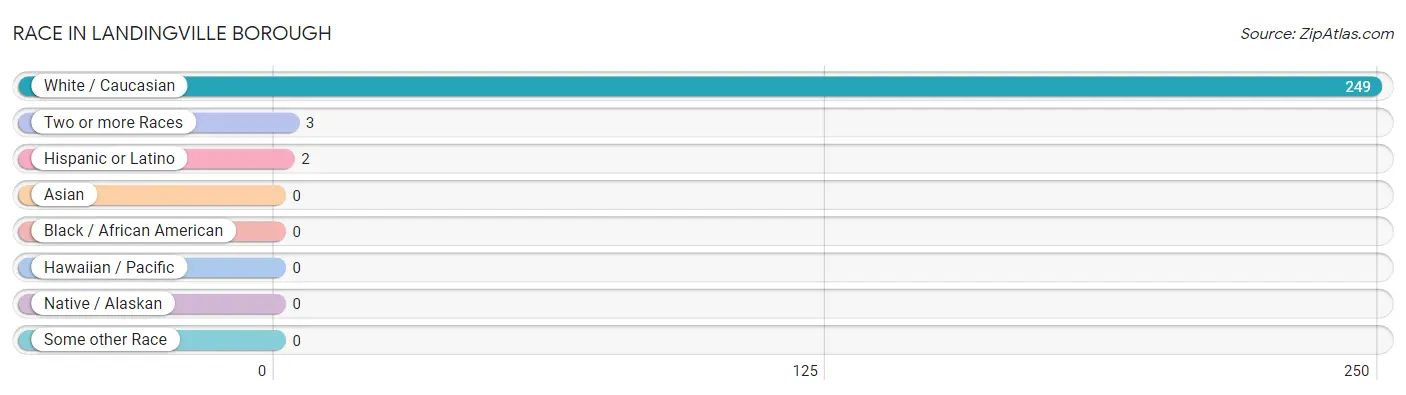
Race in Landingville borough
The most populous races in Landingville borough are White / Caucasian (249 | 98.8%), Two or more Races (3 | 1.2%), and Hispanic or Latino (2 | 0.8%).
| Race | # Population | % Population |
| Asian | 0 | 0.0% |
| Black / African American | 0 | 0.0% |
| Hawaiian / Pacific | 0 | 0.0% |
| Hispanic or Latino | 2 | 0.8% |
| Native / Alaskan | 0 | 0.0% |
| White / Caucasian | 249 | 98.8% |
| Two or more Races | 3 | 1.2% |
| Some other Race | 0 | 0.0% |
| Total | 252 | 100.0% |
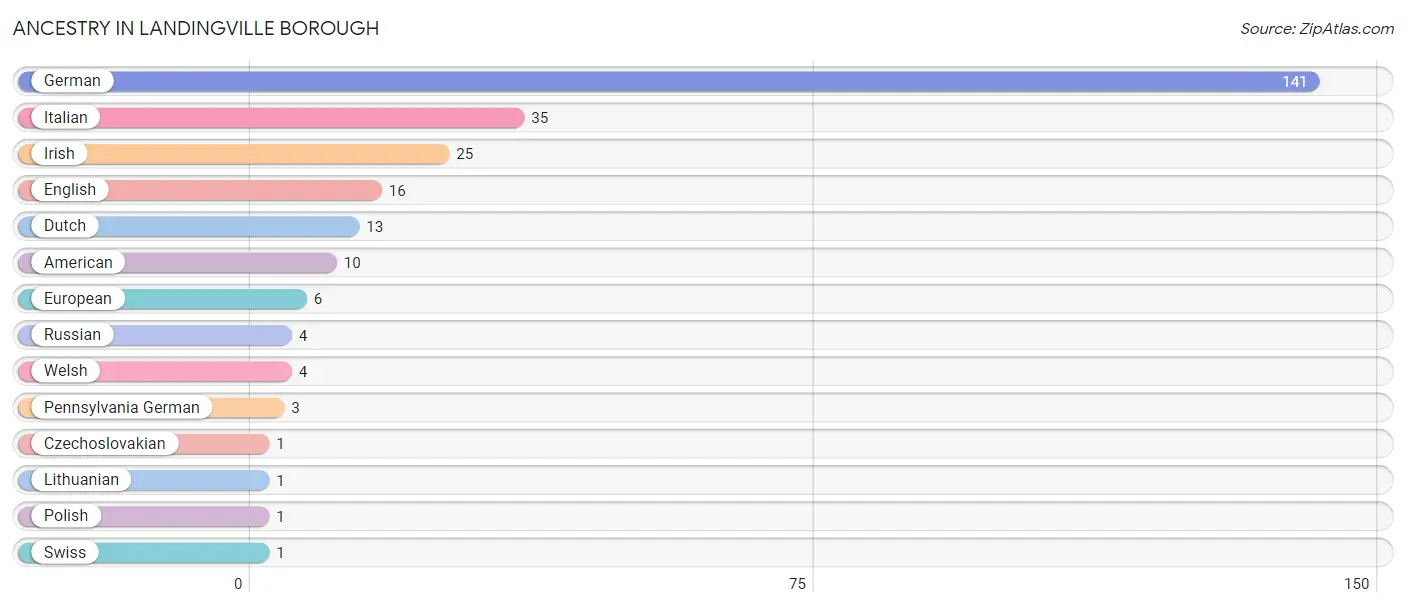
Ancestry in Landingville borough
The most populous ancestries reported in Landingville borough are German (141 | 55.9%), Italian (35 | 13.9%), Irish (25 | 9.9%), English (16 | 6.4%), and Dutch (13 | 5.2%), together accounting for 91.3% of all Landingville borough residents.
| Ancestry | # Population | % Population |
| American | 10 | 4.0% |
| Czechoslovakian | 1 | 0.4% |
| Dutch | 13 | 5.2% |
| English | 16 | 6.4% |
| European | 6 | 2.4% |
| German | 141 | 55.9% |
| Irish | 25 | 9.9% |
| Italian | 35 | 13.9% |
| Lithuanian | 1 | 0.4% |
| Pennsylvania German | 3 | 1.2% |
| Polish | 1 | 0.4% |
| Russian | 4 | 1.6% |
| Swiss | 1 | 0.4% |
| Welsh | 4 | 1.6% | View All 14 Rows |
Immigrants in Landingville borough

| Immigration Origin | # Population | % Population | View All 0 Rows |
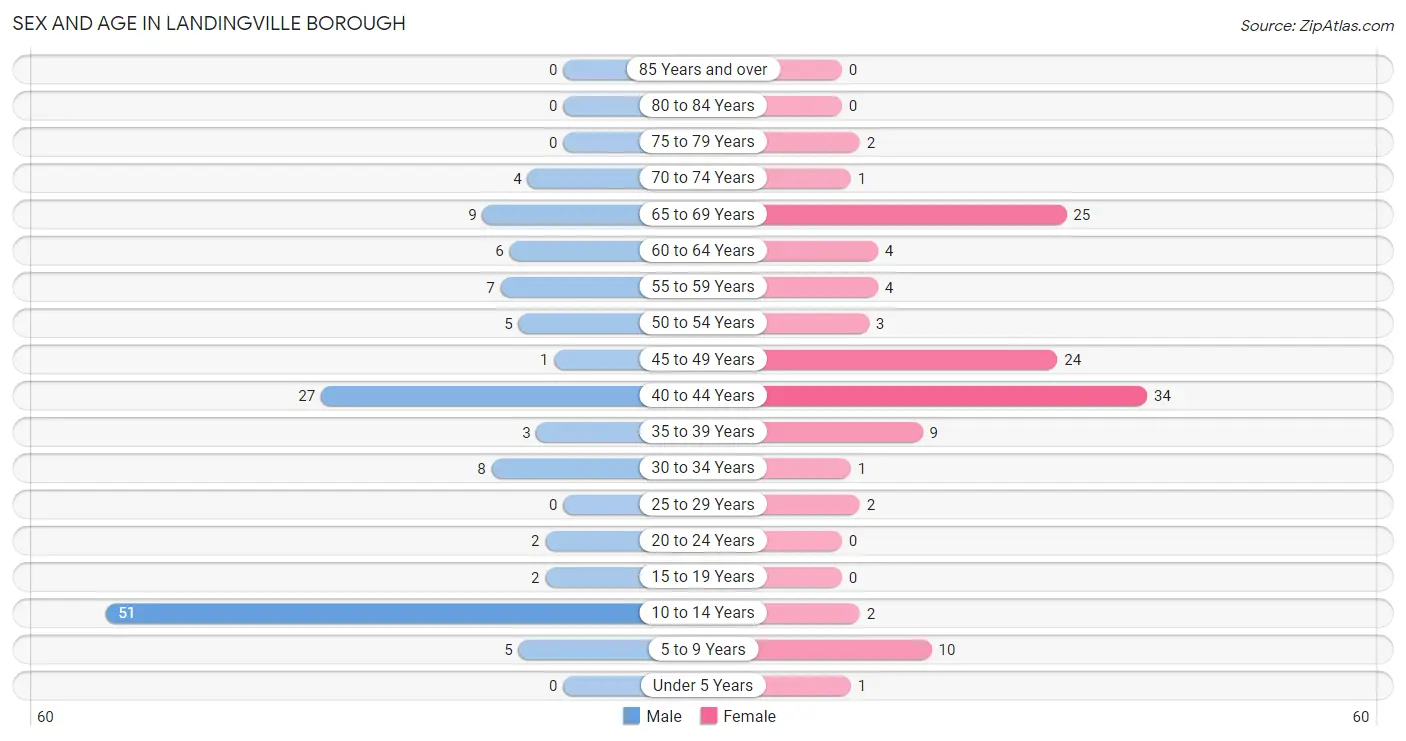
Sex and Age in Landingville borough
Sex and Age in Landingville borough
The most populous age groups in Landingville borough are 10 to 14 Years (51 | 39.2%) for men and 40 to 44 Years (34 | 27.9%) for women.
| Age Bracket | Male | Female |
| Under 5 Years | 0 (0.0%) | 1 (0.8%) |
| 5 to 9 Years | 5 (3.8%) | 10 (8.2%) |
| 10 to 14 Years | 51 (39.2%) | 2 (1.6%) |
| 15 to 19 Years | 2 (1.5%) | 0 (0.0%) |
| 20 to 24 Years | 2 (1.5%) | 0 (0.0%) |
| 25 to 29 Years | 0 (0.0%) | 2 (1.6%) |
| 30 to 34 Years | 8 (6.1%) | 1 (0.8%) |
| 35 to 39 Years | 3 (2.3%) | 9 (7.4%) |
| 40 to 44 Years | 27 (20.8%) | 34 (27.9%) |
| 45 to 49 Years | 1 (0.8%) | 24 (19.7%) |
| 50 to 54 Years | 5 (3.8%) | 3 (2.5%) |
| 55 to 59 Years | 7 (5.4%) | 4 (3.3%) |
| 60 to 64 Years | 6 (4.6%) | 4 (3.3%) |
| 65 to 69 Years | 9 (6.9%) | 25 (20.5%) |
| 70 to 74 Years | 4 (3.1%) | 1 (0.8%) |
| 75 to 79 Years | 0 (0.0%) | 2 (1.6%) |
| 80 to 84 Years | 0 (0.0%) | 0 (0.0%) |
| 85 Years and over | 0 (0.0%) | 0 (0.0%) |
| Total | 130 (100.0%) | 122 (100.0%) |
Families and Households in Landingville borough
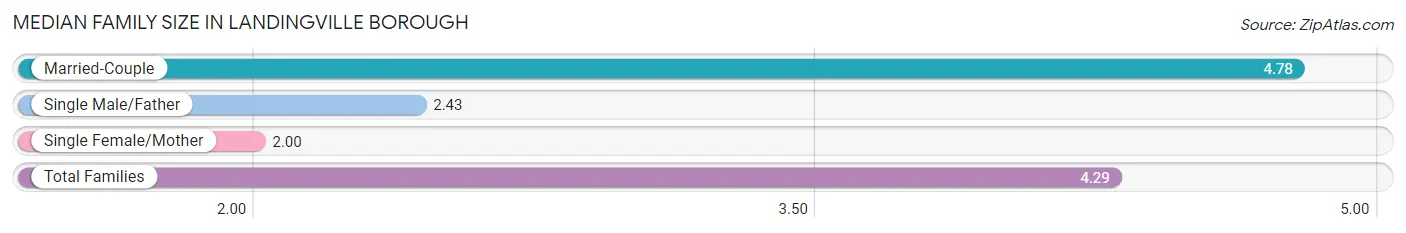
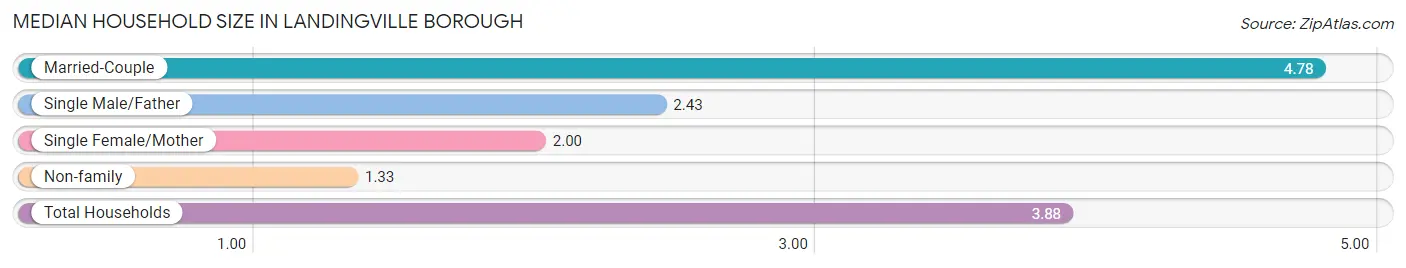
Median Family Size in Landingville borough
The median family size in Landingville borough is 4.29 persons per family, with married-couple families (45 | 80.4%) accounting for the largest median family size of 4.78 persons per family. On the other hand, single female/mother families (4 | 7.1%) represent the smallest median family size with 2.00 persons per family.
| Family Type | # Families | Family Size |
| Married-Couple | 45 (80.4%) | 4.78 |
| Single Male/Father | 7 (12.5%) | 2.43 |
| Single Female/Mother | 4 (7.1%) | 2.00 |
| Total Families | 56 (100.0%) | 4.29 |
Median Household Size in Landingville borough
The median household size in Landingville borough is 3.88 persons per household, with married-couple households (45 | 69.2%) accounting for the largest median household size of 4.78 persons per household. non-family households (9 | 13.9%) represent the smallest median household size with 1.33 persons per household.
| Household Type | # Households | Household Size |
| Married-Couple | 45 (69.2%) | 4.78 |
| Single Male/Father | 7 (10.8%) | 2.43 |
| Single Female/Mother | 4 (6.1%) | 2.00 |
| Non-family | 9 (13.9%) | 1.33 |
| Total Households | 65 (100.0%) | 3.88 |
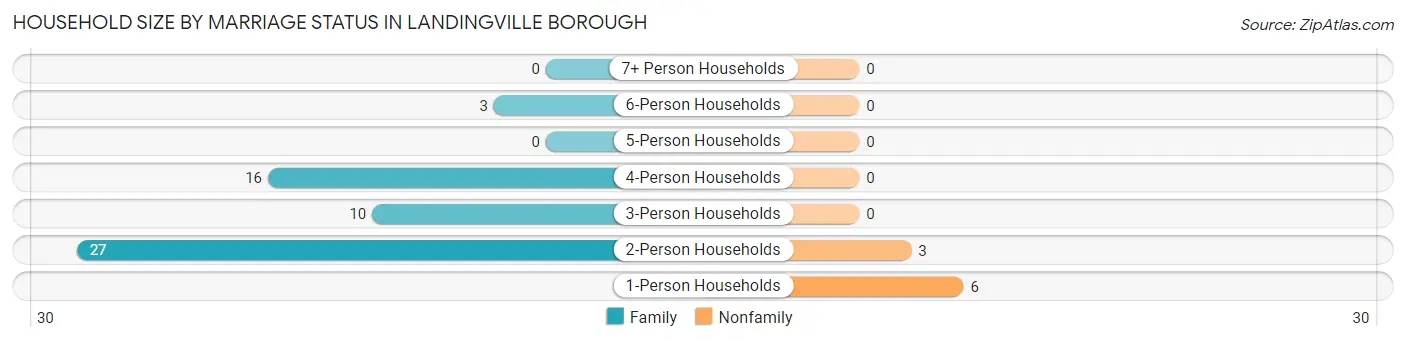
Household Size by Marriage Status in Landingville borough
Out of a total of 65 households in Landingville borough, 56 (86.2%) are family households, while 9 (13.9%) are nonfamily households. The most numerous type of family households are 2-person households, comprising 27, and the most common type of nonfamily households are 1-person households, comprising 6.
| Household Size | Family Households | Nonfamily Households |
| 1-Person Households | - | 6 (9.2%) |
| 2-Person Households | 27 (41.5%) | 3 (4.6%) |
| 3-Person Households | 10 (15.4%) | 0 (0.0%) |
| 4-Person Households | 16 (24.6%) | 0 (0.0%) |
| 5-Person Households | 0 (0.0%) | 0 (0.0%) |
| 6-Person Households | 3 (4.6%) | 0 (0.0%) |
| 7+ Person Households | 0 (0.0%) | 0 (0.0%) |
| Total | 56 (86.2%) | 9 (13.9%) |
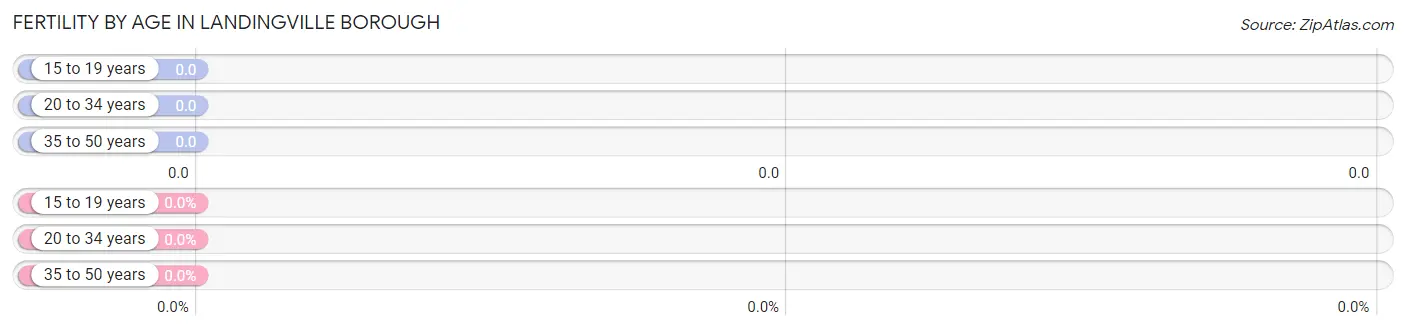
Female Fertility in Landingville borough
Fertility by Age in Landingville borough
| Age Bracket | Women with Births | Births / 1,000 Women |
| 15 to 19 years | 0 (0.0%) | 0.0 |
| 20 to 34 years | 0 (0.0%) | 0.0 |
| 35 to 50 years | 0 (0.0%) | 0.0 |
| Total | 0 (0.0%) | 0.0 |
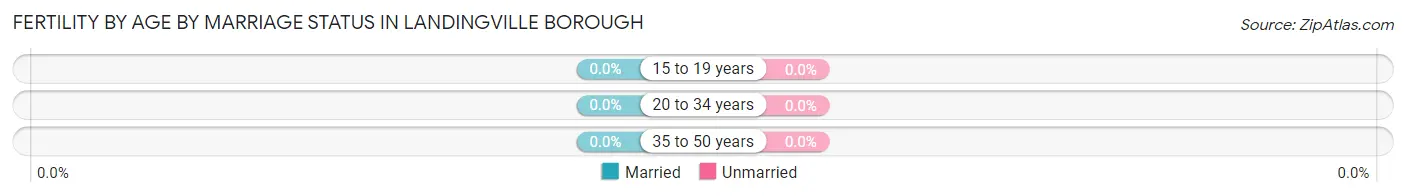
Fertility by Age by Marriage Status in Landingville borough
| Age Bracket | Married | Unmarried |
| 15 to 19 years | 0 (0.0%) | 0 (0.0%) |
| 20 to 34 years | 0 (0.0%) | 0 (0.0%) |
| 35 to 50 years | 0 (0.0%) | 0 (0.0%) |
| Total | 0 (0.0%) | 0 (0.0%) |
Fertility by Education in Landingville borough
| Educational Attainment | Women with Births | Births / 1,000 Women |
| Less than High School | 0 (0.0%) | 0.0 |
| High School Diploma | 0 (0.0%) | 0.0 |
| College or Associate's Degree | 0 (0.0%) | 0.0 |
| Bachelor's Degree | 0 (0.0%) | 0.0 |
| Graduate Degree | 0 (0.0%) | 0.0 |
| Total | 0 (0.0%) | 0.0 |
Fertility by Education by Marriage Status in Landingville borough
| Educational Attainment | Married | Unmarried |
| Less than High School | 0 (0.0%) | 0 (0.0%) |
| High School Diploma | 0 (0.0%) | 0 (0.0%) |
| College or Associate's Degree | 0 (0.0%) | 0 (0.0%) |
| Bachelor's Degree | 0 (0.0%) | 0 (0.0%) |
| Graduate Degree | 0 (0.0%) | 0 (0.0%) |
| Total | 0 (0.0%) | 0 (0.0%) |
Income in Landingville borough
Income Overview in Landingville borough
Per Capita Income in Landingville borough is $25,941, while median incomes of families and households are $97,500 and $84,063 respectively.
| Characteristic | Number | Measure |
| Per Capita Income | 252 | $25,941 |
| Median Family Income | 56 | $97,500 |
| Mean Family Income | 56 | $96,725 |
| Median Household Income | 65 | $84,063 |
| Mean Household Income | 65 | $90,100 |
| Income Deficit | 56 | $1,640 |
| Wage / Income Gap (%) | 252 | 13.19% |
| Wage / Income Gap ($) | 252 | 86.81¢ per $1 |
| Gini / Inequality Index | 252 | 0.36 |
Earnings by Sex in Landingville borough
Average Earnings in Landingville borough are $56,250, $56,875 for men and $49,375 for women, a difference of 13.2%.
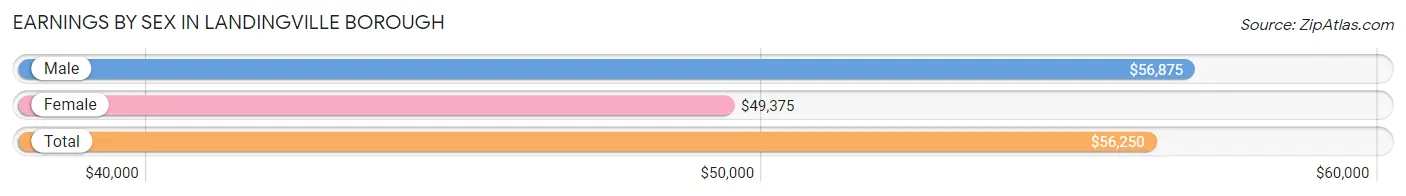
| Sex | Number | Average Earnings |
| Male | 51 (50.0%) | $56,875 |
| Female | 51 (50.0%) | $49,375 |
| Total | 102 (100.0%) | $56,250 |
Earnings by Sex by Income Bracket in Landingville borough
The most common earnings brackets in Landingville borough are $55,000 to $64,999 for men (22 | 43.1%) and $65,000 to $74,999 for women (16 | 31.4%).
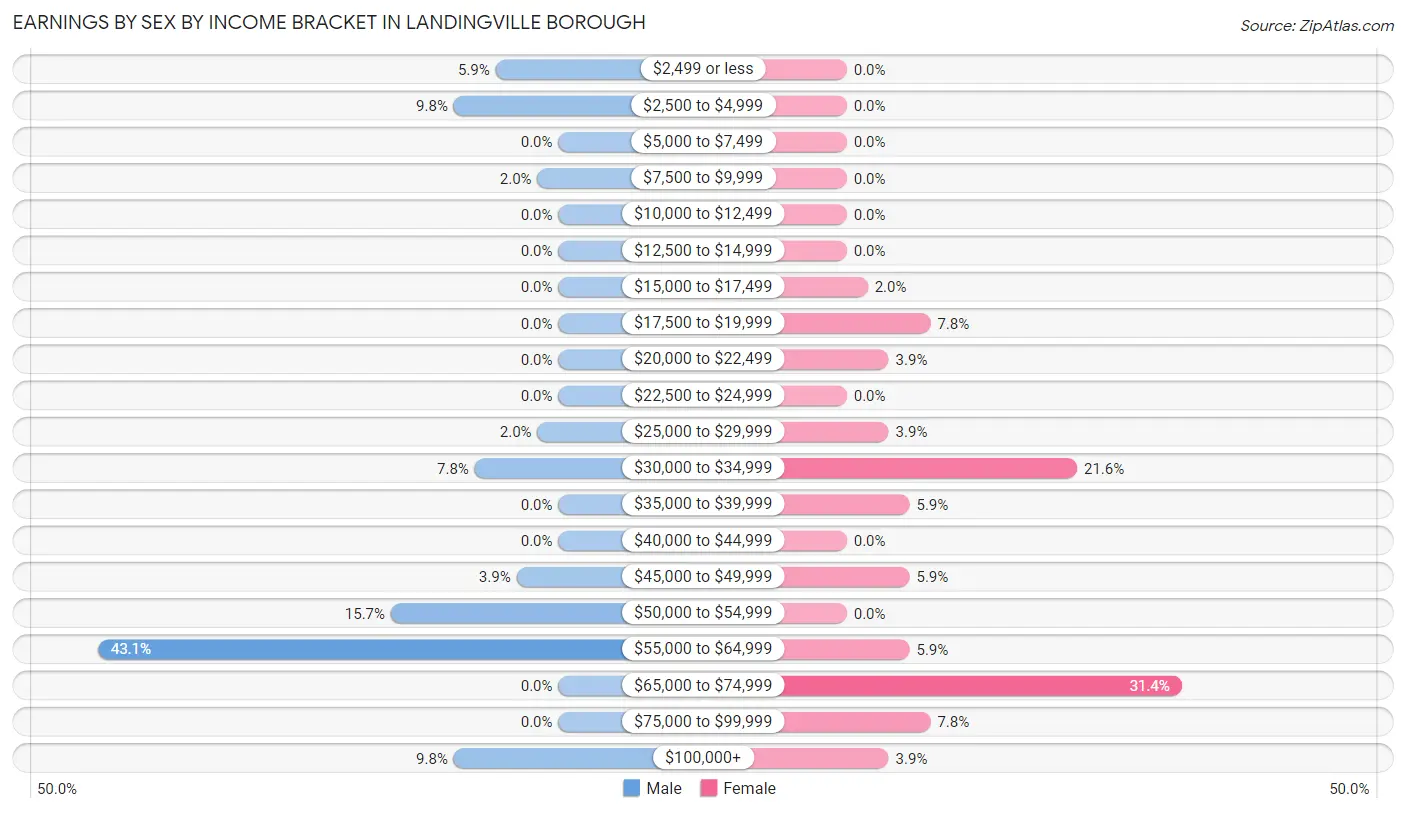
| Income | Male | Female |
| $2,499 or less | 3 (5.9%) | 0 (0.0%) |
| $2,500 to $4,999 | 5 (9.8%) | 0 (0.0%) |
| $5,000 to $7,499 | 0 (0.0%) | 0 (0.0%) |
| $7,500 to $9,999 | 1 (2.0%) | 0 (0.0%) |
| $10,000 to $12,499 | 0 (0.0%) | 0 (0.0%) |
| $12,500 to $14,999 | 0 (0.0%) | 0 (0.0%) |
| $15,000 to $17,499 | 0 (0.0%) | 1 (2.0%) |
| $17,500 to $19,999 | 0 (0.0%) | 4 (7.8%) |
| $20,000 to $22,499 | 0 (0.0%) | 2 (3.9%) |
| $22,500 to $24,999 | 0 (0.0%) | 0 (0.0%) |
| $25,000 to $29,999 | 1 (2.0%) | 2 (3.9%) |
| $30,000 to $34,999 | 4 (7.8%) | 11 (21.6%) |
| $35,000 to $39,999 | 0 (0.0%) | 3 (5.9%) |
| $40,000 to $44,999 | 0 (0.0%) | 0 (0.0%) |
| $45,000 to $49,999 | 2 (3.9%) | 3 (5.9%) |
| $50,000 to $54,999 | 8 (15.7%) | 0 (0.0%) |
| $55,000 to $64,999 | 22 (43.1%) | 3 (5.9%) |
| $65,000 to $74,999 | 0 (0.0%) | 16 (31.4%) |
| $75,000 to $99,999 | 0 (0.0%) | 4 (7.8%) |
| $100,000+ | 5 (9.8%) | 2 (3.9%) |
| Total | 51 (100.0%) | 51 (100.0%) |
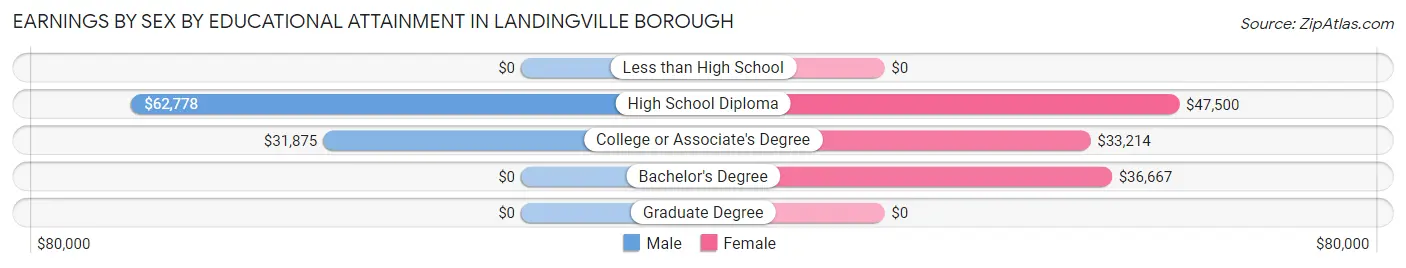
Earnings by Sex by Educational Attainment in Landingville borough
Average earnings in Landingville borough are $58,125 for men and $49,375 for women, a difference of 15.0%. Men with an educational attainment of high school diploma enjoy the highest average annual earnings of $62,778, while those with college or associate's degree education earn the least with $31,875. Women with an educational attainment of high school diploma earn the most with the average annual earnings of $47,500, while those with college or associate's degree education have the smallest earnings of $33,214.
| Educational Attainment | Male Income | Female Income |
| Less than High School | - | - |
| High School Diploma | $62,778 | $47,500 |
| College or Associate's Degree | $31,875 | $33,214 |
| Bachelor's Degree | - | - |
| Graduate Degree | - | - |
| Total | $58,125 | $49,375 |
Family Income in Landingville borough
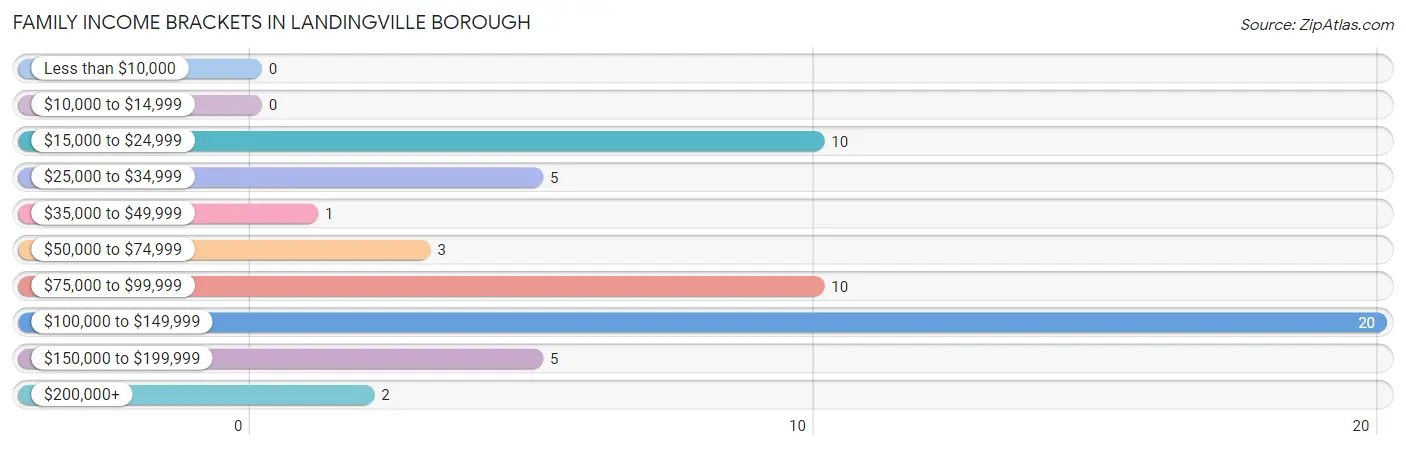
Family Income Brackets in Landingville borough
According to the Landingville borough family income data, there are 20 families falling into the $100,000 to $149,999 income range, which is the most common income bracket and makes up 35.7% of all families.
| Income Bracket | # Families | % Families |
| Less than $10,000 | 0 | 0.0% |
| $10,000 to $14,999 | 0 | 0.0% |
| $15,000 to $24,999 | 10 | 17.9% |
| $25,000 to $34,999 | 5 | 8.9% |
| $35,000 to $49,999 | 1 | 1.8% |
| $50,000 to $74,999 | 3 | 5.4% |
| $75,000 to $99,999 | 10 | 17.9% |
| $100,000 to $149,999 | 20 | 35.7% |
| $150,000 to $199,999 | 5 | 8.9% |
| $200,000+ | 2 | 3.6% |
Family Income by Famaliy Size in Landingville borough
| Income Bracket | # Families | Median Income |
| 2-Person Families | 27 (48.2%) | $0 |
| 3-Person Families | 10 (17.9%) | $0 |
| 4-Person Families | 16 (28.6%) | $0 |
| 5-Person Families | 0 (0.0%) | $0 |
| 6-Person Families | 3 (5.4%) | $0 |
| 7+ Person Families | 0 (0.0%) | $0 |
| Total | 56 (100.0%) | $97,500 |
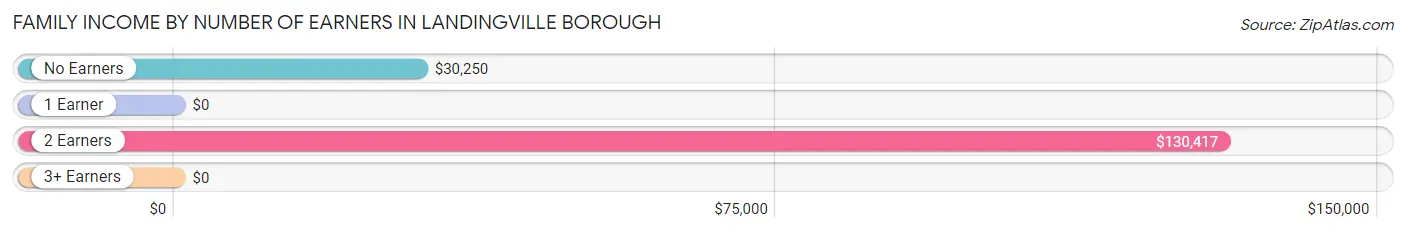
Family Income by Number of Earners in Landingville borough
| Number of Earners | # Families | Median Income |
| No Earners | 9 (16.1%) | $30,250 |
| 1 Earner | 6 (10.7%) | $0 |
| 2 Earners | 39 (69.6%) | $130,417 |
| 3+ Earners | 2 (3.6%) | $0 |
| Total | 56 (100.0%) | $97,500 |
Household Income in Landingville borough
Household Income Brackets in Landingville borough
With 20 households falling in the category, the $100,000 to $149,999 income range is the most frequent in Landingville borough, accounting for 30.8% of all households.
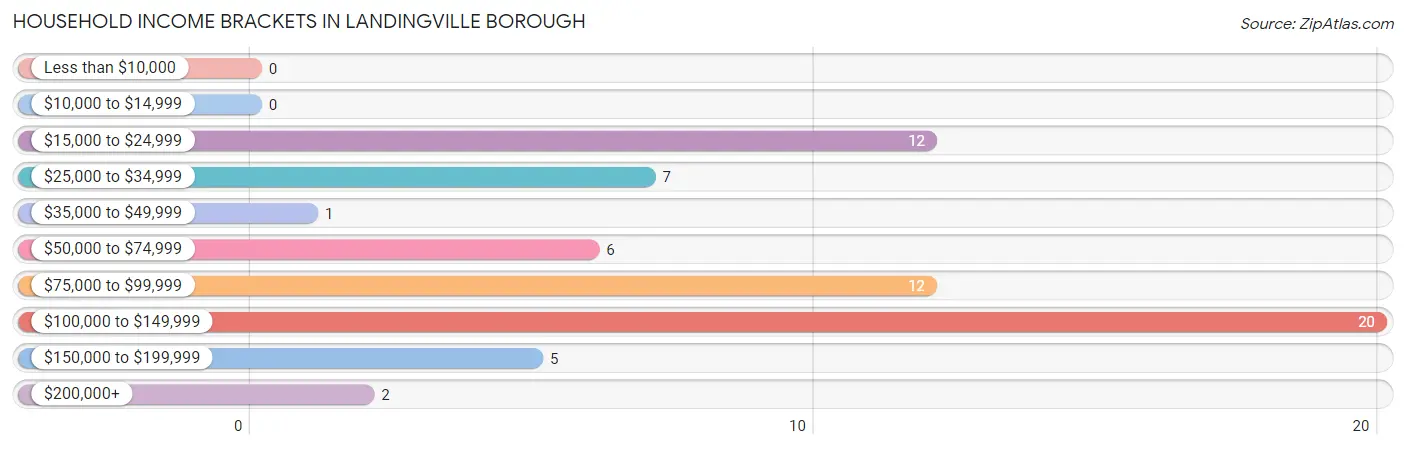
| Income Bracket | # Households | % Households |
| Less than $10,000 | 0 | 0.0% |
| $10,000 to $14,999 | 0 | 0.0% |
| $15,000 to $24,999 | 12 | 18.5% |
| $25,000 to $34,999 | 7 | 10.8% |
| $35,000 to $49,999 | 1 | 1.5% |
| $50,000 to $74,999 | 6 | 9.2% |
| $75,000 to $99,999 | 12 | 18.5% |
| $100,000 to $149,999 | 20 | 30.8% |
| $150,000 to $199,999 | 5 | 7.7% |
| $200,000+ | 2 | 3.1% |
Household Income by Householder Age in Landingville borough
The median household income in Landingville borough is $84,063, with the highest median household income of $108,125 found in the 45 to 64 years age bracket for the primary householder. A total of 37 households (56.9%) fall into this category.
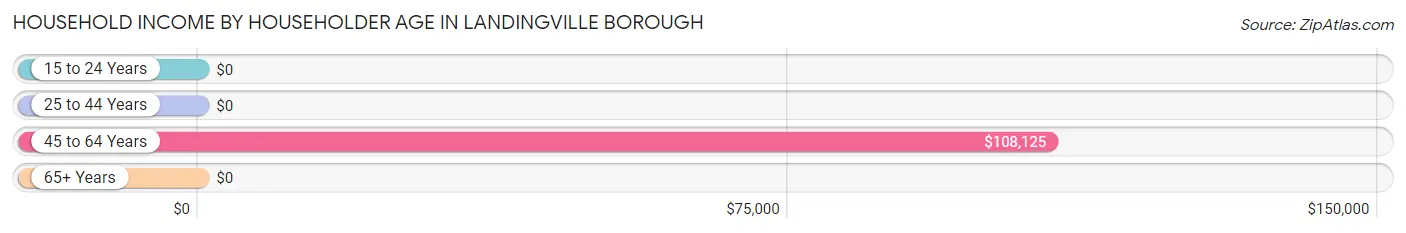
| Income Bracket | # Households | Median Income |
| 15 to 24 Years | 0 (0.0%) | $0 |
| 25 to 44 Years | 16 (24.6%) | $0 |
| 45 to 64 Years | 37 (56.9%) | $108,125 |
| 65+ Years | 12 (18.5%) | $0 |
| Total | 65 (100.0%) | $84,063 |
Poverty in Landingville borough
Income Below Poverty by Sex and Age in Landingville borough
With 6.1% poverty level for males and 44.3% for females among the residents of Landingville borough, 18 to 24 year old males and 65 to 74 year old females are the most vulnerable to poverty, with 2 males (50.0%) and 25 females (96.2%) in their respective age groups living below the poverty level.
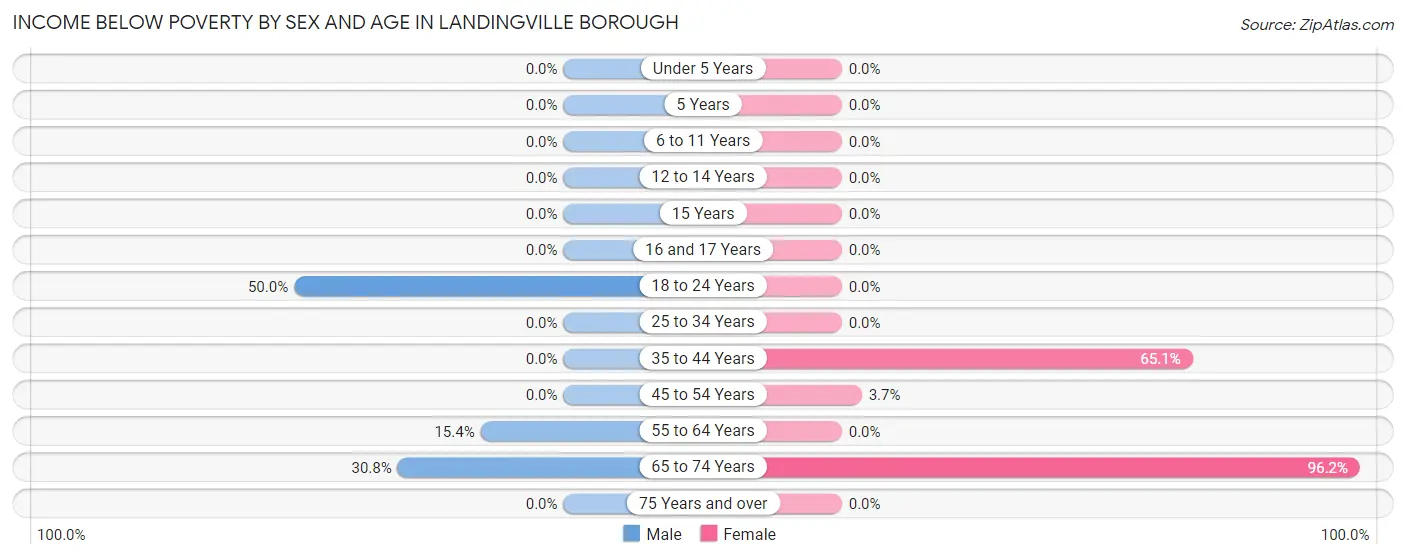
| Age Bracket | Male | Female |
| Under 5 Years | 0 (0.0%) | 0 (0.0%) |
| 5 Years | 0 (0.0%) | 0 (0.0%) |
| 6 to 11 Years | 0 (0.0%) | 0 (0.0%) |
| 12 to 14 Years | 0 (0.0%) | 0 (0.0%) |
| 15 Years | 0 (0.0%) | 0 (0.0%) |
| 16 and 17 Years | 0 (0.0%) | 0 (0.0%) |
| 18 to 24 Years | 2 (50.0%) | 0 (0.0%) |
| 25 to 34 Years | 0 (0.0%) | 0 (0.0%) |
| 35 to 44 Years | 0 (0.0%) | 28 (65.1%) |
| 45 to 54 Years | 0 (0.0%) | 1 (3.7%) |
| 55 to 64 Years | 2 (15.4%) | 0 (0.0%) |
| 65 to 74 Years | 4 (30.8%) | 25 (96.2%) |
| 75 Years and over | 0 (0.0%) | 0 (0.0%) |
| Total | 8 (6.1%) | 54 (44.3%) |
Income Above Poverty by Sex and Age in Landingville borough
According to the poverty statistics in Landingville borough, males aged 5 years and females aged under 5 years are the age groups that are most secure financially, with 100.0% of males and 100.0% of females in these age groups living above the poverty line.
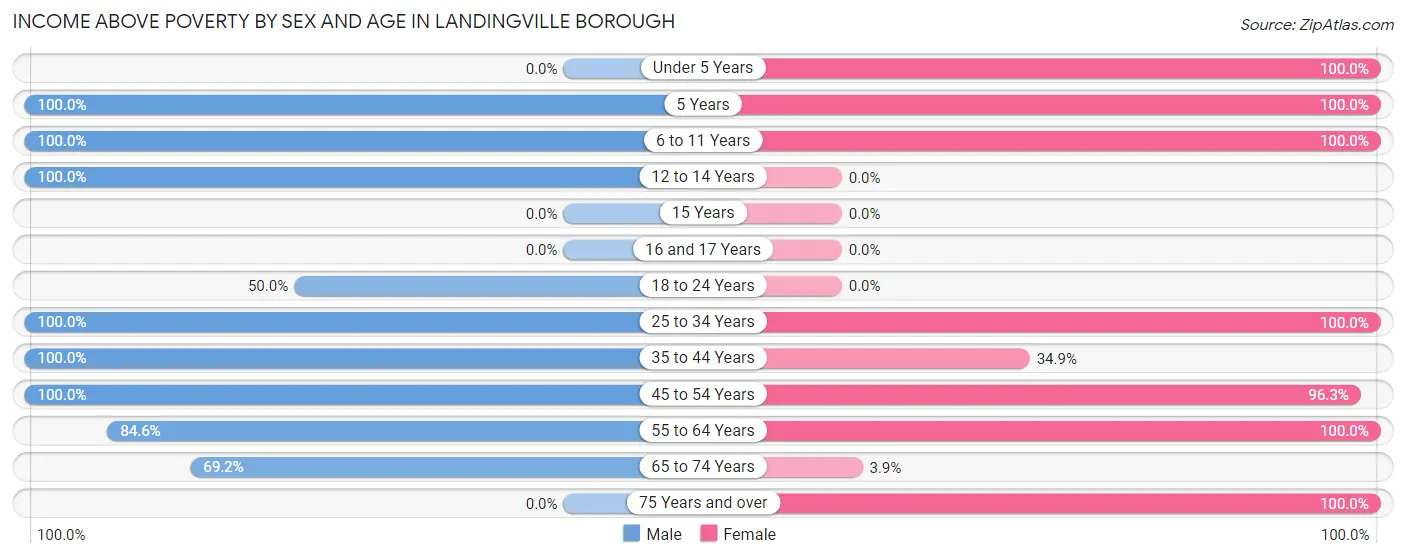
| Age Bracket | Male | Female |
| Under 5 Years | 0 (0.0%) | 1 (100.0%) |
| 5 Years | 4 (100.0%) | 3 (100.0%) |
| 6 to 11 Years | 28 (100.0%) | 9 (100.0%) |
| 12 to 14 Years | 24 (100.0%) | 0 (0.0%) |
| 15 Years | 0 (0.0%) | 0 (0.0%) |
| 16 and 17 Years | 0 (0.0%) | 0 (0.0%) |
| 18 to 24 Years | 2 (50.0%) | 0 (0.0%) |
| 25 to 34 Years | 8 (100.0%) | 3 (100.0%) |
| 35 to 44 Years | 30 (100.0%) | 15 (34.9%) |
| 45 to 54 Years | 6 (100.0%) | 26 (96.3%) |
| 55 to 64 Years | 11 (84.6%) | 8 (100.0%) |
| 65 to 74 Years | 9 (69.2%) | 1 (3.8%) |
| 75 Years and over | 0 (0.0%) | 2 (100.0%) |
| Total | 122 (93.9%) | 68 (55.7%) |
Income Below Poverty Among Married-Couple Families in Landingville borough
The poverty statistics for married-couple families in Landingville borough show that 11.1% or 5 of the total 45 families live below the poverty line. Families with no children have the highest poverty rate of 20.8%, comprising of 5 families. On the other hand, families with 1 or 2 children have the lowest poverty rate of 0.0%, which includes 0 families.
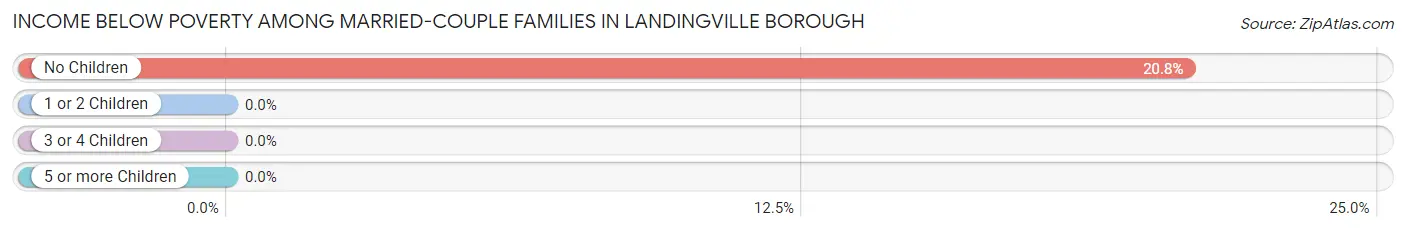
| Children | Above Poverty | Below Poverty |
| No Children | 19 (79.2%) | 5 (20.8%) |
| 1 or 2 Children | 18 (100.0%) | 0 (0.0%) |
| 3 or 4 Children | 3 (100.0%) | 0 (0.0%) |
| 5 or more Children | 0 (0.0%) | 0 (0.0%) |
| Total | 40 (88.9%) | 5 (11.1%) |
Income Below Poverty Among Single-Parent Households in Landingville borough
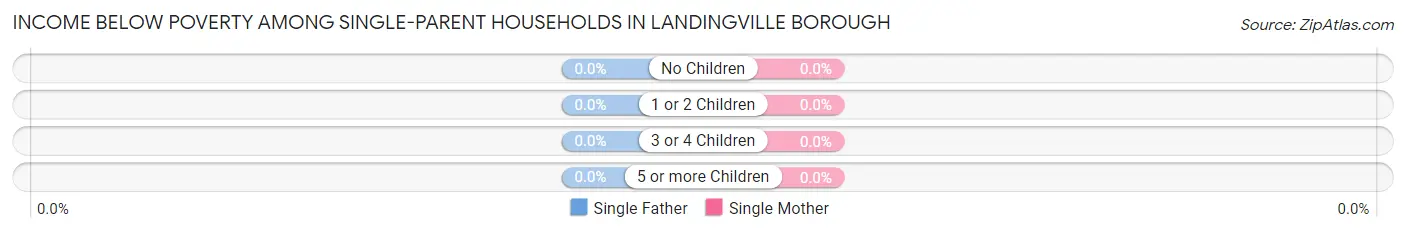
| Children | Single Father | Single Mother |
| No Children | 0 (0.0%) | 0 (0.0%) |
| 1 or 2 Children | 0 (0.0%) | 0 (0.0%) |
| 3 or 4 Children | 0 (0.0%) | 0 (0.0%) |
| 5 or more Children | 0 (0.0%) | 0 (0.0%) |
| Total | 0 (0.0%) | 0 (0.0%) |
Income Below Poverty Among Married-Couple vs Single-Parent Households in Landingville borough
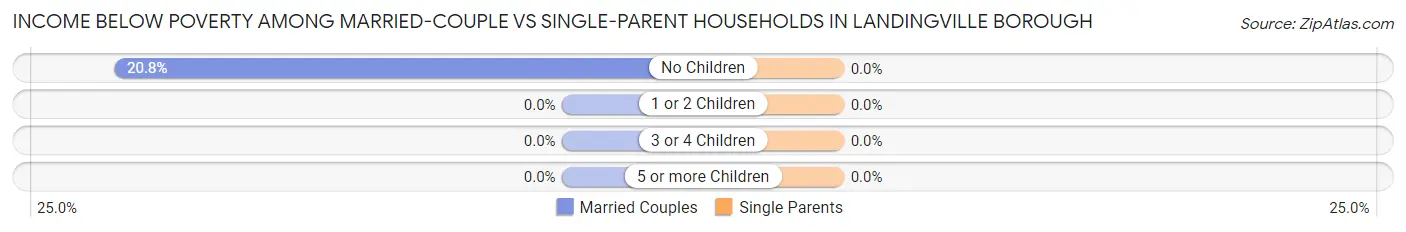
| Children | Married-Couple Families | Single-Parent Households |
| No Children | 5 (20.8%) | 0 (0.0%) |
| 1 or 2 Children | 0 (0.0%) | 0 (0.0%) |
| 3 or 4 Children | 0 (0.0%) | 0 (0.0%) |
| 5 or more Children | 0 (0.0%) | 0 (0.0%) |
| Total | 5 (11.1%) | 0 (0.0%) |
Employment Characteristics in Landingville borough
Employment by Class of Employer in Landingville borough
Among the 92 employed individuals in Landingville borough, private company employees (56 | 60.9%), local government employees (22 | 23.9%), and not-for-profit organizations (8 | 8.7%) make up the most common classes of employment.
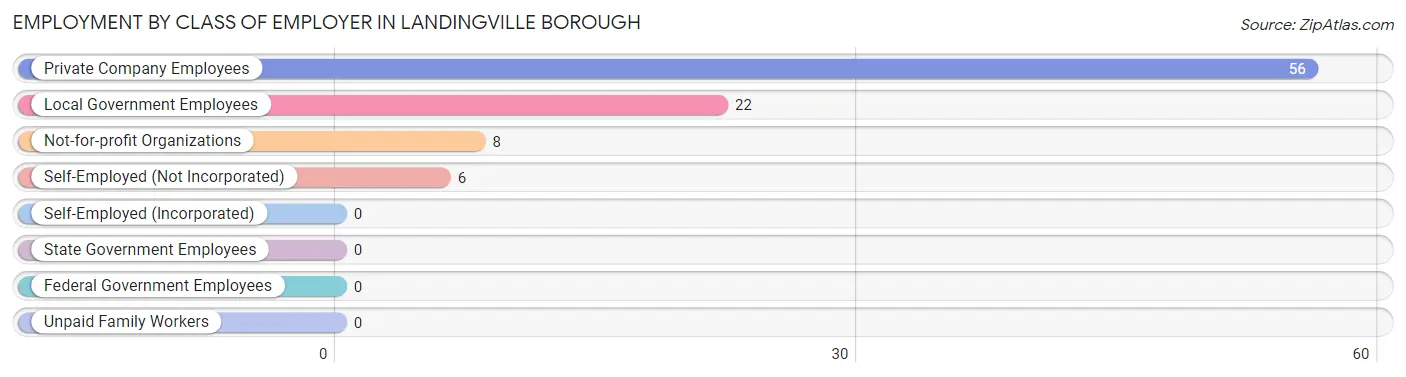
| Employer Class | # Employees | % Employees |
| Private Company Employees | 56 | 60.9% |
| Self-Employed (Incorporated) | 0 | 0.0% |
| Self-Employed (Not Incorporated) | 6 | 6.5% |
| Not-for-profit Organizations | 8 | 8.7% |
| Local Government Employees | 22 | 23.9% |
| State Government Employees | 0 | 0.0% |
| Federal Government Employees | 0 | 0.0% |
| Unpaid Family Workers | 0 | 0.0% |
| Total | 92 | 100.0% |
Employment Status by Age in Landingville borough
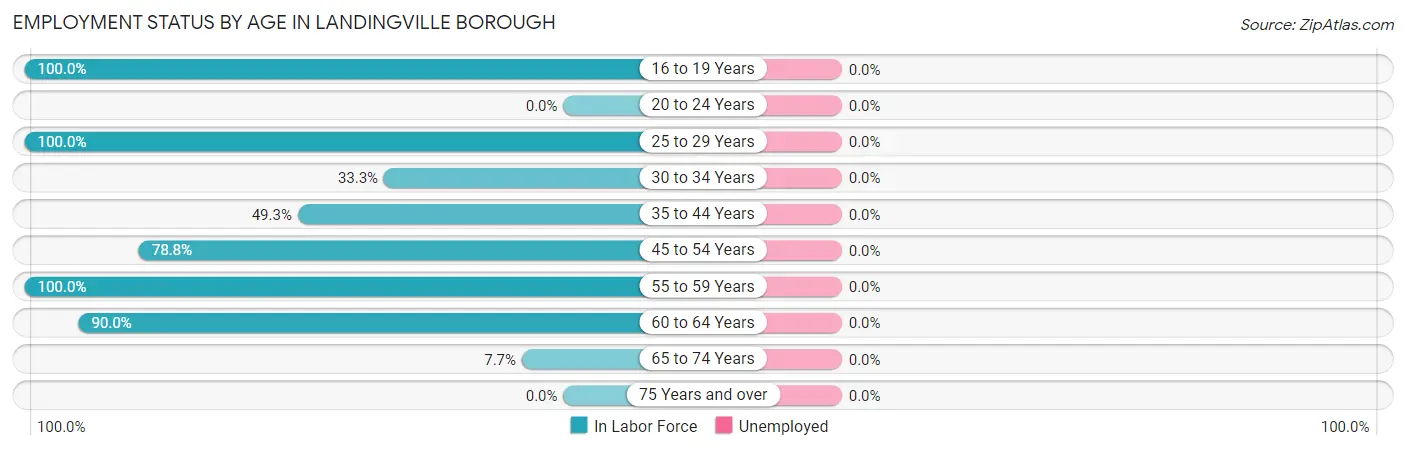
| Age Bracket | In Labor Force | Unemployed |
| 16 to 19 Years | 2 (100.0%) | 0 (0.0%) |
| 20 to 24 Years | 0 (0.0%) | 0 (0.0%) |
| 25 to 29 Years | 2 (100.0%) | 0 (0.0%) |
| 30 to 34 Years | 3 (33.3%) | 0 (0.0%) |
| 35 to 44 Years | 36 (49.3%) | 0 (0.0%) |
| 45 to 54 Years | 26 (78.8%) | 0 (0.0%) |
| 55 to 59 Years | 11 (100.0%) | 0 (0.0%) |
| 60 to 64 Years | 9 (90.0%) | 0 (0.0%) |
| 65 to 74 Years | 3 (7.7%) | 0 (0.0%) |
| 75 Years and over | 0 (0.0%) | 0 (0.0%) |
| Total | 92 (50.3%) | 0 (0.0%) |
Employment Status by Educational Attainment in Landingville borough
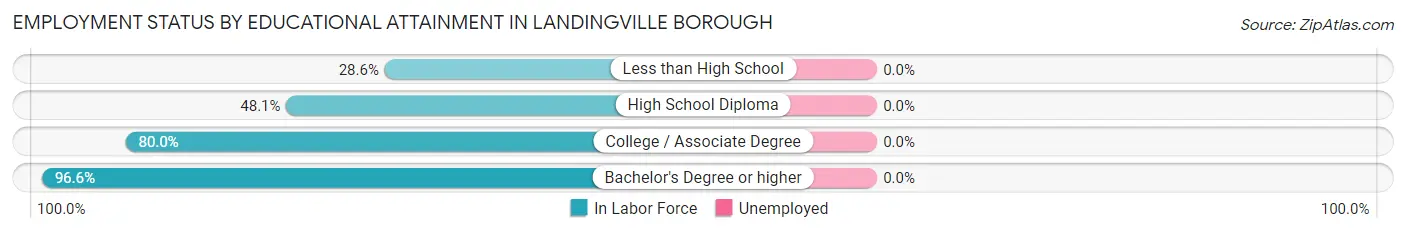
| Educational Attainment | In Labor Force | Unemployed |
| Less than High School | 2 (28.6%) | 0 (0.0%) |
| High School Diploma | 37 (48.1%) | 0 (0.0%) |
| College / Associate Degree | 20 (80.0%) | 0 (0.0%) |
| Bachelor's Degree or higher | 28 (96.6%) | 0 (0.0%) |
| Total | 87 (63.0%) | 0 (0.0%) |
Employment Occupations by Sex in Landingville borough
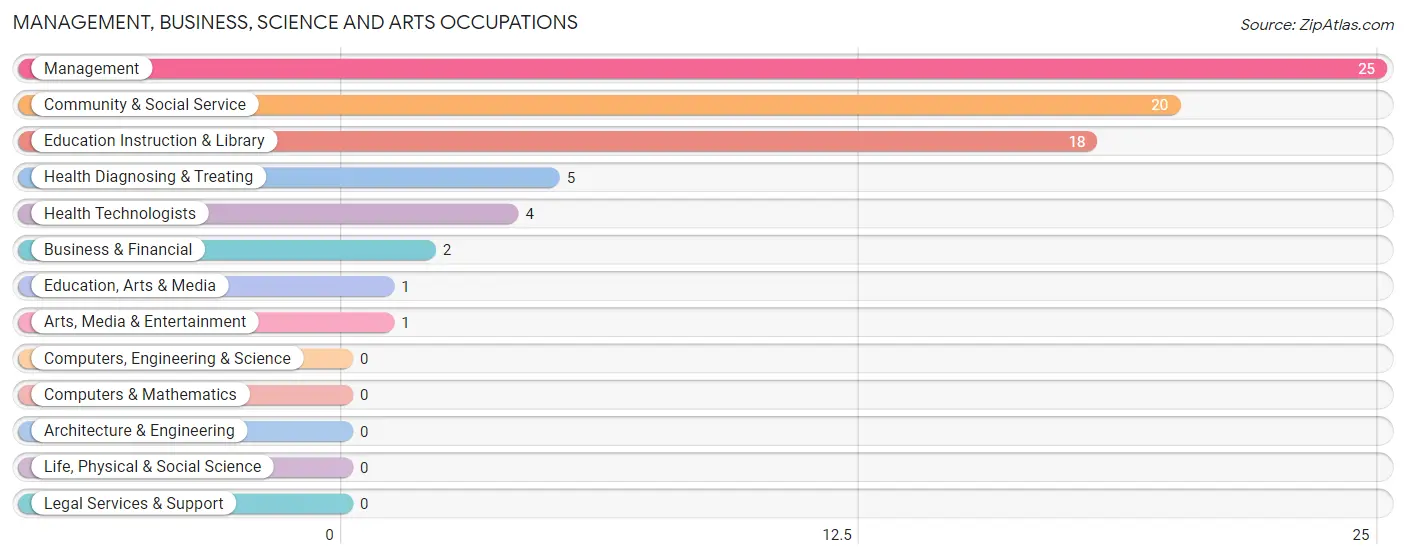
Management, Business, Science and Arts Occupations
The most common Management, Business, Science and Arts occupations in Landingville borough are Management (25 | 27.2%), Community & Social Service (20 | 21.7%), Education Instruction & Library (18 | 19.6%), Health Diagnosing & Treating (5 | 5.4%), and Health Technologists (4 | 4.3%).
Management, Business, Science and Arts Occupations by Sex
Within the Management, Business, Science and Arts occupations in Landingville borough, the most male-oriented occupations are Business & Financial (100.0%), Education, Arts & Media (100.0%), and Arts, Media & Entertainment (100.0%), while the most female-oriented occupations are Education Instruction & Library (100.0%), Health Diagnosing & Treating (100.0%), and Health Technologists (100.0%).
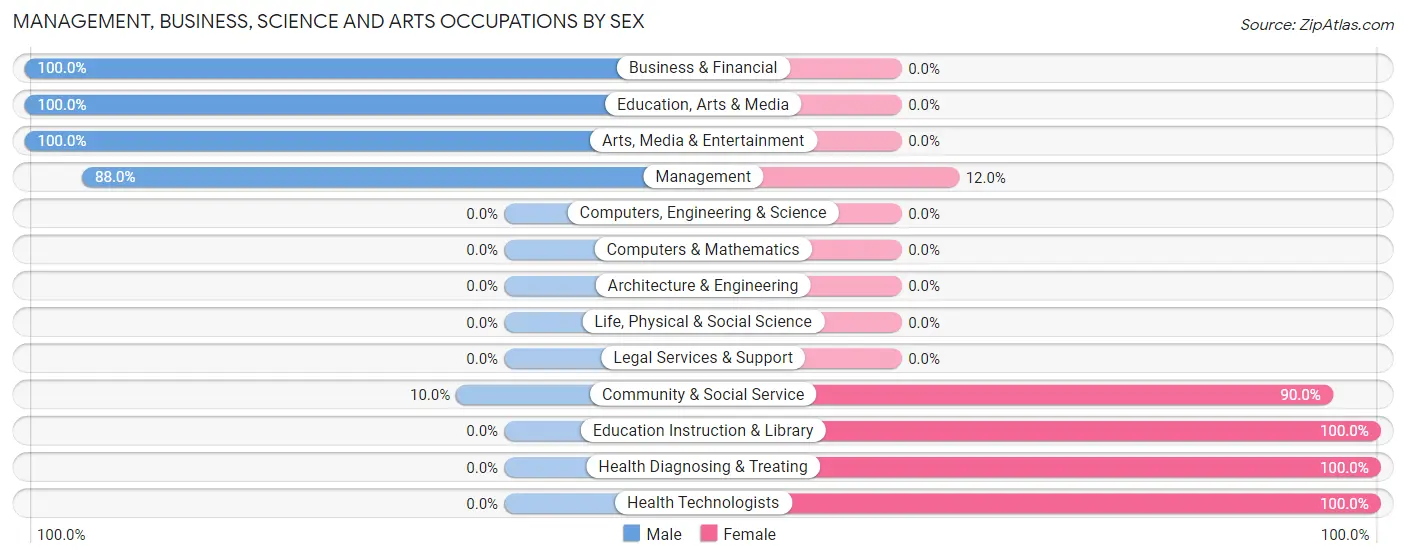
| Occupation | Male | Female |
| Management | 22 (88.0%) | 3 (12.0%) |
| Business & Financial | 2 (100.0%) | 0 (0.0%) |
| Computers, Engineering & Science | 0 (0.0%) | 0 (0.0%) |
| Computers & Mathematics | 0 (0.0%) | 0 (0.0%) |
| Architecture & Engineering | 0 (0.0%) | 0 (0.0%) |
| Life, Physical & Social Science | 0 (0.0%) | 0 (0.0%) |
| Community & Social Service | 2 (10.0%) | 18 (90.0%) |
| Education, Arts & Media | 1 (100.0%) | 0 (0.0%) |
| Legal Services & Support | 0 (0.0%) | 0 (0.0%) |
| Education Instruction & Library | 0 (0.0%) | 18 (100.0%) |
| Arts, Media & Entertainment | 1 (100.0%) | 0 (0.0%) |
| Health Diagnosing & Treating | 0 (0.0%) | 5 (100.0%) |
| Health Technologists | 0 (0.0%) | 4 (100.0%) |
| Total (Category) | 26 (50.0%) | 26 (50.0%) |
| Total (Overall) | 45 (48.9%) | 47 (51.1%) |
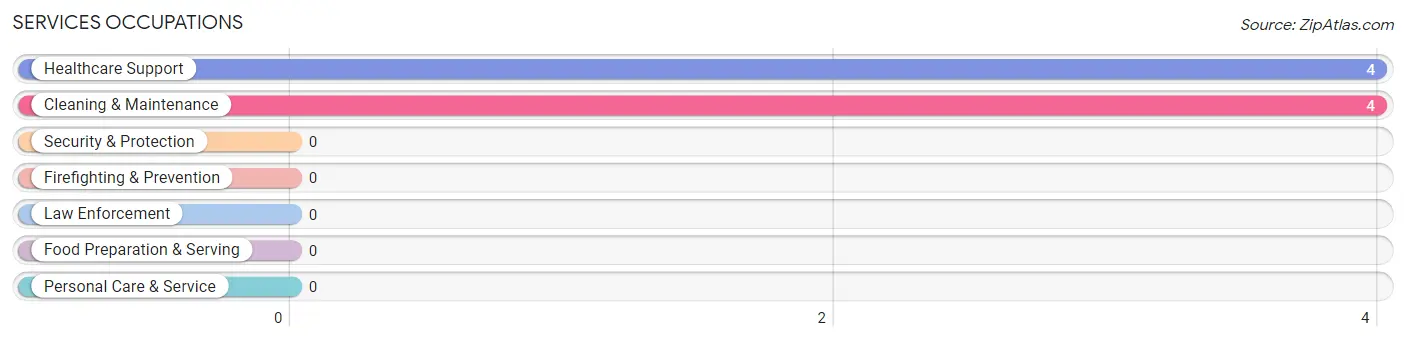
Services Occupations
The most common Services occupations in Landingville borough are Healthcare Support (4 | 4.3%), and Cleaning & Maintenance (4 | 4.3%).
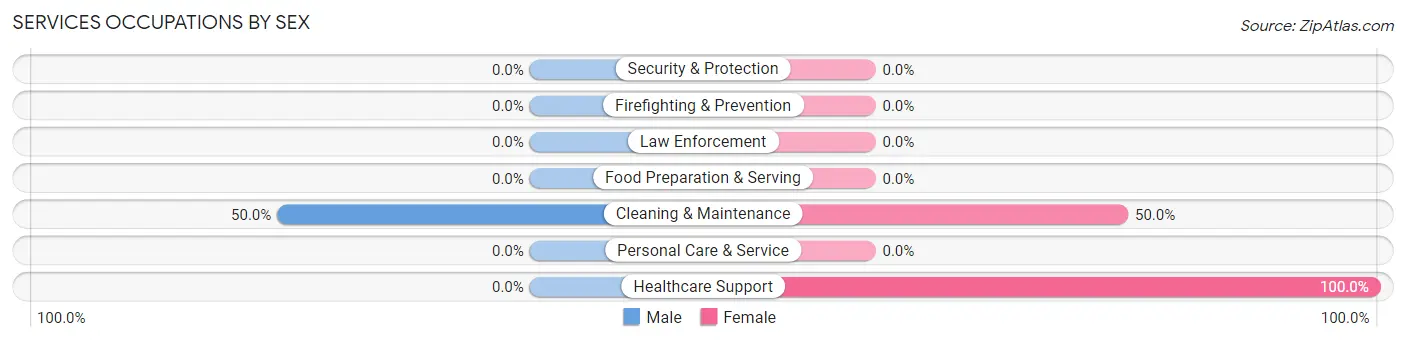
Services Occupations by Sex
| Occupation | Male | Female |
| Healthcare Support | 0 (0.0%) | 4 (100.0%) |
| Security & Protection | 0 (0.0%) | 0 (0.0%) |
| Firefighting & Prevention | 0 (0.0%) | 0 (0.0%) |
| Law Enforcement | 0 (0.0%) | 0 (0.0%) |
| Food Preparation & Serving | 0 (0.0%) | 0 (0.0%) |
| Cleaning & Maintenance | 2 (50.0%) | 2 (50.0%) |
| Personal Care & Service | 0 (0.0%) | 0 (0.0%) |
| Total (Category) | 2 (25.0%) | 6 (75.0%) |
| Total (Overall) | 45 (48.9%) | 47 (51.1%) |
Sales and Office Occupations
The most common Sales and Office occupations in Landingville borough are Office & Administration (11 | 12.0%), and Sales & Related (5 | 5.4%).

Sales and Office Occupations by Sex

| Occupation | Male | Female |
| Sales & Related | 3 (60.0%) | 2 (40.0%) |
| Office & Administration | 0 (0.0%) | 11 (100.0%) |
| Total (Category) | 3 (18.8%) | 13 (81.2%) |
| Total (Overall) | 45 (48.9%) | 47 (51.1%) |
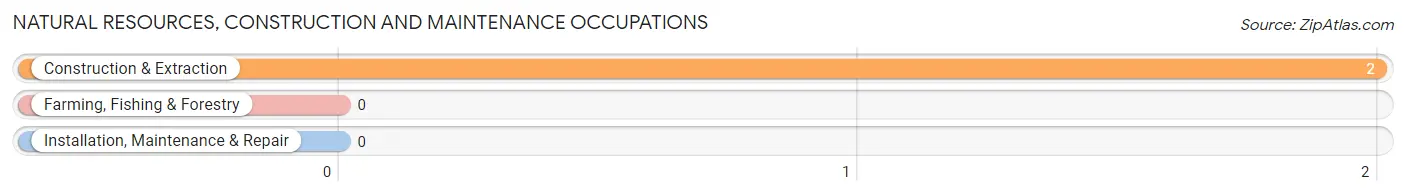
Natural Resources, Construction and Maintenance Occupations
The most common Natural Resources, Construction and Maintenance occupations in Landingville borough are , and Construction & Extraction (2 | 2.2%).
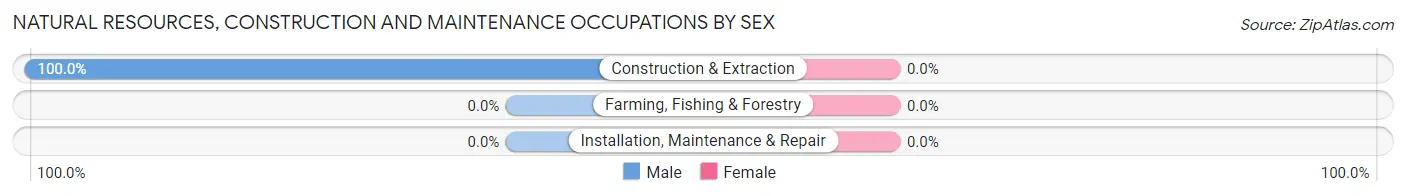
Natural Resources, Construction and Maintenance Occupations by Sex
| Occupation | Male | Female |
| Farming, Fishing & Forestry | 0 (0.0%) | 0 (0.0%) |
| Construction & Extraction | 2 (100.0%) | 0 (0.0%) |
| Installation, Maintenance & Repair | 0 (0.0%) | 0 (0.0%) |
| Total (Category) | 2 (100.0%) | 0 (0.0%) |
| Total (Overall) | 45 (48.9%) | 47 (51.1%) |
Production, Transportation and Moving Occupations
The most common Production, Transportation and Moving occupations in Landingville borough are Transportation (6 | 6.5%), Production (4 | 4.3%), and Material Moving (4 | 4.3%).
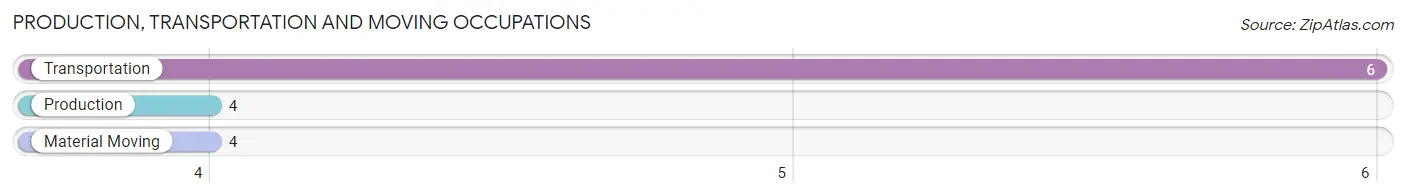
Production, Transportation and Moving Occupations by Sex
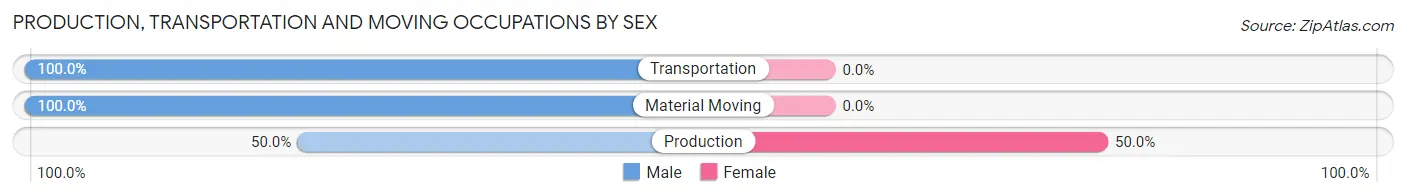
| Occupation | Male | Female |
| Production | 2 (50.0%) | 2 (50.0%) |
| Transportation | 6 (100.0%) | 0 (0.0%) |
| Material Moving | 4 (100.0%) | 0 (0.0%) |
| Total (Category) | 12 (85.7%) | 2 (14.3%) |
| Total (Overall) | 45 (48.9%) | 47 (51.1%) |
Employment Industries by Sex in Landingville borough
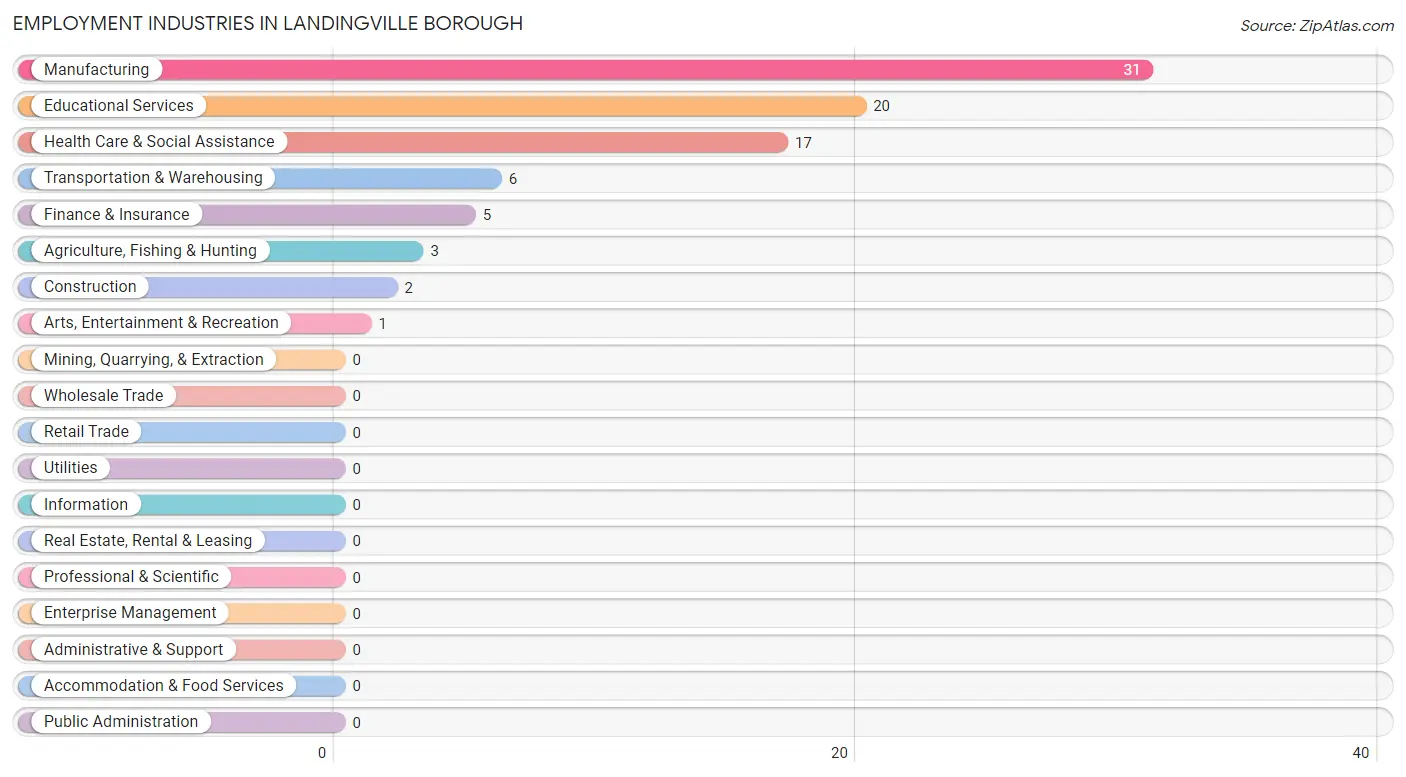
Employment Industries in Landingville borough
The major employment industries in Landingville borough include Manufacturing (31 | 33.7%), Educational Services (20 | 21.7%), Health Care & Social Assistance (17 | 18.5%), Transportation & Warehousing (6 | 6.5%), and Finance & Insurance (5 | 5.4%).
Employment Industries by Sex in Landingville borough
The Landingville borough industries that see more men than women are Construction (100.0%), Arts, Entertainment & Recreation (100.0%), and Manufacturing (93.5%), whereas the industries that tend to have a higher number of women are Educational Services (100.0%), Health Care & Social Assistance (100.0%), and Finance & Insurance (60.0%).
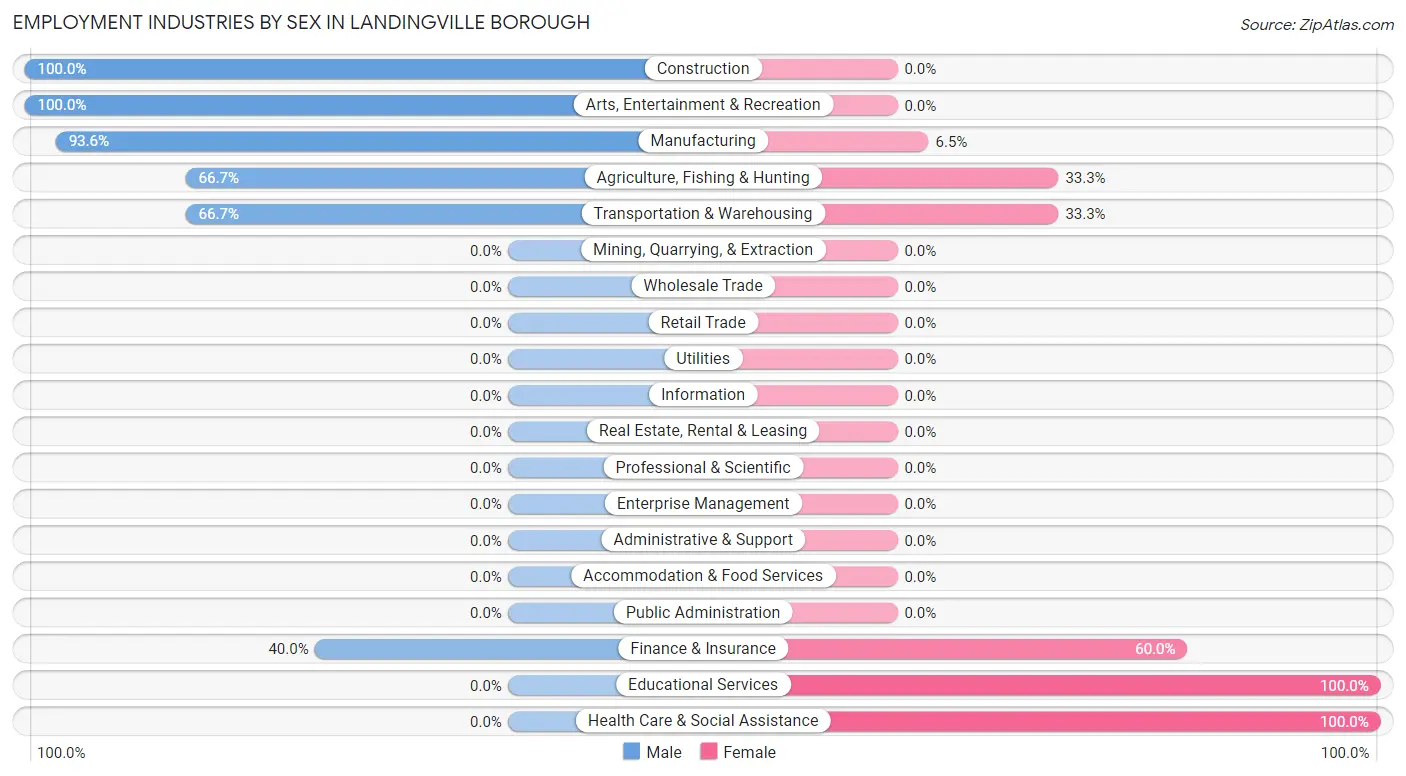
| Industry | Male | Female |
| Agriculture, Fishing & Hunting | 2 (66.7%) | 1 (33.3%) |
| Mining, Quarrying, & Extraction | 0 (0.0%) | 0 (0.0%) |
| Construction | 2 (100.0%) | 0 (0.0%) |
| Manufacturing | 29 (93.5%) | 2 (6.5%) |
| Wholesale Trade | 0 (0.0%) | 0 (0.0%) |
| Retail Trade | 0 (0.0%) | 0 (0.0%) |
| Transportation & Warehousing | 4 (66.7%) | 2 (33.3%) |
| Utilities | 0 (0.0%) | 0 (0.0%) |
| Information | 0 (0.0%) | 0 (0.0%) |
| Finance & Insurance | 2 (40.0%) | 3 (60.0%) |
| Real Estate, Rental & Leasing | 0 (0.0%) | 0 (0.0%) |
| Professional & Scientific | 0 (0.0%) | 0 (0.0%) |
| Enterprise Management | 0 (0.0%) | 0 (0.0%) |
| Administrative & Support | 0 (0.0%) | 0 (0.0%) |
| Educational Services | 0 (0.0%) | 20 (100.0%) |
| Health Care & Social Assistance | 0 (0.0%) | 17 (100.0%) |
| Arts, Entertainment & Recreation | 1 (100.0%) | 0 (0.0%) |
| Accommodation & Food Services | 0 (0.0%) | 0 (0.0%) |
| Public Administration | 0 (0.0%) | 0 (0.0%) |
| Total | 45 (48.9%) | 47 (51.1%) |
Education in Landingville borough
School Enrollment in Landingville borough
The most common levels of schooling among the 65 students in Landingville borough are middle school (29 | 44.6%), high school (26 | 40.0%), and elementary school (8 | 12.3%).
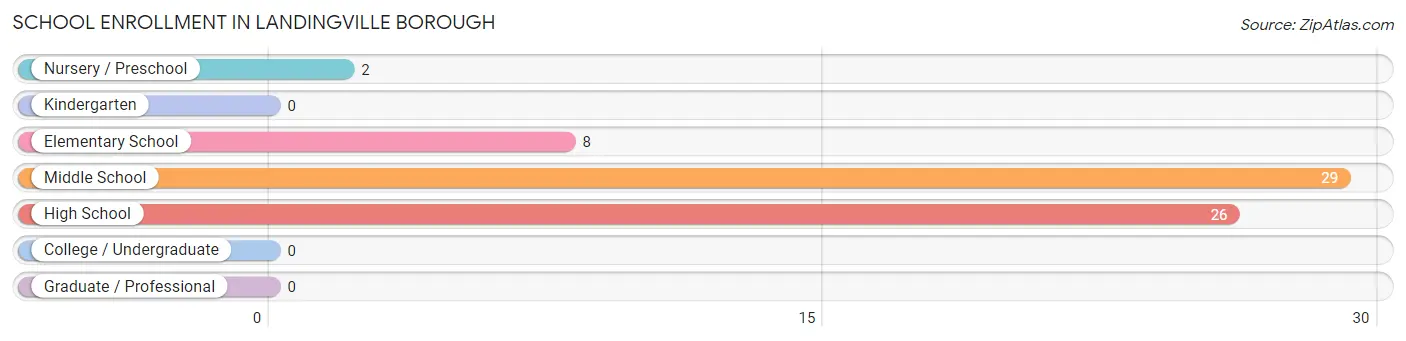
| School Level | # Students | % Students |
| Nursery / Preschool | 2 | 3.1% |
| Kindergarten | 0 | 0.0% |
| Elementary School | 8 | 12.3% |
| Middle School | 29 | 44.6% |
| High School | 26 | 40.0% |
| College / Undergraduate | 0 | 0.0% |
| Graduate / Professional | 0 | 0.0% |
| Total | 65 | 100.0% |
School Enrollment by Age by Funding Source in Landingville borough
Out of a total of 65 students who are enrolled in schools in Landingville borough, 7 (10.8%) attend a private institution, while the remaining 58 (89.2%) are enrolled in public schools. The age group of 5 to 9 year old has the highest likelihood of being enrolled in private schools, with 7 (77.8% in the age bracket) enrolled. Conversely, the age group of 3 to 4 year olds has the lowest likelihood of being enrolled in a private school, with 1 (100.0% in the age bracket) attending a public institution.
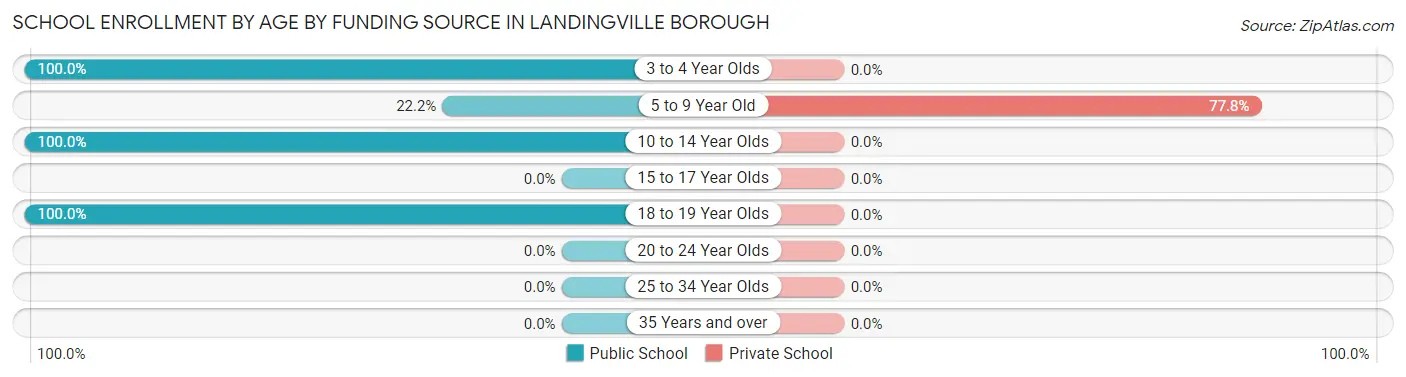
| Age Bracket | Public School | Private School |
| 3 to 4 Year Olds | 1 (100.0%) | 0 (0.0%) |
| 5 to 9 Year Old | 2 (22.2%) | 7 (77.8%) |
| 10 to 14 Year Olds | 53 (100.0%) | 0 (0.0%) |
| 15 to 17 Year Olds | 0 (0.0%) | 0 (0.0%) |
| 18 to 19 Year Olds | 2 (100.0%) | 0 (0.0%) |
| 20 to 24 Year Olds | 0 (0.0%) | 0 (0.0%) |
| 25 to 34 Year Olds | 0 (0.0%) | 0 (0.0%) |
| 35 Years and over | 0 (0.0%) | 0 (0.0%) |
| Total | 58 (89.2%) | 7 (10.8%) |
Educational Attainment by Field of Study in Landingville borough
Education (19 | 61.3%), business (8 | 25.8%), arts & humanities (3 | 9.7%), and science & technology (1 | 3.2%) are the most common fields of study among 31 individuals in Landingville borough who have obtained a bachelor's degree or higher.
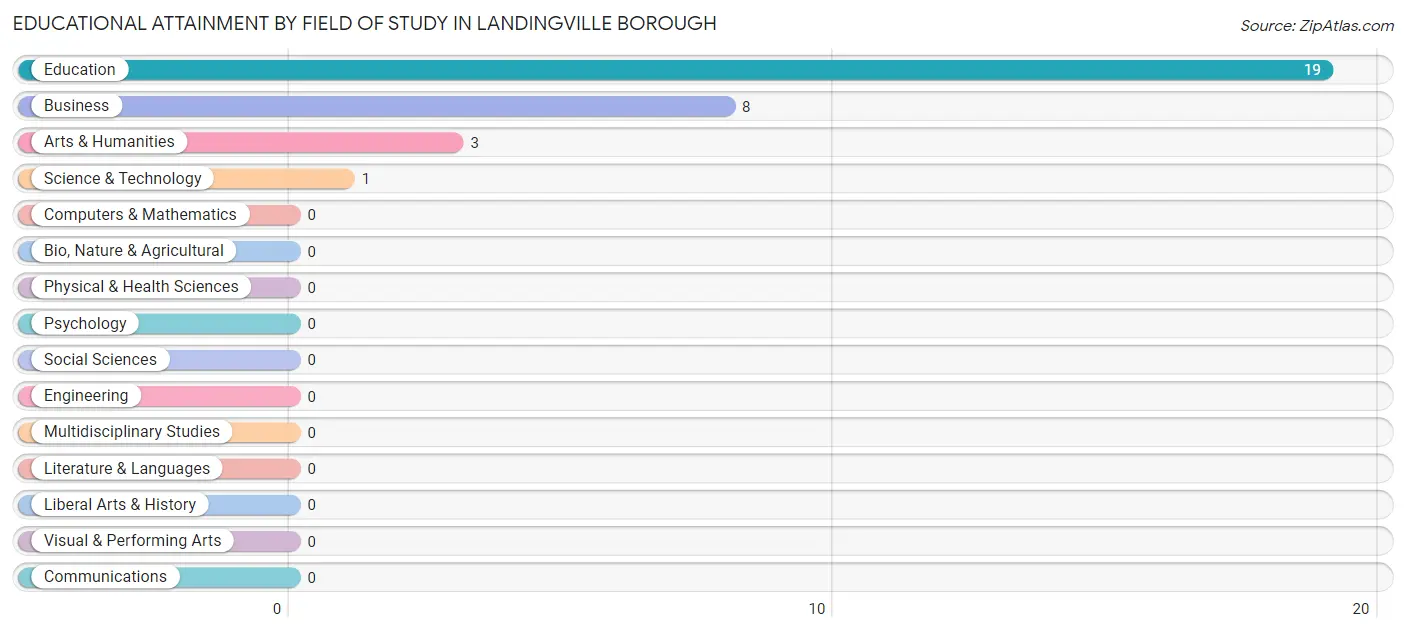
| Field of Study | # Graduates | % Graduates |
| Computers & Mathematics | 0 | 0.0% |
| Bio, Nature & Agricultural | 0 | 0.0% |
| Physical & Health Sciences | 0 | 0.0% |
| Psychology | 0 | 0.0% |
| Social Sciences | 0 | 0.0% |
| Engineering | 0 | 0.0% |
| Multidisciplinary Studies | 0 | 0.0% |
| Science & Technology | 1 | 3.2% |
| Business | 8 | 25.8% |
| Education | 19 | 61.3% |
| Literature & Languages | 0 | 0.0% |
| Liberal Arts & History | 0 | 0.0% |
| Visual & Performing Arts | 0 | 0.0% |
| Communications | 0 | 0.0% |
| Arts & Humanities | 3 | 9.7% |
| Total | 31 | 100.0% |
Transportation & Commute in Landingville borough
Vehicle Availability by Sex in Landingville borough
The most prevalent vehicle ownership categories in Landingville borough are males with 3 vehicles (22, accounting for 48.9%) and females with 3 vehicles (17, making up 46.8%).
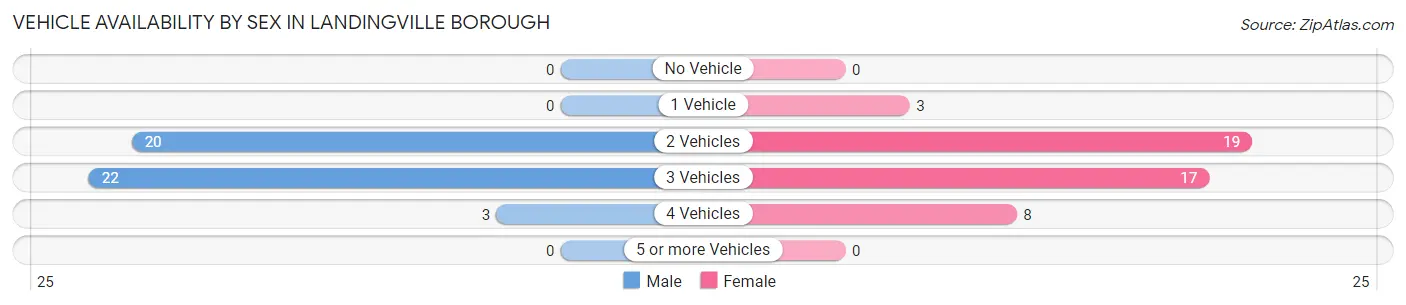
| Vehicles Available | Male | Female |
| No Vehicle | 0 (0.0%) | 0 (0.0%) |
| 1 Vehicle | 0 (0.0%) | 3 (6.4%) |
| 2 Vehicles | 20 (44.4%) | 19 (40.4%) |
| 3 Vehicles | 22 (48.9%) | 17 (36.2%) |
| 4 Vehicles | 3 (6.7%) | 8 (17.0%) |
| 5 or more Vehicles | 0 (0.0%) | 0 (0.0%) |
| Total | 45 (100.0%) | 47 (100.0%) |
Commute Time in Landingville borough
The most frequently occuring commute durations in Landingville borough are 10 to 14 minutes (24 commuters, 27.9%), 25 to 29 minutes (17 commuters, 19.8%), and 15 to 19 minutes (12 commuters, 14.0%).
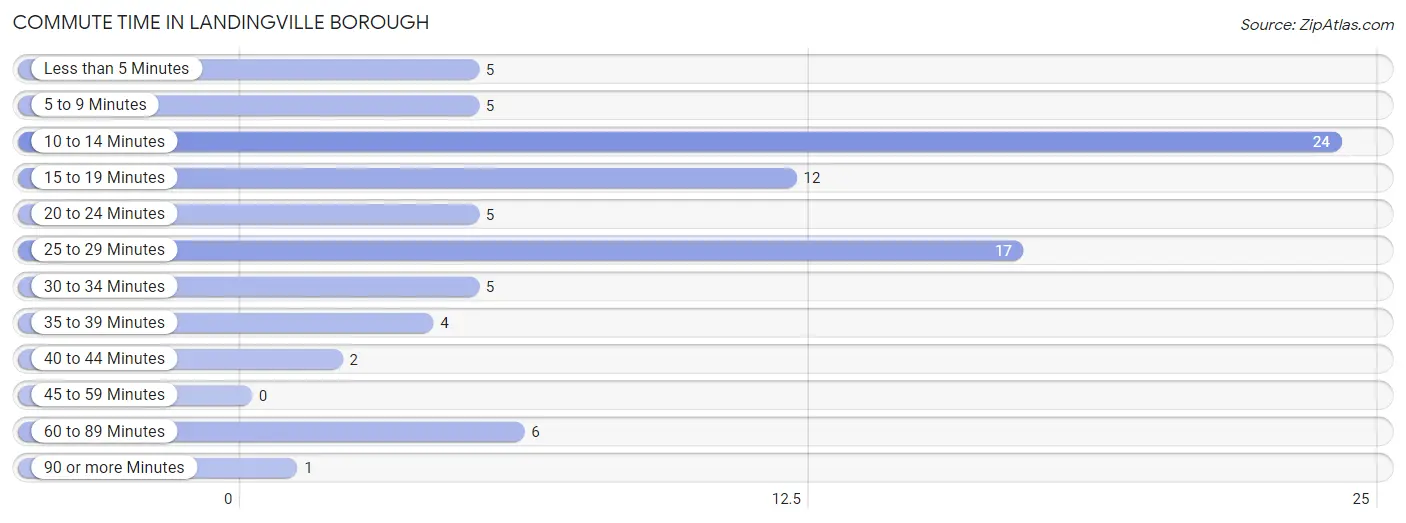
| Commute Time | # Commuters | % Commuters |
| Less than 5 Minutes | 5 | 5.8% |
| 5 to 9 Minutes | 5 | 5.8% |
| 10 to 14 Minutes | 24 | 27.9% |
| 15 to 19 Minutes | 12 | 14.0% |
| 20 to 24 Minutes | 5 | 5.8% |
| 25 to 29 Minutes | 17 | 19.8% |
| 30 to 34 Minutes | 5 | 5.8% |
| 35 to 39 Minutes | 4 | 4.6% |
| 40 to 44 Minutes | 2 | 2.3% |
| 45 to 59 Minutes | 0 | 0.0% |
| 60 to 89 Minutes | 6 | 7.0% |
| 90 or more Minutes | 1 | 1.2% |
Commute Time by Sex in Landingville borough
The most common commute times in Landingville borough are 10 to 14 minutes (21 commuters, 50.0%) for males and 25 to 29 minutes (17 commuters, 38.6%) for females.
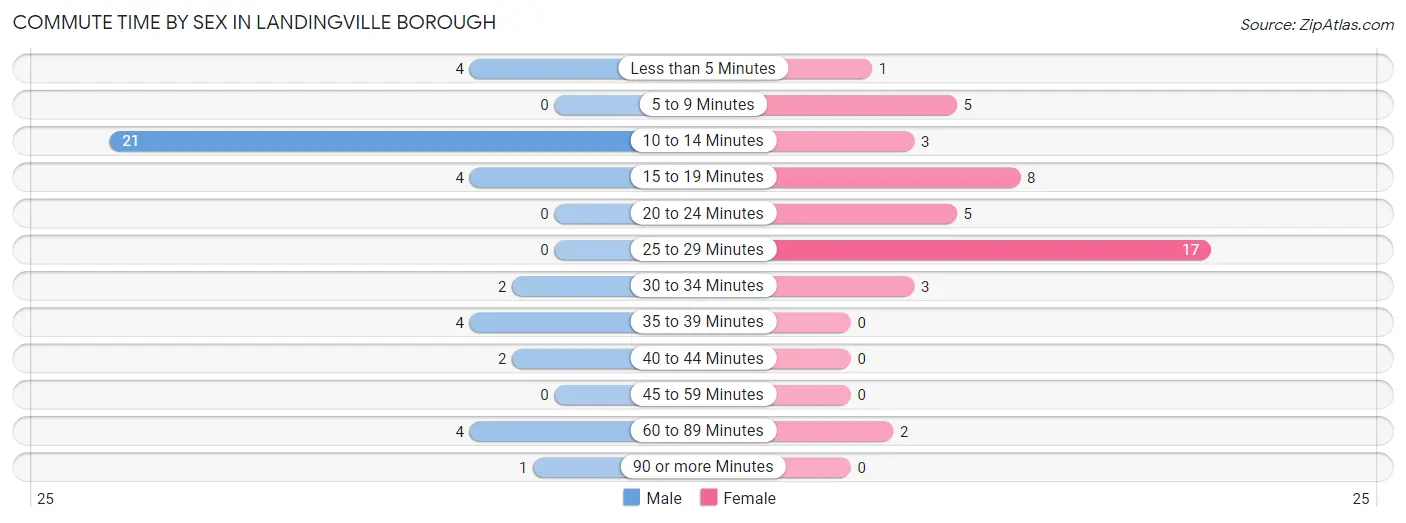
| Commute Time | Male | Female |
| Less than 5 Minutes | 4 (9.5%) | 1 (2.3%) |
| 5 to 9 Minutes | 0 (0.0%) | 5 (11.4%) |
| 10 to 14 Minutes | 21 (50.0%) | 3 (6.8%) |
| 15 to 19 Minutes | 4 (9.5%) | 8 (18.2%) |
| 20 to 24 Minutes | 0 (0.0%) | 5 (11.4%) |
| 25 to 29 Minutes | 0 (0.0%) | 17 (38.6%) |
| 30 to 34 Minutes | 2 (4.8%) | 3 (6.8%) |
| 35 to 39 Minutes | 4 (9.5%) | 0 (0.0%) |
| 40 to 44 Minutes | 2 (4.8%) | 0 (0.0%) |
| 45 to 59 Minutes | 0 (0.0%) | 0 (0.0%) |
| 60 to 89 Minutes | 4 (9.5%) | 2 (4.5%) |
| 90 or more Minutes | 1 (2.4%) | 0 (0.0%) |
Time of Departure to Work by Sex in Landingville borough
The most frequent times of departure to work in Landingville borough are 7:00 AM to 7:29 AM (22, 52.4%) for males and 7:00 AM to 7:29 AM (28, 63.6%) for females.
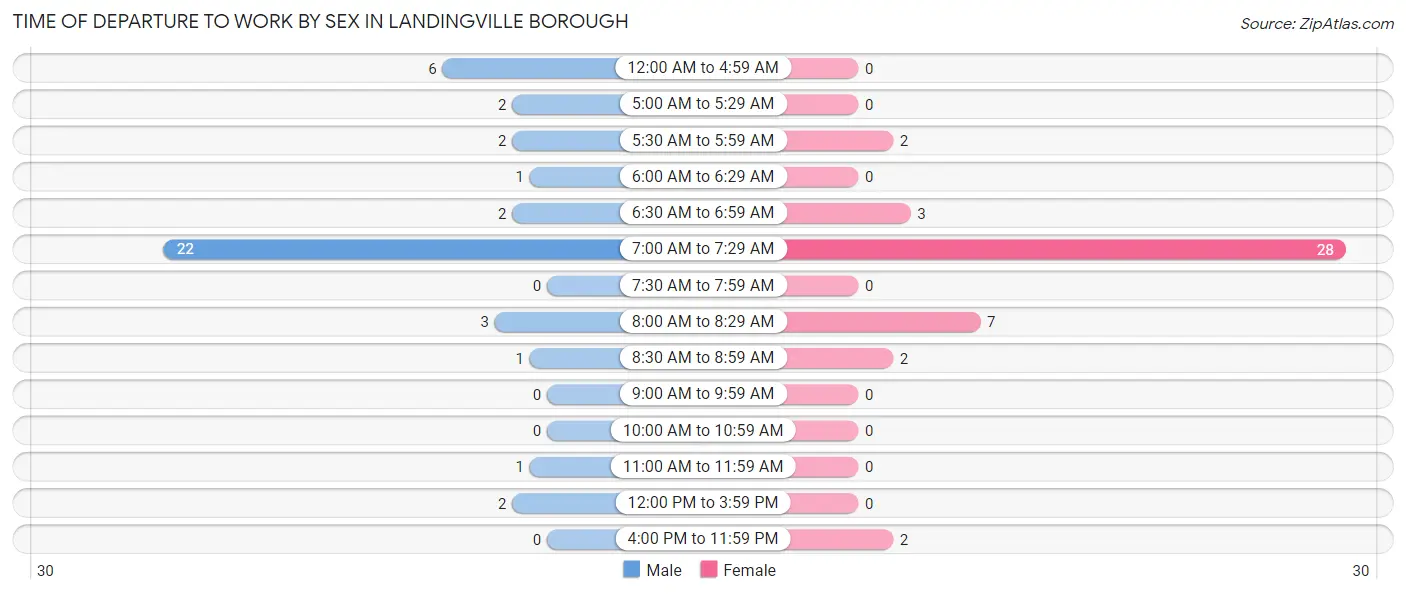
| Time of Departure | Male | Female |
| 12:00 AM to 4:59 AM | 6 (14.3%) | 0 (0.0%) |
| 5:00 AM to 5:29 AM | 2 (4.8%) | 0 (0.0%) |
| 5:30 AM to 5:59 AM | 2 (4.8%) | 2 (4.5%) |
| 6:00 AM to 6:29 AM | 1 (2.4%) | 0 (0.0%) |
| 6:30 AM to 6:59 AM | 2 (4.8%) | 3 (6.8%) |
| 7:00 AM to 7:29 AM | 22 (52.4%) | 28 (63.6%) |
| 7:30 AM to 7:59 AM | 0 (0.0%) | 0 (0.0%) |
| 8:00 AM to 8:29 AM | 3 (7.1%) | 7 (15.9%) |
| 8:30 AM to 8:59 AM | 1 (2.4%) | 2 (4.5%) |
| 9:00 AM to 9:59 AM | 0 (0.0%) | 0 (0.0%) |
| 10:00 AM to 10:59 AM | 0 (0.0%) | 0 (0.0%) |
| 11:00 AM to 11:59 AM | 1 (2.4%) | 0 (0.0%) |
| 12:00 PM to 3:59 PM | 2 (4.8%) | 0 (0.0%) |
| 4:00 PM to 11:59 PM | 0 (0.0%) | 2 (4.5%) |
| Total | 42 (100.0%) | 44 (100.0%) |
Housing Occupancy in Landingville borough
Occupancy by Ownership in Landingville borough
Of the total 65 dwellings in Landingville borough, owner-occupied units account for 51 (78.5%), while renter-occupied units make up 14 (21.5%).
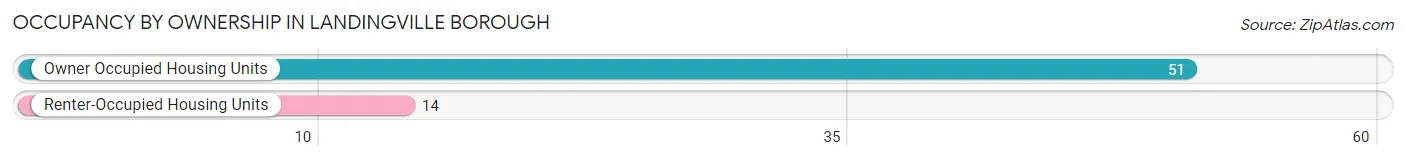
| Occupancy | # Housing Units | % Housing Units |
| Owner Occupied Housing Units | 51 | 78.5% |
| Renter-Occupied Housing Units | 14 | 21.5% |
| Total Occupied Housing Units | 65 | 100.0% |
Occupancy by Household Size in Landingville borough
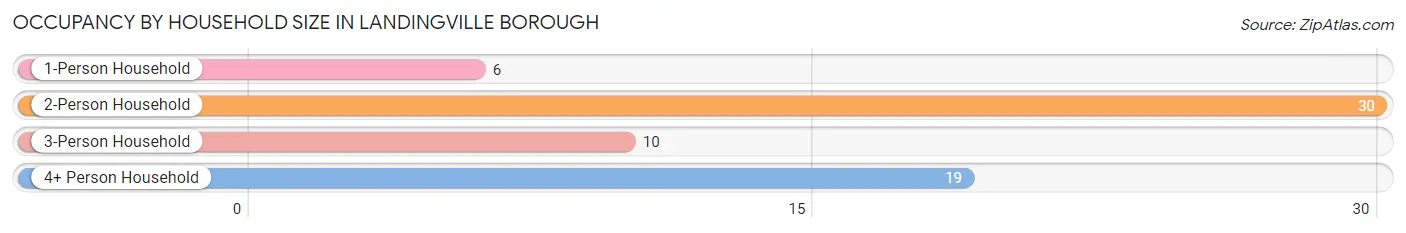
| Household Size | # Housing Units | % Housing Units |
| 1-Person Household | 6 | 9.2% |
| 2-Person Household | 30 | 46.2% |
| 3-Person Household | 10 | 15.4% |
| 4+ Person Household | 19 | 29.2% |
| Total Housing Units | 65 | 100.0% |
Occupancy by Ownership by Household Size in Landingville borough
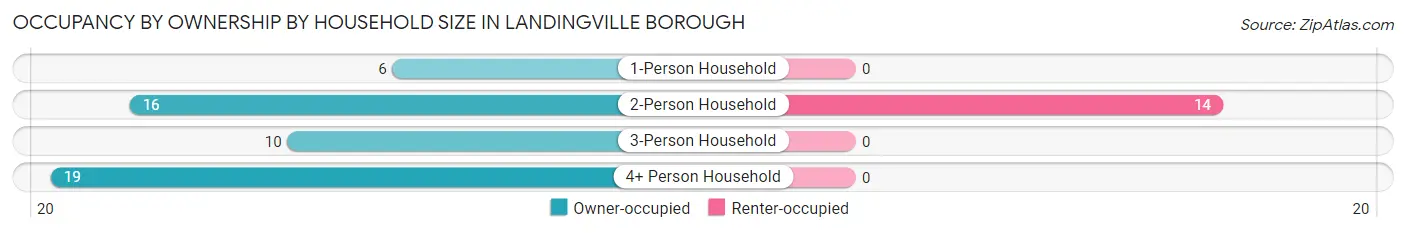
| Household Size | Owner-occupied | Renter-occupied |
| 1-Person Household | 6 (100.0%) | 0 (0.0%) |
| 2-Person Household | 16 (53.3%) | 14 (46.7%) |
| 3-Person Household | 10 (100.0%) | 0 (0.0%) |
| 4+ Person Household | 19 (100.0%) | 0 (0.0%) |
| Total Housing Units | 51 (78.5%) | 14 (21.5%) |
Occupancy by Educational Attainment in Landingville borough
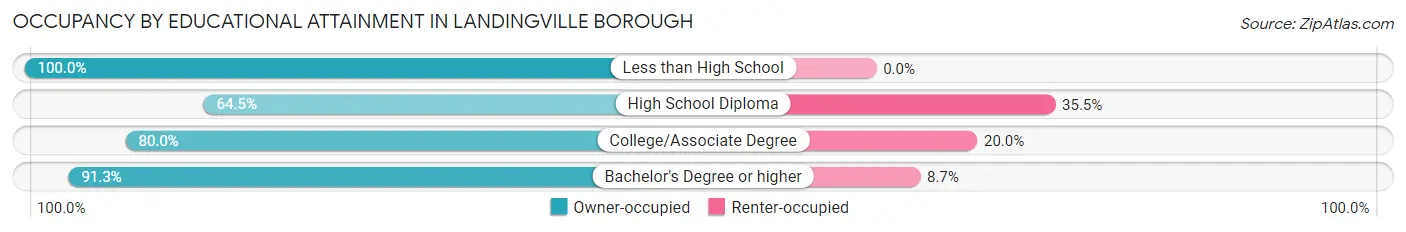
| Household Size | Owner-occupied | Renter-occupied |
| Less than High School | 6 (100.0%) | 0 (0.0%) |
| High School Diploma | 20 (64.5%) | 11 (35.5%) |
| College/Associate Degree | 4 (80.0%) | 1 (20.0%) |
| Bachelor's Degree or higher | 21 (91.3%) | 2 (8.7%) |
Occupancy by Age of Householder in Landingville borough
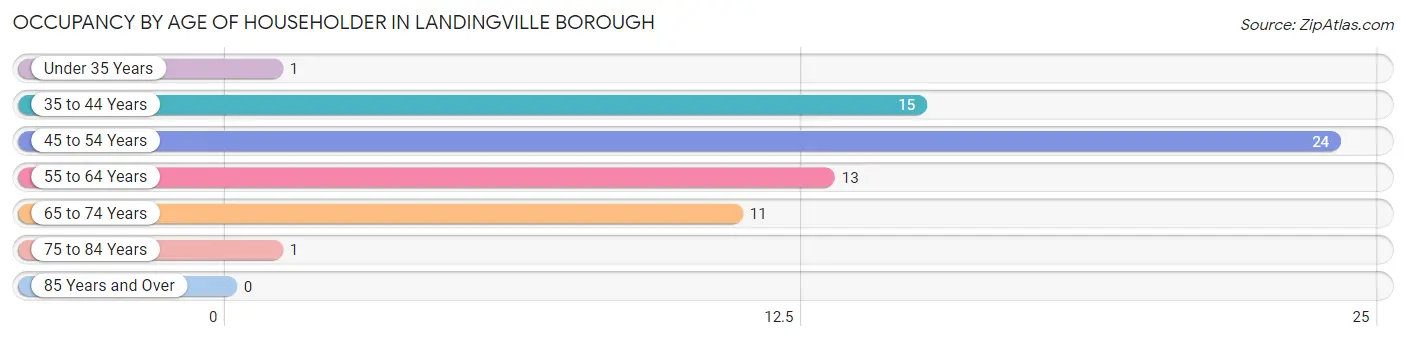
| Age Bracket | # Households | % Households |
| Under 35 Years | 1 | 1.5% |
| 35 to 44 Years | 15 | 23.1% |
| 45 to 54 Years | 24 | 36.9% |
| 55 to 64 Years | 13 | 20.0% |
| 65 to 74 Years | 11 | 16.9% |
| 75 to 84 Years | 1 | 1.5% |
| 85 Years and Over | 0 | 0.0% |
| Total | 65 | 100.0% |
Housing Finances in Landingville borough
Median Income by Occupancy in Landingville borough
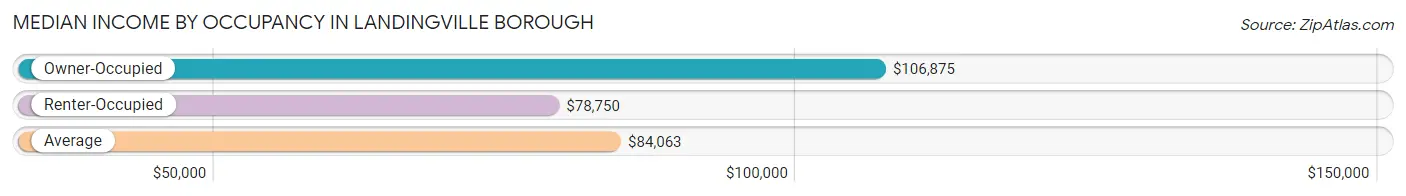
| Occupancy Type | # Households | Median Income |
| Owner-Occupied | 51 (78.5%) | $106,875 |
| Renter-Occupied | 14 (21.5%) | $78,750 |
| Average | 65 (100.0%) | $84,063 |
Occupancy by Householder Income Bracket in Landingville borough
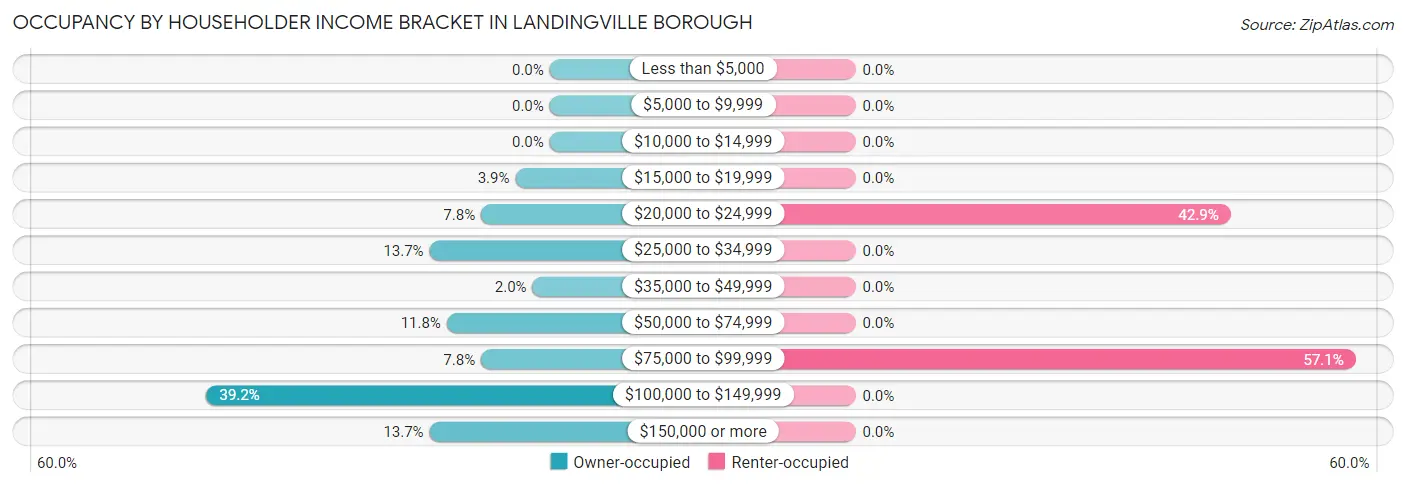
| Income Bracket | Owner-occupied | Renter-occupied |
| Less than $5,000 | 0 (0.0%) | 0 (0.0%) |
| $5,000 to $9,999 | 0 (0.0%) | 0 (0.0%) |
| $10,000 to $14,999 | 0 (0.0%) | 0 (0.0%) |
| $15,000 to $19,999 | 2 (3.9%) | 0 (0.0%) |
| $20,000 to $24,999 | 4 (7.8%) | 6 (42.9%) |
| $25,000 to $34,999 | 7 (13.7%) | 0 (0.0%) |
| $35,000 to $49,999 | 1 (2.0%) | 0 (0.0%) |
| $50,000 to $74,999 | 6 (11.8%) | 0 (0.0%) |
| $75,000 to $99,999 | 4 (7.8%) | 8 (57.1%) |
| $100,000 to $149,999 | 20 (39.2%) | 0 (0.0%) |
| $150,000 or more | 7 (13.7%) | 0 (0.0%) |
| Total | 51 (100.0%) | 14 (100.0%) |
Monthly Housing Cost Tiers in Landingville borough
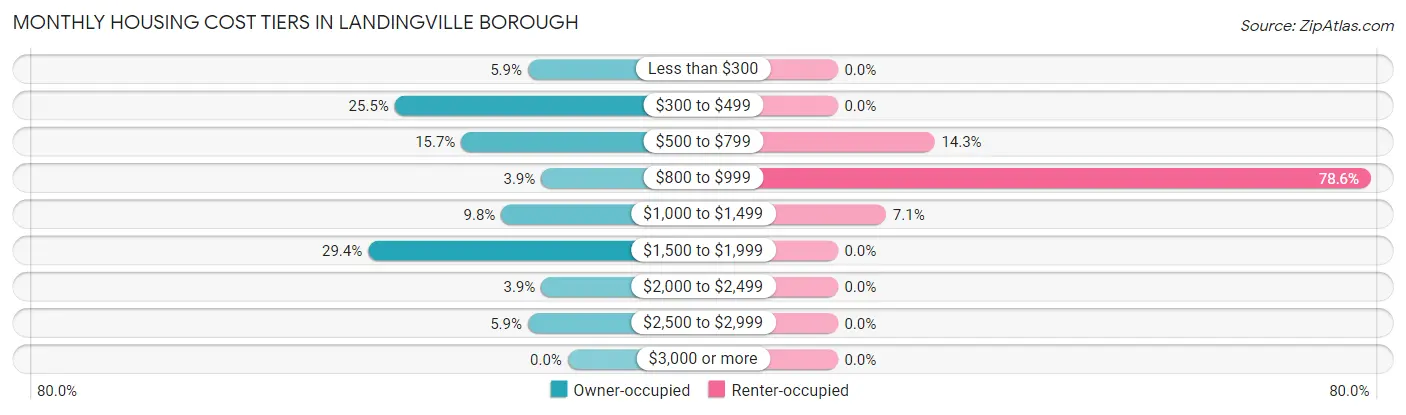
| Monthly Cost | Owner-occupied | Renter-occupied |
| Less than $300 | 3 (5.9%) | 0 (0.0%) |
| $300 to $499 | 13 (25.5%) | 0 (0.0%) |
| $500 to $799 | 8 (15.7%) | 2 (14.3%) |
| $800 to $999 | 2 (3.9%) | 11 (78.6%) |
| $1,000 to $1,499 | 5 (9.8%) | 1 (7.1%) |
| $1,500 to $1,999 | 15 (29.4%) | 0 (0.0%) |
| $2,000 to $2,499 | 2 (3.9%) | 0 (0.0%) |
| $2,500 to $2,999 | 3 (5.9%) | 0 (0.0%) |
| $3,000 or more | 0 (0.0%) | 0 (0.0%) |
| Total | 51 (100.0%) | 14 (100.0%) |
Physical Housing Characteristics in Landingville borough
Housing Structures in Landingville borough
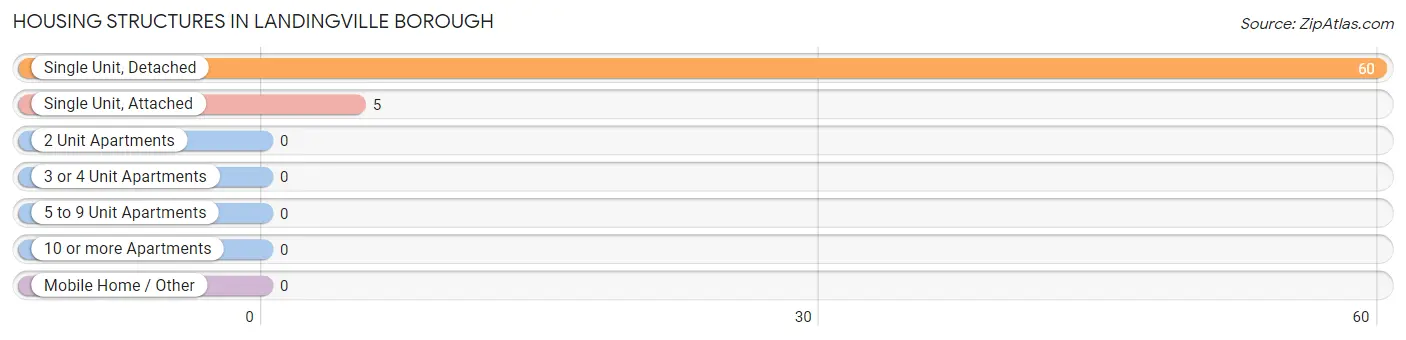
| Structure Type | # Housing Units | % Housing Units |
| Single Unit, Detached | 60 | 92.3% |
| Single Unit, Attached | 5 | 7.7% |
| 2 Unit Apartments | 0 | 0.0% |
| 3 or 4 Unit Apartments | 0 | 0.0% |
| 5 to 9 Unit Apartments | 0 | 0.0% |
| 10 or more Apartments | 0 | 0.0% |
| Mobile Home / Other | 0 | 0.0% |
| Total | 65 | 100.0% |
Housing Structures by Occupancy in Landingville borough
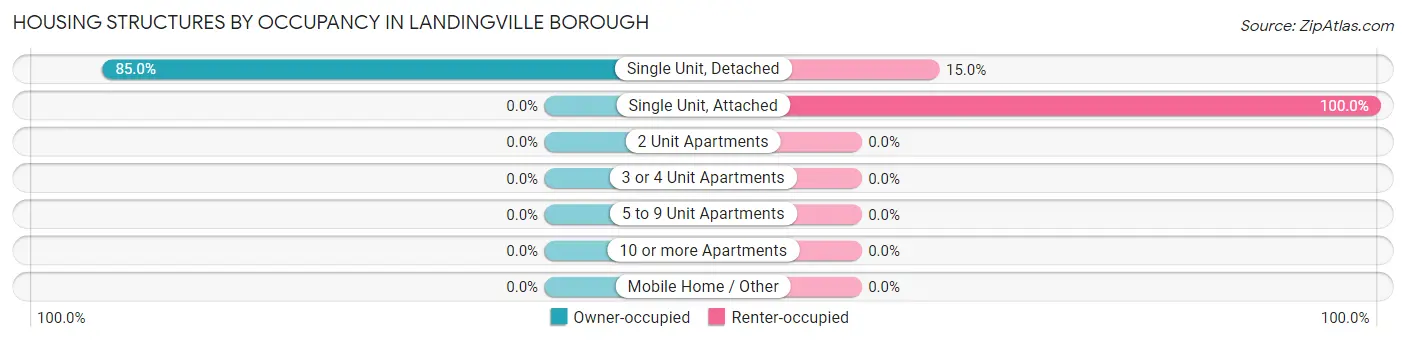
| Structure Type | Owner-occupied | Renter-occupied |
| Single Unit, Detached | 51 (85.0%) | 9 (15.0%) |
| Single Unit, Attached | 0 (0.0%) | 5 (100.0%) |
| 2 Unit Apartments | 0 (0.0%) | 0 (0.0%) |
| 3 or 4 Unit Apartments | 0 (0.0%) | 0 (0.0%) |
| 5 to 9 Unit Apartments | 0 (0.0%) | 0 (0.0%) |
| 10 or more Apartments | 0 (0.0%) | 0 (0.0%) |
| Mobile Home / Other | 0 (0.0%) | 0 (0.0%) |
| Total | 51 (78.5%) | 14 (21.5%) |
Housing Structures by Number of Rooms in Landingville borough
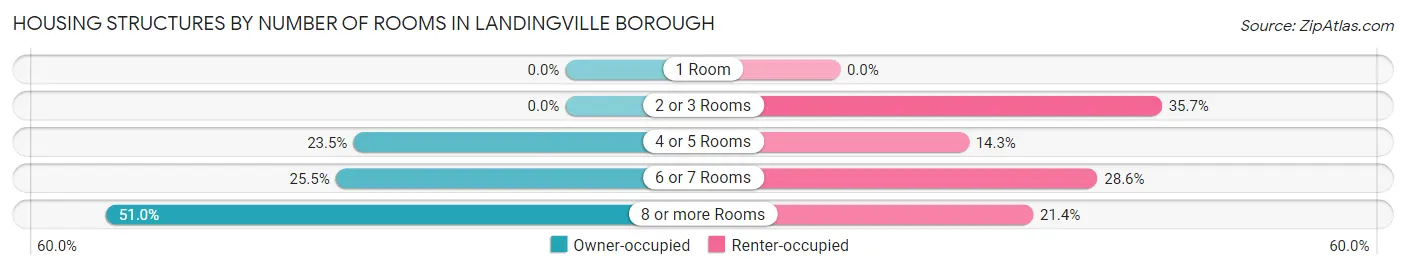
| Number of Rooms | Owner-occupied | Renter-occupied |
| 1 Room | 0 (0.0%) | 0 (0.0%) |
| 2 or 3 Rooms | 0 (0.0%) | 5 (35.7%) |
| 4 or 5 Rooms | 12 (23.5%) | 2 (14.3%) |
| 6 or 7 Rooms | 13 (25.5%) | 4 (28.6%) |
| 8 or more Rooms | 26 (51.0%) | 3 (21.4%) |
| Total | 51 (100.0%) | 14 (100.0%) |
Housing Structure by Heating Type in Landingville borough
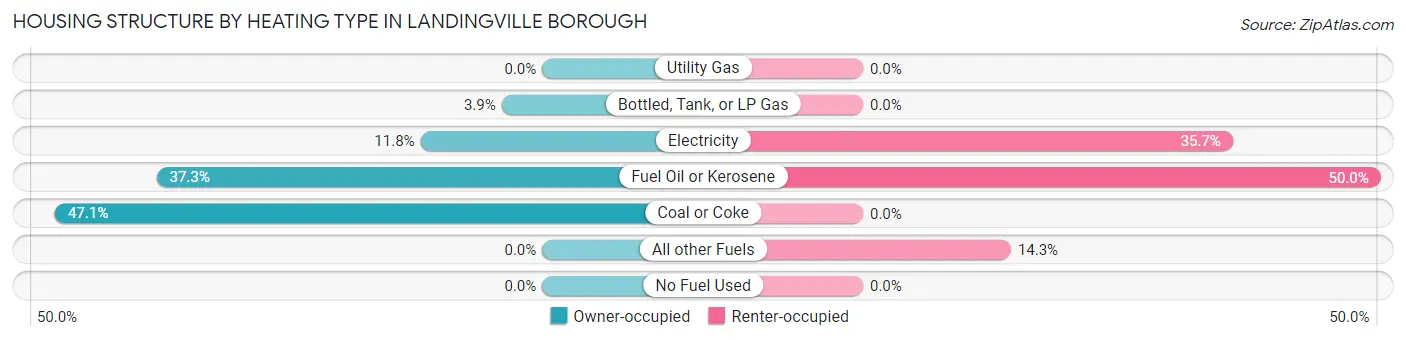
| Heating Type | Owner-occupied | Renter-occupied |
| Utility Gas | 0 (0.0%) | 0 (0.0%) |
| Bottled, Tank, or LP Gas | 2 (3.9%) | 0 (0.0%) |
| Electricity | 6 (11.8%) | 5 (35.7%) |
| Fuel Oil or Kerosene | 19 (37.2%) | 7 (50.0%) |
| Coal or Coke | 24 (47.1%) | 0 (0.0%) |
| All other Fuels | 0 (0.0%) | 2 (14.3%) |
| No Fuel Used | 0 (0.0%) | 0 (0.0%) |
| Total | 51 (100.0%) | 14 (100.0%) |
Household Vehicle Usage in Landingville borough
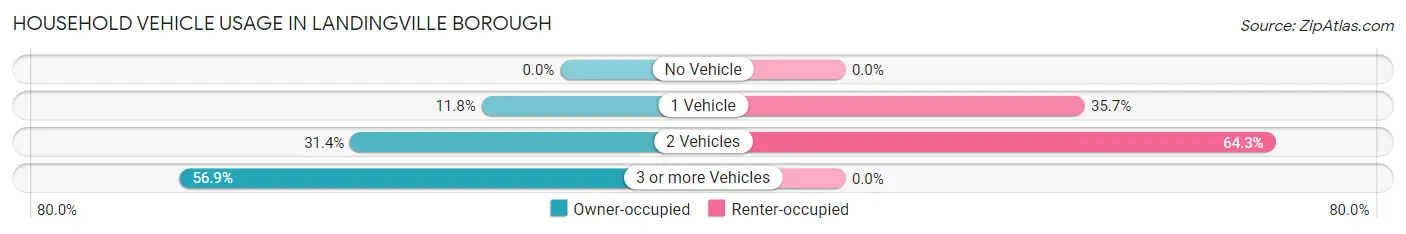
| Vehicles per Household | Owner-occupied | Renter-occupied |
| No Vehicle | 0 (0.0%) | 0 (0.0%) |
| 1 Vehicle | 6 (11.8%) | 5 (35.7%) |
| 2 Vehicles | 16 (31.4%) | 9 (64.3%) |
| 3 or more Vehicles | 29 (56.9%) | 0 (0.0%) |
| Total | 51 (100.0%) | 14 (100.0%) |
Real Estate & Mortgages in Landingville borough
Real Estate and Mortgage Overview in Landingville borough
| Characteristic | Without Mortgage | With Mortgage |
| Housing Units | 22 | 29 |
| Median Property Value | $95,000 | $270,300 |
| Median Household Income | $61,250 | $7 |
| Monthly Housing Costs | $383 | $0 |
| Real Estate Taxes | $1,500 | $0 |
Property Value by Mortgage Status in Landingville borough
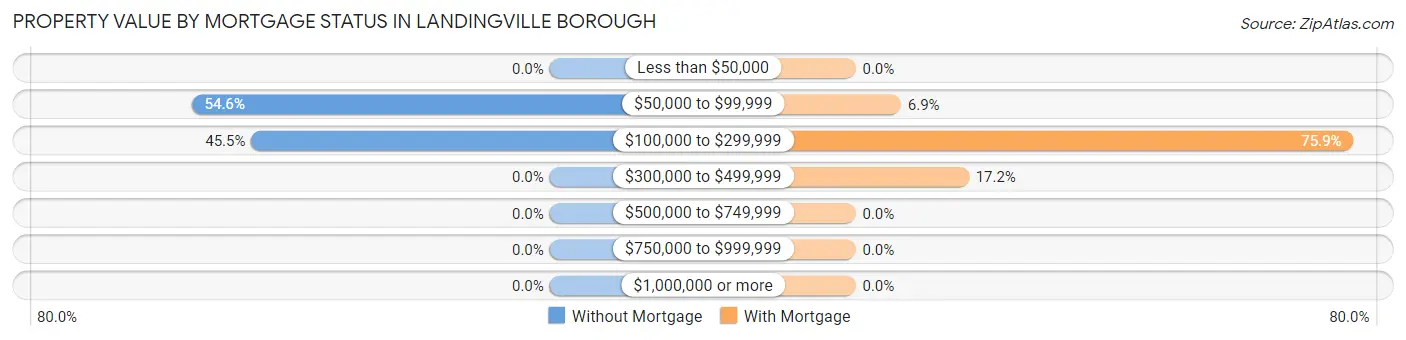
| Property Value | Without Mortgage | With Mortgage |
| Less than $50,000 | 0 (0.0%) | 0 (0.0%) |
| $50,000 to $99,999 | 12 (54.5%) | 2 (6.9%) |
| $100,000 to $299,999 | 10 (45.5%) | 22 (75.9%) |
| $300,000 to $499,999 | 0 (0.0%) | 5 (17.2%) |
| $500,000 to $749,999 | 0 (0.0%) | 0 (0.0%) |
| $750,000 to $999,999 | 0 (0.0%) | 0 (0.0%) |
| $1,000,000 or more | 0 (0.0%) | 0 (0.0%) |
| Total | 22 (100.0%) | 29 (100.0%) |
Household Income by Mortgage Status in Landingville borough
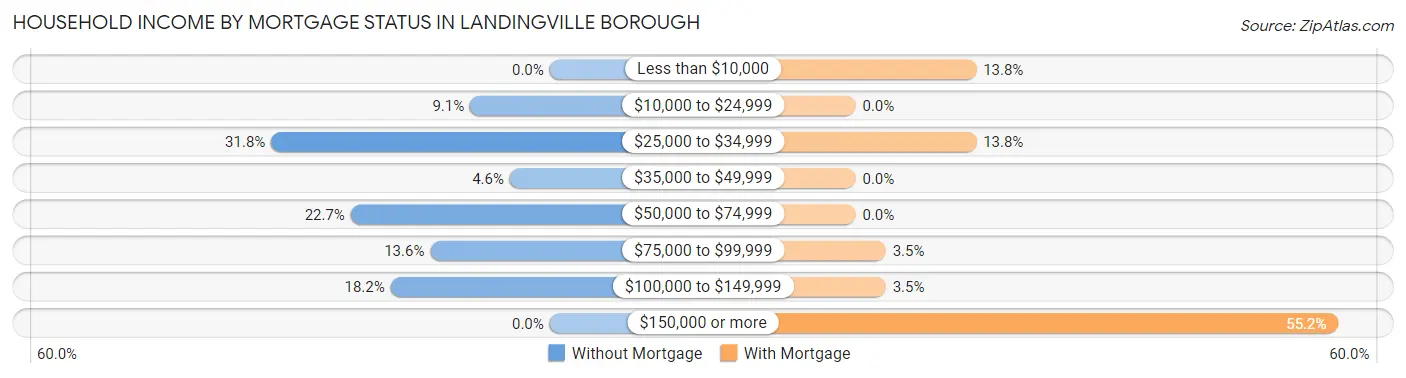
| Household Income | Without Mortgage | With Mortgage |
| Less than $10,000 | 0 (0.0%) | 4 (13.8%) |
| $10,000 to $24,999 | 2 (9.1%) | 0 (0.0%) |
| $25,000 to $34,999 | 7 (31.8%) | 4 (13.8%) |
| $35,000 to $49,999 | 1 (4.5%) | 0 (0.0%) |
| $50,000 to $74,999 | 5 (22.7%) | 0 (0.0%) |
| $75,000 to $99,999 | 3 (13.6%) | 1 (3.5%) |
| $100,000 to $149,999 | 4 (18.2%) | 1 (3.5%) |
| $150,000 or more | 0 (0.0%) | 16 (55.2%) |
| Total | 22 (100.0%) | 29 (100.0%) |
Property Value to Household Income Ratio in Landingville borough
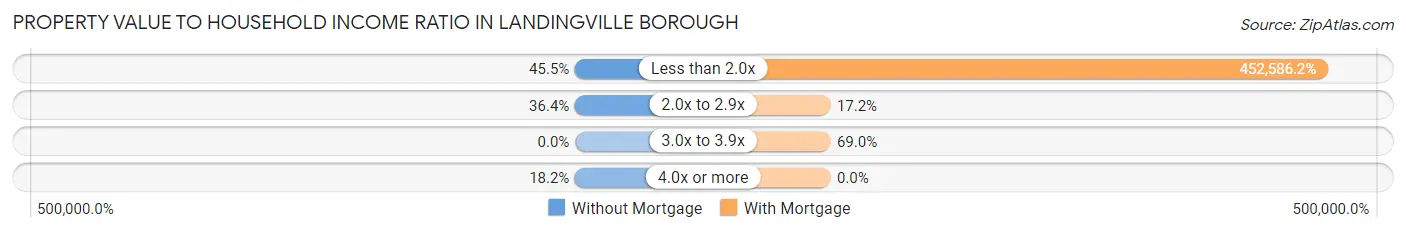
| Value-to-Income Ratio | Without Mortgage | With Mortgage |
| Less than 2.0x | 10 (45.5%) | 131,250 (452,586.2%) |
| 2.0x to 2.9x | 8 (36.4%) | 5 (17.2%) |
| 3.0x to 3.9x | 0 (0.0%) | 20 (69.0%) |
| 4.0x or more | 4 (18.2%) | 0 (0.0%) |
| Total | 22 (100.0%) | 29 (100.0%) |
Real Estate Taxes by Mortgage Status in Landingville borough
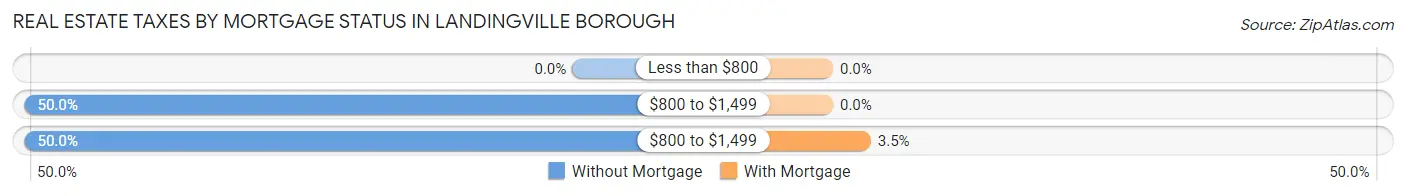
| Property Taxes | Without Mortgage | With Mortgage |
| Less than $800 | 0 (0.0%) | 0 (0.0%) |
| $800 to $1,499 | 11 (50.0%) | 0 (0.0%) |
| $800 to $1,499 | 11 (50.0%) | 1 (3.5%) |
| Total | 22 (100.0%) | 29 (100.0%) |
Health & Disability in Landingville borough
Health Insurance Coverage by Age in Landingville borough
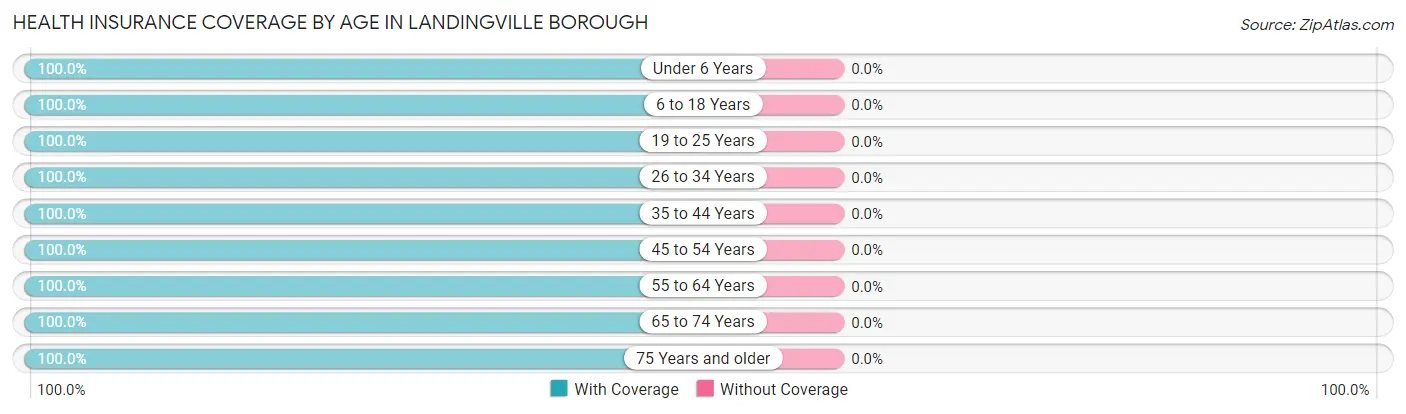
| Age Bracket | With Coverage | Without Coverage |
| Under 6 Years | 8 (100.0%) | 0 (0.0%) |
| 6 to 18 Years | 63 (100.0%) | 0 (0.0%) |
| 19 to 25 Years | 2 (100.0%) | 0 (0.0%) |
| 26 to 34 Years | 11 (100.0%) | 0 (0.0%) |
| 35 to 44 Years | 73 (100.0%) | 0 (0.0%) |
| 45 to 54 Years | 33 (100.0%) | 0 (0.0%) |
| 55 to 64 Years | 21 (100.0%) | 0 (0.0%) |
| 65 to 74 Years | 39 (100.0%) | 0 (0.0%) |
| 75 Years and older | 2 (100.0%) | 0 (0.0%) |
| Total | 252 (100.0%) | 0 (0.0%) |
Health Insurance Coverage by Citizenship Status in Landingville borough
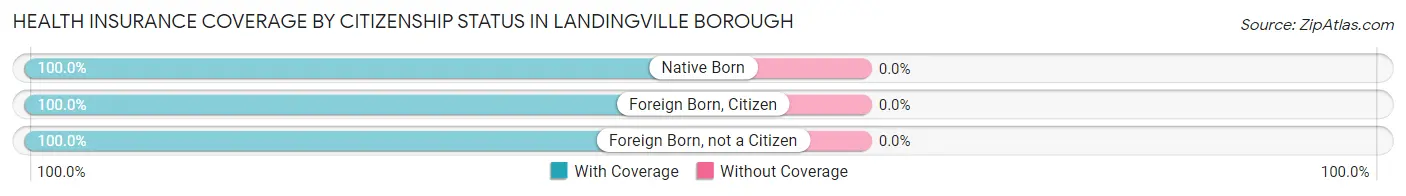
| Citizenship Status | With Coverage | Without Coverage |
| Native Born | 8 (100.0%) | 0 (0.0%) |
| Foreign Born, Citizen | 63 (100.0%) | 0 (0.0%) |
| Foreign Born, not a Citizen | 2 (100.0%) | 0 (0.0%) |
Health Insurance Coverage by Household Income in Landingville borough
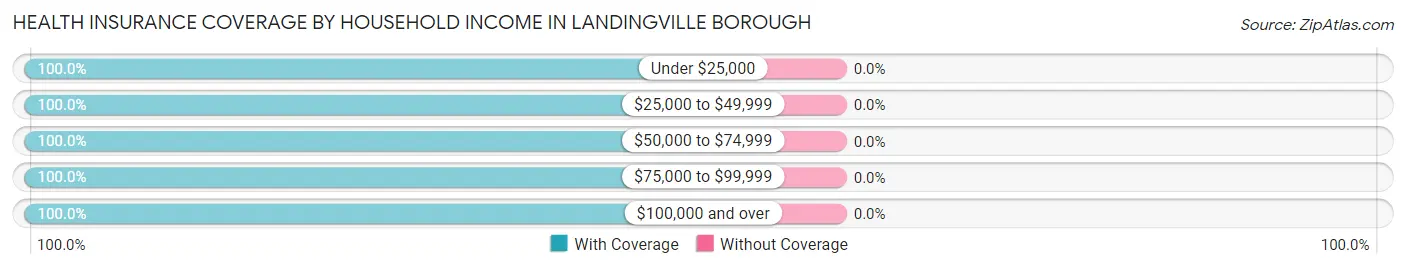
| Household Income | With Coverage | Without Coverage |
| Under $25,000 | 73 (100.0%) | 0 (0.0%) |
| $25,000 to $49,999 | 16 (100.0%) | 0 (0.0%) |
| $50,000 to $74,999 | 14 (100.0%) | 0 (0.0%) |
| $75,000 to $99,999 | 26 (100.0%) | 0 (0.0%) |
| $100,000 and over | 123 (100.0%) | 0 (0.0%) |
Public vs Private Health Insurance Coverage by Age in Landingville borough
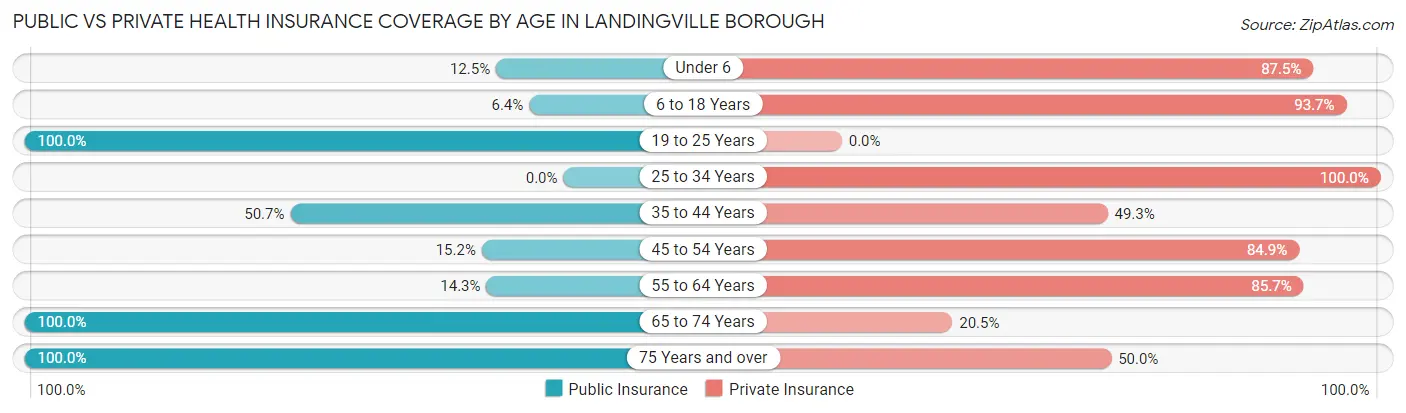
| Age Bracket | Public Insurance | Private Insurance |
| Under 6 | 1 (12.5%) | 7 (87.5%) |
| 6 to 18 Years | 4 (6.4%) | 59 (93.6%) |
| 19 to 25 Years | 2 (100.0%) | 0 (0.0%) |
| 25 to 34 Years | 0 (0.0%) | 11 (100.0%) |
| 35 to 44 Years | 37 (50.7%) | 36 (49.3%) |
| 45 to 54 Years | 5 (15.1%) | 28 (84.9%) |
| 55 to 64 Years | 3 (14.3%) | 18 (85.7%) |
| 65 to 74 Years | 39 (100.0%) | 8 (20.5%) |
| 75 Years and over | 2 (100.0%) | 1 (50.0%) |
| Total | 93 (36.9%) | 168 (66.7%) |
Disability Status by Sex by Age in Landingville borough
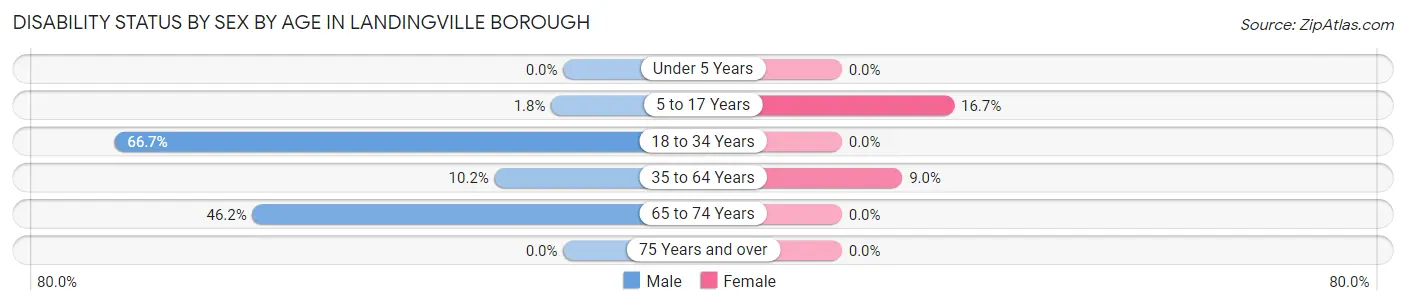
| Age Bracket | Male | Female |
| Under 5 Years | 0 (0.0%) | 0 (0.0%) |
| 5 to 17 Years | 1 (1.8%) | 2 (16.7%) |
| 18 to 34 Years | 8 (66.7%) | 0 (0.0%) |
| 35 to 64 Years | 5 (10.2%) | 7 (9.0%) |
| 65 to 74 Years | 6 (46.2%) | 0 (0.0%) |
| 75 Years and over | 0 (0.0%) | 0 (0.0%) |
Disability Class by Sex by Age in Landingville borough
Disability Class: Hearing Difficulty
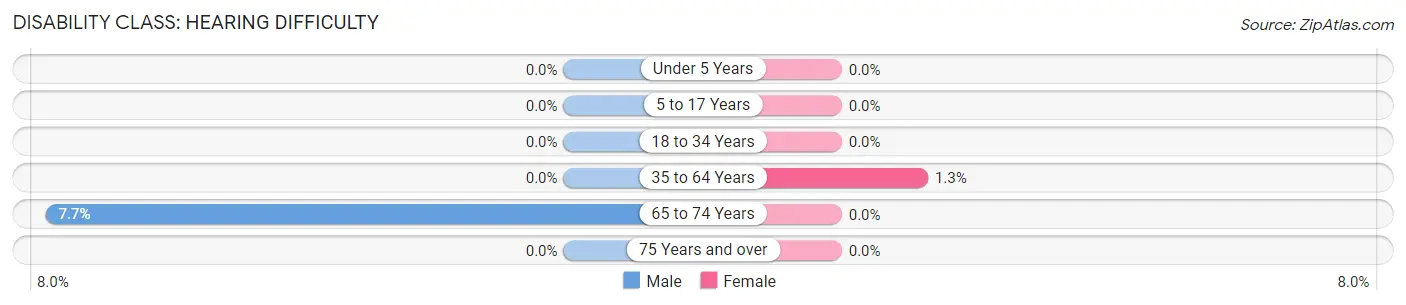
| Age Bracket | Male | Female |
| Under 5 Years | 0 (0.0%) | 0 (0.0%) |
| 5 to 17 Years | 0 (0.0%) | 0 (0.0%) |
| 18 to 34 Years | 0 (0.0%) | 0 (0.0%) |
| 35 to 64 Years | 0 (0.0%) | 1 (1.3%) |
| 65 to 74 Years | 1 (7.7%) | 0 (0.0%) |
| 75 Years and over | 0 (0.0%) | 0 (0.0%) |
Disability Class: Vision Difficulty
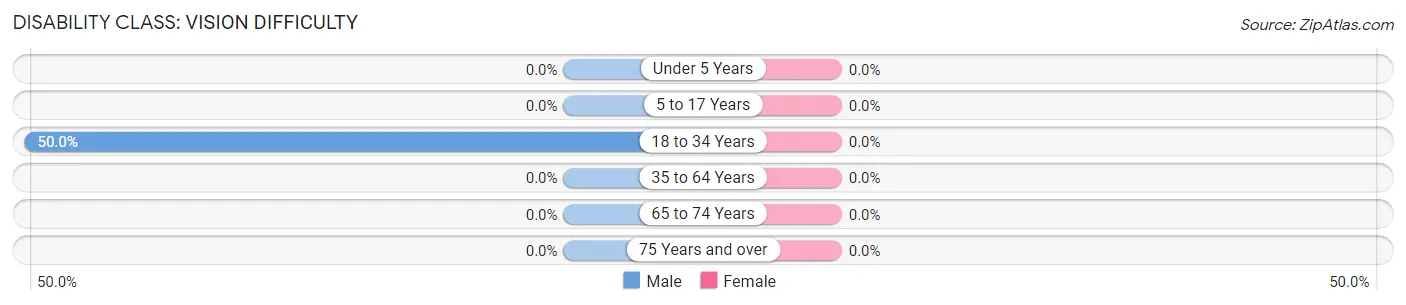
| Age Bracket | Male | Female |
| Under 5 Years | 0 (0.0%) | 0 (0.0%) |
| 5 to 17 Years | 0 (0.0%) | 0 (0.0%) |
| 18 to 34 Years | 6 (50.0%) | 0 (0.0%) |
| 35 to 64 Years | 0 (0.0%) | 0 (0.0%) |
| 65 to 74 Years | 0 (0.0%) | 0 (0.0%) |
| 75 Years and over | 0 (0.0%) | 0 (0.0%) |
Disability Class: Cognitive Difficulty
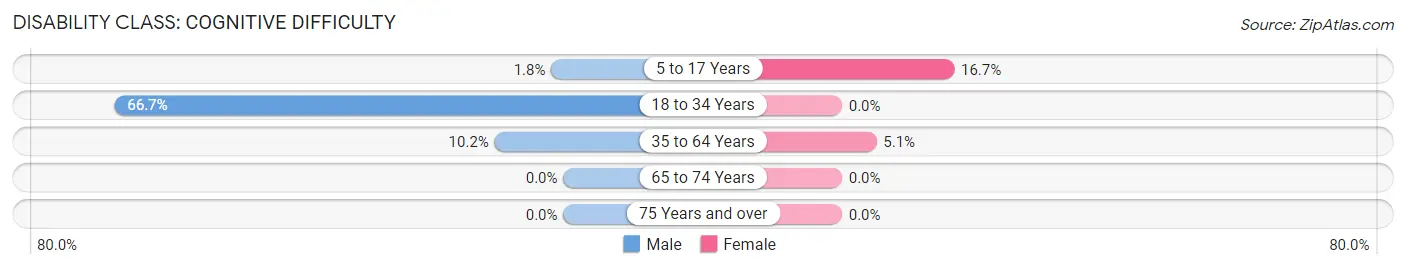
| Age Bracket | Male | Female |
| 5 to 17 Years | 1 (1.8%) | 2 (16.7%) |
| 18 to 34 Years | 8 (66.7%) | 0 (0.0%) |
| 35 to 64 Years | 5 (10.2%) | 4 (5.1%) |
| 65 to 74 Years | 0 (0.0%) | 0 (0.0%) |
| 75 Years and over | 0 (0.0%) | 0 (0.0%) |
Disability Class: Ambulatory Difficulty
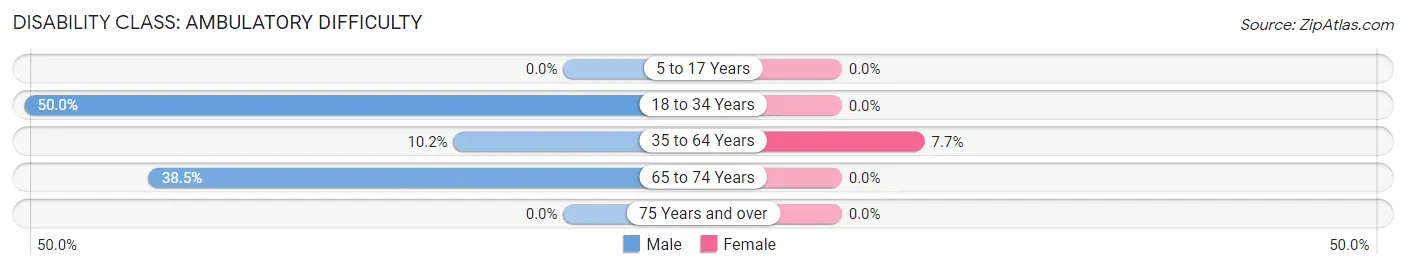
| Age Bracket | Male | Female |
| 5 to 17 Years | 0 (0.0%) | 0 (0.0%) |
| 18 to 34 Years | 6 (50.0%) | 0 (0.0%) |
| 35 to 64 Years | 5 (10.2%) | 6 (7.7%) |
| 65 to 74 Years | 5 (38.5%) | 0 (0.0%) |
| 75 Years and over | 0 (0.0%) | 0 (0.0%) |
Disability Class: Self-Care Difficulty
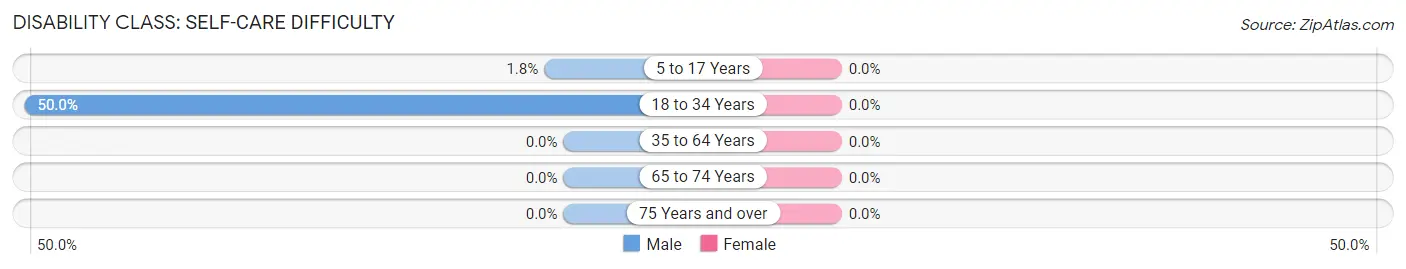
| Age Bracket | Male | Female |
| 5 to 17 Years | 1 (1.8%) | 0 (0.0%) |
| 18 to 34 Years | 6 (50.0%) | 0 (0.0%) |
| 35 to 64 Years | 0 (0.0%) | 0 (0.0%) |
| 65 to 74 Years | 0 (0.0%) | 0 (0.0%) |
| 75 Years and over | 0 (0.0%) | 0 (0.0%) |
Technology Access in Landingville borough
Computing Device Access in Landingville borough
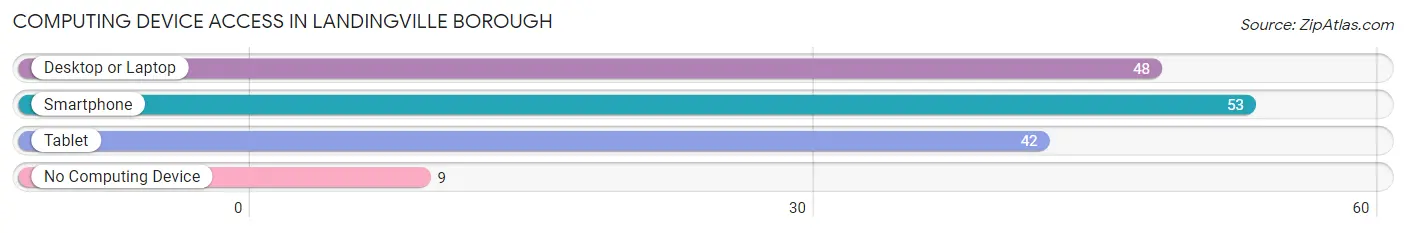
| Device Type | # Households | % Households |
| Desktop or Laptop | 48 | 73.9% |
| Smartphone | 53 | 81.5% |
| Tablet | 42 | 64.6% |
| No Computing Device | 9 | 13.9% |
| Total | 65 | 100.0% |
Internet Access in Landingville borough
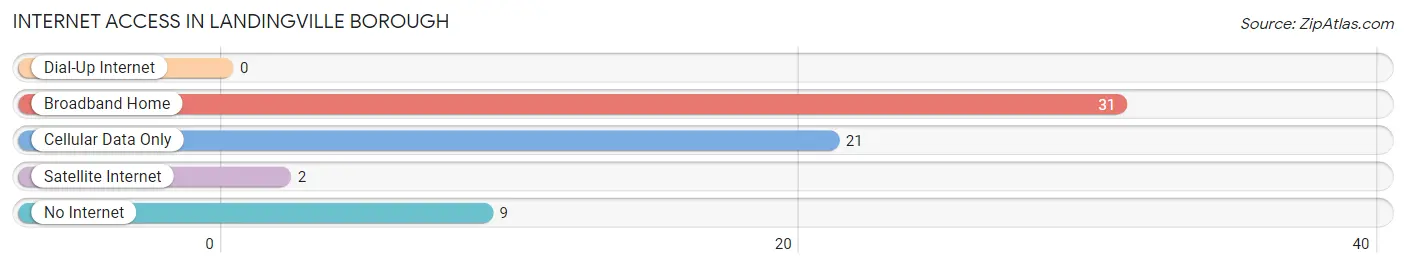
| Internet Type | # Households | % Households |
| Dial-Up Internet | 0 | 0.0% |
| Broadband Home | 31 | 47.7% |
| Cellular Data Only | 21 | 32.3% |
| Satellite Internet | 2 | 3.1% |
| No Internet | 9 | 13.9% |
| Total | 65 | 100.0% |
Landingville borough Summary
Landingville Borough is a small borough located in Schuylkill County, Pennsylvania. It is situated in the southern part of the county, just north of the city of Pottsville. The borough was incorporated in 1876 and has a population of approximately 1,000 people.
Geography
Landingville Borough is located in the southern part of Schuylkill County, Pennsylvania. It is situated in the Appalachian Mountains, and is surrounded by the townships of West Brunswick, East Brunswick, North Manheim, and South Manheim. The borough is located at an elevation of 1,000 feet above sea level. The total area of the borough is 0.6 square miles, all of which is land.
The climate in Landingville Borough is classified as humid continental, with cold winters and hot, humid summers. The average annual temperature is 48°F, and the average annual precipitation is 41 inches.
Economy
The economy of Landingville Borough is largely based on agriculture and tourism. The borough is home to several farms, which produce a variety of crops, including corn, soybeans, hay, and wheat. The borough also has several small businesses, including a grocery store, a hardware store, and a restaurant.
Tourism is an important part of the economy of Landingville Borough. The borough is home to several attractions, including the Landingville Historical Society Museum, the Landingville Railroad Museum, and the Landingville Covered Bridge. The borough also hosts several annual events, including the Landingville Fall Festival and the Landingville Christmas Parade.
Demographics
As of the 2010 census, the population of Landingville Borough was 1,000 people. The racial makeup of the borough was 97.2% White, 0.7% African American, 0.2% Native American, 0.2% Asian, 0.2% from other races, and 1.7% from two or more races. Hispanic or Latino of any race were 0.7% of the population.
The median household income in Landingville Borough was $41,250, and the median family income was $45,833. The per capita income was $19,945. About 8.2% of families and 10.2% of the population were below the poverty line, including 14.3% of those under age 18 and 8.3% of those age 65 or over.
History
Landingville Borough was first settled in the early 1800s by German immigrants. The borough was originally known as “Landing”, and was later renamed “Landingville”. The borough was officially incorporated in 1876.
In the late 1800s, the borough was home to several coal mines, which provided employment for many of the residents. The coal mines were eventually closed in the early 1900s, and the borough’s economy shifted to agriculture and tourism.
In the early 1900s, the borough was home to several churches, including the Landingville United Methodist Church, the Landingville Lutheran Church, and the Landingville Presbyterian Church. The borough also had several schools, including the Landingville Elementary School and the Landingville High School.
Today, Landingville Borough is a small, rural community. The borough is home to several small businesses, farms, and attractions. The borough is also home to several churches and schools, and is a popular destination for tourists.
Common Questions
What is the Total Population of Landingville borough?
Total Population of Landingville borough is 252.
What is the Total Male Population of Landingville borough?
Total Male Population of Landingville borough is 130.
What is the Total Female Population of Landingville borough?
Total Female Population of Landingville borough is 122.
What is the Ratio of Males per 100 Females in Landingville borough?
There are 106.56 Males per 100 Females in Landingville borough.
What is the Ratio of Females per 100 Males in Landingville borough?
There are 93.85 Females per 100 Males in Landingville borough.
What is the Median Population Age in Landingville borough?
Median Population Age in Landingville borough is 43.2 Years.
What is the Average Family Size in Landingville borough
Average Family Size in Landingville borough is 4.3 People.
What is the Average Household Size in Landingville borough
Average Household Size in Landingville borough is 3.9 People.
What is Per Capita Income in Landingville borough?
Per Capita income in Landingville borough is $25,941.
What is the Median Family Income in Landingville borough?
Median Family Income in Landingville borough is $97,500.
What is the Median Household income in Landingville borough?
Median Household Income in Landingville borough is $84,063.
What is Income or Wage Gap in Landingville borough?
Income or Wage Gap in Landingville borough is 13.2%.
Women in Landingville borough earn 86.8 cents for every dollar earned by a man.
What is Family Income Deficit in Landingville borough?
Family Income Deficit in Landingville borough is $1,640.
Families that are below poverty line in Landingville borough earn $1,640 less on average than the poverty threshold level.
What is Inequality or Gini Index in Landingville borough?
Inequality or Gini Index in Landingville borough is 0.36.
How Large is the Labor Force in Landingville borough?
There are 92 People in the Labor Forcein in Landingville borough.
What is the Percentage of People in the Labor Force in Landingville borough?
50.3% of People are in the Labor Force in Landingville borough.