Wallowa, OR
Wallowa Map
Wallowa Overview
724
TOTAL POPULATION
360
MALE POPULATION
364
FEMALE POPULATION
98.90
MALES / 100 FEMALES
101.11
FEMALES / 100 MALES
37.0
MEDIAN AGE
2.8
AVG FAMILY SIZE
2.6
AVG HOUSEHOLD SIZE
$26,660
PER CAPITA INCOME
$53,750
AVG FAMILY INCOME
$46,250
AVG HOUSEHOLD INCOME
9.2%
WAGE / INCOME GAP [ % ]
90.8¢/ $1
WAGE / INCOME GAP [ $ ]
0.33
INEQUALITY / GINI INDEX
325
LABOR FORCE [ PEOPLE ]
61.0%
PERCENT IN LABOR FORCE
2.8%
UNEMPLOYMENT RATE
Wallowa Zip Codes
Wallowa Area Codes
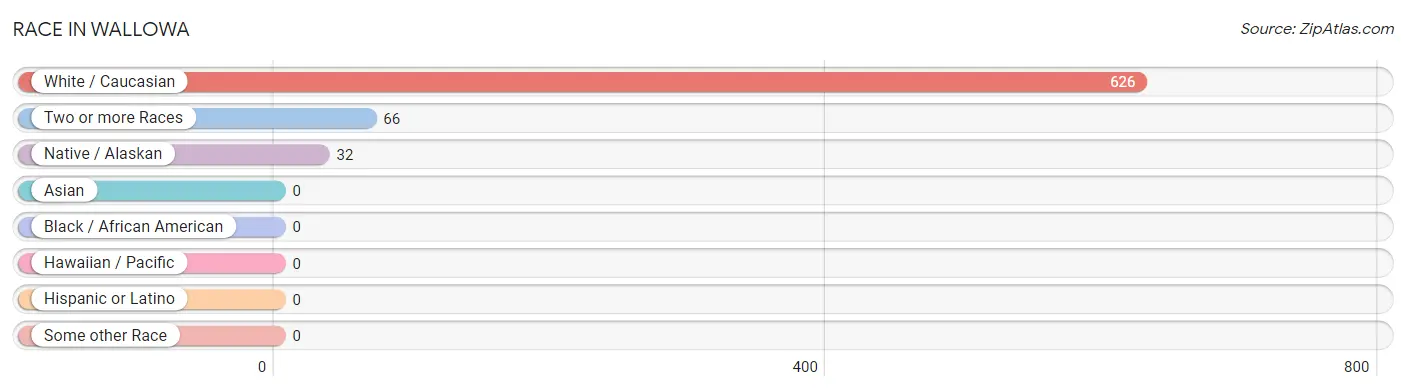
Race in Wallowa
The most populous races in Wallowa are White / Caucasian (626 | 86.5%), Two or more Races (66 | 9.1%), and Native / Alaskan (32 | 4.4%).
| Race | # Population | % Population |
| Asian | 0 | 0.0% |
| Black / African American | 0 | 0.0% |
| Hawaiian / Pacific | 0 | 0.0% |
| Hispanic or Latino | 0 | 0.0% |
| Native / Alaskan | 32 | 4.4% |
| White / Caucasian | 626 | 86.5% |
| Two or more Races | 66 | 9.1% |
| Some other Race | 0 | 0.0% |
| Total | 724 | 100.0% |
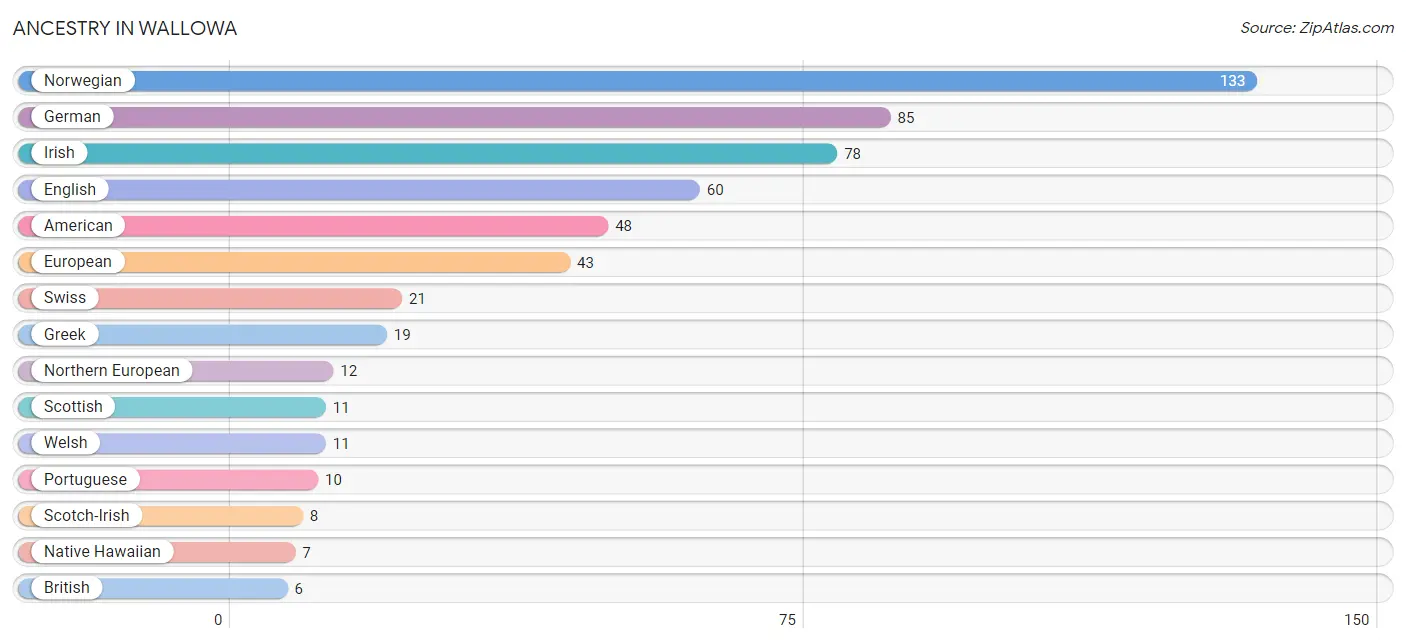
Ancestry in Wallowa
The most populous ancestries reported in Wallowa are Norwegian (133 | 18.4%), German (85 | 11.7%), Irish (78 | 10.8%), English (60 | 8.3%), and American (48 | 6.6%), together accounting for 55.8% of all Wallowa residents.
| Ancestry | # Population | % Population |
| American | 48 | 6.6% |
| British | 6 | 0.8% |
| English | 60 | 8.3% |
| European | 43 | 5.9% |
| German | 85 | 11.7% |
| Greek | 19 | 2.6% |
| Hungarian | 4 | 0.5% |
| Irish | 78 | 10.8% |
| Native Hawaiian | 7 | 1.0% |
| Nigerian | 5 | 0.7% |
| Northern European | 12 | 1.7% |
| Norwegian | 133 | 18.4% |
| Portuguese | 10 | 1.4% |
| Scotch-Irish | 8 | 1.1% |
| Scottish | 11 | 1.5% |
| Subsaharan African | 5 | 0.7% |
| Swiss | 21 | 2.9% |
| Welsh | 11 | 1.5% | View All 18 Rows |
Immigrants in Wallowa

| Immigration Origin | # Population | % Population | View All 0 Rows |
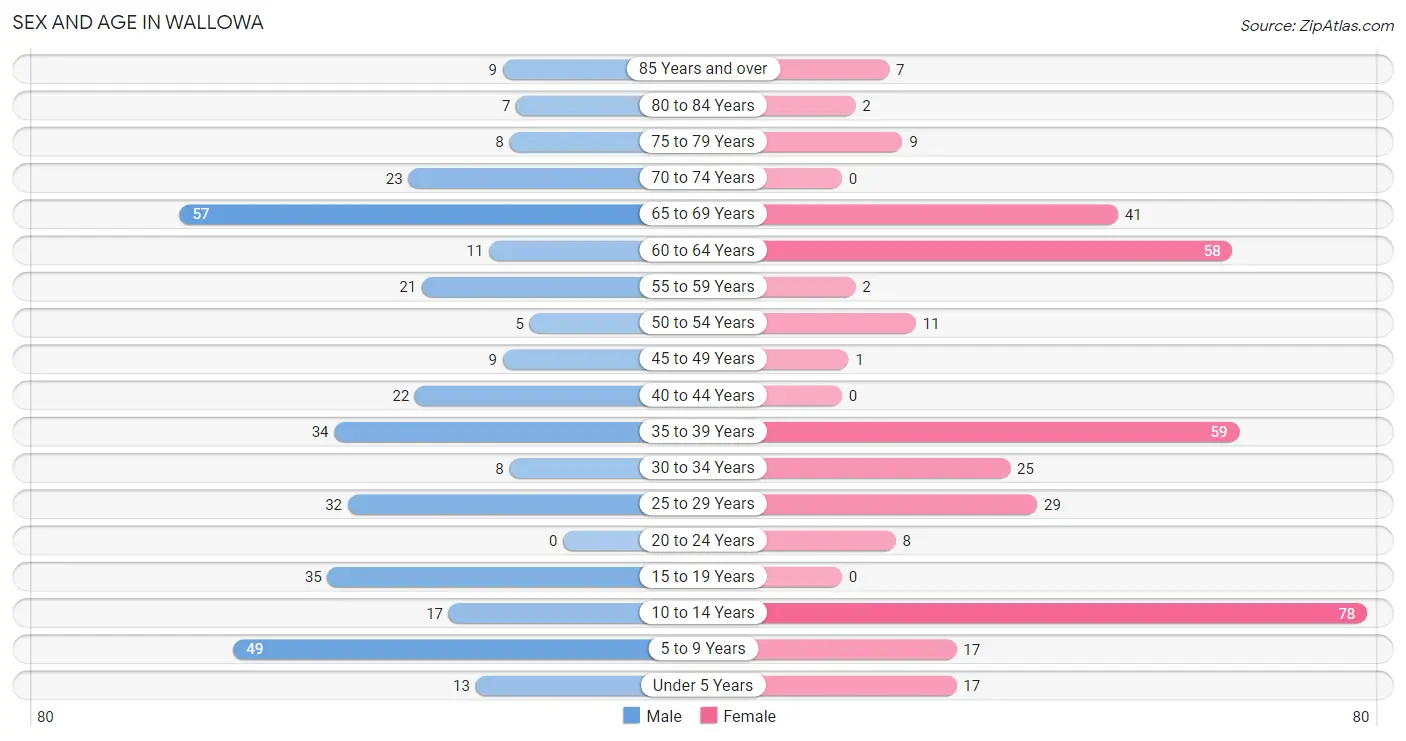
Sex and Age in Wallowa
Sex and Age in Wallowa
The most populous age groups in Wallowa are 65 to 69 Years (57 | 15.8%) for men and 10 to 14 Years (78 | 21.4%) for women.
| Age Bracket | Male | Female |
| Under 5 Years | 13 (3.6%) | 17 (4.7%) |
| 5 to 9 Years | 49 (13.6%) | 17 (4.7%) |
| 10 to 14 Years | 17 (4.7%) | 78 (21.4%) |
| 15 to 19 Years | 35 (9.7%) | 0 (0.0%) |
| 20 to 24 Years | 0 (0.0%) | 8 (2.2%) |
| 25 to 29 Years | 32 (8.9%) | 29 (8.0%) |
| 30 to 34 Years | 8 (2.2%) | 25 (6.9%) |
| 35 to 39 Years | 34 (9.4%) | 59 (16.2%) |
| 40 to 44 Years | 22 (6.1%) | 0 (0.0%) |
| 45 to 49 Years | 9 (2.5%) | 1 (0.3%) |
| 50 to 54 Years | 5 (1.4%) | 11 (3.0%) |
| 55 to 59 Years | 21 (5.8%) | 2 (0.5%) |
| 60 to 64 Years | 11 (3.1%) | 58 (15.9%) |
| 65 to 69 Years | 57 (15.8%) | 41 (11.3%) |
| 70 to 74 Years | 23 (6.4%) | 0 (0.0%) |
| 75 to 79 Years | 8 (2.2%) | 9 (2.5%) |
| 80 to 84 Years | 7 (1.9%) | 2 (0.5%) |
| 85 Years and over | 9 (2.5%) | 7 (1.9%) |
| Total | 360 (100.0%) | 364 (100.0%) |
Families and Households in Wallowa
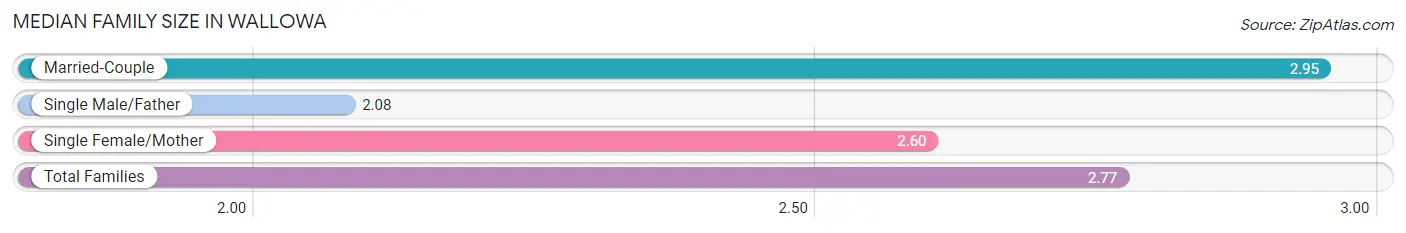
Median Family Size in Wallowa
The median family size in Wallowa is 2.77 persons per family, with married-couple families (148 | 65.2%) accounting for the largest median family size of 2.95 persons per family. On the other hand, single male/father families (26 | 11.5%) represent the smallest median family size with 2.08 persons per family.
| Family Type | # Families | Family Size |
| Married-Couple | 148 (65.2%) | 2.95 |
| Single Male/Father | 26 (11.5%) | 2.08 |
| Single Female/Mother | 53 (23.4%) | 2.60 |
| Total Families | 227 (100.0%) | 2.77 |
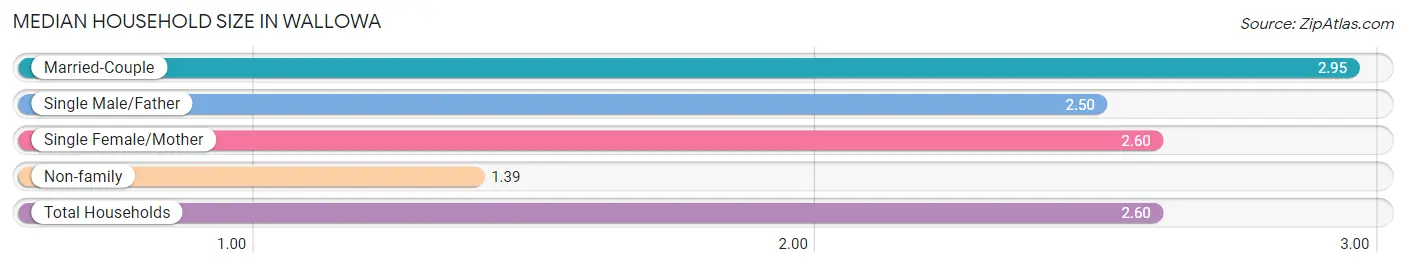
Median Household Size in Wallowa
The median household size in Wallowa is 2.60 persons per household, with married-couple households (148 | 55.2%) accounting for the largest median household size of 2.95 persons per household. non-family households (41 | 15.3%) represent the smallest median household size with 1.39 persons per household.
| Household Type | # Households | Household Size |
| Married-Couple | 148 (55.2%) | 2.95 |
| Single Male/Father | 26 (9.7%) | 2.50 |
| Single Female/Mother | 53 (19.8%) | 2.60 |
| Non-family | 41 (15.3%) | 1.39 |
| Total Households | 268 (100.0%) | 2.60 |
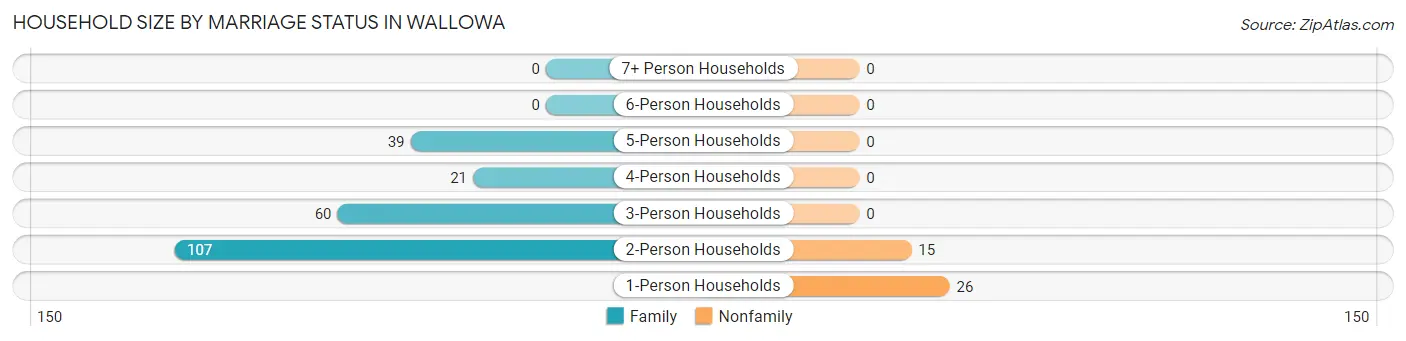
Household Size by Marriage Status in Wallowa
Out of a total of 268 households in Wallowa, 227 (84.7%) are family households, while 41 (15.3%) are nonfamily households. The most numerous type of family households are 2-person households, comprising 107, and the most common type of nonfamily households are 1-person households, comprising 26.
| Household Size | Family Households | Nonfamily Households |
| 1-Person Households | - | 26 (9.7%) |
| 2-Person Households | 107 (39.9%) | 15 (5.6%) |
| 3-Person Households | 60 (22.4%) | 0 (0.0%) |
| 4-Person Households | 21 (7.8%) | 0 (0.0%) |
| 5-Person Households | 39 (14.5%) | 0 (0.0%) |
| 6-Person Households | 0 (0.0%) | 0 (0.0%) |
| 7+ Person Households | 0 (0.0%) | 0 (0.0%) |
| Total | 227 (84.7%) | 41 (15.3%) |
Female Fertility in Wallowa
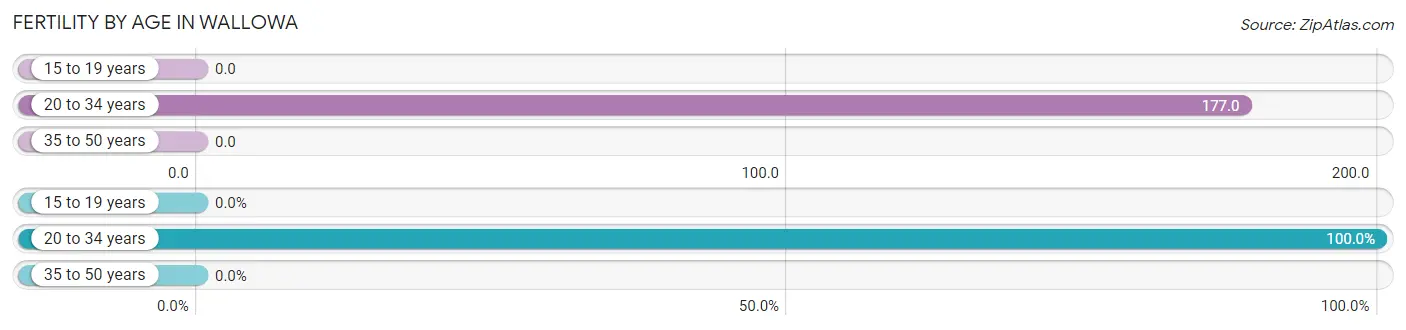
Fertility by Age in Wallowa
Average fertility rate in Wallowa is 90.0 births per 1,000 women. Women in the age bracket of 20 to 34 years have the highest fertility rate with 177.0 births per 1,000 women. Women in the age bracket of 20 to 34 years acount for 100.0% of all women with births.
| Age Bracket | Women with Births | Births / 1,000 Women |
| 15 to 19 years | 0 (0.0%) | 0.0 |
| 20 to 34 years | 11 (100.0%) | 177.0 |
| 35 to 50 years | 0 (0.0%) | 0.0 |
| Total | 11 (100.0%) | 90.0 |
Fertility by Age by Marriage Status in Wallowa
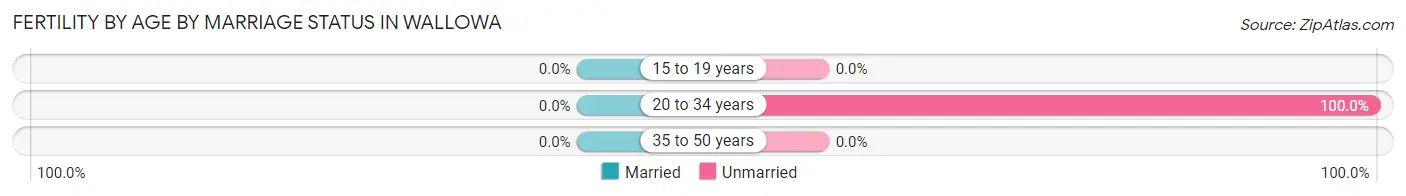
| Age Bracket | Married | Unmarried |
| 15 to 19 years | 0 (0.0%) | 0 (0.0%) |
| 20 to 34 years | 0 (0.0%) | 11 (100.0%) |
| 35 to 50 years | 0 (0.0%) | 0 (0.0%) |
| Total | 0 (0.0%) | 11 (100.0%) |
Fertility by Education in Wallowa
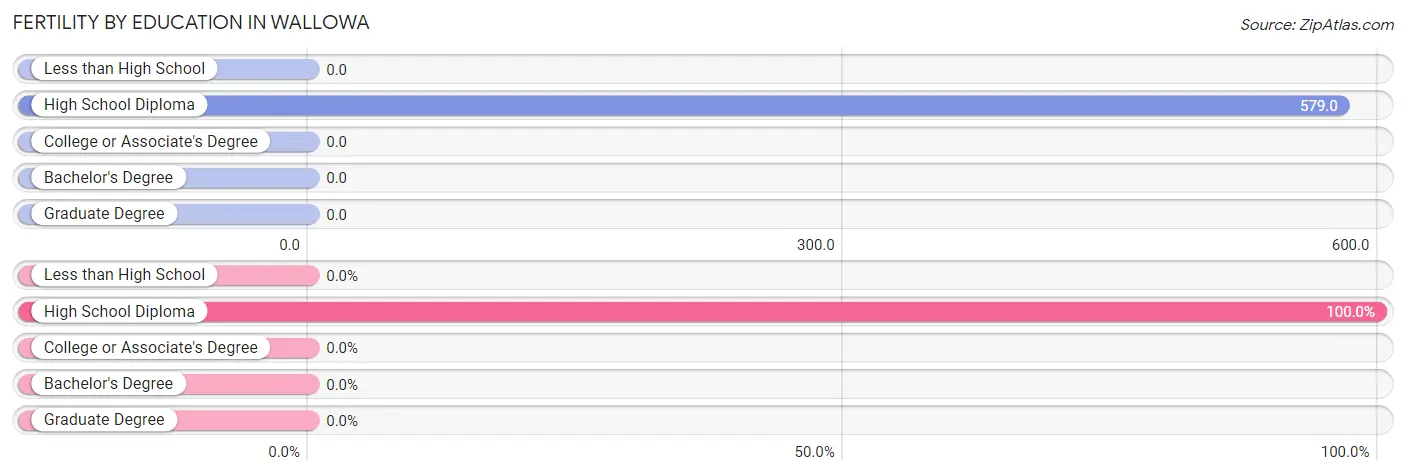
| Educational Attainment | Women with Births | Births / 1,000 Women |
| Less than High School | 0 (0.0%) | 0.0 |
| High School Diploma | 11 (100.0%) | 579.0 |
| College or Associate's Degree | 0 (0.0%) | 0.0 |
| Bachelor's Degree | 0 (0.0%) | 0.0 |
| Graduate Degree | 0 (0.0%) | 0.0 |
| Total | 11 (100.0%) | 90.0 |
Fertility by Education by Marriage Status in Wallowa
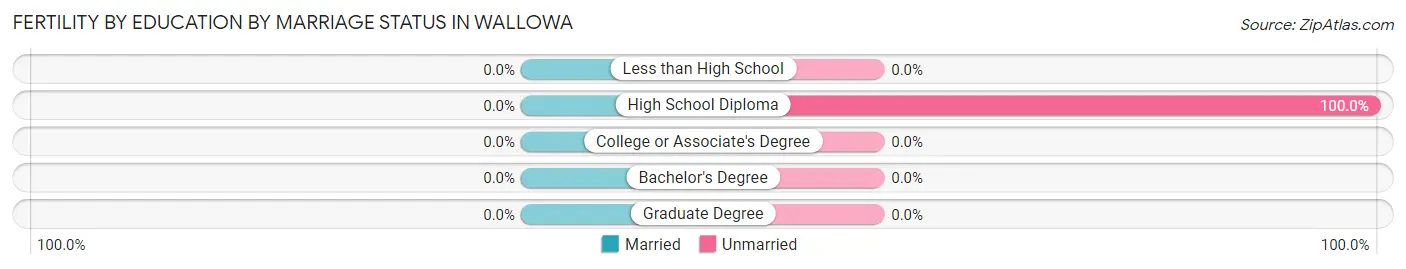
| Educational Attainment | Married | Unmarried |
| Less than High School | 0 (0.0%) | 0 (0.0%) |
| High School Diploma | 0 (0.0%) | 11 (100.0%) |
| College or Associate's Degree | 0 (0.0%) | 0 (0.0%) |
| Bachelor's Degree | 0 (0.0%) | 0 (0.0%) |
| Graduate Degree | 0 (0.0%) | 0 (0.0%) |
| Total | 0 (0.0%) | 11 (100.0%) |
Income in Wallowa
Income Overview in Wallowa
Per Capita Income in Wallowa is $26,660, while median incomes of families and households are $53,750 and $46,250 respectively.
| Characteristic | Number | Measure |
| Per Capita Income | 724 | $26,660 |
| Median Family Income | 227 | $53,750 |
| Mean Family Income | 227 | $74,078 |
| Median Household Income | 268 | $46,250 |
| Mean Household Income | 268 | $70,113 |
| Income Deficit | 227 | $0 |
| Wage / Income Gap (%) | 724 | 9.15% |
| Wage / Income Gap ($) | 724 | 90.85¢ per $1 |
| Gini / Inequality Index | 724 | 0.33 |
Earnings by Sex in Wallowa
Average Earnings in Wallowa are $30,575, $28,309 for men and $31,161 for women, a difference of 9.1%.
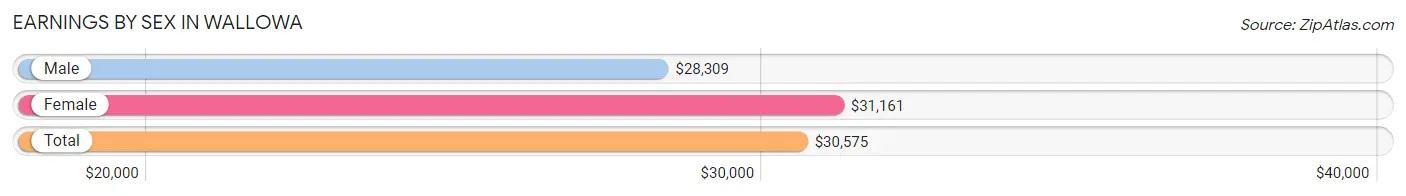
| Sex | Number | Average Earnings |
| Male | 185 (51.5%) | $28,309 |
| Female | 174 (48.5%) | $31,161 |
| Total | 359 (100.0%) | $30,575 |
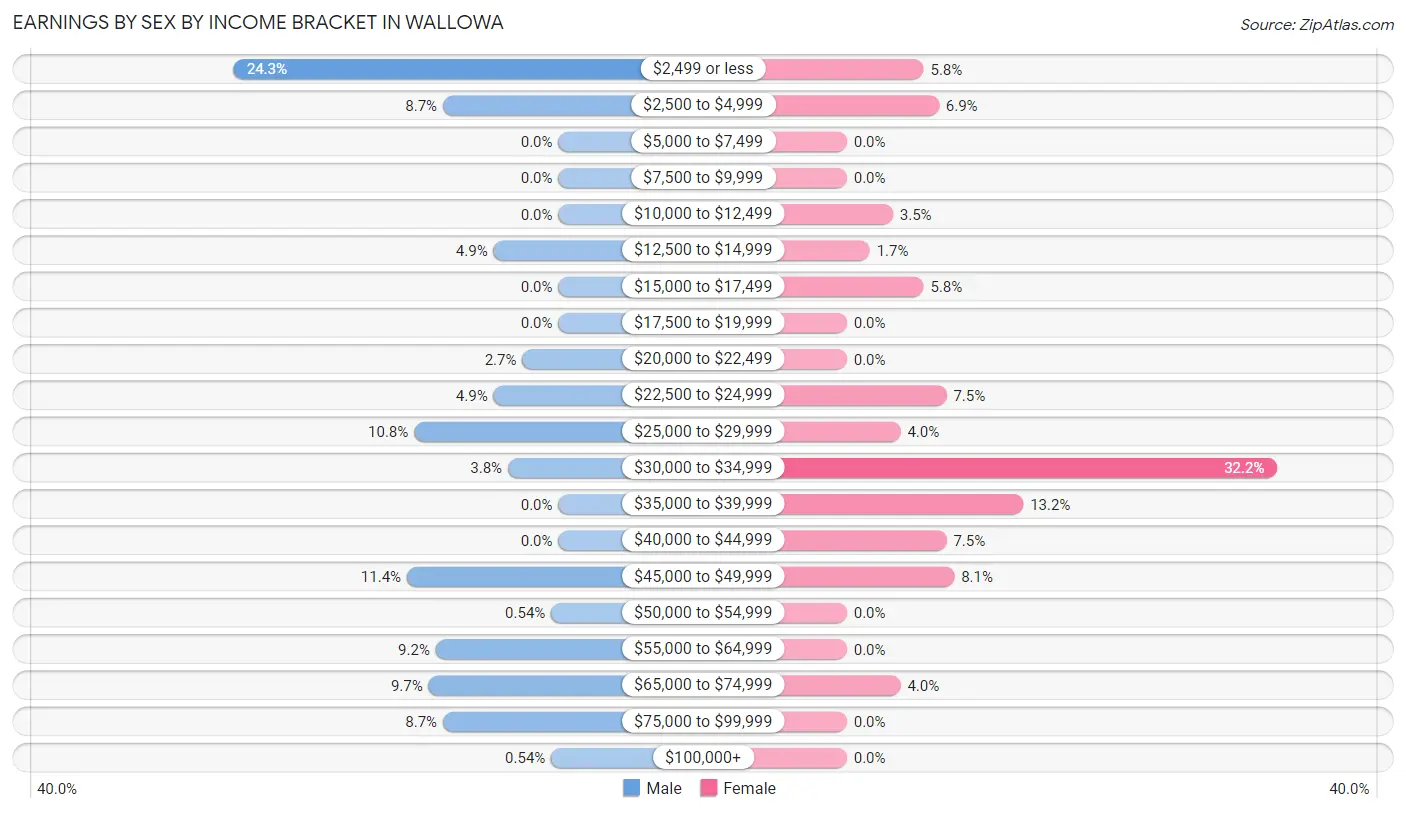
Earnings by Sex by Income Bracket in Wallowa
The most common earnings brackets in Wallowa are $2,499 or less for men (45 | 24.3%) and $30,000 to $34,999 for women (56 | 32.2%).
| Income | Male | Female |
| $2,499 or less | 45 (24.3%) | 10 (5.8%) |
| $2,500 to $4,999 | 16 (8.6%) | 12 (6.9%) |
| $5,000 to $7,499 | 0 (0.0%) | 0 (0.0%) |
| $7,500 to $9,999 | 0 (0.0%) | 0 (0.0%) |
| $10,000 to $12,499 | 0 (0.0%) | 6 (3.5%) |
| $12,500 to $14,999 | 9 (4.9%) | 3 (1.7%) |
| $15,000 to $17,499 | 0 (0.0%) | 10 (5.8%) |
| $17,500 to $19,999 | 0 (0.0%) | 0 (0.0%) |
| $20,000 to $22,499 | 5 (2.7%) | 0 (0.0%) |
| $22,500 to $24,999 | 9 (4.9%) | 13 (7.5%) |
| $25,000 to $29,999 | 20 (10.8%) | 7 (4.0%) |
| $30,000 to $34,999 | 7 (3.8%) | 56 (32.2%) |
| $35,000 to $39,999 | 0 (0.0%) | 23 (13.2%) |
| $40,000 to $44,999 | 0 (0.0%) | 13 (7.5%) |
| $45,000 to $49,999 | 21 (11.4%) | 14 (8.1%) |
| $50,000 to $54,999 | 1 (0.5%) | 0 (0.0%) |
| $55,000 to $64,999 | 17 (9.2%) | 0 (0.0%) |
| $65,000 to $74,999 | 18 (9.7%) | 7 (4.0%) |
| $75,000 to $99,999 | 16 (8.6%) | 0 (0.0%) |
| $100,000+ | 1 (0.5%) | 0 (0.0%) |
| Total | 185 (100.0%) | 174 (100.0%) |
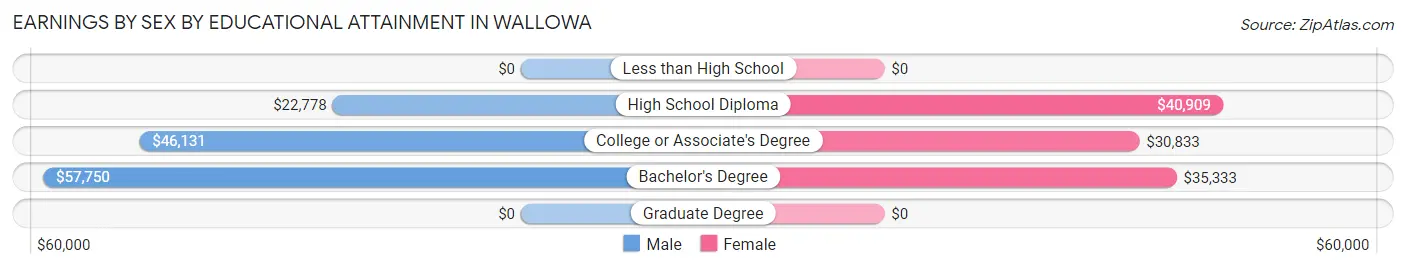
Earnings by Sex by Educational Attainment in Wallowa
| Educational Attainment | Male Income | Female Income |
| Less than High School | - | - |
| High School Diploma | $22,778 | $40,909 |
| College or Associate's Degree | $46,131 | $30,833 |
| Bachelor's Degree | $57,750 | $35,333 |
| Graduate Degree | - | - |
| Total | - | - |
Family Income in Wallowa
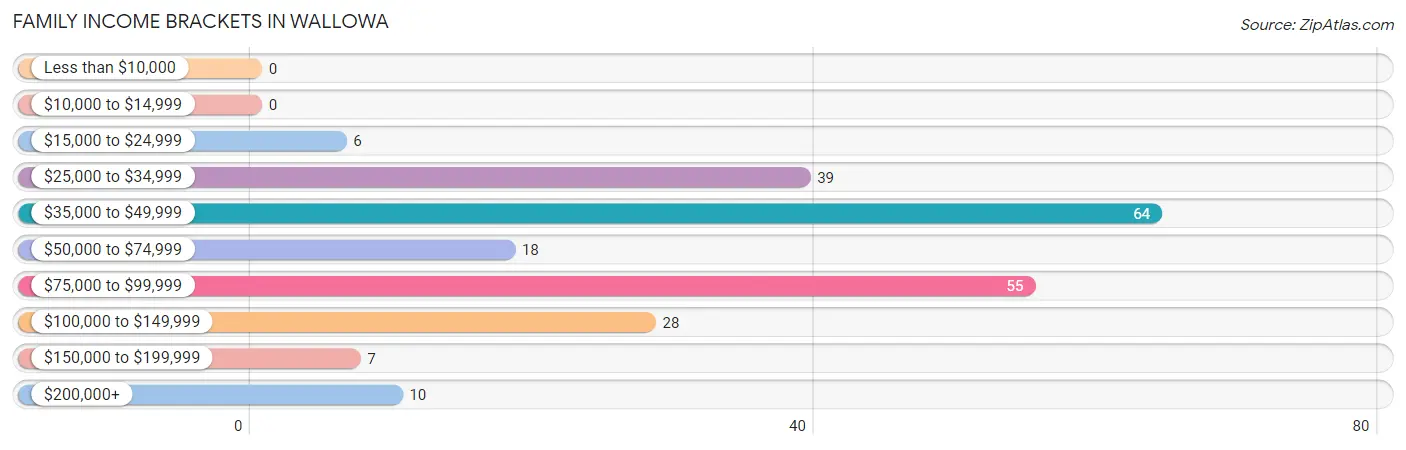
Family Income Brackets in Wallowa
According to the Wallowa family income data, there are 64 families falling into the $35,000 to $49,999 income range, which is the most common income bracket and makes up 28.2% of all families.
| Income Bracket | # Families | % Families |
| Less than $10,000 | 0 | 0.0% |
| $10,000 to $14,999 | 0 | 0.0% |
| $15,000 to $24,999 | 6 | 2.6% |
| $25,000 to $34,999 | 39 | 17.2% |
| $35,000 to $49,999 | 64 | 28.2% |
| $50,000 to $74,999 | 18 | 7.9% |
| $75,000 to $99,999 | 55 | 24.2% |
| $100,000 to $149,999 | 28 | 12.3% |
| $150,000 to $199,999 | 7 | 3.1% |
| $200,000+ | 10 | 4.4% |
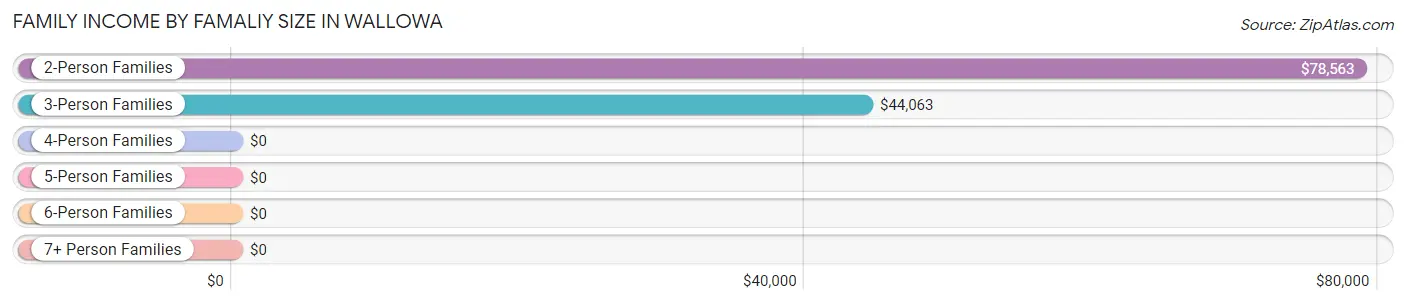
Family Income by Famaliy Size in Wallowa
2-person families (107 | 47.1%) account for the highest median family income in Wallowa with $78,563 per family, while 2-person families (107 | 47.1%) have the highest median income of $39,282 per family member.
| Income Bracket | # Families | Median Income |
| 2-Person Families | 107 (47.1%) | $78,563 |
| 3-Person Families | 60 (26.4%) | $44,063 |
| 4-Person Families | 38 (16.7%) | $0 |
| 5-Person Families | 22 (9.7%) | $0 |
| 6-Person Families | 0 (0.0%) | $0 |
| 7+ Person Families | 0 (0.0%) | $0 |
| Total | 227 (100.0%) | $53,750 |
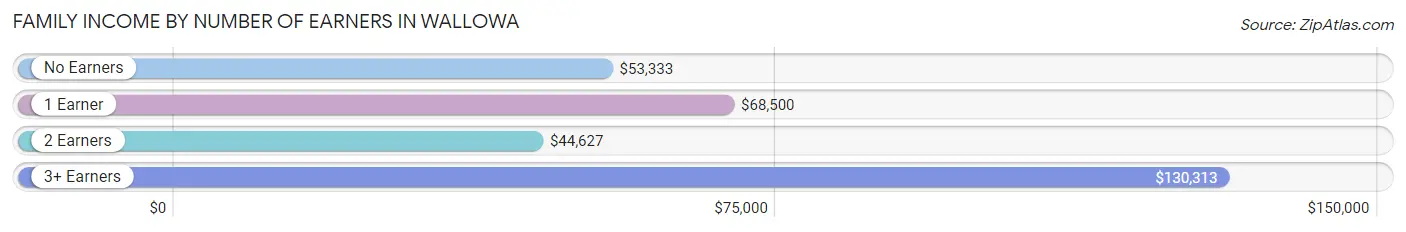
Family Income by Number of Earners in Wallowa
The median family income in Wallowa is $53,750, with families comprising 3+ earners (14) having the highest median family income of $130,313, while families with 2 earners (119) have the lowest median family income of $44,627, accounting for 6.2% and 52.4% of families, respectively.
| Number of Earners | # Families | Median Income |
| No Earners | 32 (14.1%) | $53,333 |
| 1 Earner | 62 (27.3%) | $68,500 |
| 2 Earners | 119 (52.4%) | $44,627 |
| 3+ Earners | 14 (6.2%) | $130,313 |
| Total | 227 (100.0%) | $53,750 |
Household Income in Wallowa
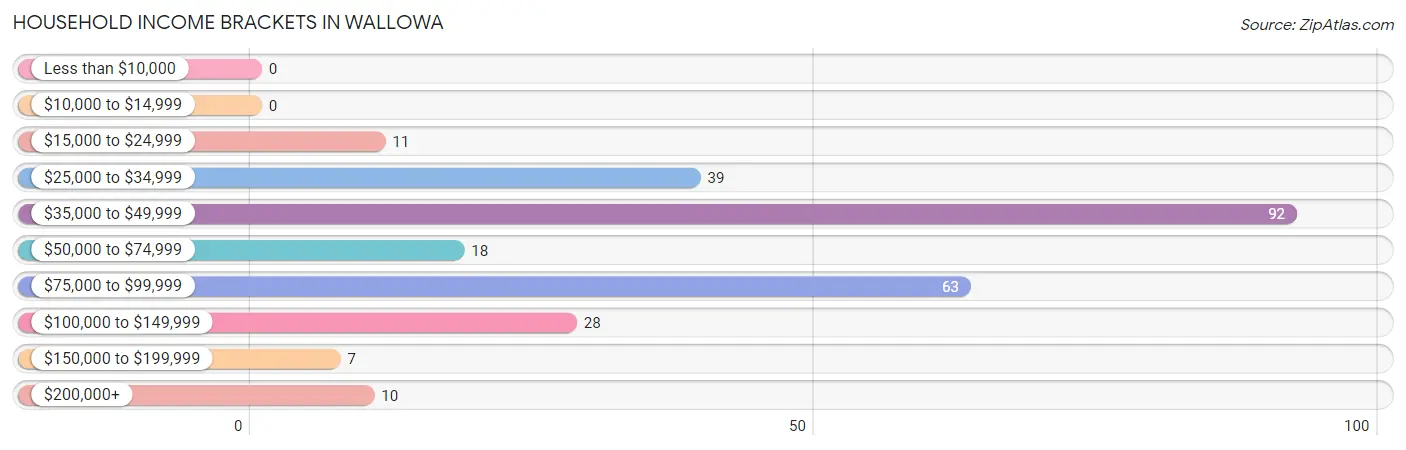
Household Income Brackets in Wallowa
With 92 households falling in the category, the $35,000 to $49,999 income range is the most frequent in Wallowa, accounting for 34.3% of all households.
| Income Bracket | # Households | % Households |
| Less than $10,000 | 0 | 0.0% |
| $10,000 to $14,999 | 0 | 0.0% |
| $15,000 to $24,999 | 11 | 4.1% |
| $25,000 to $34,999 | 39 | 14.6% |
| $35,000 to $49,999 | 92 | 34.3% |
| $50,000 to $74,999 | 18 | 6.7% |
| $75,000 to $99,999 | 63 | 23.5% |
| $100,000 to $149,999 | 28 | 10.4% |
| $150,000 to $199,999 | 7 | 2.6% |
| $200,000+ | 10 | 3.7% |
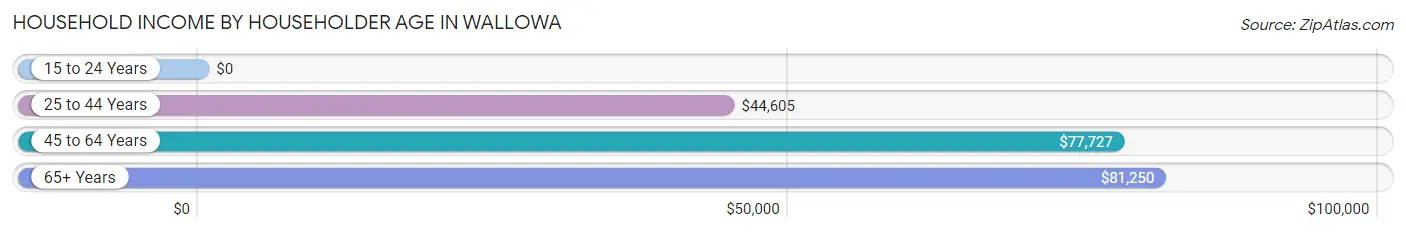
Household Income by Householder Age in Wallowa
The median household income in Wallowa is $46,250, with the highest median household income of $81,250 found in the 65+ years age bracket for the primary householder. A total of 60 households (22.4%) fall into this category.
| Income Bracket | # Households | Median Income |
| 15 to 24 Years | 0 (0.0%) | $0 |
| 25 to 44 Years | 142 (53.0%) | $44,605 |
| 45 to 64 Years | 66 (24.6%) | $77,727 |
| 65+ Years | 60 (22.4%) | $81,250 |
| Total | 268 (100.0%) | $46,250 |
Poverty in Wallowa
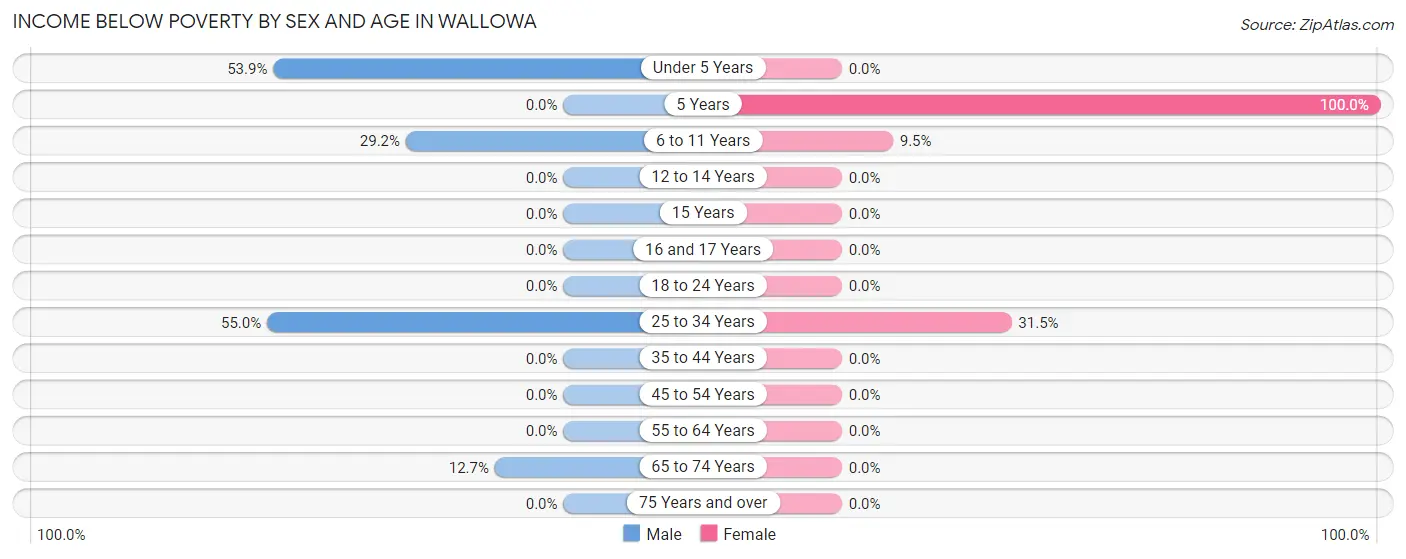
Income Below Poverty by Sex and Age in Wallowa
With 16.4% poverty level for males and 8.9% for females among the residents of Wallowa, 25 to 34 year old males and 5 year old females are the most vulnerable to poverty, with 22 males (55.0%) and 8 females (100.0%) in their respective age groups living below the poverty level.
| Age Bracket | Male | Female |
| Under 5 Years | 7 (53.8%) | 0 (0.0%) |
| 5 Years | 0 (0.0%) | 8 (100.0%) |
| 6 to 11 Years | 19 (29.2%) | 7 (9.5%) |
| 12 to 14 Years | 0 (0.0%) | 0 (0.0%) |
| 15 Years | 0 (0.0%) | 0 (0.0%) |
| 16 and 17 Years | 0 (0.0%) | 0 (0.0%) |
| 18 to 24 Years | 0 (0.0%) | 0 (0.0%) |
| 25 to 34 Years | 22 (55.0%) | 17 (31.5%) |
| 35 to 44 Years | 0 (0.0%) | 0 (0.0%) |
| 45 to 54 Years | 0 (0.0%) | 0 (0.0%) |
| 55 to 64 Years | 0 (0.0%) | 0 (0.0%) |
| 65 to 74 Years | 7 (12.7%) | 0 (0.0%) |
| 75 Years and over | 0 (0.0%) | 0 (0.0%) |
| Total | 55 (16.4%) | 32 (8.9%) |
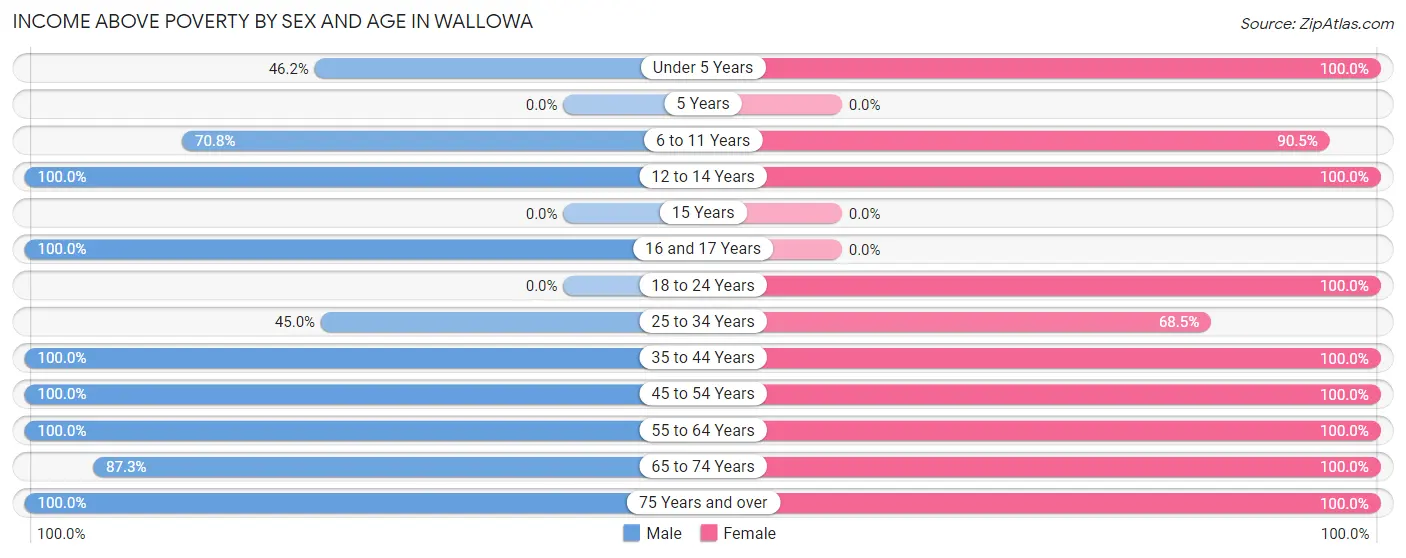
Income Above Poverty by Sex and Age in Wallowa
According to the poverty statistics in Wallowa, males aged 12 to 14 years and females aged under 5 years are the age groups that are most secure financially, with 100.0% of males and 100.0% of females in these age groups living above the poverty line.
| Age Bracket | Male | Female |
| Under 5 Years | 6 (46.2%) | 17 (100.0%) |
| 5 Years | 0 (0.0%) | 0 (0.0%) |
| 6 to 11 Years | 46 (70.8%) | 67 (90.5%) |
| 12 to 14 Years | 1 (100.0%) | 13 (100.0%) |
| 15 Years | 0 (0.0%) | 0 (0.0%) |
| 16 and 17 Years | 35 (100.0%) | 0 (0.0%) |
| 18 to 24 Years | 0 (0.0%) | 8 (100.0%) |
| 25 to 34 Years | 18 (45.0%) | 37 (68.5%) |
| 35 to 44 Years | 56 (100.0%) | 59 (100.0%) |
| 45 to 54 Years | 14 (100.0%) | 12 (100.0%) |
| 55 to 64 Years | 32 (100.0%) | 60 (100.0%) |
| 65 to 74 Years | 48 (87.3%) | 41 (100.0%) |
| 75 Years and over | 24 (100.0%) | 15 (100.0%) |
| Total | 280 (83.6%) | 329 (91.1%) |
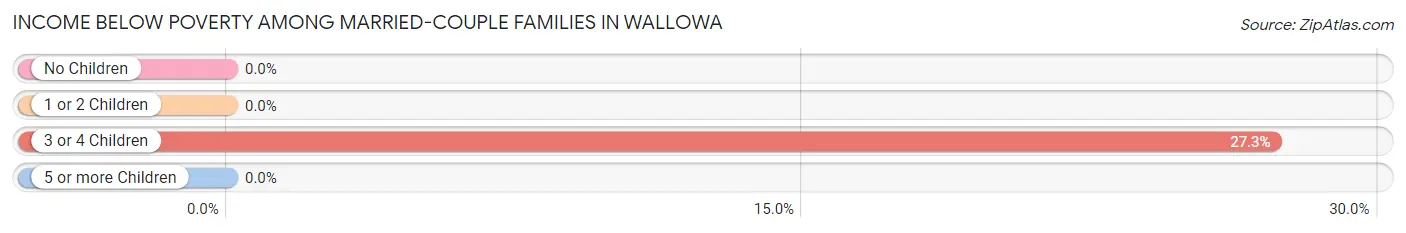
Income Below Poverty Among Married-Couple Families in Wallowa
The poverty statistics for married-couple families in Wallowa show that 4.1% or 6 of the total 148 families live below the poverty line. Families with 3 or 4 children have the highest poverty rate of 27.3%, comprising of 6 families. On the other hand, families with no children have the lowest poverty rate of 0.0%, which includes 0 families.
| Children | Above Poverty | Below Poverty |
| No Children | 98 (100.0%) | 0 (0.0%) |
| 1 or 2 Children | 28 (100.0%) | 0 (0.0%) |
| 3 or 4 Children | 16 (72.7%) | 6 (27.3%) |
| 5 or more Children | 0 (0.0%) | 0 (0.0%) |
| Total | 142 (96.0%) | 6 (4.1%) |
Income Below Poverty Among Single-Parent Households in Wallowa
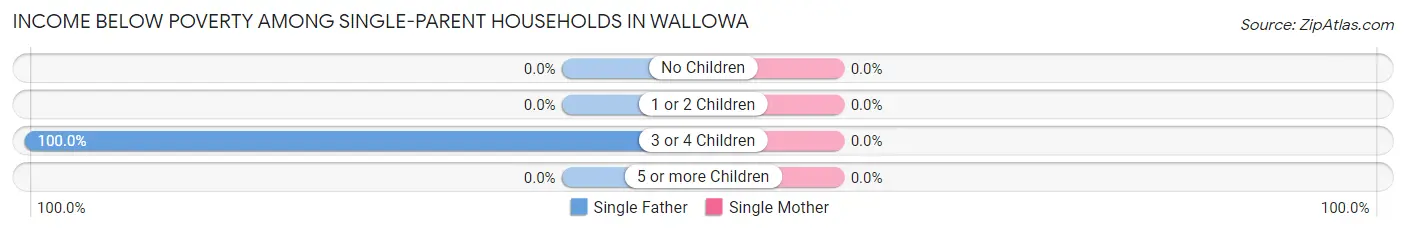
| Children | Single Father | Single Mother |
| No Children | 0 (0.0%) | 0 (0.0%) |
| 1 or 2 Children | 0 (0.0%) | 0 (0.0%) |
| 3 or 4 Children | 17 (100.0%) | 0 (0.0%) |
| 5 or more Children | 0 (0.0%) | 0 (0.0%) |
| Total | 17 (65.4%) | 0 (0.0%) |
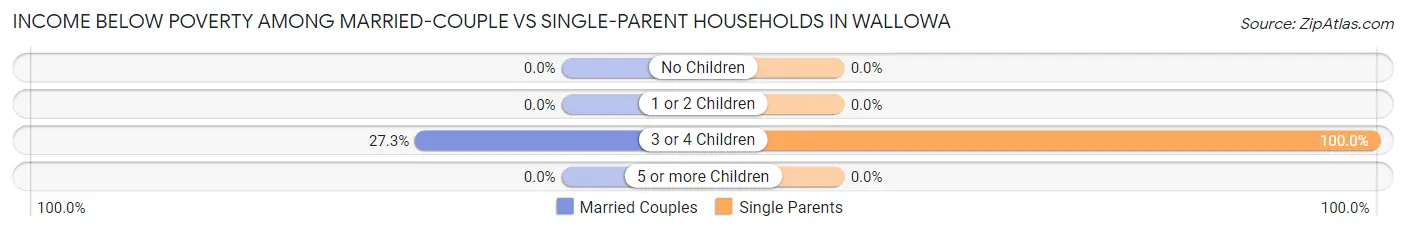
Income Below Poverty Among Married-Couple vs Single-Parent Households in Wallowa
The poverty data for Wallowa shows that 6 of the married-couple family households (4.1%) and 17 of the single-parent households (21.5%) are living below the poverty level. Within the married-couple family households, those with 3 or 4 children have the highest poverty rate, with 6 households (27.3%) falling below the poverty line. Among the single-parent households, those with 3 or 4 children have the highest poverty rate, with 17 household (100.0%) living below poverty.
| Children | Married-Couple Families | Single-Parent Households |
| No Children | 0 (0.0%) | 0 (0.0%) |
| 1 or 2 Children | 0 (0.0%) | 0 (0.0%) |
| 3 or 4 Children | 6 (27.3%) | 17 (100.0%) |
| 5 or more Children | 0 (0.0%) | 0 (0.0%) |
| Total | 6 (4.1%) | 17 (21.5%) |
Employment Characteristics in Wallowa
Employment by Class of Employer in Wallowa
Among the 316 employed individuals in Wallowa, private company employees (140 | 44.3%), federal government employees (54 | 17.1%), and self-employed (incorporated) (34 | 10.8%) make up the most common classes of employment.
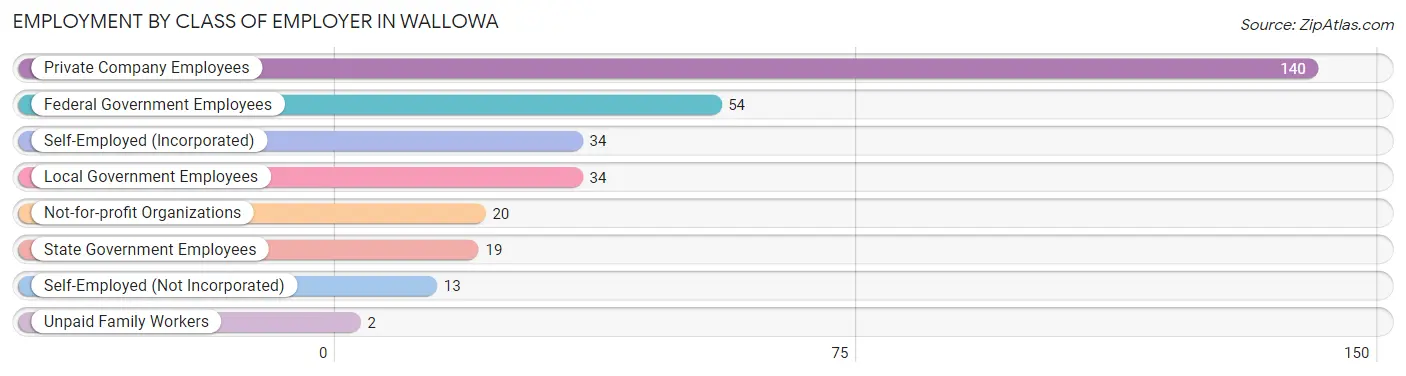
| Employer Class | # Employees | % Employees |
| Private Company Employees | 140 | 44.3% |
| Self-Employed (Incorporated) | 34 | 10.8% |
| Self-Employed (Not Incorporated) | 13 | 4.1% |
| Not-for-profit Organizations | 20 | 6.3% |
| Local Government Employees | 34 | 10.8% |
| State Government Employees | 19 | 6.0% |
| Federal Government Employees | 54 | 17.1% |
| Unpaid Family Workers | 2 | 0.6% |
| Total | 316 | 100.0% |
Employment Status by Age in Wallowa
According to the labor force statistics for Wallowa, out of the total population over 16 years of age (533), 61.0% or 325 individuals are in the labor force, with 2.8% or 9 of them unemployed. The age group with the highest labor force participation rate is 20 to 24 years, with 100.0% or 8 individuals in the labor force. Within the labor force, the 55 to 59 years age range has the highest percentage of unemployed individuals, with 39.1% or 9 of them being unemployed.
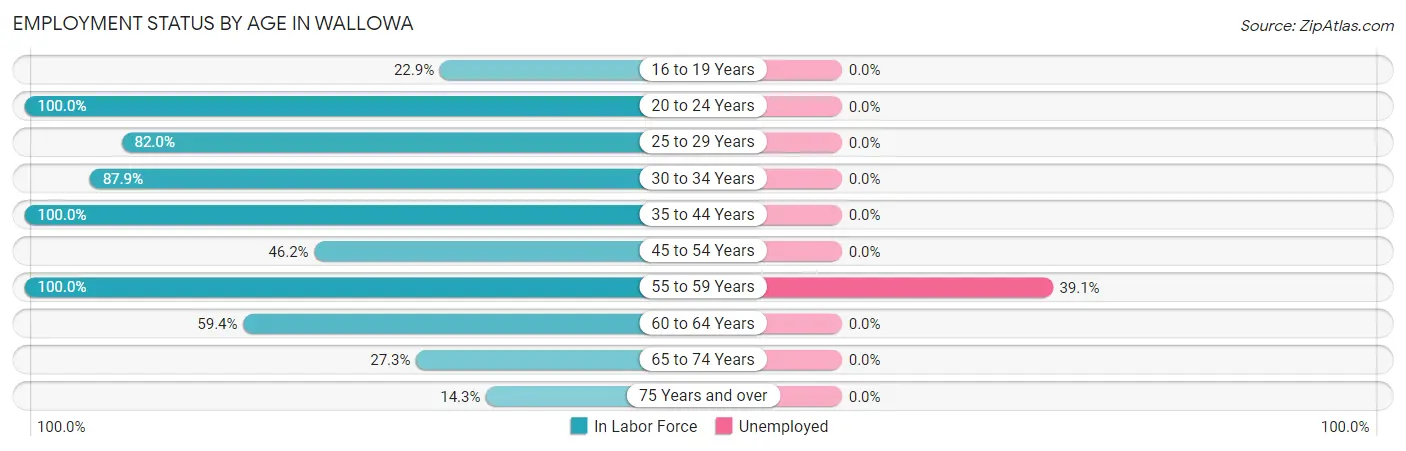
| Age Bracket | In Labor Force | Unemployed |
| 16 to 19 Years | 8 (22.9%) | 0 (0.0%) |
| 20 to 24 Years | 8 (100.0%) | 0 (0.0%) |
| 25 to 29 Years | 50 (82.0%) | 0 (0.0%) |
| 30 to 34 Years | 29 (87.9%) | 0 (0.0%) |
| 35 to 44 Years | 115 (100.0%) | 0 (0.0%) |
| 45 to 54 Years | 12 (46.2%) | 0 (0.0%) |
| 55 to 59 Years | 23 (100.0%) | 9 (39.1%) |
| 60 to 64 Years | 41 (59.4%) | 0 (0.0%) |
| 65 to 74 Years | 33 (27.3%) | 0 (0.0%) |
| 75 Years and over | 6 (14.3%) | 0 (0.0%) |
| Total | 325 (61.0%) | 9 (2.8%) |
Employment Status by Educational Attainment in Wallowa
According to labor force statistics for Wallowa, 82.6% of individuals (270) out of the total population between 25 and 64 years of age (327) are in the labor force, with 3.3% or 9 of them being unemployed. The group with the highest labor force participation rate are those with the educational attainment of bachelor's degree or higher, with 95.1% or 39 individuals in the labor force. Within the labor force, individuals with college / associate degree education have the highest percentage of unemployment, with 5.4% or 9 of them being unemployed.
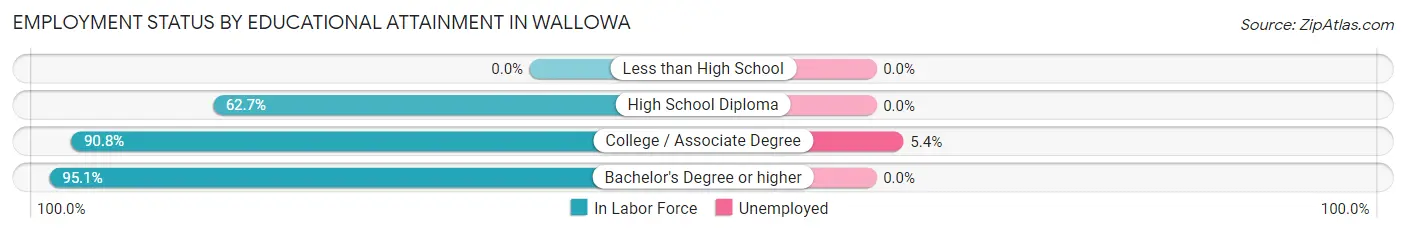
| Educational Attainment | In Labor Force | Unemployed |
| Less than High School | 0 (0.0%) | 0 (0.0%) |
| High School Diploma | 64 (62.7%) | 0 (0.0%) |
| College / Associate Degree | 167 (90.8%) | 10 (5.4%) |
| Bachelor's Degree or higher | 39 (95.1%) | 0 (0.0%) |
| Total | 270 (82.6%) | 11 (3.3%) |
Employment Occupations by Sex in Wallowa
Management, Business, Science and Arts Occupations
The most common Management, Business, Science and Arts occupations in Wallowa are Management (19 | 6.0%), Community & Social Service (13 | 4.1%), Arts, Media & Entertainment (7 | 2.2%), Health Diagnosing & Treating (7 | 2.2%), and Education Instruction & Library (6 | 1.9%).
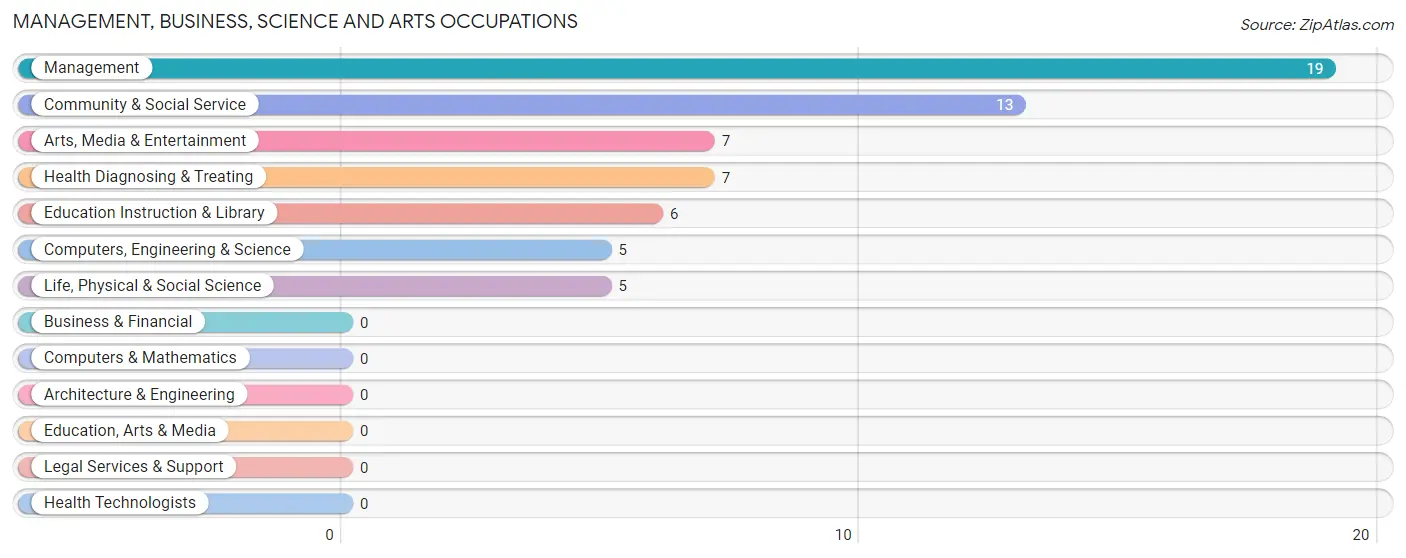
Management, Business, Science and Arts Occupations by Sex
Within the Management, Business, Science and Arts occupations in Wallowa, the most male-oriented occupations are Computers, Engineering & Science (100.0%), Life, Physical & Social Science (100.0%), and Management (89.5%), while the most female-oriented occupations are Community & Social Service (100.0%), Education Instruction & Library (100.0%), and Arts, Media & Entertainment (100.0%).
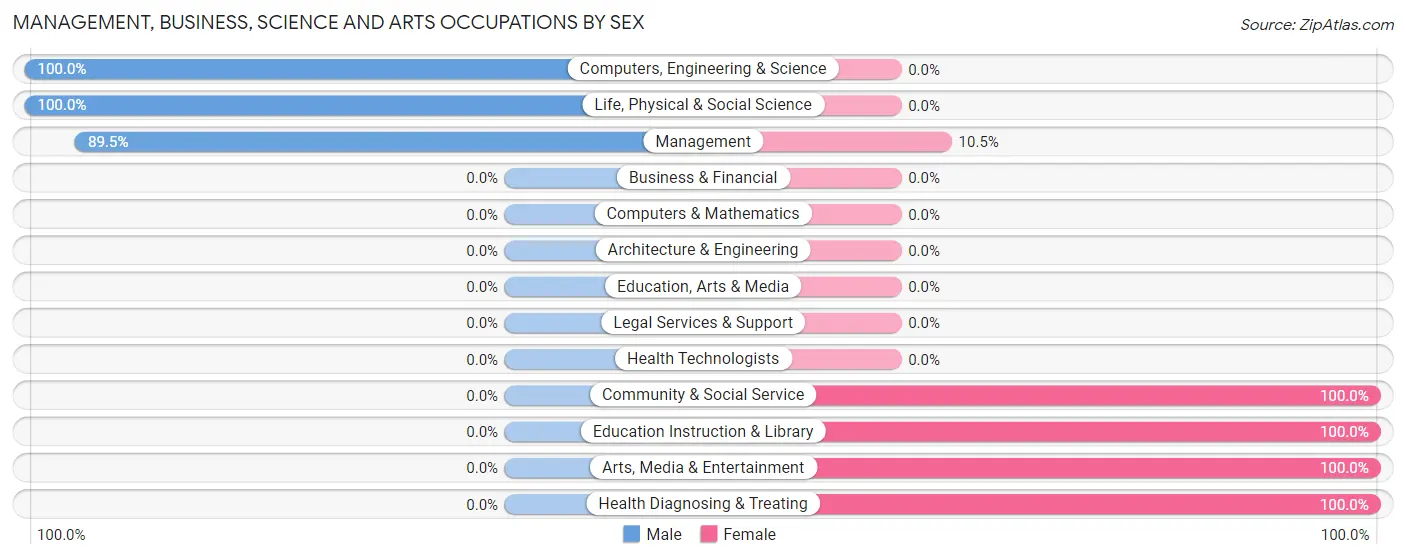
| Occupation | Male | Female |
| Management | 17 (89.5%) | 2 (10.5%) |
| Business & Financial | 0 (0.0%) | 0 (0.0%) |
| Computers, Engineering & Science | 5 (100.0%) | 0 (0.0%) |
| Computers & Mathematics | 0 (0.0%) | 0 (0.0%) |
| Architecture & Engineering | 0 (0.0%) | 0 (0.0%) |
| Life, Physical & Social Science | 5 (100.0%) | 0 (0.0%) |
| Community & Social Service | 0 (0.0%) | 13 (100.0%) |
| Education, Arts & Media | 0 (0.0%) | 0 (0.0%) |
| Legal Services & Support | 0 (0.0%) | 0 (0.0%) |
| Education Instruction & Library | 0 (0.0%) | 6 (100.0%) |
| Arts, Media & Entertainment | 0 (0.0%) | 7 (100.0%) |
| Health Diagnosing & Treating | 0 (0.0%) | 7 (100.0%) |
| Health Technologists | 0 (0.0%) | 0 (0.0%) |
| Total (Category) | 22 (50.0%) | 22 (50.0%) |
| Total (Overall) | 142 (44.9%) | 174 (55.1%) |
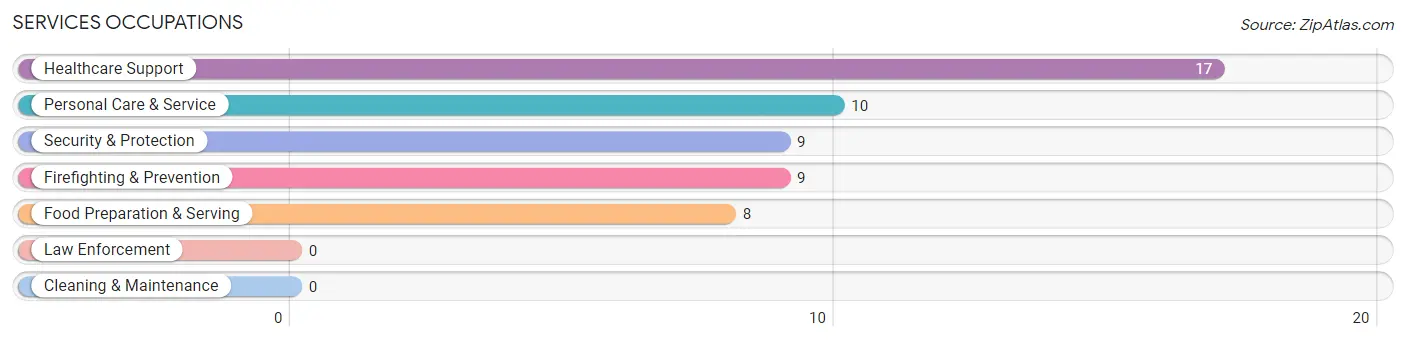
Services Occupations
The most common Services occupations in Wallowa are Healthcare Support (17 | 5.4%), Personal Care & Service (10 | 3.2%), Security & Protection (9 | 2.9%), Firefighting & Prevention (9 | 2.9%), and Food Preparation & Serving (8 | 2.5%).
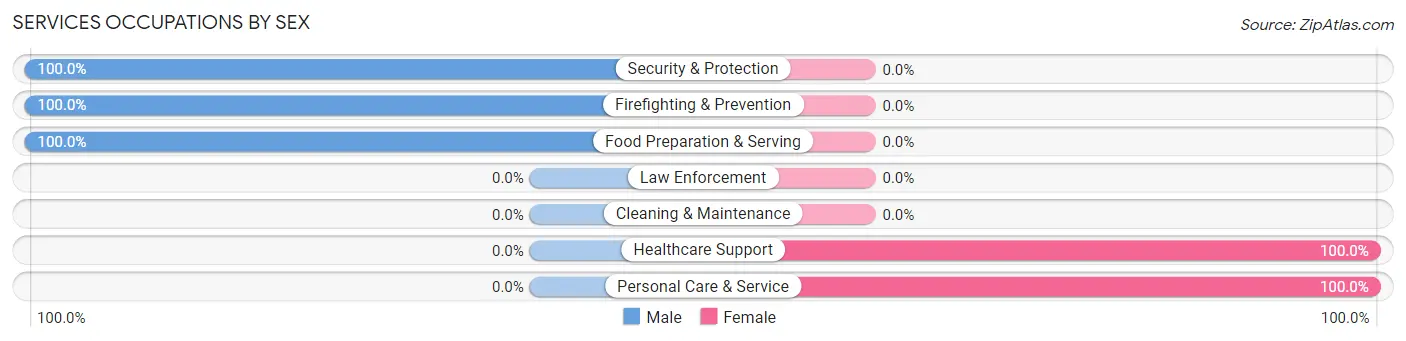
Services Occupations by Sex
Within the Services occupations in Wallowa, the most male-oriented occupations are Security & Protection (100.0%), Firefighting & Prevention (100.0%), and Food Preparation & Serving (100.0%), while the most female-oriented occupations are Healthcare Support (100.0%), and Personal Care & Service (100.0%).
| Occupation | Male | Female |
| Healthcare Support | 0 (0.0%) | 17 (100.0%) |
| Security & Protection | 9 (100.0%) | 0 (0.0%) |
| Firefighting & Prevention | 9 (100.0%) | 0 (0.0%) |
| Law Enforcement | 0 (0.0%) | 0 (0.0%) |
| Food Preparation & Serving | 8 (100.0%) | 0 (0.0%) |
| Cleaning & Maintenance | 0 (0.0%) | 0 (0.0%) |
| Personal Care & Service | 0 (0.0%) | 10 (100.0%) |
| Total (Category) | 17 (38.6%) | 27 (61.4%) |
| Total (Overall) | 142 (44.9%) | 174 (55.1%) |
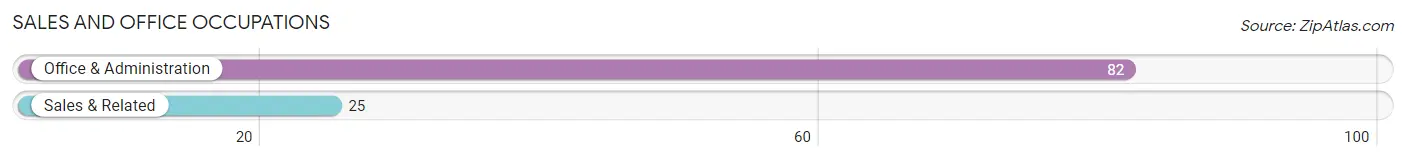
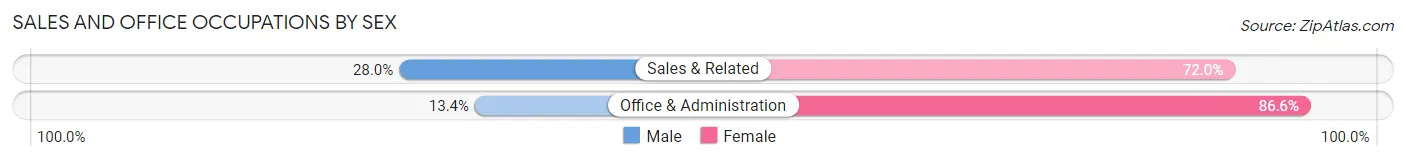
Sales and Office Occupations
The most common Sales and Office occupations in Wallowa are Office & Administration (82 | 26.0%), and Sales & Related (25 | 7.9%).
Sales and Office Occupations by Sex
| Occupation | Male | Female |
| Sales & Related | 7 (28.0%) | 18 (72.0%) |
| Office & Administration | 11 (13.4%) | 71 (86.6%) |
| Total (Category) | 18 (16.8%) | 89 (83.2%) |
| Total (Overall) | 142 (44.9%) | 174 (55.1%) |
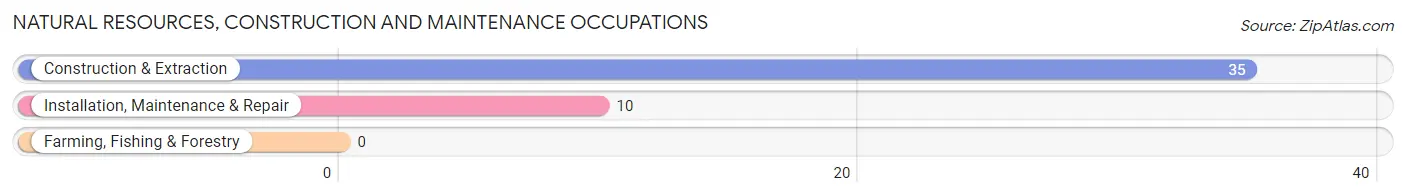
Natural Resources, Construction and Maintenance Occupations
The most common Natural Resources, Construction and Maintenance occupations in Wallowa are Construction & Extraction (35 | 11.1%), and Installation, Maintenance & Repair (10 | 3.2%).
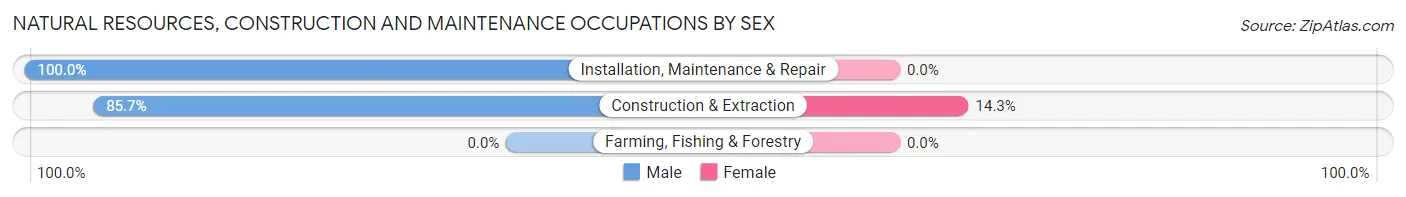
Natural Resources, Construction and Maintenance Occupations by Sex
| Occupation | Male | Female |
| Farming, Fishing & Forestry | 0 (0.0%) | 0 (0.0%) |
| Construction & Extraction | 30 (85.7%) | 5 (14.3%) |
| Installation, Maintenance & Repair | 10 (100.0%) | 0 (0.0%) |
| Total (Category) | 40 (88.9%) | 5 (11.1%) |
| Total (Overall) | 142 (44.9%) | 174 (55.1%) |
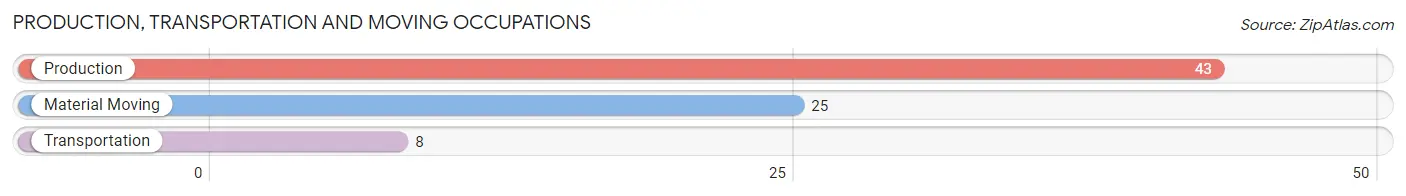
Production, Transportation and Moving Occupations
The most common Production, Transportation and Moving occupations in Wallowa are Production (43 | 13.6%), Material Moving (25 | 7.9%), and Transportation (8 | 2.5%).
Production, Transportation and Moving Occupations by Sex
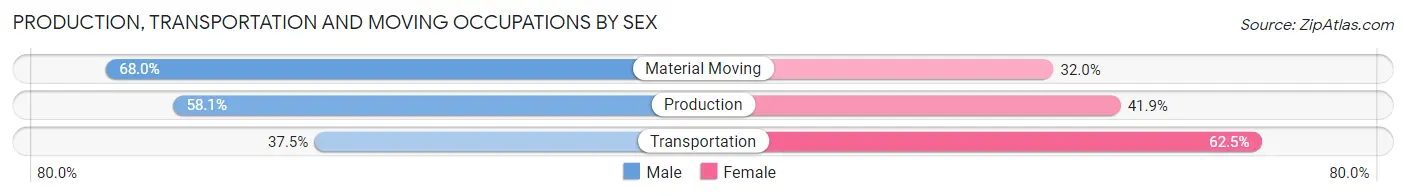
| Occupation | Male | Female |
| Production | 25 (58.1%) | 18 (41.9%) |
| Transportation | 3 (37.5%) | 5 (62.5%) |
| Material Moving | 17 (68.0%) | 8 (32.0%) |
| Total (Category) | 45 (59.2%) | 31 (40.8%) |
| Total (Overall) | 142 (44.9%) | 174 (55.1%) |
Employment Industries by Sex in Wallowa
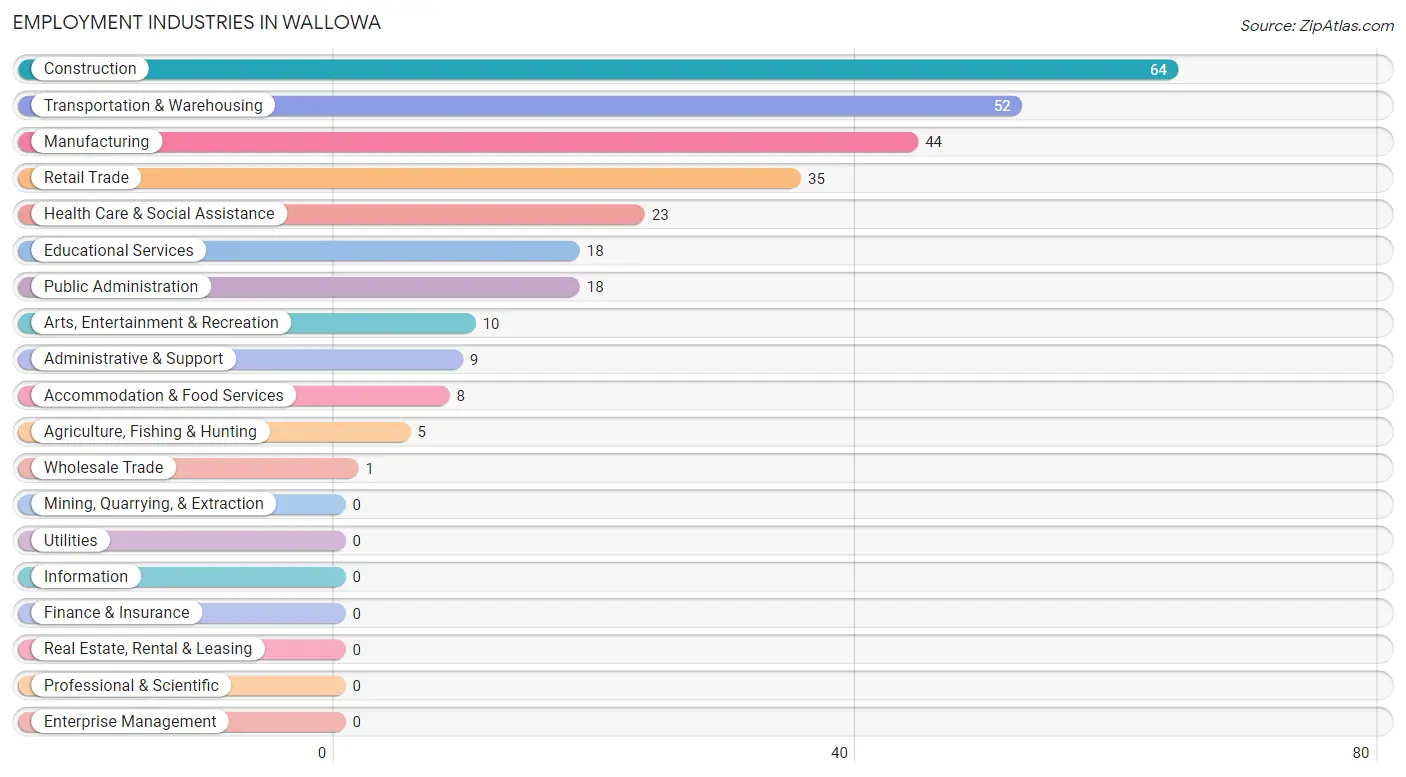
Employment Industries in Wallowa
The major employment industries in Wallowa include Construction (64 | 20.3%), Transportation & Warehousing (52 | 16.5%), Manufacturing (44 | 13.9%), Retail Trade (35 | 11.1%), and Health Care & Social Assistance (23 | 7.3%).
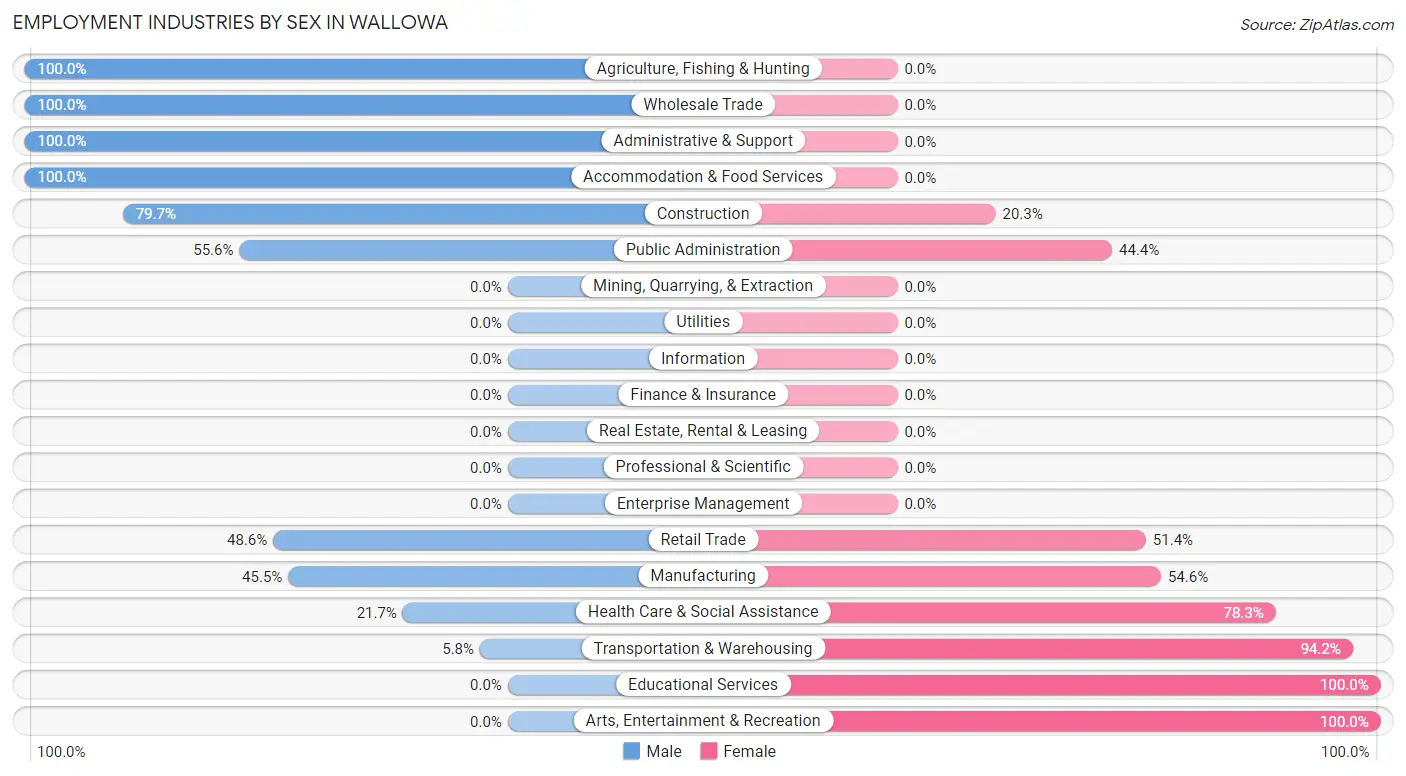
Employment Industries by Sex in Wallowa
The Wallowa industries that see more men than women are Agriculture, Fishing & Hunting (100.0%), Wholesale Trade (100.0%), and Administrative & Support (100.0%), whereas the industries that tend to have a higher number of women are Educational Services (100.0%), Arts, Entertainment & Recreation (100.0%), and Transportation & Warehousing (94.2%).
| Industry | Male | Female |
| Agriculture, Fishing & Hunting | 5 (100.0%) | 0 (0.0%) |
| Mining, Quarrying, & Extraction | 0 (0.0%) | 0 (0.0%) |
| Construction | 51 (79.7%) | 13 (20.3%) |
| Manufacturing | 20 (45.5%) | 24 (54.5%) |
| Wholesale Trade | 1 (100.0%) | 0 (0.0%) |
| Retail Trade | 17 (48.6%) | 18 (51.4%) |
| Transportation & Warehousing | 3 (5.8%) | 49 (94.2%) |
| Utilities | 0 (0.0%) | 0 (0.0%) |
| Information | 0 (0.0%) | 0 (0.0%) |
| Finance & Insurance | 0 (0.0%) | 0 (0.0%) |
| Real Estate, Rental & Leasing | 0 (0.0%) | 0 (0.0%) |
| Professional & Scientific | 0 (0.0%) | 0 (0.0%) |
| Enterprise Management | 0 (0.0%) | 0 (0.0%) |
| Administrative & Support | 9 (100.0%) | 0 (0.0%) |
| Educational Services | 0 (0.0%) | 18 (100.0%) |
| Health Care & Social Assistance | 5 (21.7%) | 18 (78.3%) |
| Arts, Entertainment & Recreation | 0 (0.0%) | 10 (100.0%) |
| Accommodation & Food Services | 8 (100.0%) | 0 (0.0%) |
| Public Administration | 10 (55.6%) | 8 (44.4%) |
| Total | 142 (44.9%) | 174 (55.1%) |
Education in Wallowa
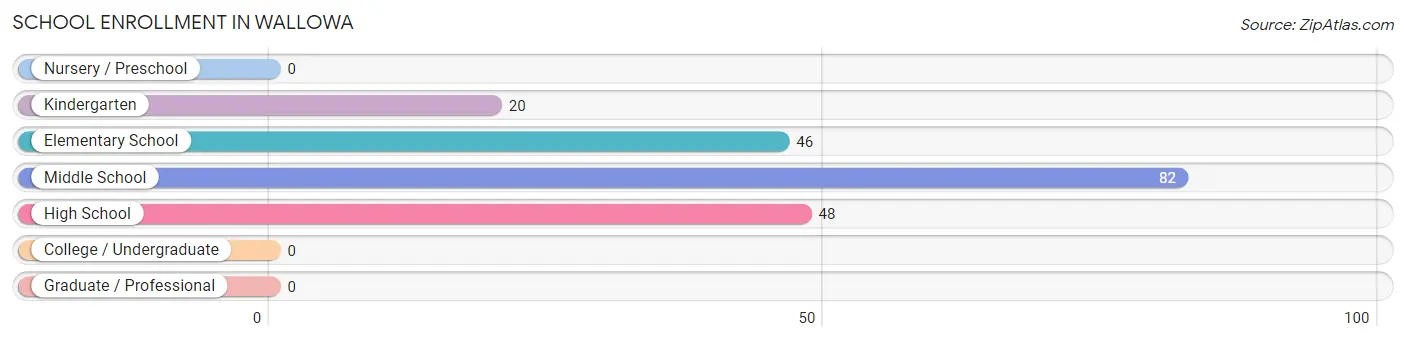
School Enrollment in Wallowa
The most common levels of schooling among the 196 students in Wallowa are middle school (82 | 41.8%), high school (48 | 24.5%), and elementary school (46 | 23.5%).
| School Level | # Students | % Students |
| Nursery / Preschool | 0 | 0.0% |
| Kindergarten | 20 | 10.2% |
| Elementary School | 46 | 23.5% |
| Middle School | 82 | 41.8% |
| High School | 48 | 24.5% |
| College / Undergraduate | 0 | 0.0% |
| Graduate / Professional | 0 | 0.0% |
| Total | 196 | 100.0% |
School Enrollment by Age by Funding Source in Wallowa
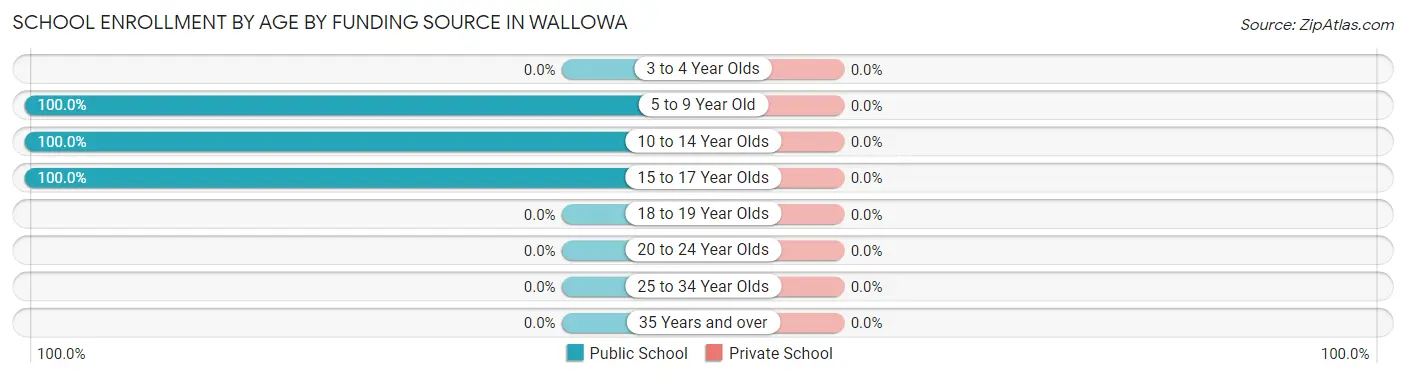
| Age Bracket | Public School | Private School |
| 3 to 4 Year Olds | 0 (0.0%) | 0 (0.0%) |
| 5 to 9 Year Old | 66 (100.0%) | 0 (0.0%) |
| 10 to 14 Year Olds | 95 (100.0%) | 0 (0.0%) |
| 15 to 17 Year Olds | 35 (100.0%) | 0 (0.0%) |
| 18 to 19 Year Olds | 0 (0.0%) | 0 (0.0%) |
| 20 to 24 Year Olds | 0 (0.0%) | 0 (0.0%) |
| 25 to 34 Year Olds | 0 (0.0%) | 0 (0.0%) |
| 35 Years and over | 0 (0.0%) | 0 (0.0%) |
| Total | 196 (100.0%) | 0 (0.0%) |
Educational Attainment by Field of Study in Wallowa
Education (28 | 29.8%), arts & humanities (17 | 18.1%), science & technology (12 | 12.8%), physical & health sciences (9 | 9.6%), and engineering (7 | 7.4%) are the most common fields of study among 94 individuals in Wallowa who have obtained a bachelor's degree or higher.
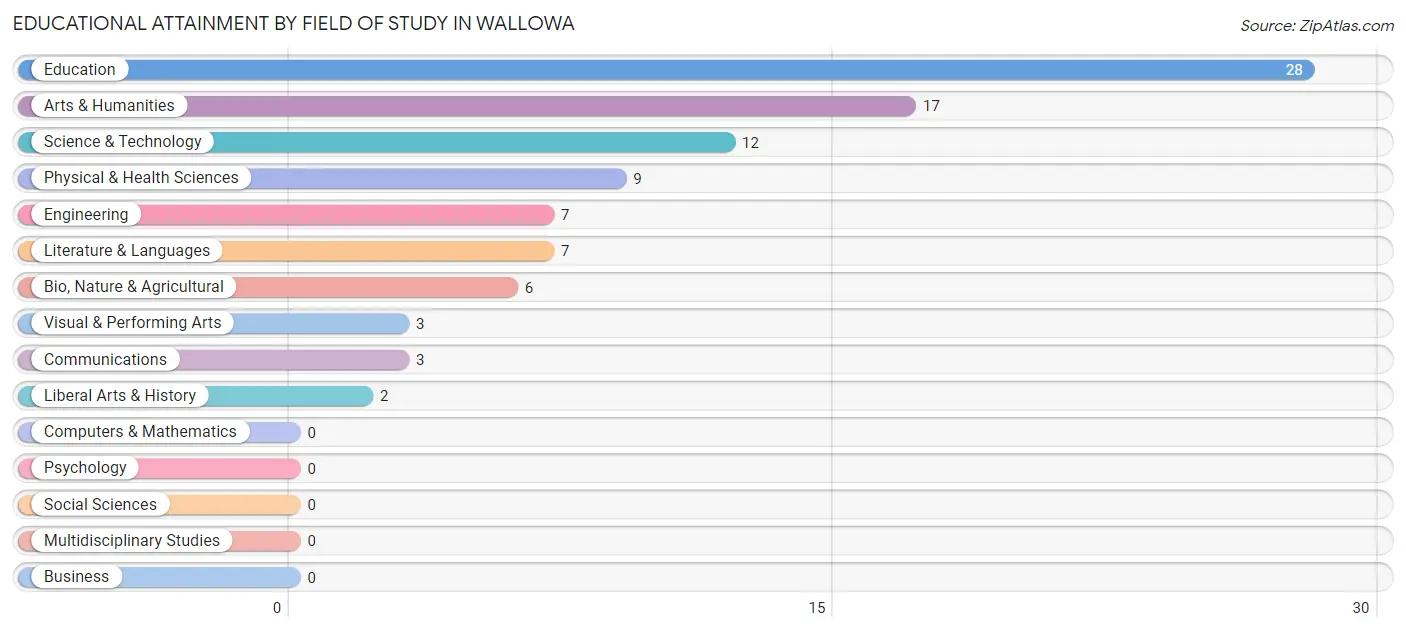
| Field of Study | # Graduates | % Graduates |
| Computers & Mathematics | 0 | 0.0% |
| Bio, Nature & Agricultural | 6 | 6.4% |
| Physical & Health Sciences | 9 | 9.6% |
| Psychology | 0 | 0.0% |
| Social Sciences | 0 | 0.0% |
| Engineering | 7 | 7.4% |
| Multidisciplinary Studies | 0 | 0.0% |
| Science & Technology | 12 | 12.8% |
| Business | 0 | 0.0% |
| Education | 28 | 29.8% |
| Literature & Languages | 7 | 7.4% |
| Liberal Arts & History | 2 | 2.1% |
| Visual & Performing Arts | 3 | 3.2% |
| Communications | 3 | 3.2% |
| Arts & Humanities | 17 | 18.1% |
| Total | 94 | 100.0% |
Transportation & Commute in Wallowa
Vehicle Availability by Sex in Wallowa
The most prevalent vehicle ownership categories in Wallowa are males with 3 vehicles (48, accounting for 33.8%) and females with 3 vehicles (89, making up 27.6%).
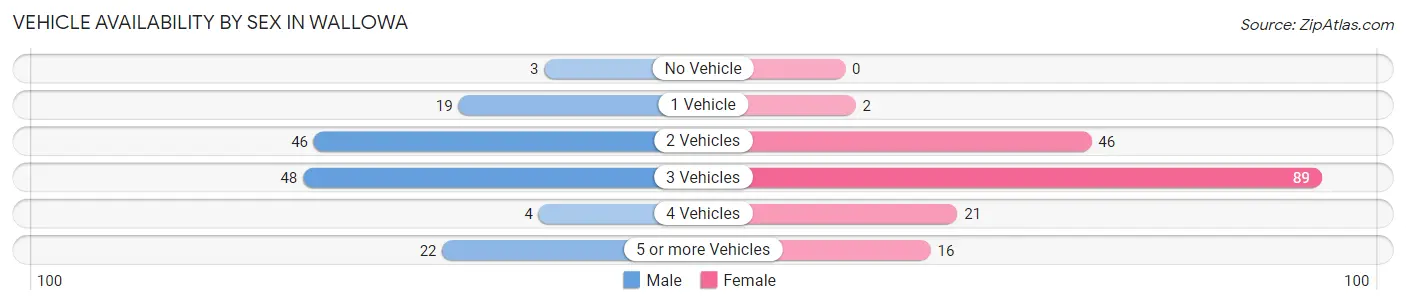
| Vehicles Available | Male | Female |
| No Vehicle | 3 (2.1%) | 0 (0.0%) |
| 1 Vehicle | 19 (13.4%) | 2 (1.1%) |
| 2 Vehicles | 46 (32.4%) | 46 (26.4%) |
| 3 Vehicles | 48 (33.8%) | 89 (51.1%) |
| 4 Vehicles | 4 (2.8%) | 21 (12.1%) |
| 5 or more Vehicles | 22 (15.5%) | 16 (9.2%) |
| Total | 142 (100.0%) | 174 (100.0%) |
Commute Time in Wallowa
The most frequently occuring commute durations in Wallowa are less than 5 minutes (78 commuters, 38.4%), 30 to 34 minutes (29 commuters, 14.3%), and 45 to 59 minutes (21 commuters, 10.3%).
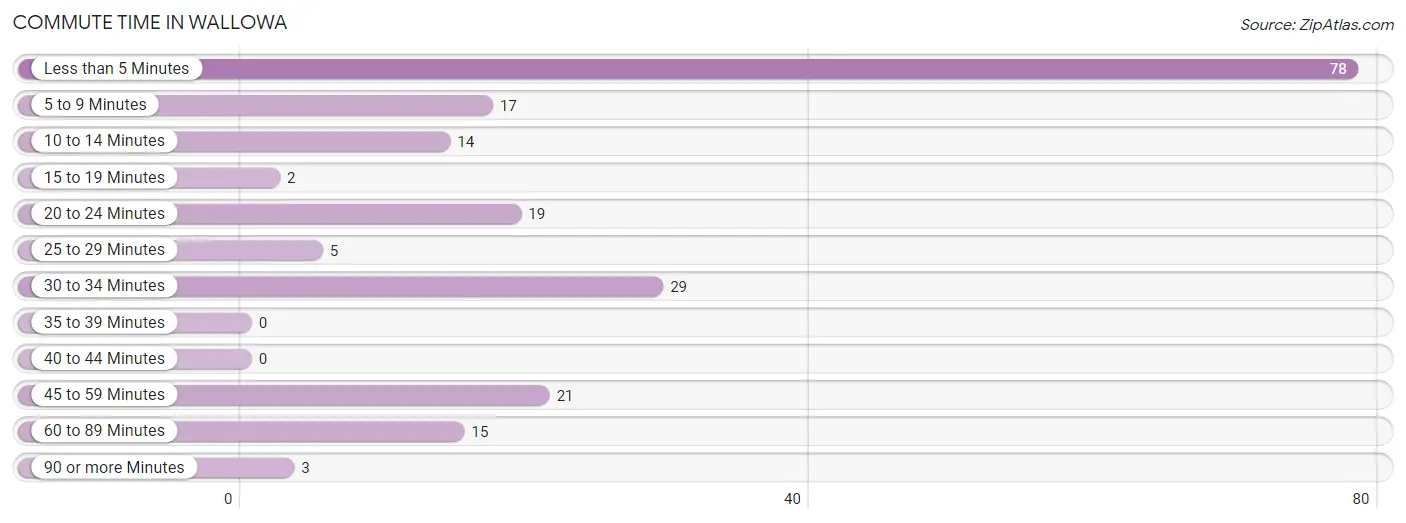
| Commute Time | # Commuters | % Commuters |
| Less than 5 Minutes | 78 | 38.4% |
| 5 to 9 Minutes | 17 | 8.4% |
| 10 to 14 Minutes | 14 | 6.9% |
| 15 to 19 Minutes | 2 | 1.0% |
| 20 to 24 Minutes | 19 | 9.4% |
| 25 to 29 Minutes | 5 | 2.5% |
| 30 to 34 Minutes | 29 | 14.3% |
| 35 to 39 Minutes | 0 | 0.0% |
| 40 to 44 Minutes | 0 | 0.0% |
| 45 to 59 Minutes | 21 | 10.3% |
| 60 to 89 Minutes | 15 | 7.4% |
| 90 or more Minutes | 3 | 1.5% |
Commute Time by Sex in Wallowa
The most common commute times in Wallowa are less than 5 minutes (45 commuters, 45.5%) for males and less than 5 minutes (33 commuters, 31.7%) for females.
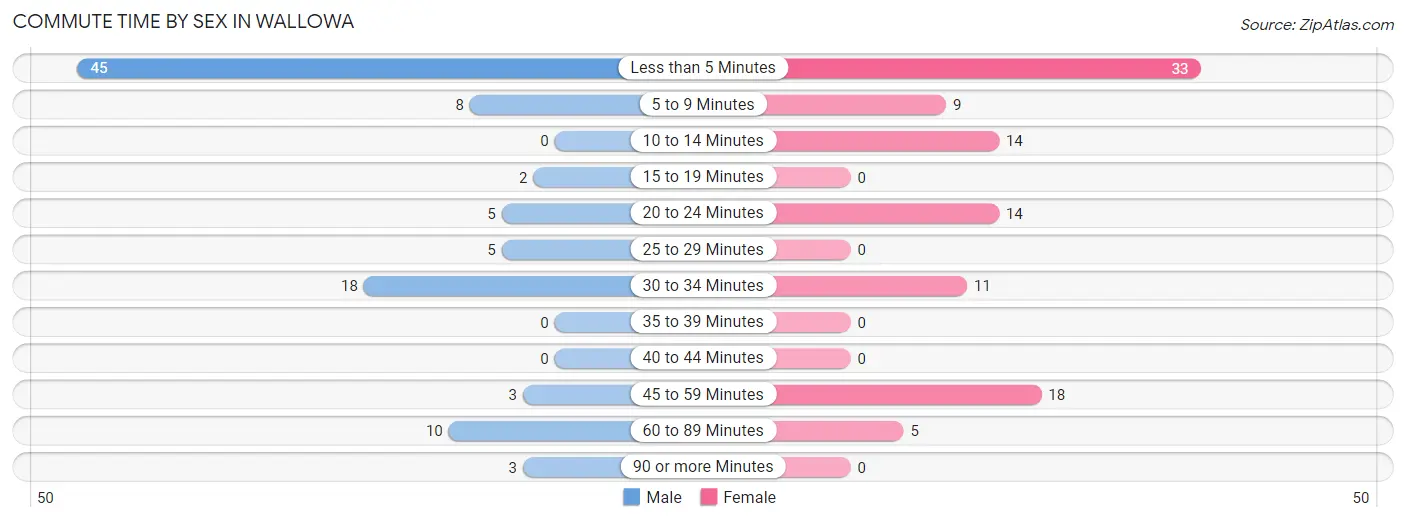
| Commute Time | Male | Female |
| Less than 5 Minutes | 45 (45.5%) | 33 (31.7%) |
| 5 to 9 Minutes | 8 (8.1%) | 9 (8.6%) |
| 10 to 14 Minutes | 0 (0.0%) | 14 (13.5%) |
| 15 to 19 Minutes | 2 (2.0%) | 0 (0.0%) |
| 20 to 24 Minutes | 5 (5.1%) | 14 (13.5%) |
| 25 to 29 Minutes | 5 (5.1%) | 0 (0.0%) |
| 30 to 34 Minutes | 18 (18.2%) | 11 (10.6%) |
| 35 to 39 Minutes | 0 (0.0%) | 0 (0.0%) |
| 40 to 44 Minutes | 0 (0.0%) | 0 (0.0%) |
| 45 to 59 Minutes | 3 (3.0%) | 18 (17.3%) |
| 60 to 89 Minutes | 10 (10.1%) | 5 (4.8%) |
| 90 or more Minutes | 3 (3.0%) | 0 (0.0%) |
Time of Departure to Work by Sex in Wallowa
The most frequent times of departure to work in Wallowa are 9:00 AM to 9:59 AM (21, 21.2%) for males and 7:00 AM to 7:29 AM (33, 31.7%) for females.
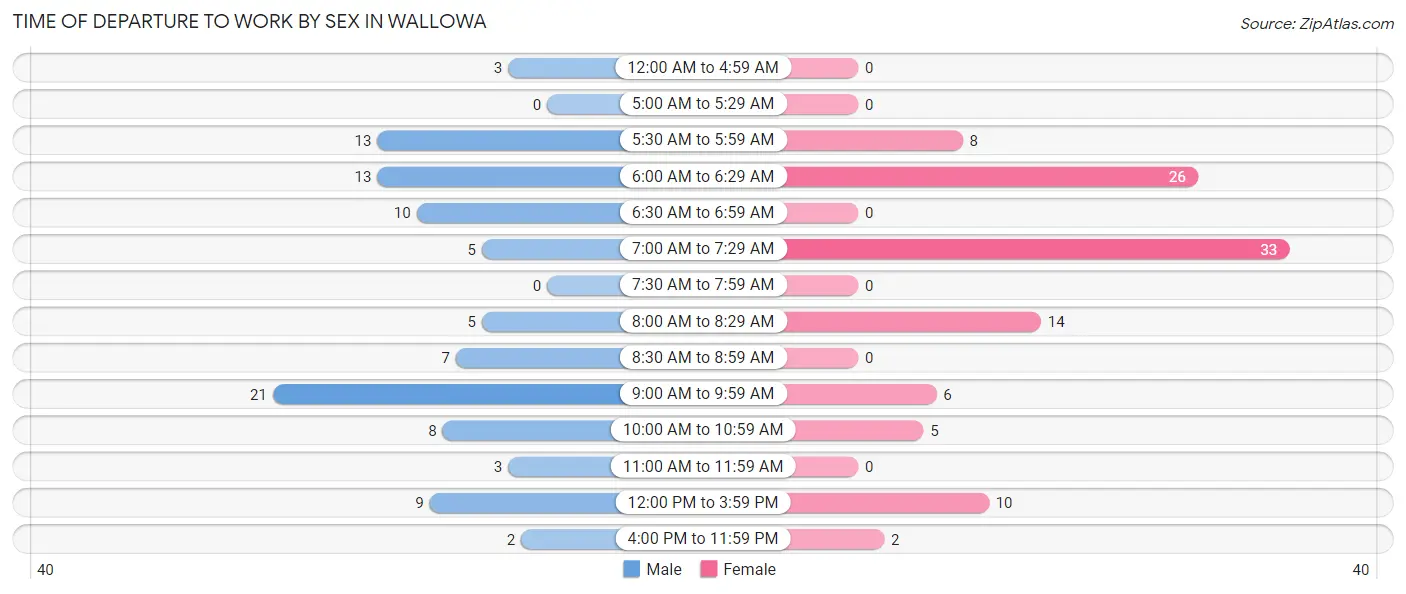
| Time of Departure | Male | Female |
| 12:00 AM to 4:59 AM | 3 (3.0%) | 0 (0.0%) |
| 5:00 AM to 5:29 AM | 0 (0.0%) | 0 (0.0%) |
| 5:30 AM to 5:59 AM | 13 (13.1%) | 8 (7.7%) |
| 6:00 AM to 6:29 AM | 13 (13.1%) | 26 (25.0%) |
| 6:30 AM to 6:59 AM | 10 (10.1%) | 0 (0.0%) |
| 7:00 AM to 7:29 AM | 5 (5.1%) | 33 (31.7%) |
| 7:30 AM to 7:59 AM | 0 (0.0%) | 0 (0.0%) |
| 8:00 AM to 8:29 AM | 5 (5.1%) | 14 (13.5%) |
| 8:30 AM to 8:59 AM | 7 (7.1%) | 0 (0.0%) |
| 9:00 AM to 9:59 AM | 21 (21.2%) | 6 (5.8%) |
| 10:00 AM to 10:59 AM | 8 (8.1%) | 5 (4.8%) |
| 11:00 AM to 11:59 AM | 3 (3.0%) | 0 (0.0%) |
| 12:00 PM to 3:59 PM | 9 (9.1%) | 10 (9.6%) |
| 4:00 PM to 11:59 PM | 2 (2.0%) | 2 (1.9%) |
| Total | 99 (100.0%) | 104 (100.0%) |
Housing Occupancy in Wallowa
Occupancy by Ownership in Wallowa
Of the total 268 dwellings in Wallowa, owner-occupied units account for 223 (83.2%), while renter-occupied units make up 45 (16.8%).
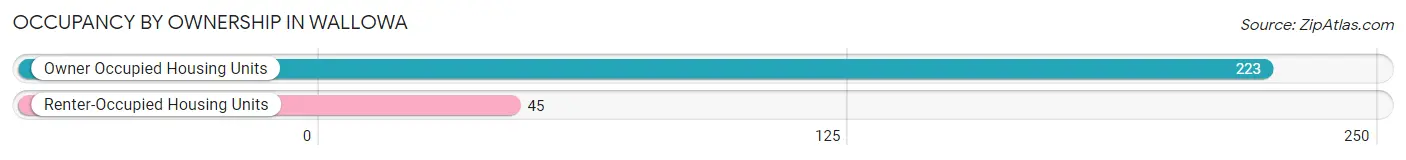
| Occupancy | # Housing Units | % Housing Units |
| Owner Occupied Housing Units | 223 | 83.2% |
| Renter-Occupied Housing Units | 45 | 16.8% |
| Total Occupied Housing Units | 268 | 100.0% |
Occupancy by Household Size in Wallowa
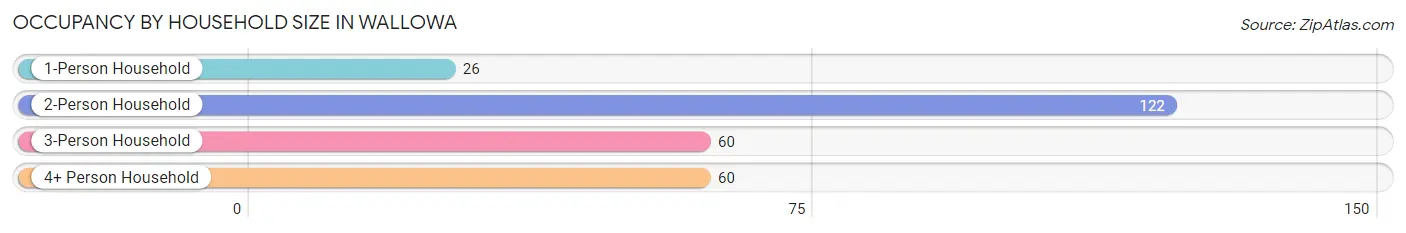
| Household Size | # Housing Units | % Housing Units |
| 1-Person Household | 26 | 9.7% |
| 2-Person Household | 122 | 45.5% |
| 3-Person Household | 60 | 22.4% |
| 4+ Person Household | 60 | 22.4% |
| Total Housing Units | 268 | 100.0% |
Occupancy by Ownership by Household Size in Wallowa
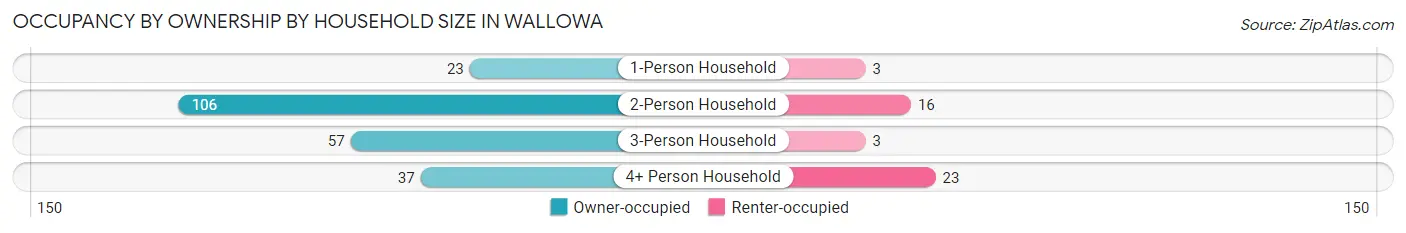
| Household Size | Owner-occupied | Renter-occupied |
| 1-Person Household | 23 (88.5%) | 3 (11.5%) |
| 2-Person Household | 106 (86.9%) | 16 (13.1%) |
| 3-Person Household | 57 (95.0%) | 3 (5.0%) |
| 4+ Person Household | 37 (61.7%) | 23 (38.3%) |
| Total Housing Units | 223 (83.2%) | 45 (16.8%) |
Occupancy by Educational Attainment in Wallowa
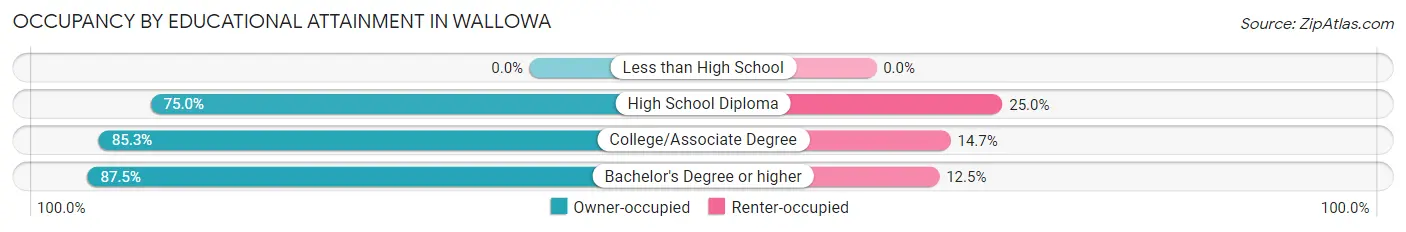
| Household Size | Owner-occupied | Renter-occupied |
| Less than High School | 0 (0.0%) | 0 (0.0%) |
| High School Diploma | 48 (75.0%) | 16 (25.0%) |
| College/Associate Degree | 133 (85.3%) | 23 (14.7%) |
| Bachelor's Degree or higher | 42 (87.5%) | 6 (12.5%) |
Occupancy by Age of Householder in Wallowa
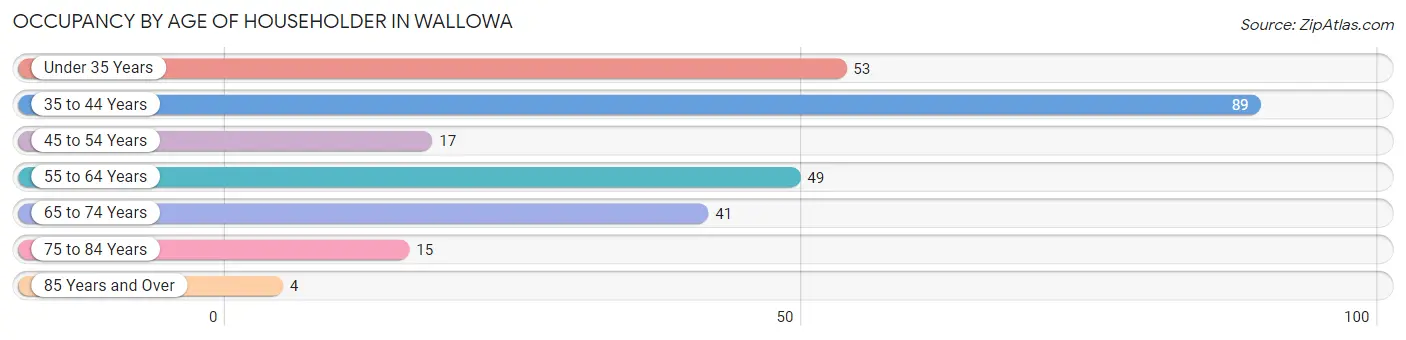
| Age Bracket | # Households | % Households |
| Under 35 Years | 53 | 19.8% |
| 35 to 44 Years | 89 | 33.2% |
| 45 to 54 Years | 17 | 6.3% |
| 55 to 64 Years | 49 | 18.3% |
| 65 to 74 Years | 41 | 15.3% |
| 75 to 84 Years | 15 | 5.6% |
| 85 Years and Over | 4 | 1.5% |
| Total | 268 | 100.0% |
Housing Finances in Wallowa
Median Income by Occupancy in Wallowa
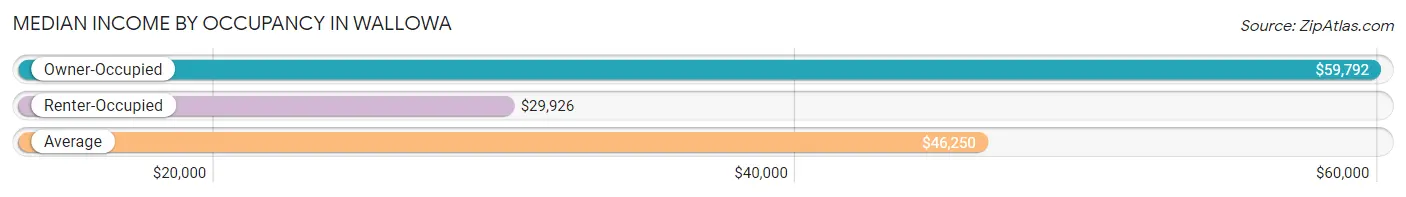
| Occupancy Type | # Households | Median Income |
| Owner-Occupied | 223 (83.2%) | $59,792 |
| Renter-Occupied | 45 (16.8%) | $29,926 |
| Average | 268 (100.0%) | $46,250 |
Occupancy by Householder Income Bracket in Wallowa
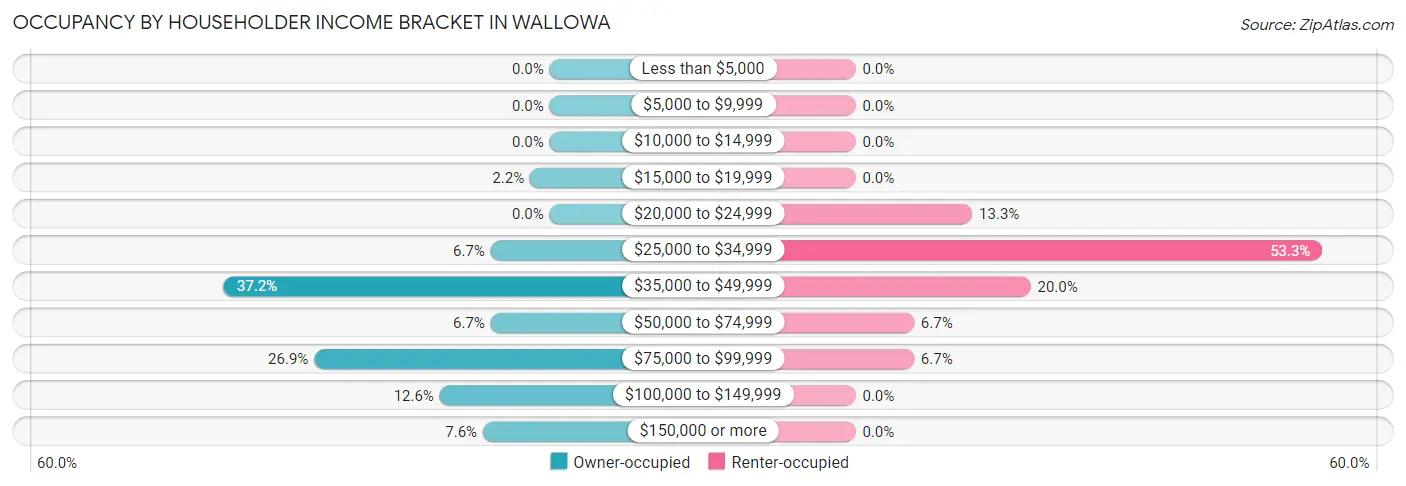
| Income Bracket | Owner-occupied | Renter-occupied |
| Less than $5,000 | 0 (0.0%) | 0 (0.0%) |
| $5,000 to $9,999 | 0 (0.0%) | 0 (0.0%) |
| $10,000 to $14,999 | 0 (0.0%) | 0 (0.0%) |
| $15,000 to $19,999 | 5 (2.2%) | 0 (0.0%) |
| $20,000 to $24,999 | 0 (0.0%) | 6 (13.3%) |
| $25,000 to $34,999 | 15 (6.7%) | 24 (53.3%) |
| $35,000 to $49,999 | 83 (37.2%) | 9 (20.0%) |
| $50,000 to $74,999 | 15 (6.7%) | 3 (6.7%) |
| $75,000 to $99,999 | 60 (26.9%) | 3 (6.7%) |
| $100,000 to $149,999 | 28 (12.6%) | 0 (0.0%) |
| $150,000 or more | 17 (7.6%) | 0 (0.0%) |
| Total | 223 (100.0%) | 45 (100.0%) |
Monthly Housing Cost Tiers in Wallowa
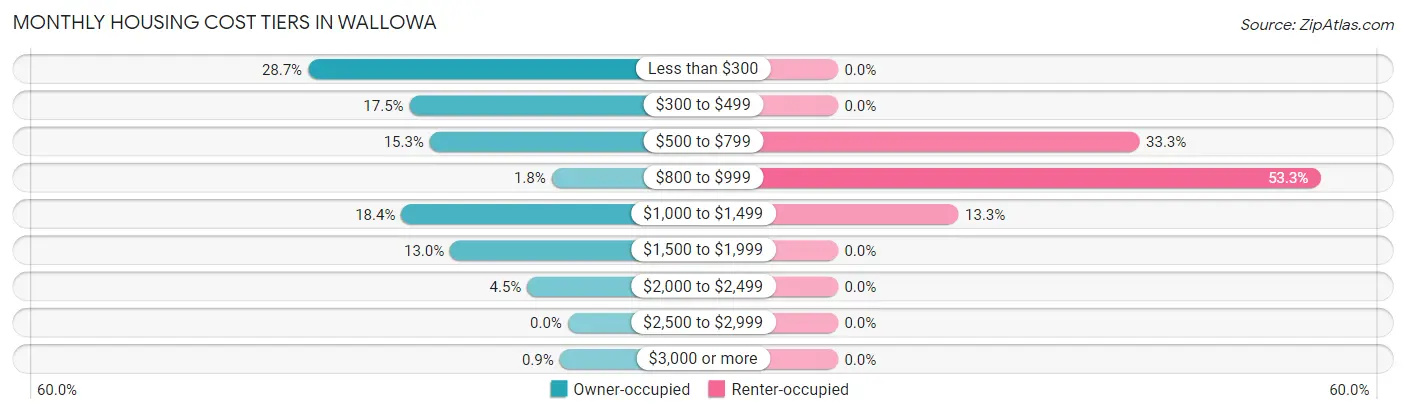
| Monthly Cost | Owner-occupied | Renter-occupied |
| Less than $300 | 64 (28.7%) | 0 (0.0%) |
| $300 to $499 | 39 (17.5%) | 0 (0.0%) |
| $500 to $799 | 34 (15.2%) | 15 (33.3%) |
| $800 to $999 | 4 (1.8%) | 24 (53.3%) |
| $1,000 to $1,499 | 41 (18.4%) | 6 (13.3%) |
| $1,500 to $1,999 | 29 (13.0%) | 0 (0.0%) |
| $2,000 to $2,499 | 10 (4.5%) | 0 (0.0%) |
| $2,500 to $2,999 | 0 (0.0%) | 0 (0.0%) |
| $3,000 or more | 2 (0.9%) | 0 (0.0%) |
| Total | 223 (100.0%) | 45 (100.0%) |
Physical Housing Characteristics in Wallowa
Housing Structures in Wallowa
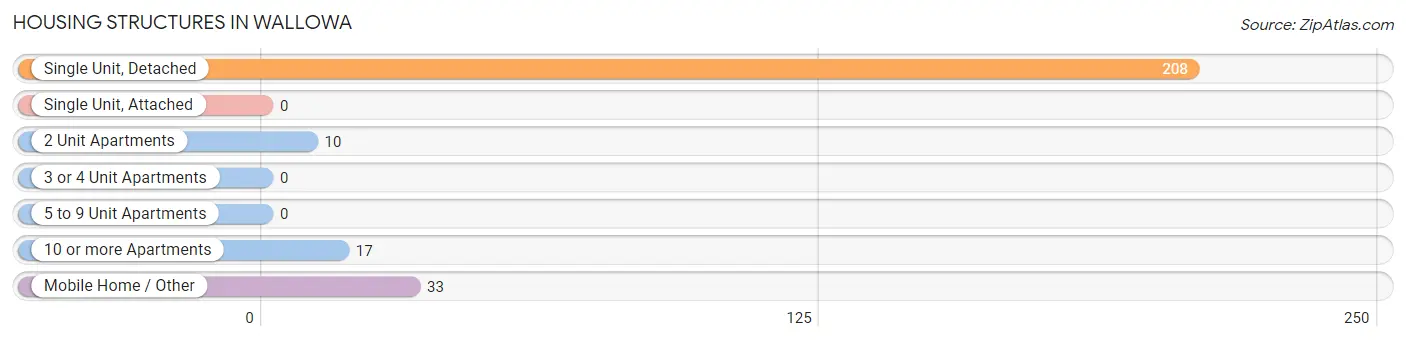
| Structure Type | # Housing Units | % Housing Units |
| Single Unit, Detached | 208 | 77.6% |
| Single Unit, Attached | 0 | 0.0% |
| 2 Unit Apartments | 10 | 3.7% |
| 3 or 4 Unit Apartments | 0 | 0.0% |
| 5 to 9 Unit Apartments | 0 | 0.0% |
| 10 or more Apartments | 17 | 6.3% |
| Mobile Home / Other | 33 | 12.3% |
| Total | 268 | 100.0% |
Housing Structures by Occupancy in Wallowa
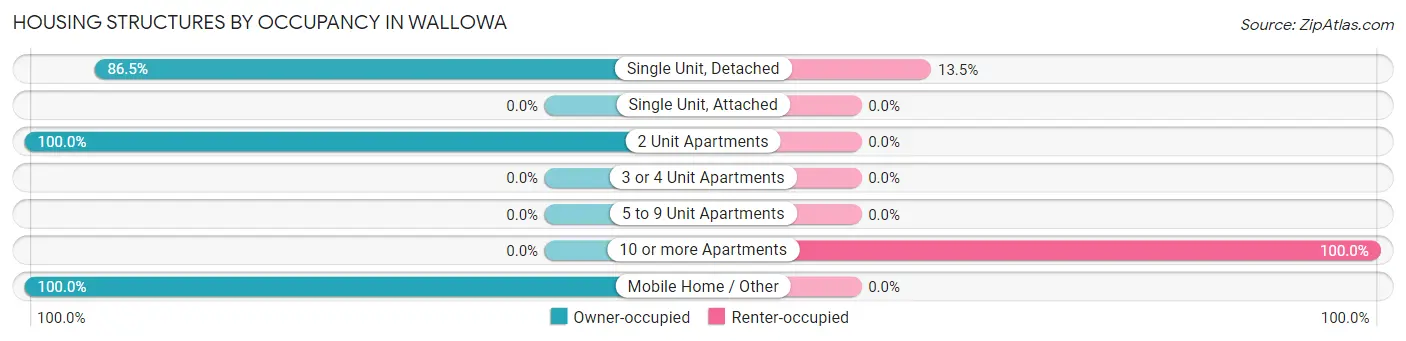
| Structure Type | Owner-occupied | Renter-occupied |
| Single Unit, Detached | 180 (86.5%) | 28 (13.5%) |
| Single Unit, Attached | 0 (0.0%) | 0 (0.0%) |
| 2 Unit Apartments | 10 (100.0%) | 0 (0.0%) |
| 3 or 4 Unit Apartments | 0 (0.0%) | 0 (0.0%) |
| 5 to 9 Unit Apartments | 0 (0.0%) | 0 (0.0%) |
| 10 or more Apartments | 0 (0.0%) | 17 (100.0%) |
| Mobile Home / Other | 33 (100.0%) | 0 (0.0%) |
| Total | 223 (83.2%) | 45 (16.8%) |
Housing Structures by Number of Rooms in Wallowa
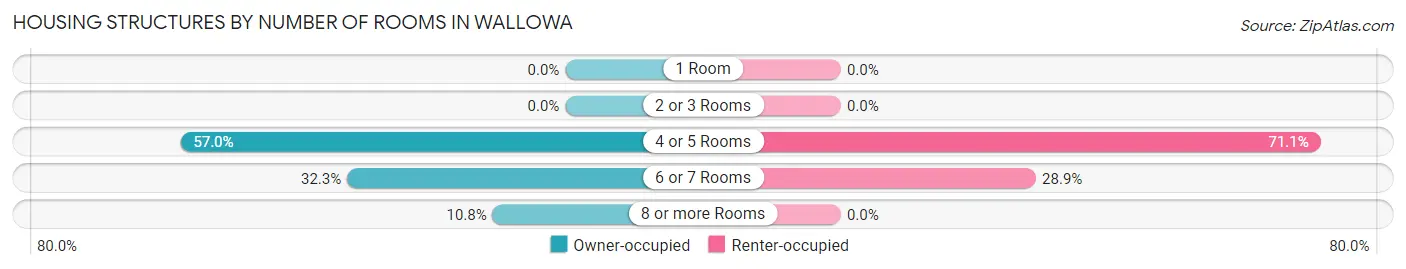
| Number of Rooms | Owner-occupied | Renter-occupied |
| 1 Room | 0 (0.0%) | 0 (0.0%) |
| 2 or 3 Rooms | 0 (0.0%) | 0 (0.0%) |
| 4 or 5 Rooms | 127 (57.0%) | 32 (71.1%) |
| 6 or 7 Rooms | 72 (32.3%) | 13 (28.9%) |
| 8 or more Rooms | 24 (10.8%) | 0 (0.0%) |
| Total | 223 (100.0%) | 45 (100.0%) |
Housing Structure by Heating Type in Wallowa
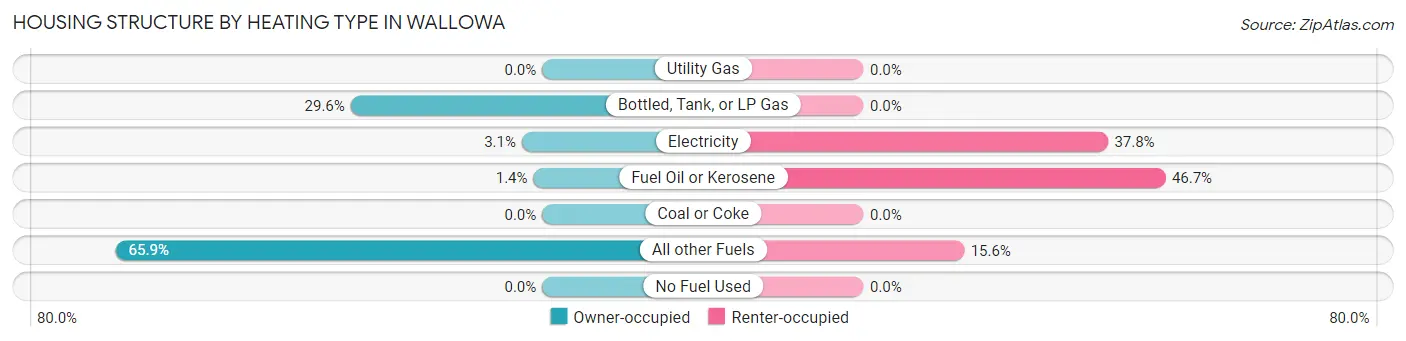
| Heating Type | Owner-occupied | Renter-occupied |
| Utility Gas | 0 (0.0%) | 0 (0.0%) |
| Bottled, Tank, or LP Gas | 66 (29.6%) | 0 (0.0%) |
| Electricity | 7 (3.1%) | 17 (37.8%) |
| Fuel Oil or Kerosene | 3 (1.3%) | 21 (46.7%) |
| Coal or Coke | 0 (0.0%) | 0 (0.0%) |
| All other Fuels | 147 (65.9%) | 7 (15.6%) |
| No Fuel Used | 0 (0.0%) | 0 (0.0%) |
| Total | 223 (100.0%) | 45 (100.0%) |
Household Vehicle Usage in Wallowa
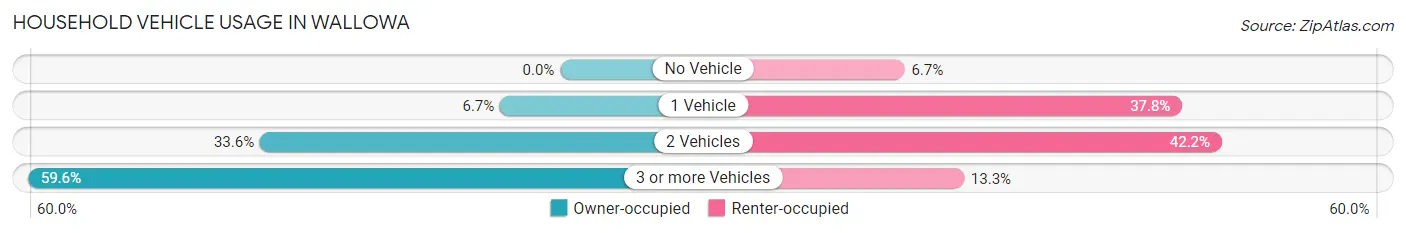
| Vehicles per Household | Owner-occupied | Renter-occupied |
| No Vehicle | 0 (0.0%) | 3 (6.7%) |
| 1 Vehicle | 15 (6.7%) | 17 (37.8%) |
| 2 Vehicles | 75 (33.6%) | 19 (42.2%) |
| 3 or more Vehicles | 133 (59.6%) | 6 (13.3%) |
| Total | 223 (100.0%) | 45 (100.0%) |
Real Estate & Mortgages in Wallowa
Real Estate and Mortgage Overview in Wallowa
| Characteristic | Without Mortgage | With Mortgage |
| Housing Units | 130 | 93 |
| Median Property Value | $269,600 | $239,000 |
| Median Household Income | $44,342 | $9 |
| Monthly Housing Costs | $403 | $2 |
| Real Estate Taxes | $800 | $0 |
Property Value by Mortgage Status in Wallowa
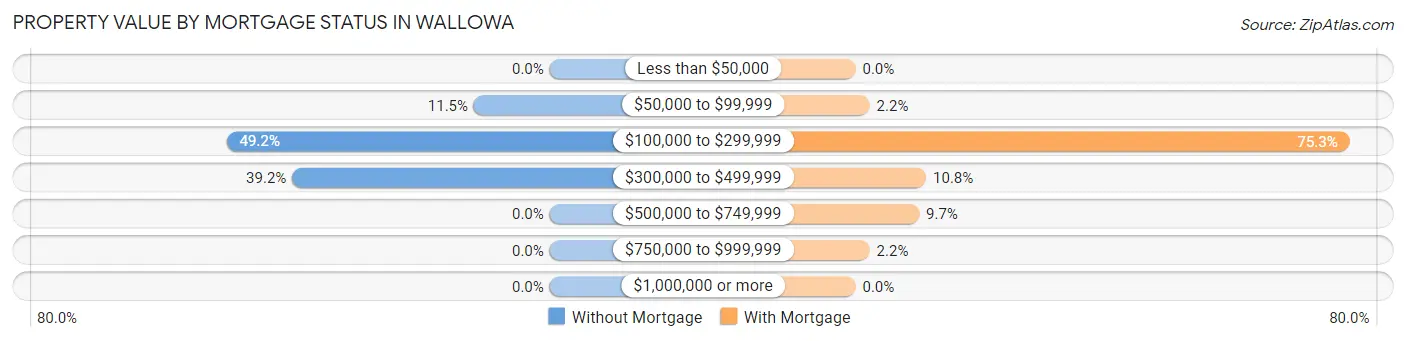
| Property Value | Without Mortgage | With Mortgage |
| Less than $50,000 | 0 (0.0%) | 0 (0.0%) |
| $50,000 to $99,999 | 15 (11.5%) | 2 (2.1%) |
| $100,000 to $299,999 | 64 (49.2%) | 70 (75.3%) |
| $300,000 to $499,999 | 51 (39.2%) | 10 (10.7%) |
| $500,000 to $749,999 | 0 (0.0%) | 9 (9.7%) |
| $750,000 to $999,999 | 0 (0.0%) | 2 (2.1%) |
| $1,000,000 or more | 0 (0.0%) | 0 (0.0%) |
| Total | 130 (100.0%) | 93 (100.0%) |
Household Income by Mortgage Status in Wallowa
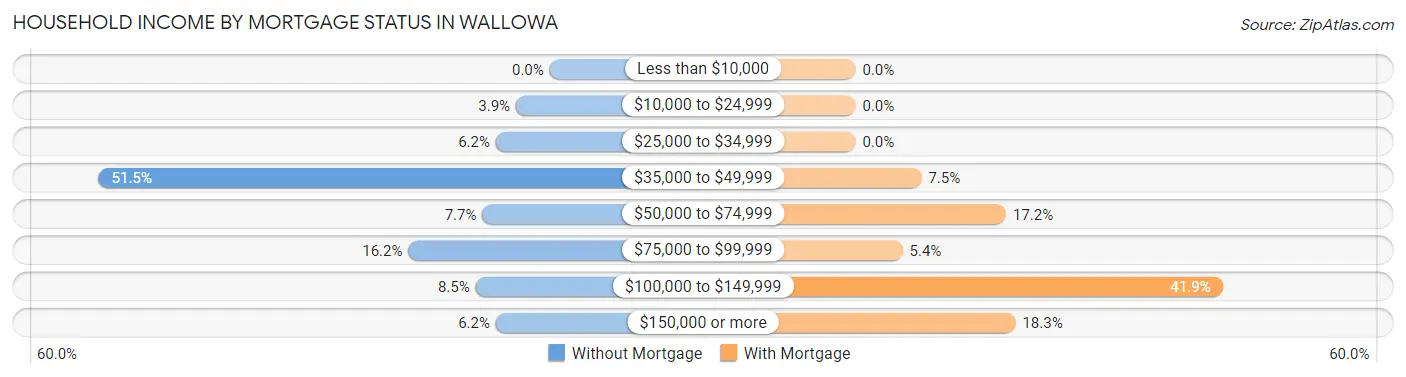
| Household Income | Without Mortgage | With Mortgage |
| Less than $10,000 | 0 (0.0%) | 0 (0.0%) |
| $10,000 to $24,999 | 5 (3.8%) | 0 (0.0%) |
| $25,000 to $34,999 | 8 (6.1%) | 0 (0.0%) |
| $35,000 to $49,999 | 67 (51.5%) | 7 (7.5%) |
| $50,000 to $74,999 | 10 (7.7%) | 16 (17.2%) |
| $75,000 to $99,999 | 21 (16.2%) | 5 (5.4%) |
| $100,000 to $149,999 | 11 (8.5%) | 39 (41.9%) |
| $150,000 or more | 8 (6.1%) | 17 (18.3%) |
| Total | 130 (100.0%) | 93 (100.0%) |
Property Value to Household Income Ratio in Wallowa
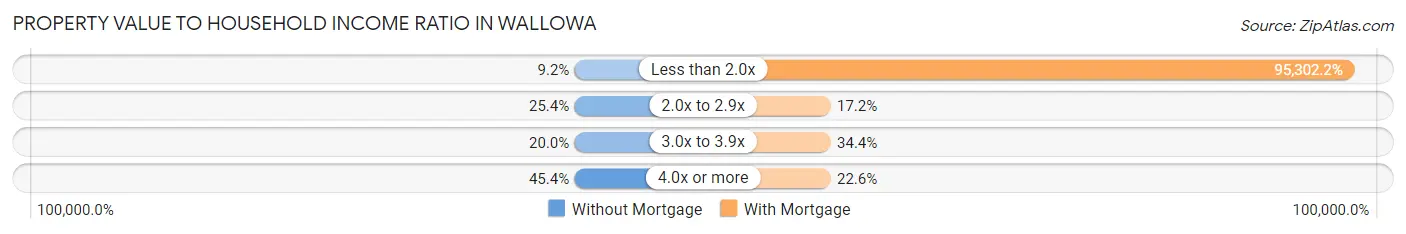
| Value-to-Income Ratio | Without Mortgage | With Mortgage |
| Less than 2.0x | 12 (9.2%) | 88,631 (95,302.1%) |
| 2.0x to 2.9x | 33 (25.4%) | 16 (17.2%) |
| 3.0x to 3.9x | 26 (20.0%) | 32 (34.4%) |
| 4.0x or more | 59 (45.4%) | 21 (22.6%) |
| Total | 130 (100.0%) | 93 (100.0%) |
Real Estate Taxes by Mortgage Status in Wallowa
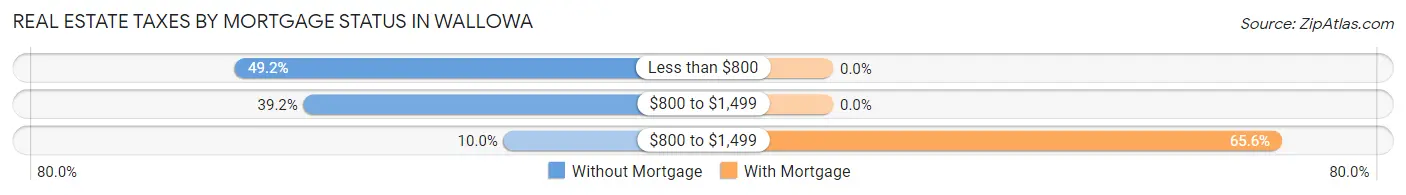
| Property Taxes | Without Mortgage | With Mortgage |
| Less than $800 | 64 (49.2%) | 0 (0.0%) |
| $800 to $1,499 | 51 (39.2%) | 0 (0.0%) |
| $800 to $1,499 | 13 (10.0%) | 61 (65.6%) |
| Total | 130 (100.0%) | 93 (100.0%) |
Health & Disability in Wallowa
Health Insurance Coverage by Age in Wallowa
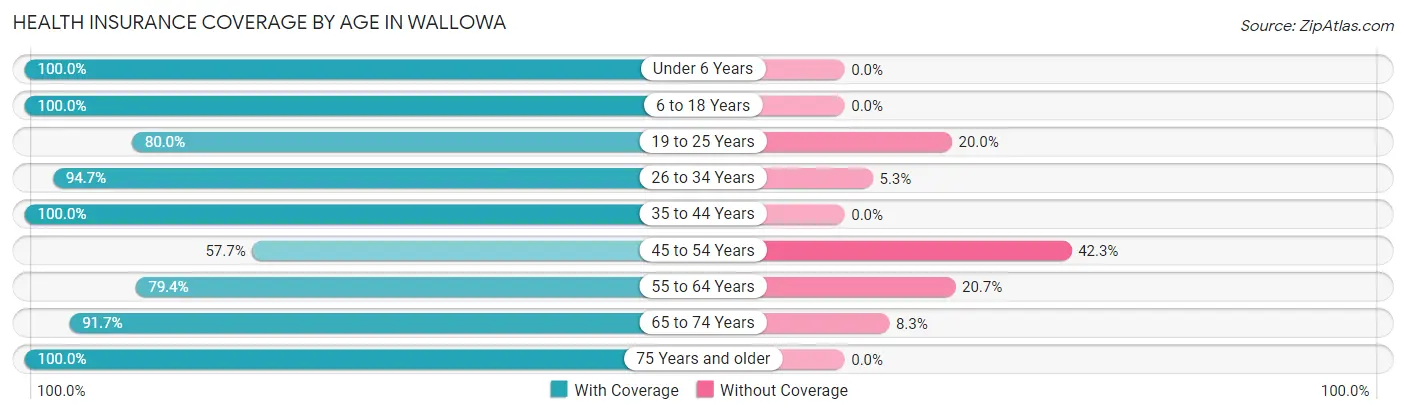
| Age Bracket | With Coverage | Without Coverage |
| Under 6 Years | 38 (100.0%) | 0 (0.0%) |
| 6 to 18 Years | 188 (100.0%) | 0 (0.0%) |
| 19 to 25 Years | 36 (80.0%) | 9 (20.0%) |
| 26 to 34 Years | 54 (94.7%) | 3 (5.3%) |
| 35 to 44 Years | 115 (100.0%) | 0 (0.0%) |
| 45 to 54 Years | 15 (57.7%) | 11 (42.3%) |
| 55 to 64 Years | 73 (79.3%) | 19 (20.6%) |
| 65 to 74 Years | 88 (91.7%) | 8 (8.3%) |
| 75 Years and older | 39 (100.0%) | 0 (0.0%) |
| Total | 646 (92.8%) | 50 (7.2%) |
Health Insurance Coverage by Citizenship Status in Wallowa
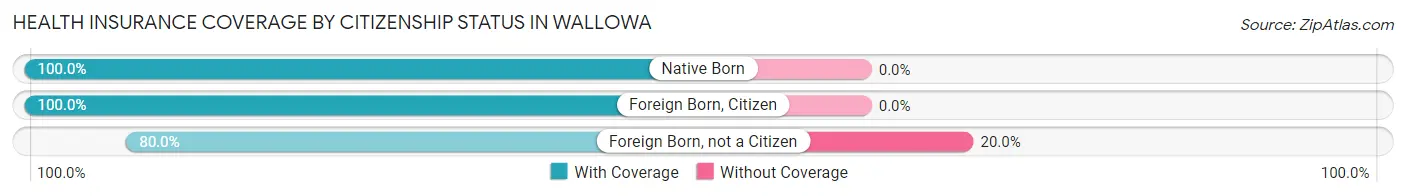
| Citizenship Status | With Coverage | Without Coverage |
| Native Born | 38 (100.0%) | 0 (0.0%) |
| Foreign Born, Citizen | 188 (100.0%) | 0 (0.0%) |
| Foreign Born, not a Citizen | 36 (80.0%) | 9 (20.0%) |
Health Insurance Coverage by Household Income in Wallowa
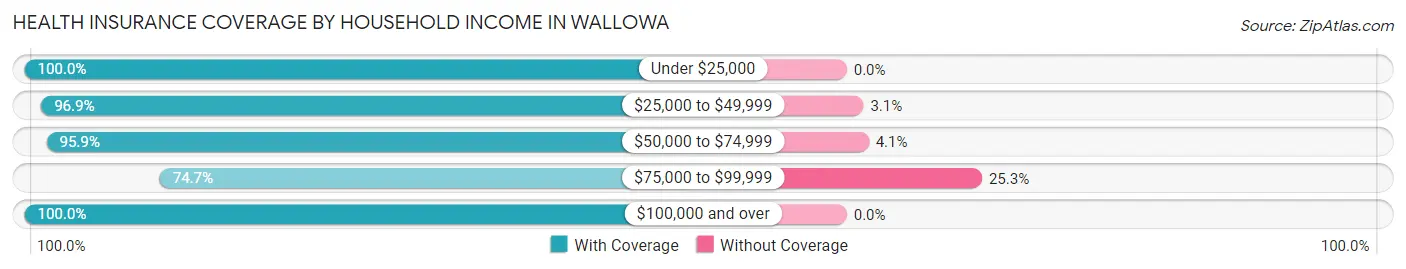
| Household Income | With Coverage | Without Coverage |
| Under $25,000 | 36 (100.0%) | 0 (0.0%) |
| $25,000 to $49,999 | 279 (96.9%) | 9 (3.1%) |
| $50,000 to $74,999 | 70 (95.9%) | 3 (4.1%) |
| $75,000 to $99,999 | 112 (74.7%) | 38 (25.3%) |
| $100,000 and over | 149 (100.0%) | 0 (0.0%) |
Public vs Private Health Insurance Coverage by Age in Wallowa
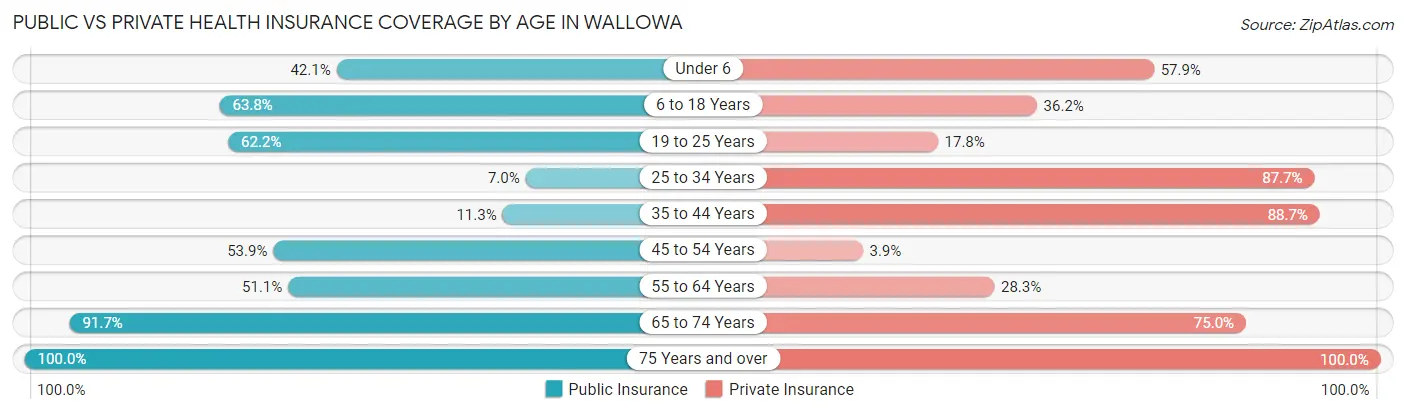
| Age Bracket | Public Insurance | Private Insurance |
| Under 6 | 16 (42.1%) | 22 (57.9%) |
| 6 to 18 Years | 120 (63.8%) | 68 (36.2%) |
| 19 to 25 Years | 28 (62.2%) | 8 (17.8%) |
| 25 to 34 Years | 4 (7.0%) | 50 (87.7%) |
| 35 to 44 Years | 13 (11.3%) | 102 (88.7%) |
| 45 to 54 Years | 14 (53.8%) | 1 (3.8%) |
| 55 to 64 Years | 47 (51.1%) | 26 (28.3%) |
| 65 to 74 Years | 88 (91.7%) | 72 (75.0%) |
| 75 Years and over | 39 (100.0%) | 39 (100.0%) |
| Total | 369 (53.0%) | 388 (55.7%) |
Disability Status by Sex by Age in Wallowa
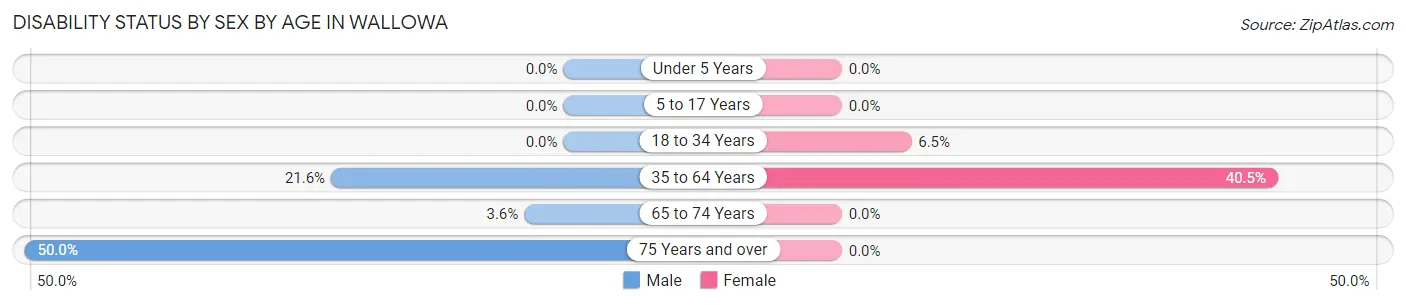
| Age Bracket | Male | Female |
| Under 5 Years | 0 (0.0%) | 0 (0.0%) |
| 5 to 17 Years | 0 (0.0%) | 0 (0.0%) |
| 18 to 34 Years | 0 (0.0%) | 4 (6.5%) |
| 35 to 64 Years | 22 (21.6%) | 53 (40.5%) |
| 65 to 74 Years | 2 (3.6%) | 0 (0.0%) |
| 75 Years and over | 12 (50.0%) | 0 (0.0%) |
Disability Class by Sex by Age in Wallowa
Disability Class: Hearing Difficulty
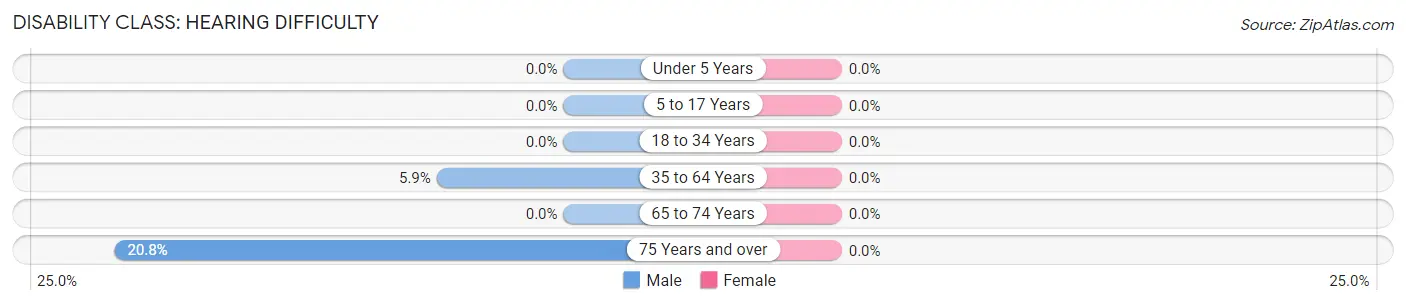
| Age Bracket | Male | Female |
| Under 5 Years | 0 (0.0%) | 0 (0.0%) |
| 5 to 17 Years | 0 (0.0%) | 0 (0.0%) |
| 18 to 34 Years | 0 (0.0%) | 0 (0.0%) |
| 35 to 64 Years | 6 (5.9%) | 0 (0.0%) |
| 65 to 74 Years | 0 (0.0%) | 0 (0.0%) |
| 75 Years and over | 5 (20.8%) | 0 (0.0%) |
Disability Class: Vision Difficulty
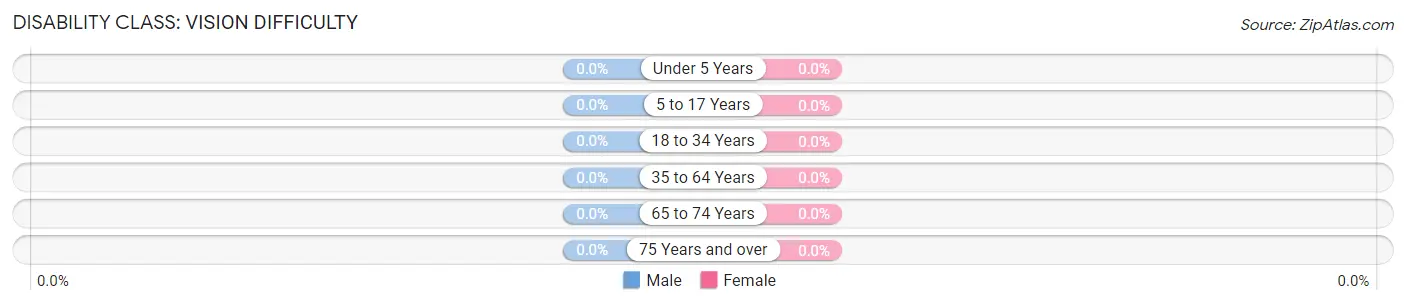
| Age Bracket | Male | Female |
| Under 5 Years | 0 (0.0%) | 0 (0.0%) |
| 5 to 17 Years | 0 (0.0%) | 0 (0.0%) |
| 18 to 34 Years | 0 (0.0%) | 0 (0.0%) |
| 35 to 64 Years | 0 (0.0%) | 0 (0.0%) |
| 65 to 74 Years | 0 (0.0%) | 0 (0.0%) |
| 75 Years and over | 0 (0.0%) | 0 (0.0%) |
Disability Class: Cognitive Difficulty
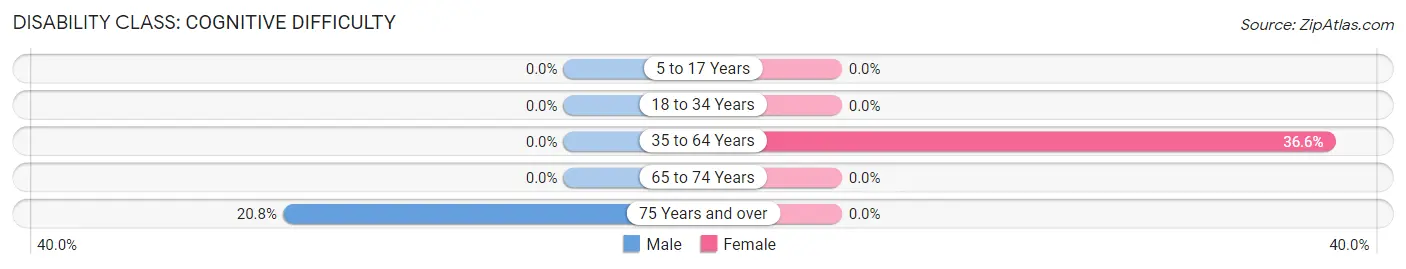
| Age Bracket | Male | Female |
| 5 to 17 Years | 0 (0.0%) | 0 (0.0%) |
| 18 to 34 Years | 0 (0.0%) | 0 (0.0%) |
| 35 to 64 Years | 0 (0.0%) | 48 (36.6%) |
| 65 to 74 Years | 0 (0.0%) | 0 (0.0%) |
| 75 Years and over | 5 (20.8%) | 0 (0.0%) |
Disability Class: Ambulatory Difficulty
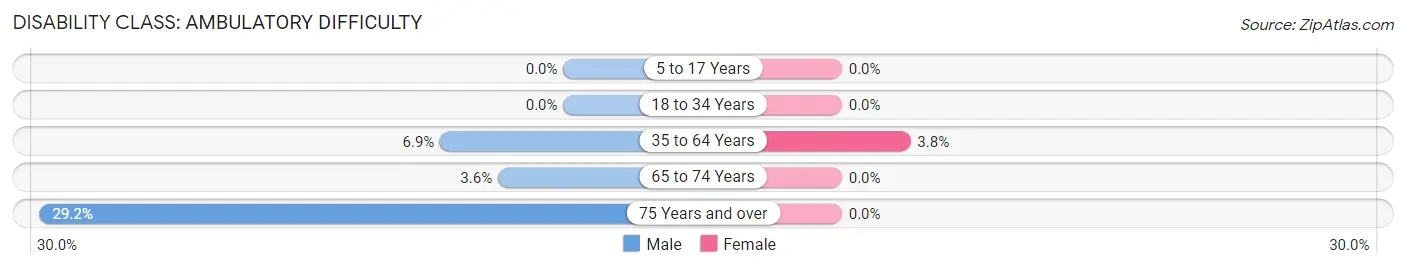
| Age Bracket | Male | Female |
| 5 to 17 Years | 0 (0.0%) | 0 (0.0%) |
| 18 to 34 Years | 0 (0.0%) | 0 (0.0%) |
| 35 to 64 Years | 7 (6.9%) | 5 (3.8%) |
| 65 to 74 Years | 2 (3.6%) | 0 (0.0%) |
| 75 Years and over | 7 (29.2%) | 0 (0.0%) |
Disability Class: Self-Care Difficulty
| Age Bracket | Male | Female |
| 5 to 17 Years | 0 (0.0%) | 0 (0.0%) |
| 18 to 34 Years | 0 (0.0%) | 0 (0.0%) |
| 35 to 64 Years | 0 (0.0%) | 0 (0.0%) |
| 65 to 74 Years | 0 (0.0%) | 0 (0.0%) |
| 75 Years and over | 0 (0.0%) | 0 (0.0%) |
Technology Access in Wallowa
Computing Device Access in Wallowa
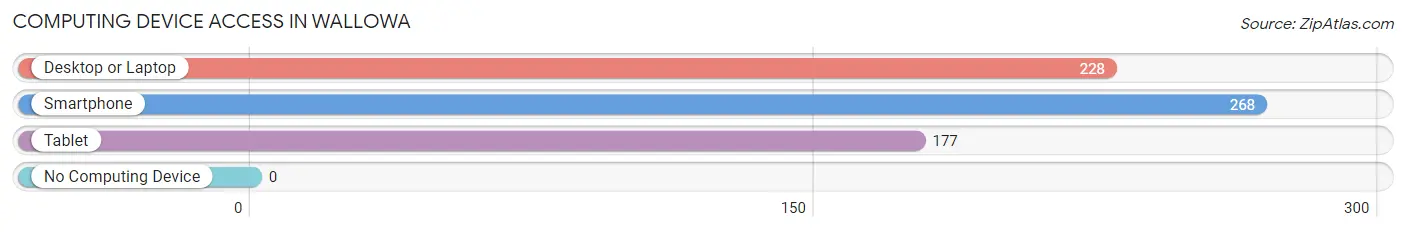
| Device Type | # Households | % Households |
| Desktop or Laptop | 228 | 85.1% |
| Smartphone | 268 | 100.0% |
| Tablet | 177 | 66.0% |
| No Computing Device | 0 | 0.0% |
| Total | 268 | 100.0% |
Internet Access in Wallowa
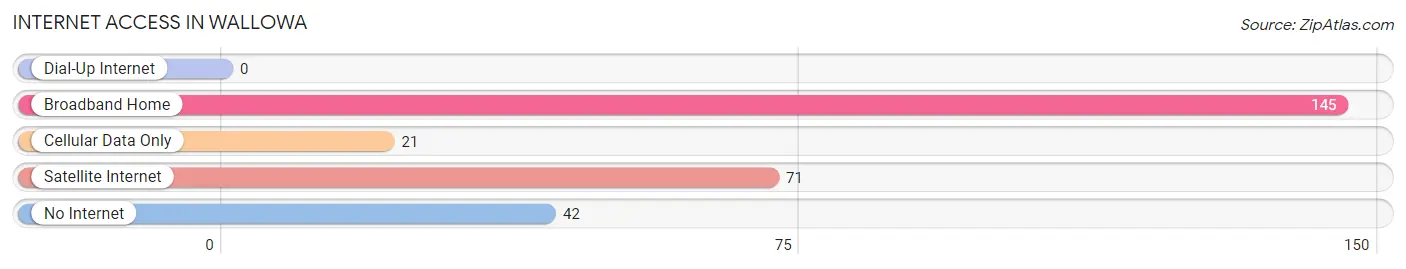
| Internet Type | # Households | % Households |
| Dial-Up Internet | 0 | 0.0% |
| Broadband Home | 145 | 54.1% |
| Cellular Data Only | 21 | 7.8% |
| Satellite Internet | 71 | 26.5% |
| No Internet | 42 | 15.7% |
| Total | 268 | 100.0% |
Wallowa Summary
Wallowa, Oregon is a small town located in the northeastern corner of the state. It is situated in the Wallowa Valley, which is surrounded by the Wallowa Mountains and the Eagle Cap Wilderness. The town is the county seat of Wallowa County and has a population of about 1,000 people.
History
The area that is now Wallowa was first inhabited by the Nez Perce tribe, who lived in the area for thousands of years before the arrival of European settlers. The first white settlers arrived in the area in the late 1800s, and the town of Wallowa was officially established in 1883. The town was named after the Wallowa River, which was named by the Nez Perce for the abundance of salmon in the river.
The town quickly grew and became an important center for the local economy. The Wallowa Valley was home to a thriving logging industry, and the town was also home to a number of businesses, including a sawmill, a flour mill, a creamery, and a brewery.
In the early 1900s, Wallowa was a popular tourist destination, and the town was home to a number of hotels and resorts. The town was also home to a number of cultural attractions, including the Wallowa County Museum and the Wallowa County Historical Society.
Geography
Wallowa is located in the northeastern corner of Oregon, in the Wallowa Valley. The town is surrounded by the Wallowa Mountains and the Eagle Cap Wilderness. The Wallowa River runs through the town, and the Wallowa Lake is located just outside of town.
The town has a total area of 1.2 square miles, all of which is land. The town has a mild climate, with warm summers and cold winters.
Economy
The economy of Wallowa is largely based on tourism and agriculture. The town is home to a number of tourist attractions, including the Wallowa County Museum and the Wallowa County Historical Society. The town is also home to a number of outdoor recreation opportunities, including fishing, hunting, and camping.
The town is also home to a number of agricultural businesses, including a number of farms and ranches. The town is also home to a number of small businesses, including restaurants, shops, and other services.
Demographics
As of the 2010 census, the population of Wallowa was 1,019. The racial makeup of the town was 95.3% White, 0.3% African American, 0.7% Native American, 0.3% Asian, 0.1% Pacific Islander, 0.7% from other races, and 2.0% from two or more races. Hispanic or Latino of any race were 2.7% of the population.
The median income for a household in Wallowa was $31,250, and the median income for a family was $37,500. The per capita income for the town was $17,845. About 11.3% of families and 14.2% of the population were below the poverty line, including 18.2% of those under age 18 and 8.3% of those age 65 or over.
Common Questions
What is the Total Population of Wallowa?
Total Population of Wallowa is 724.
What is the Total Male Population of Wallowa?
Total Male Population of Wallowa is 360.
What is the Total Female Population of Wallowa?
Total Female Population of Wallowa is 364.
What is the Ratio of Males per 100 Females in Wallowa?
There are 98.90 Males per 100 Females in Wallowa.
What is the Ratio of Females per 100 Males in Wallowa?
There are 101.11 Females per 100 Males in Wallowa.
What is the Median Population Age in Wallowa?
Median Population Age in Wallowa is 37.0 Years.
What is the Average Family Size in Wallowa
Average Family Size in Wallowa is 2.8 People.
What is the Average Household Size in Wallowa
Average Household Size in Wallowa is 2.6 People.
What is Per Capita Income in Wallowa?
Per Capita income in Wallowa is $26,660.
What is the Median Family Income in Wallowa?
Median Family Income in Wallowa is $53,750.
What is the Median Household income in Wallowa?
Median Household Income in Wallowa is $46,250.
What is Income or Wage Gap in Wallowa?
Income or Wage Gap in Wallowa is 9.2%.
Women in Wallowa earn 90.8 cents for every dollar earned by a man.
What is Inequality or Gini Index in Wallowa?
Inequality or Gini Index in Wallowa is 0.33.
How Large is the Labor Force in Wallowa?
There are 325 People in the Labor Forcein in Wallowa.
What is the Percentage of People in the Labor Force in Wallowa?
61.0% of People are in the Labor Force in Wallowa.
What is the Unemployment Rate in Wallowa?
Unemployment Rate in Wallowa is 2.8%.