Labish Village, OR
Labish Village Map
Labish Village Overview
496
TOTAL POPULATION
224
MALE POPULATION
272
FEMALE POPULATION
82.35
MALES / 100 FEMALES
121.43
FEMALES / 100 MALES
25.2
MEDIAN AGE
3.9
AVG FAMILY SIZE
4.1
AVG HOUSEHOLD SIZE
$17,418
PER CAPITA INCOME
$47,426
AVG FAMILY INCOME
$56,250
AVG HOUSEHOLD INCOME
0.29
INEQUALITY / GINI INDEX
274
LABOR FORCE [ PEOPLE ]
74.7%
PERCENT IN LABOR FORCE
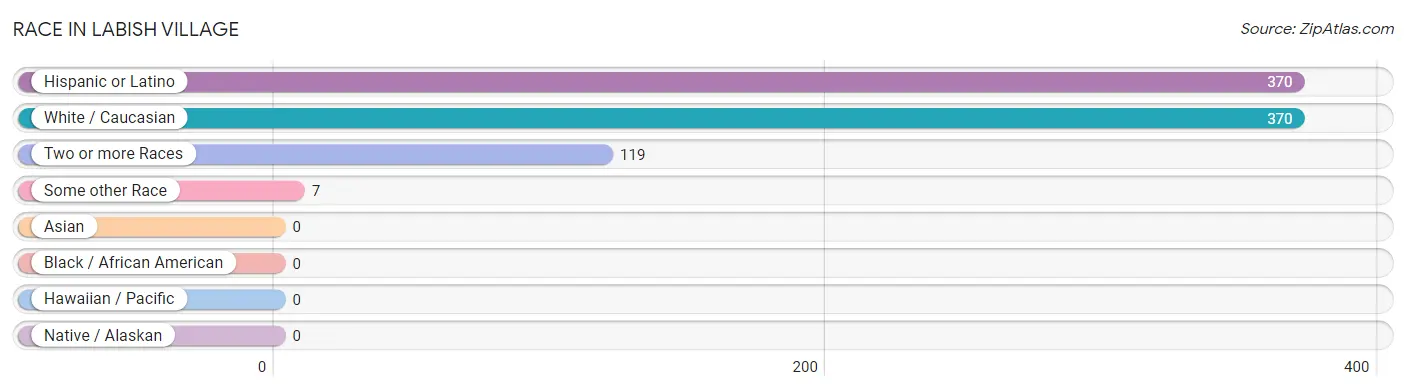
Race in Labish Village
The most populous races in Labish Village are Hispanic or Latino (370 | 74.6%), White / Caucasian (370 | 74.6%), and Two or more Races (119 | 24.0%).
| Race | # Population | % Population |
| Asian | 0 | 0.0% |
| Black / African American | 0 | 0.0% |
| Hawaiian / Pacific | 0 | 0.0% |
| Hispanic or Latino | 370 | 74.6% |
| Native / Alaskan | 0 | 0.0% |
| White / Caucasian | 370 | 74.6% |
| Two or more Races | 119 | 24.0% |
| Some other Race | 7 | 1.4% |
| Total | 496 | 100.0% |
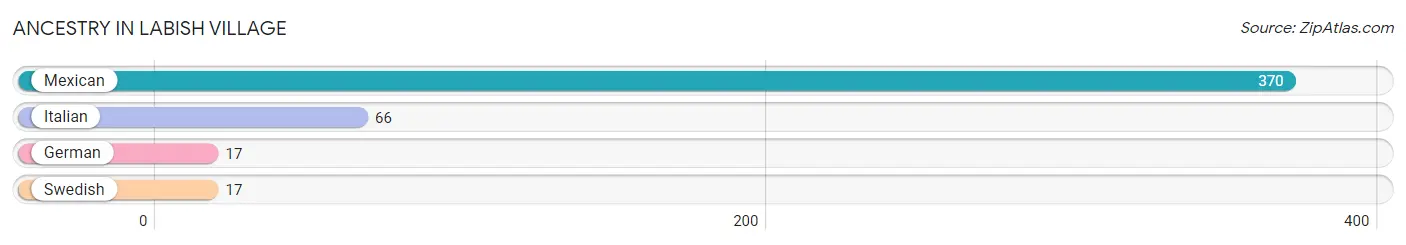
Ancestry in Labish Village
The most populous ancestries reported in Labish Village are Mexican (370 | 74.6%), Italian (66 | 13.3%), German (17 | 3.4%), and Swedish (17 | 3.4%), together accounting for 94.8% of all Labish Village residents.
| Ancestry | # Population | % Population |
| German | 17 | 3.4% |
| Italian | 66 | 13.3% |
| Mexican | 370 | 74.6% |
| Swedish | 17 | 3.4% | View All 4 Rows |
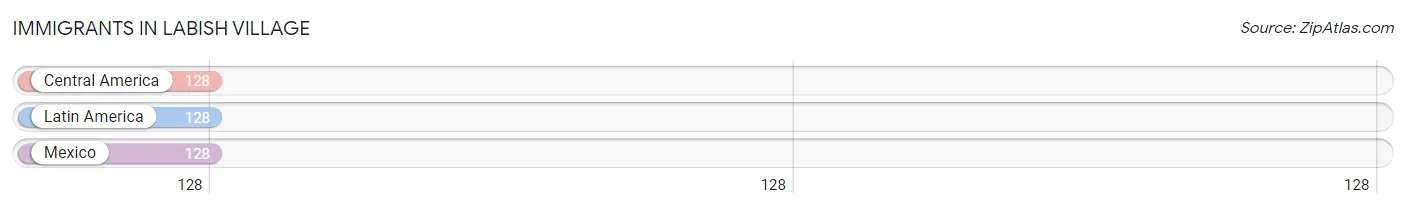
Immigrants in Labish Village
The most numerous immigrant groups reported in Labish Village came from Central America (128 | 25.8%), Latin America (128 | 25.8%), and Mexico (128 | 25.8%), together accounting for 77.4% of all Labish Village residents.
| Immigration Origin | # Population | % Population |
| Central America | 128 | 25.8% |
| Latin America | 128 | 25.8% |
| Mexico | 128 | 25.8% | View All 3 Rows |
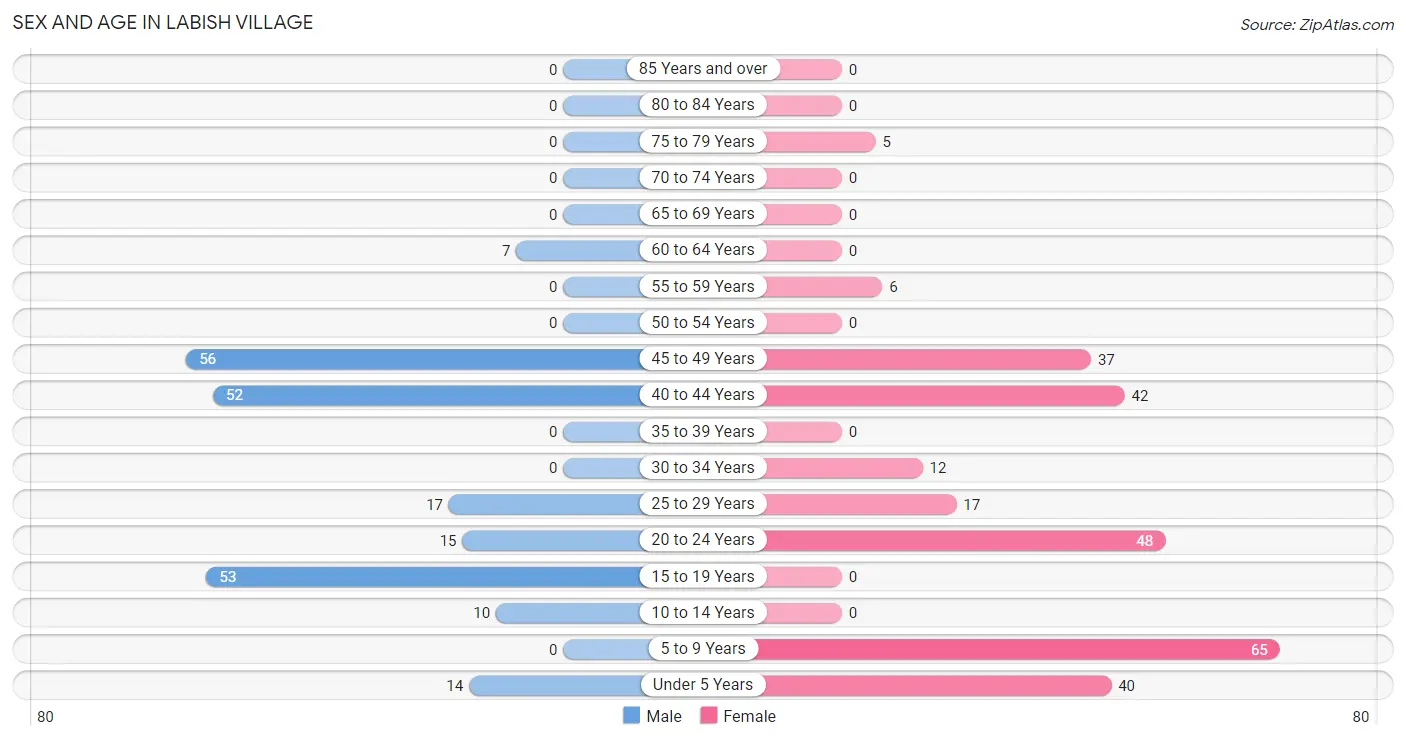
Sex and Age in Labish Village
Sex and Age in Labish Village
The most populous age groups in Labish Village are 45 to 49 Years (56 | 25.0%) for men and 5 to 9 Years (65 | 23.9%) for women.
| Age Bracket | Male | Female |
| Under 5 Years | 14 (6.2%) | 40 (14.7%) |
| 5 to 9 Years | 0 (0.0%) | 65 (23.9%) |
| 10 to 14 Years | 10 (4.5%) | 0 (0.0%) |
| 15 to 19 Years | 53 (23.7%) | 0 (0.0%) |
| 20 to 24 Years | 15 (6.7%) | 48 (17.6%) |
| 25 to 29 Years | 17 (7.6%) | 17 (6.2%) |
| 30 to 34 Years | 0 (0.0%) | 12 (4.4%) |
| 35 to 39 Years | 0 (0.0%) | 0 (0.0%) |
| 40 to 44 Years | 52 (23.2%) | 42 (15.4%) |
| 45 to 49 Years | 56 (25.0%) | 37 (13.6%) |
| 50 to 54 Years | 0 (0.0%) | 0 (0.0%) |
| 55 to 59 Years | 0 (0.0%) | 6 (2.2%) |
| 60 to 64 Years | 7 (3.1%) | 0 (0.0%) |
| 65 to 69 Years | 0 (0.0%) | 0 (0.0%) |
| 70 to 74 Years | 0 (0.0%) | 0 (0.0%) |
| 75 to 79 Years | 0 (0.0%) | 5 (1.8%) |
| 80 to 84 Years | 0 (0.0%) | 0 (0.0%) |
| 85 Years and over | 0 (0.0%) | 0 (0.0%) |
| Total | 224 (100.0%) | 272 (100.0%) |
Families and Households in Labish Village
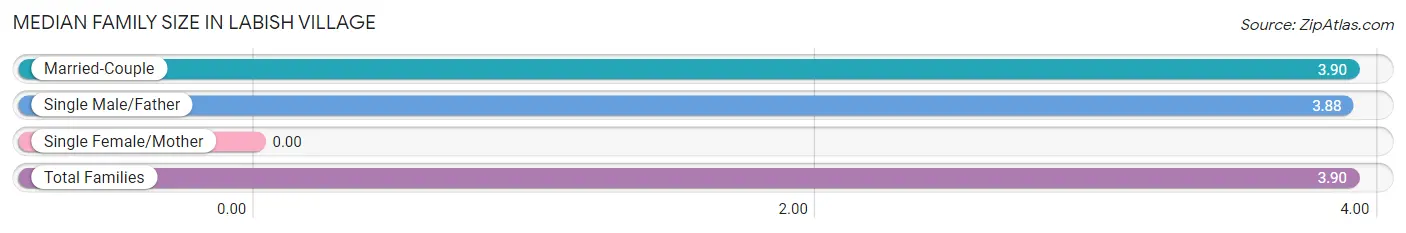
Median Family Size in Labish Village
| Family Type | # Families | Family Size |
| Married-Couple | 104 (86.0%) | 3.90 |
| Single Male/Father | 17 (14.1%) | 3.88 |
| Single Female/Mother | 0 (0.0%) | - |
| Total Families | 121 (100.0%) | 3.90 |
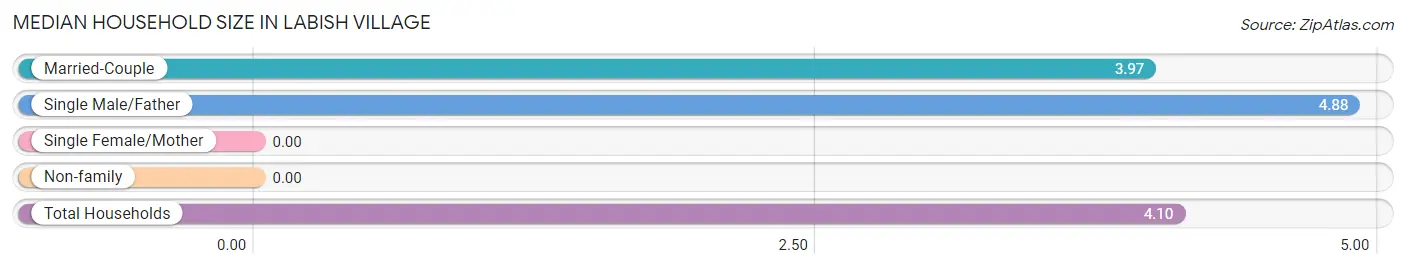
Median Household Size in Labish Village
| Household Type | # Households | Household Size |
| Married-Couple | 104 (86.0%) | 3.97 |
| Single Male/Father | 17 (14.1%) | 4.88 |
| Single Female/Mother | 0 (0.0%) | - |
| Non-family | 0 (0.0%) | - |
| Total Households | 121 (100.0%) | 4.10 |
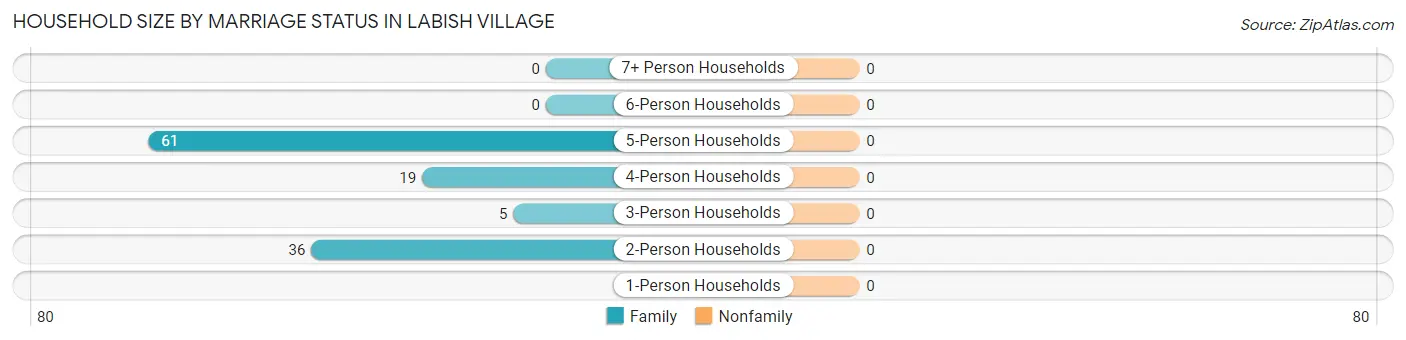
Household Size by Marriage Status in Labish Village
| Household Size | Family Households | Nonfamily Households |
| 1-Person Households | - | 0 (0.0%) |
| 2-Person Households | 36 (29.7%) | 0 (0.0%) |
| 3-Person Households | 5 (4.1%) | 0 (0.0%) |
| 4-Person Households | 19 (15.7%) | 0 (0.0%) |
| 5-Person Households | 61 (50.4%) | 0 (0.0%) |
| 6-Person Households | 0 (0.0%) | 0 (0.0%) |
| 7+ Person Households | 0 (0.0%) | 0 (0.0%) |
| Total | 121 (100.0%) | 0 (0.0%) |
Female Fertility in Labish Village
Fertility by Age in Labish Village
| Age Bracket | Women with Births | Births / 1,000 Women |
| 15 to 19 years | 0 (0.0%) | 0.0 |
| 20 to 34 years | 0 (0.0%) | 0.0 |
| 35 to 50 years | 0 (0.0%) | 0.0 |
| Total | 0 (0.0%) | 0.0 |
Fertility by Age by Marriage Status in Labish Village
| Age Bracket | Married | Unmarried |
| 15 to 19 years | 0 (0.0%) | 0 (0.0%) |
| 20 to 34 years | 0 (0.0%) | 0 (0.0%) |
| 35 to 50 years | 0 (0.0%) | 0 (0.0%) |
| Total | 0 (0.0%) | 0 (0.0%) |
Fertility by Education in Labish Village
| Educational Attainment | Women with Births | Births / 1,000 Women |
| Less than High School | 0 (0.0%) | 0.0 |
| High School Diploma | 0 (0.0%) | 0.0 |
| College or Associate's Degree | 0 (0.0%) | 0.0 |
| Bachelor's Degree | 0 (0.0%) | 0.0 |
| Graduate Degree | 0 (0.0%) | 0.0 |
| Total | 0 (0.0%) | 0.0 |
Fertility by Education by Marriage Status in Labish Village
| Educational Attainment | Married | Unmarried |
| Less than High School | 0 (0.0%) | 0 (0.0%) |
| High School Diploma | 0 (0.0%) | 0 (0.0%) |
| College or Associate's Degree | 0 (0.0%) | 0 (0.0%) |
| Bachelor's Degree | 0 (0.0%) | 0 (0.0%) |
| Graduate Degree | 0 (0.0%) | 0 (0.0%) |
| Total | 0 (0.0%) | 0 (0.0%) |
Income in Labish Village
Income Overview in Labish Village
Per Capita Income in Labish Village is $17,418, while median incomes of families and households are $47,426 and $56,250 respectively.
| Characteristic | Number | Measure |
| Per Capita Income | 496 | $17,418 |
| Median Family Income | 121 | $47,426 |
| Mean Family Income | 121 | $59,122 |
| Median Household Income | 121 | $56,250 |
| Mean Household Income | 121 | $67,231 |
| Income Deficit | 121 | $0 |
| Wage / Income Gap (%) | 496 | 0.00% |
| Wage / Income Gap ($) | 496 | 100.00¢ per $1 |
| Gini / Inequality Index | 496 | 0.29 |
Earnings by Sex in Labish Village
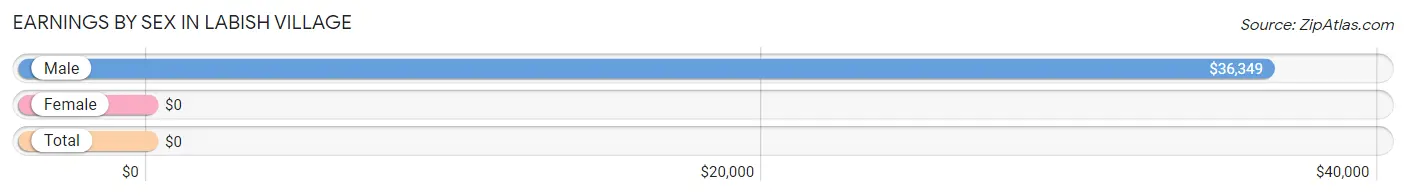
| Sex | Number | Average Earnings |
| Male | 191 (68.5%) | $36,349 |
| Female | 88 (31.5%) | $0 |
| Total | 279 (100.0%) | $0 |
Earnings by Sex by Income Bracket in Labish Village
The most common earnings brackets in Labish Village are $35,000 to $39,999 for men (71 | 37.2%) and $5,000 to $7,499 for women (44 | 50.0%).
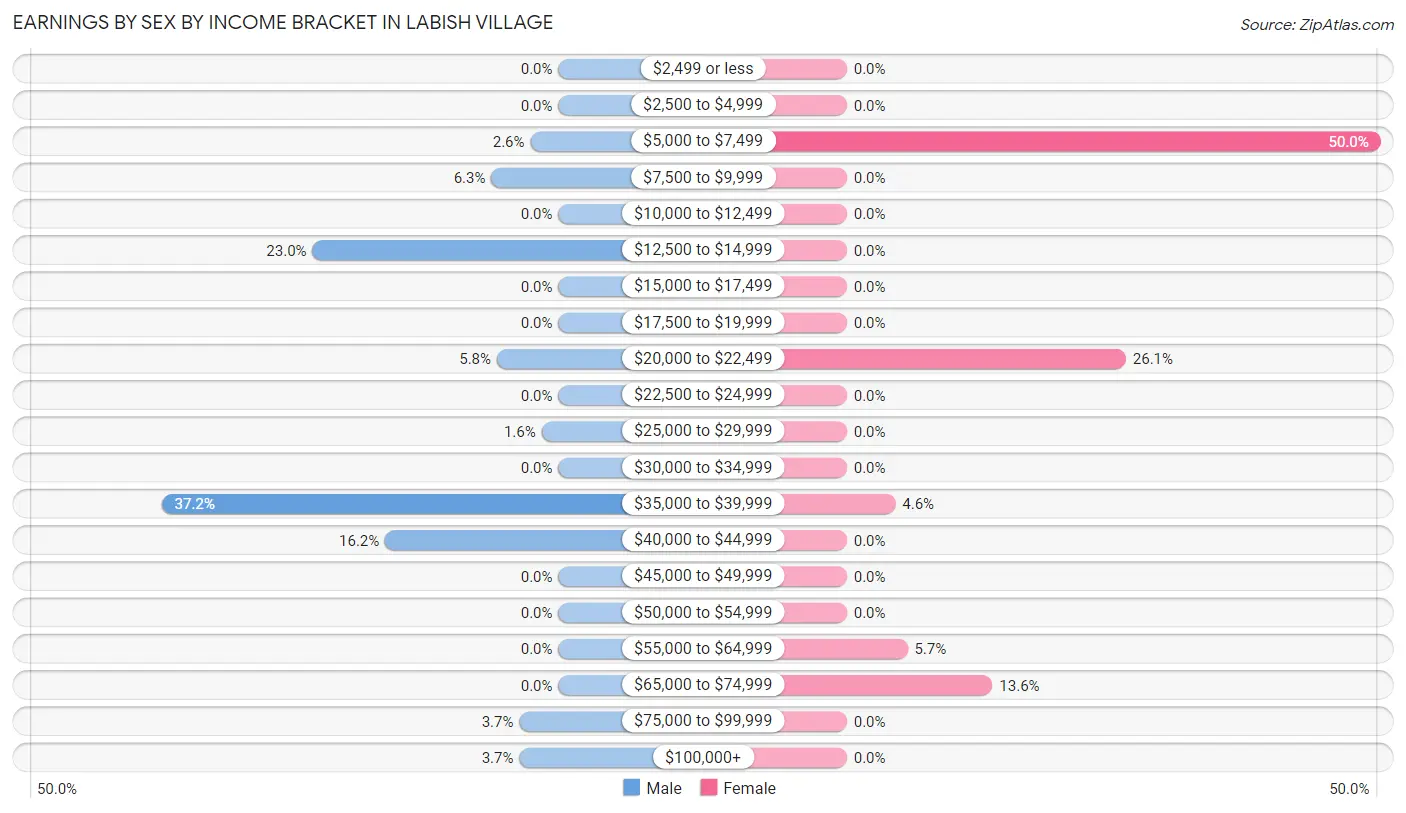
| Income | Male | Female |
| $2,499 or less | 0 (0.0%) | 0 (0.0%) |
| $2,500 to $4,999 | 0 (0.0%) | 0 (0.0%) |
| $5,000 to $7,499 | 5 (2.6%) | 44 (50.0%) |
| $7,500 to $9,999 | 12 (6.3%) | 0 (0.0%) |
| $10,000 to $12,499 | 0 (0.0%) | 0 (0.0%) |
| $12,500 to $14,999 | 44 (23.0%) | 0 (0.0%) |
| $15,000 to $17,499 | 0 (0.0%) | 0 (0.0%) |
| $17,500 to $19,999 | 0 (0.0%) | 0 (0.0%) |
| $20,000 to $22,499 | 11 (5.8%) | 23 (26.1%) |
| $22,500 to $24,999 | 0 (0.0%) | 0 (0.0%) |
| $25,000 to $29,999 | 3 (1.6%) | 0 (0.0%) |
| $30,000 to $34,999 | 0 (0.0%) | 0 (0.0%) |
| $35,000 to $39,999 | 71 (37.2%) | 4 (4.5%) |
| $40,000 to $44,999 | 31 (16.2%) | 0 (0.0%) |
| $45,000 to $49,999 | 0 (0.0%) | 0 (0.0%) |
| $50,000 to $54,999 | 0 (0.0%) | 0 (0.0%) |
| $55,000 to $64,999 | 0 (0.0%) | 5 (5.7%) |
| $65,000 to $74,999 | 0 (0.0%) | 12 (13.6%) |
| $75,000 to $99,999 | 7 (3.7%) | 0 (0.0%) |
| $100,000+ | 7 (3.7%) | 0 (0.0%) |
| Total | 191 (100.0%) | 88 (100.0%) |
Earnings by Sex by Educational Attainment in Labish Village
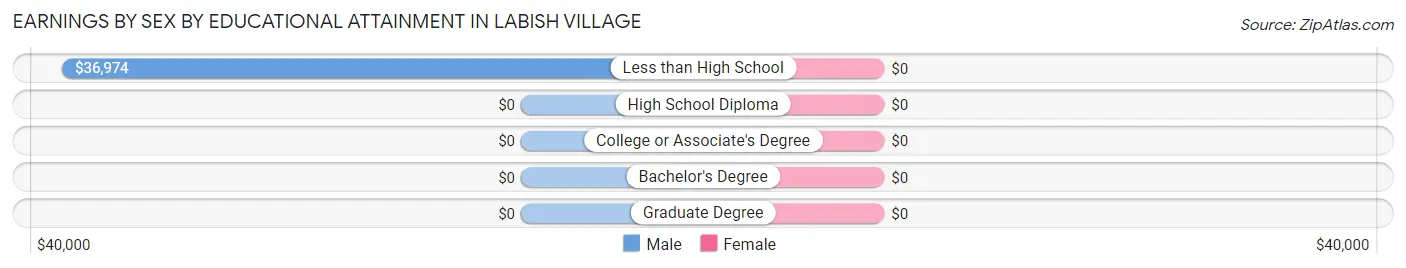
| Educational Attainment | Male Income | Female Income |
| Less than High School | $36,974 | $0 |
| High School Diploma | - | - |
| College or Associate's Degree | - | - |
| Bachelor's Degree | - | - |
| Graduate Degree | - | - |
| Total | $38,409 | $0 |
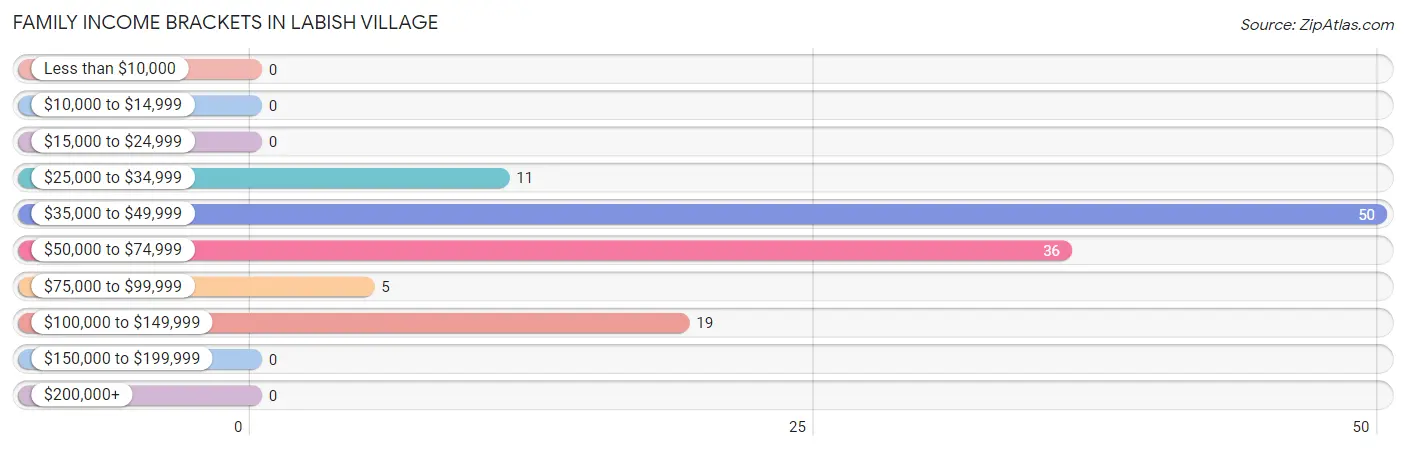
Family Income in Labish Village
Family Income Brackets in Labish Village
According to the Labish Village family income data, there are 50 families falling into the $35,000 to $49,999 income range, which is the most common income bracket and makes up 41.3% of all families.
| Income Bracket | # Families | % Families |
| Less than $10,000 | 0 | 0.0% |
| $10,000 to $14,999 | 0 | 0.0% |
| $15,000 to $24,999 | 0 | 0.0% |
| $25,000 to $34,999 | 11 | 9.1% |
| $35,000 to $49,999 | 50 | 41.3% |
| $50,000 to $74,999 | 36 | 29.8% |
| $75,000 to $99,999 | 5 | 4.1% |
| $100,000 to $149,999 | 19 | 15.7% |
| $150,000 to $199,999 | 0 | 0.0% |
| $200,000+ | 0 | 0.0% |
Family Income by Famaliy Size in Labish Village
| Income Bracket | # Families | Median Income |
| 2-Person Families | 36 (29.7%) | $0 |
| 3-Person Families | 12 (9.9%) | $0 |
| 4-Person Families | 29 (24.0%) | $0 |
| 5-Person Families | 44 (36.4%) | $0 |
| 6-Person Families | 0 (0.0%) | $0 |
| 7+ Person Families | 0 (0.0%) | $0 |
| Total | 121 (100.0%) | $47,426 |
Family Income by Number of Earners in Labish Village
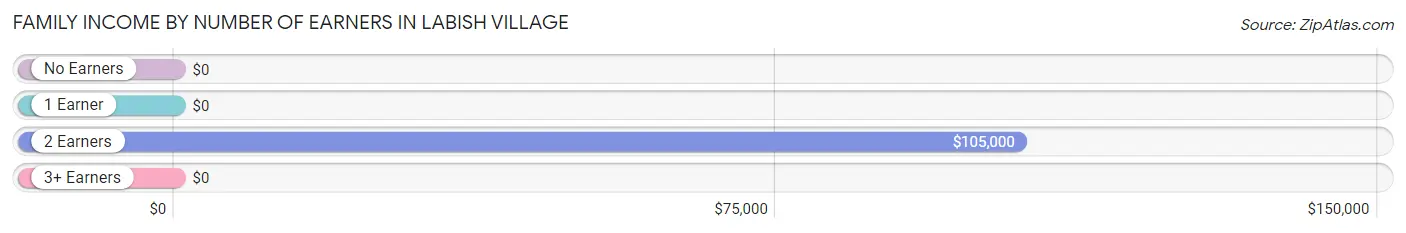
| Number of Earners | # Families | Median Income |
| No Earners | 0 (0.0%) | $0 |
| 1 Earner | 50 (41.3%) | $0 |
| 2 Earners | 38 (31.4%) | $105,000 |
| 3+ Earners | 33 (27.3%) | $0 |
| Total | 121 (100.0%) | $47,426 |
Household Income in Labish Village
Household Income Brackets in Labish Village
With 53 households falling in the category, the $50,000 to $74,999 income range is the most frequent in Labish Village, accounting for 43.8% of all households.
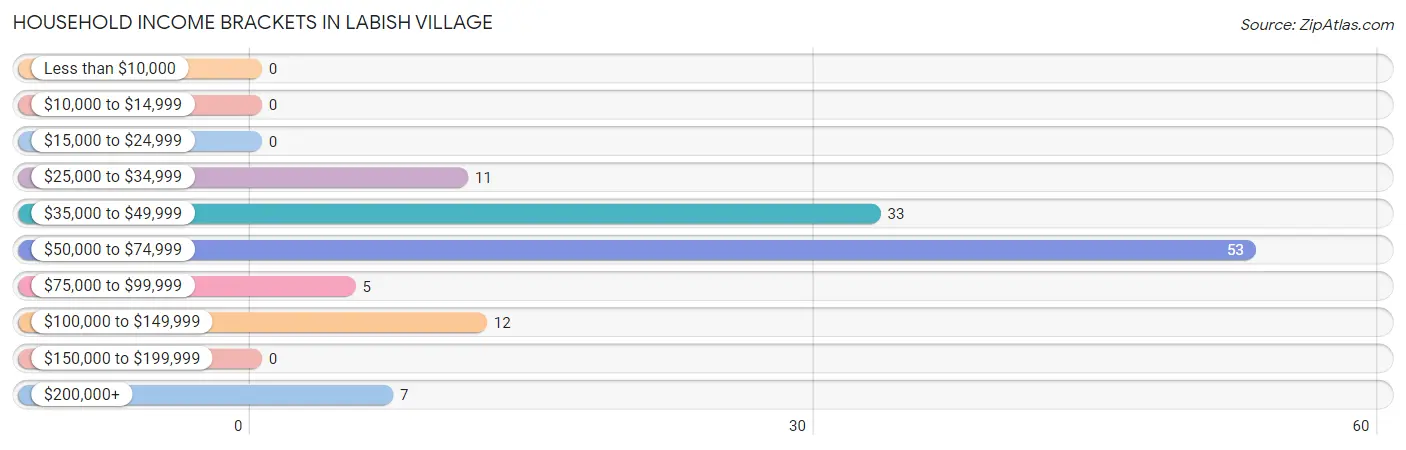
| Income Bracket | # Households | % Households |
| Less than $10,000 | 0 | 0.0% |
| $10,000 to $14,999 | 0 | 0.0% |
| $15,000 to $24,999 | 0 | 0.0% |
| $25,000 to $34,999 | 11 | 9.1% |
| $35,000 to $49,999 | 33 | 27.3% |
| $50,000 to $74,999 | 53 | 43.8% |
| $75,000 to $99,999 | 5 | 4.1% |
| $100,000 to $149,999 | 12 | 9.9% |
| $150,000 to $199,999 | 0 | 0.0% |
| $200,000+ | 7 | 5.8% |
Household Income by Householder Age in Labish Village
The median household income in Labish Village is $56,250, with the highest median household income of $57,348 found in the 25 to 44 years age bracket for the primary householder. A total of 62 households (51.2%) fall into this category. Meanwhile, the 15 to 24 years age bracket for the primary householder has the lowest median household income of $0, with 3 households (2.5%) in this group.
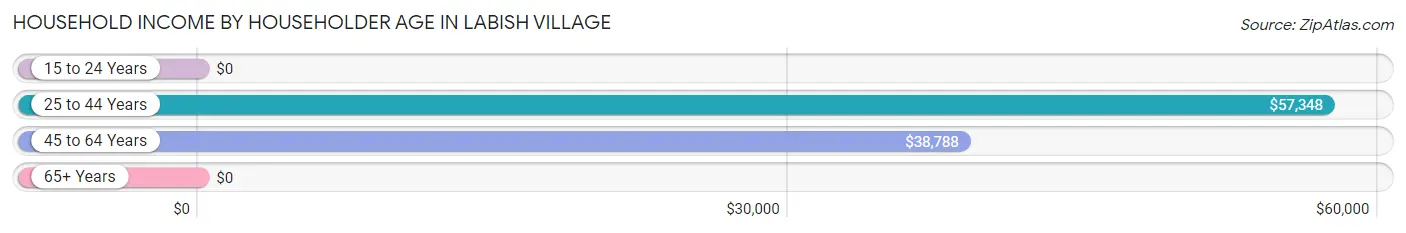
| Income Bracket | # Households | Median Income |
| 15 to 24 Years | 3 (2.5%) | $0 |
| 25 to 44 Years | 62 (51.2%) | $57,348 |
| 45 to 64 Years | 56 (46.3%) | $38,788 |
| 65+ Years | 0 (0.0%) | $0 |
| Total | 121 (100.0%) | $56,250 |
Poverty in Labish Village
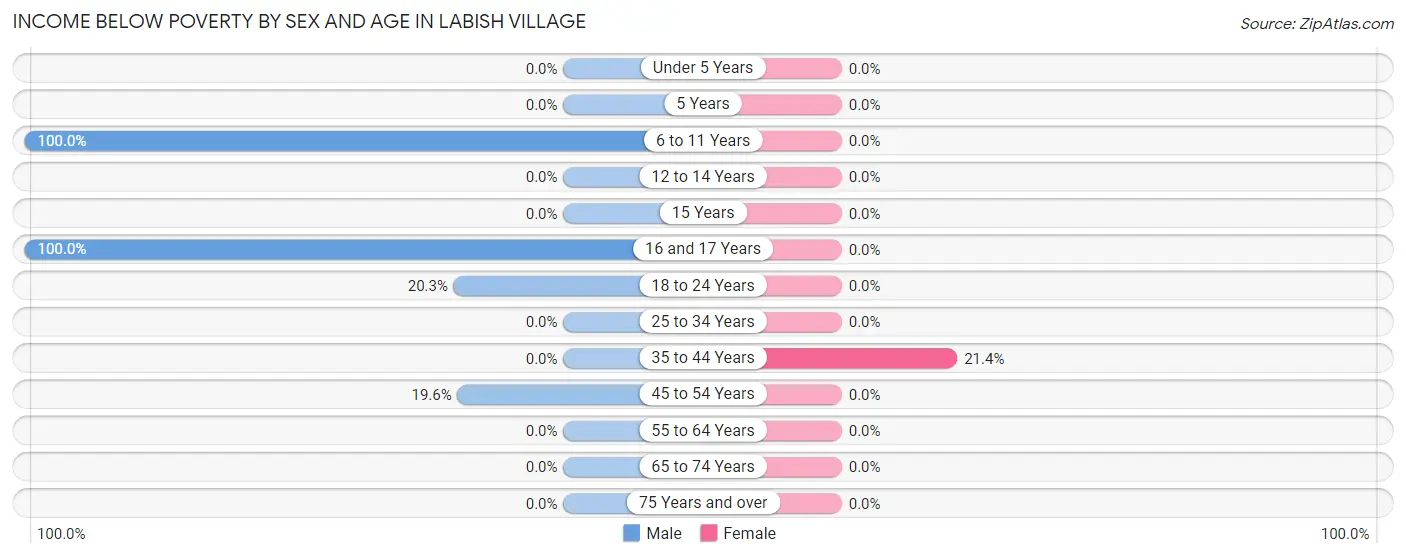
Income Below Poverty by Sex and Age in Labish Village
With 18.8% poverty level for males and 3.3% for females among the residents of Labish Village, 6 to 11 year old males and 35 to 44 year old females are the most vulnerable to poverty, with 10 males (100.0%) and 9 females (21.4%) in their respective age groups living below the poverty level.
| Age Bracket | Male | Female |
| Under 5 Years | 0 (0.0%) | 0 (0.0%) |
| 5 Years | 0 (0.0%) | 0 (0.0%) |
| 6 to 11 Years | 10 (100.0%) | 0 (0.0%) |
| 12 to 14 Years | 0 (0.0%) | 0 (0.0%) |
| 15 Years | 0 (0.0%) | 0 (0.0%) |
| 16 and 17 Years | 9 (100.0%) | 0 (0.0%) |
| 18 to 24 Years | 12 (20.3%) | 0 (0.0%) |
| 25 to 34 Years | 0 (0.0%) | 0 (0.0%) |
| 35 to 44 Years | 0 (0.0%) | 9 (21.4%) |
| 45 to 54 Years | 11 (19.6%) | 0 (0.0%) |
| 55 to 64 Years | 0 (0.0%) | 0 (0.0%) |
| 65 to 74 Years | 0 (0.0%) | 0 (0.0%) |
| 75 Years and over | 0 (0.0%) | 0 (0.0%) |
| Total | 42 (18.8%) | 9 (3.3%) |
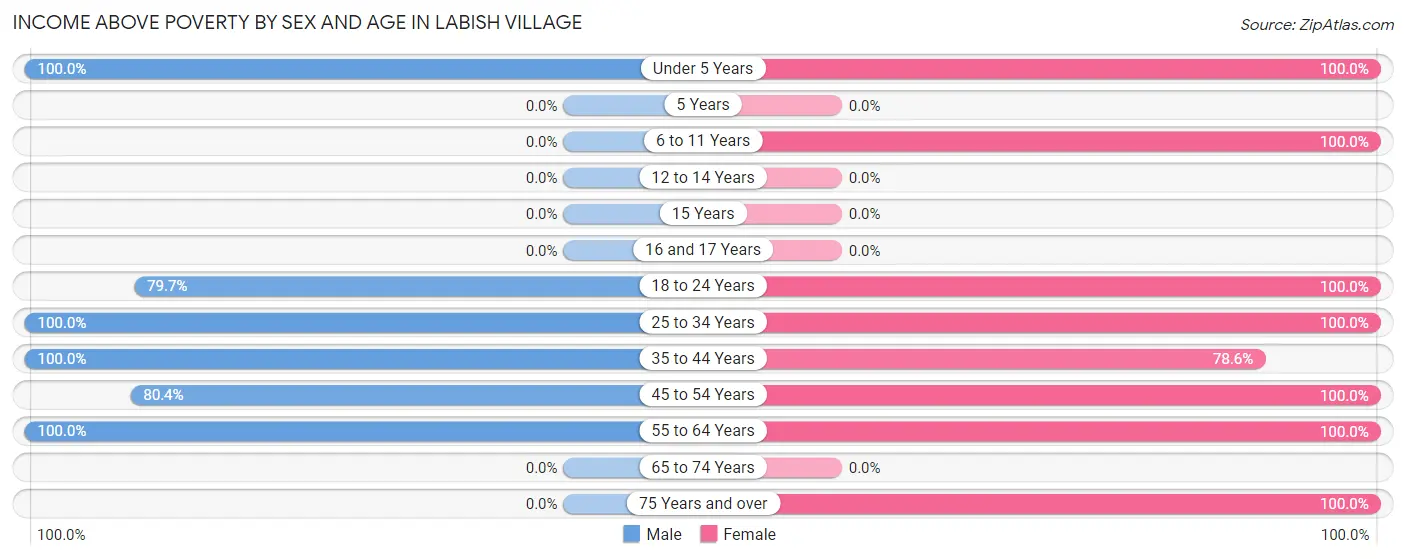
Income Above Poverty by Sex and Age in Labish Village
According to the poverty statistics in Labish Village, males aged under 5 years and females aged under 5 years are the age groups that are most secure financially, with 100.0% of males and 100.0% of females in these age groups living above the poverty line.
| Age Bracket | Male | Female |
| Under 5 Years | 14 (100.0%) | 40 (100.0%) |
| 5 Years | 0 (0.0%) | 0 (0.0%) |
| 6 to 11 Years | 0 (0.0%) | 65 (100.0%) |
| 12 to 14 Years | 0 (0.0%) | 0 (0.0%) |
| 15 Years | 0 (0.0%) | 0 (0.0%) |
| 16 and 17 Years | 0 (0.0%) | 0 (0.0%) |
| 18 to 24 Years | 47 (79.7%) | 48 (100.0%) |
| 25 to 34 Years | 17 (100.0%) | 29 (100.0%) |
| 35 to 44 Years | 52 (100.0%) | 33 (78.6%) |
| 45 to 54 Years | 45 (80.4%) | 37 (100.0%) |
| 55 to 64 Years | 7 (100.0%) | 6 (100.0%) |
| 65 to 74 Years | 0 (0.0%) | 0 (0.0%) |
| 75 Years and over | 0 (0.0%) | 5 (100.0%) |
| Total | 182 (81.2%) | 263 (96.7%) |
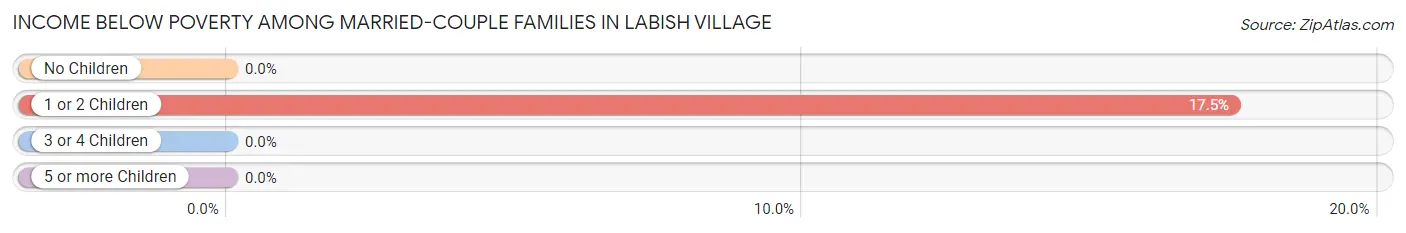
Income Below Poverty Among Married-Couple Families in Labish Village
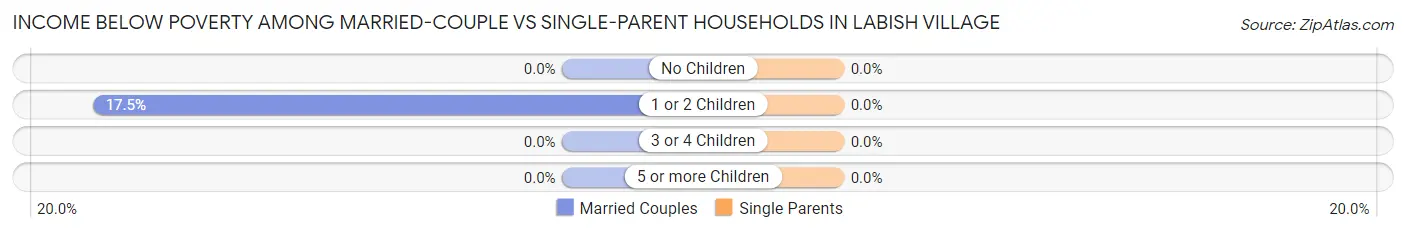
The poverty statistics for married-couple families in Labish Village show that 10.6% or 11 of the total 104 families live below the poverty line. Families with 1 or 2 children have the highest poverty rate of 17.5%, comprising of 11 families. On the other hand, families with no children have the lowest poverty rate of 0.0%, which includes 0 families.
| Children | Above Poverty | Below Poverty |
| No Children | 41 (100.0%) | 0 (0.0%) |
| 1 or 2 Children | 52 (82.5%) | 11 (17.5%) |
| 3 or 4 Children | 0 (0.0%) | 0 (0.0%) |
| 5 or more Children | 0 (0.0%) | 0 (0.0%) |
| Total | 93 (89.4%) | 11 (10.6%) |
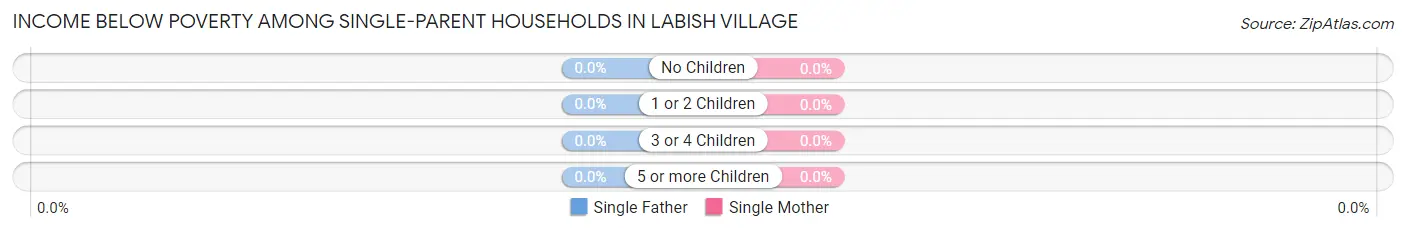
Income Below Poverty Among Single-Parent Households in Labish Village
| Children | Single Father | Single Mother |
| No Children | 0 (0.0%) | 0 (0.0%) |
| 1 or 2 Children | 0 (0.0%) | 0 (0.0%) |
| 3 or 4 Children | 0 (0.0%) | 0 (0.0%) |
| 5 or more Children | 0 (0.0%) | 0 (0.0%) |
| Total | 0 (0.0%) | 0 (0.0%) |
Income Below Poverty Among Married-Couple vs Single-Parent Households in Labish Village
| Children | Married-Couple Families | Single-Parent Households |
| No Children | 0 (0.0%) | 0 (0.0%) |
| 1 or 2 Children | 11 (17.5%) | 0 (0.0%) |
| 3 or 4 Children | 0 (0.0%) | 0 (0.0%) |
| 5 or more Children | 0 (0.0%) | 0 (0.0%) |
| Total | 11 (10.6%) | 0 (0.0%) |
Employment Characteristics in Labish Village
Employment by Class of Employer in Labish Village
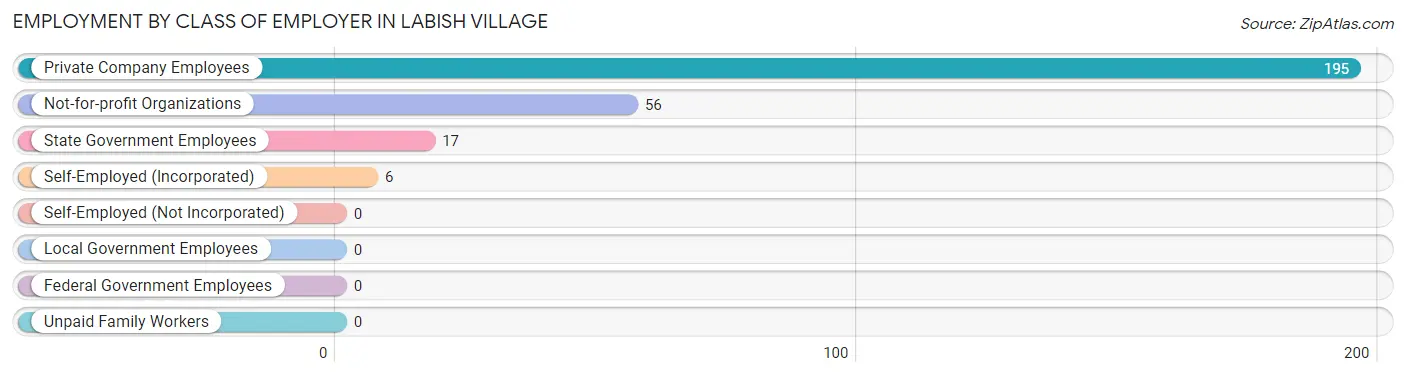
Among the 274 employed individuals in Labish Village, private company employees (195 | 71.2%), not-for-profit organizations (56 | 20.4%), and state government employees (17 | 6.2%) make up the most common classes of employment.
| Employer Class | # Employees | % Employees |
| Private Company Employees | 195 | 71.2% |
| Self-Employed (Incorporated) | 6 | 2.2% |
| Self-Employed (Not Incorporated) | 0 | 0.0% |
| Not-for-profit Organizations | 56 | 20.4% |
| Local Government Employees | 0 | 0.0% |
| State Government Employees | 17 | 6.2% |
| Federal Government Employees | 0 | 0.0% |
| Unpaid Family Workers | 0 | 0.0% |
| Total | 274 | 100.0% |
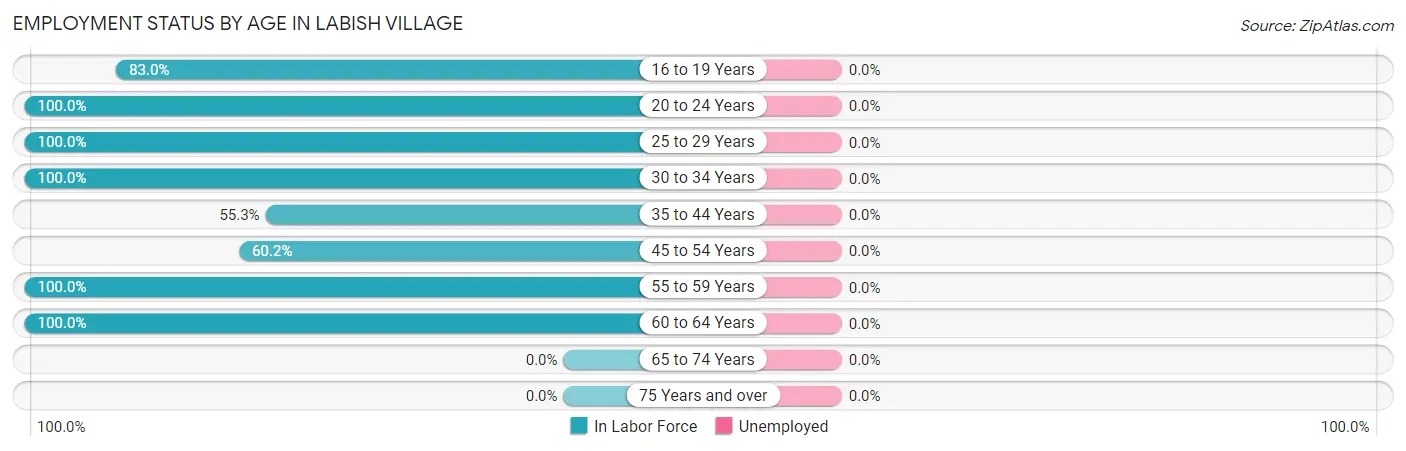
Employment Status by Age in Labish Village
| Age Bracket | In Labor Force | Unemployed |
| 16 to 19 Years | 44 (83.0%) | 0 (0.0%) |
| 20 to 24 Years | 63 (100.0%) | 0 (0.0%) |
| 25 to 29 Years | 34 (100.0%) | 0 (0.0%) |
| 30 to 34 Years | 12 (100.0%) | 0 (0.0%) |
| 35 to 44 Years | 52 (55.3%) | 0 (0.0%) |
| 45 to 54 Years | 56 (60.2%) | 0 (0.0%) |
| 55 to 59 Years | 6 (100.0%) | 0 (0.0%) |
| 60 to 64 Years | 7 (100.0%) | 0 (0.0%) |
| 65 to 74 Years | 0 (0.0%) | 0 (0.0%) |
| 75 Years and over | 0 (0.0%) | 0 (0.0%) |
| Total | 274 (74.7%) | 0 (0.0%) |
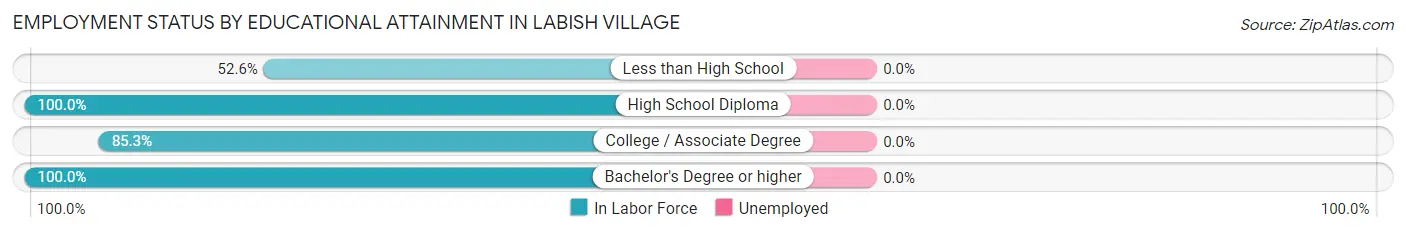
Employment Status by Educational Attainment in Labish Village
| Educational Attainment | In Labor Force | Unemployed |
| Less than High School | 82 (52.6%) | 0 (0.0%) |
| High School Diploma | 31 (100.0%) | 0 (0.0%) |
| College / Associate Degree | 29 (85.3%) | 0 (0.0%) |
| Bachelor's Degree or higher | 25 (100.0%) | 0 (0.0%) |
| Total | 167 (67.9%) | 0 (0.0%) |
Employment Occupations by Sex in Labish Village
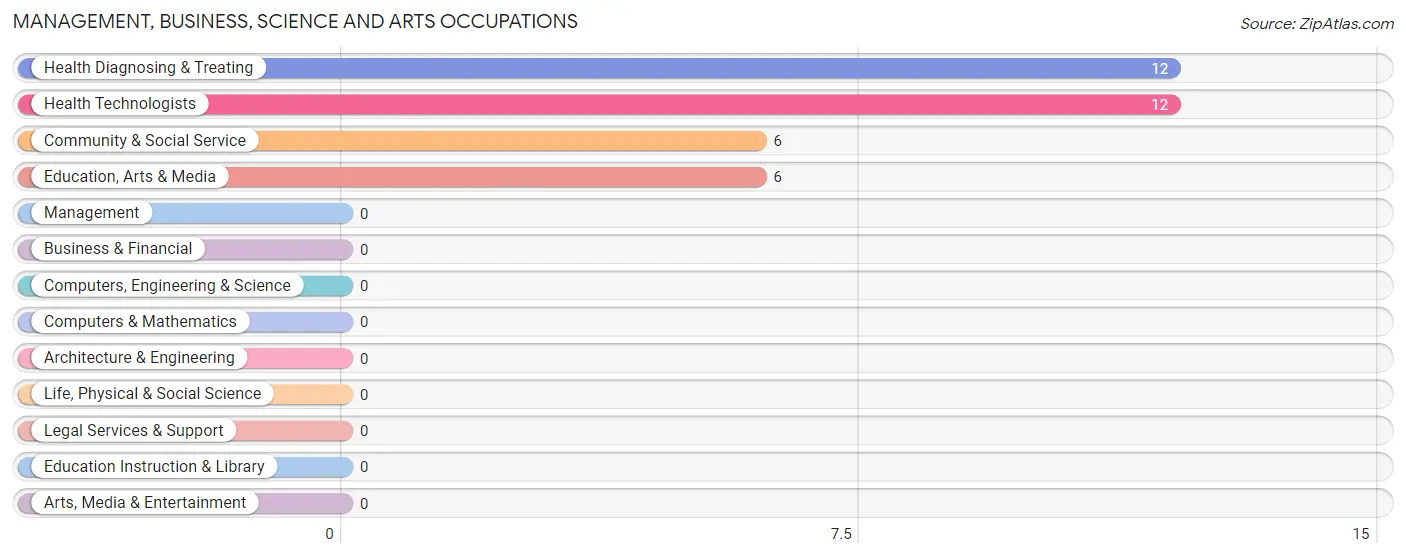
Management, Business, Science and Arts Occupations
The most common Management, Business, Science and Arts occupations in Labish Village are Health Diagnosing & Treating (12 | 4.4%), Health Technologists (12 | 4.4%), Community & Social Service (6 | 2.2%), and Education, Arts & Media (6 | 2.2%).
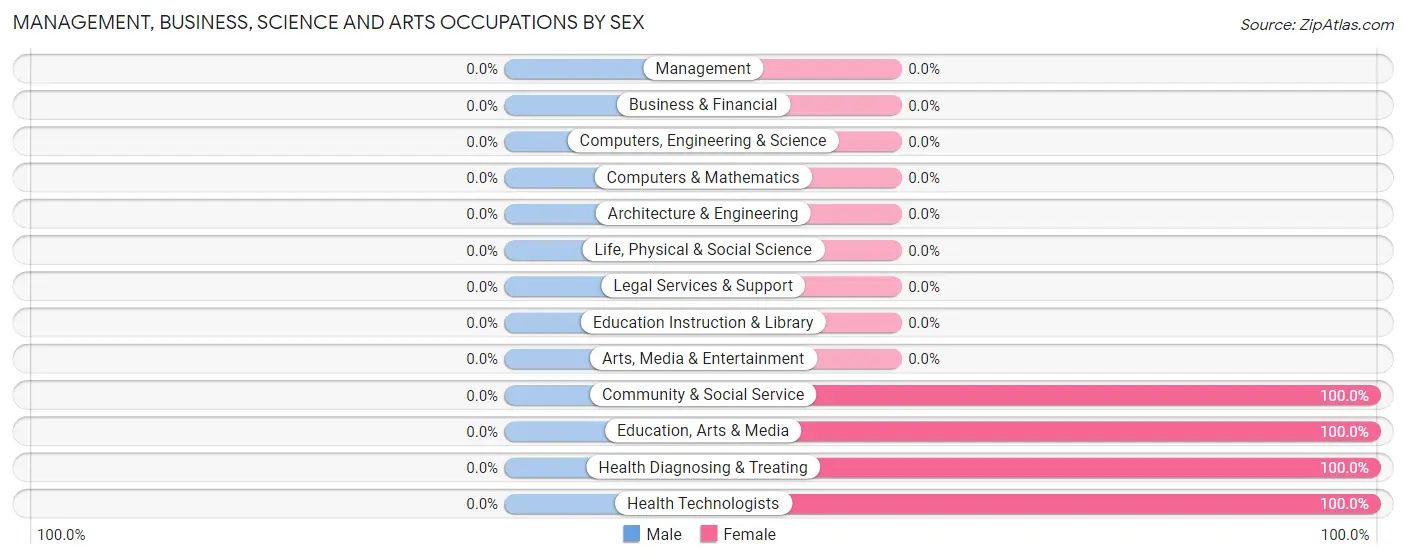
Management, Business, Science and Arts Occupations by Sex
| Occupation | Male | Female |
| Management | 0 (0.0%) | 0 (0.0%) |
| Business & Financial | 0 (0.0%) | 0 (0.0%) |
| Computers, Engineering & Science | 0 (0.0%) | 0 (0.0%) |
| Computers & Mathematics | 0 (0.0%) | 0 (0.0%) |
| Architecture & Engineering | 0 (0.0%) | 0 (0.0%) |
| Life, Physical & Social Science | 0 (0.0%) | 0 (0.0%) |
| Community & Social Service | 0 (0.0%) | 6 (100.0%) |
| Education, Arts & Media | 0 (0.0%) | 6 (100.0%) |
| Legal Services & Support | 0 (0.0%) | 0 (0.0%) |
| Education Instruction & Library | 0 (0.0%) | 0 (0.0%) |
| Arts, Media & Entertainment | 0 (0.0%) | 0 (0.0%) |
| Health Diagnosing & Treating | 0 (0.0%) | 12 (100.0%) |
| Health Technologists | 0 (0.0%) | 12 (100.0%) |
| Total (Category) | 0 (0.0%) | 18 (100.0%) |
| Total (Overall) | 186 (67.9%) | 88 (32.1%) |
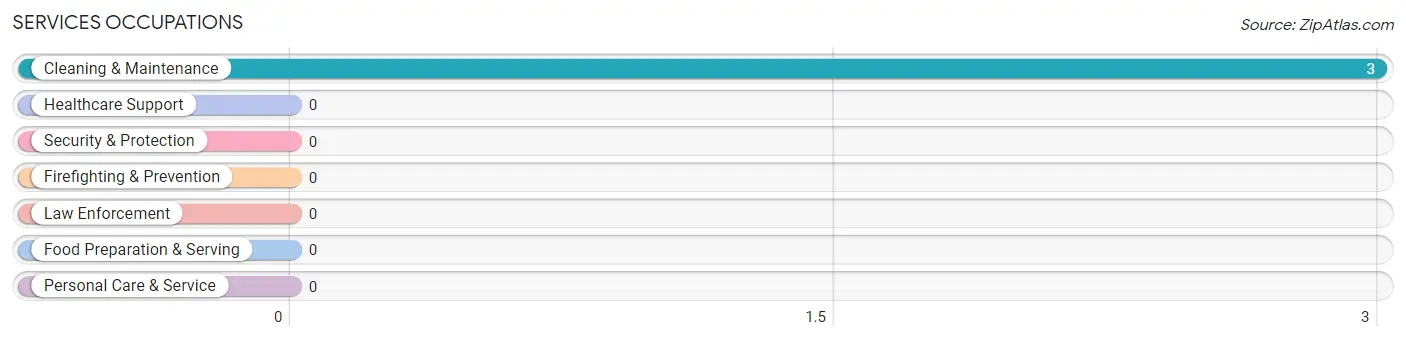
Services Occupations
The most common Services occupations in Labish Village are , and Cleaning & Maintenance (3 | 1.1%).
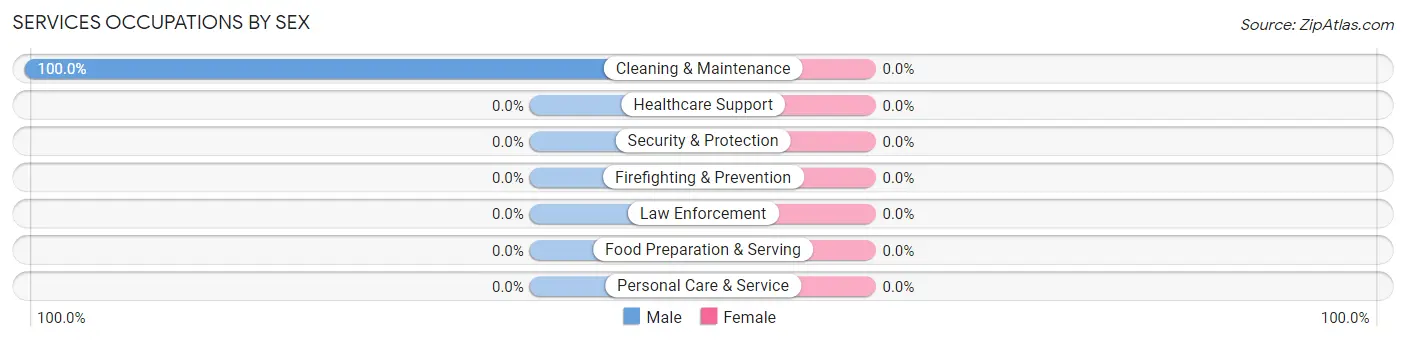
Services Occupations by Sex
| Occupation | Male | Female |
| Healthcare Support | 0 (0.0%) | 0 (0.0%) |
| Security & Protection | 0 (0.0%) | 0 (0.0%) |
| Firefighting & Prevention | 0 (0.0%) | 0 (0.0%) |
| Law Enforcement | 0 (0.0%) | 0 (0.0%) |
| Food Preparation & Serving | 0 (0.0%) | 0 (0.0%) |
| Cleaning & Maintenance | 3 (100.0%) | 0 (0.0%) |
| Personal Care & Service | 0 (0.0%) | 0 (0.0%) |
| Total (Category) | 3 (100.0%) | 0 (0.0%) |
| Total (Overall) | 186 (67.9%) | 88 (32.1%) |
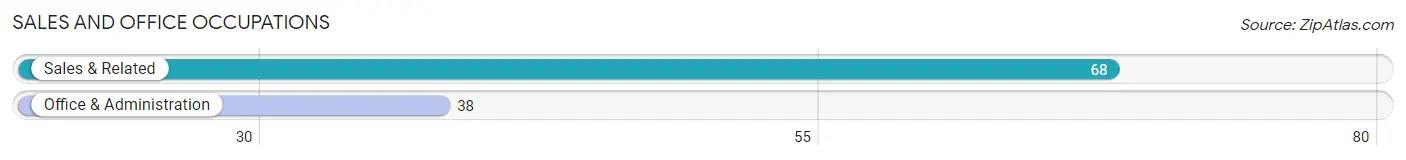
Sales and Office Occupations
The most common Sales and Office occupations in Labish Village are Sales & Related (68 | 24.8%), and Office & Administration (38 | 13.9%).
Sales and Office Occupations by Sex
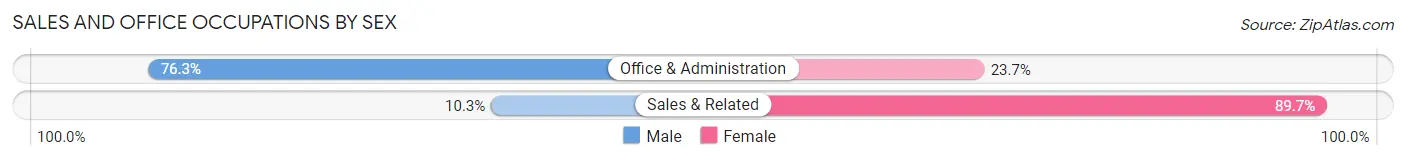
| Occupation | Male | Female |
| Sales & Related | 7 (10.3%) | 61 (89.7%) |
| Office & Administration | 29 (76.3%) | 9 (23.7%) |
| Total (Category) | 36 (34.0%) | 70 (66.0%) |
| Total (Overall) | 186 (67.9%) | 88 (32.1%) |
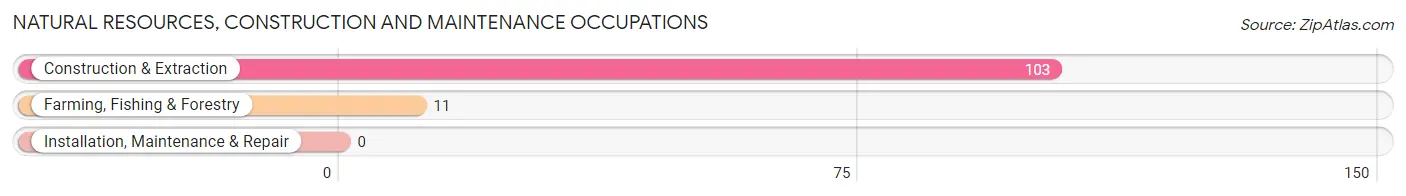
Natural Resources, Construction and Maintenance Occupations
The most common Natural Resources, Construction and Maintenance occupations in Labish Village are Construction & Extraction (103 | 37.6%), and Farming, Fishing & Forestry (11 | 4.0%).
Natural Resources, Construction and Maintenance Occupations by Sex
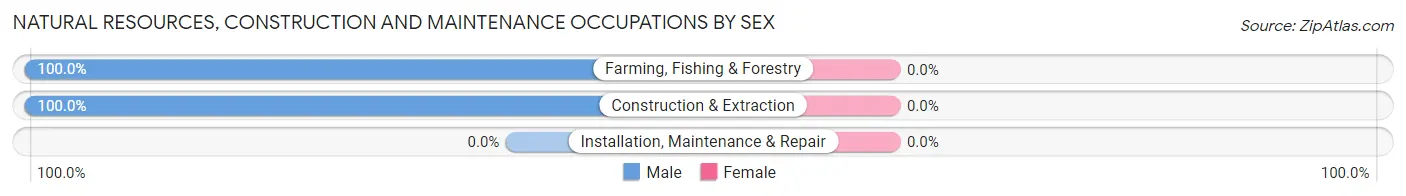
| Occupation | Male | Female |
| Farming, Fishing & Forestry | 11 (100.0%) | 0 (0.0%) |
| Construction & Extraction | 103 (100.0%) | 0 (0.0%) |
| Installation, Maintenance & Repair | 0 (0.0%) | 0 (0.0%) |
| Total (Category) | 114 (100.0%) | 0 (0.0%) |
| Total (Overall) | 186 (67.9%) | 88 (32.1%) |
Production, Transportation and Moving Occupations
The most common Production, Transportation and Moving occupations in Labish Village are , and Production (33 | 12.0%).
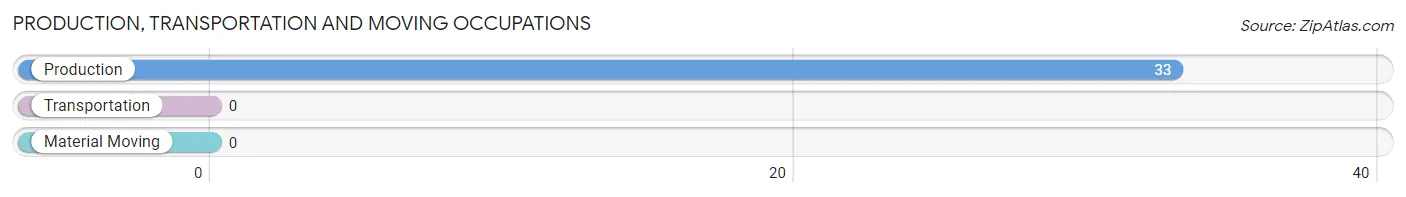
Production, Transportation and Moving Occupations by Sex
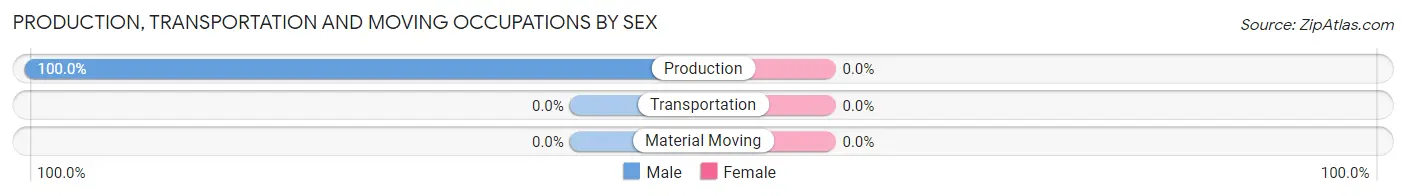
| Occupation | Male | Female |
| Production | 33 (100.0%) | 0 (0.0%) |
| Transportation | 0 (0.0%) | 0 (0.0%) |
| Material Moving | 0 (0.0%) | 0 (0.0%) |
| Total (Category) | 33 (100.0%) | 0 (0.0%) |
| Total (Overall) | 186 (67.9%) | 88 (32.1%) |
Employment Industries by Sex in Labish Village
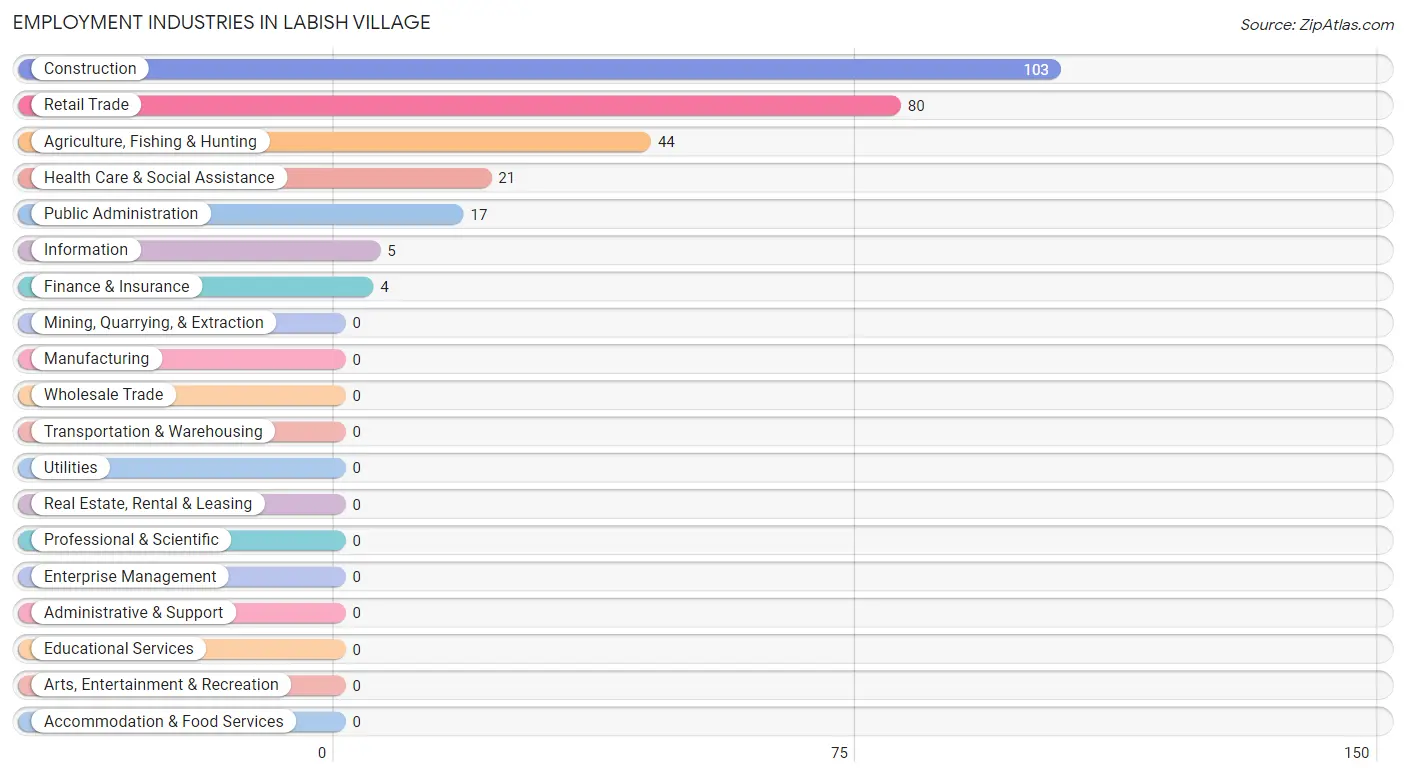
Employment Industries in Labish Village
The major employment industries in Labish Village include Construction (103 | 37.6%), Retail Trade (80 | 29.2%), Agriculture, Fishing & Hunting (44 | 16.1%), Health Care & Social Assistance (21 | 7.7%), and Public Administration (17 | 6.2%).
Employment Industries by Sex in Labish Village
The Labish Village industries that see more men than women are Agriculture, Fishing & Hunting (100.0%), Construction (100.0%), and Public Administration (100.0%), whereas the industries that tend to have a higher number of women are Information (100.0%), Finance & Insurance (100.0%), and Health Care & Social Assistance (85.7%).
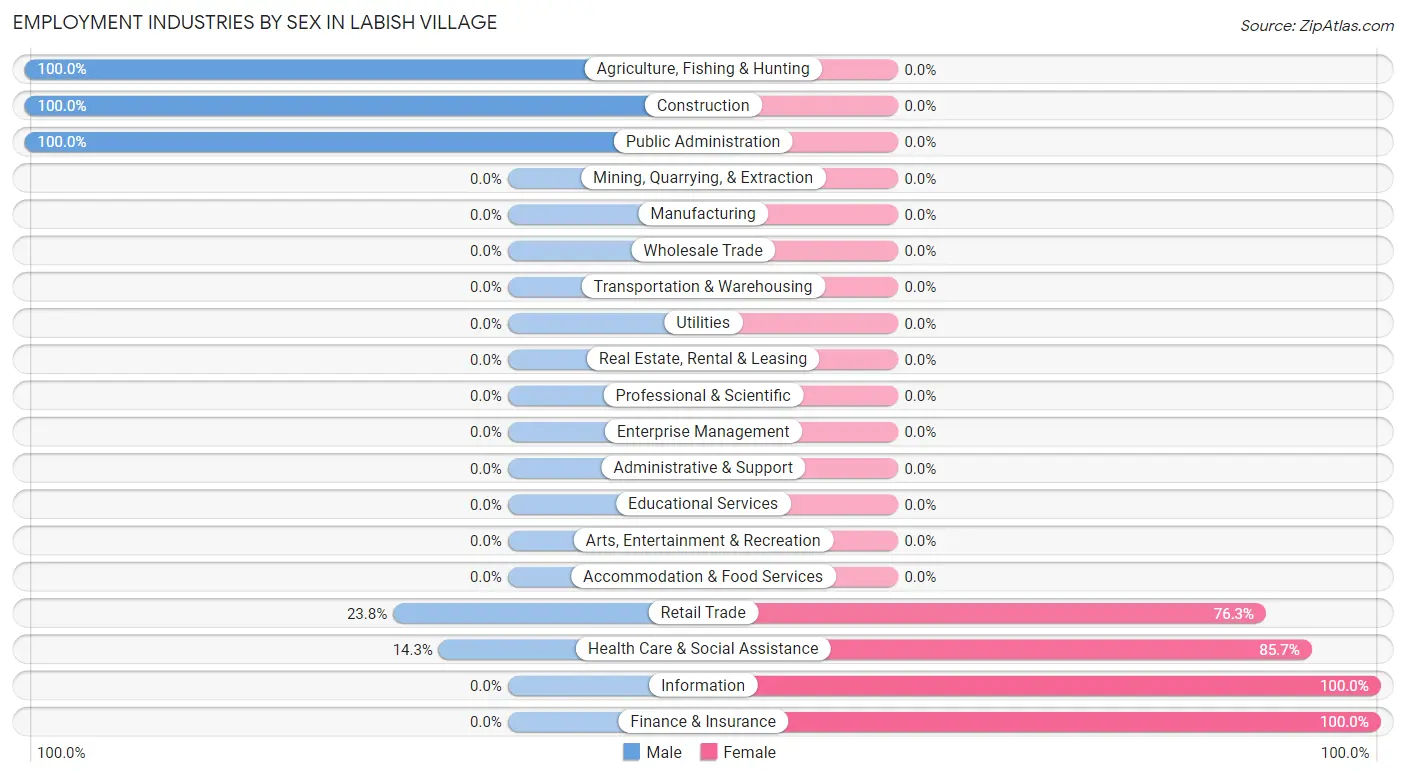
| Industry | Male | Female |
| Agriculture, Fishing & Hunting | 44 (100.0%) | 0 (0.0%) |
| Mining, Quarrying, & Extraction | 0 (0.0%) | 0 (0.0%) |
| Construction | 103 (100.0%) | 0 (0.0%) |
| Manufacturing | 0 (0.0%) | 0 (0.0%) |
| Wholesale Trade | 0 (0.0%) | 0 (0.0%) |
| Retail Trade | 19 (23.7%) | 61 (76.2%) |
| Transportation & Warehousing | 0 (0.0%) | 0 (0.0%) |
| Utilities | 0 (0.0%) | 0 (0.0%) |
| Information | 0 (0.0%) | 5 (100.0%) |
| Finance & Insurance | 0 (0.0%) | 4 (100.0%) |
| Real Estate, Rental & Leasing | 0 (0.0%) | 0 (0.0%) |
| Professional & Scientific | 0 (0.0%) | 0 (0.0%) |
| Enterprise Management | 0 (0.0%) | 0 (0.0%) |
| Administrative & Support | 0 (0.0%) | 0 (0.0%) |
| Educational Services | 0 (0.0%) | 0 (0.0%) |
| Health Care & Social Assistance | 3 (14.3%) | 18 (85.7%) |
| Arts, Entertainment & Recreation | 0 (0.0%) | 0 (0.0%) |
| Accommodation & Food Services | 0 (0.0%) | 0 (0.0%) |
| Public Administration | 17 (100.0%) | 0 (0.0%) |
| Total | 186 (67.9%) | 88 (32.1%) |
Education in Labish Village
School Enrollment in Labish Village
The most common levels of schooling among the 201 students in Labish Village are college / undergraduate (100 | 49.7%), elementary school (65 | 32.3%), and kindergarten (17 | 8.5%).
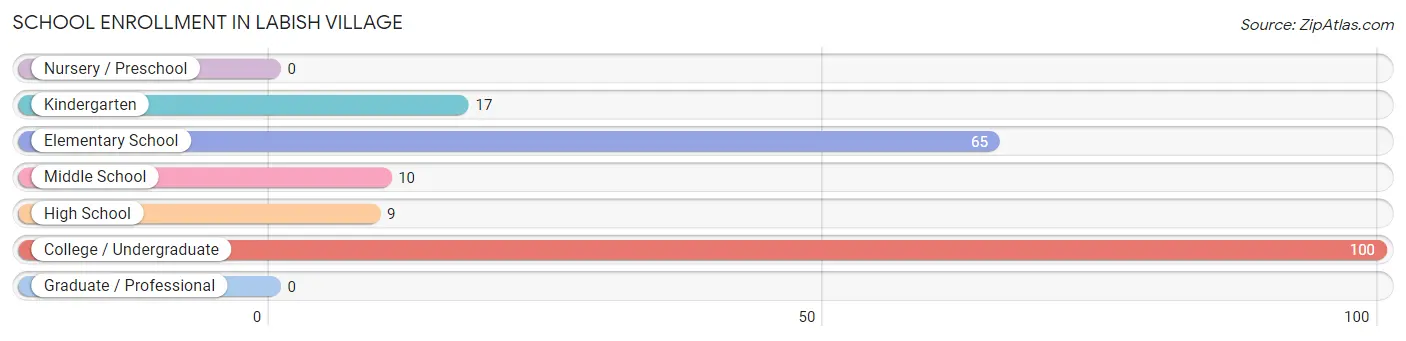
| School Level | # Students | % Students |
| Nursery / Preschool | 0 | 0.0% |
| Kindergarten | 17 | 8.5% |
| Elementary School | 65 | 32.3% |
| Middle School | 10 | 5.0% |
| High School | 9 | 4.5% |
| College / Undergraduate | 100 | 49.7% |
| Graduate / Professional | 0 | 0.0% |
| Total | 201 | 100.0% |
School Enrollment by Age by Funding Source in Labish Village
Out of a total of 201 students who are enrolled in schools in Labish Village, 44 (21.9%) attend a private institution, while the remaining 157 (78.1%) are enrolled in public schools. The age group of 18 to 19 year olds has the highest likelihood of being enrolled in private schools, with 44 (100.0% in the age bracket) enrolled. Conversely, the age group of 3 to 4 year olds has the lowest likelihood of being enrolled in a private school, with 17 (100.0% in the age bracket) attending a public institution.
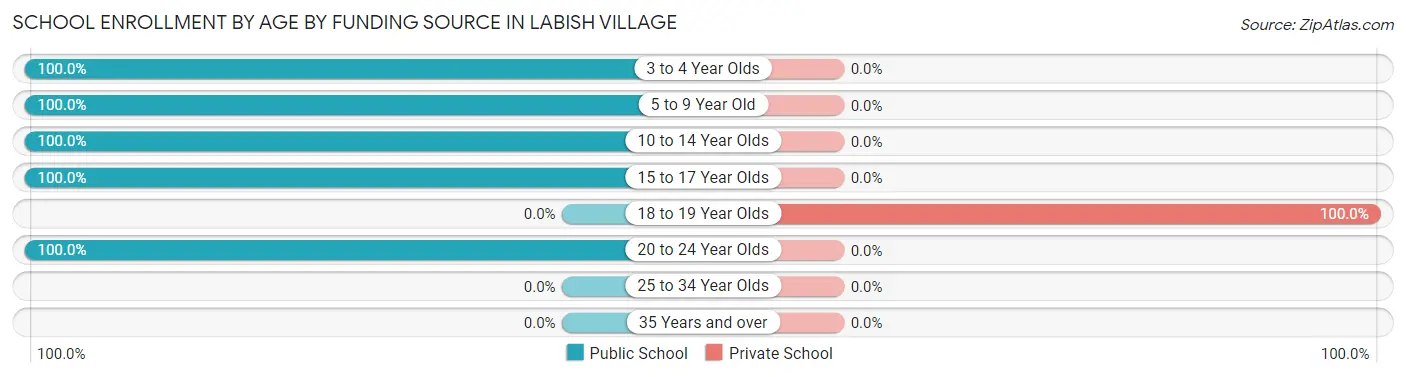
| Age Bracket | Public School | Private School |
| 3 to 4 Year Olds | 17 (100.0%) | 0 (0.0%) |
| 5 to 9 Year Old | 65 (100.0%) | 0 (0.0%) |
| 10 to 14 Year Olds | 10 (100.0%) | 0 (0.0%) |
| 15 to 17 Year Olds | 9 (100.0%) | 0 (0.0%) |
| 18 to 19 Year Olds | 0 (0.0%) | 44 (100.0%) |
| 20 to 24 Year Olds | 56 (100.0%) | 0 (0.0%) |
| 25 to 34 Year Olds | 0 (0.0%) | 0 (0.0%) |
| 35 Years and over | 0 (0.0%) | 0 (0.0%) |
| Total | 157 (78.1%) | 44 (21.9%) |
Educational Attainment by Field of Study in Labish Village
Science & technology (19 | 76.0%), and visual & performing arts (6 | 24.0%) are the most common fields of study among 25 individuals in Labish Village who have obtained a bachelor's degree or higher.
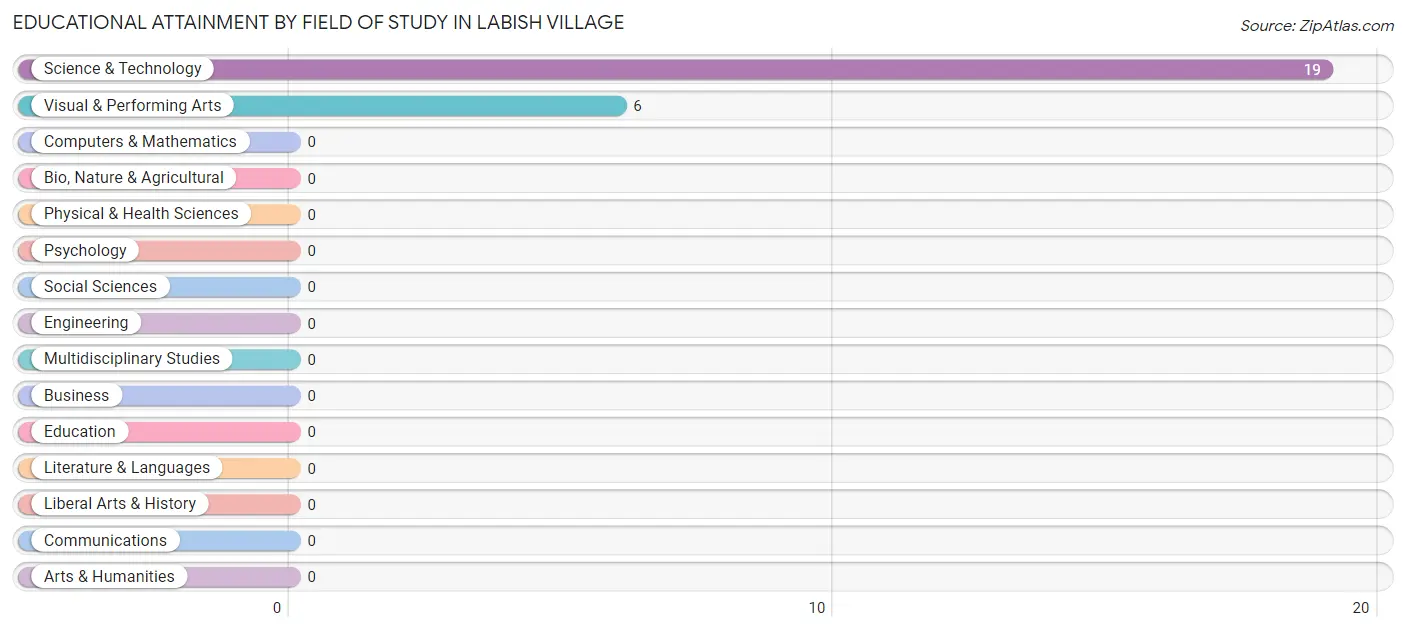
| Field of Study | # Graduates | % Graduates |
| Computers & Mathematics | 0 | 0.0% |
| Bio, Nature & Agricultural | 0 | 0.0% |
| Physical & Health Sciences | 0 | 0.0% |
| Psychology | 0 | 0.0% |
| Social Sciences | 0 | 0.0% |
| Engineering | 0 | 0.0% |
| Multidisciplinary Studies | 0 | 0.0% |
| Science & Technology | 19 | 76.0% |
| Business | 0 | 0.0% |
| Education | 0 | 0.0% |
| Literature & Languages | 0 | 0.0% |
| Liberal Arts & History | 0 | 0.0% |
| Visual & Performing Arts | 6 | 24.0% |
| Communications | 0 | 0.0% |
| Arts & Humanities | 0 | 0.0% |
| Total | 25 | 100.0% |
Transportation & Commute in Labish Village
Vehicle Availability by Sex in Labish Village
The most prevalent vehicle ownership categories in Labish Village are males with 4 vehicles (85, accounting for 45.7%) and females with 4 vehicles (48, making up 96.6%).
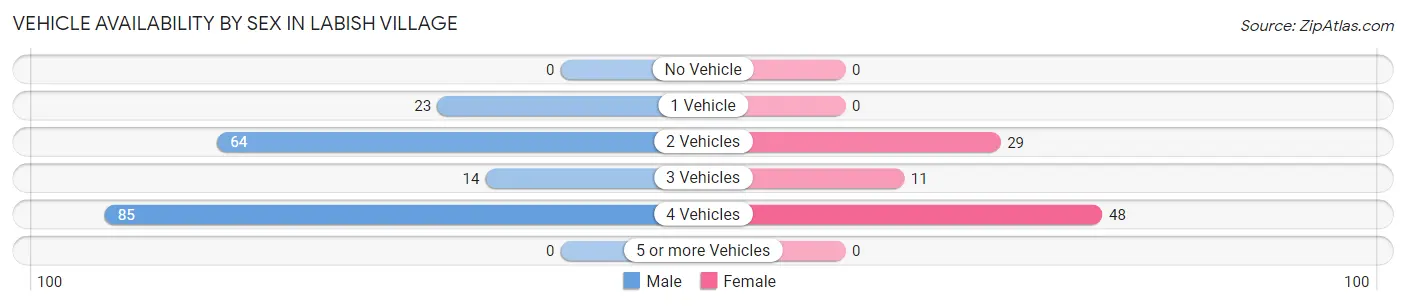
| Vehicles Available | Male | Female |
| No Vehicle | 0 (0.0%) | 0 (0.0%) |
| 1 Vehicle | 23 (12.4%) | 0 (0.0%) |
| 2 Vehicles | 64 (34.4%) | 29 (33.0%) |
| 3 Vehicles | 14 (7.5%) | 11 (12.5%) |
| 4 Vehicles | 85 (45.7%) | 48 (54.5%) |
| 5 or more Vehicles | 0 (0.0%) | 0 (0.0%) |
| Total | 186 (100.0%) | 88 (100.0%) |
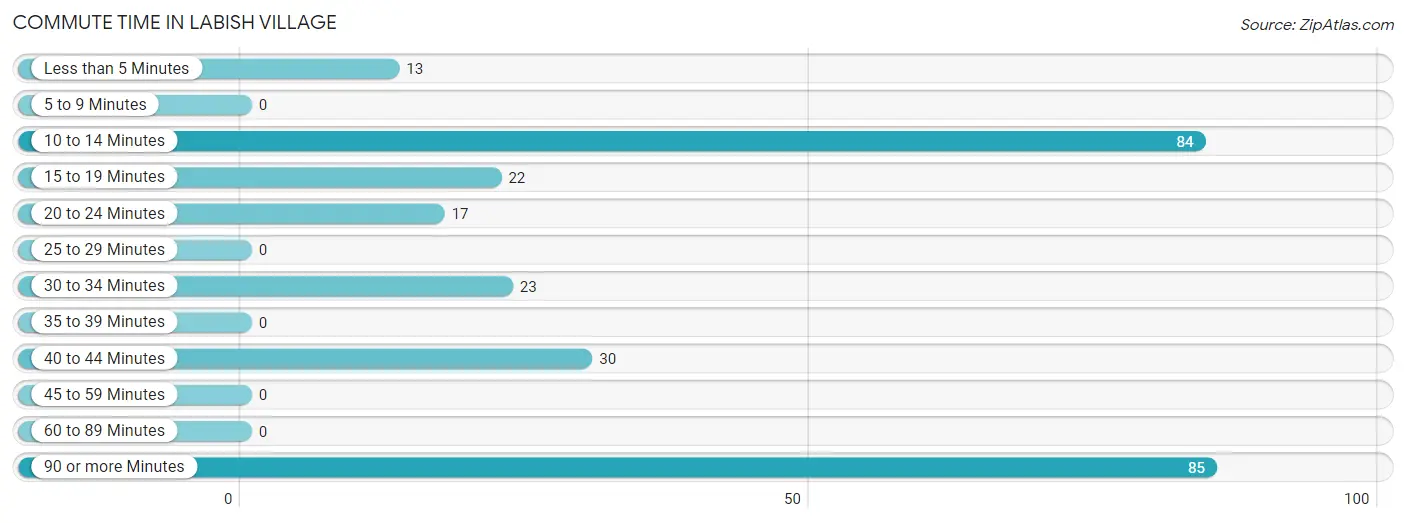
Commute Time in Labish Village
The most frequently occuring commute durations in Labish Village are 90 or more minutes (85 commuters, 31.0%), 10 to 14 minutes (84 commuters, 30.7%), and 40 to 44 minutes (30 commuters, 11.0%).
| Commute Time | # Commuters | % Commuters |
| Less than 5 Minutes | 13 | 4.7% |
| 5 to 9 Minutes | 0 | 0.0% |
| 10 to 14 Minutes | 84 | 30.7% |
| 15 to 19 Minutes | 22 | 8.0% |
| 20 to 24 Minutes | 17 | 6.2% |
| 25 to 29 Minutes | 0 | 0.0% |
| 30 to 34 Minutes | 23 | 8.4% |
| 35 to 39 Minutes | 0 | 0.0% |
| 40 to 44 Minutes | 30 | 11.0% |
| 45 to 59 Minutes | 0 | 0.0% |
| 60 to 89 Minutes | 0 | 0.0% |
| 90 or more Minutes | 85 | 31.0% |
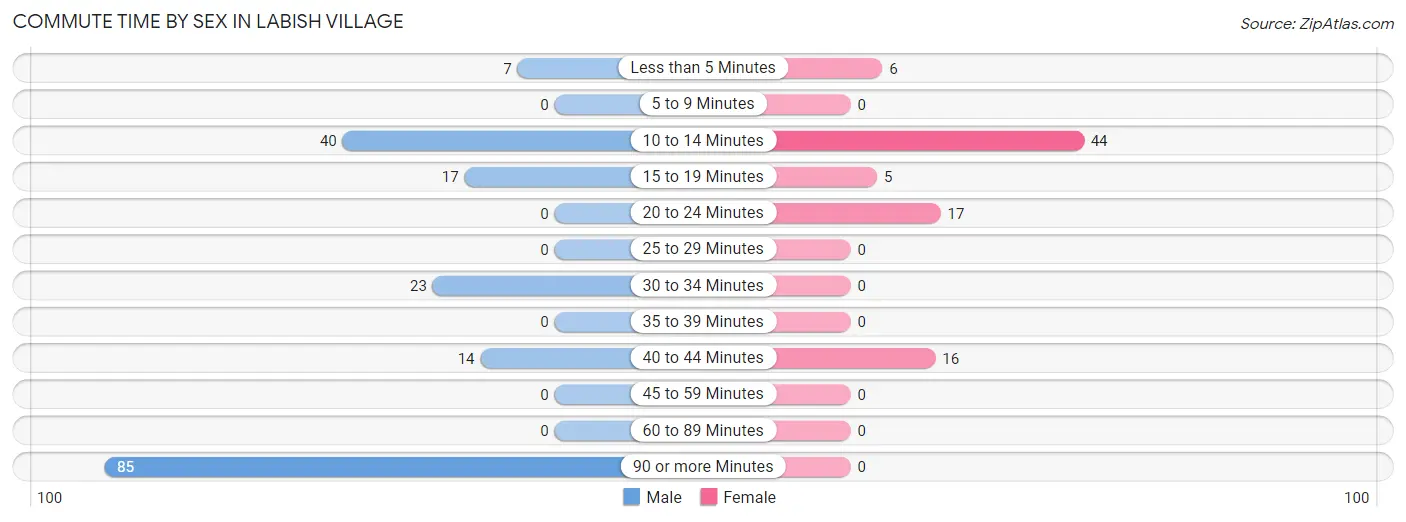
Commute Time by Sex in Labish Village
The most common commute times in Labish Village are 90 or more minutes (85 commuters, 45.7%) for males and 10 to 14 minutes (44 commuters, 50.0%) for females.
| Commute Time | Male | Female |
| Less than 5 Minutes | 7 (3.8%) | 6 (6.8%) |
| 5 to 9 Minutes | 0 (0.0%) | 0 (0.0%) |
| 10 to 14 Minutes | 40 (21.5%) | 44 (50.0%) |
| 15 to 19 Minutes | 17 (9.1%) | 5 (5.7%) |
| 20 to 24 Minutes | 0 (0.0%) | 17 (19.3%) |
| 25 to 29 Minutes | 0 (0.0%) | 0 (0.0%) |
| 30 to 34 Minutes | 23 (12.4%) | 0 (0.0%) |
| 35 to 39 Minutes | 0 (0.0%) | 0 (0.0%) |
| 40 to 44 Minutes | 14 (7.5%) | 16 (18.2%) |
| 45 to 59 Minutes | 0 (0.0%) | 0 (0.0%) |
| 60 to 89 Minutes | 0 (0.0%) | 0 (0.0%) |
| 90 or more Minutes | 85 (45.7%) | 0 (0.0%) |
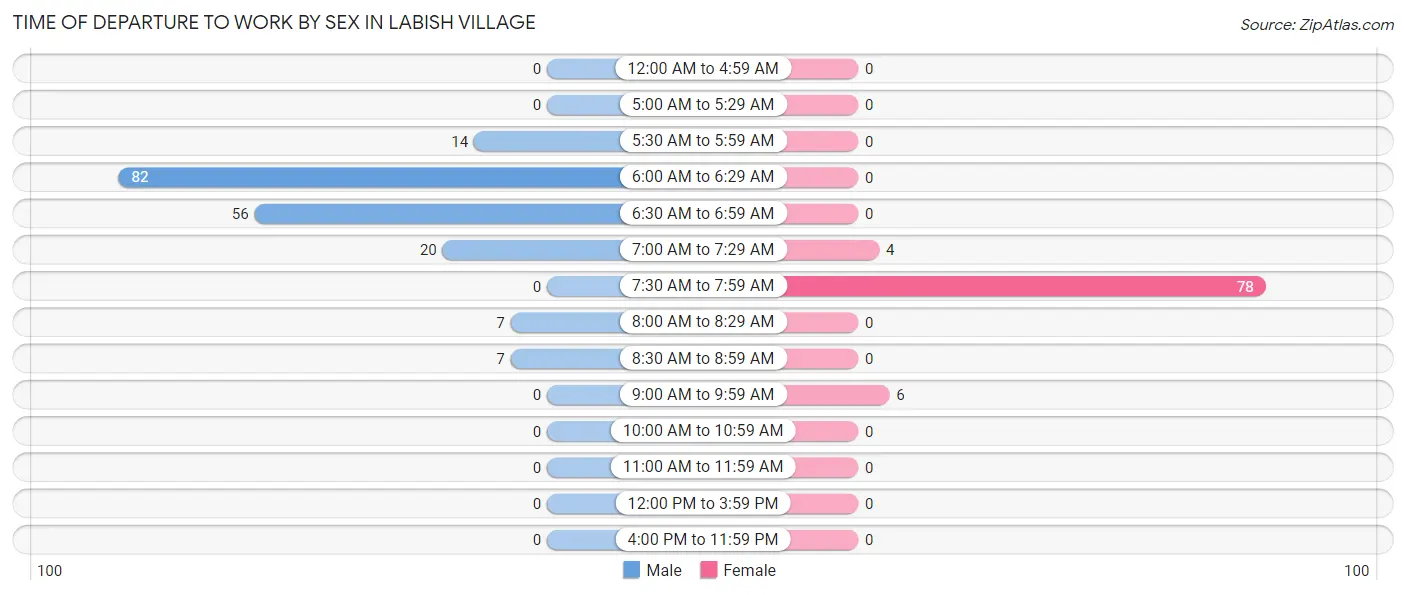
Time of Departure to Work by Sex in Labish Village
The most frequent times of departure to work in Labish Village are 6:00 AM to 6:29 AM (82, 44.1%) for males and 7:30 AM to 7:59 AM (78, 88.6%) for females.
| Time of Departure | Male | Female |
| 12:00 AM to 4:59 AM | 0 (0.0%) | 0 (0.0%) |
| 5:00 AM to 5:29 AM | 0 (0.0%) | 0 (0.0%) |
| 5:30 AM to 5:59 AM | 14 (7.5%) | 0 (0.0%) |
| 6:00 AM to 6:29 AM | 82 (44.1%) | 0 (0.0%) |
| 6:30 AM to 6:59 AM | 56 (30.1%) | 0 (0.0%) |
| 7:00 AM to 7:29 AM | 20 (10.7%) | 4 (4.5%) |
| 7:30 AM to 7:59 AM | 0 (0.0%) | 78 (88.6%) |
| 8:00 AM to 8:29 AM | 7 (3.8%) | 0 (0.0%) |
| 8:30 AM to 8:59 AM | 7 (3.8%) | 0 (0.0%) |
| 9:00 AM to 9:59 AM | 0 (0.0%) | 6 (6.8%) |
| 10:00 AM to 10:59 AM | 0 (0.0%) | 0 (0.0%) |
| 11:00 AM to 11:59 AM | 0 (0.0%) | 0 (0.0%) |
| 12:00 PM to 3:59 PM | 0 (0.0%) | 0 (0.0%) |
| 4:00 PM to 11:59 PM | 0 (0.0%) | 0 (0.0%) |
| Total | 186 (100.0%) | 88 (100.0%) |
Housing Occupancy in Labish Village
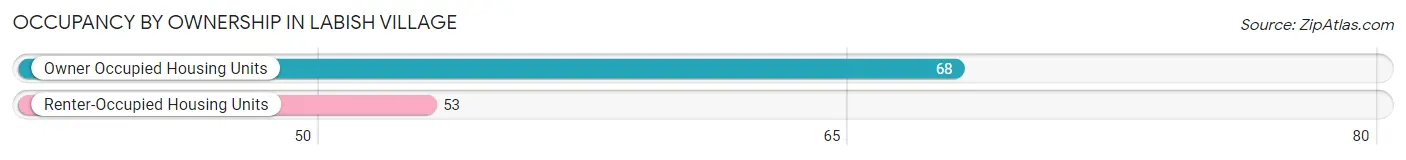
Occupancy by Ownership in Labish Village
Of the total 121 dwellings in Labish Village, owner-occupied units account for 68 (56.2%), while renter-occupied units make up 53 (43.8%).
| Occupancy | # Housing Units | % Housing Units |
| Owner Occupied Housing Units | 68 | 56.2% |
| Renter-Occupied Housing Units | 53 | 43.8% |
| Total Occupied Housing Units | 121 | 100.0% |
Occupancy by Household Size in Labish Village
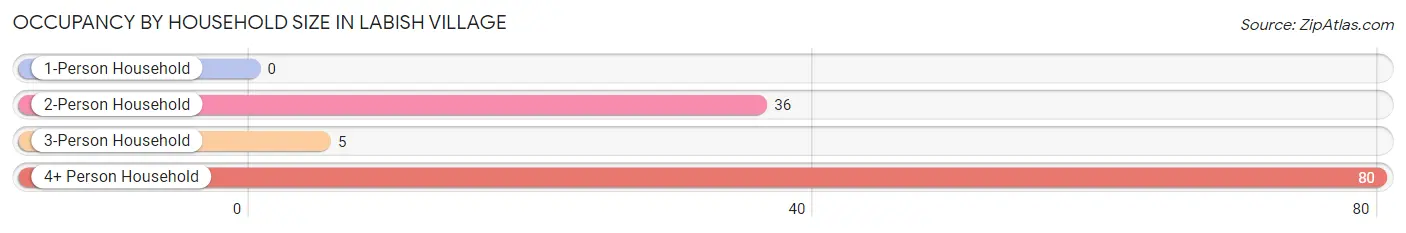
| Household Size | # Housing Units | % Housing Units |
| 1-Person Household | 0 | 0.0% |
| 2-Person Household | 36 | 29.7% |
| 3-Person Household | 5 | 4.1% |
| 4+ Person Household | 80 | 66.1% |
| Total Housing Units | 121 | 100.0% |
Occupancy by Ownership by Household Size in Labish Village
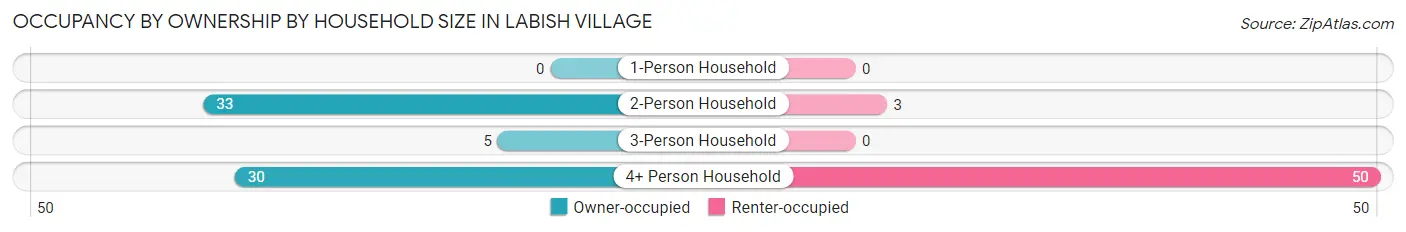
| Household Size | Owner-occupied | Renter-occupied |
| 1-Person Household | 0 (0.0%) | 0 (0.0%) |
| 2-Person Household | 33 (91.7%) | 3 (8.3%) |
| 3-Person Household | 5 (100.0%) | 0 (0.0%) |
| 4+ Person Household | 30 (37.5%) | 50 (62.5%) |
| Total Housing Units | 68 (56.2%) | 53 (43.8%) |
Occupancy by Educational Attainment in Labish Village
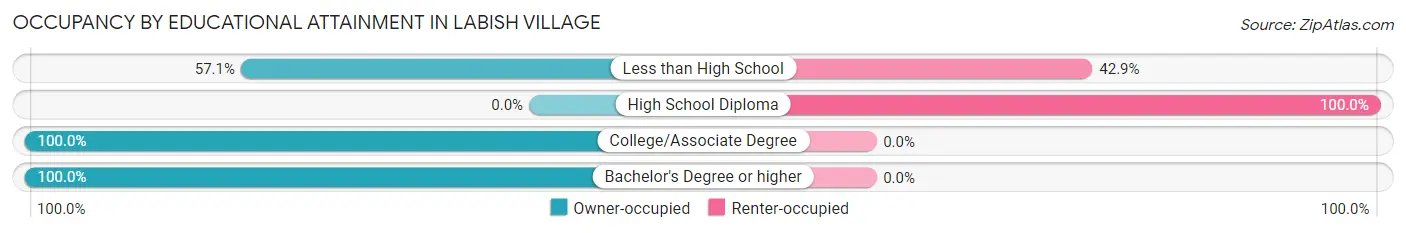
| Household Size | Owner-occupied | Renter-occupied |
| Less than High School | 44 (57.1%) | 33 (42.9%) |
| High School Diploma | 0 (0.0%) | 20 (100.0%) |
| College/Associate Degree | 5 (100.0%) | 0 (0.0%) |
| Bachelor's Degree or higher | 19 (100.0%) | 0 (0.0%) |
Occupancy by Age of Householder in Labish Village
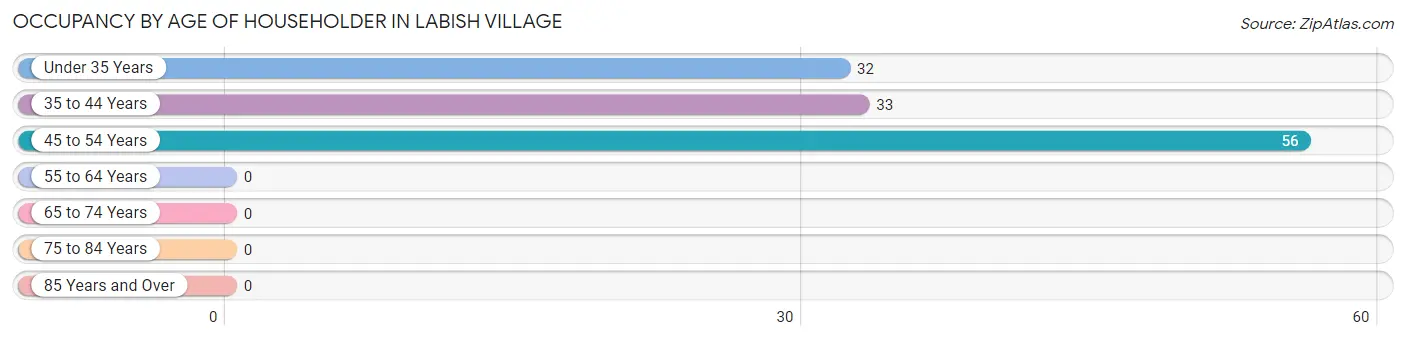
| Age Bracket | # Households | % Households |
| Under 35 Years | 32 | 26.5% |
| 35 to 44 Years | 33 | 27.3% |
| 45 to 54 Years | 56 | 46.3% |
| 55 to 64 Years | 0 | 0.0% |
| 65 to 74 Years | 0 | 0.0% |
| 75 to 84 Years | 0 | 0.0% |
| 85 Years and Over | 0 | 0.0% |
| Total | 121 | 100.0% |
Housing Finances in Labish Village
Median Income by Occupancy in Labish Village
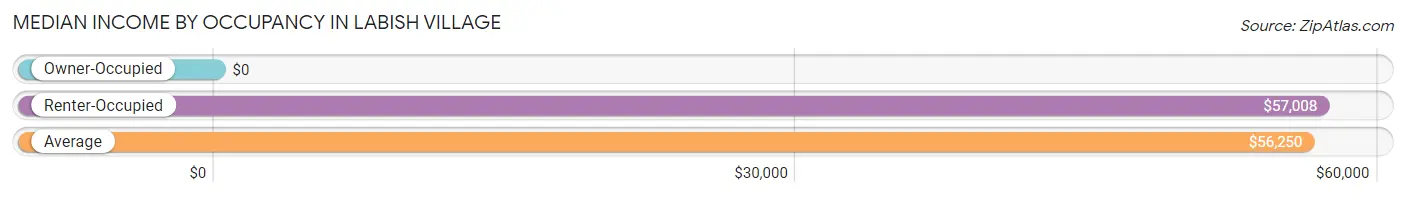
| Occupancy Type | # Households | Median Income |
| Owner-Occupied | 68 (56.2%) | $0 |
| Renter-Occupied | 53 (43.8%) | $57,008 |
| Average | 121 (100.0%) | $56,250 |
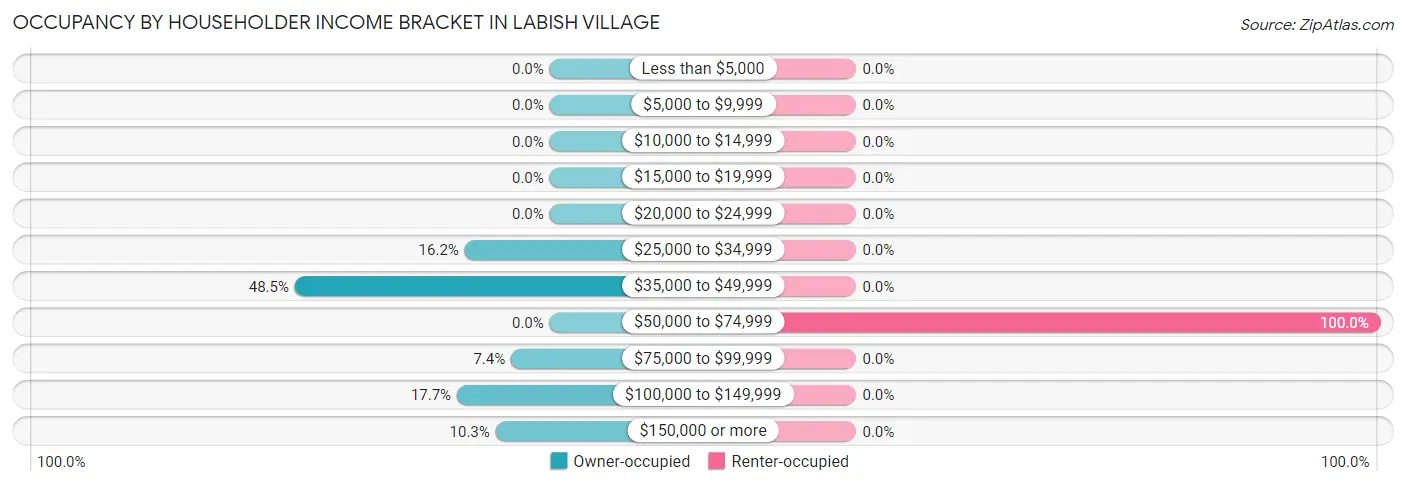
Occupancy by Householder Income Bracket in Labish Village
| Income Bracket | Owner-occupied | Renter-occupied |
| Less than $5,000 | 0 (0.0%) | 0 (0.0%) |
| $5,000 to $9,999 | 0 (0.0%) | 0 (0.0%) |
| $10,000 to $14,999 | 0 (0.0%) | 0 (0.0%) |
| $15,000 to $19,999 | 0 (0.0%) | 0 (0.0%) |
| $20,000 to $24,999 | 0 (0.0%) | 0 (0.0%) |
| $25,000 to $34,999 | 11 (16.2%) | 0 (0.0%) |
| $35,000 to $49,999 | 33 (48.5%) | 0 (0.0%) |
| $50,000 to $74,999 | 0 (0.0%) | 53 (100.0%) |
| $75,000 to $99,999 | 5 (7.3%) | 0 (0.0%) |
| $100,000 to $149,999 | 12 (17.6%) | 0 (0.0%) |
| $150,000 or more | 7 (10.3%) | 0 (0.0%) |
| Total | 68 (100.0%) | 53 (100.0%) |
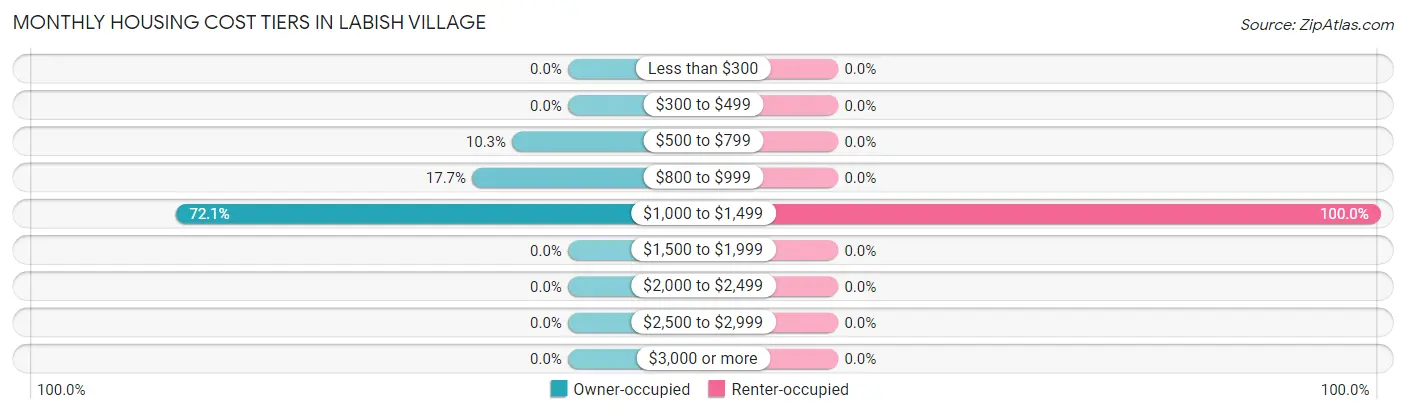
Monthly Housing Cost Tiers in Labish Village
| Monthly Cost | Owner-occupied | Renter-occupied |
| Less than $300 | 0 (0.0%) | 0 (0.0%) |
| $300 to $499 | 0 (0.0%) | 0 (0.0%) |
| $500 to $799 | 7 (10.3%) | 0 (0.0%) |
| $800 to $999 | 12 (17.6%) | 0 (0.0%) |
| $1,000 to $1,499 | 49 (72.1%) | 53 (100.0%) |
| $1,500 to $1,999 | 0 (0.0%) | 0 (0.0%) |
| $2,000 to $2,499 | 0 (0.0%) | 0 (0.0%) |
| $2,500 to $2,999 | 0 (0.0%) | 0 (0.0%) |
| $3,000 or more | 0 (0.0%) | 0 (0.0%) |
| Total | 68 (100.0%) | 53 (100.0%) |
Physical Housing Characteristics in Labish Village
Housing Structures in Labish Village
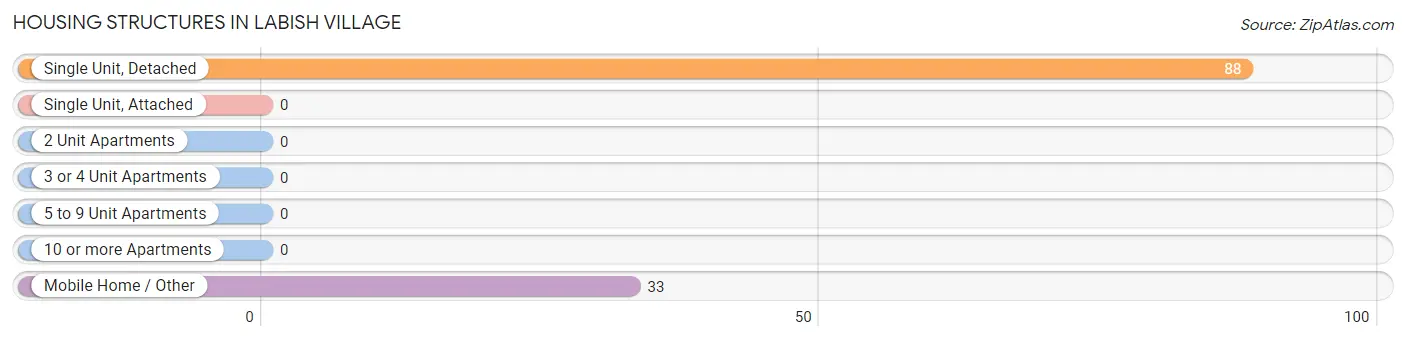
| Structure Type | # Housing Units | % Housing Units |
| Single Unit, Detached | 88 | 72.7% |
| Single Unit, Attached | 0 | 0.0% |
| 2 Unit Apartments | 0 | 0.0% |
| 3 or 4 Unit Apartments | 0 | 0.0% |
| 5 to 9 Unit Apartments | 0 | 0.0% |
| 10 or more Apartments | 0 | 0.0% |
| Mobile Home / Other | 33 | 27.3% |
| Total | 121 | 100.0% |
Housing Structures by Occupancy in Labish Village
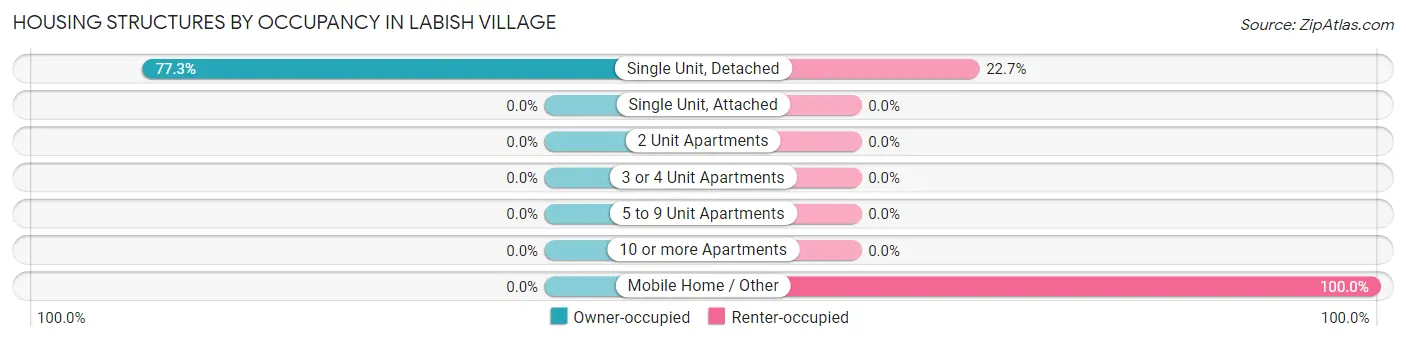
| Structure Type | Owner-occupied | Renter-occupied |
| Single Unit, Detached | 68 (77.3%) | 20 (22.7%) |
| Single Unit, Attached | 0 (0.0%) | 0 (0.0%) |
| 2 Unit Apartments | 0 (0.0%) | 0 (0.0%) |
| 3 or 4 Unit Apartments | 0 (0.0%) | 0 (0.0%) |
| 5 to 9 Unit Apartments | 0 (0.0%) | 0 (0.0%) |
| 10 or more Apartments | 0 (0.0%) | 0 (0.0%) |
| Mobile Home / Other | 0 (0.0%) | 33 (100.0%) |
| Total | 68 (56.2%) | 53 (43.8%) |
Housing Structures by Number of Rooms in Labish Village
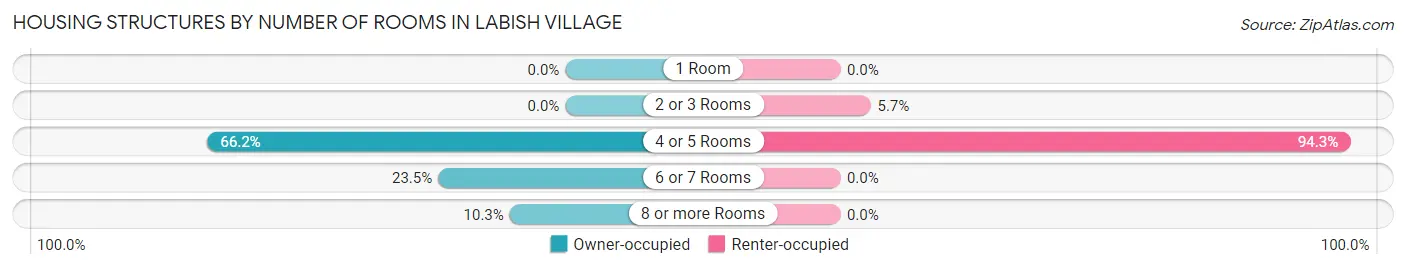
| Number of Rooms | Owner-occupied | Renter-occupied |
| 1 Room | 0 (0.0%) | 0 (0.0%) |
| 2 or 3 Rooms | 0 (0.0%) | 3 (5.7%) |
| 4 or 5 Rooms | 45 (66.2%) | 50 (94.3%) |
| 6 or 7 Rooms | 16 (23.5%) | 0 (0.0%) |
| 8 or more Rooms | 7 (10.3%) | 0 (0.0%) |
| Total | 68 (100.0%) | 53 (100.0%) |
Housing Structure by Heating Type in Labish Village
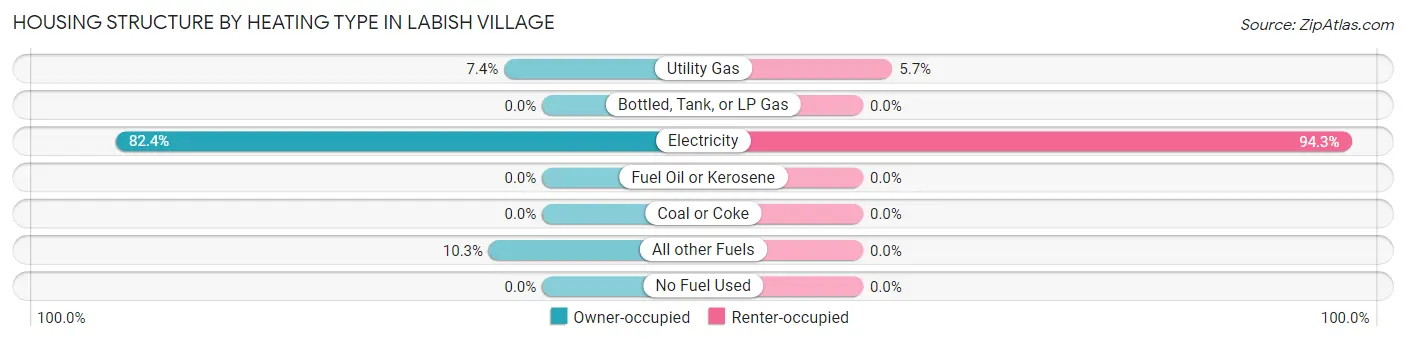
| Heating Type | Owner-occupied | Renter-occupied |
| Utility Gas | 5 (7.3%) | 3 (5.7%) |
| Bottled, Tank, or LP Gas | 0 (0.0%) | 0 (0.0%) |
| Electricity | 56 (82.4%) | 50 (94.3%) |
| Fuel Oil or Kerosene | 0 (0.0%) | 0 (0.0%) |
| Coal or Coke | 0 (0.0%) | 0 (0.0%) |
| All other Fuels | 7 (10.3%) | 0 (0.0%) |
| No Fuel Used | 0 (0.0%) | 0 (0.0%) |
| Total | 68 (100.0%) | 53 (100.0%) |
Household Vehicle Usage in Labish Village
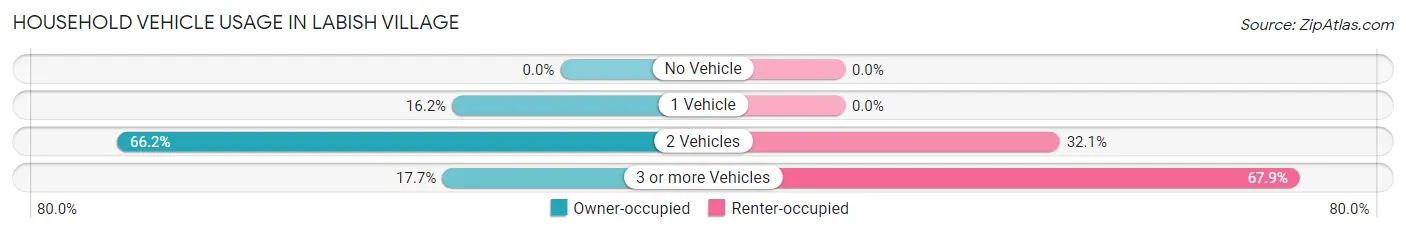
| Vehicles per Household | Owner-occupied | Renter-occupied |
| No Vehicle | 0 (0.0%) | 0 (0.0%) |
| 1 Vehicle | 11 (16.2%) | 0 (0.0%) |
| 2 Vehicles | 45 (66.2%) | 17 (32.1%) |
| 3 or more Vehicles | 12 (17.6%) | 36 (67.9%) |
| Total | 68 (100.0%) | 53 (100.0%) |
Real Estate & Mortgages in Labish Village
Real Estate and Mortgage Overview in Labish Village
| Characteristic | Without Mortgage | With Mortgage |
| Housing Units | 7 | 61 |
| Median Property Value | - | - |
| Median Household Income | - | - |
| Monthly Housing Costs | - | - |
| Real Estate Taxes | - | - |
Property Value by Mortgage Status in Labish Village
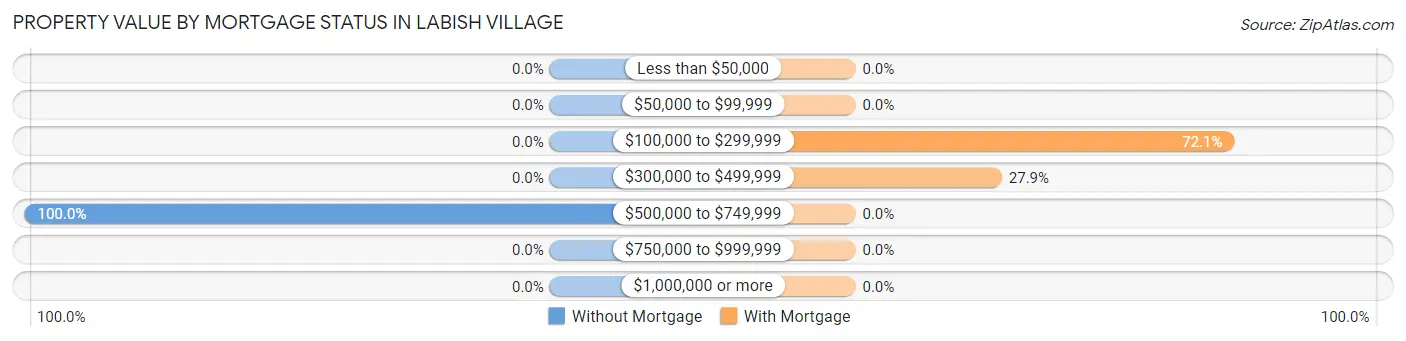
| Property Value | Without Mortgage | With Mortgage |
| Less than $50,000 | 0 (0.0%) | 0 (0.0%) |
| $50,000 to $99,999 | 0 (0.0%) | 0 (0.0%) |
| $100,000 to $299,999 | 0 (0.0%) | 44 (72.1%) |
| $300,000 to $499,999 | 0 (0.0%) | 17 (27.9%) |
| $500,000 to $749,999 | 7 (100.0%) | 0 (0.0%) |
| $750,000 to $999,999 | 0 (0.0%) | 0 (0.0%) |
| $1,000,000 or more | 0 (0.0%) | 0 (0.0%) |
| Total | 7 (100.0%) | 61 (100.0%) |
Household Income by Mortgage Status in Labish Village
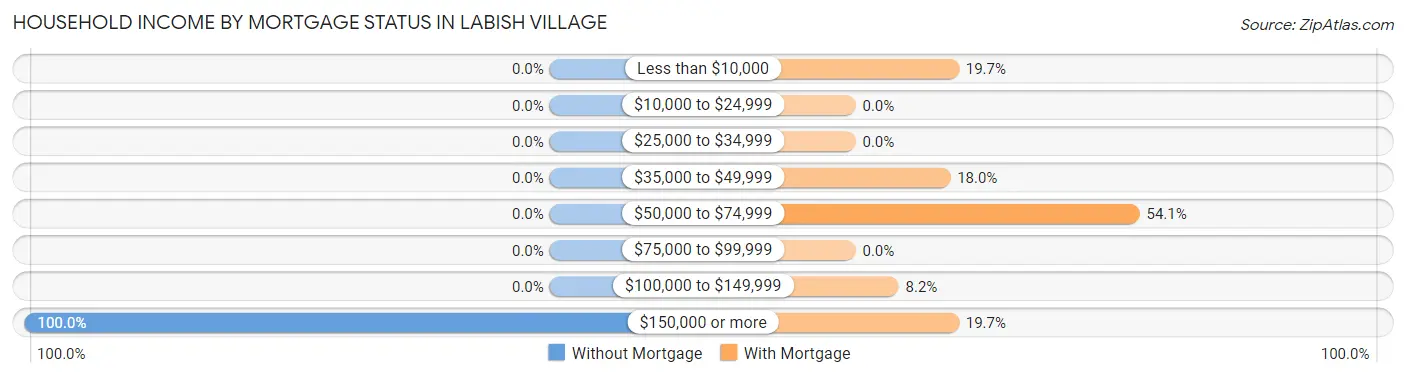
| Household Income | Without Mortgage | With Mortgage |
| Less than $10,000 | 0 (0.0%) | 12 (19.7%) |
| $10,000 to $24,999 | 0 (0.0%) | 0 (0.0%) |
| $25,000 to $34,999 | 0 (0.0%) | 0 (0.0%) |
| $35,000 to $49,999 | 0 (0.0%) | 11 (18.0%) |
| $50,000 to $74,999 | 0 (0.0%) | 33 (54.1%) |
| $75,000 to $99,999 | 0 (0.0%) | 0 (0.0%) |
| $100,000 to $149,999 | 0 (0.0%) | 5 (8.2%) |
| $150,000 or more | 7 (100.0%) | 12 (19.7%) |
| Total | 7 (100.0%) | 61 (100.0%) |
Property Value to Household Income Ratio in Labish Village
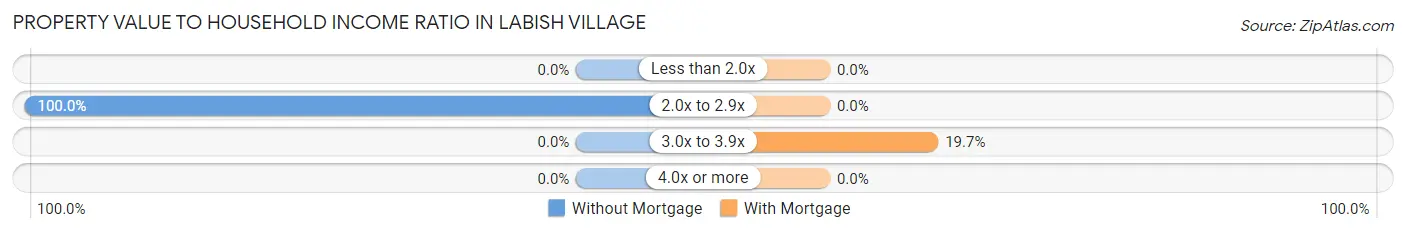
| Value-to-Income Ratio | Without Mortgage | With Mortgage |
| Less than 2.0x | 0 (0.0%) | 0 (0.0%) |
| 2.0x to 2.9x | 7 (100.0%) | 0 (0.0%) |
| 3.0x to 3.9x | 0 (0.0%) | 12 (19.7%) |
| 4.0x or more | 0 (0.0%) | 0 (0.0%) |
| Total | 7 (100.0%) | 61 (100.0%) |
Real Estate Taxes by Mortgage Status in Labish Village
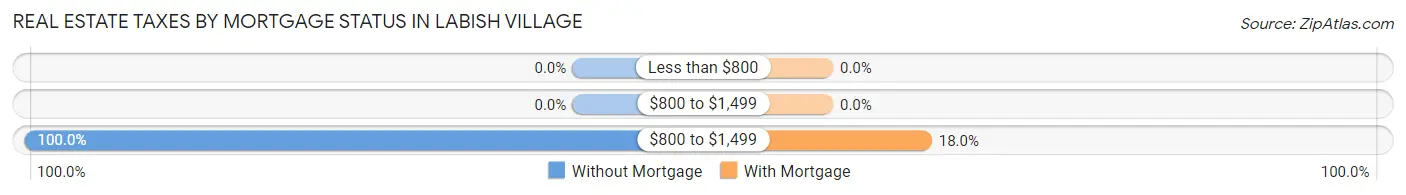
| Property Taxes | Without Mortgage | With Mortgage |
| Less than $800 | 0 (0.0%) | 0 (0.0%) |
| $800 to $1,499 | 0 (0.0%) | 0 (0.0%) |
| $800 to $1,499 | 7 (100.0%) | 11 (18.0%) |
| Total | 7 (100.0%) | 61 (100.0%) |
Health & Disability in Labish Village
Health Insurance Coverage by Age in Labish Village
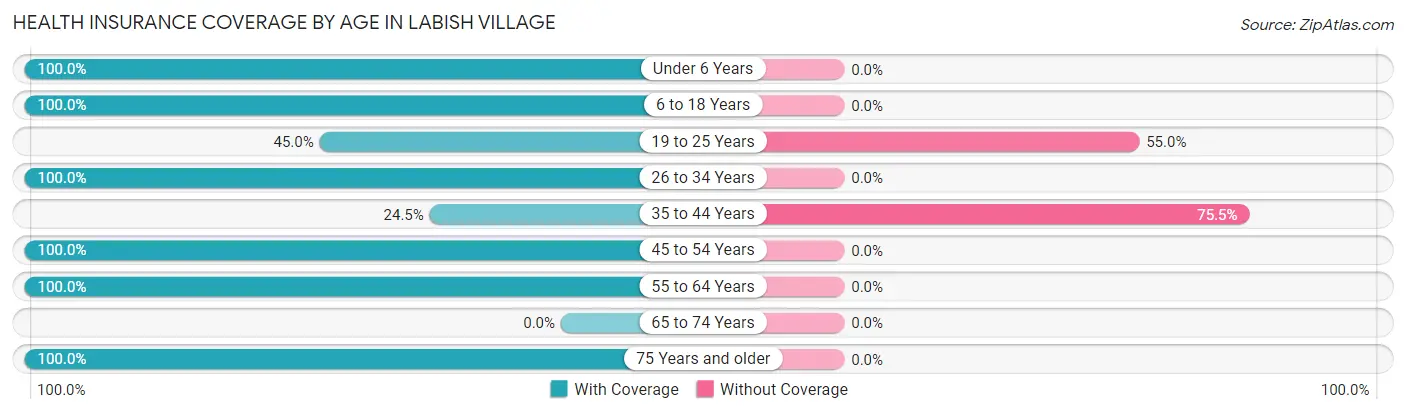
| Age Bracket | With Coverage | Without Coverage |
| Under 6 Years | 54 (100.0%) | 0 (0.0%) |
| 6 to 18 Years | 128 (100.0%) | 0 (0.0%) |
| 19 to 25 Years | 36 (45.0%) | 44 (55.0%) |
| 26 to 34 Years | 29 (100.0%) | 0 (0.0%) |
| 35 to 44 Years | 23 (24.5%) | 71 (75.5%) |
| 45 to 54 Years | 93 (100.0%) | 0 (0.0%) |
| 55 to 64 Years | 13 (100.0%) | 0 (0.0%) |
| 65 to 74 Years | 0 (0.0%) | 0 (0.0%) |
| 75 Years and older | 5 (100.0%) | 0 (0.0%) |
| Total | 381 (76.8%) | 115 (23.2%) |
Health Insurance Coverage by Citizenship Status in Labish Village
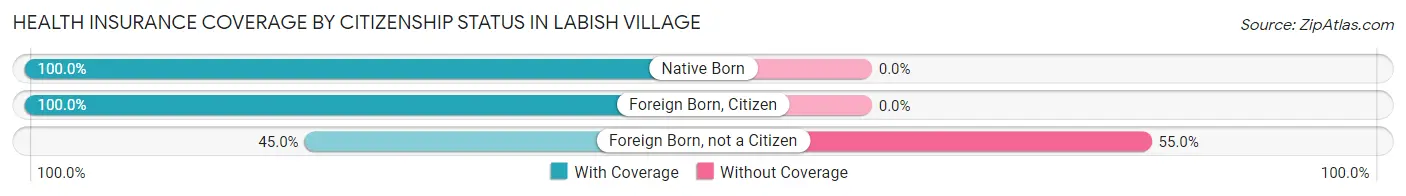
| Citizenship Status | With Coverage | Without Coverage |
| Native Born | 54 (100.0%) | 0 (0.0%) |
| Foreign Born, Citizen | 128 (100.0%) | 0 (0.0%) |
| Foreign Born, not a Citizen | 36 (45.0%) | 44 (55.0%) |
Health Insurance Coverage by Household Income in Labish Village
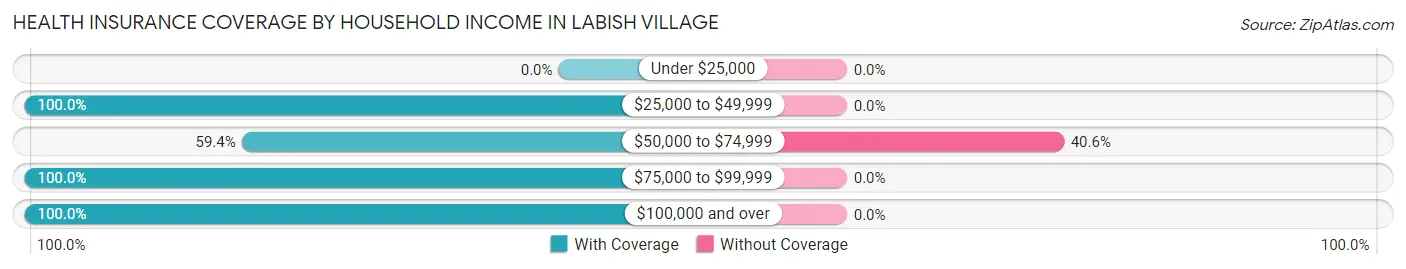
| Household Income | With Coverage | Without Coverage |
| Under $25,000 | 0 (0.0%) | 0 (0.0%) |
| $25,000 to $49,999 | 116 (100.0%) | 0 (0.0%) |
| $50,000 to $74,999 | 168 (59.4%) | 115 (40.6%) |
| $75,000 to $99,999 | 15 (100.0%) | 0 (0.0%) |
| $100,000 and over | 82 (100.0%) | 0 (0.0%) |
Public vs Private Health Insurance Coverage by Age in Labish Village
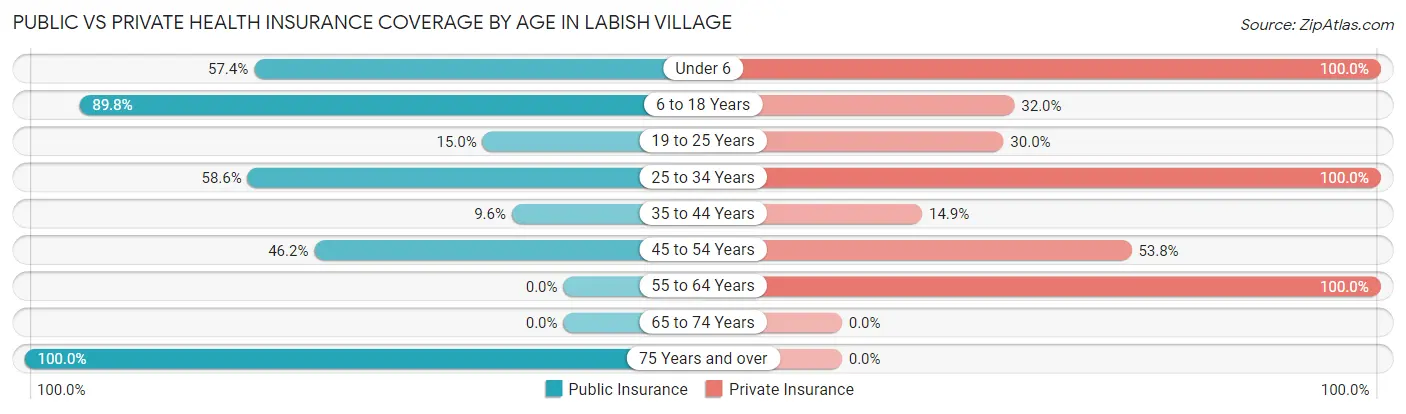
| Age Bracket | Public Insurance | Private Insurance |
| Under 6 | 31 (57.4%) | 54 (100.0%) |
| 6 to 18 Years | 115 (89.8%) | 41 (32.0%) |
| 19 to 25 Years | 12 (15.0%) | 24 (30.0%) |
| 25 to 34 Years | 17 (58.6%) | 29 (100.0%) |
| 35 to 44 Years | 9 (9.6%) | 14 (14.9%) |
| 45 to 54 Years | 43 (46.2%) | 50 (53.8%) |
| 55 to 64 Years | 0 (0.0%) | 13 (100.0%) |
| 65 to 74 Years | 0 (0.0%) | 0 (0.0%) |
| 75 Years and over | 5 (100.0%) | 0 (0.0%) |
| Total | 232 (46.8%) | 225 (45.4%) |
Disability Status by Sex by Age in Labish Village
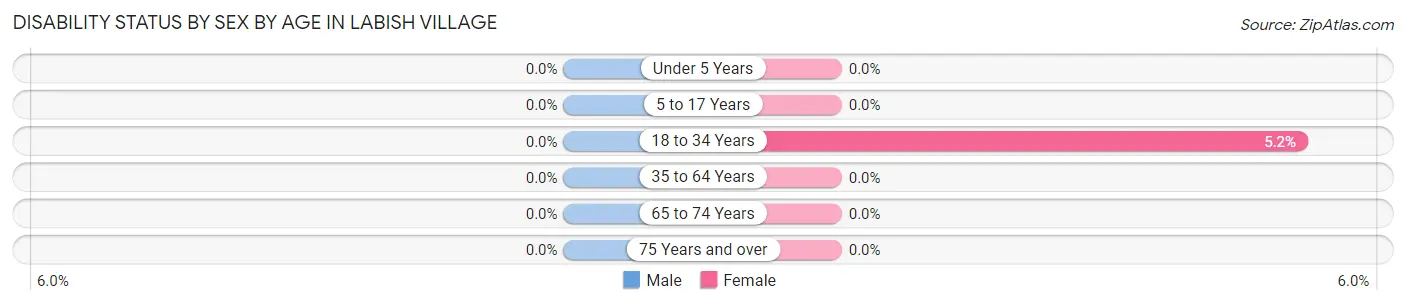
| Age Bracket | Male | Female |
| Under 5 Years | 0 (0.0%) | 0 (0.0%) |
| 5 to 17 Years | 0 (0.0%) | 0 (0.0%) |
| 18 to 34 Years | 0 (0.0%) | 4 (5.2%) |
| 35 to 64 Years | 0 (0.0%) | 0 (0.0%) |
| 65 to 74 Years | 0 (0.0%) | 0 (0.0%) |
| 75 Years and over | 0 (0.0%) | 0 (0.0%) |
Disability Class by Sex by Age in Labish Village
Disability Class: Hearing Difficulty
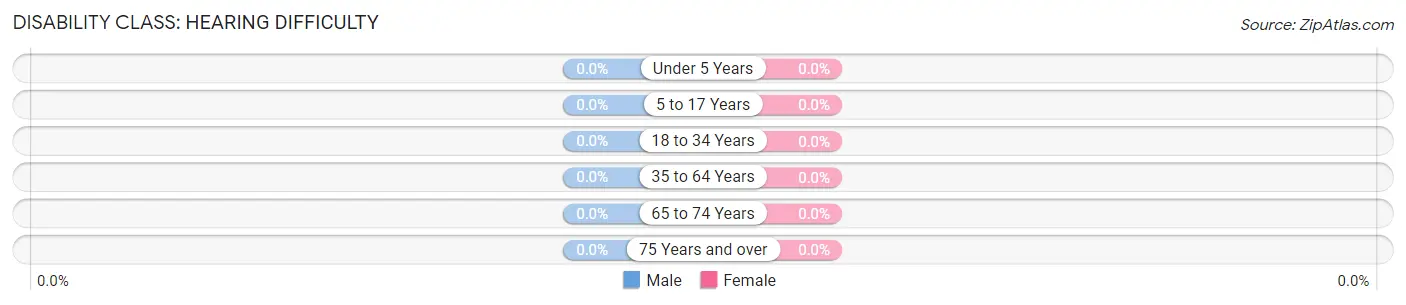
| Age Bracket | Male | Female |
| Under 5 Years | 0 (0.0%) | 0 (0.0%) |
| 5 to 17 Years | 0 (0.0%) | 0 (0.0%) |
| 18 to 34 Years | 0 (0.0%) | 0 (0.0%) |
| 35 to 64 Years | 0 (0.0%) | 0 (0.0%) |
| 65 to 74 Years | 0 (0.0%) | 0 (0.0%) |
| 75 Years and over | 0 (0.0%) | 0 (0.0%) |
Disability Class: Vision Difficulty
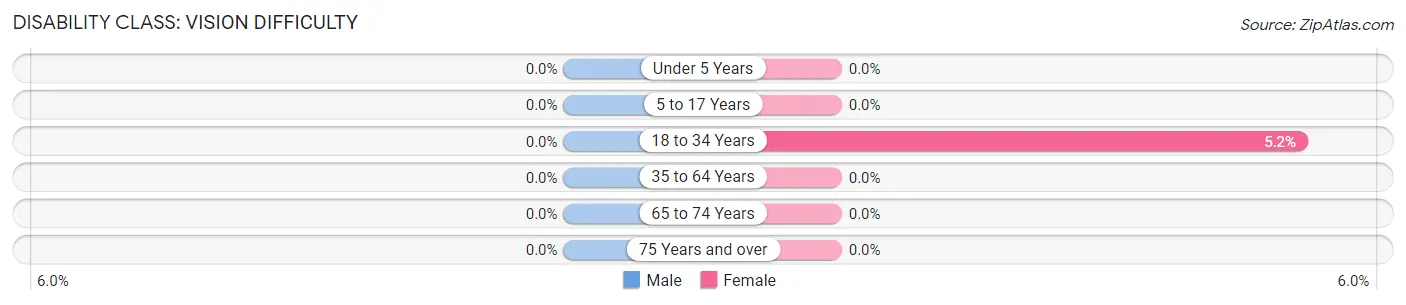
| Age Bracket | Male | Female |
| Under 5 Years | 0 (0.0%) | 0 (0.0%) |
| 5 to 17 Years | 0 (0.0%) | 0 (0.0%) |
| 18 to 34 Years | 0 (0.0%) | 4 (5.2%) |
| 35 to 64 Years | 0 (0.0%) | 0 (0.0%) |
| 65 to 74 Years | 0 (0.0%) | 0 (0.0%) |
| 75 Years and over | 0 (0.0%) | 0 (0.0%) |
Disability Class: Cognitive Difficulty

| Age Bracket | Male | Female |
| 5 to 17 Years | 0 (0.0%) | 0 (0.0%) |
| 18 to 34 Years | 0 (0.0%) | 0 (0.0%) |
| 35 to 64 Years | 0 (0.0%) | 0 (0.0%) |
| 65 to 74 Years | 0 (0.0%) | 0 (0.0%) |
| 75 Years and over | 0 (0.0%) | 0 (0.0%) |
Disability Class: Ambulatory Difficulty
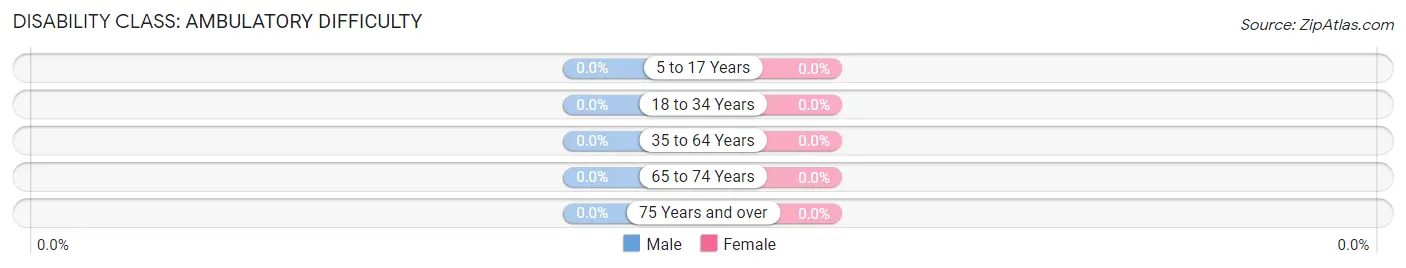
| Age Bracket | Male | Female |
| 5 to 17 Years | 0 (0.0%) | 0 (0.0%) |
| 18 to 34 Years | 0 (0.0%) | 0 (0.0%) |
| 35 to 64 Years | 0 (0.0%) | 0 (0.0%) |
| 65 to 74 Years | 0 (0.0%) | 0 (0.0%) |
| 75 Years and over | 0 (0.0%) | 0 (0.0%) |
Disability Class: Self-Care Difficulty
| Age Bracket | Male | Female |
| 5 to 17 Years | 0 (0.0%) | 0 (0.0%) |
| 18 to 34 Years | 0 (0.0%) | 0 (0.0%) |
| 35 to 64 Years | 0 (0.0%) | 0 (0.0%) |
| 65 to 74 Years | 0 (0.0%) | 0 (0.0%) |
| 75 Years and over | 0 (0.0%) | 0 (0.0%) |
Technology Access in Labish Village
Computing Device Access in Labish Village
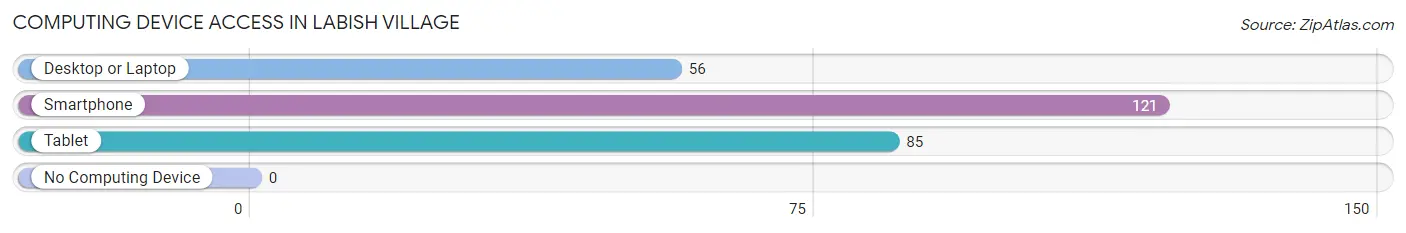
| Device Type | # Households | % Households |
| Desktop or Laptop | 56 | 46.3% |
| Smartphone | 121 | 100.0% |
| Tablet | 85 | 70.3% |
| No Computing Device | 0 | 0.0% |
| Total | 121 | 100.0% |
Internet Access in Labish Village
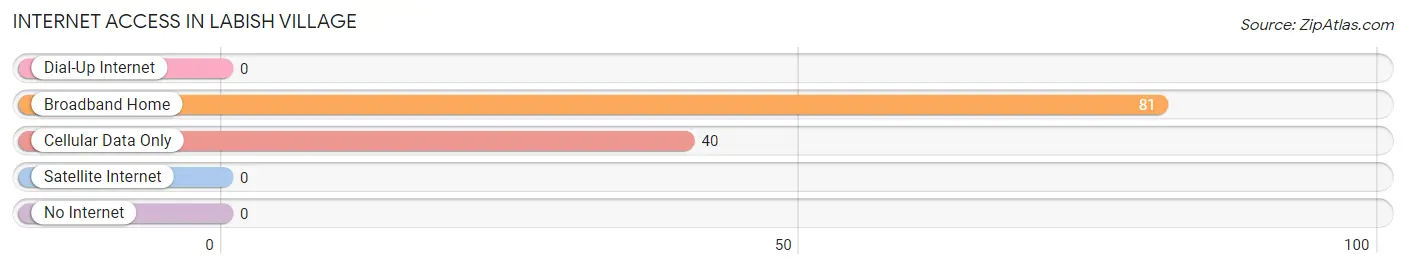
| Internet Type | # Households | % Households |
| Dial-Up Internet | 0 | 0.0% |
| Broadband Home | 81 | 66.9% |
| Cellular Data Only | 40 | 33.1% |
| Satellite Internet | 0 | 0.0% |
| No Internet | 0 | 0.0% |
| Total | 121 | 100.0% |
Labish Village Summary
Labish Village is a small unincorporated community located in Marion County, Oregon. It is situated in the foothills of the Cascade Mountains, approximately 20 miles east of Salem, the state capital. The village is home to a population of approximately 500 people, and is known for its rural charm and close-knit community.
History
Labish Village was founded in 1845 by a group of settlers from the Willamette Valley. The settlers were looking for a place to settle and farm, and the area around Labish Village provided them with fertile soil and abundant resources. The village was named after the Labish Creek, which runs through the area.
The village grew slowly over the years, and by the early 1900s it had become a thriving agricultural community. The village was home to several small farms, as well as a general store, a post office, and a school.
In the 1950s, the village began to decline as many of the younger residents moved away in search of better opportunities. The population dwindled to just a few hundred people, and the village became a quiet, rural community.
Geography
Labish Village is located in the foothills of the Cascade Mountains, approximately 20 miles east of Salem, the state capital. The village is situated in a valley, surrounded by rolling hills and lush forests. The Labish Creek runs through the village, providing a source of water for the local farms and homes.
The climate in Labish Village is mild and temperate, with warm summers and cool winters. The average annual temperature is around 50 degrees Fahrenheit, and the average annual precipitation is around 30 inches.
Economy
The economy of Labish Village is largely based on agriculture. The village is home to several small farms, which produce a variety of crops, including wheat, corn, and hay. The farms also raise livestock, such as cows, pigs, and chickens.
In addition to agriculture, the village is home to several small businesses, including a general store, a post office, and a few restaurants. The village also has a small tourism industry, as it is a popular destination for hikers and campers.
Demographics
As of the 2010 census, the population of Labish Village was 498 people. The population is predominantly white (94.2%), with a small minority of African Americans (2.2%) and Native Americans (1.2%). The median age of the population is 44.7 years, and the median household income is $45,000.
Conclusion
Labish Village is a small, rural community located in Marion County, Oregon. It is known for its close-knit community and rural charm, and is home to a population of approximately 500 people. The village is largely based on agriculture, and is also a popular destination for hikers and campers. The population is predominantly white, with a small minority of African Americans and Native Americans.
Common Questions
What is the Total Population of Labish Village?
Total Population of Labish Village is 496.
What is the Total Male Population of Labish Village?
Total Male Population of Labish Village is 224.
What is the Total Female Population of Labish Village?
Total Female Population of Labish Village is 272.
What is the Ratio of Males per 100 Females in Labish Village?
There are 82.35 Males per 100 Females in Labish Village.
What is the Ratio of Females per 100 Males in Labish Village?
There are 121.43 Females per 100 Males in Labish Village.
What is the Median Population Age in Labish Village?
Median Population Age in Labish Village is 25.2 Years.
What is the Average Family Size in Labish Village
Average Family Size in Labish Village is 3.9 People.
What is the Average Household Size in Labish Village
Average Household Size in Labish Village is 4.1 People.
What is Per Capita Income in Labish Village?
Per Capita income in Labish Village is $17,418.
What is the Median Family Income in Labish Village?
Median Family Income in Labish Village is $47,426.
What is the Median Household income in Labish Village?
Median Household Income in Labish Village is $56,250.
What is Inequality or Gini Index in Labish Village?
Inequality or Gini Index in Labish Village is 0.29.
How Large is the Labor Force in Labish Village?
There are 274 People in the Labor Forcein in Labish Village.
What is the Percentage of People in the Labor Force in Labish Village?
74.7% of People are in the Labor Force in Labish Village.