Summerville, OR
Summerville Map
Summerville Overview
130
TOTAL POPULATION
69
MALE POPULATION
61
FEMALE POPULATION
113.11
MALES / 100 FEMALES
88.41
FEMALES / 100 MALES
43.1
MEDIAN AGE
2.8
AVG FAMILY SIZE
2.8
AVG HOUSEHOLD SIZE
$36,647
PER CAPITA INCOME
$113,750
AVG FAMILY INCOME
$113,594
AVG HOUSEHOLD INCOME
12.8%
WAGE / INCOME GAP [ % ]
87.2¢/ $1
WAGE / INCOME GAP [ $ ]
0.31
INEQUALITY / GINI INDEX
75
LABOR FORCE [ PEOPLE ]
67.0%
PERCENT IN LABOR FORCE
21.3%
UNEMPLOYMENT RATE
Summerville Zip Codes
Summerville Area Codes
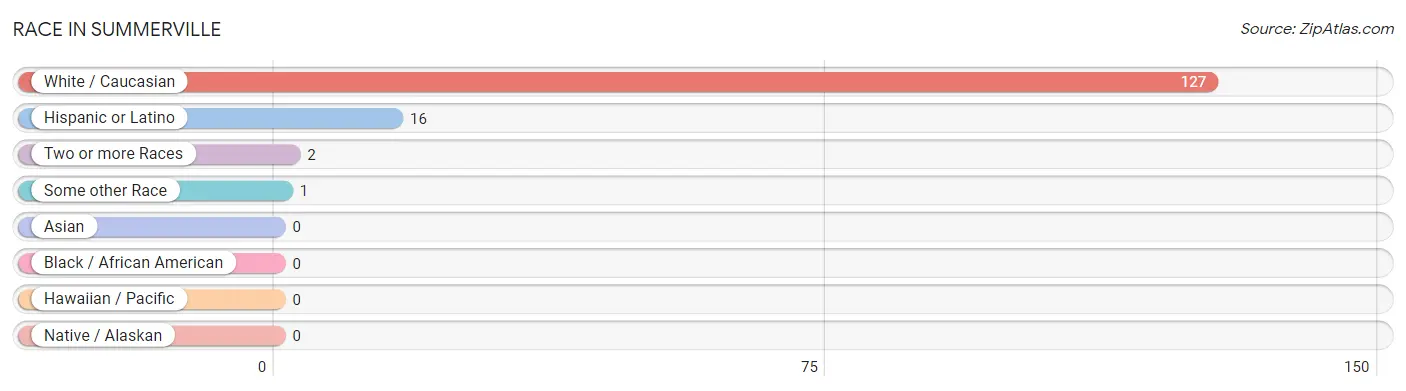
Race in Summerville
The most populous races in Summerville are White / Caucasian (127 | 97.7%), Hispanic or Latino (16 | 12.3%), and Two or more Races (2 | 1.5%).
| Race | # Population | % Population |
| Asian | 0 | 0.0% |
| Black / African American | 0 | 0.0% |
| Hawaiian / Pacific | 0 | 0.0% |
| Hispanic or Latino | 16 | 12.3% |
| Native / Alaskan | 0 | 0.0% |
| White / Caucasian | 127 | 97.7% |
| Two or more Races | 2 | 1.5% |
| Some other Race | 1 | 0.8% |
| Total | 130 | 100.0% |
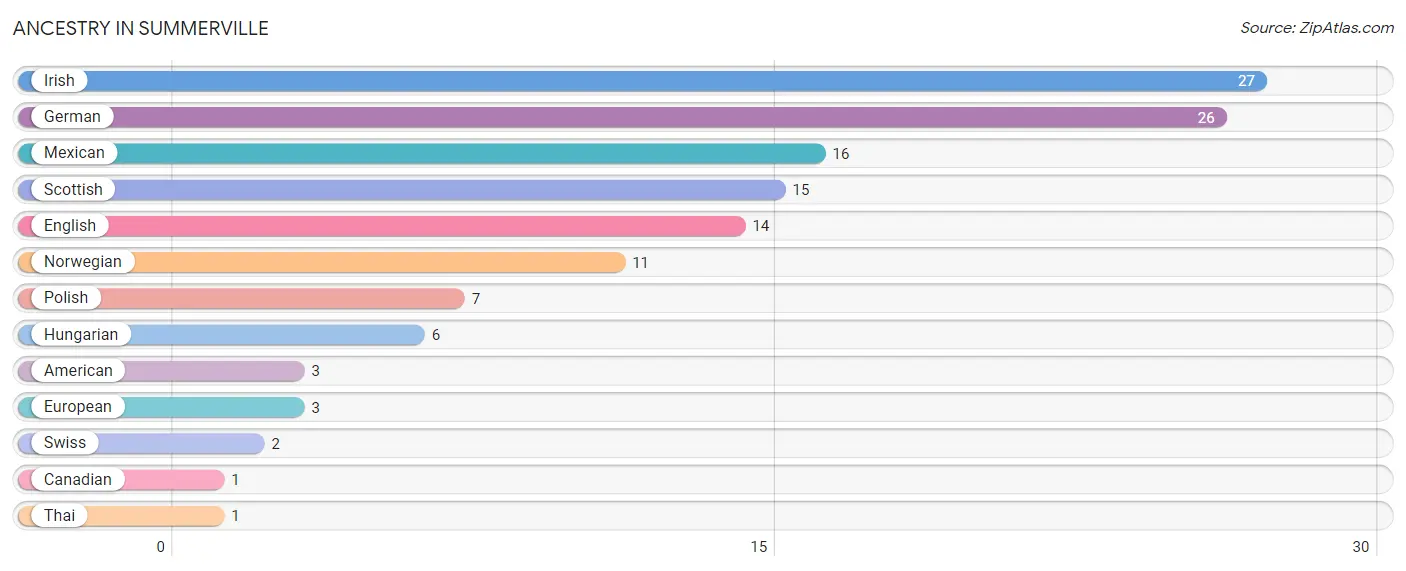
Ancestry in Summerville
The most populous ancestries reported in Summerville are Irish (27 | 20.8%), German (26 | 20.0%), Mexican (16 | 12.3%), Scottish (15 | 11.5%), and English (14 | 10.8%), together accounting for 75.4% of all Summerville residents.
| Ancestry | # Population | % Population |
| American | 3 | 2.3% |
| Canadian | 1 | 0.8% |
| English | 14 | 10.8% |
| European | 3 | 2.3% |
| German | 26 | 20.0% |
| Hungarian | 6 | 4.6% |
| Irish | 27 | 20.8% |
| Mexican | 16 | 12.3% |
| Norwegian | 11 | 8.5% |
| Polish | 7 | 5.4% |
| Scottish | 15 | 11.5% |
| Swiss | 2 | 1.5% |
| Thai | 1 | 0.8% | View All 13 Rows |
Immigrants in Summerville

| Immigration Origin | # Population | % Population | View All 0 Rows |
Sex and Age in Summerville
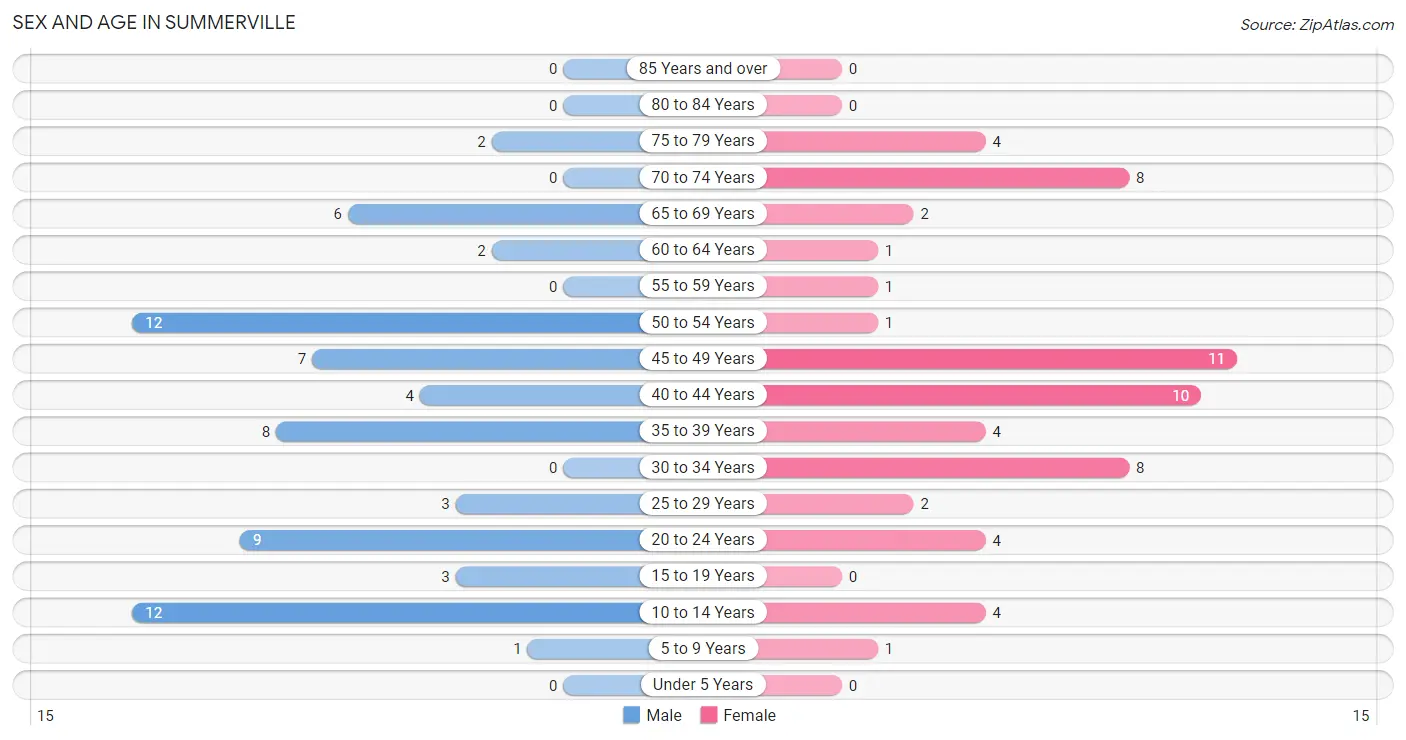
Sex and Age in Summerville
The most populous age groups in Summerville are 10 to 14 Years (12 | 17.4%) for men and 45 to 49 Years (11 | 18.0%) for women.
| Age Bracket | Male | Female |
| Under 5 Years | 0 (0.0%) | 0 (0.0%) |
| 5 to 9 Years | 1 (1.5%) | 1 (1.6%) |
| 10 to 14 Years | 12 (17.4%) | 4 (6.6%) |
| 15 to 19 Years | 3 (4.3%) | 0 (0.0%) |
| 20 to 24 Years | 9 (13.0%) | 4 (6.6%) |
| 25 to 29 Years | 3 (4.3%) | 2 (3.3%) |
| 30 to 34 Years | 0 (0.0%) | 8 (13.1%) |
| 35 to 39 Years | 8 (11.6%) | 4 (6.6%) |
| 40 to 44 Years | 4 (5.8%) | 10 (16.4%) |
| 45 to 49 Years | 7 (10.1%) | 11 (18.0%) |
| 50 to 54 Years | 12 (17.4%) | 1 (1.6%) |
| 55 to 59 Years | 0 (0.0%) | 1 (1.6%) |
| 60 to 64 Years | 2 (2.9%) | 1 (1.6%) |
| 65 to 69 Years | 6 (8.7%) | 2 (3.3%) |
| 70 to 74 Years | 0 (0.0%) | 8 (13.1%) |
| 75 to 79 Years | 2 (2.9%) | 4 (6.6%) |
| 80 to 84 Years | 0 (0.0%) | 0 (0.0%) |
| 85 Years and over | 0 (0.0%) | 0 (0.0%) |
| Total | 69 (100.0%) | 61 (100.0%) |
Families and Households in Summerville
Median Family Size in Summerville
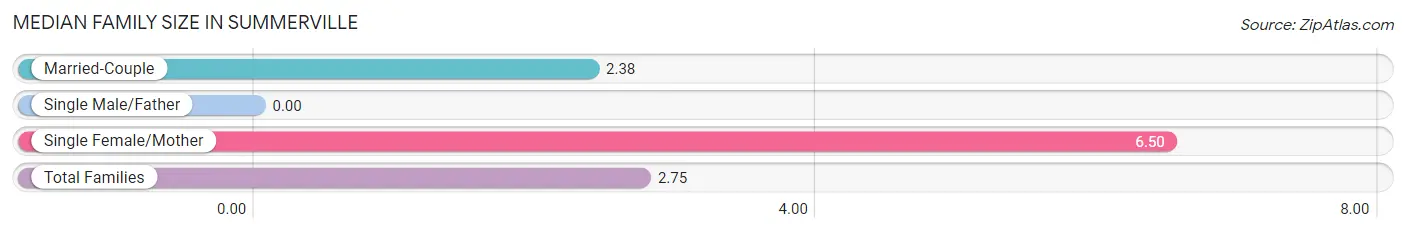
| Family Type | # Families | Family Size |
| Married-Couple | 40 (90.9%) | 2.38 |
| Single Male/Father | 0 (0.0%) | - |
| Single Female/Mother | 4 (9.1%) | 6.50 |
| Total Families | 44 (100.0%) | 2.75 |
Median Household Size in Summerville
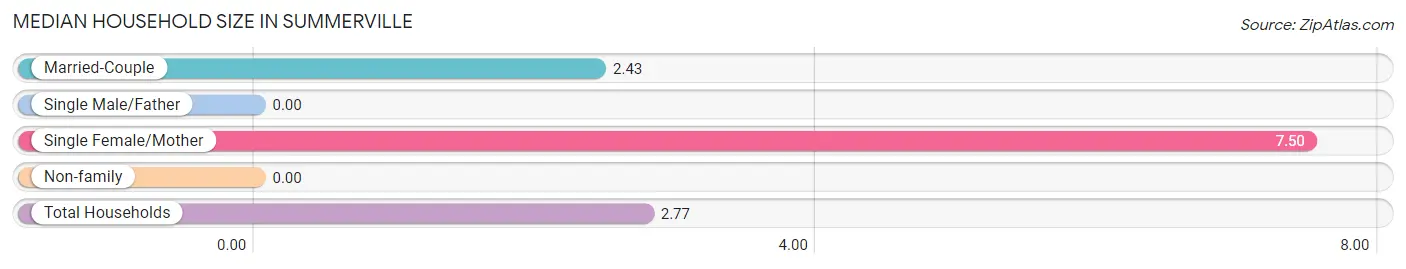
| Household Type | # Households | Household Size |
| Married-Couple | 40 (85.1%) | 2.43 |
| Single Male/Father | 0 (0.0%) | - |
| Single Female/Mother | 4 (8.5%) | 7.50 |
| Non-family | 3 (6.4%) | - |
| Total Households | 47 (100.0%) | 2.77 |
Household Size by Marriage Status in Summerville
Out of a total of 47 households in Summerville, 44 (93.6%) are family households, while 3 (6.4%) are nonfamily households. The most numerous type of family households are 2-person households, comprising 25, and the most common type of nonfamily households are 1-person households, comprising 3.
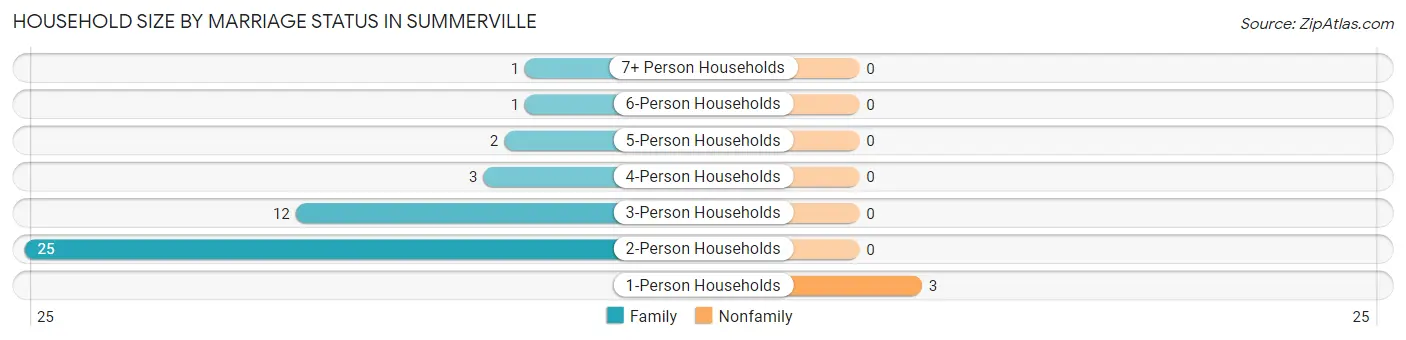
| Household Size | Family Households | Nonfamily Households |
| 1-Person Households | - | 3 (6.4%) |
| 2-Person Households | 25 (53.2%) | 0 (0.0%) |
| 3-Person Households | 12 (25.5%) | 0 (0.0%) |
| 4-Person Households | 3 (6.4%) | 0 (0.0%) |
| 5-Person Households | 2 (4.3%) | 0 (0.0%) |
| 6-Person Households | 1 (2.1%) | 0 (0.0%) |
| 7+ Person Households | 1 (2.1%) | 0 (0.0%) |
| Total | 44 (93.6%) | 3 (6.4%) |
Female Fertility in Summerville
Fertility by Age in Summerville
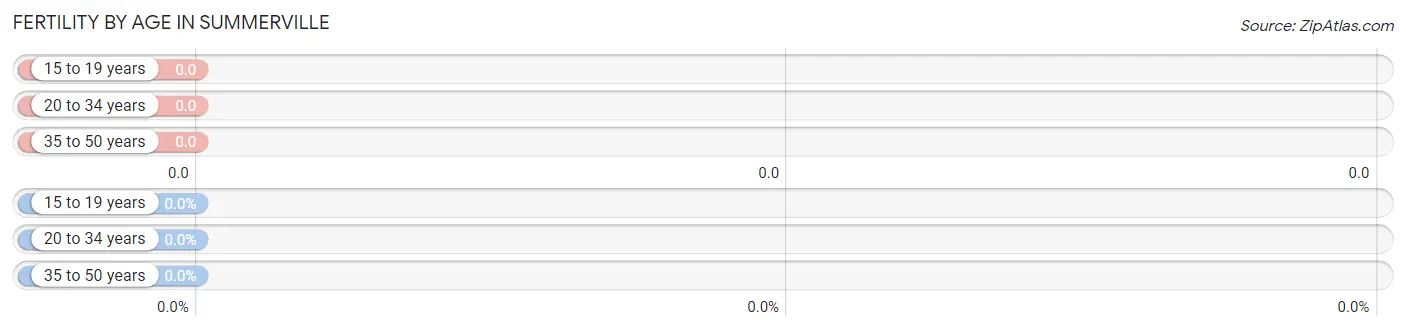
| Age Bracket | Women with Births | Births / 1,000 Women |
| 15 to 19 years | 0 (0.0%) | 0.0 |
| 20 to 34 years | 0 (0.0%) | 0.0 |
| 35 to 50 years | 0 (0.0%) | 0.0 |
| Total | 0 (0.0%) | 0.0 |
Fertility by Age by Marriage Status in Summerville
| Age Bracket | Married | Unmarried |
| 15 to 19 years | 0 (0.0%) | 0 (0.0%) |
| 20 to 34 years | 0 (0.0%) | 0 (0.0%) |
| 35 to 50 years | 0 (0.0%) | 0 (0.0%) |
| Total | 0 (0.0%) | 0 (0.0%) |
Fertility by Education in Summerville
| Educational Attainment | Women with Births | Births / 1,000 Women |
| Less than High School | 0 (0.0%) | 0.0 |
| High School Diploma | 0 (0.0%) | 0.0 |
| College or Associate's Degree | 0 (0.0%) | 0.0 |
| Bachelor's Degree | 0 (0.0%) | 0.0 |
| Graduate Degree | 0 (0.0%) | 0.0 |
| Total | 0 (0.0%) | 0.0 |
Fertility by Education by Marriage Status in Summerville
| Educational Attainment | Married | Unmarried |
| Less than High School | 0 (0.0%) | 0 (0.0%) |
| High School Diploma | 0 (0.0%) | 0 (0.0%) |
| College or Associate's Degree | 0 (0.0%) | 0 (0.0%) |
| Bachelor's Degree | 0 (0.0%) | 0 (0.0%) |
| Graduate Degree | 0 (0.0%) | 0 (0.0%) |
| Total | 0 (0.0%) | 0 (0.0%) |
Income in Summerville
Income Overview in Summerville
Per Capita Income in Summerville is $36,647, while median incomes of families and households are $113,750 and $113,594 respectively.
| Characteristic | Number | Measure |
| Per Capita Income | 130 | $36,647 |
| Median Family Income | 44 | $113,750 |
| Mean Family Income | 44 | $108,934 |
| Median Household Income | 47 | $113,594 |
| Mean Household Income | 47 | $105,730 |
| Income Deficit | 44 | $0 |
| Wage / Income Gap (%) | 130 | 12.76% |
| Wage / Income Gap ($) | 130 | 87.24¢ per $1 |
| Gini / Inequality Index | 130 | 0.31 |
Earnings by Sex in Summerville
Average Earnings in Summerville are $45,781, $50,625 for men and $44,167 for women, a difference of 12.8%.
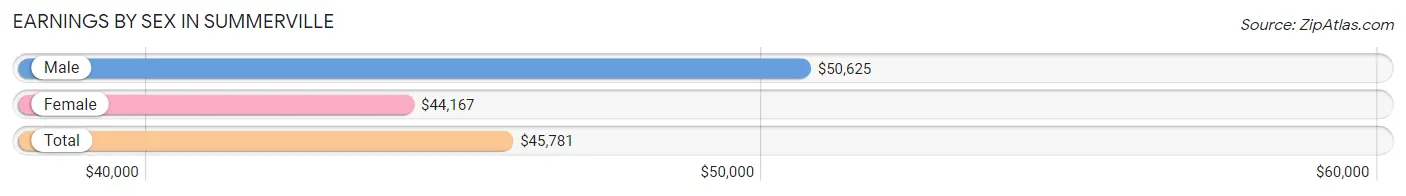
| Sex | Number | Average Earnings |
| Male | 47 (58.0%) | $50,625 |
| Female | 34 (42.0%) | $44,167 |
| Total | 81 (100.0%) | $45,781 |
Earnings by Sex by Income Bracket in Summerville
The most common earnings brackets in Summerville are $100,000+ for men (8 | 17.0%) and $45,000 to $49,999 for women (8 | 23.5%).
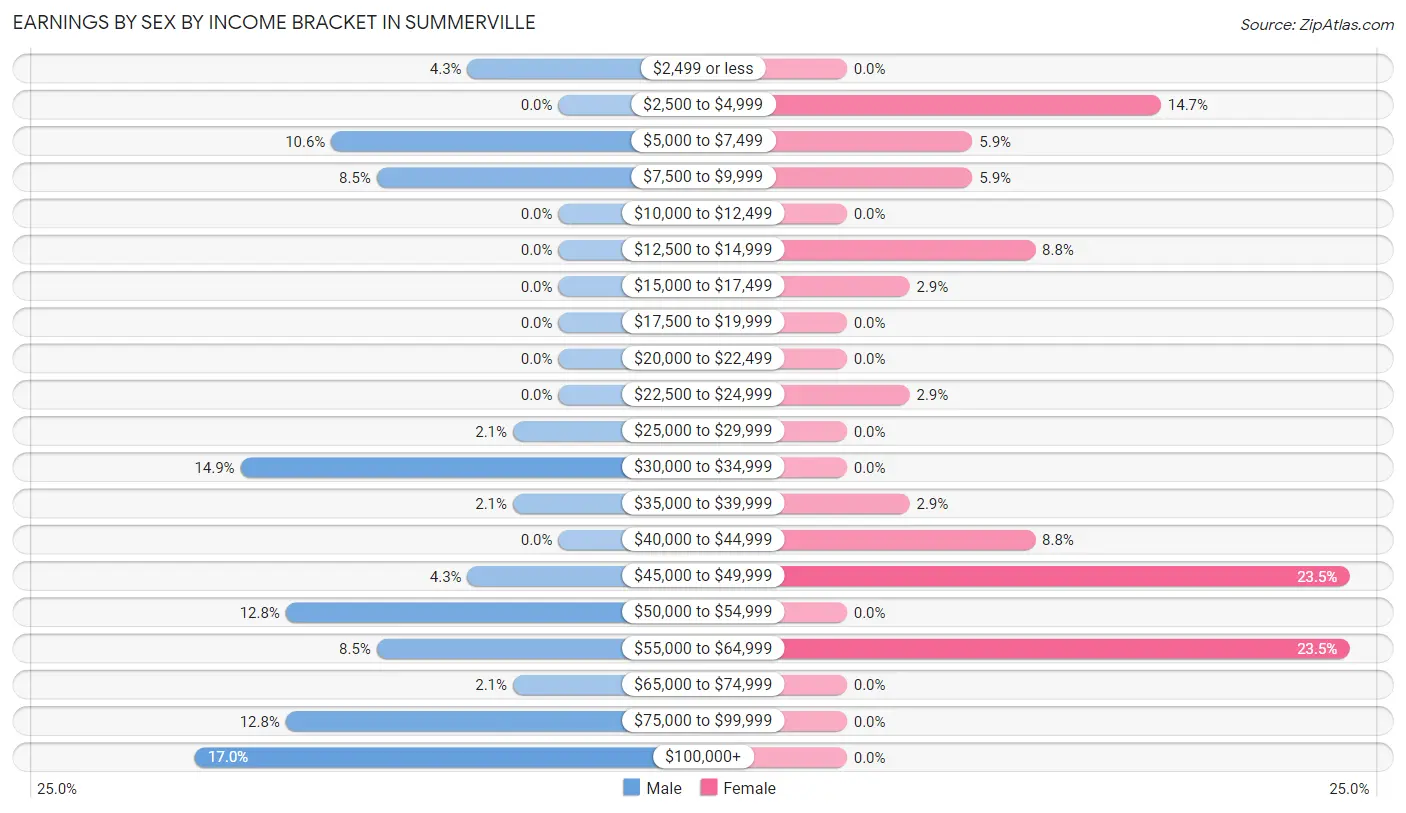
| Income | Male | Female |
| $2,499 or less | 2 (4.3%) | 0 (0.0%) |
| $2,500 to $4,999 | 0 (0.0%) | 5 (14.7%) |
| $5,000 to $7,499 | 5 (10.6%) | 2 (5.9%) |
| $7,500 to $9,999 | 4 (8.5%) | 2 (5.9%) |
| $10,000 to $12,499 | 0 (0.0%) | 0 (0.0%) |
| $12,500 to $14,999 | 0 (0.0%) | 3 (8.8%) |
| $15,000 to $17,499 | 0 (0.0%) | 1 (2.9%) |
| $17,500 to $19,999 | 0 (0.0%) | 0 (0.0%) |
| $20,000 to $22,499 | 0 (0.0%) | 0 (0.0%) |
| $22,500 to $24,999 | 0 (0.0%) | 1 (2.9%) |
| $25,000 to $29,999 | 1 (2.1%) | 0 (0.0%) |
| $30,000 to $34,999 | 7 (14.9%) | 0 (0.0%) |
| $35,000 to $39,999 | 1 (2.1%) | 1 (2.9%) |
| $40,000 to $44,999 | 0 (0.0%) | 3 (8.8%) |
| $45,000 to $49,999 | 2 (4.3%) | 8 (23.5%) |
| $50,000 to $54,999 | 6 (12.8%) | 0 (0.0%) |
| $55,000 to $64,999 | 4 (8.5%) | 8 (23.5%) |
| $65,000 to $74,999 | 1 (2.1%) | 0 (0.0%) |
| $75,000 to $99,999 | 6 (12.8%) | 0 (0.0%) |
| $100,000+ | 8 (17.0%) | 0 (0.0%) |
| Total | 47 (100.0%) | 34 (100.0%) |
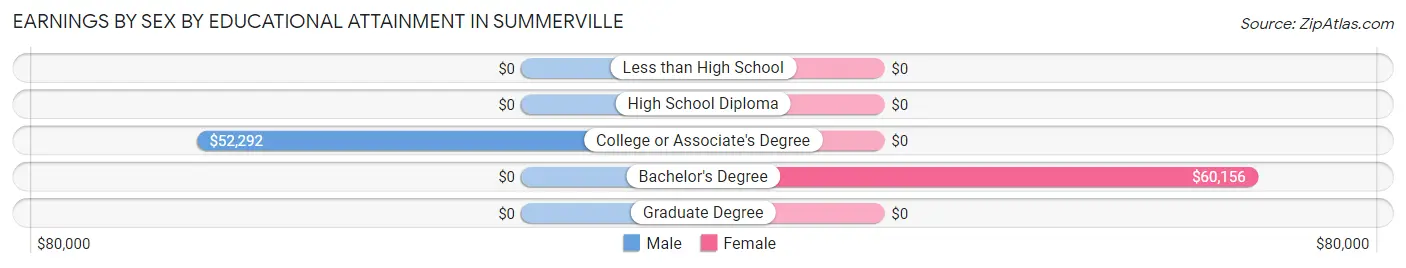
Earnings by Sex by Educational Attainment in Summerville
Average earnings in Summerville are $53,750 for men and $44,583 for women, a difference of 17.1%. Men with an educational attainment of college or associate's degree enjoy the highest average annual earnings of $52,292, while those with college or associate's degree education earn the least with $52,292. Women with an educational attainment of bachelor's degree earn the most with the average annual earnings of $60,156, while those with bachelor's degree education have the smallest earnings of $60,156.
| Educational Attainment | Male Income | Female Income |
| Less than High School | - | - |
| High School Diploma | - | - |
| College or Associate's Degree | $52,292 | $0 |
| Bachelor's Degree | - | - |
| Graduate Degree | - | - |
| Total | $53,750 | $44,583 |
Family Income in Summerville
Family Income Brackets in Summerville
According to the Summerville family income data, there are 20 families falling into the $100,000 to $149,999 income range, which is the most common income bracket and makes up 45.5% of all families.
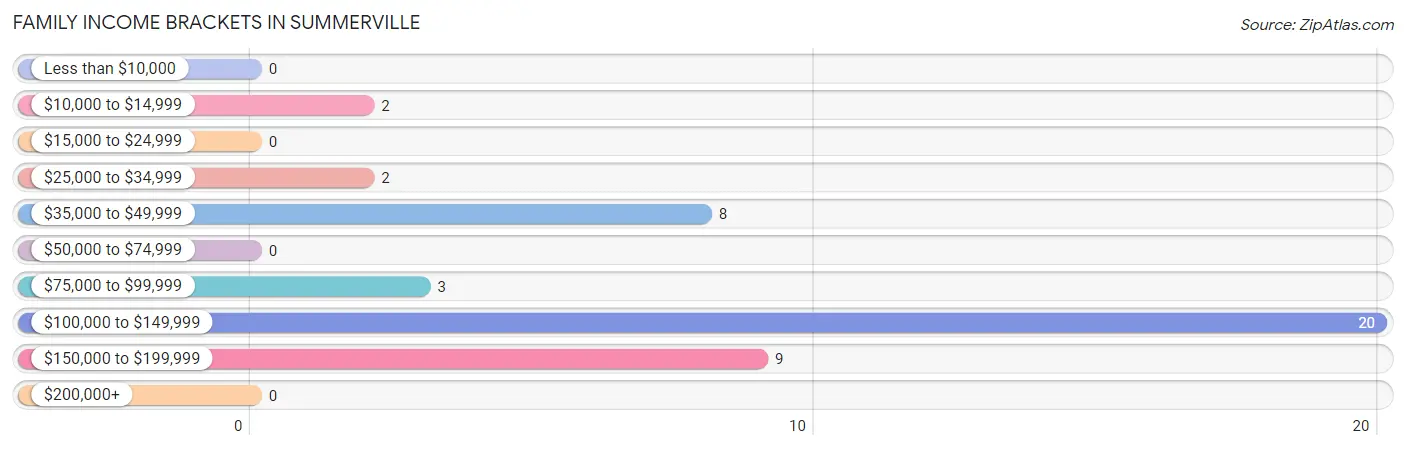
| Income Bracket | # Families | % Families |
| Less than $10,000 | 0 | 0.0% |
| $10,000 to $14,999 | 2 | 4.5% |
| $15,000 to $24,999 | 0 | 0.0% |
| $25,000 to $34,999 | 2 | 4.5% |
| $35,000 to $49,999 | 8 | 18.2% |
| $50,000 to $74,999 | 0 | 0.0% |
| $75,000 to $99,999 | 3 | 6.8% |
| $100,000 to $149,999 | 20 | 45.5% |
| $150,000 to $199,999 | 9 | 20.5% |
| $200,000+ | 0 | 0.0% |
Family Income by Famaliy Size in Summerville
3-person families (12 | 27.3%) account for the highest median family income in Summerville with $114,375 per family, while 2-person families (25 | 56.8%) have the highest median income of $50,312 per family member.
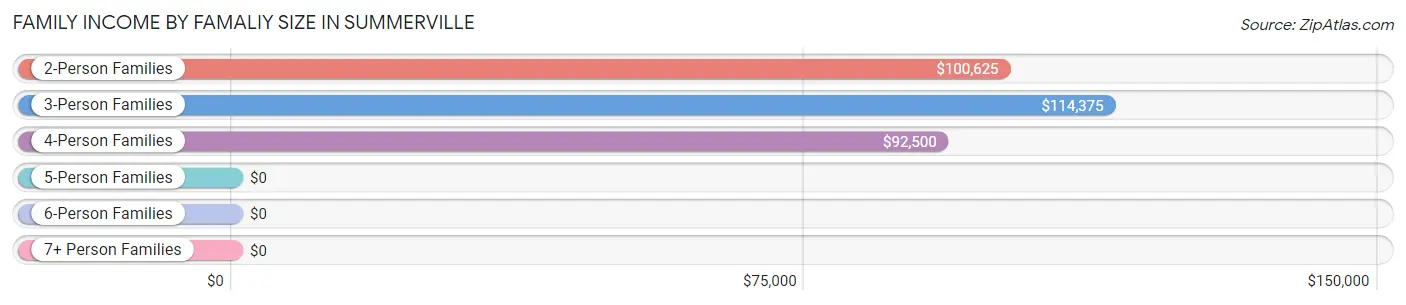
| Income Bracket | # Families | Median Income |
| 2-Person Families | 25 (56.8%) | $100,625 |
| 3-Person Families | 12 (27.3%) | $114,375 |
| 4-Person Families | 6 (13.6%) | $92,500 |
| 5-Person Families | 0 (0.0%) | $0 |
| 6-Person Families | 0 (0.0%) | $0 |
| 7+ Person Families | 1 (2.3%) | $0 |
| Total | 44 (100.0%) | $113,750 |
Family Income by Number of Earners in Summerville
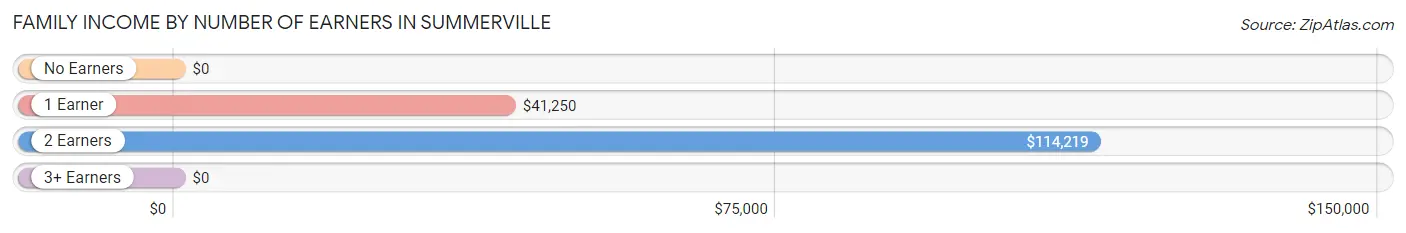
| Number of Earners | # Families | Median Income |
| No Earners | 4 (9.1%) | $0 |
| 1 Earner | 10 (22.7%) | $41,250 |
| 2 Earners | 27 (61.4%) | $114,219 |
| 3+ Earners | 3 (6.8%) | $0 |
| Total | 44 (100.0%) | $113,750 |
Household Income in Summerville
Household Income Brackets in Summerville
With 19 households falling in the category, the $100,000 to $149,999 income range is the most frequent in Summerville, accounting for 40.4% of all households.

| Income Bracket | # Households | % Households |
| Less than $10,000 | 0 | 0.0% |
| $10,000 to $14,999 | 0 | 0.0% |
| $15,000 to $24,999 | 4 | 8.5% |
| $25,000 to $34,999 | 2 | 4.3% |
| $35,000 to $49,999 | 9 | 19.1% |
| $50,000 to $74,999 | 0 | 0.0% |
| $75,000 to $99,999 | 3 | 6.4% |
| $100,000 to $149,999 | 19 | 40.4% |
| $150,000 to $199,999 | 10 | 21.3% |
| $200,000+ | 0 | 0.0% |
Household Income by Householder Age in Summerville
The median household income in Summerville is $113,594, with the highest median household income of $116,250 found in the 25 to 44 years age bracket for the primary householder. A total of 20 households (42.5%) fall into this category.
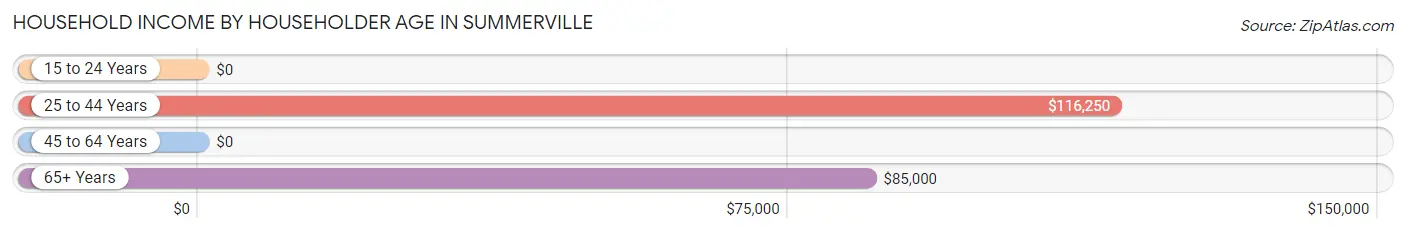
| Income Bracket | # Households | Median Income |
| 15 to 24 Years | 0 (0.0%) | $0 |
| 25 to 44 Years | 20 (42.5%) | $116,250 |
| 45 to 64 Years | 15 (31.9%) | $0 |
| 65+ Years | 12 (25.5%) | $85,000 |
| Total | 47 (100.0%) | $113,594 |
Poverty in Summerville
Income Below Poverty by Sex and Age in Summerville
With 20.6% poverty level for males and 3.3% for females among the residents of Summerville, 12 to 14 year old males and 35 to 44 year old females are the most vulnerable to poverty, with 2 males (100.0%) and 2 females (14.3%) in their respective age groups living below the poverty level.
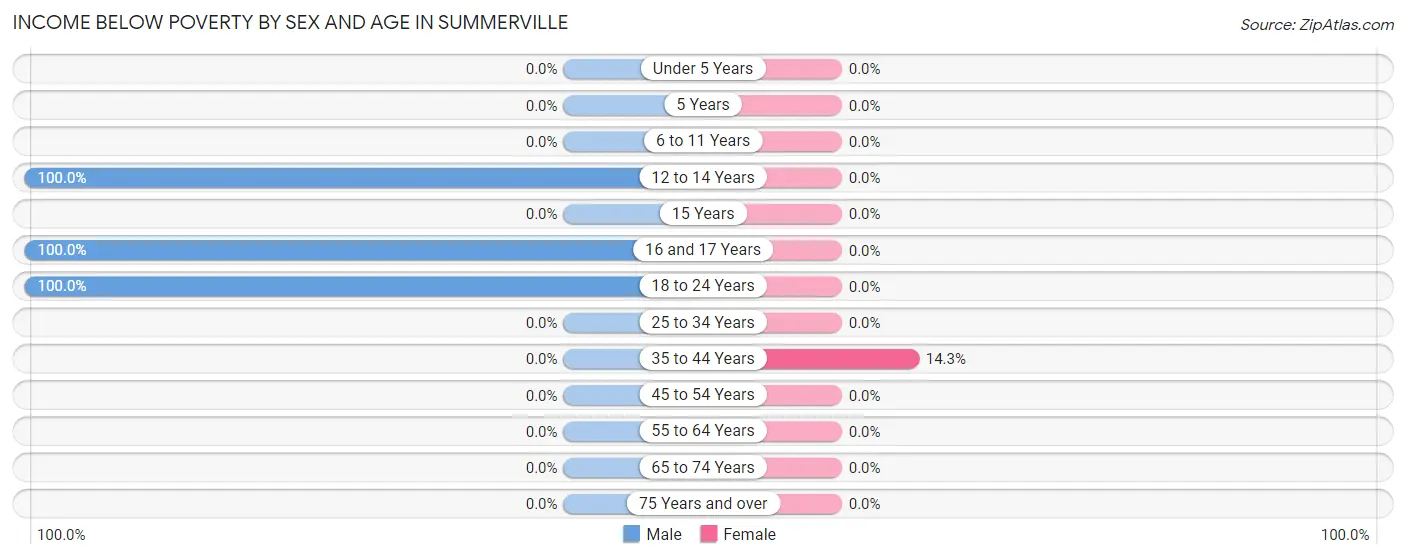
| Age Bracket | Male | Female |
| Under 5 Years | 0 (0.0%) | 0 (0.0%) |
| 5 Years | 0 (0.0%) | 0 (0.0%) |
| 6 to 11 Years | 0 (0.0%) | 0 (0.0%) |
| 12 to 14 Years | 2 (100.0%) | 0 (0.0%) |
| 15 Years | 0 (0.0%) | 0 (0.0%) |
| 16 and 17 Years | 3 (100.0%) | 0 (0.0%) |
| 18 to 24 Years | 9 (100.0%) | 0 (0.0%) |
| 25 to 34 Years | 0 (0.0%) | 0 (0.0%) |
| 35 to 44 Years | 0 (0.0%) | 2 (14.3%) |
| 45 to 54 Years | 0 (0.0%) | 0 (0.0%) |
| 55 to 64 Years | 0 (0.0%) | 0 (0.0%) |
| 65 to 74 Years | 0 (0.0%) | 0 (0.0%) |
| 75 Years and over | 0 (0.0%) | 0 (0.0%) |
| Total | 14 (20.6%) | 2 (3.3%) |
Income Above Poverty by Sex and Age in Summerville
According to the poverty statistics in Summerville, males aged 6 to 11 years and females aged 6 to 11 years are the age groups that are most secure financially, with 100.0% of males and 100.0% of females in these age groups living above the poverty line.

| Age Bracket | Male | Female |
| Under 5 Years | 0 (0.0%) | 0 (0.0%) |
| 5 Years | 0 (0.0%) | 0 (0.0%) |
| 6 to 11 Years | 10 (100.0%) | 1 (100.0%) |
| 12 to 14 Years | 0 (0.0%) | 4 (100.0%) |
| 15 Years | 0 (0.0%) | 0 (0.0%) |
| 16 and 17 Years | 0 (0.0%) | 0 (0.0%) |
| 18 to 24 Years | 0 (0.0%) | 4 (100.0%) |
| 25 to 34 Years | 3 (100.0%) | 10 (100.0%) |
| 35 to 44 Years | 12 (100.0%) | 12 (85.7%) |
| 45 to 54 Years | 19 (100.0%) | 12 (100.0%) |
| 55 to 64 Years | 2 (100.0%) | 2 (100.0%) |
| 65 to 74 Years | 6 (100.0%) | 10 (100.0%) |
| 75 Years and over | 2 (100.0%) | 4 (100.0%) |
| Total | 54 (79.4%) | 59 (96.7%) |
Income Below Poverty Among Married-Couple Families in Summerville
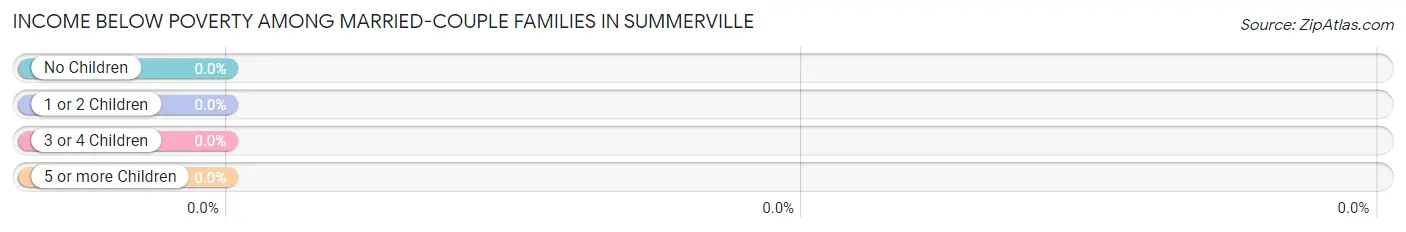
| Children | Above Poverty | Below Poverty |
| No Children | 28 (100.0%) | 0 (0.0%) |
| 1 or 2 Children | 12 (100.0%) | 0 (0.0%) |
| 3 or 4 Children | 0 (0.0%) | 0 (0.0%) |
| 5 or more Children | 0 (0.0%) | 0 (0.0%) |
| Total | 40 (100.0%) | 0 (0.0%) |
Income Below Poverty Among Single-Parent Households in Summerville
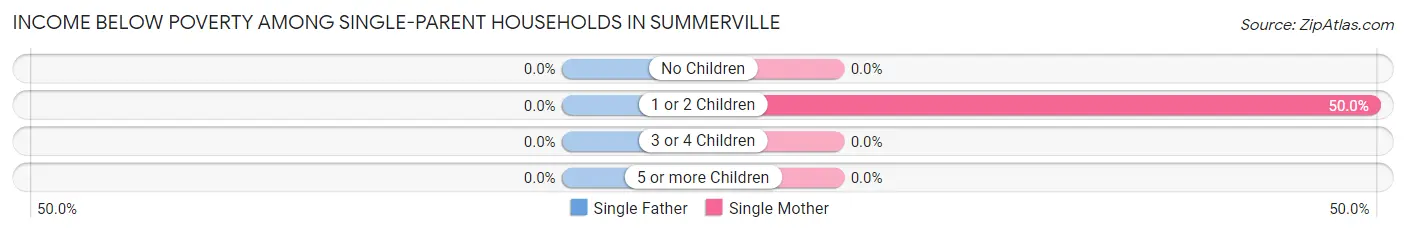
| Children | Single Father | Single Mother |
| No Children | 0 (0.0%) | 0 (0.0%) |
| 1 or 2 Children | 0 (0.0%) | 2 (50.0%) |
| 3 or 4 Children | 0 (0.0%) | 0 (0.0%) |
| 5 or more Children | 0 (0.0%) | 0 (0.0%) |
| Total | 0 (0.0%) | 2 (50.0%) |
Income Below Poverty Among Married-Couple vs Single-Parent Households in Summerville
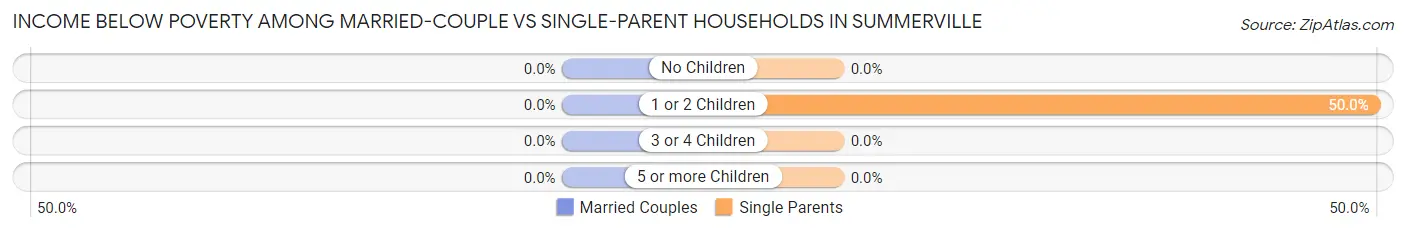
| Children | Married-Couple Families | Single-Parent Households |
| No Children | 0 (0.0%) | 0 (0.0%) |
| 1 or 2 Children | 0 (0.0%) | 2 (50.0%) |
| 3 or 4 Children | 0 (0.0%) | 0 (0.0%) |
| 5 or more Children | 0 (0.0%) | 0 (0.0%) |
| Total | 0 (0.0%) | 2 (50.0%) |
Employment Characteristics in Summerville
Employment by Class of Employer in Summerville
Among the 59 employed individuals in Summerville, private company employees (29 | 49.1%), self-employed (incorporated) (8 | 13.6%), and not-for-profit organizations (8 | 13.6%) make up the most common classes of employment.
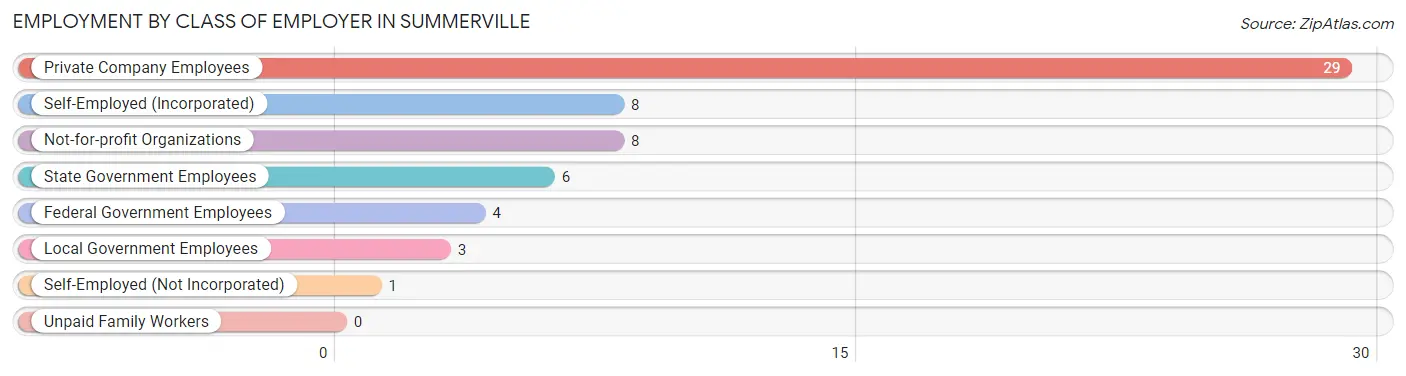
| Employer Class | # Employees | % Employees |
| Private Company Employees | 29 | 49.1% |
| Self-Employed (Incorporated) | 8 | 13.6% |
| Self-Employed (Not Incorporated) | 1 | 1.7% |
| Not-for-profit Organizations | 8 | 13.6% |
| Local Government Employees | 3 | 5.1% |
| State Government Employees | 6 | 10.2% |
| Federal Government Employees | 4 | 6.8% |
| Unpaid Family Workers | 0 | 0.0% |
| Total | 59 | 100.0% |
Employment Status by Age in Summerville
According to the labor force statistics for Summerville, out of the total population over 16 years of age (112), 67.0% or 75 individuals are in the labor force, with 21.3% or 16 of them unemployed. The age group with the highest labor force participation rate is 30 to 34 years, with 100.0% or 8 individuals in the labor force. Within the labor force, the 20 to 24 years age range has the highest percentage of unemployed individuals, with 90.0% or 9 of them being unemployed.
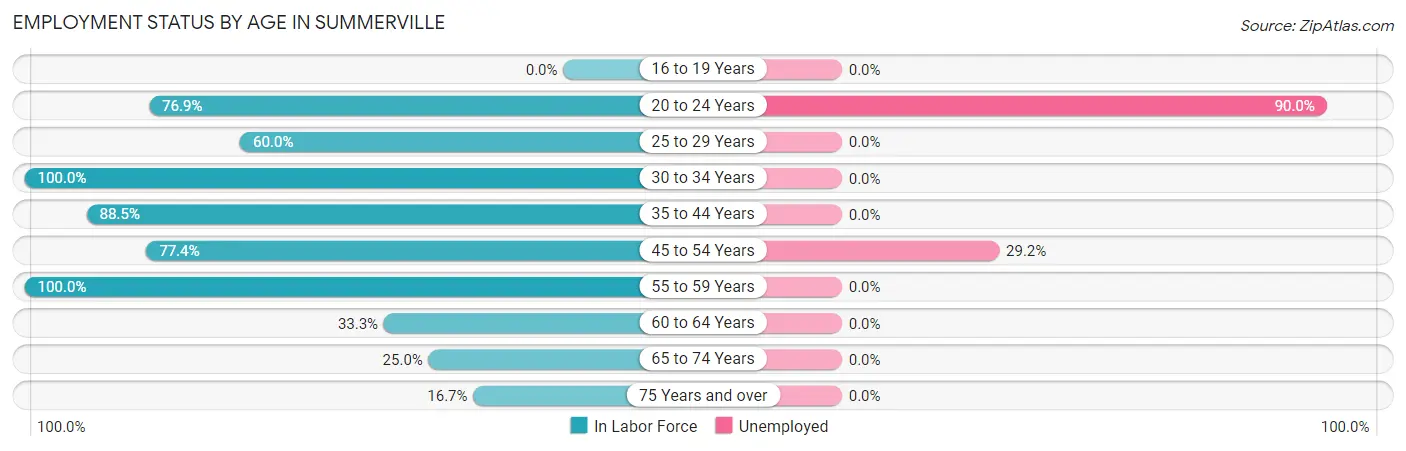
| Age Bracket | In Labor Force | Unemployed |
| 16 to 19 Years | 0 (0.0%) | 0 (0.0%) |
| 20 to 24 Years | 10 (76.9%) | 9 (90.0%) |
| 25 to 29 Years | 3 (60.0%) | 0 (0.0%) |
| 30 to 34 Years | 8 (100.0%) | 0 (0.0%) |
| 35 to 44 Years | 23 (88.5%) | 0 (0.0%) |
| 45 to 54 Years | 24 (77.4%) | 7 (29.2%) |
| 55 to 59 Years | 1 (100.0%) | 0 (0.0%) |
| 60 to 64 Years | 1 (33.3%) | 0 (0.0%) |
| 65 to 74 Years | 4 (25.0%) | 0 (0.0%) |
| 75 Years and over | 1 (16.7%) | 0 (0.0%) |
| Total | 75 (67.0%) | 16 (21.3%) |
Employment Status by Educational Attainment in Summerville
According to labor force statistics for Summerville, 81.1% of individuals (60) out of the total population between 25 and 64 years of age (74) are in the labor force, with 11.7% or 7 of them being unemployed. The group with the highest labor force participation rate are those with the educational attainment of bachelor's degree or higher, with 100.0% or 21 individuals in the labor force. Within the labor force, individuals with high school diploma education have the highest percentage of unemployment, with 36.8% or 7 of them being unemployed.
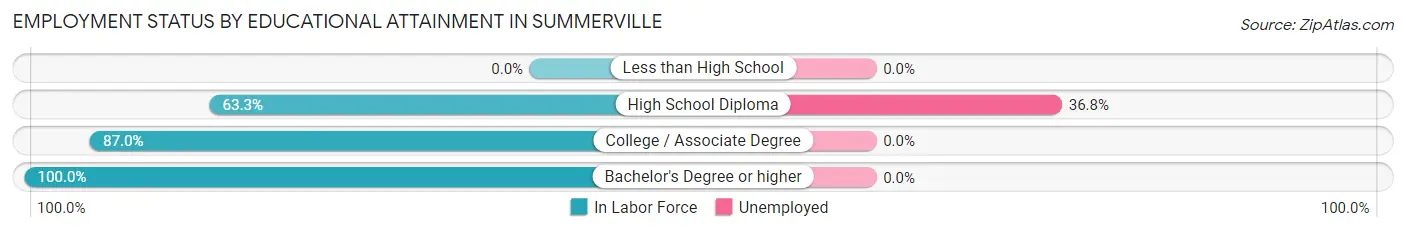
| Educational Attainment | In Labor Force | Unemployed |
| Less than High School | 0 (0.0%) | 0 (0.0%) |
| High School Diploma | 19 (63.3%) | 11 (36.8%) |
| College / Associate Degree | 20 (87.0%) | 0 (0.0%) |
| Bachelor's Degree or higher | 21 (100.0%) | 0 (0.0%) |
| Total | 60 (81.1%) | 9 (11.7%) |
Employment Occupations by Sex in Summerville
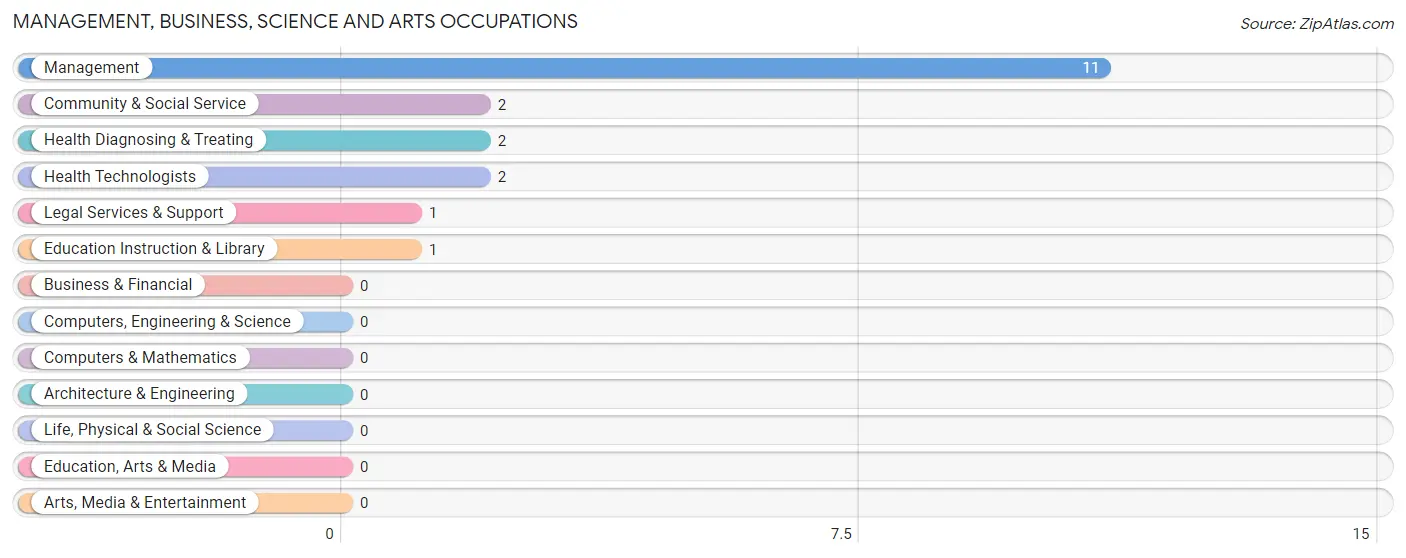
Management, Business, Science and Arts Occupations
The most common Management, Business, Science and Arts occupations in Summerville are Management (11 | 18.6%), Community & Social Service (2 | 3.4%), Health Diagnosing & Treating (2 | 3.4%), Health Technologists (2 | 3.4%), and Legal Services & Support (1 | 1.7%).
Management, Business, Science and Arts Occupations by Sex
Within the Management, Business, Science and Arts occupations in Summerville, the most male-oriented occupations are Health Diagnosing & Treating (100.0%), Health Technologists (100.0%), and Management (9.1%), while the most female-oriented occupations are Community & Social Service (100.0%), Legal Services & Support (100.0%), and Education Instruction & Library (100.0%).
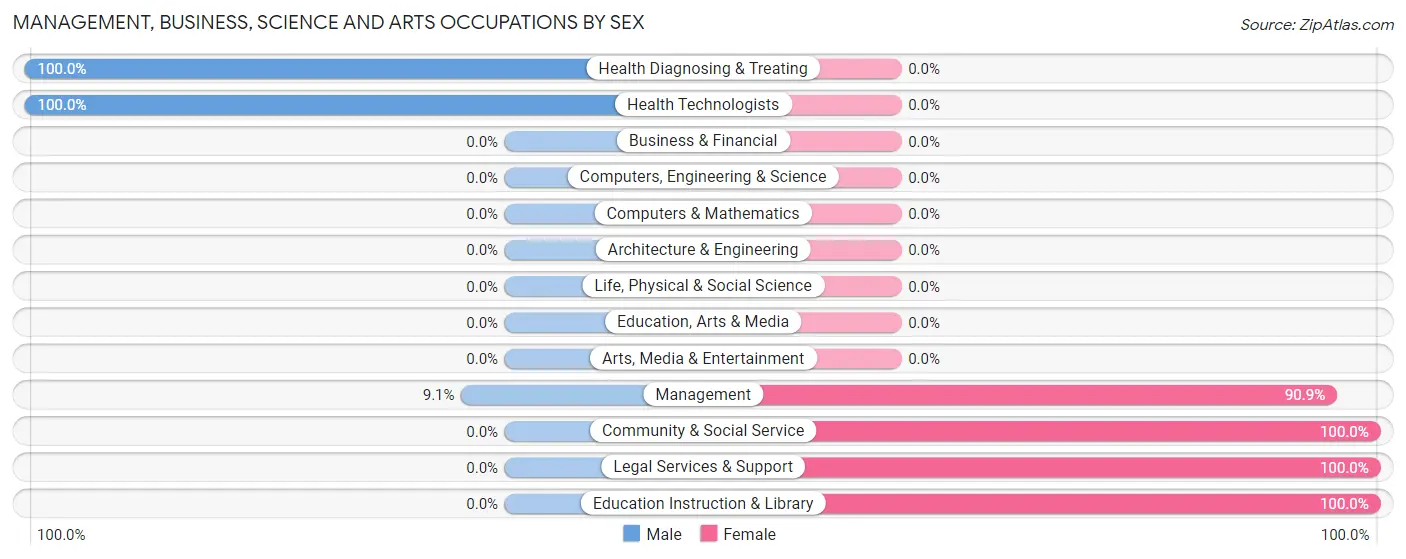
| Occupation | Male | Female |
| Management | 1 (9.1%) | 10 (90.9%) |
| Business & Financial | 0 (0.0%) | 0 (0.0%) |
| Computers, Engineering & Science | 0 (0.0%) | 0 (0.0%) |
| Computers & Mathematics | 0 (0.0%) | 0 (0.0%) |
| Architecture & Engineering | 0 (0.0%) | 0 (0.0%) |
| Life, Physical & Social Science | 0 (0.0%) | 0 (0.0%) |
| Community & Social Service | 0 (0.0%) | 2 (100.0%) |
| Education, Arts & Media | 0 (0.0%) | 0 (0.0%) |
| Legal Services & Support | 0 (0.0%) | 1 (100.0%) |
| Education Instruction & Library | 0 (0.0%) | 1 (100.0%) |
| Arts, Media & Entertainment | 0 (0.0%) | 0 (0.0%) |
| Health Diagnosing & Treating | 2 (100.0%) | 0 (0.0%) |
| Health Technologists | 2 (100.0%) | 0 (0.0%) |
| Total (Category) | 3 (20.0%) | 12 (80.0%) |
| Total (Overall) | 29 (49.1%) | 30 (50.8%) |
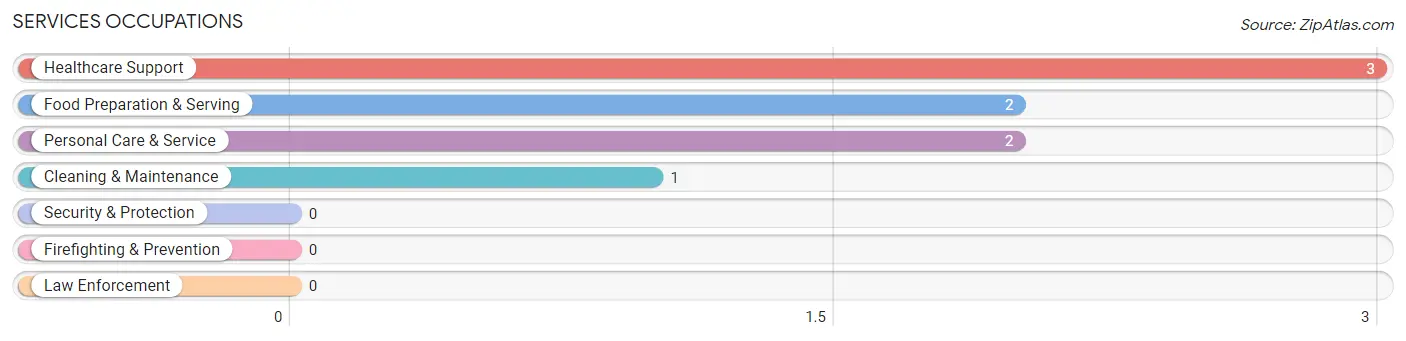
Services Occupations
The most common Services occupations in Summerville are Healthcare Support (3 | 5.1%), Food Preparation & Serving (2 | 3.4%), Personal Care & Service (2 | 3.4%), and Cleaning & Maintenance (1 | 1.7%).
Services Occupations by Sex
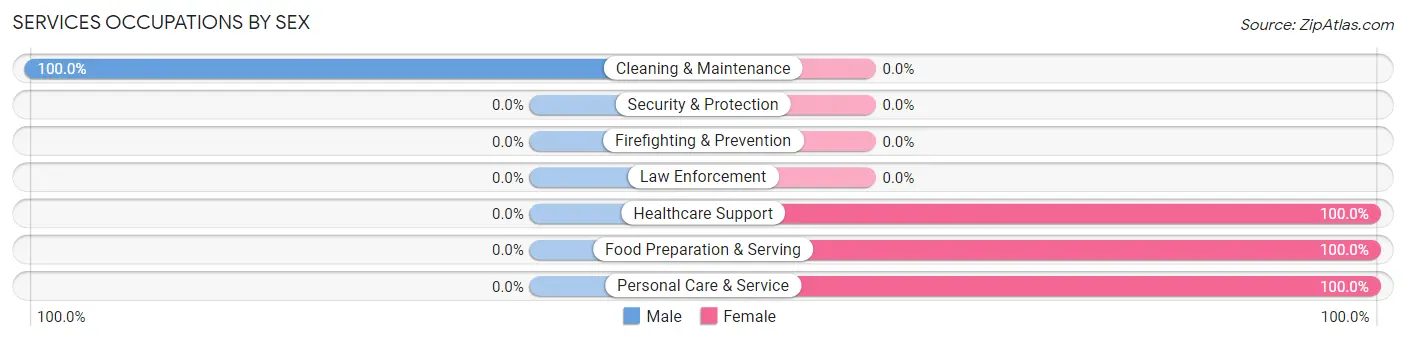
| Occupation | Male | Female |
| Healthcare Support | 0 (0.0%) | 3 (100.0%) |
| Security & Protection | 0 (0.0%) | 0 (0.0%) |
| Firefighting & Prevention | 0 (0.0%) | 0 (0.0%) |
| Law Enforcement | 0 (0.0%) | 0 (0.0%) |
| Food Preparation & Serving | 0 (0.0%) | 2 (100.0%) |
| Cleaning & Maintenance | 1 (100.0%) | 0 (0.0%) |
| Personal Care & Service | 0 (0.0%) | 2 (100.0%) |
| Total (Category) | 1 (12.5%) | 7 (87.5%) |
| Total (Overall) | 29 (49.1%) | 30 (50.8%) |
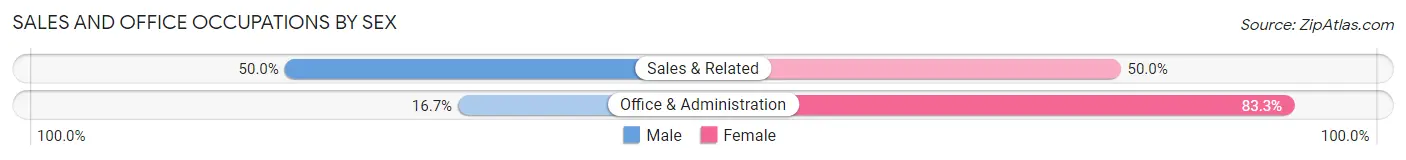
Sales and Office Occupations
The most common Sales and Office occupations in Summerville are Office & Administration (12 | 20.3%), and Sales & Related (2 | 3.4%).

Sales and Office Occupations by Sex
| Occupation | Male | Female |
| Sales & Related | 1 (50.0%) | 1 (50.0%) |
| Office & Administration | 2 (16.7%) | 10 (83.3%) |
| Total (Category) | 3 (21.4%) | 11 (78.6%) |
| Total (Overall) | 29 (49.1%) | 30 (50.8%) |
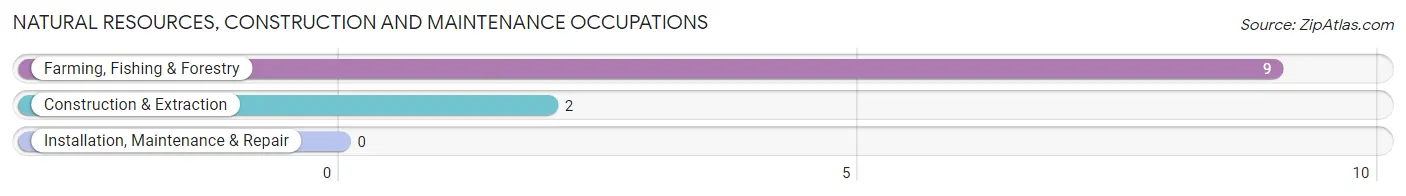
Natural Resources, Construction and Maintenance Occupations
The most common Natural Resources, Construction and Maintenance occupations in Summerville are Farming, Fishing & Forestry (9 | 15.2%), and Construction & Extraction (2 | 3.4%).
Natural Resources, Construction and Maintenance Occupations by Sex
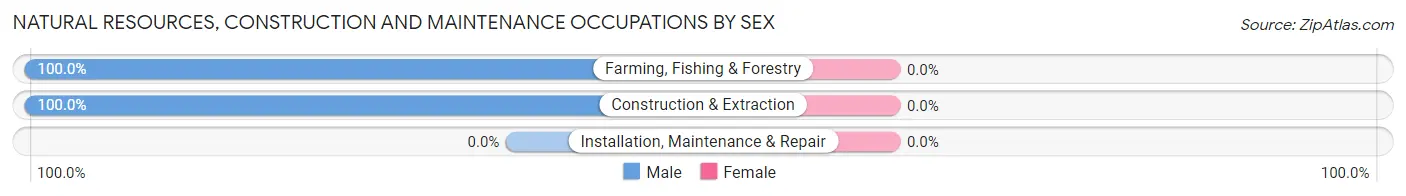
| Occupation | Male | Female |
| Farming, Fishing & Forestry | 9 (100.0%) | 0 (0.0%) |
| Construction & Extraction | 2 (100.0%) | 0 (0.0%) |
| Installation, Maintenance & Repair | 0 (0.0%) | 0 (0.0%) |
| Total (Category) | 11 (100.0%) | 0 (0.0%) |
| Total (Overall) | 29 (49.1%) | 30 (50.8%) |
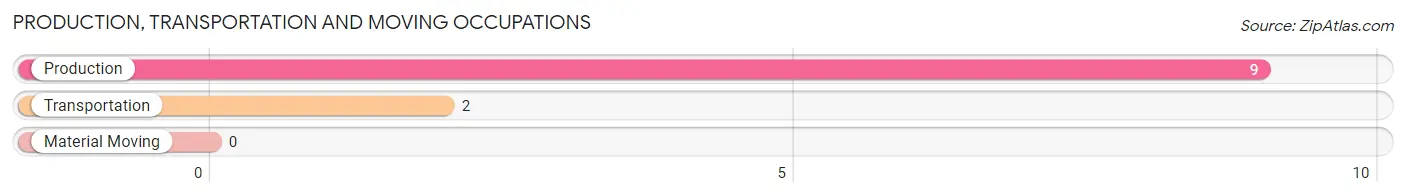
Production, Transportation and Moving Occupations
The most common Production, Transportation and Moving occupations in Summerville are Production (9 | 15.2%), and Transportation (2 | 3.4%).
Production, Transportation and Moving Occupations by Sex
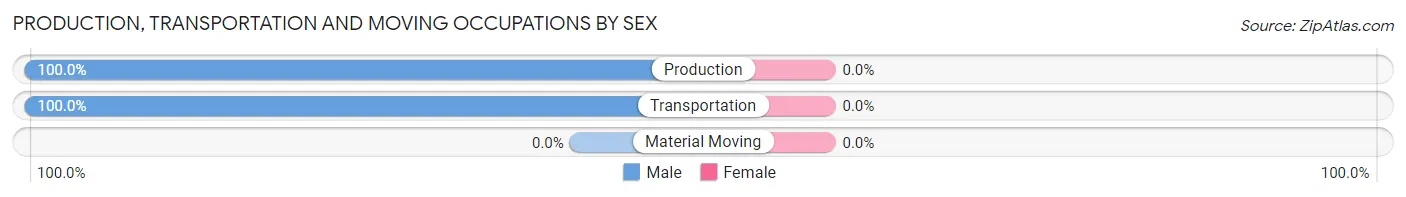
| Occupation | Male | Female |
| Production | 9 (100.0%) | 0 (0.0%) |
| Transportation | 2 (100.0%) | 0 (0.0%) |
| Material Moving | 0 (0.0%) | 0 (0.0%) |
| Total (Category) | 11 (100.0%) | 0 (0.0%) |
| Total (Overall) | 29 (49.1%) | 30 (50.8%) |
Employment Industries by Sex in Summerville
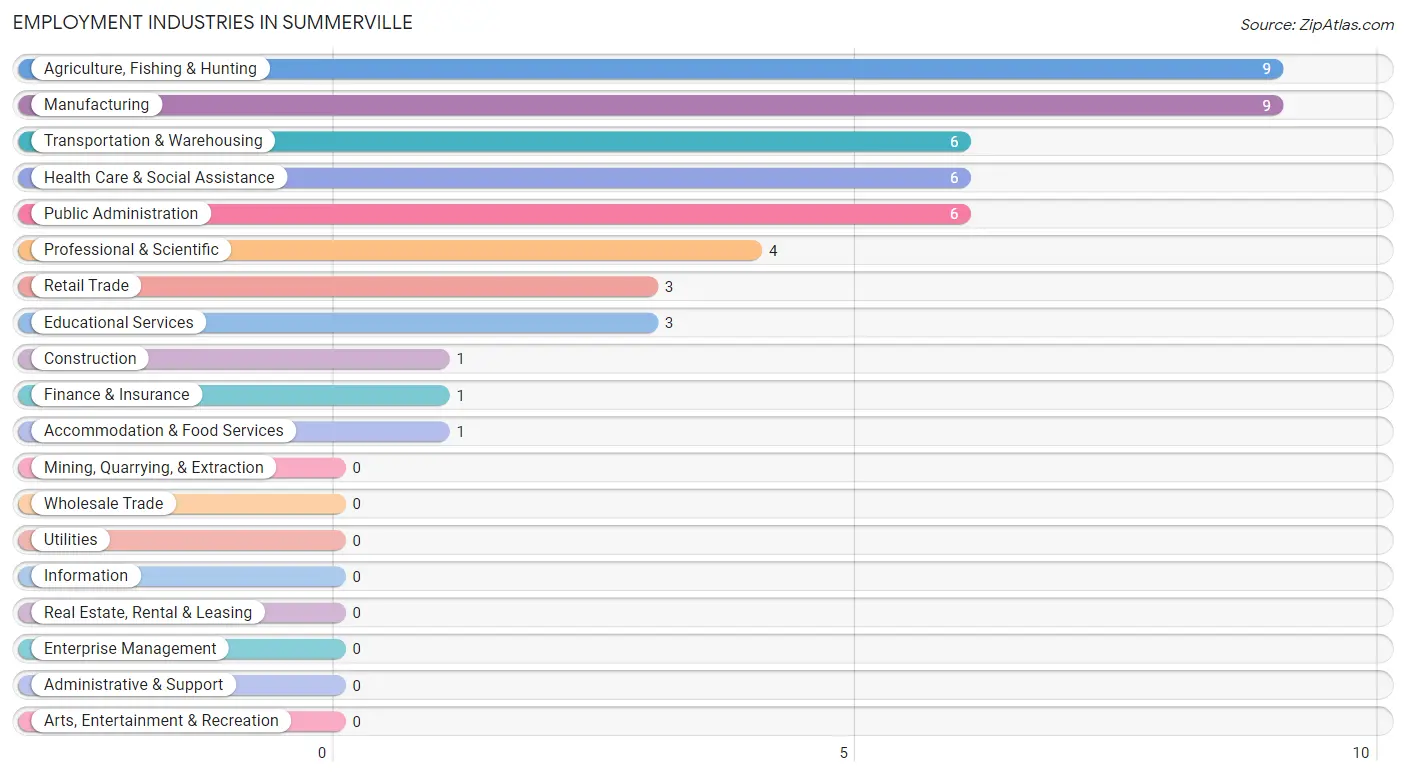
Employment Industries in Summerville
The major employment industries in Summerville include Agriculture, Fishing & Hunting (9 | 15.2%), Manufacturing (9 | 15.2%), Transportation & Warehousing (6 | 10.2%), Health Care & Social Assistance (6 | 10.2%), and Public Administration (6 | 10.2%).
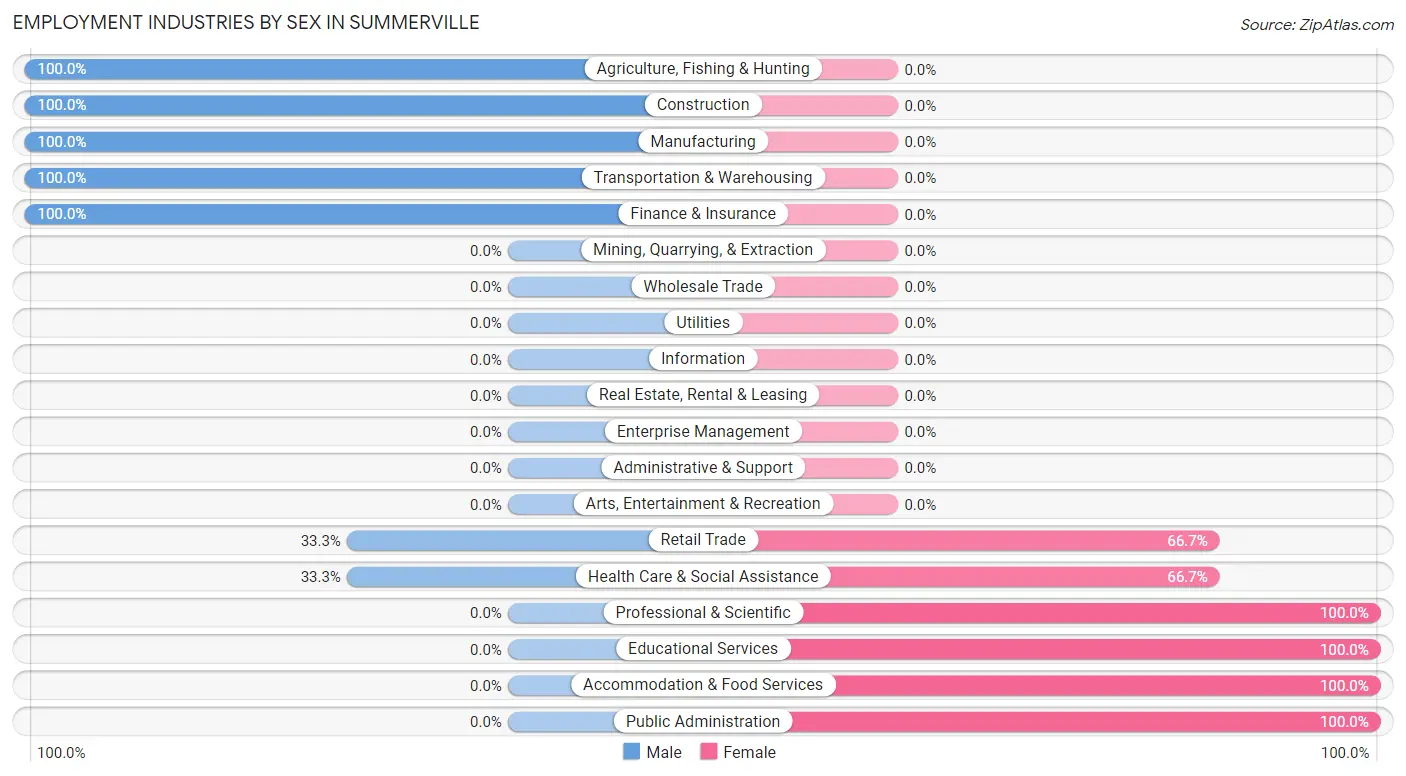
Employment Industries by Sex in Summerville
The Summerville industries that see more men than women are Agriculture, Fishing & Hunting (100.0%), Construction (100.0%), and Manufacturing (100.0%), whereas the industries that tend to have a higher number of women are Professional & Scientific (100.0%), Educational Services (100.0%), and Accommodation & Food Services (100.0%).
| Industry | Male | Female |
| Agriculture, Fishing & Hunting | 9 (100.0%) | 0 (0.0%) |
| Mining, Quarrying, & Extraction | 0 (0.0%) | 0 (0.0%) |
| Construction | 1 (100.0%) | 0 (0.0%) |
| Manufacturing | 9 (100.0%) | 0 (0.0%) |
| Wholesale Trade | 0 (0.0%) | 0 (0.0%) |
| Retail Trade | 1 (33.3%) | 2 (66.7%) |
| Transportation & Warehousing | 6 (100.0%) | 0 (0.0%) |
| Utilities | 0 (0.0%) | 0 (0.0%) |
| Information | 0 (0.0%) | 0 (0.0%) |
| Finance & Insurance | 1 (100.0%) | 0 (0.0%) |
| Real Estate, Rental & Leasing | 0 (0.0%) | 0 (0.0%) |
| Professional & Scientific | 0 (0.0%) | 4 (100.0%) |
| Enterprise Management | 0 (0.0%) | 0 (0.0%) |
| Administrative & Support | 0 (0.0%) | 0 (0.0%) |
| Educational Services | 0 (0.0%) | 3 (100.0%) |
| Health Care & Social Assistance | 2 (33.3%) | 4 (66.7%) |
| Arts, Entertainment & Recreation | 0 (0.0%) | 0 (0.0%) |
| Accommodation & Food Services | 0 (0.0%) | 1 (100.0%) |
| Public Administration | 0 (0.0%) | 6 (100.0%) |
| Total | 29 (49.1%) | 30 (50.8%) |
Education in Summerville
School Enrollment in Summerville
The most common levels of schooling among the 27 students in Summerville are elementary school (10 | 37.0%), middle school (7 | 25.9%), and college / undergraduate (6 | 22.2%).
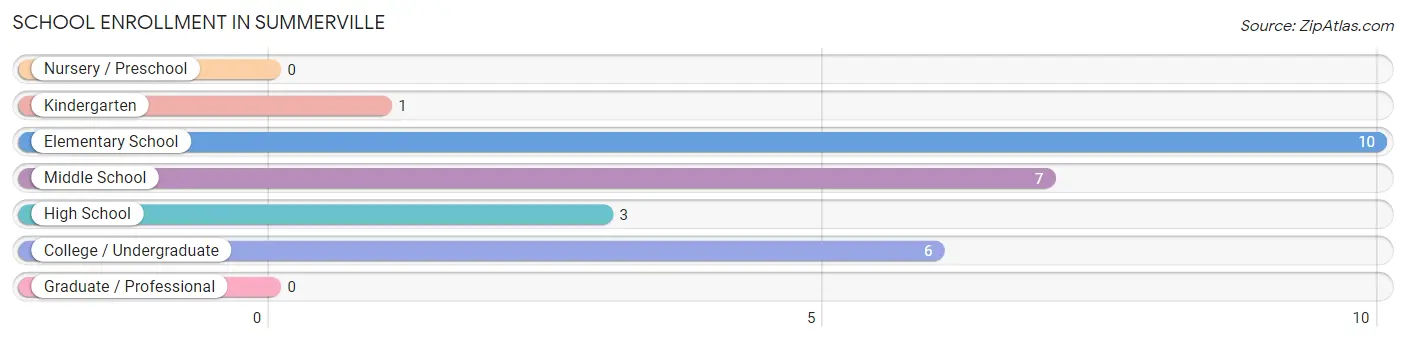
| School Level | # Students | % Students |
| Nursery / Preschool | 0 | 0.0% |
| Kindergarten | 1 | 3.7% |
| Elementary School | 10 | 37.0% |
| Middle School | 7 | 25.9% |
| High School | 3 | 11.1% |
| College / Undergraduate | 6 | 22.2% |
| Graduate / Professional | 0 | 0.0% |
| Total | 27 | 100.0% |
School Enrollment by Age by Funding Source in Summerville
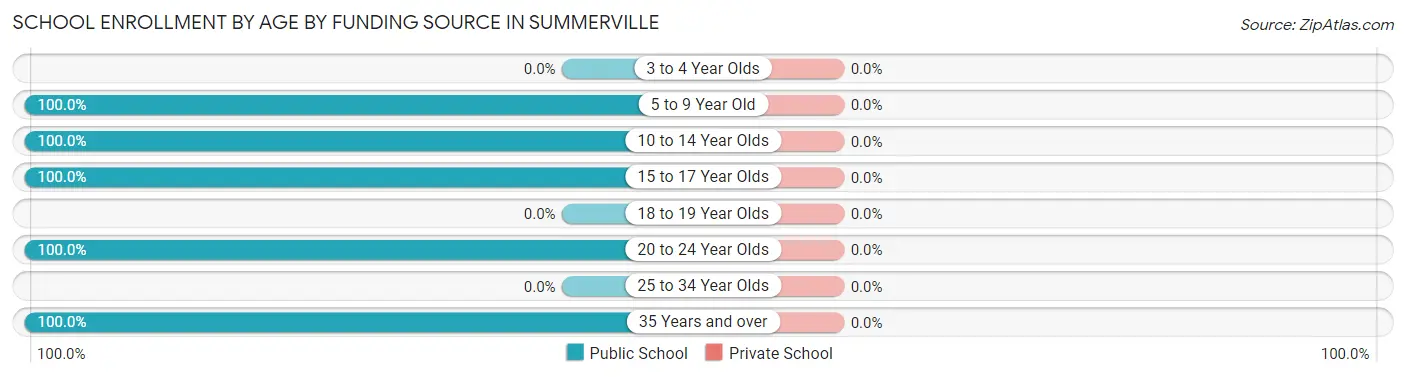
| Age Bracket | Public School | Private School |
| 3 to 4 Year Olds | 0 (0.0%) | 0 (0.0%) |
| 5 to 9 Year Old | 2 (100.0%) | 0 (0.0%) |
| 10 to 14 Year Olds | 16 (100.0%) | 0 (0.0%) |
| 15 to 17 Year Olds | 3 (100.0%) | 0 (0.0%) |
| 18 to 19 Year Olds | 0 (0.0%) | 0 (0.0%) |
| 20 to 24 Year Olds | 4 (100.0%) | 0 (0.0%) |
| 25 to 34 Year Olds | 0 (0.0%) | 0 (0.0%) |
| 35 Years and over | 2 (100.0%) | 0 (0.0%) |
| Total | 27 (100.0%) | 0 (0.0%) |
Educational Attainment by Field of Study in Summerville
Social sciences (9 | 30.0%), bio, nature & agricultural (8 | 26.7%), education (6 | 20.0%), literature & languages (5 | 16.7%), and science & technology (1 | 3.3%) are the most common fields of study among 30 individuals in Summerville who have obtained a bachelor's degree or higher.
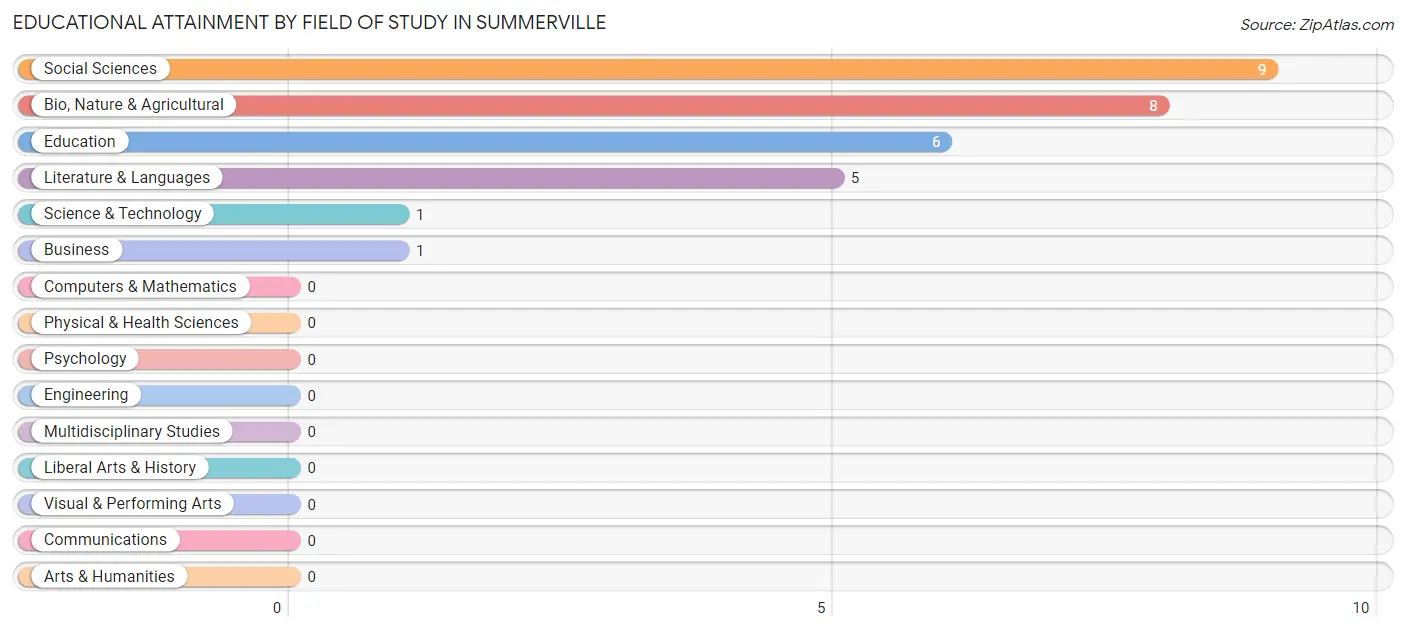
| Field of Study | # Graduates | % Graduates |
| Computers & Mathematics | 0 | 0.0% |
| Bio, Nature & Agricultural | 8 | 26.7% |
| Physical & Health Sciences | 0 | 0.0% |
| Psychology | 0 | 0.0% |
| Social Sciences | 9 | 30.0% |
| Engineering | 0 | 0.0% |
| Multidisciplinary Studies | 0 | 0.0% |
| Science & Technology | 1 | 3.3% |
| Business | 1 | 3.3% |
| Education | 6 | 20.0% |
| Literature & Languages | 5 | 16.7% |
| Liberal Arts & History | 0 | 0.0% |
| Visual & Performing Arts | 0 | 0.0% |
| Communications | 0 | 0.0% |
| Arts & Humanities | 0 | 0.0% |
| Total | 30 | 100.0% |
Transportation & Commute in Summerville
Vehicle Availability by Sex in Summerville
The most prevalent vehicle ownership categories in Summerville are males with 5 or more vehicles (13, accounting for 44.8%) and females with 5 or more vehicles (13, making up 43.3%).
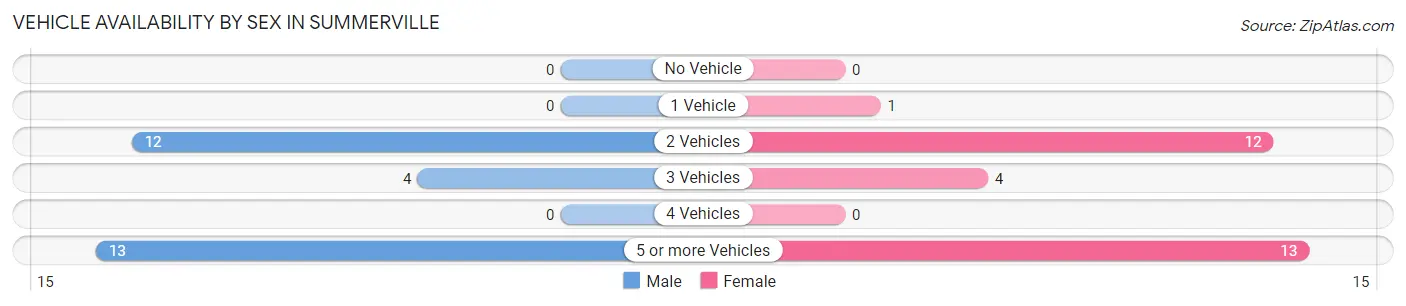
| Vehicles Available | Male | Female |
| No Vehicle | 0 (0.0%) | 0 (0.0%) |
| 1 Vehicle | 0 (0.0%) | 1 (3.3%) |
| 2 Vehicles | 12 (41.4%) | 12 (40.0%) |
| 3 Vehicles | 4 (13.8%) | 4 (13.3%) |
| 4 Vehicles | 0 (0.0%) | 0 (0.0%) |
| 5 or more Vehicles | 13 (44.8%) | 13 (43.3%) |
| Total | 29 (100.0%) | 30 (100.0%) |
Commute Time in Summerville
The most frequently occuring commute durations in Summerville are 20 to 24 minutes (23 commuters, 39.0%), 15 to 19 minutes (9 commuters, 15.2%), and 25 to 29 minutes (9 commuters, 15.2%).
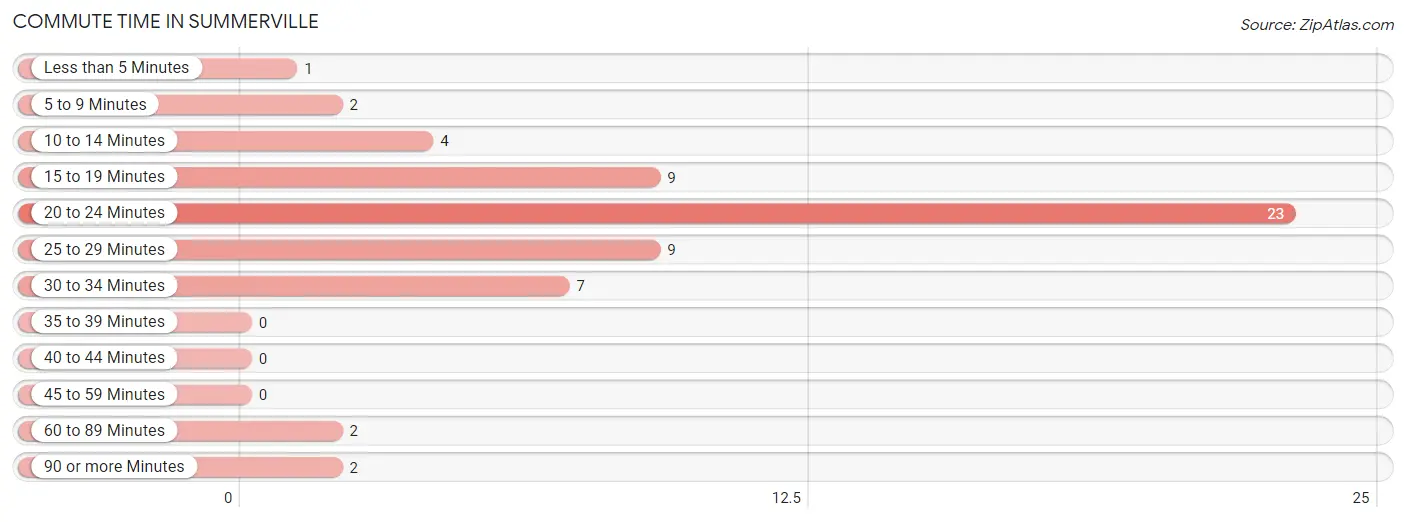
| Commute Time | # Commuters | % Commuters |
| Less than 5 Minutes | 1 | 1.7% |
| 5 to 9 Minutes | 2 | 3.4% |
| 10 to 14 Minutes | 4 | 6.8% |
| 15 to 19 Minutes | 9 | 15.2% |
| 20 to 24 Minutes | 23 | 39.0% |
| 25 to 29 Minutes | 9 | 15.2% |
| 30 to 34 Minutes | 7 | 11.9% |
| 35 to 39 Minutes | 0 | 0.0% |
| 40 to 44 Minutes | 0 | 0.0% |
| 45 to 59 Minutes | 0 | 0.0% |
| 60 to 89 Minutes | 2 | 3.4% |
| 90 or more Minutes | 2 | 3.4% |
Commute Time by Sex in Summerville
The most common commute times in Summerville are 20 to 24 minutes (9 commuters, 31.0%) for males and 20 to 24 minutes (14 commuters, 46.7%) for females.
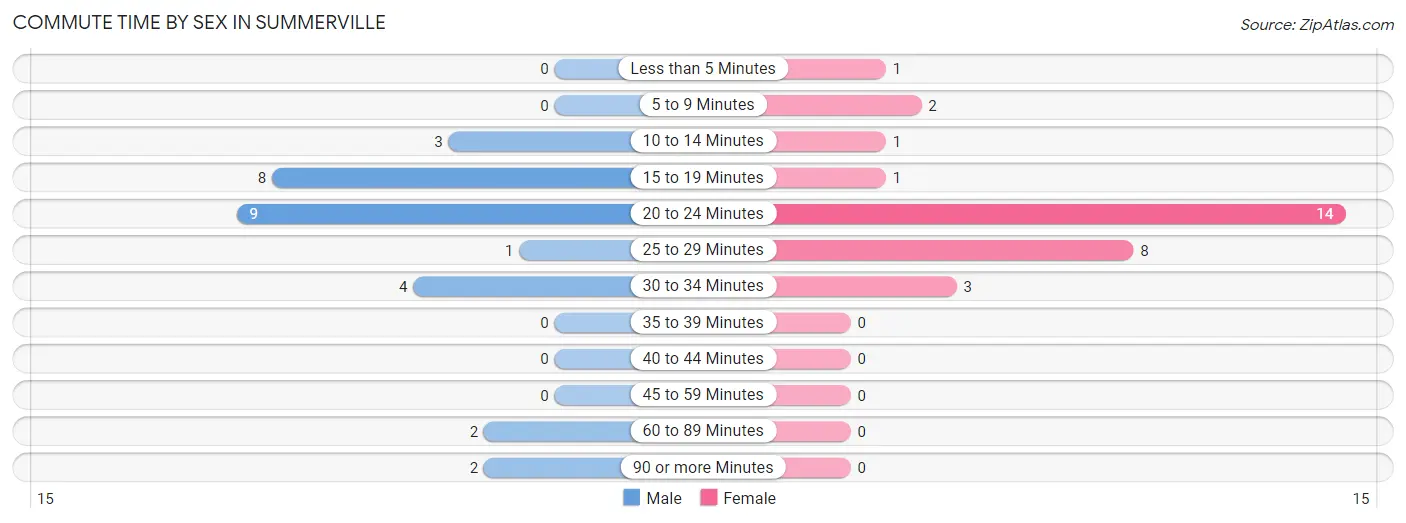
| Commute Time | Male | Female |
| Less than 5 Minutes | 0 (0.0%) | 1 (3.3%) |
| 5 to 9 Minutes | 0 (0.0%) | 2 (6.7%) |
| 10 to 14 Minutes | 3 (10.3%) | 1 (3.3%) |
| 15 to 19 Minutes | 8 (27.6%) | 1 (3.3%) |
| 20 to 24 Minutes | 9 (31.0%) | 14 (46.7%) |
| 25 to 29 Minutes | 1 (3.5%) | 8 (26.7%) |
| 30 to 34 Minutes | 4 (13.8%) | 3 (10.0%) |
| 35 to 39 Minutes | 0 (0.0%) | 0 (0.0%) |
| 40 to 44 Minutes | 0 (0.0%) | 0 (0.0%) |
| 45 to 59 Minutes | 0 (0.0%) | 0 (0.0%) |
| 60 to 89 Minutes | 2 (6.9%) | 0 (0.0%) |
| 90 or more Minutes | 2 (6.9%) | 0 (0.0%) |
Time of Departure to Work by Sex in Summerville
The most frequent times of departure to work in Summerville are 8:00 AM to 8:29 AM (7, 24.1%) for males and 7:30 AM to 7:59 AM (8, 26.7%) for females.
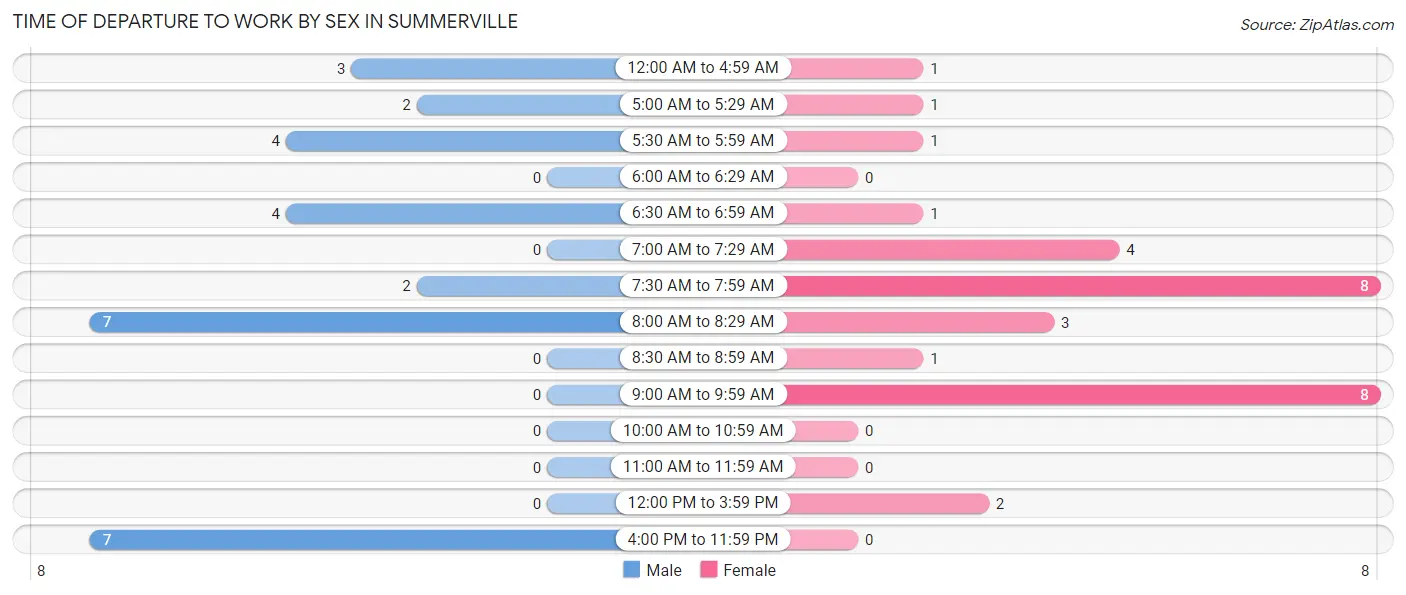
| Time of Departure | Male | Female |
| 12:00 AM to 4:59 AM | 3 (10.3%) | 1 (3.3%) |
| 5:00 AM to 5:29 AM | 2 (6.9%) | 1 (3.3%) |
| 5:30 AM to 5:59 AM | 4 (13.8%) | 1 (3.3%) |
| 6:00 AM to 6:29 AM | 0 (0.0%) | 0 (0.0%) |
| 6:30 AM to 6:59 AM | 4 (13.8%) | 1 (3.3%) |
| 7:00 AM to 7:29 AM | 0 (0.0%) | 4 (13.3%) |
| 7:30 AM to 7:59 AM | 2 (6.9%) | 8 (26.7%) |
| 8:00 AM to 8:29 AM | 7 (24.1%) | 3 (10.0%) |
| 8:30 AM to 8:59 AM | 0 (0.0%) | 1 (3.3%) |
| 9:00 AM to 9:59 AM | 0 (0.0%) | 8 (26.7%) |
| 10:00 AM to 10:59 AM | 0 (0.0%) | 0 (0.0%) |
| 11:00 AM to 11:59 AM | 0 (0.0%) | 0 (0.0%) |
| 12:00 PM to 3:59 PM | 0 (0.0%) | 2 (6.7%) |
| 4:00 PM to 11:59 PM | 7 (24.1%) | 0 (0.0%) |
| Total | 29 (100.0%) | 30 (100.0%) |
Housing Occupancy in Summerville
Occupancy by Ownership in Summerville
Of the total 47 dwellings in Summerville, owner-occupied units account for 47 (100.0%), while renter-occupied units make up 0 (0.0%).
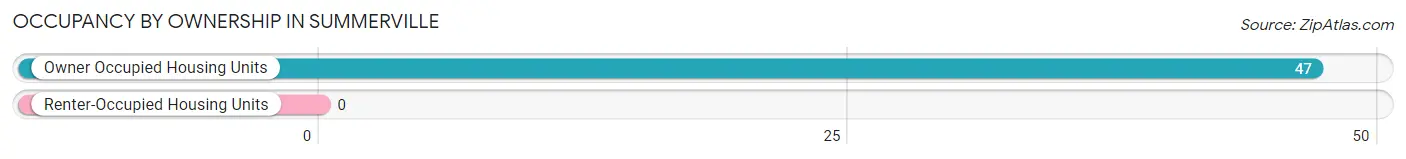
| Occupancy | # Housing Units | % Housing Units |
| Owner Occupied Housing Units | 47 | 100.0% |
| Renter-Occupied Housing Units | 0 | 0.0% |
| Total Occupied Housing Units | 47 | 100.0% |
Occupancy by Household Size in Summerville
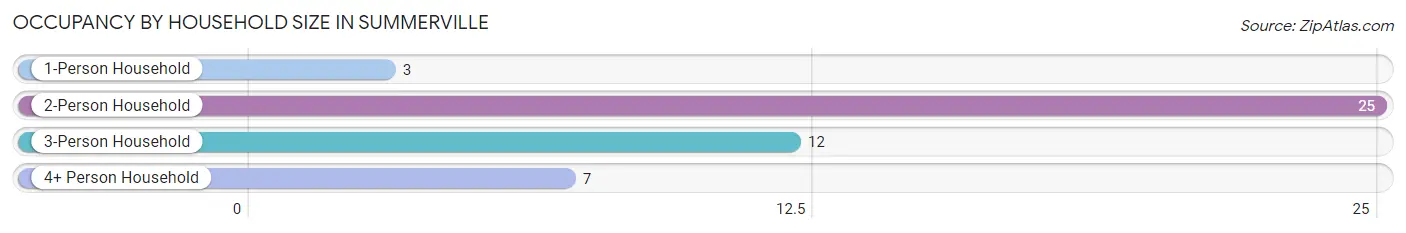
| Household Size | # Housing Units | % Housing Units |
| 1-Person Household | 3 | 6.4% |
| 2-Person Household | 25 | 53.2% |
| 3-Person Household | 12 | 25.5% |
| 4+ Person Household | 7 | 14.9% |
| Total Housing Units | 47 | 100.0% |
Occupancy by Ownership by Household Size in Summerville
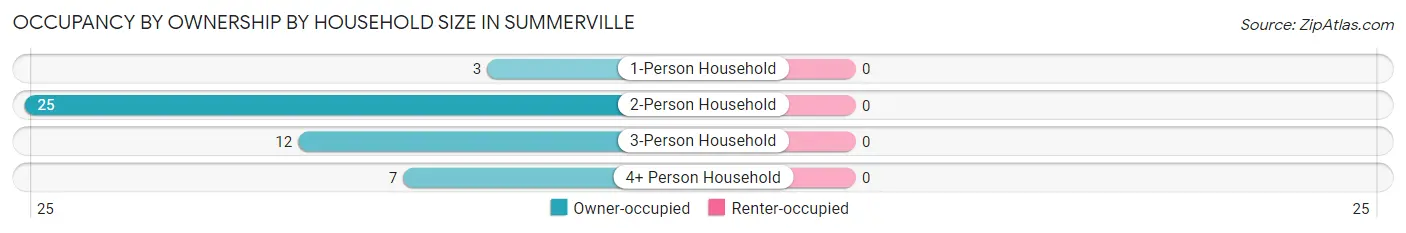
| Household Size | Owner-occupied | Renter-occupied |
| 1-Person Household | 3 (100.0%) | 0 (0.0%) |
| 2-Person Household | 25 (100.0%) | 0 (0.0%) |
| 3-Person Household | 12 (100.0%) | 0 (0.0%) |
| 4+ Person Household | 7 (100.0%) | 0 (0.0%) |
| Total Housing Units | 47 (100.0%) | 0 (0.0%) |
Occupancy by Educational Attainment in Summerville
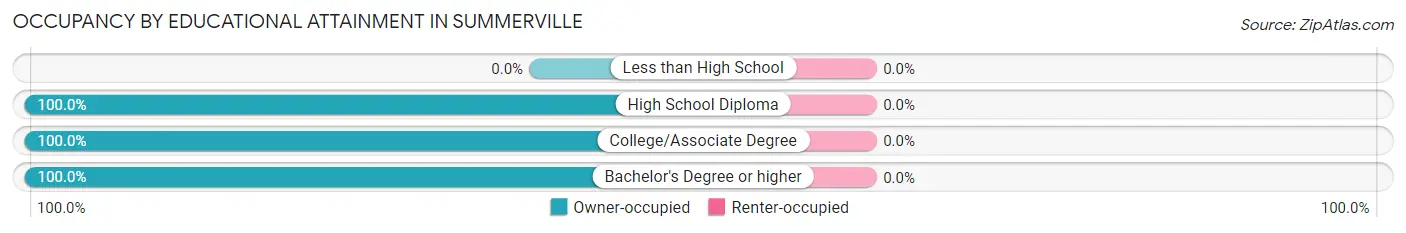
| Household Size | Owner-occupied | Renter-occupied |
| Less than High School | 0 (0.0%) | 0 (0.0%) |
| High School Diploma | 14 (100.0%) | 0 (0.0%) |
| College/Associate Degree | 12 (100.0%) | 0 (0.0%) |
| Bachelor's Degree or higher | 21 (100.0%) | 0 (0.0%) |
Occupancy by Age of Householder in Summerville
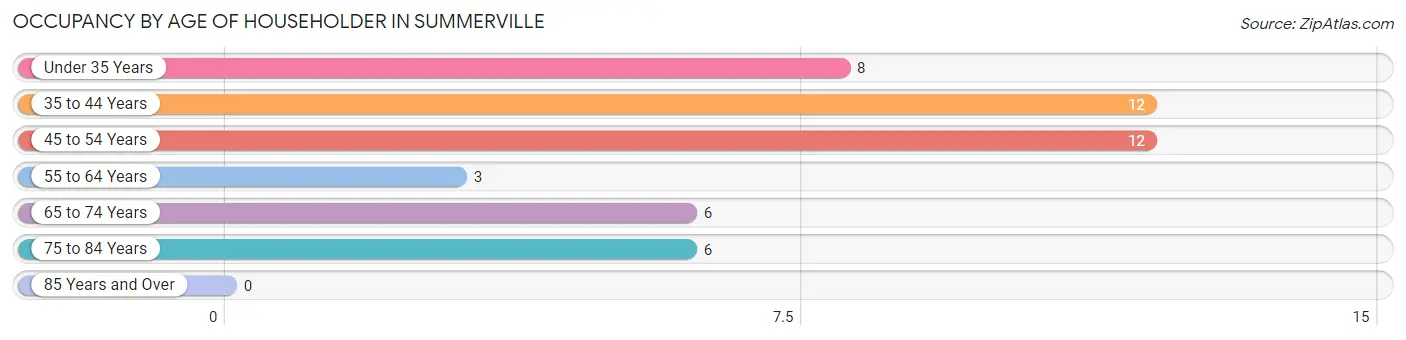
| Age Bracket | # Households | % Households |
| Under 35 Years | 8 | 17.0% |
| 35 to 44 Years | 12 | 25.5% |
| 45 to 54 Years | 12 | 25.5% |
| 55 to 64 Years | 3 | 6.4% |
| 65 to 74 Years | 6 | 12.8% |
| 75 to 84 Years | 6 | 12.8% |
| 85 Years and Over | 0 | 0.0% |
| Total | 47 | 100.0% |
Housing Finances in Summerville
Median Income by Occupancy in Summerville
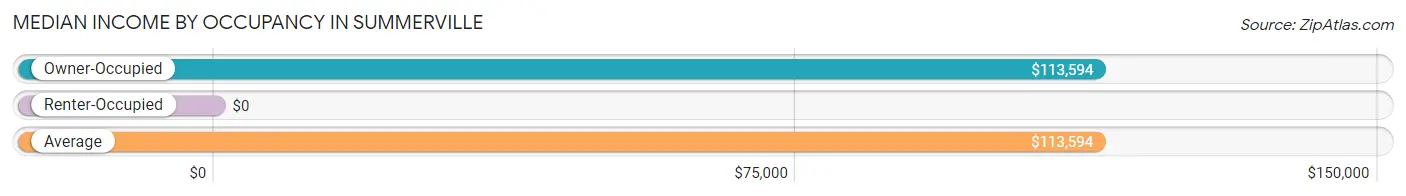
| Occupancy Type | # Households | Median Income |
| Owner-Occupied | 47 (100.0%) | $113,594 |
| Renter-Occupied | 0 (0.0%) | $0 |
| Average | 47 (100.0%) | $113,594 |
Occupancy by Householder Income Bracket in Summerville
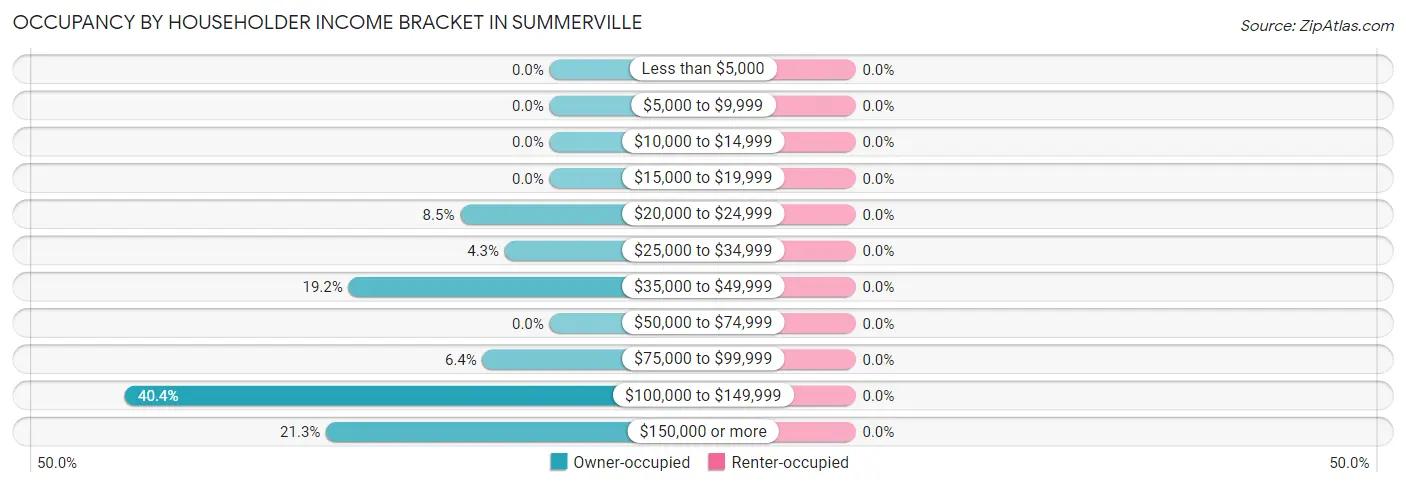
| Income Bracket | Owner-occupied | Renter-occupied |
| Less than $5,000 | 0 (0.0%) | 0 (0.0%) |
| $5,000 to $9,999 | 0 (0.0%) | 0 (0.0%) |
| $10,000 to $14,999 | 0 (0.0%) | 0 (0.0%) |
| $15,000 to $19,999 | 0 (0.0%) | 0 (0.0%) |
| $20,000 to $24,999 | 4 (8.5%) | 0 (0.0%) |
| $25,000 to $34,999 | 2 (4.3%) | 0 (0.0%) |
| $35,000 to $49,999 | 9 (19.2%) | 0 (0.0%) |
| $50,000 to $74,999 | 0 (0.0%) | 0 (0.0%) |
| $75,000 to $99,999 | 3 (6.4%) | 0 (0.0%) |
| $100,000 to $149,999 | 19 (40.4%) | 0 (0.0%) |
| $150,000 or more | 10 (21.3%) | 0 (0.0%) |
| Total | 47 (100.0%) | 0 (0.0%) |
Monthly Housing Cost Tiers in Summerville
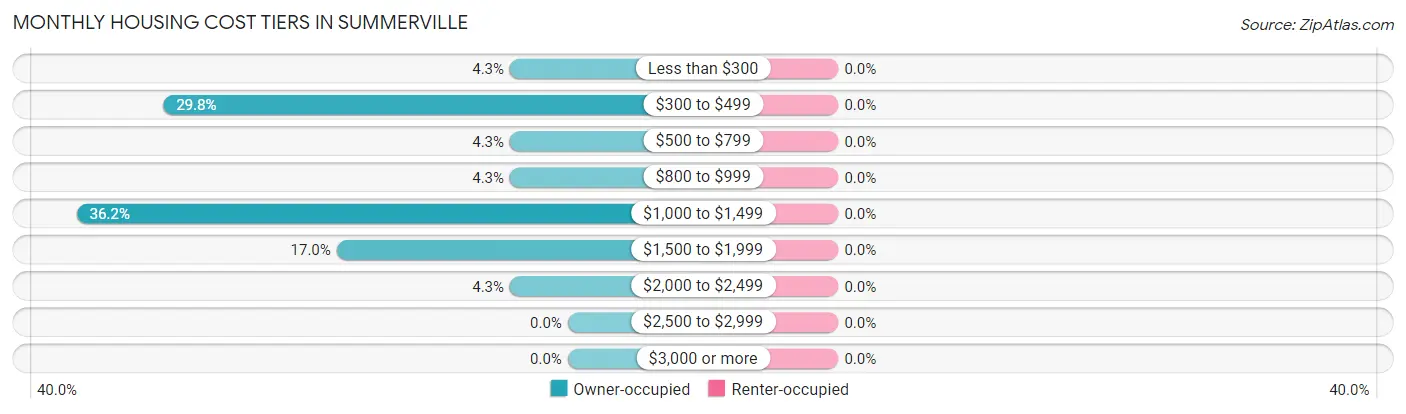
| Monthly Cost | Owner-occupied | Renter-occupied |
| Less than $300 | 2 (4.3%) | 0 (0.0%) |
| $300 to $499 | 14 (29.8%) | 0 (0.0%) |
| $500 to $799 | 2 (4.3%) | 0 (0.0%) |
| $800 to $999 | 2 (4.3%) | 0 (0.0%) |
| $1,000 to $1,499 | 17 (36.2%) | 0 (0.0%) |
| $1,500 to $1,999 | 8 (17.0%) | 0 (0.0%) |
| $2,000 to $2,499 | 2 (4.3%) | 0 (0.0%) |
| $2,500 to $2,999 | 0 (0.0%) | 0 (0.0%) |
| $3,000 or more | 0 (0.0%) | 0 (0.0%) |
| Total | 47 (100.0%) | 0 (0.0%) |
Physical Housing Characteristics in Summerville
Housing Structures in Summerville
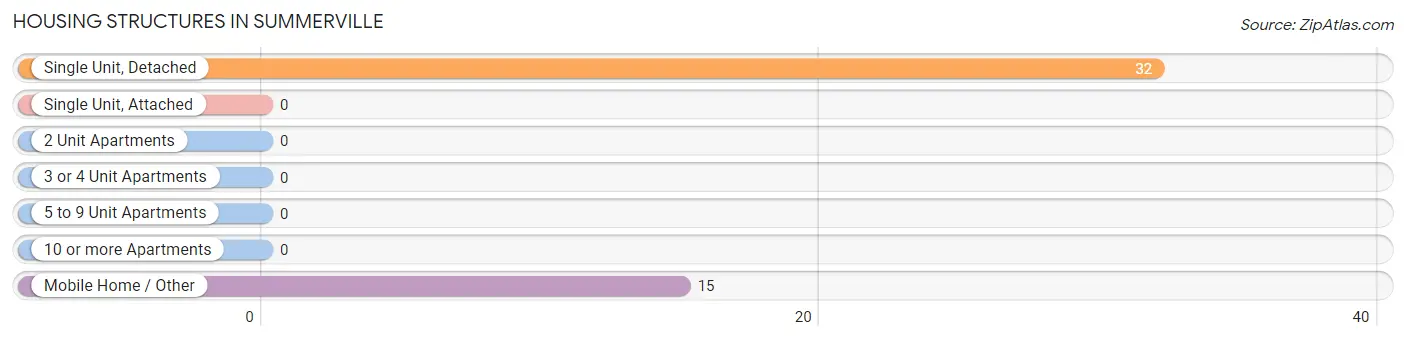
| Structure Type | # Housing Units | % Housing Units |
| Single Unit, Detached | 32 | 68.1% |
| Single Unit, Attached | 0 | 0.0% |
| 2 Unit Apartments | 0 | 0.0% |
| 3 or 4 Unit Apartments | 0 | 0.0% |
| 5 to 9 Unit Apartments | 0 | 0.0% |
| 10 or more Apartments | 0 | 0.0% |
| Mobile Home / Other | 15 | 31.9% |
| Total | 47 | 100.0% |
Housing Structures by Occupancy in Summerville
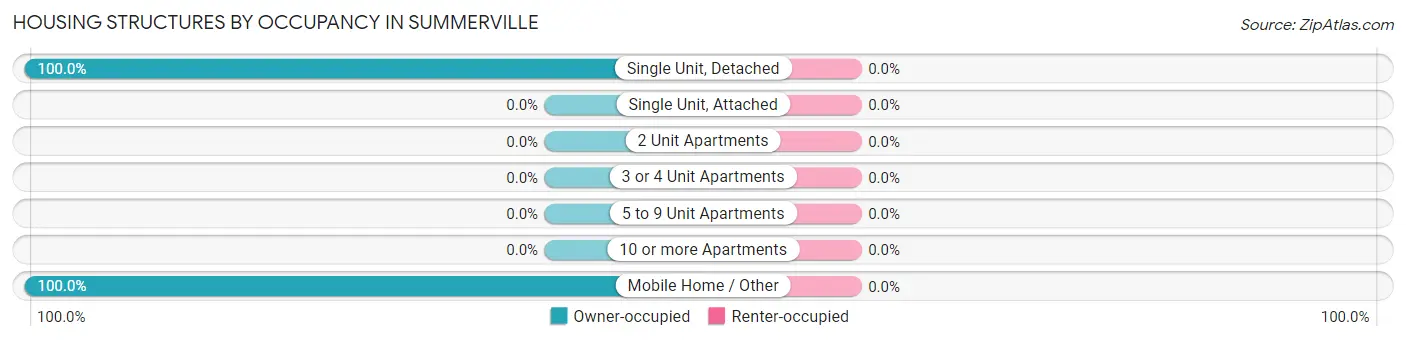
| Structure Type | Owner-occupied | Renter-occupied |
| Single Unit, Detached | 32 (100.0%) | 0 (0.0%) |
| Single Unit, Attached | 0 (0.0%) | 0 (0.0%) |
| 2 Unit Apartments | 0 (0.0%) | 0 (0.0%) |
| 3 or 4 Unit Apartments | 0 (0.0%) | 0 (0.0%) |
| 5 to 9 Unit Apartments | 0 (0.0%) | 0 (0.0%) |
| 10 or more Apartments | 0 (0.0%) | 0 (0.0%) |
| Mobile Home / Other | 15 (100.0%) | 0 (0.0%) |
| Total | 47 (100.0%) | 0 (0.0%) |
Housing Structures by Number of Rooms in Summerville
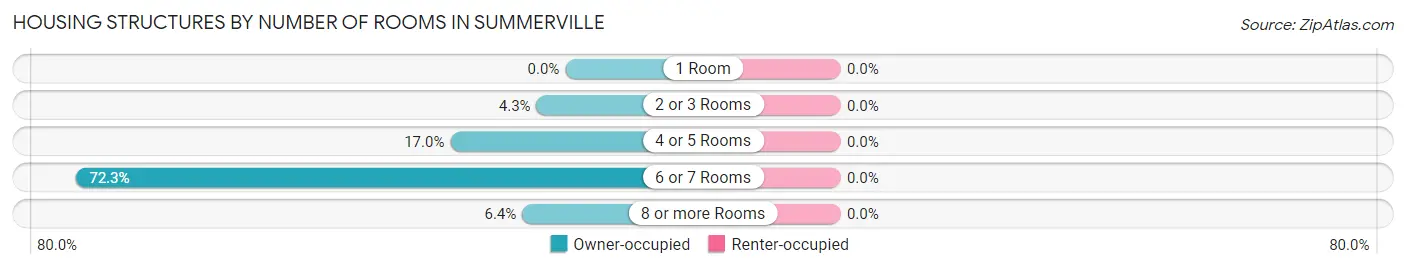
| Number of Rooms | Owner-occupied | Renter-occupied |
| 1 Room | 0 (0.0%) | 0 (0.0%) |
| 2 or 3 Rooms | 2 (4.3%) | 0 (0.0%) |
| 4 or 5 Rooms | 8 (17.0%) | 0 (0.0%) |
| 6 or 7 Rooms | 34 (72.3%) | 0 (0.0%) |
| 8 or more Rooms | 3 (6.4%) | 0 (0.0%) |
| Total | 47 (100.0%) | 0 (0.0%) |
Housing Structure by Heating Type in Summerville
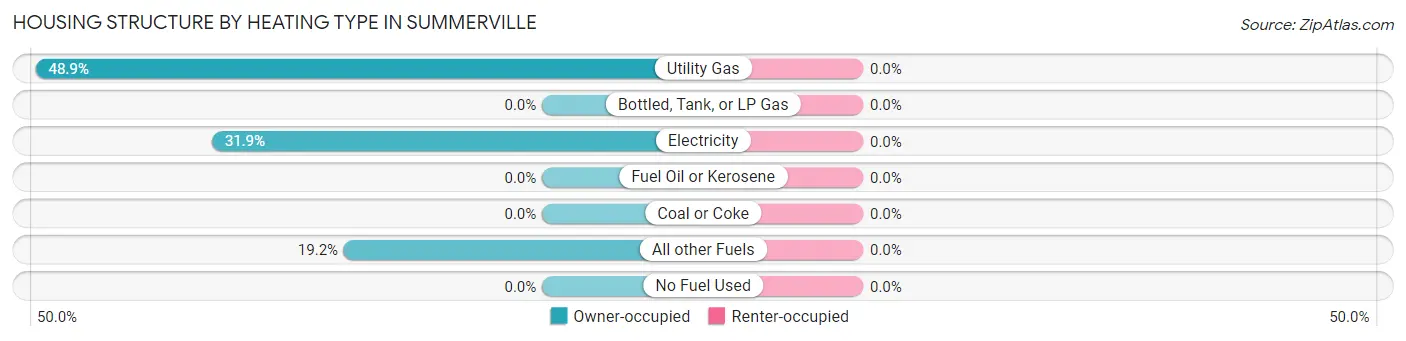
| Heating Type | Owner-occupied | Renter-occupied |
| Utility Gas | 23 (48.9%) | 0 (0.0%) |
| Bottled, Tank, or LP Gas | 0 (0.0%) | 0 (0.0%) |
| Electricity | 15 (31.9%) | 0 (0.0%) |
| Fuel Oil or Kerosene | 0 (0.0%) | 0 (0.0%) |
| Coal or Coke | 0 (0.0%) | 0 (0.0%) |
| All other Fuels | 9 (19.2%) | 0 (0.0%) |
| No Fuel Used | 0 (0.0%) | 0 (0.0%) |
| Total | 47 (100.0%) | 0 (0.0%) |
Household Vehicle Usage in Summerville
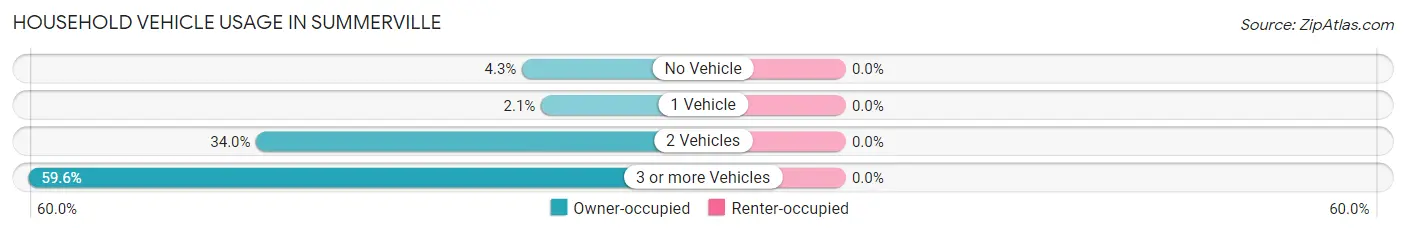
| Vehicles per Household | Owner-occupied | Renter-occupied |
| No Vehicle | 2 (4.3%) | 0 (0.0%) |
| 1 Vehicle | 1 (2.1%) | 0 (0.0%) |
| 2 Vehicles | 16 (34.0%) | 0 (0.0%) |
| 3 or more Vehicles | 28 (59.6%) | 0 (0.0%) |
| Total | 47 (100.0%) | 0 (0.0%) |
Real Estate & Mortgages in Summerville
Real Estate and Mortgage Overview in Summerville
| Characteristic | Without Mortgage | With Mortgage |
| Housing Units | 17 | 30 |
| Median Property Value | $254,200 | $0 |
| Median Household Income | $124,063 | $3 |
| Monthly Housing Costs | $378 | $0 |
| Real Estate Taxes | $1,771 | $0 |
Property Value by Mortgage Status in Summerville
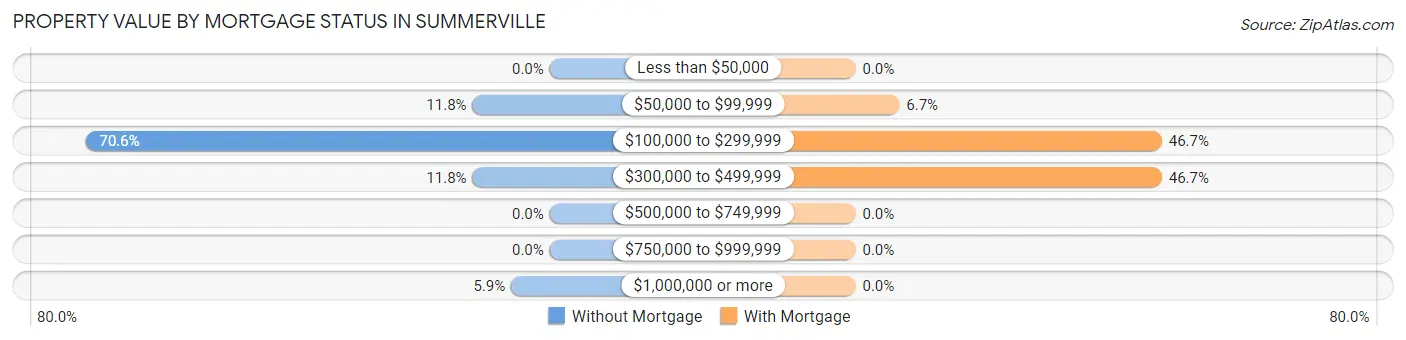
| Property Value | Without Mortgage | With Mortgage |
| Less than $50,000 | 0 (0.0%) | 0 (0.0%) |
| $50,000 to $99,999 | 2 (11.8%) | 2 (6.7%) |
| $100,000 to $299,999 | 12 (70.6%) | 14 (46.7%) |
| $300,000 to $499,999 | 2 (11.8%) | 14 (46.7%) |
| $500,000 to $749,999 | 0 (0.0%) | 0 (0.0%) |
| $750,000 to $999,999 | 0 (0.0%) | 0 (0.0%) |
| $1,000,000 or more | 1 (5.9%) | 0 (0.0%) |
| Total | 17 (100.0%) | 30 (100.0%) |
Household Income by Mortgage Status in Summerville
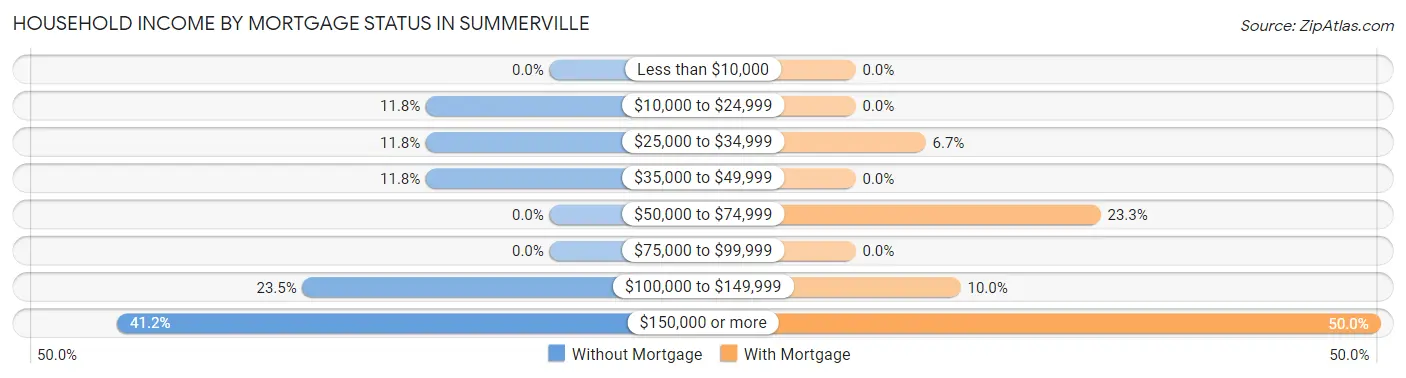
| Household Income | Without Mortgage | With Mortgage |
| Less than $10,000 | 0 (0.0%) | 0 (0.0%) |
| $10,000 to $24,999 | 2 (11.8%) | 0 (0.0%) |
| $25,000 to $34,999 | 2 (11.8%) | 2 (6.7%) |
| $35,000 to $49,999 | 2 (11.8%) | 0 (0.0%) |
| $50,000 to $74,999 | 0 (0.0%) | 7 (23.3%) |
| $75,000 to $99,999 | 0 (0.0%) | 0 (0.0%) |
| $100,000 to $149,999 | 4 (23.5%) | 3 (10.0%) |
| $150,000 or more | 7 (41.2%) | 15 (50.0%) |
| Total | 17 (100.0%) | 30 (100.0%) |
Property Value to Household Income Ratio in Summerville
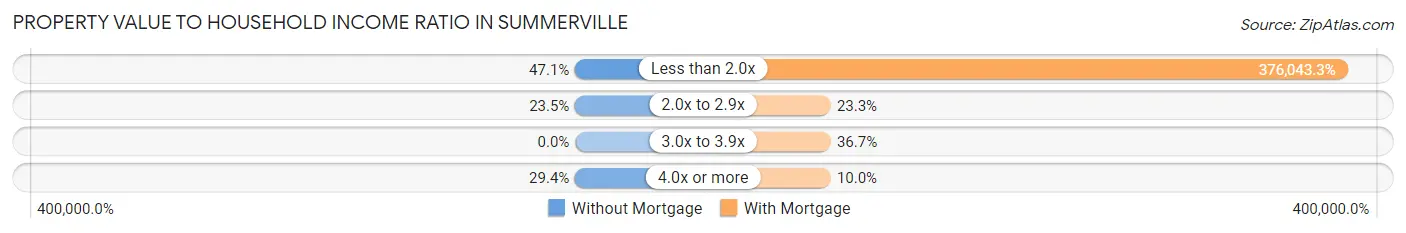
| Value-to-Income Ratio | Without Mortgage | With Mortgage |
| Less than 2.0x | 8 (47.1%) | 112,813 (376,043.3%) |
| 2.0x to 2.9x | 4 (23.5%) | 7 (23.3%) |
| 3.0x to 3.9x | 0 (0.0%) | 11 (36.7%) |
| 4.0x or more | 5 (29.4%) | 3 (10.0%) |
| Total | 17 (100.0%) | 30 (100.0%) |
Real Estate Taxes by Mortgage Status in Summerville
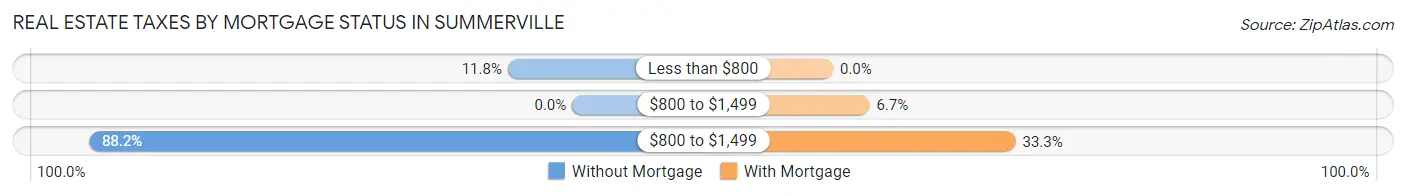
| Property Taxes | Without Mortgage | With Mortgage |
| Less than $800 | 2 (11.8%) | 0 (0.0%) |
| $800 to $1,499 | 0 (0.0%) | 2 (6.7%) |
| $800 to $1,499 | 15 (88.2%) | 10 (33.3%) |
| Total | 17 (100.0%) | 30 (100.0%) |
Health & Disability in Summerville
Health Insurance Coverage by Age in Summerville
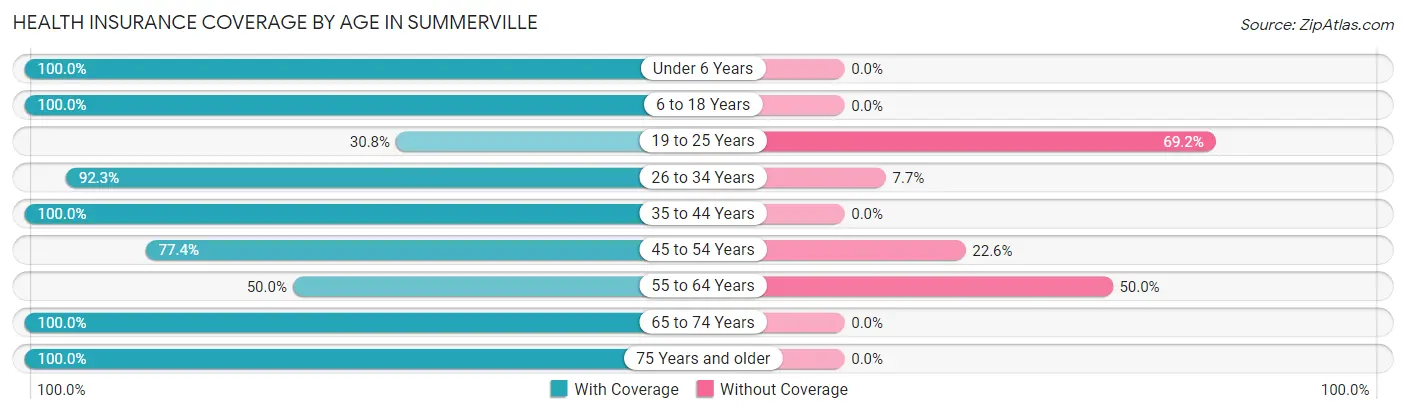
| Age Bracket | With Coverage | Without Coverage |
| Under 6 Years | 1 (100.0%) | 0 (0.0%) |
| 6 to 18 Years | 20 (100.0%) | 0 (0.0%) |
| 19 to 25 Years | 4 (30.8%) | 9 (69.2%) |
| 26 to 34 Years | 12 (92.3%) | 1 (7.7%) |
| 35 to 44 Years | 26 (100.0%) | 0 (0.0%) |
| 45 to 54 Years | 24 (77.4%) | 7 (22.6%) |
| 55 to 64 Years | 2 (50.0%) | 2 (50.0%) |
| 65 to 74 Years | 16 (100.0%) | 0 (0.0%) |
| 75 Years and older | 6 (100.0%) | 0 (0.0%) |
| Total | 111 (85.4%) | 19 (14.6%) |
Health Insurance Coverage by Citizenship Status in Summerville
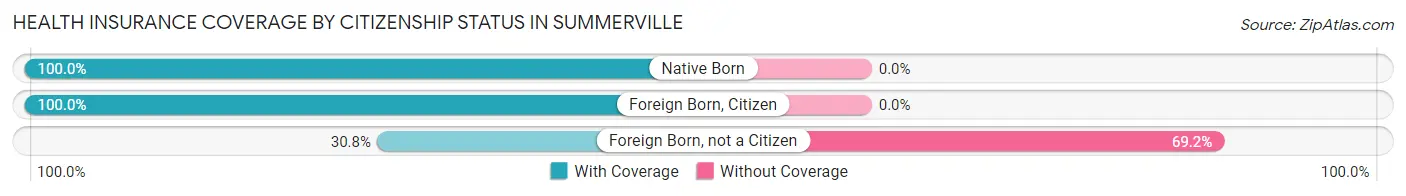
| Citizenship Status | With Coverage | Without Coverage |
| Native Born | 1 (100.0%) | 0 (0.0%) |
| Foreign Born, Citizen | 20 (100.0%) | 0 (0.0%) |
| Foreign Born, not a Citizen | 4 (30.8%) | 9 (69.2%) |
Health Insurance Coverage by Household Income in Summerville
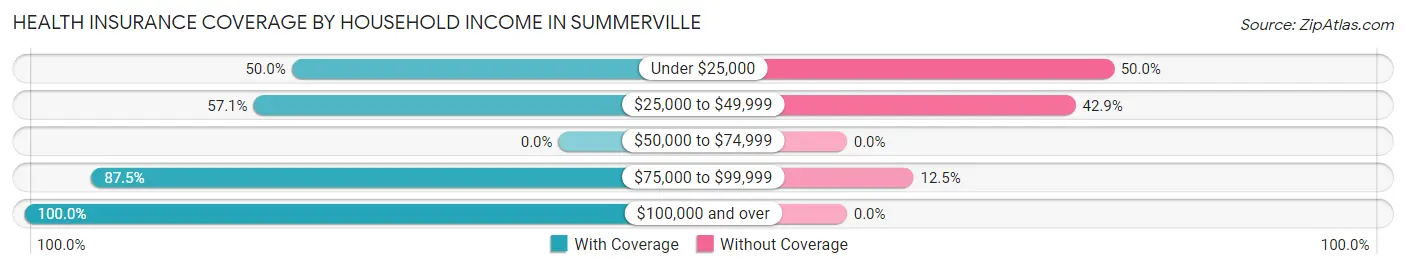
| Household Income | With Coverage | Without Coverage |
| Under $25,000 | 9 (50.0%) | 9 (50.0%) |
| $25,000 to $49,999 | 12 (57.1%) | 9 (42.9%) |
| $50,000 to $74,999 | 0 (0.0%) | 0 (0.0%) |
| $75,000 to $99,999 | 7 (87.5%) | 1 (12.5%) |
| $100,000 and over | 83 (100.0%) | 0 (0.0%) |
Public vs Private Health Insurance Coverage by Age in Summerville
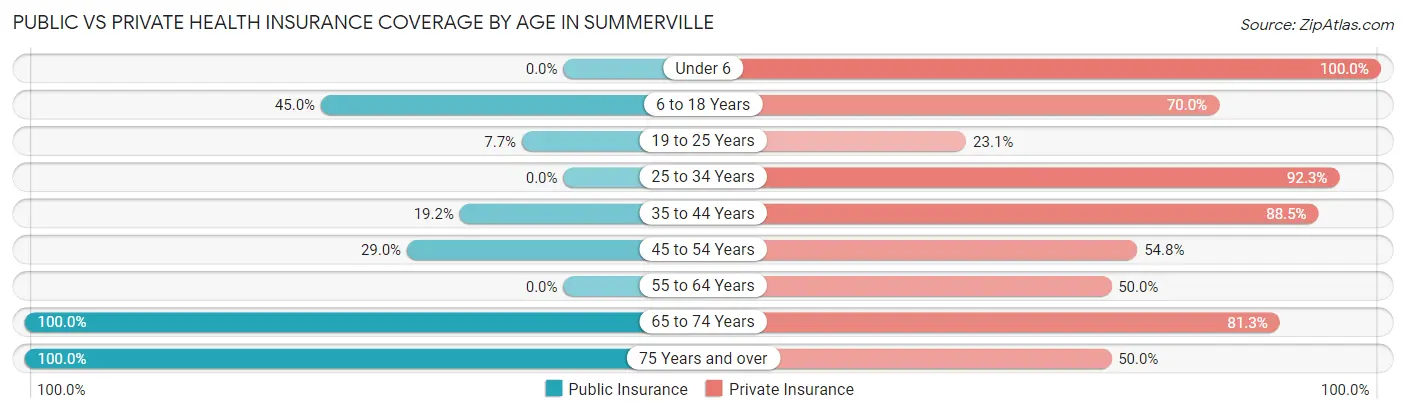
| Age Bracket | Public Insurance | Private Insurance |
| Under 6 | 0 (0.0%) | 1 (100.0%) |
| 6 to 18 Years | 9 (45.0%) | 14 (70.0%) |
| 19 to 25 Years | 1 (7.7%) | 3 (23.1%) |
| 25 to 34 Years | 0 (0.0%) | 12 (92.3%) |
| 35 to 44 Years | 5 (19.2%) | 23 (88.5%) |
| 45 to 54 Years | 9 (29.0%) | 17 (54.8%) |
| 55 to 64 Years | 0 (0.0%) | 2 (50.0%) |
| 65 to 74 Years | 16 (100.0%) | 13 (81.2%) |
| 75 Years and over | 6 (100.0%) | 3 (50.0%) |
| Total | 46 (35.4%) | 88 (67.7%) |
Disability Status by Sex by Age in Summerville
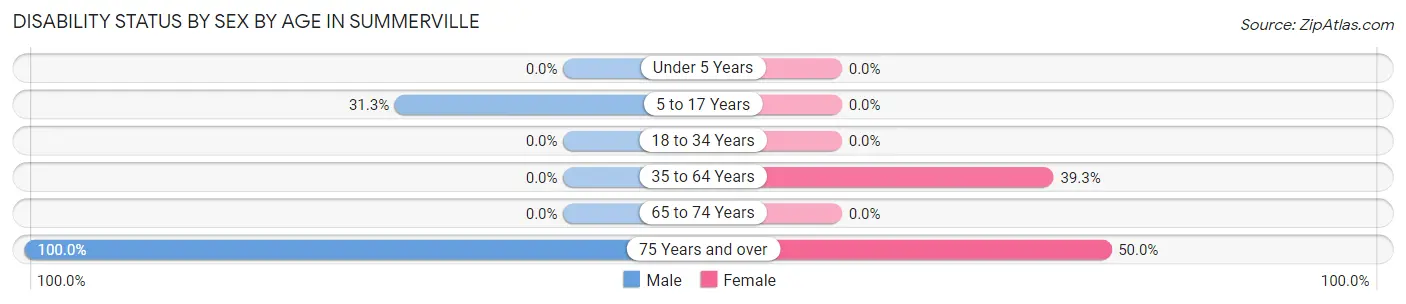
| Age Bracket | Male | Female |
| Under 5 Years | 0 (0.0%) | 0 (0.0%) |
| 5 to 17 Years | 5 (31.2%) | 0 (0.0%) |
| 18 to 34 Years | 0 (0.0%) | 0 (0.0%) |
| 35 to 64 Years | 0 (0.0%) | 11 (39.3%) |
| 65 to 74 Years | 0 (0.0%) | 0 (0.0%) |
| 75 Years and over | 2 (100.0%) | 2 (50.0%) |
Disability Class by Sex by Age in Summerville
Disability Class: Hearing Difficulty
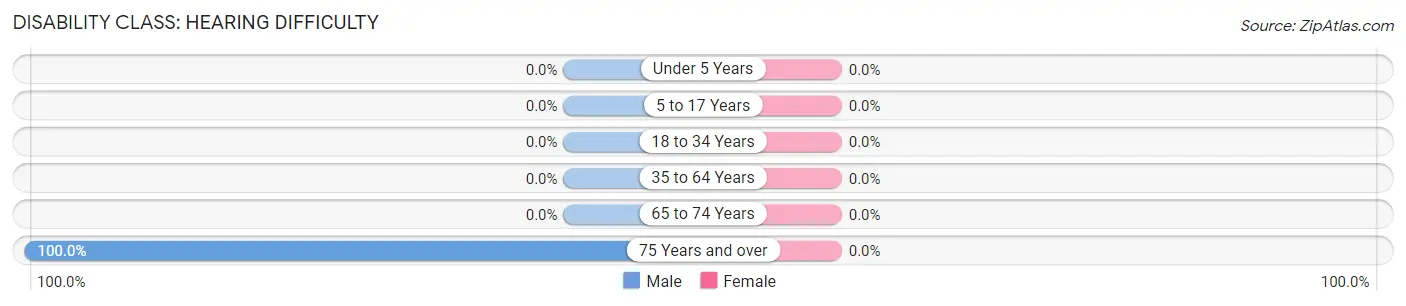
| Age Bracket | Male | Female |
| Under 5 Years | 0 (0.0%) | 0 (0.0%) |
| 5 to 17 Years | 0 (0.0%) | 0 (0.0%) |
| 18 to 34 Years | 0 (0.0%) | 0 (0.0%) |
| 35 to 64 Years | 0 (0.0%) | 0 (0.0%) |
| 65 to 74 Years | 0 (0.0%) | 0 (0.0%) |
| 75 Years and over | 2 (100.0%) | 0 (0.0%) |
Disability Class: Vision Difficulty
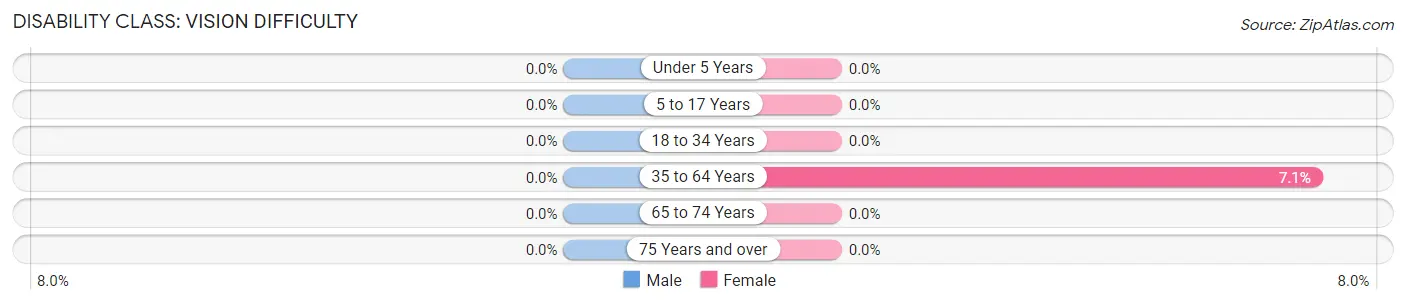
| Age Bracket | Male | Female |
| Under 5 Years | 0 (0.0%) | 0 (0.0%) |
| 5 to 17 Years | 0 (0.0%) | 0 (0.0%) |
| 18 to 34 Years | 0 (0.0%) | 0 (0.0%) |
| 35 to 64 Years | 0 (0.0%) | 2 (7.1%) |
| 65 to 74 Years | 0 (0.0%) | 0 (0.0%) |
| 75 Years and over | 0 (0.0%) | 0 (0.0%) |
Disability Class: Cognitive Difficulty
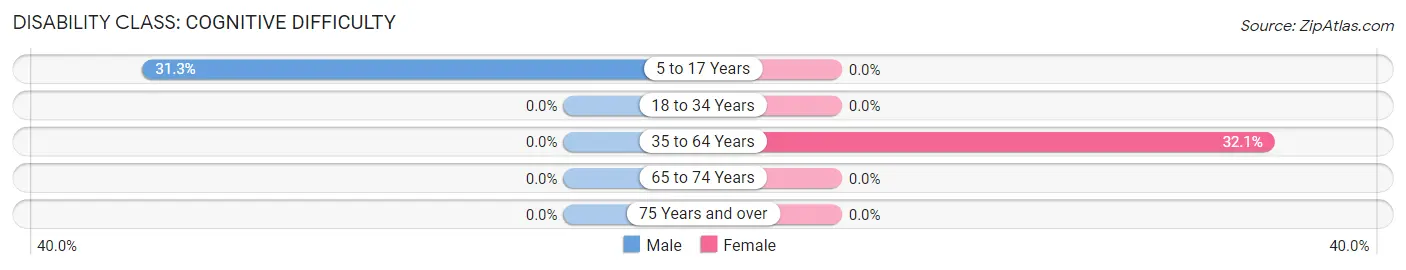
| Age Bracket | Male | Female |
| 5 to 17 Years | 5 (31.2%) | 0 (0.0%) |
| 18 to 34 Years | 0 (0.0%) | 0 (0.0%) |
| 35 to 64 Years | 0 (0.0%) | 9 (32.1%) |
| 65 to 74 Years | 0 (0.0%) | 0 (0.0%) |
| 75 Years and over | 0 (0.0%) | 0 (0.0%) |
Disability Class: Ambulatory Difficulty
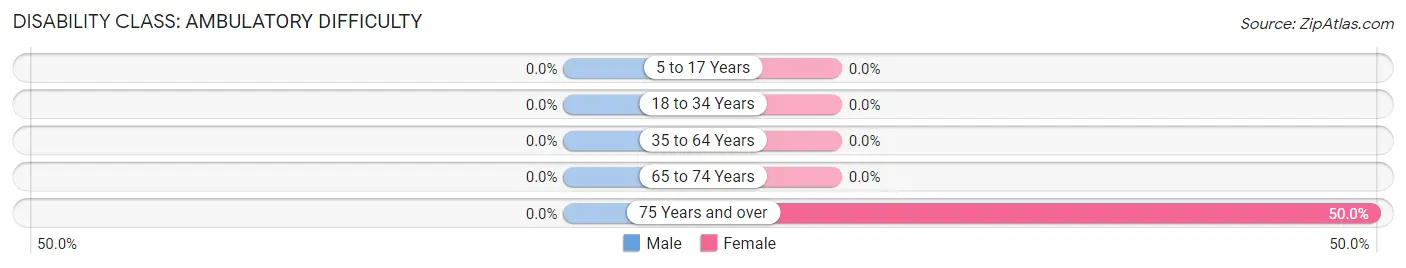
| Age Bracket | Male | Female |
| 5 to 17 Years | 0 (0.0%) | 0 (0.0%) |
| 18 to 34 Years | 0 (0.0%) | 0 (0.0%) |
| 35 to 64 Years | 0 (0.0%) | 0 (0.0%) |
| 65 to 74 Years | 0 (0.0%) | 0 (0.0%) |
| 75 Years and over | 0 (0.0%) | 2 (50.0%) |
Disability Class: Self-Care Difficulty
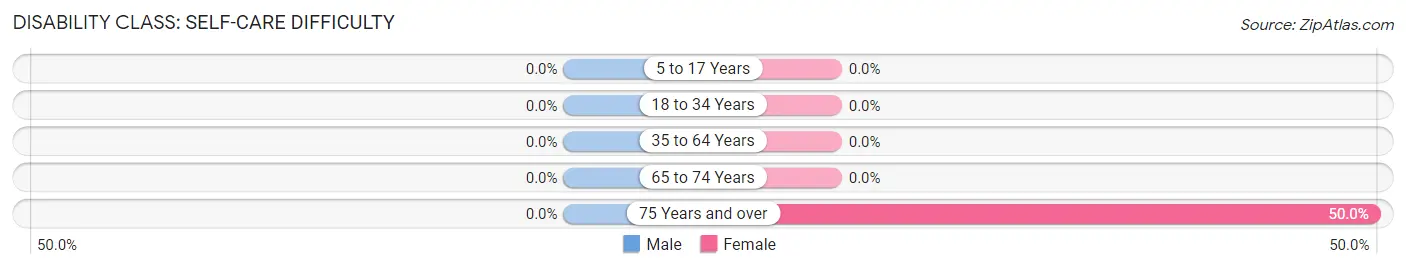
| Age Bracket | Male | Female |
| 5 to 17 Years | 0 (0.0%) | 0 (0.0%) |
| 18 to 34 Years | 0 (0.0%) | 0 (0.0%) |
| 35 to 64 Years | 0 (0.0%) | 0 (0.0%) |
| 65 to 74 Years | 0 (0.0%) | 0 (0.0%) |
| 75 Years and over | 0 (0.0%) | 2 (50.0%) |
Technology Access in Summerville
Computing Device Access in Summerville
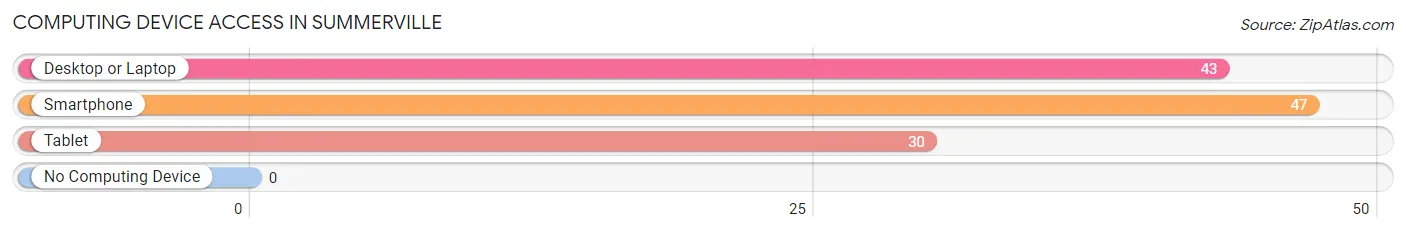
| Device Type | # Households | % Households |
| Desktop or Laptop | 43 | 91.5% |
| Smartphone | 47 | 100.0% |
| Tablet | 30 | 63.8% |
| No Computing Device | 0 | 0.0% |
| Total | 47 | 100.0% |
Internet Access in Summerville
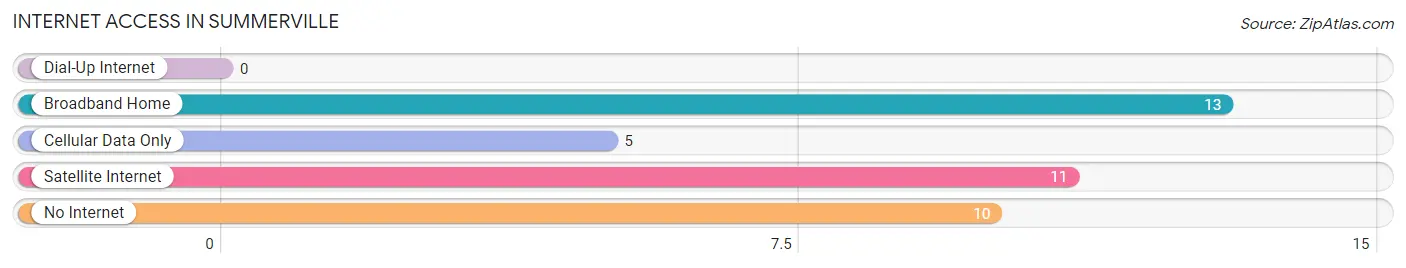
| Internet Type | # Households | % Households |
| Dial-Up Internet | 0 | 0.0% |
| Broadband Home | 13 | 27.7% |
| Cellular Data Only | 5 | 10.6% |
| Satellite Internet | 11 | 23.4% |
| No Internet | 10 | 21.3% |
| Total | 47 | 100.0% |
Summerville Summary
Introduction
The small town of Summerville, Oregon is located in the Umpqua Valley in Douglas County. It is a rural community with a population of just over 1,000 people. The town is known for its agricultural roots and its close-knit community. It is a place where people come to relax and enjoy the beauty of nature.
History
Summerville was founded in 1853 by a group of settlers from the Willamette Valley. The town was originally called “Umpqua City” but was later changed to Summerville in 1856. The town was named after the nearby Umpqua River, which was named by the local Native American tribes.
The town was originally a farming community, with the main crops being wheat, oats, and barley. In the late 1800s, the town began to grow and develop, with the addition of a post office, a school, and a general store.
In the early 1900s, the town began to diversify its economy, with the addition of a sawmill, a creamery, and a cannery. The town also became a popular tourist destination, with the opening of the Umpqua Hot Springs in the 1920s.
Geography
Summerville is located in the Umpqua Valley in Douglas County, Oregon. The town is situated at the confluence of the Umpqua and North Umpqua Rivers. The town is surrounded by rolling hills and lush forests. The climate is mild, with temperatures ranging from the mid-30s in the winter to the mid-80s in the summer.
Economy
Summerville’s economy is largely based on agriculture and tourism. The town is home to several farms, which produce a variety of crops, including wheat, oats, barley, and hay. The town is also home to several wineries, which produce a variety of wines.
The town is also a popular tourist destination, with the Umpqua Hot Springs being the main attraction. The hot springs are a popular spot for visitors to relax and enjoy the natural beauty of the area.
Demographics
As of the 2010 census, the population of Summerville was 1,072. The racial makeup of the town was 94.3% White, 0.7% African American, 0.3% Native American, 0.3% Asian, 0.1% Pacific Islander, and 4.3% from two or more races. The median household income was $37,917, and the median family income was $45,625.
Conclusion
Summerville, Oregon is a small rural town with a population of just over 1,000 people. The town is known for its agricultural roots and its close-knit community. It is a place where people come to relax and enjoy the beauty of nature. The town’s economy is largely based on agriculture and tourism, and the town is home to several wineries and the Umpqua Hot Springs. The population of Summerville is mostly White, with a small percentage of African American, Native American, Asian, and Pacific Islander residents.
Common Questions
What is the Total Population of Summerville?
Total Population of Summerville is 130.
What is the Total Male Population of Summerville?
Total Male Population of Summerville is 69.
What is the Total Female Population of Summerville?
Total Female Population of Summerville is 61.
What is the Ratio of Males per 100 Females in Summerville?
There are 113.11 Males per 100 Females in Summerville.
What is the Ratio of Females per 100 Males in Summerville?
There are 88.41 Females per 100 Males in Summerville.
What is the Median Population Age in Summerville?
Median Population Age in Summerville is 43.1 Years.
What is the Average Family Size in Summerville
Average Family Size in Summerville is 2.8 People.
What is the Average Household Size in Summerville
Average Household Size in Summerville is 2.8 People.
What is Per Capita Income in Summerville?
Per Capita income in Summerville is $36,647.
What is the Median Family Income in Summerville?
Median Family Income in Summerville is $113,750.
What is the Median Household income in Summerville?
Median Household Income in Summerville is $113,594.
What is Income or Wage Gap in Summerville?
Income or Wage Gap in Summerville is 12.8%.
Women in Summerville earn 87.2 cents for every dollar earned by a man.
What is Inequality or Gini Index in Summerville?
Inequality or Gini Index in Summerville is 0.31.
How Large is the Labor Force in Summerville?
There are 75 People in the Labor Forcein in Summerville.
What is the Percentage of People in the Labor Force in Summerville?
67.0% of People are in the Labor Force in Summerville.
What is the Unemployment Rate in Summerville?
Unemployment Rate in Summerville is 21.3%.