Pine Hollow, OR
Pine Hollow Map
Pine Hollow Overview
481
TOTAL POPULATION
223
MALE POPULATION
258
FEMALE POPULATION
86.43
MALES / 100 FEMALES
115.70
FEMALES / 100 MALES
63.8
MEDIAN AGE
2.5
AVG FAMILY SIZE
2.1
AVG HOUSEHOLD SIZE
$32,062
PER CAPITA INCOME
$51,750
AVG FAMILY INCOME
$50,089
AVG HOUSEHOLD INCOME
0.42
INEQUALITY / GINI INDEX
158
LABOR FORCE [ PEOPLE ]
35.0%
PERCENT IN LABOR FORCE
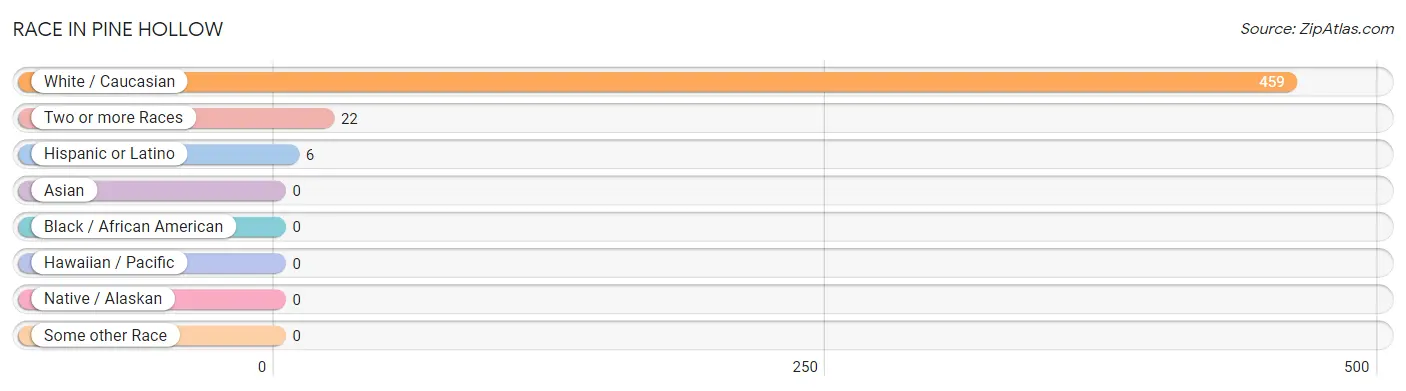
Race in Pine Hollow
The most populous races in Pine Hollow are White / Caucasian (459 | 95.4%), Two or more Races (22 | 4.6%), and Hispanic or Latino (6 | 1.3%).
| Race | # Population | % Population |
| Asian | 0 | 0.0% |
| Black / African American | 0 | 0.0% |
| Hawaiian / Pacific | 0 | 0.0% |
| Hispanic or Latino | 6 | 1.3% |
| Native / Alaskan | 0 | 0.0% |
| White / Caucasian | 459 | 95.4% |
| Two or more Races | 22 | 4.6% |
| Some other Race | 0 | 0.0% |
| Total | 481 | 100.0% |
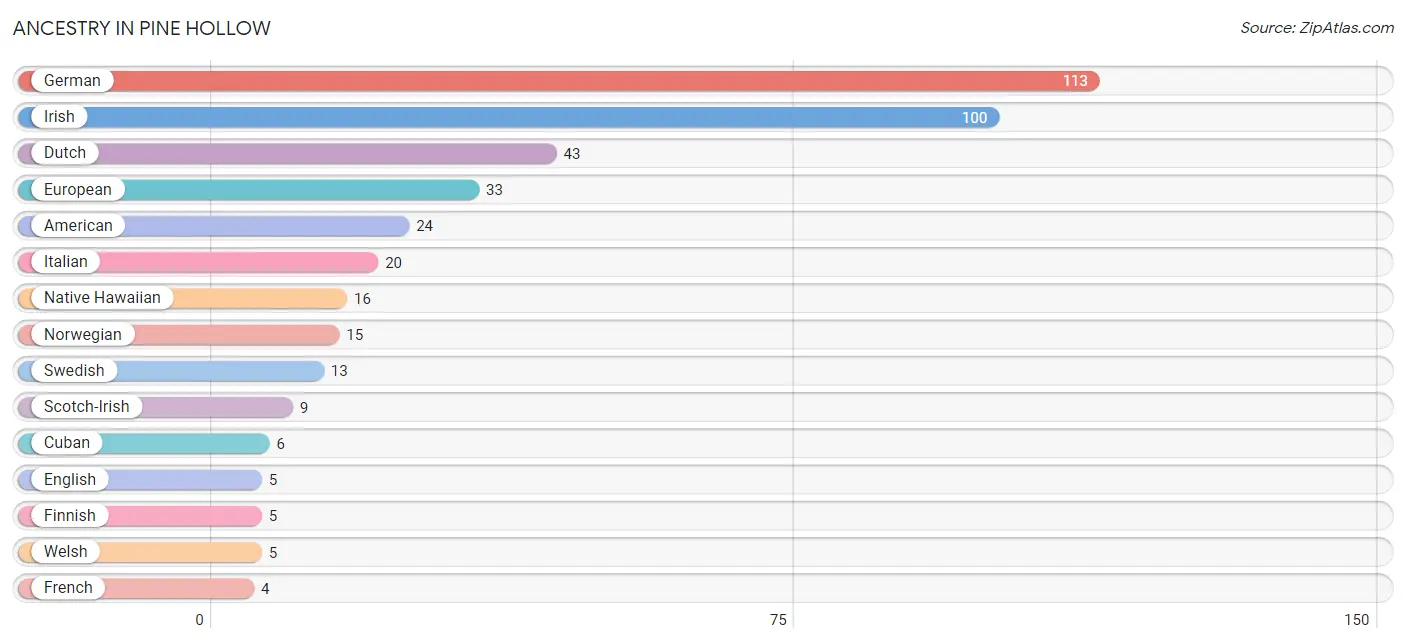
Ancestry in Pine Hollow
The most populous ancestries reported in Pine Hollow are German (113 | 23.5%), Irish (100 | 20.8%), Dutch (43 | 8.9%), European (33 | 6.9%), and American (24 | 5.0%), together accounting for 65.1% of all Pine Hollow residents.
| Ancestry | # Population | % Population |
| American | 24 | 5.0% |
| Cuban | 6 | 1.3% |
| Dutch | 43 | 8.9% |
| English | 5 | 1.0% |
| European | 33 | 6.9% |
| Finnish | 5 | 1.0% |
| French | 4 | 0.8% |
| German | 113 | 23.5% |
| Irish | 100 | 20.8% |
| Italian | 20 | 4.2% |
| Native Hawaiian | 16 | 3.3% |
| Norwegian | 15 | 3.1% |
| Scotch-Irish | 9 | 1.9% |
| Swedish | 13 | 2.7% |
| Welsh | 5 | 1.0% | View All 15 Rows |
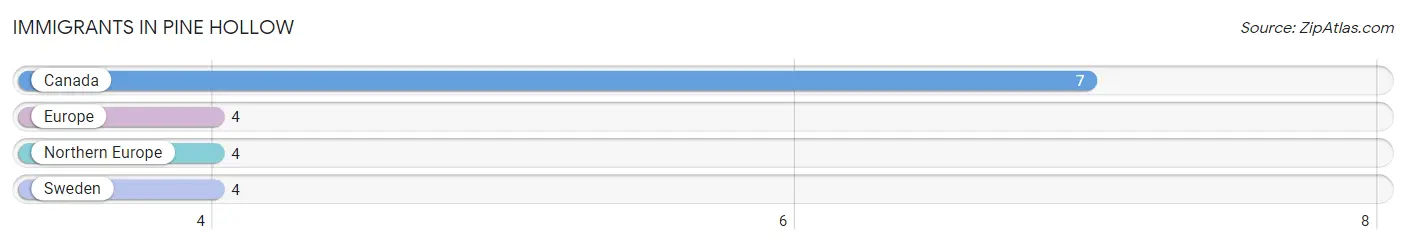
Immigrants in Pine Hollow
The most numerous immigrant groups reported in Pine Hollow came from Canada (7 | 1.5%), Europe (4 | 0.8%), Northern Europe (4 | 0.8%), and Sweden (4 | 0.8%), together accounting for 4.0% of all Pine Hollow residents.
| Immigration Origin | # Population | % Population |
| Canada | 7 | 1.5% |
| Europe | 4 | 0.8% |
| Northern Europe | 4 | 0.8% |
| Sweden | 4 | 0.8% | View All 4 Rows |
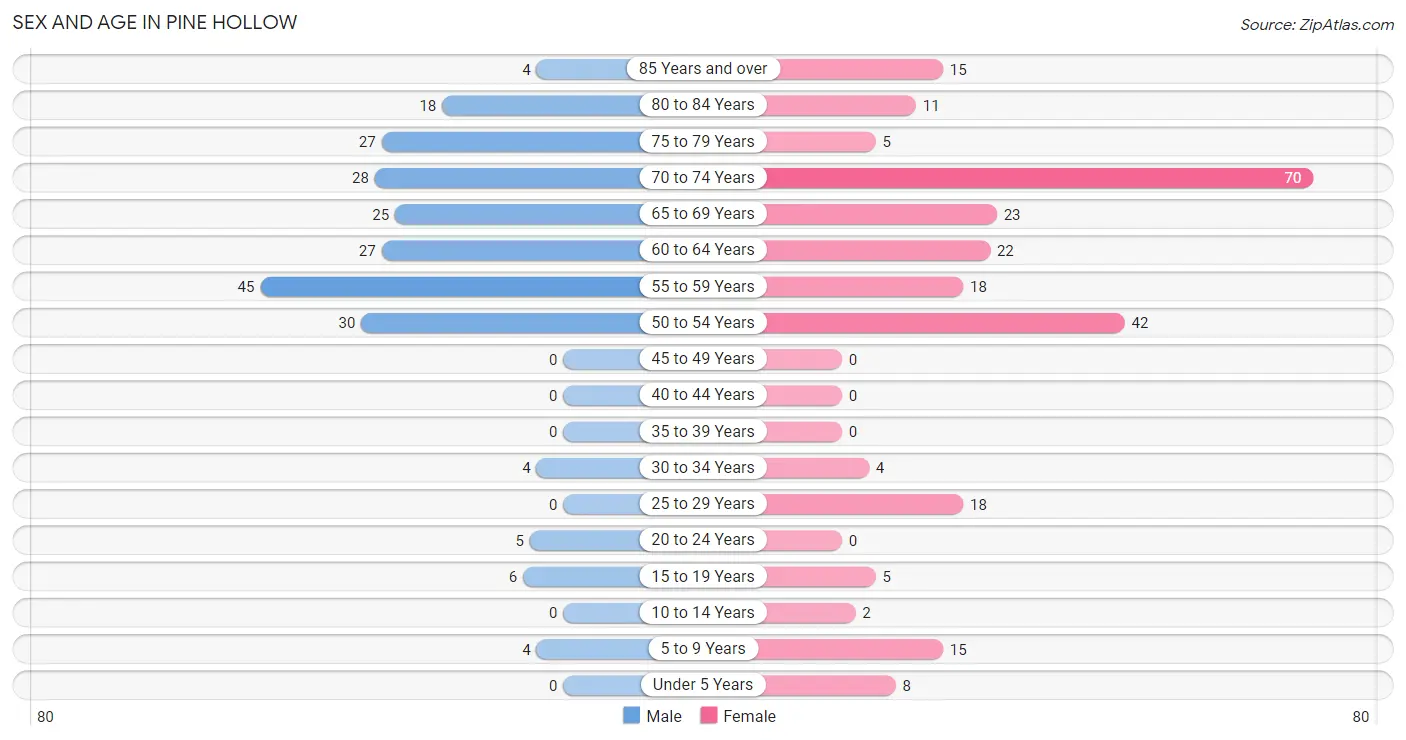
Sex and Age in Pine Hollow
Sex and Age in Pine Hollow
The most populous age groups in Pine Hollow are 55 to 59 Years (45 | 20.2%) for men and 70 to 74 Years (70 | 27.1%) for women.
| Age Bracket | Male | Female |
| Under 5 Years | 0 (0.0%) | 8 (3.1%) |
| 5 to 9 Years | 4 (1.8%) | 15 (5.8%) |
| 10 to 14 Years | 0 (0.0%) | 2 (0.8%) |
| 15 to 19 Years | 6 (2.7%) | 5 (1.9%) |
| 20 to 24 Years | 5 (2.2%) | 0 (0.0%) |
| 25 to 29 Years | 0 (0.0%) | 18 (7.0%) |
| 30 to 34 Years | 4 (1.8%) | 4 (1.5%) |
| 35 to 39 Years | 0 (0.0%) | 0 (0.0%) |
| 40 to 44 Years | 0 (0.0%) | 0 (0.0%) |
| 45 to 49 Years | 0 (0.0%) | 0 (0.0%) |
| 50 to 54 Years | 30 (13.5%) | 42 (16.3%) |
| 55 to 59 Years | 45 (20.2%) | 18 (7.0%) |
| 60 to 64 Years | 27 (12.1%) | 22 (8.5%) |
| 65 to 69 Years | 25 (11.2%) | 23 (8.9%) |
| 70 to 74 Years | 28 (12.6%) | 70 (27.1%) |
| 75 to 79 Years | 27 (12.1%) | 5 (1.9%) |
| 80 to 84 Years | 18 (8.1%) | 11 (4.3%) |
| 85 Years and over | 4 (1.8%) | 15 (5.8%) |
| Total | 223 (100.0%) | 258 (100.0%) |
Families and Households in Pine Hollow
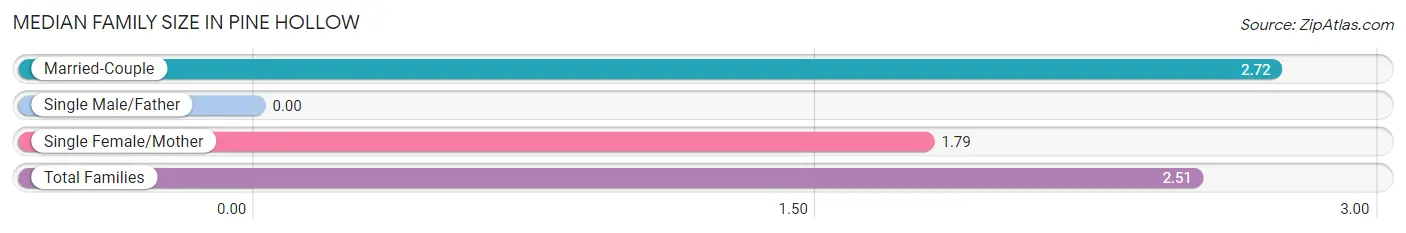
Median Family Size in Pine Hollow
| Family Type | # Families | Family Size |
| Married-Couple | 117 (77.5%) | 2.72 |
| Single Male/Father | 0 (0.0%) | - |
| Single Female/Mother | 34 (22.5%) | 1.79 |
| Total Families | 151 (100.0%) | 2.51 |
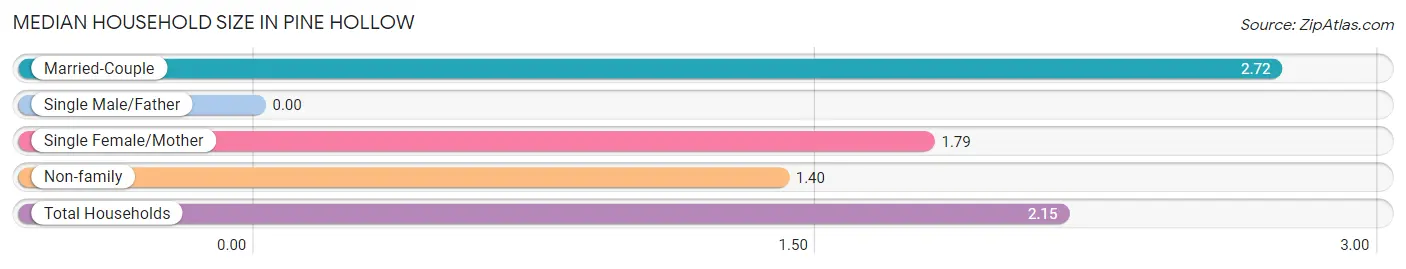
Median Household Size in Pine Hollow
| Household Type | # Households | Household Size |
| Married-Couple | 117 (52.2%) | 2.72 |
| Single Male/Father | 0 (0.0%) | - |
| Single Female/Mother | 34 (15.2%) | 1.79 |
| Non-family | 73 (32.6%) | 1.40 |
| Total Households | 224 (100.0%) | 2.15 |
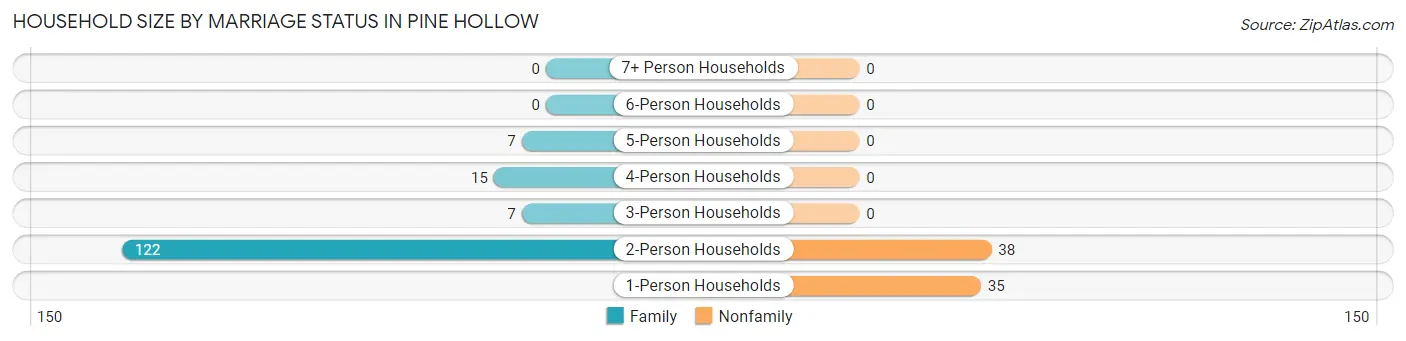
Household Size by Marriage Status in Pine Hollow
Out of a total of 224 households in Pine Hollow, 151 (67.4%) are family households, while 73 (32.6%) are nonfamily households. The most numerous type of family households are 2-person households, comprising 122, and the most common type of nonfamily households are 2-person households, comprising 38.
| Household Size | Family Households | Nonfamily Households |
| 1-Person Households | - | 35 (15.6%) |
| 2-Person Households | 122 (54.5%) | 38 (17.0%) |
| 3-Person Households | 7 (3.1%) | 0 (0.0%) |
| 4-Person Households | 15 (6.7%) | 0 (0.0%) |
| 5-Person Households | 7 (3.1%) | 0 (0.0%) |
| 6-Person Households | 0 (0.0%) | 0 (0.0%) |
| 7+ Person Households | 0 (0.0%) | 0 (0.0%) |
| Total | 151 (67.4%) | 73 (32.6%) |
Female Fertility in Pine Hollow
Fertility by Age in Pine Hollow
| Age Bracket | Women with Births | Births / 1,000 Women |
| 15 to 19 years | 0 (0.0%) | 0.0 |
| 20 to 34 years | 0 (0.0%) | 0.0 |
| 35 to 50 years | 0 (0.0%) | 0.0 |
| Total | 0 (0.0%) | 0.0 |
Fertility by Age by Marriage Status in Pine Hollow
| Age Bracket | Married | Unmarried |
| 15 to 19 years | 0 (0.0%) | 0 (0.0%) |
| 20 to 34 years | 0 (0.0%) | 0 (0.0%) |
| 35 to 50 years | 0 (0.0%) | 0 (0.0%) |
| Total | 0 (0.0%) | 0 (0.0%) |
Fertility by Education in Pine Hollow
| Educational Attainment | Women with Births | Births / 1,000 Women |
| Less than High School | 0 (0.0%) | 0.0 |
| High School Diploma | 0 (0.0%) | 0.0 |
| College or Associate's Degree | 0 (0.0%) | 0.0 |
| Bachelor's Degree | 0 (0.0%) | 0.0 |
| Graduate Degree | 0 (0.0%) | 0.0 |
| Total | 0 (0.0%) | 0.0 |
Fertility by Education by Marriage Status in Pine Hollow
| Educational Attainment | Married | Unmarried |
| Less than High School | 0 (0.0%) | 0 (0.0%) |
| High School Diploma | 0 (0.0%) | 0 (0.0%) |
| College or Associate's Degree | 0 (0.0%) | 0 (0.0%) |
| Bachelor's Degree | 0 (0.0%) | 0 (0.0%) |
| Graduate Degree | 0 (0.0%) | 0 (0.0%) |
| Total | 0 (0.0%) | 0 (0.0%) |
Income in Pine Hollow
Income Overview in Pine Hollow
Per Capita Income in Pine Hollow is $32,062, while median incomes of families and households are $51,750 and $50,089 respectively.
| Characteristic | Number | Measure |
| Per Capita Income | 481 | $32,062 |
| Median Family Income | 151 | $51,750 |
| Mean Family Income | 151 | $78,252 |
| Median Household Income | 224 | $50,089 |
| Mean Household Income | 224 | $65,738 |
| Income Deficit | 151 | $0 |
| Wage / Income Gap (%) | 481 | 0.00% |
| Wage / Income Gap ($) | 481 | 100.00¢ per $1 |
| Gini / Inequality Index | 481 | 0.42 |
Earnings by Sex in Pine Hollow
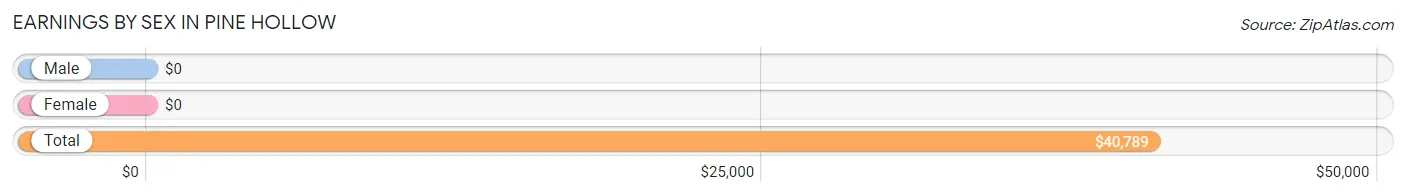
| Sex | Number | Average Earnings |
| Male | 65 (41.1%) | $0 |
| Female | 93 (58.9%) | $0 |
| Total | 158 (100.0%) | $40,789 |
Earnings by Sex by Income Bracket in Pine Hollow
The most common earnings brackets in Pine Hollow are $100,000+ for men (20 | 30.8%) and $75,000 to $99,999 for women (26 | 28.0%).
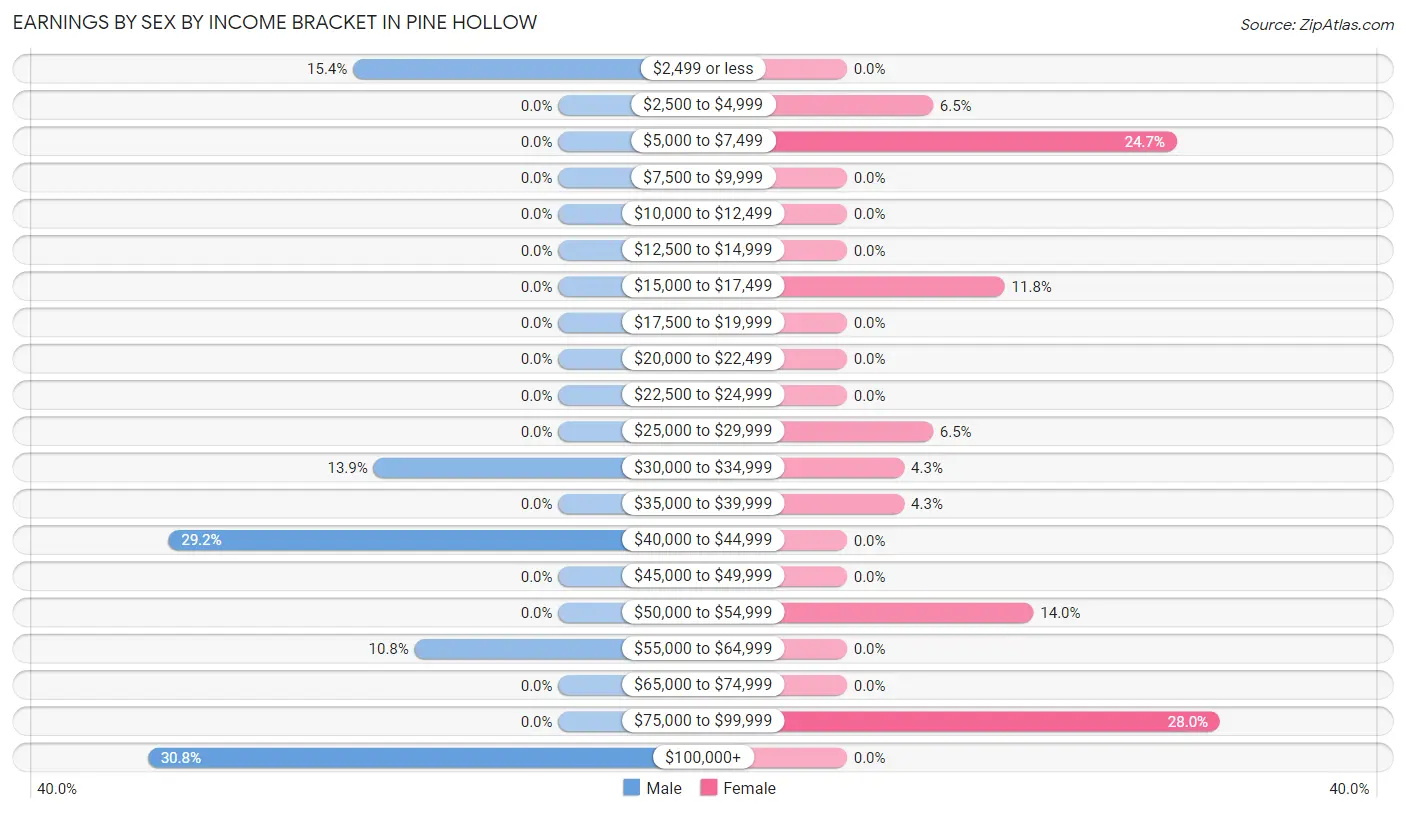
| Income | Male | Female |
| $2,499 or less | 10 (15.4%) | 0 (0.0%) |
| $2,500 to $4,999 | 0 (0.0%) | 6 (6.5%) |
| $5,000 to $7,499 | 0 (0.0%) | 23 (24.7%) |
| $7,500 to $9,999 | 0 (0.0%) | 0 (0.0%) |
| $10,000 to $12,499 | 0 (0.0%) | 0 (0.0%) |
| $12,500 to $14,999 | 0 (0.0%) | 0 (0.0%) |
| $15,000 to $17,499 | 0 (0.0%) | 11 (11.8%) |
| $17,500 to $19,999 | 0 (0.0%) | 0 (0.0%) |
| $20,000 to $22,499 | 0 (0.0%) | 0 (0.0%) |
| $22,500 to $24,999 | 0 (0.0%) | 0 (0.0%) |
| $25,000 to $29,999 | 0 (0.0%) | 6 (6.5%) |
| $30,000 to $34,999 | 9 (13.9%) | 4 (4.3%) |
| $35,000 to $39,999 | 0 (0.0%) | 4 (4.3%) |
| $40,000 to $44,999 | 19 (29.2%) | 0 (0.0%) |
| $45,000 to $49,999 | 0 (0.0%) | 0 (0.0%) |
| $50,000 to $54,999 | 0 (0.0%) | 13 (14.0%) |
| $55,000 to $64,999 | 7 (10.8%) | 0 (0.0%) |
| $65,000 to $74,999 | 0 (0.0%) | 0 (0.0%) |
| $75,000 to $99,999 | 0 (0.0%) | 26 (28.0%) |
| $100,000+ | 20 (30.8%) | 0 (0.0%) |
| Total | 65 (100.0%) | 93 (100.0%) |
Earnings by Sex by Educational Attainment in Pine Hollow
| Educational Attainment | Male Income | Female Income |
| Less than High School | - | - |
| High School Diploma | - | - |
| College or Associate's Degree | - | - |
| Bachelor's Degree | - | - |
| Graduate Degree | - | - |
| Total | - | - |
Family Income in Pine Hollow
Family Income Brackets in Pine Hollow
According to the Pine Hollow family income data, there are 34 families falling into the $15,000 to $24,999 income range, which is the most common income bracket and makes up 22.5% of all families.
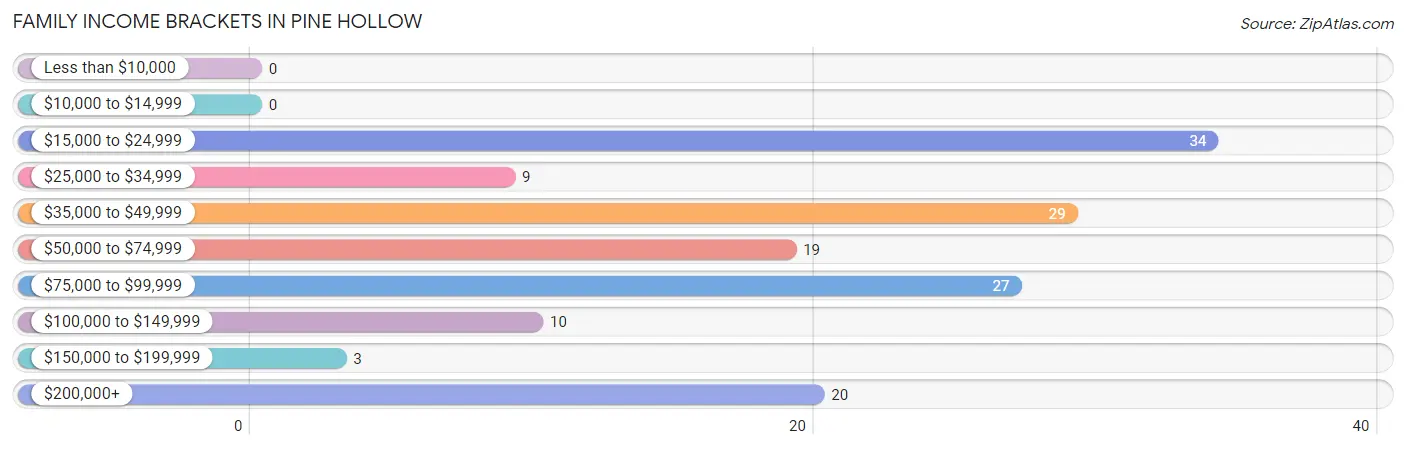
| Income Bracket | # Families | % Families |
| Less than $10,000 | 0 | 0.0% |
| $10,000 to $14,999 | 0 | 0.0% |
| $15,000 to $24,999 | 34 | 22.5% |
| $25,000 to $34,999 | 9 | 6.0% |
| $35,000 to $49,999 | 29 | 19.2% |
| $50,000 to $74,999 | 19 | 12.6% |
| $75,000 to $99,999 | 27 | 17.9% |
| $100,000 to $149,999 | 10 | 6.6% |
| $150,000 to $199,999 | 3 | 2.0% |
| $200,000+ | 20 | 13.2% |
Family Income by Famaliy Size in Pine Hollow
2-person families (122 | 80.8%) account for the highest median family income in Pine Hollow with $46,731 per family, while 2-person families (122 | 80.8%) have the highest median income of $23,366 per family member.
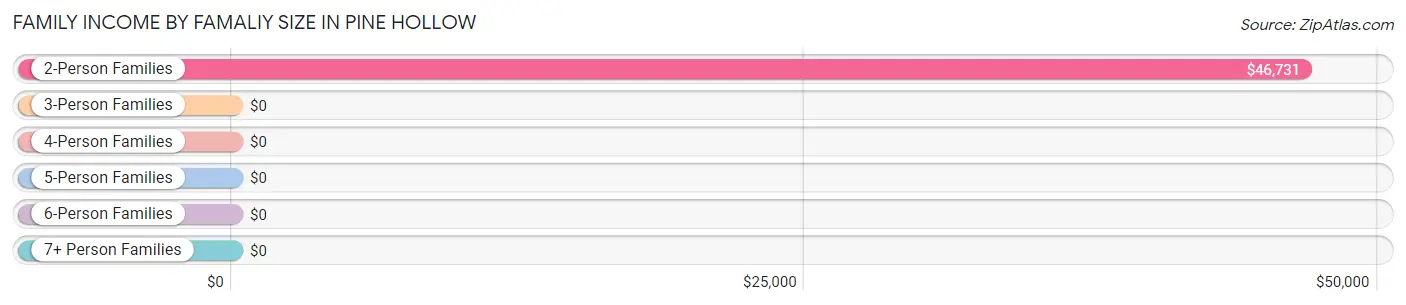
| Income Bracket | # Families | Median Income |
| 2-Person Families | 122 (80.8%) | $46,731 |
| 3-Person Families | 7 (4.6%) | $0 |
| 4-Person Families | 15 (9.9%) | $0 |
| 5-Person Families | 7 (4.6%) | $0 |
| 6-Person Families | 0 (0.0%) | $0 |
| 7+ Person Families | 0 (0.0%) | $0 |
| Total | 151 (100.0%) | $51,750 |
Family Income by Number of Earners in Pine Hollow
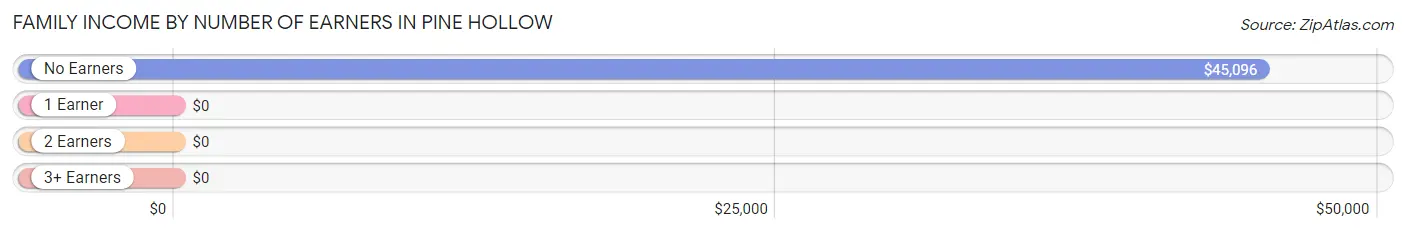
| Number of Earners | # Families | Median Income |
| No Earners | 95 (62.9%) | $45,096 |
| 1 Earner | 11 (7.3%) | $0 |
| 2 Earners | 38 (25.2%) | $0 |
| 3+ Earners | 7 (4.6%) | $0 |
| Total | 151 (100.0%) | $51,750 |
Household Income in Pine Hollow
Household Income Brackets in Pine Hollow
With 53 households falling in the category, the $50,000 to $74,999 income range is the most frequent in Pine Hollow, accounting for 23.7% of all households.
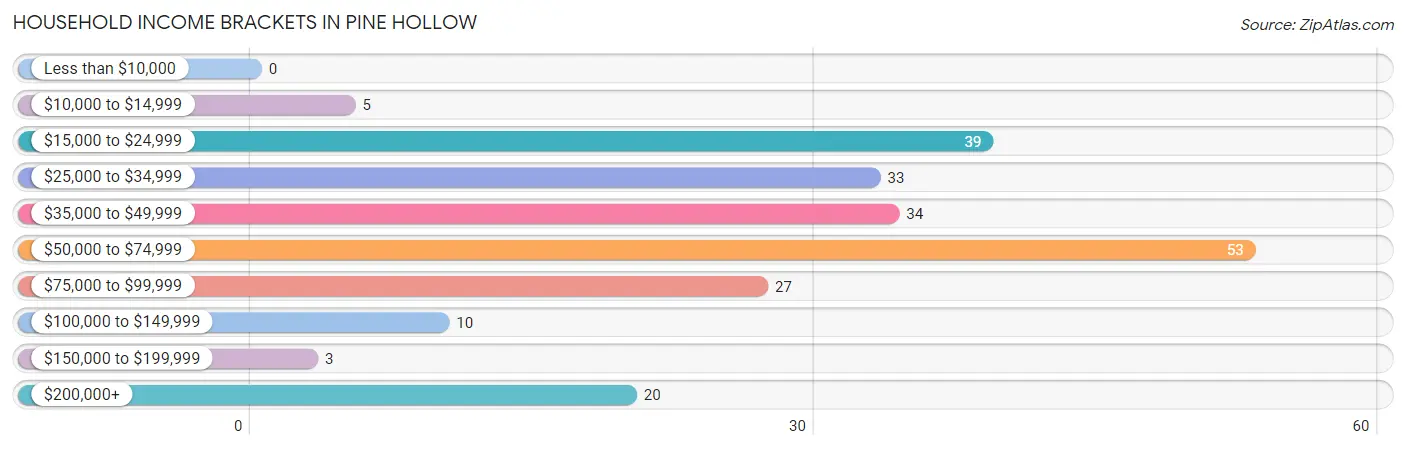
| Income Bracket | # Households | % Households |
| Less than $10,000 | 0 | 0.0% |
| $10,000 to $14,999 | 5 | 2.2% |
| $15,000 to $24,999 | 39 | 17.4% |
| $25,000 to $34,999 | 33 | 14.7% |
| $35,000 to $49,999 | 34 | 15.2% |
| $50,000 to $74,999 | 53 | 23.7% |
| $75,000 to $99,999 | 27 | 12.1% |
| $100,000 to $149,999 | 10 | 4.5% |
| $150,000 to $199,999 | 3 | 1.3% |
| $200,000+ | 20 | 8.9% |
Household Income by Householder Age in Pine Hollow
The median household income in Pine Hollow is $50,089, with the highest median household income of $88,182 found in the 45 to 64 years age bracket for the primary householder. A total of 78 households (34.8%) fall into this category.
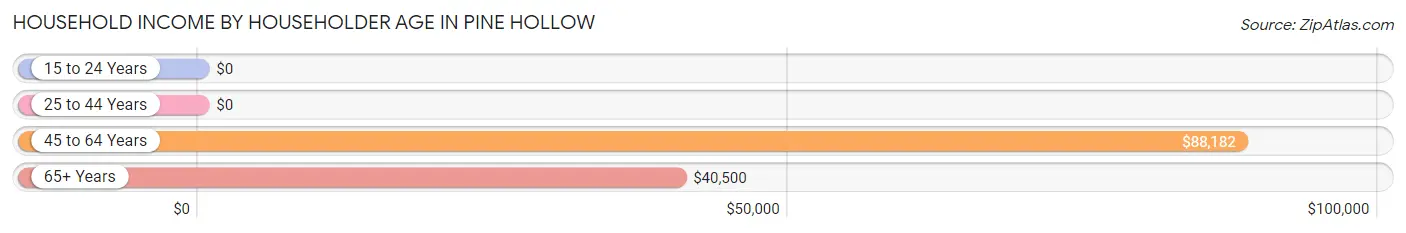
| Income Bracket | # Households | Median Income |
| 15 to 24 Years | 0 (0.0%) | $0 |
| 25 to 44 Years | 0 (0.0%) | $0 |
| 45 to 64 Years | 78 (34.8%) | $88,182 |
| 65+ Years | 146 (65.2%) | $40,500 |
| Total | 224 (100.0%) | $50,089 |
Poverty in Pine Hollow
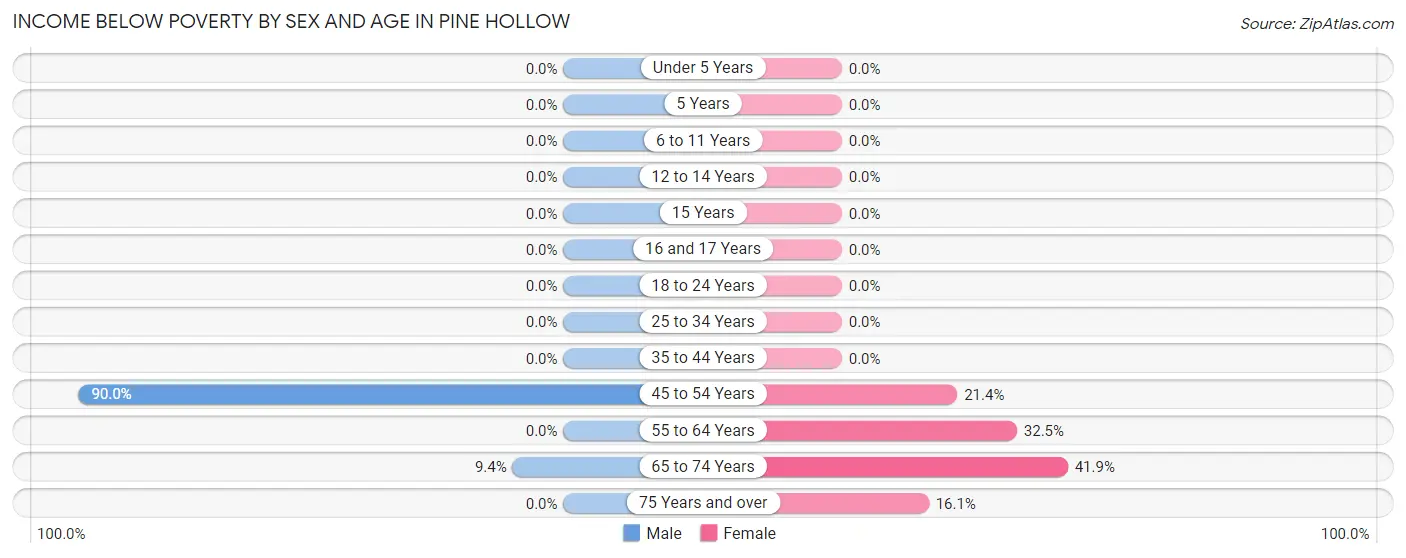
Income Below Poverty by Sex and Age in Pine Hollow
With 14.3% poverty level for males and 25.6% for females among the residents of Pine Hollow, 45 to 54 year old males and 65 to 74 year old females are the most vulnerable to poverty, with 27 males (90.0%) and 39 females (41.9%) in their respective age groups living below the poverty level.
| Age Bracket | Male | Female |
| Under 5 Years | 0 (0.0%) | 0 (0.0%) |
| 5 Years | 0 (0.0%) | 0 (0.0%) |
| 6 to 11 Years | 0 (0.0%) | 0 (0.0%) |
| 12 to 14 Years | 0 (0.0%) | 0 (0.0%) |
| 15 Years | 0 (0.0%) | 0 (0.0%) |
| 16 and 17 Years | 0 (0.0%) | 0 (0.0%) |
| 18 to 24 Years | 0 (0.0%) | 0 (0.0%) |
| 25 to 34 Years | 0 (0.0%) | 0 (0.0%) |
| 35 to 44 Years | 0 (0.0%) | 0 (0.0%) |
| 45 to 54 Years | 27 (90.0%) | 9 (21.4%) |
| 55 to 64 Years | 0 (0.0%) | 13 (32.5%) |
| 65 to 74 Years | 5 (9.4%) | 39 (41.9%) |
| 75 Years and over | 0 (0.0%) | 5 (16.1%) |
| Total | 32 (14.3%) | 66 (25.6%) |
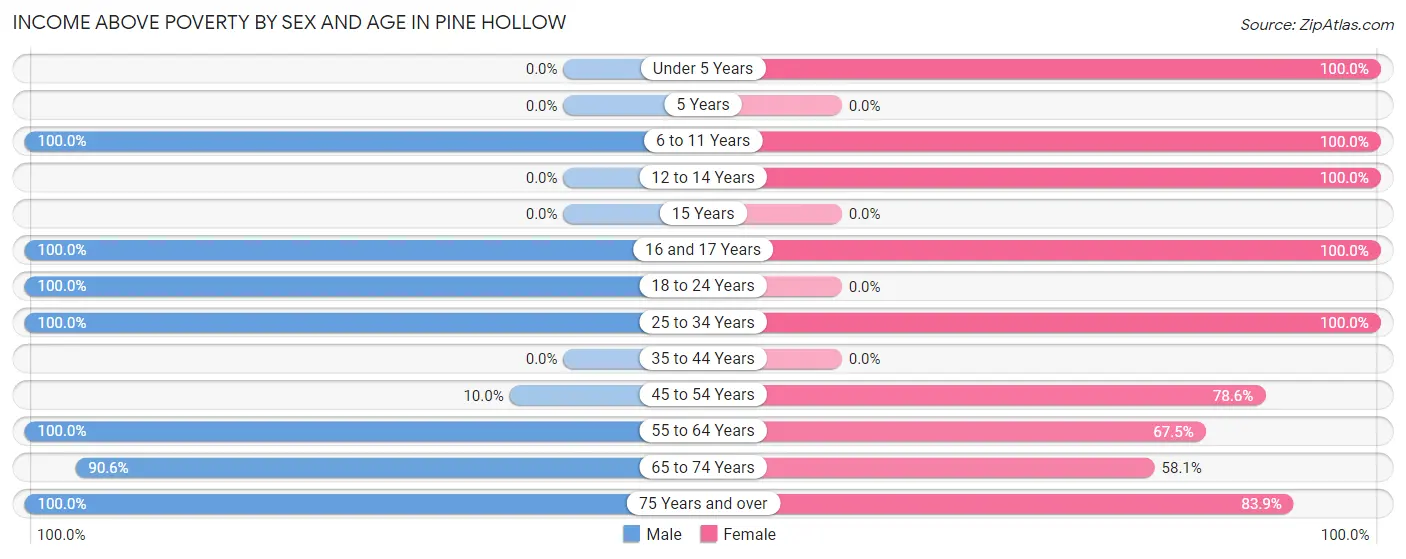
Income Above Poverty by Sex and Age in Pine Hollow
According to the poverty statistics in Pine Hollow, males aged 6 to 11 years and females aged under 5 years are the age groups that are most secure financially, with 100.0% of males and 100.0% of females in these age groups living above the poverty line.
| Age Bracket | Male | Female |
| Under 5 Years | 0 (0.0%) | 8 (100.0%) |
| 5 Years | 0 (0.0%) | 0 (0.0%) |
| 6 to 11 Years | 4 (100.0%) | 15 (100.0%) |
| 12 to 14 Years | 0 (0.0%) | 2 (100.0%) |
| 15 Years | 0 (0.0%) | 0 (0.0%) |
| 16 and 17 Years | 6 (100.0%) | 5 (100.0%) |
| 18 to 24 Years | 5 (100.0%) | 0 (0.0%) |
| 25 to 34 Years | 4 (100.0%) | 22 (100.0%) |
| 35 to 44 Years | 0 (0.0%) | 0 (0.0%) |
| 45 to 54 Years | 3 (10.0%) | 33 (78.6%) |
| 55 to 64 Years | 72 (100.0%) | 27 (67.5%) |
| 65 to 74 Years | 48 (90.6%) | 54 (58.1%) |
| 75 Years and over | 49 (100.0%) | 26 (83.9%) |
| Total | 191 (85.7%) | 192 (74.4%) |
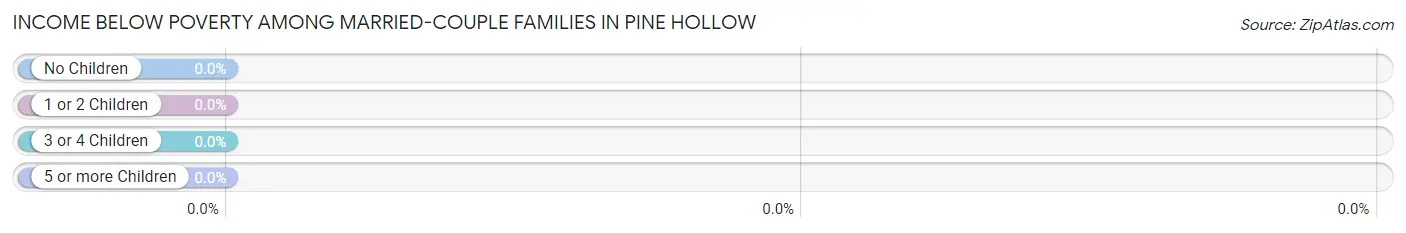
Income Below Poverty Among Married-Couple Families in Pine Hollow
| Children | Above Poverty | Below Poverty |
| No Children | 88 (100.0%) | 0 (0.0%) |
| 1 or 2 Children | 29 (100.0%) | 0 (0.0%) |
| 3 or 4 Children | 0 (0.0%) | 0 (0.0%) |
| 5 or more Children | 0 (0.0%) | 0 (0.0%) |
| Total | 117 (100.0%) | 0 (0.0%) |
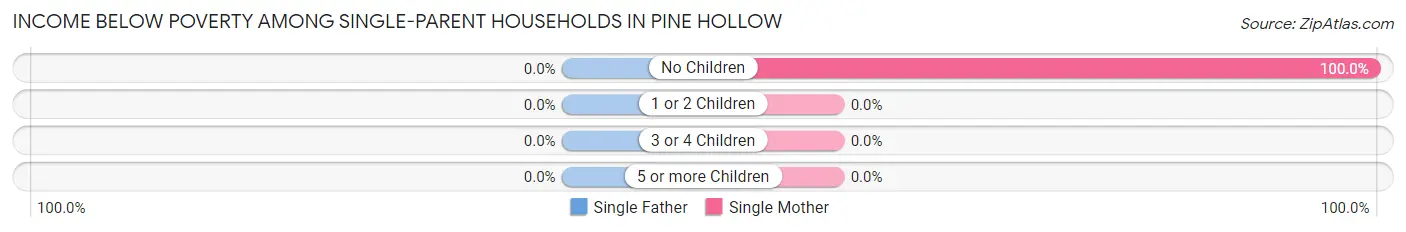
Income Below Poverty Among Single-Parent Households in Pine Hollow
| Children | Single Father | Single Mother |
| No Children | 0 (0.0%) | 34 (100.0%) |
| 1 or 2 Children | 0 (0.0%) | 0 (0.0%) |
| 3 or 4 Children | 0 (0.0%) | 0 (0.0%) |
| 5 or more Children | 0 (0.0%) | 0 (0.0%) |
| Total | 0 (0.0%) | 34 (100.0%) |
Income Below Poverty Among Married-Couple vs Single-Parent Households in Pine Hollow
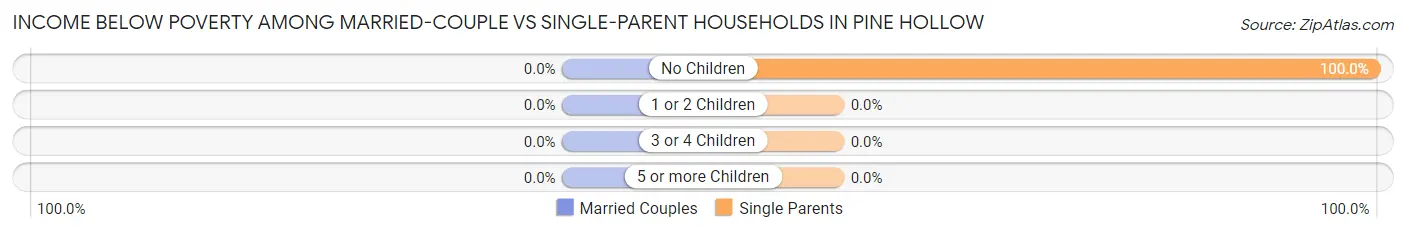
| Children | Married-Couple Families | Single-Parent Households |
| No Children | 0 (0.0%) | 34 (100.0%) |
| 1 or 2 Children | 0 (0.0%) | 0 (0.0%) |
| 3 or 4 Children | 0 (0.0%) | 0 (0.0%) |
| 5 or more Children | 0 (0.0%) | 0 (0.0%) |
| Total | 0 (0.0%) | 34 (100.0%) |
Employment Characteristics in Pine Hollow
Employment by Class of Employer in Pine Hollow
Among the 158 employed individuals in Pine Hollow, private company employees (109 | 69.0%), not-for-profit organizations (38 | 24.0%), and self-employed (not incorporated) (7 | 4.4%) make up the most common classes of employment.
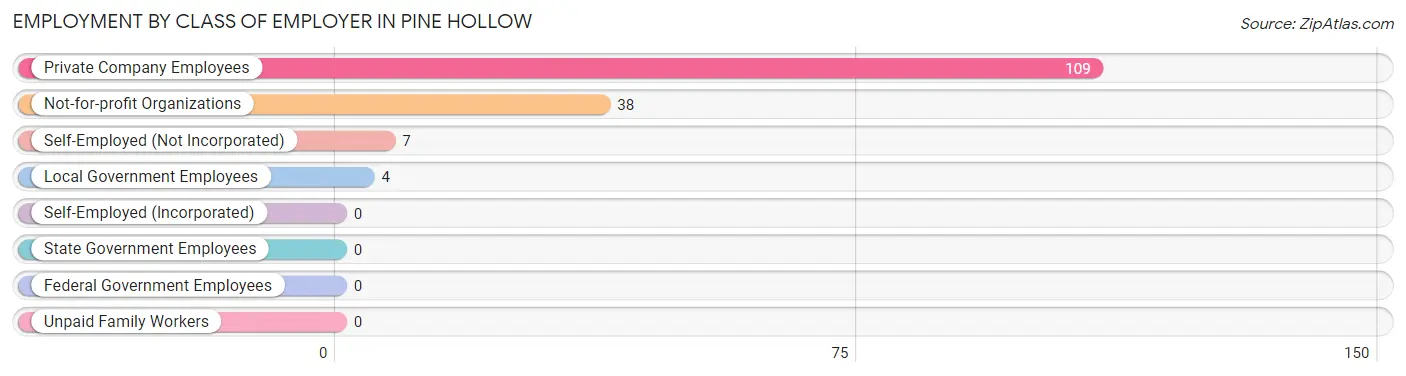
| Employer Class | # Employees | % Employees |
| Private Company Employees | 109 | 69.0% |
| Self-Employed (Incorporated) | 0 | 0.0% |
| Self-Employed (Not Incorporated) | 7 | 4.4% |
| Not-for-profit Organizations | 38 | 24.0% |
| Local Government Employees | 4 | 2.5% |
| State Government Employees | 0 | 0.0% |
| Federal Government Employees | 0 | 0.0% |
| Unpaid Family Workers | 0 | 0.0% |
| Total | 158 | 100.0% |
Employment Status by Age in Pine Hollow
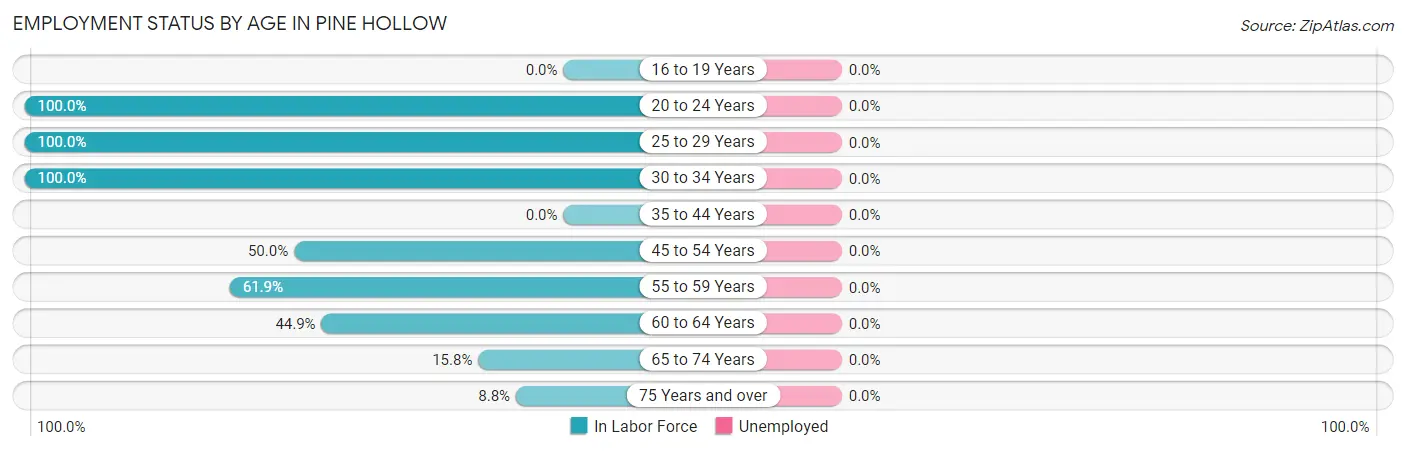
| Age Bracket | In Labor Force | Unemployed |
| 16 to 19 Years | 0 (0.0%) | 0 (0.0%) |
| 20 to 24 Years | 5 (100.0%) | 0 (0.0%) |
| 25 to 29 Years | 18 (100.0%) | 0 (0.0%) |
| 30 to 34 Years | 8 (100.0%) | 0 (0.0%) |
| 35 to 44 Years | 0 (0.0%) | 0 (0.0%) |
| 45 to 54 Years | 36 (50.0%) | 0 (0.0%) |
| 55 to 59 Years | 39 (61.9%) | 0 (0.0%) |
| 60 to 64 Years | 22 (44.9%) | 0 (0.0%) |
| 65 to 74 Years | 23 (15.8%) | 0 (0.0%) |
| 75 Years and over | 7 (8.8%) | 0 (0.0%) |
| Total | 158 (35.0%) | 0 (0.0%) |
Employment Status by Educational Attainment in Pine Hollow
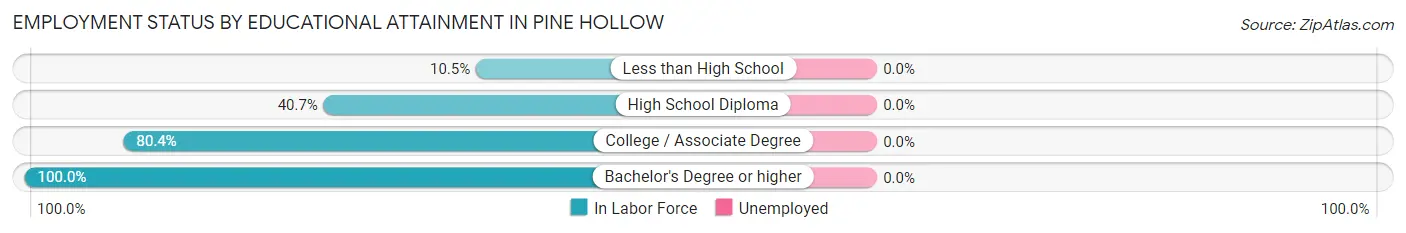
| Educational Attainment | In Labor Force | Unemployed |
| Less than High School | 4 (10.5%) | 0 (0.0%) |
| High School Diploma | 22 (40.7%) | 0 (0.0%) |
| College / Associate Degree | 86 (80.4%) | 0 (0.0%) |
| Bachelor's Degree or higher | 11 (100.0%) | 0 (0.0%) |
| Total | 123 (58.6%) | 0 (0.0%) |
Employment Occupations by Sex in Pine Hollow
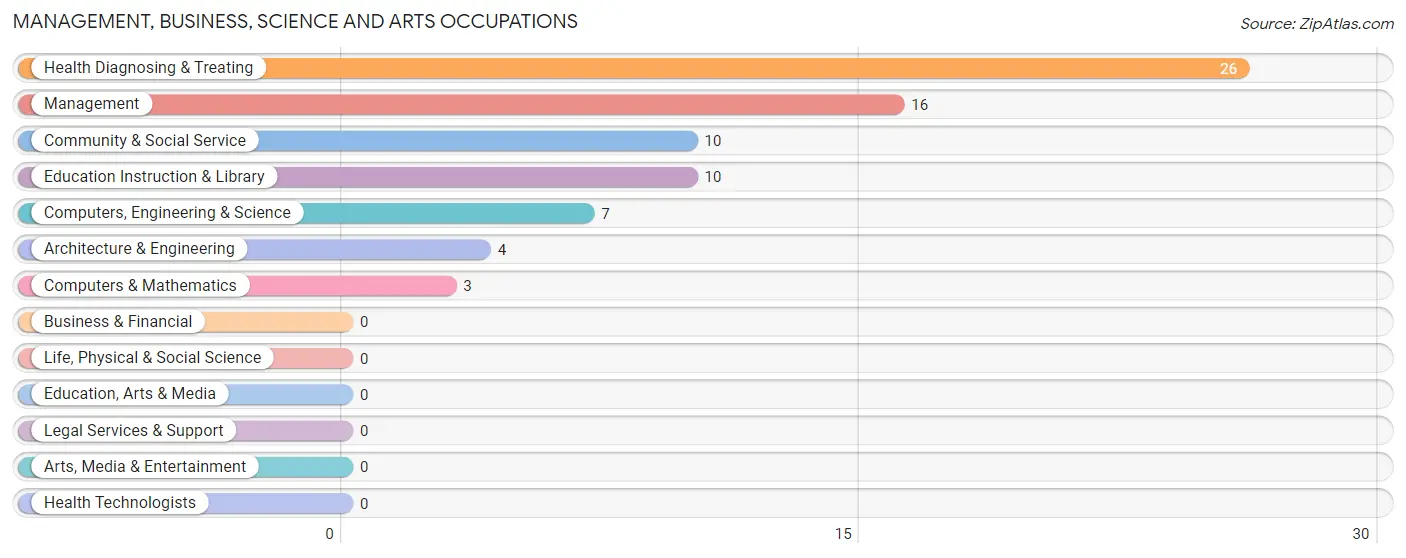
Management, Business, Science and Arts Occupations
The most common Management, Business, Science and Arts occupations in Pine Hollow are Health Diagnosing & Treating (26 | 16.5%), Management (16 | 10.1%), Community & Social Service (10 | 6.3%), Education Instruction & Library (10 | 6.3%), and Computers, Engineering & Science (7 | 4.4%).
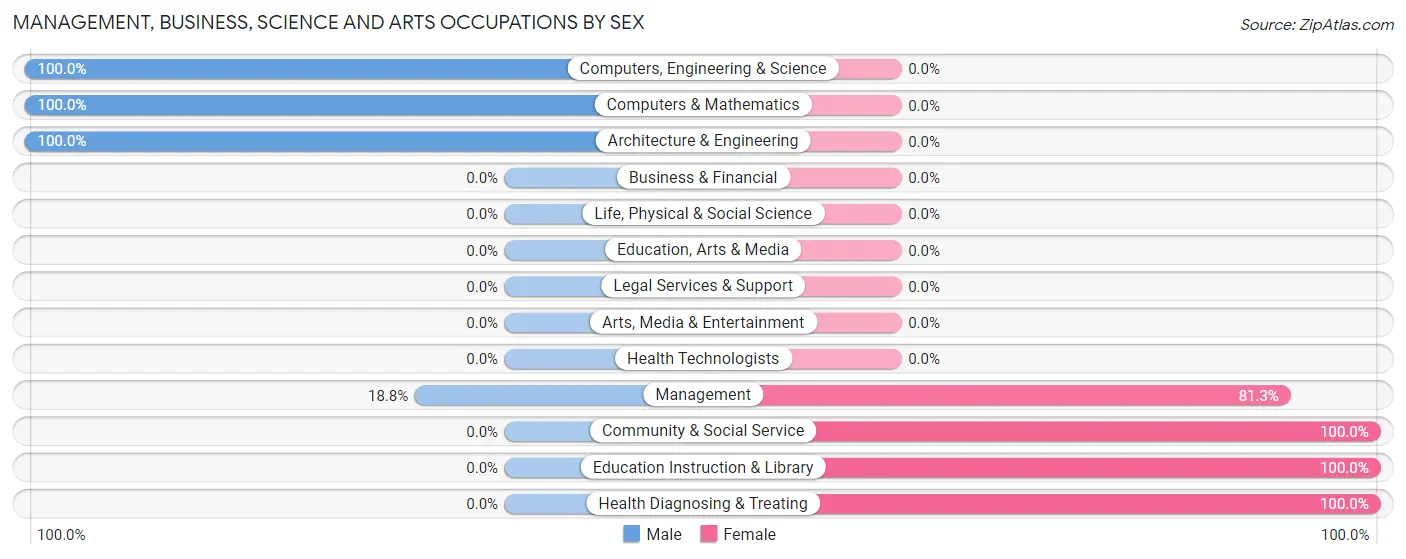
Management, Business, Science and Arts Occupations by Sex
Within the Management, Business, Science and Arts occupations in Pine Hollow, the most male-oriented occupations are Computers, Engineering & Science (100.0%), Computers & Mathematics (100.0%), and Architecture & Engineering (100.0%), while the most female-oriented occupations are Community & Social Service (100.0%), Education Instruction & Library (100.0%), and Health Diagnosing & Treating (100.0%).
| Occupation | Male | Female |
| Management | 3 (18.8%) | 13 (81.2%) |
| Business & Financial | 0 (0.0%) | 0 (0.0%) |
| Computers, Engineering & Science | 7 (100.0%) | 0 (0.0%) |
| Computers & Mathematics | 3 (100.0%) | 0 (0.0%) |
| Architecture & Engineering | 4 (100.0%) | 0 (0.0%) |
| Life, Physical & Social Science | 0 (0.0%) | 0 (0.0%) |
| Community & Social Service | 0 (0.0%) | 10 (100.0%) |
| Education, Arts & Media | 0 (0.0%) | 0 (0.0%) |
| Legal Services & Support | 0 (0.0%) | 0 (0.0%) |
| Education Instruction & Library | 0 (0.0%) | 10 (100.0%) |
| Arts, Media & Entertainment | 0 (0.0%) | 0 (0.0%) |
| Health Diagnosing & Treating | 0 (0.0%) | 26 (100.0%) |
| Health Technologists | 0 (0.0%) | 0 (0.0%) |
| Total (Category) | 10 (17.0%) | 49 (83.1%) |
| Total (Overall) | 65 (41.1%) | 93 (58.9%) |
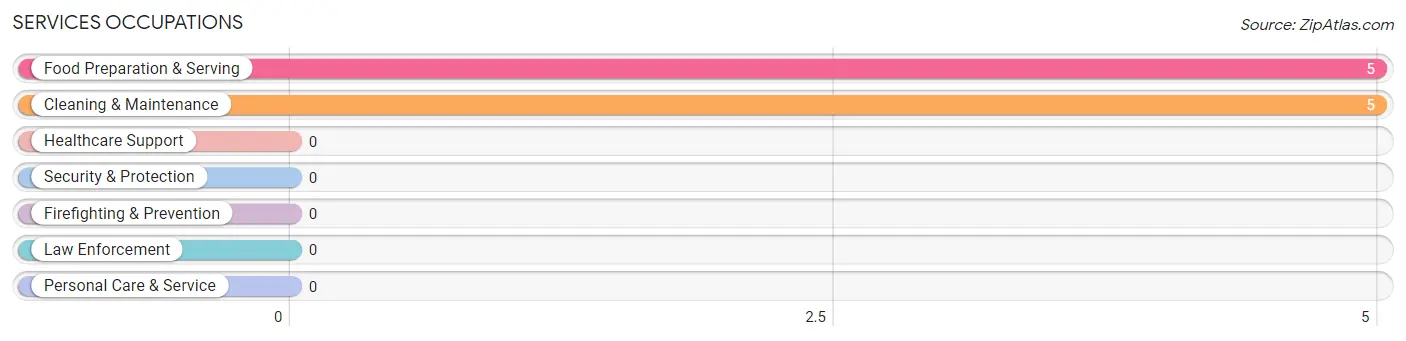
Services Occupations
The most common Services occupations in Pine Hollow are Food Preparation & Serving (5 | 3.2%), and Cleaning & Maintenance (5 | 3.2%).
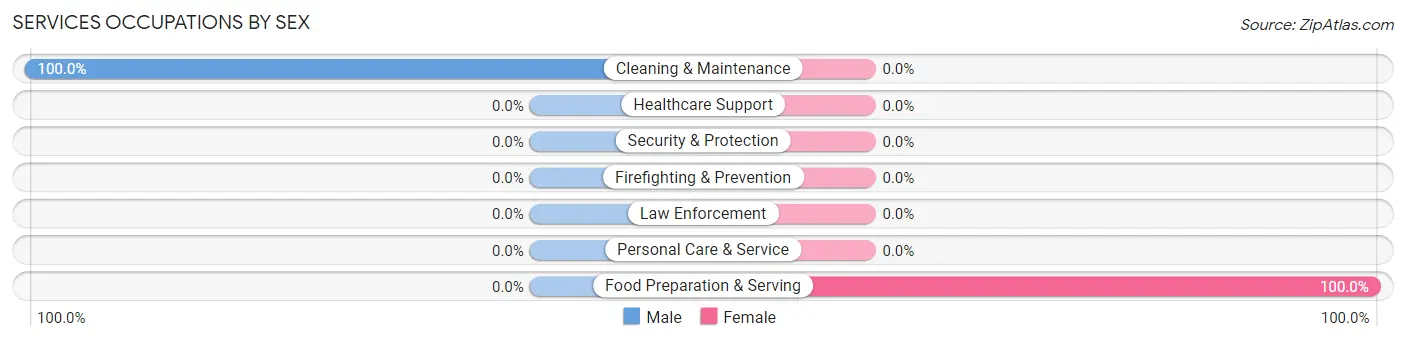
Services Occupations by Sex
| Occupation | Male | Female |
| Healthcare Support | 0 (0.0%) | 0 (0.0%) |
| Security & Protection | 0 (0.0%) | 0 (0.0%) |
| Firefighting & Prevention | 0 (0.0%) | 0 (0.0%) |
| Law Enforcement | 0 (0.0%) | 0 (0.0%) |
| Food Preparation & Serving | 0 (0.0%) | 5 (100.0%) |
| Cleaning & Maintenance | 5 (100.0%) | 0 (0.0%) |
| Personal Care & Service | 0 (0.0%) | 0 (0.0%) |
| Total (Category) | 5 (50.0%) | 5 (50.0%) |
| Total (Overall) | 65 (41.1%) | 93 (58.9%) |
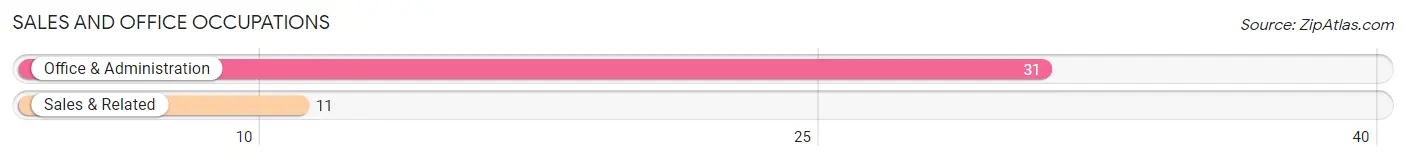
Sales and Office Occupations
The most common Sales and Office occupations in Pine Hollow are Office & Administration (31 | 19.6%), and Sales & Related (11 | 7.0%).
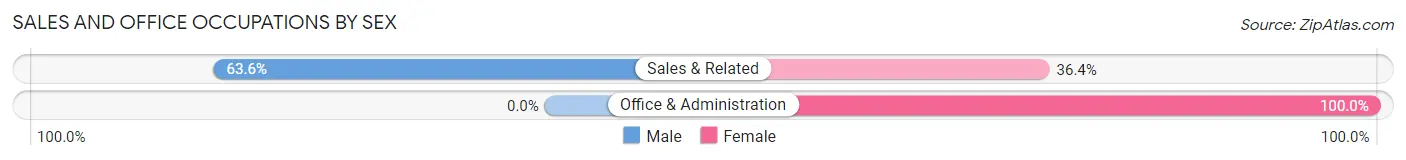
Sales and Office Occupations by Sex
| Occupation | Male | Female |
| Sales & Related | 7 (63.6%) | 4 (36.4%) |
| Office & Administration | 0 (0.0%) | 31 (100.0%) |
| Total (Category) | 7 (16.7%) | 35 (83.3%) |
| Total (Overall) | 65 (41.1%) | 93 (58.9%) |
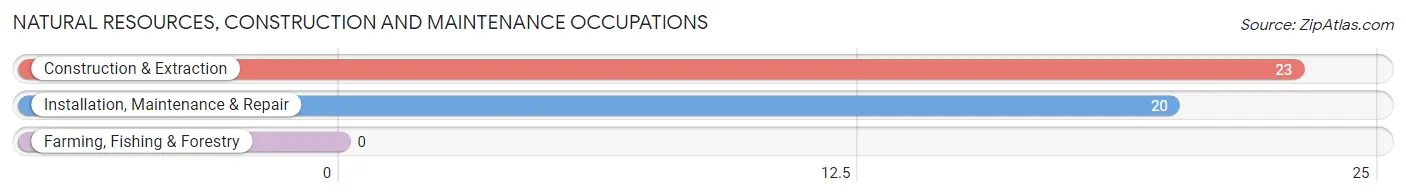
Natural Resources, Construction and Maintenance Occupations
The most common Natural Resources, Construction and Maintenance occupations in Pine Hollow are Construction & Extraction (23 | 14.6%), and Installation, Maintenance & Repair (20 | 12.7%).
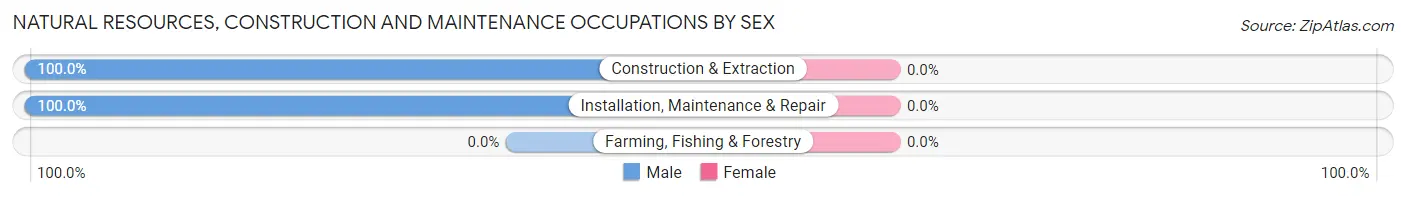
Natural Resources, Construction and Maintenance Occupations by Sex
| Occupation | Male | Female |
| Farming, Fishing & Forestry | 0 (0.0%) | 0 (0.0%) |
| Construction & Extraction | 23 (100.0%) | 0 (0.0%) |
| Installation, Maintenance & Repair | 20 (100.0%) | 0 (0.0%) |
| Total (Category) | 43 (100.0%) | 0 (0.0%) |
| Total (Overall) | 65 (41.1%) | 93 (58.9%) |
Production, Transportation and Moving Occupations
The most common Production, Transportation and Moving occupations in Pine Hollow are , and Production (4 | 2.5%).
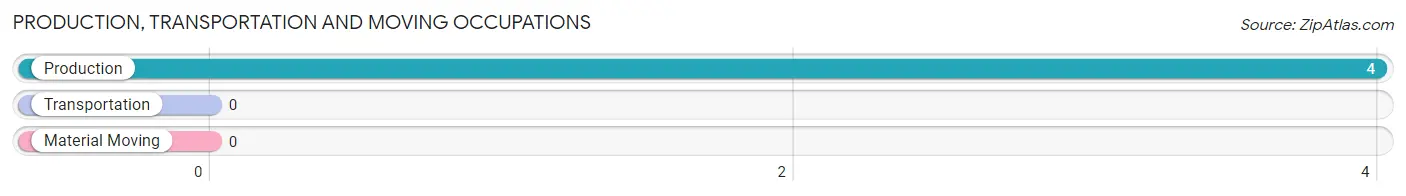
Production, Transportation and Moving Occupations by Sex
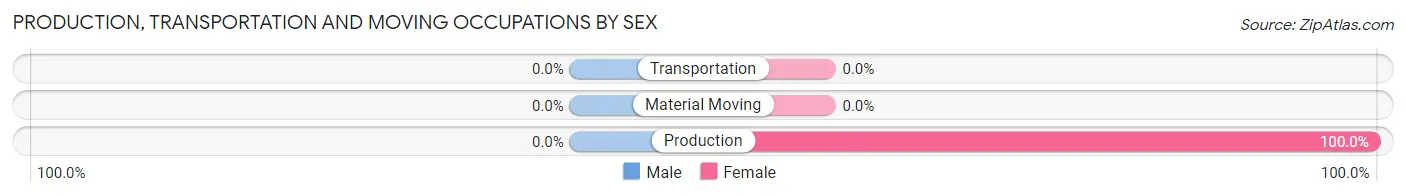
| Occupation | Male | Female |
| Production | 0 (0.0%) | 4 (100.0%) |
| Transportation | 0 (0.0%) | 0 (0.0%) |
| Material Moving | 0 (0.0%) | 0 (0.0%) |
| Total (Category) | 0 (0.0%) | 4 (100.0%) |
| Total (Overall) | 65 (41.1%) | 93 (58.9%) |
Employment Industries by Sex in Pine Hollow
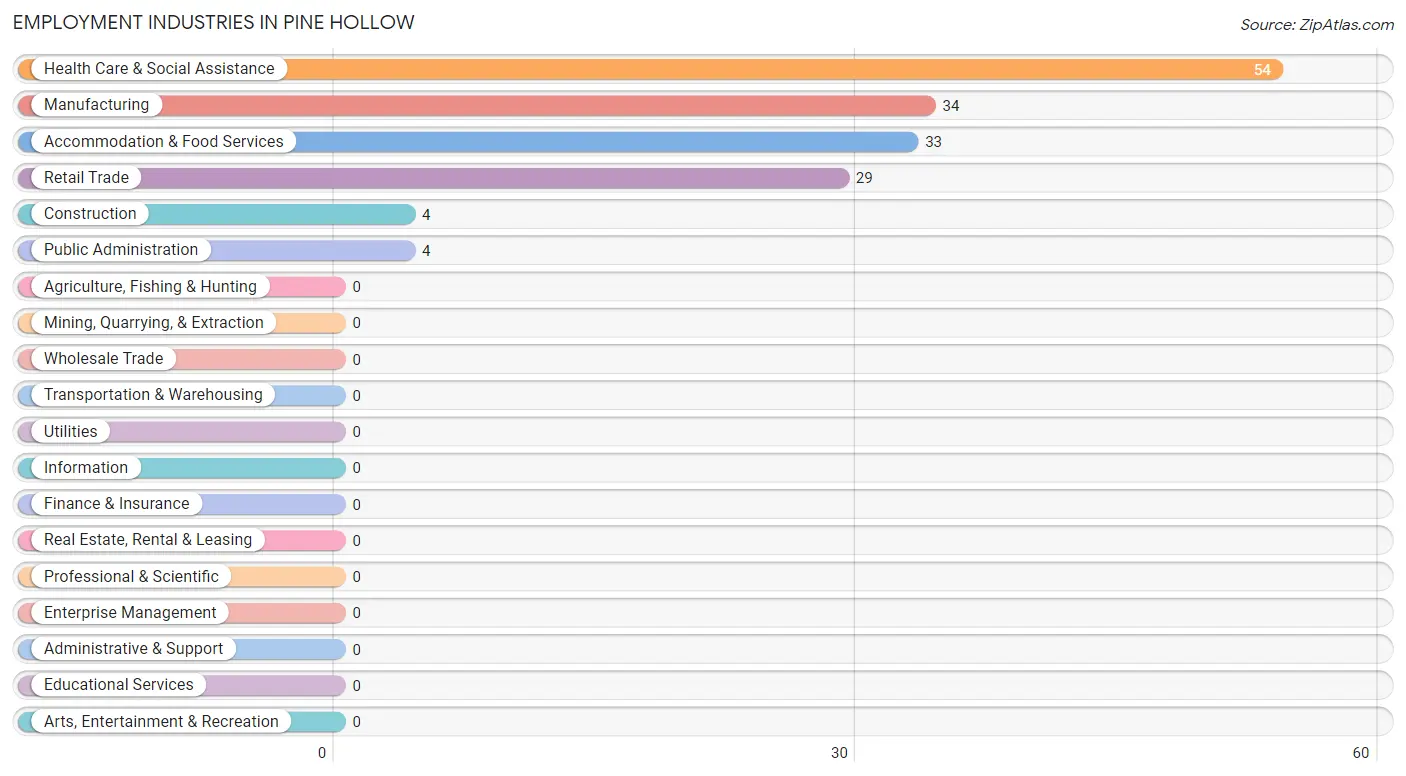
Employment Industries in Pine Hollow
The major employment industries in Pine Hollow include Health Care & Social Assistance (54 | 34.2%), Manufacturing (34 | 21.5%), Accommodation & Food Services (33 | 20.9%), Retail Trade (29 | 18.3%), and Construction (4 | 2.5%).
Employment Industries by Sex in Pine Hollow
The Pine Hollow industries that see more men than women are Construction (100.0%), Manufacturing (70.6%), and Health Care & Social Assistance (40.7%), whereas the industries that tend to have a higher number of women are Public Administration (100.0%), Retail Trade (75.9%), and Accommodation & Food Services (75.8%).
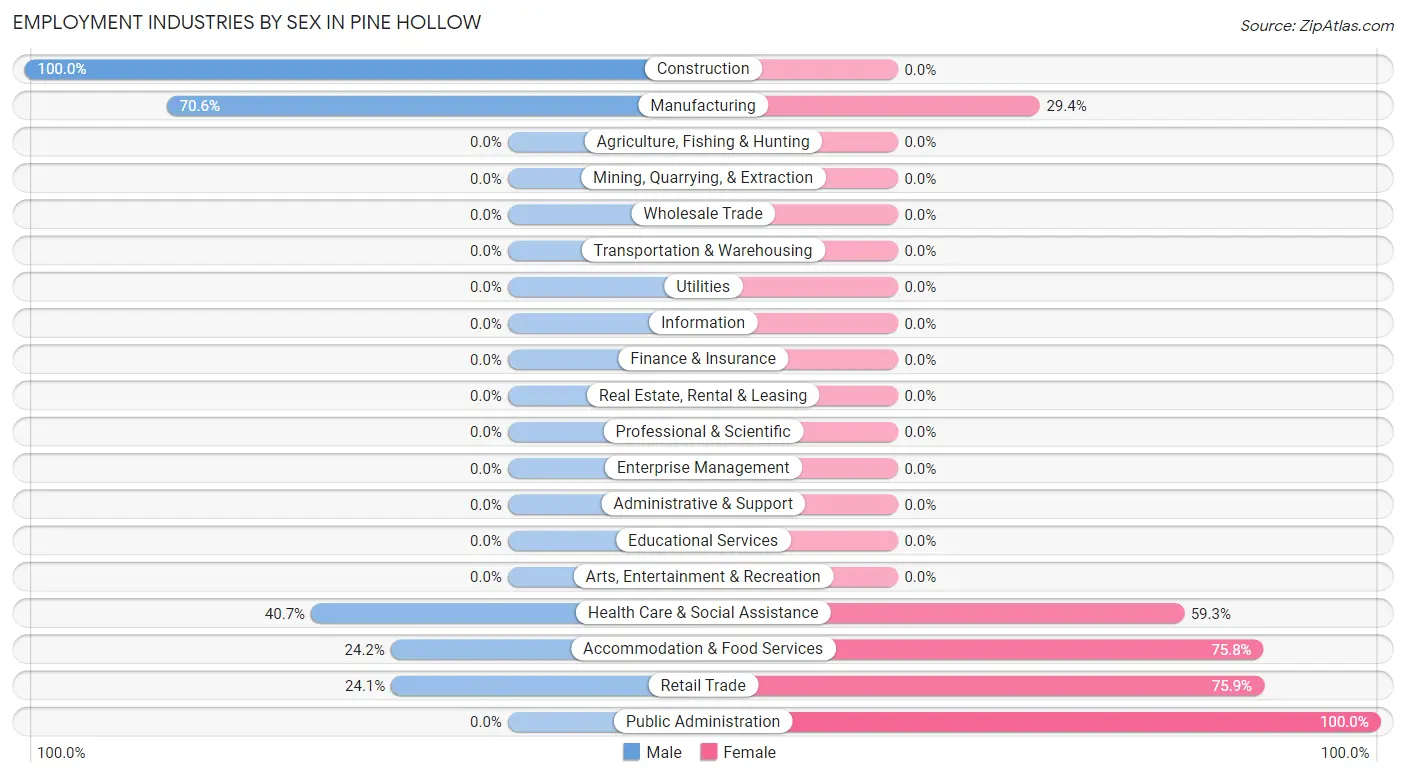
| Industry | Male | Female |
| Agriculture, Fishing & Hunting | 0 (0.0%) | 0 (0.0%) |
| Mining, Quarrying, & Extraction | 0 (0.0%) | 0 (0.0%) |
| Construction | 4 (100.0%) | 0 (0.0%) |
| Manufacturing | 24 (70.6%) | 10 (29.4%) |
| Wholesale Trade | 0 (0.0%) | 0 (0.0%) |
| Retail Trade | 7 (24.1%) | 22 (75.9%) |
| Transportation & Warehousing | 0 (0.0%) | 0 (0.0%) |
| Utilities | 0 (0.0%) | 0 (0.0%) |
| Information | 0 (0.0%) | 0 (0.0%) |
| Finance & Insurance | 0 (0.0%) | 0 (0.0%) |
| Real Estate, Rental & Leasing | 0 (0.0%) | 0 (0.0%) |
| Professional & Scientific | 0 (0.0%) | 0 (0.0%) |
| Enterprise Management | 0 (0.0%) | 0 (0.0%) |
| Administrative & Support | 0 (0.0%) | 0 (0.0%) |
| Educational Services | 0 (0.0%) | 0 (0.0%) |
| Health Care & Social Assistance | 22 (40.7%) | 32 (59.3%) |
| Arts, Entertainment & Recreation | 0 (0.0%) | 0 (0.0%) |
| Accommodation & Food Services | 8 (24.2%) | 25 (75.8%) |
| Public Administration | 0 (0.0%) | 4 (100.0%) |
| Total | 65 (41.1%) | 93 (58.9%) |
Education in Pine Hollow
School Enrollment in Pine Hollow
The most common levels of schooling among the 32 students in Pine Hollow are kindergarten (15 | 46.9%), high school (13 | 40.6%), and elementary school (4 | 12.5%).
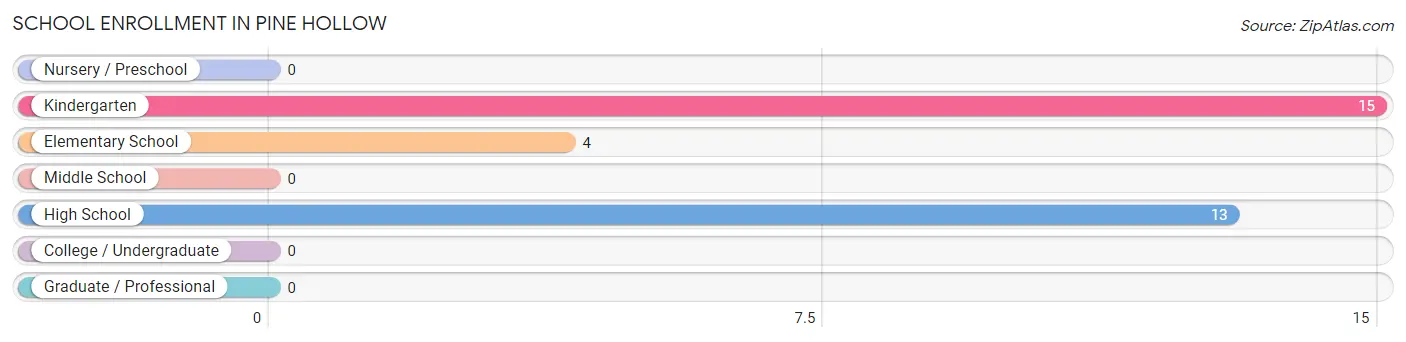
| School Level | # Students | % Students |
| Nursery / Preschool | 0 | 0.0% |
| Kindergarten | 15 | 46.9% |
| Elementary School | 4 | 12.5% |
| Middle School | 0 | 0.0% |
| High School | 13 | 40.6% |
| College / Undergraduate | 0 | 0.0% |
| Graduate / Professional | 0 | 0.0% |
| Total | 32 | 100.0% |
School Enrollment by Age by Funding Source in Pine Hollow
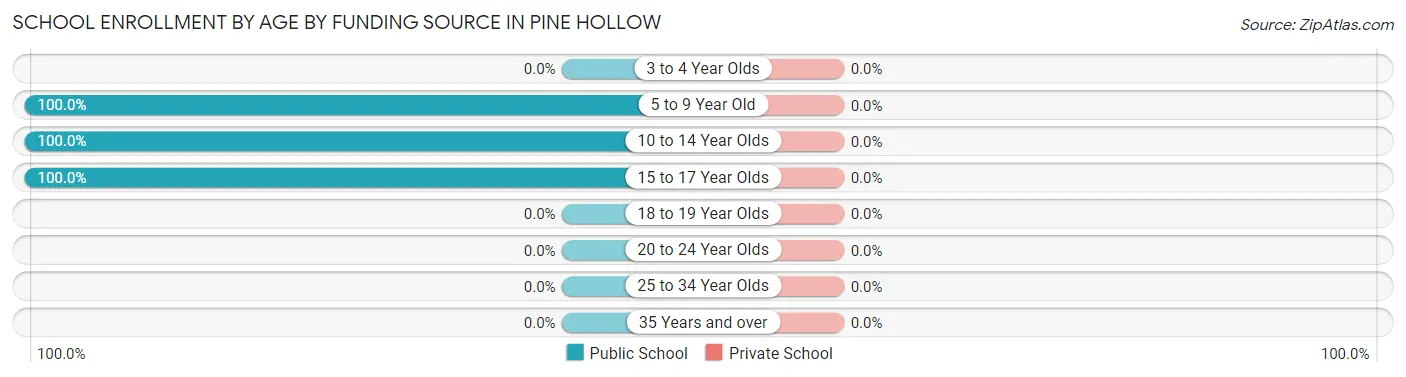
| Age Bracket | Public School | Private School |
| 3 to 4 Year Olds | 0 (0.0%) | 0 (0.0%) |
| 5 to 9 Year Old | 19 (100.0%) | 0 (0.0%) |
| 10 to 14 Year Olds | 2 (100.0%) | 0 (0.0%) |
| 15 to 17 Year Olds | 11 (100.0%) | 0 (0.0%) |
| 18 to 19 Year Olds | 0 (0.0%) | 0 (0.0%) |
| 20 to 24 Year Olds | 0 (0.0%) | 0 (0.0%) |
| 25 to 34 Year Olds | 0 (0.0%) | 0 (0.0%) |
| 35 Years and over | 0 (0.0%) | 0 (0.0%) |
| Total | 32 (100.0%) | 0 (0.0%) |
Educational Attainment by Field of Study in Pine Hollow
Business (12 | 44.4%), education (11 | 40.7%), and arts & humanities (4 | 14.8%) are the most common fields of study among 27 individuals in Pine Hollow who have obtained a bachelor's degree or higher.
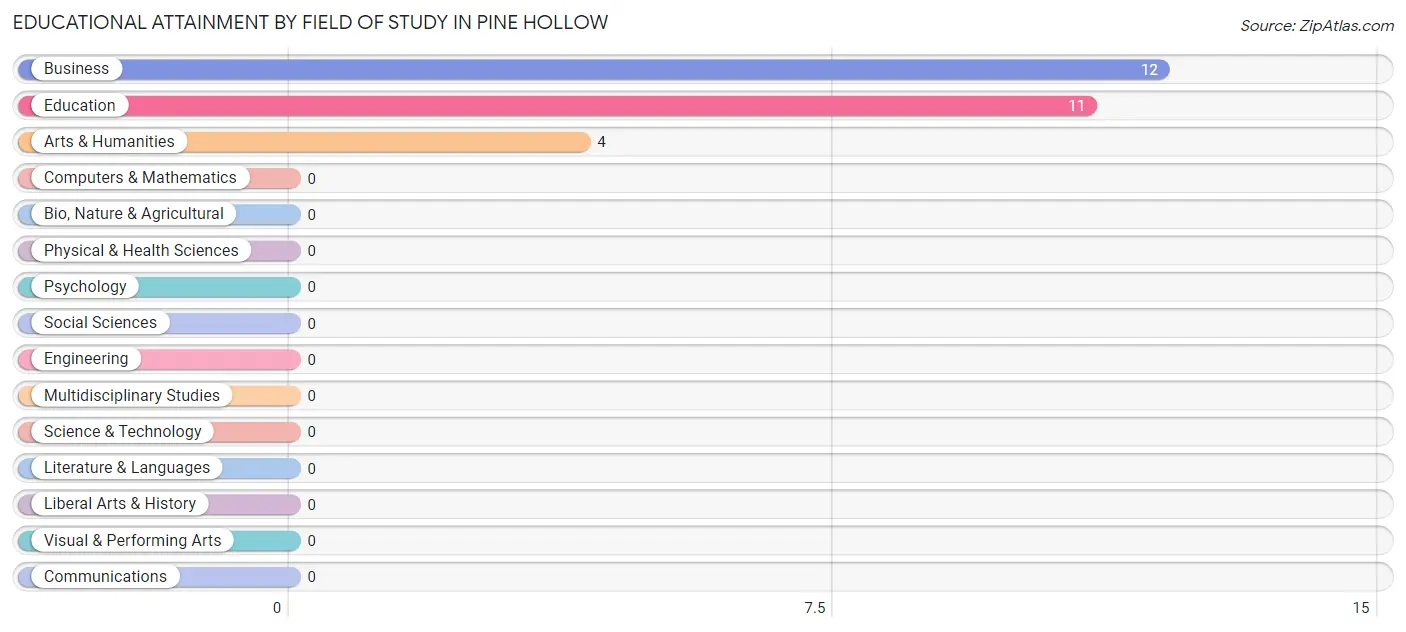
| Field of Study | # Graduates | % Graduates |
| Computers & Mathematics | 0 | 0.0% |
| Bio, Nature & Agricultural | 0 | 0.0% |
| Physical & Health Sciences | 0 | 0.0% |
| Psychology | 0 | 0.0% |
| Social Sciences | 0 | 0.0% |
| Engineering | 0 | 0.0% |
| Multidisciplinary Studies | 0 | 0.0% |
| Science & Technology | 0 | 0.0% |
| Business | 12 | 44.4% |
| Education | 11 | 40.7% |
| Literature & Languages | 0 | 0.0% |
| Liberal Arts & History | 0 | 0.0% |
| Visual & Performing Arts | 0 | 0.0% |
| Communications | 0 | 0.0% |
| Arts & Humanities | 4 | 14.8% |
| Total | 27 | 100.0% |
Transportation & Commute in Pine Hollow
Vehicle Availability by Sex in Pine Hollow
The most prevalent vehicle ownership categories in Pine Hollow are males with 2 vehicles (39, accounting for 60.0%) and females with 2 vehicles (38, making up 41.9%).
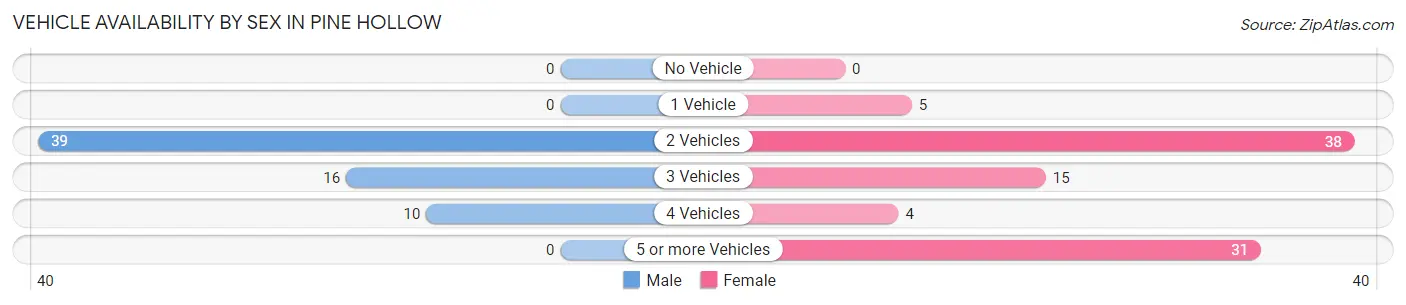
| Vehicles Available | Male | Female |
| No Vehicle | 0 (0.0%) | 0 (0.0%) |
| 1 Vehicle | 0 (0.0%) | 5 (5.4%) |
| 2 Vehicles | 39 (60.0%) | 38 (40.9%) |
| 3 Vehicles | 16 (24.6%) | 15 (16.1%) |
| 4 Vehicles | 10 (15.4%) | 4 (4.3%) |
| 5 or more Vehicles | 0 (0.0%) | 31 (33.3%) |
| Total | 65 (100.0%) | 93 (100.0%) |
Commute Time in Pine Hollow
The most frequently occuring commute durations in Pine Hollow are 30 to 34 minutes (48 commuters, 31.6%), 60 to 89 minutes (26 commuters, 17.1%), and 90 or more minutes (24 commuters, 15.8%).
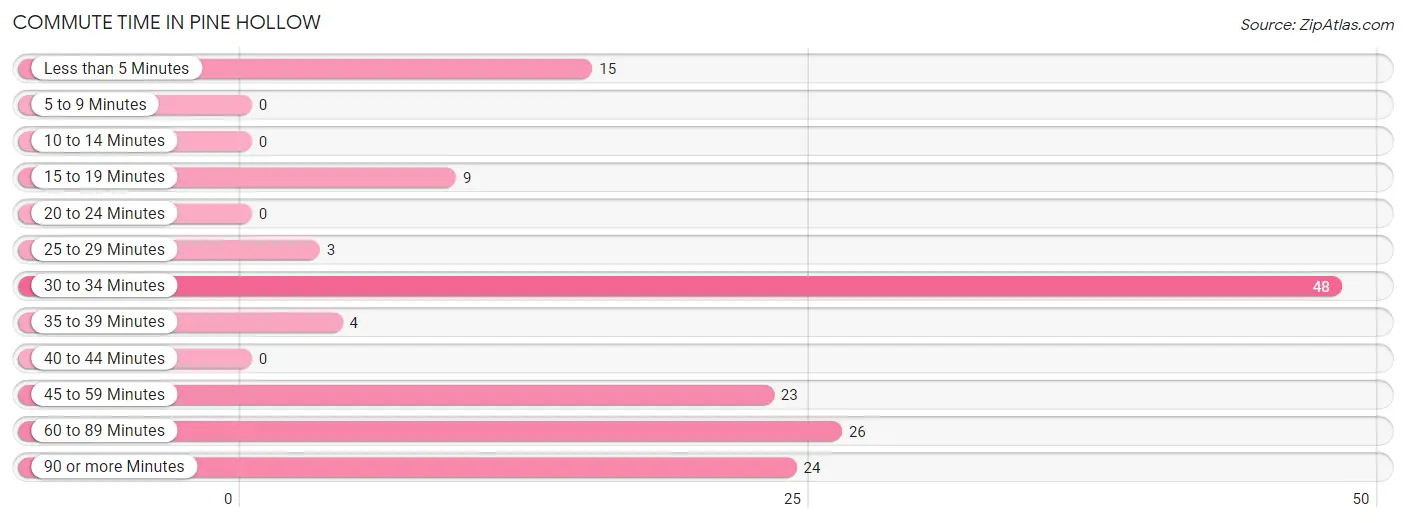
| Commute Time | # Commuters | % Commuters |
| Less than 5 Minutes | 15 | 9.9% |
| 5 to 9 Minutes | 0 | 0.0% |
| 10 to 14 Minutes | 0 | 0.0% |
| 15 to 19 Minutes | 9 | 5.9% |
| 20 to 24 Minutes | 0 | 0.0% |
| 25 to 29 Minutes | 3 | 2.0% |
| 30 to 34 Minutes | 48 | 31.6% |
| 35 to 39 Minutes | 4 | 2.6% |
| 40 to 44 Minutes | 0 | 0.0% |
| 45 to 59 Minutes | 23 | 15.1% |
| 60 to 89 Minutes | 26 | 17.1% |
| 90 or more Minutes | 24 | 15.8% |
Commute Time by Sex in Pine Hollow
The most common commute times in Pine Hollow are 30 to 34 minutes (30 commuters, 46.2%) for males and 60 to 89 minutes (26 commuters, 29.9%) for females.
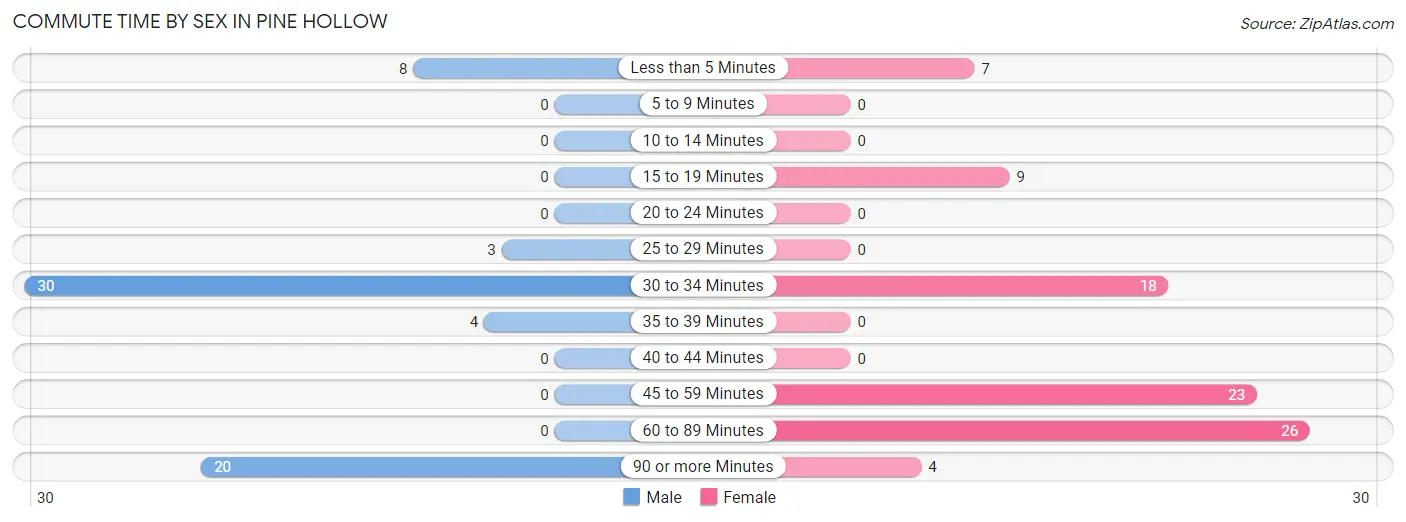
| Commute Time | Male | Female |
| Less than 5 Minutes | 8 (12.3%) | 7 (8.1%) |
| 5 to 9 Minutes | 0 (0.0%) | 0 (0.0%) |
| 10 to 14 Minutes | 0 (0.0%) | 0 (0.0%) |
| 15 to 19 Minutes | 0 (0.0%) | 9 (10.3%) |
| 20 to 24 Minutes | 0 (0.0%) | 0 (0.0%) |
| 25 to 29 Minutes | 3 (4.6%) | 0 (0.0%) |
| 30 to 34 Minutes | 30 (46.2%) | 18 (20.7%) |
| 35 to 39 Minutes | 4 (6.1%) | 0 (0.0%) |
| 40 to 44 Minutes | 0 (0.0%) | 0 (0.0%) |
| 45 to 59 Minutes | 0 (0.0%) | 23 (26.4%) |
| 60 to 89 Minutes | 0 (0.0%) | 26 (29.9%) |
| 90 or more Minutes | 20 (30.8%) | 4 (4.6%) |
Time of Departure to Work by Sex in Pine Hollow
The most frequent times of departure to work in Pine Hollow are 10:00 AM to 10:59 AM (29, 44.6%) for males and 7:00 AM to 7:29 AM (30, 34.5%) for females.
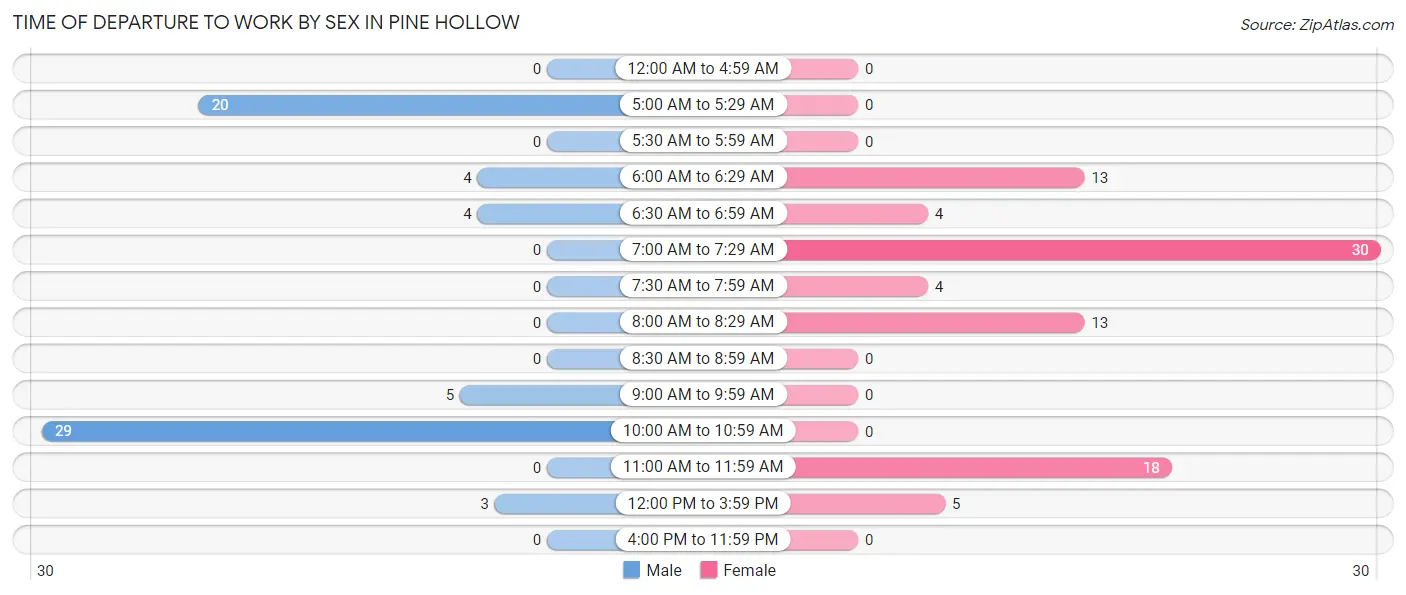
| Time of Departure | Male | Female |
| 12:00 AM to 4:59 AM | 0 (0.0%) | 0 (0.0%) |
| 5:00 AM to 5:29 AM | 20 (30.8%) | 0 (0.0%) |
| 5:30 AM to 5:59 AM | 0 (0.0%) | 0 (0.0%) |
| 6:00 AM to 6:29 AM | 4 (6.1%) | 13 (14.9%) |
| 6:30 AM to 6:59 AM | 4 (6.1%) | 4 (4.6%) |
| 7:00 AM to 7:29 AM | 0 (0.0%) | 30 (34.5%) |
| 7:30 AM to 7:59 AM | 0 (0.0%) | 4 (4.6%) |
| 8:00 AM to 8:29 AM | 0 (0.0%) | 13 (14.9%) |
| 8:30 AM to 8:59 AM | 0 (0.0%) | 0 (0.0%) |
| 9:00 AM to 9:59 AM | 5 (7.7%) | 0 (0.0%) |
| 10:00 AM to 10:59 AM | 29 (44.6%) | 0 (0.0%) |
| 11:00 AM to 11:59 AM | 0 (0.0%) | 18 (20.7%) |
| 12:00 PM to 3:59 PM | 3 (4.6%) | 5 (5.8%) |
| 4:00 PM to 11:59 PM | 0 (0.0%) | 0 (0.0%) |
| Total | 65 (100.0%) | 87 (100.0%) |
Housing Occupancy in Pine Hollow
Occupancy by Ownership in Pine Hollow
Of the total 224 dwellings in Pine Hollow, owner-occupied units account for 210 (93.8%), while renter-occupied units make up 14 (6.2%).
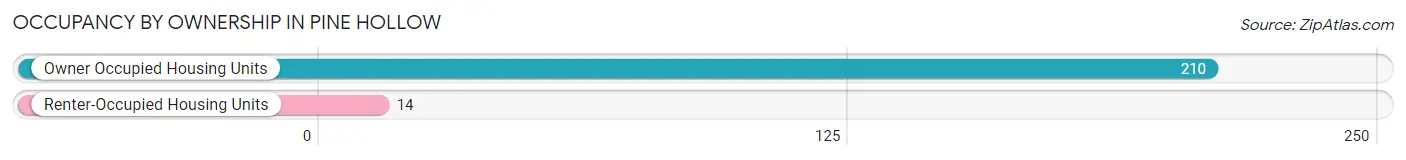
| Occupancy | # Housing Units | % Housing Units |
| Owner Occupied Housing Units | 210 | 93.8% |
| Renter-Occupied Housing Units | 14 | 6.2% |
| Total Occupied Housing Units | 224 | 100.0% |
Occupancy by Household Size in Pine Hollow
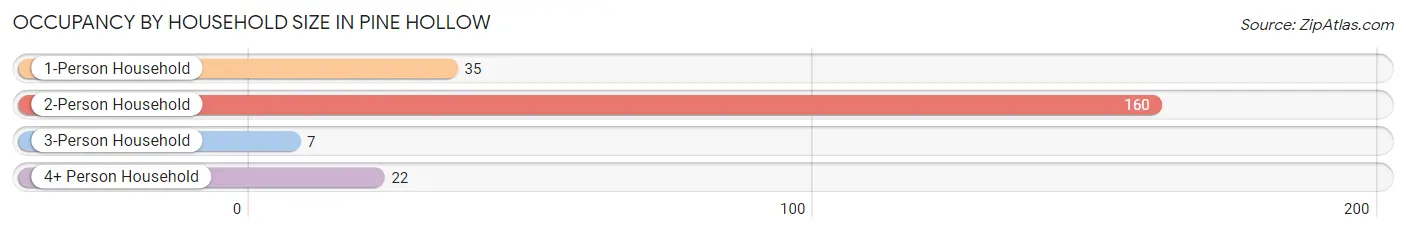
| Household Size | # Housing Units | % Housing Units |
| 1-Person Household | 35 | 15.6% |
| 2-Person Household | 160 | 71.4% |
| 3-Person Household | 7 | 3.1% |
| 4+ Person Household | 22 | 9.8% |
| Total Housing Units | 224 | 100.0% |
Occupancy by Ownership by Household Size in Pine Hollow
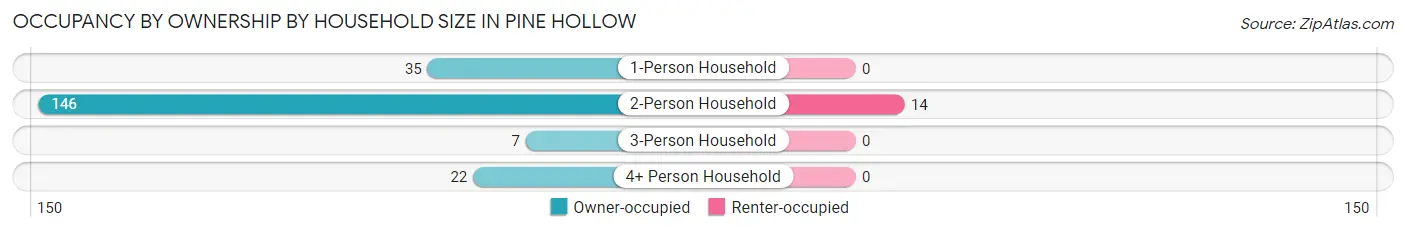
| Household Size | Owner-occupied | Renter-occupied |
| 1-Person Household | 35 (100.0%) | 0 (0.0%) |
| 2-Person Household | 146 (91.2%) | 14 (8.7%) |
| 3-Person Household | 7 (100.0%) | 0 (0.0%) |
| 4+ Person Household | 22 (100.0%) | 0 (0.0%) |
| Total Housing Units | 210 (93.8%) | 14 (6.2%) |
Occupancy by Educational Attainment in Pine Hollow
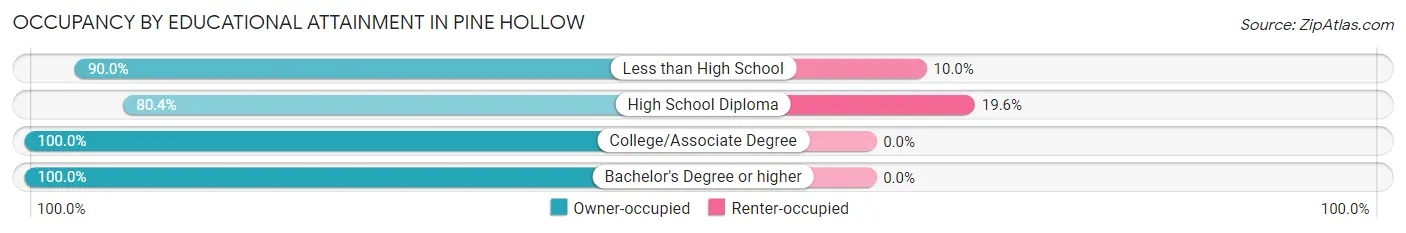
| Household Size | Owner-occupied | Renter-occupied |
| Less than High School | 45 (90.0%) | 5 (10.0%) |
| High School Diploma | 37 (80.4%) | 9 (19.6%) |
| College/Associate Degree | 116 (100.0%) | 0 (0.0%) |
| Bachelor's Degree or higher | 12 (100.0%) | 0 (0.0%) |
Occupancy by Age of Householder in Pine Hollow
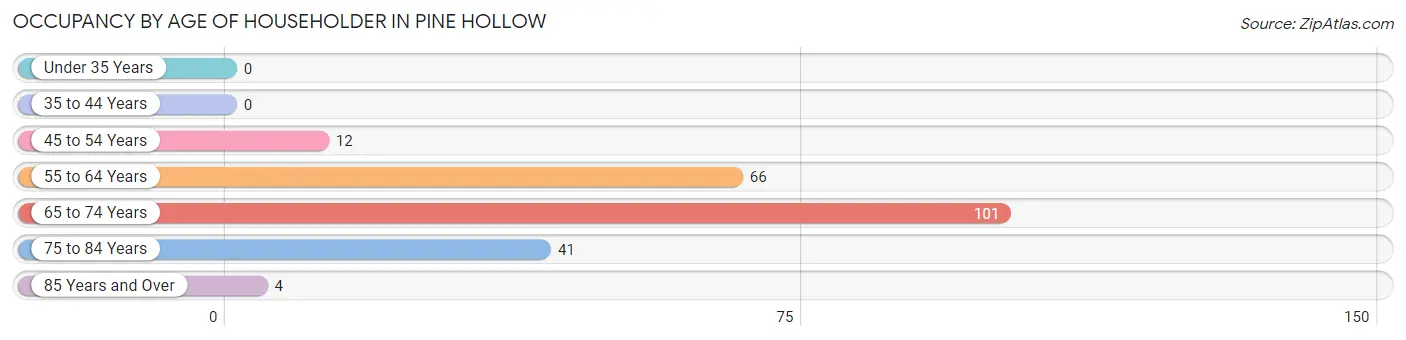
| Age Bracket | # Households | % Households |
| Under 35 Years | 0 | 0.0% |
| 35 to 44 Years | 0 | 0.0% |
| 45 to 54 Years | 12 | 5.4% |
| 55 to 64 Years | 66 | 29.5% |
| 65 to 74 Years | 101 | 45.1% |
| 75 to 84 Years | 41 | 18.3% |
| 85 Years and Over | 4 | 1.8% |
| Total | 224 | 100.0% |
Housing Finances in Pine Hollow
Median Income by Occupancy in Pine Hollow
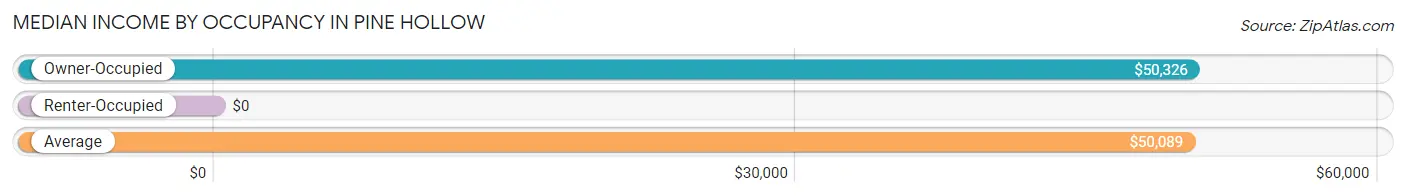
| Occupancy Type | # Households | Median Income |
| Owner-Occupied | 210 (93.8%) | $50,326 |
| Renter-Occupied | 14 (6.2%) | $0 |
| Average | 224 (100.0%) | $50,089 |
Occupancy by Householder Income Bracket in Pine Hollow
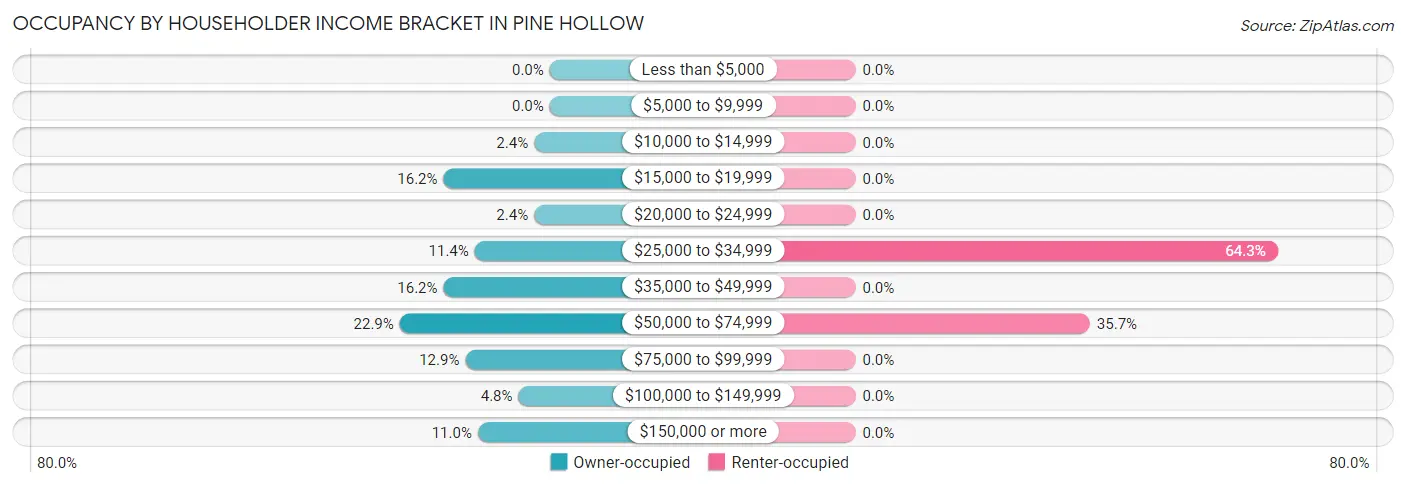
| Income Bracket | Owner-occupied | Renter-occupied |
| Less than $5,000 | 0 (0.0%) | 0 (0.0%) |
| $5,000 to $9,999 | 0 (0.0%) | 0 (0.0%) |
| $10,000 to $14,999 | 5 (2.4%) | 0 (0.0%) |
| $15,000 to $19,999 | 34 (16.2%) | 0 (0.0%) |
| $20,000 to $24,999 | 5 (2.4%) | 0 (0.0%) |
| $25,000 to $34,999 | 24 (11.4%) | 9 (64.3%) |
| $35,000 to $49,999 | 34 (16.2%) | 0 (0.0%) |
| $50,000 to $74,999 | 48 (22.9%) | 5 (35.7%) |
| $75,000 to $99,999 | 27 (12.9%) | 0 (0.0%) |
| $100,000 to $149,999 | 10 (4.8%) | 0 (0.0%) |
| $150,000 or more | 23 (11.0%) | 0 (0.0%) |
| Total | 210 (100.0%) | 14 (100.0%) |
Monthly Housing Cost Tiers in Pine Hollow
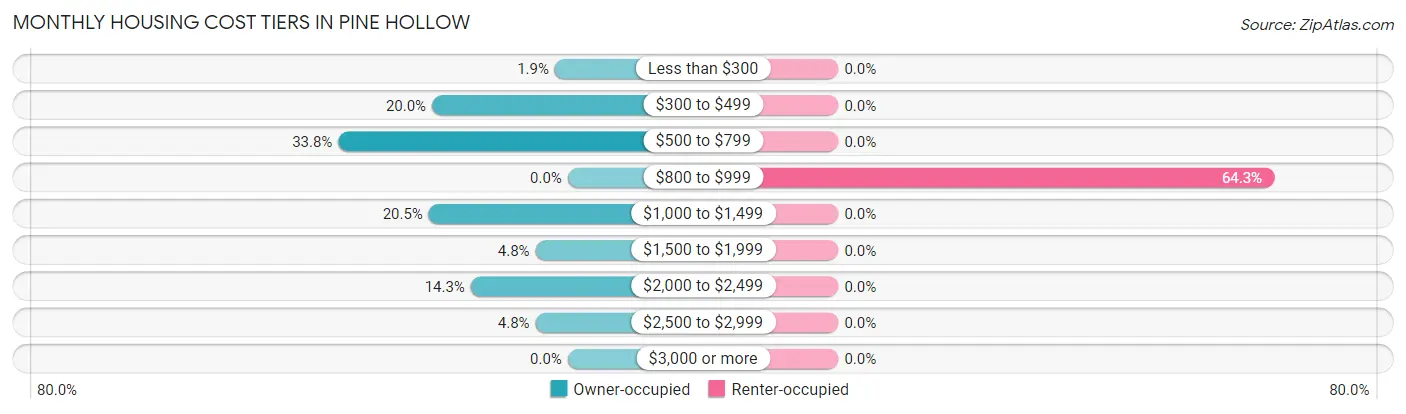
| Monthly Cost | Owner-occupied | Renter-occupied |
| Less than $300 | 4 (1.9%) | 0 (0.0%) |
| $300 to $499 | 42 (20.0%) | 0 (0.0%) |
| $500 to $799 | 71 (33.8%) | 0 (0.0%) |
| $800 to $999 | 0 (0.0%) | 9 (64.3%) |
| $1,000 to $1,499 | 43 (20.5%) | 0 (0.0%) |
| $1,500 to $1,999 | 10 (4.8%) | 0 (0.0%) |
| $2,000 to $2,499 | 30 (14.3%) | 0 (0.0%) |
| $2,500 to $2,999 | 10 (4.8%) | 0 (0.0%) |
| $3,000 or more | 0 (0.0%) | 0 (0.0%) |
| Total | 210 (100.0%) | 14 (100.0%) |
Physical Housing Characteristics in Pine Hollow
Housing Structures in Pine Hollow
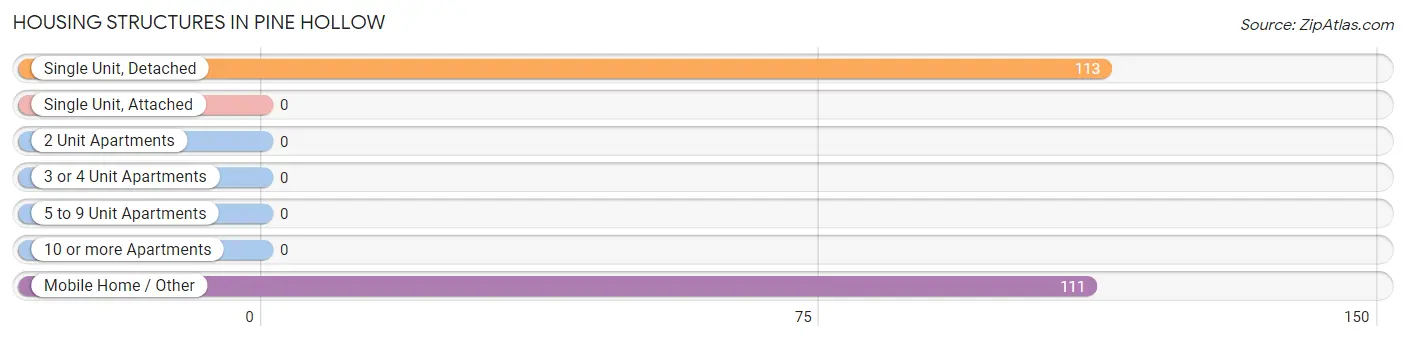
| Structure Type | # Housing Units | % Housing Units |
| Single Unit, Detached | 113 | 50.4% |
| Single Unit, Attached | 0 | 0.0% |
| 2 Unit Apartments | 0 | 0.0% |
| 3 or 4 Unit Apartments | 0 | 0.0% |
| 5 to 9 Unit Apartments | 0 | 0.0% |
| 10 or more Apartments | 0 | 0.0% |
| Mobile Home / Other | 111 | 49.5% |
| Total | 224 | 100.0% |
Housing Structures by Occupancy in Pine Hollow
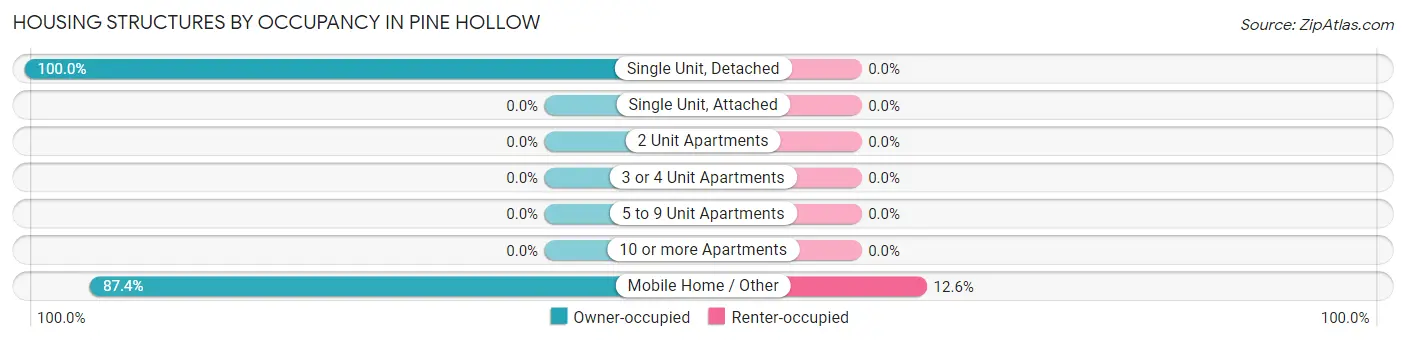
| Structure Type | Owner-occupied | Renter-occupied |
| Single Unit, Detached | 113 (100.0%) | 0 (0.0%) |
| Single Unit, Attached | 0 (0.0%) | 0 (0.0%) |
| 2 Unit Apartments | 0 (0.0%) | 0 (0.0%) |
| 3 or 4 Unit Apartments | 0 (0.0%) | 0 (0.0%) |
| 5 to 9 Unit Apartments | 0 (0.0%) | 0 (0.0%) |
| 10 or more Apartments | 0 (0.0%) | 0 (0.0%) |
| Mobile Home / Other | 97 (87.4%) | 14 (12.6%) |
| Total | 210 (93.8%) | 14 (6.2%) |
Housing Structures by Number of Rooms in Pine Hollow
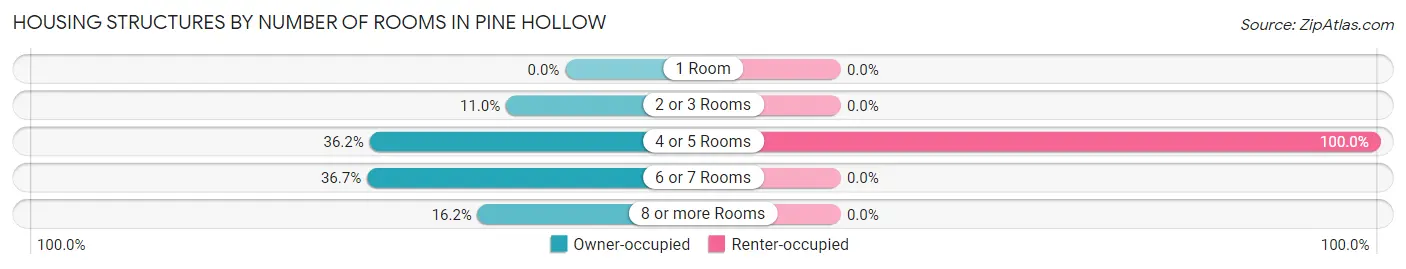
| Number of Rooms | Owner-occupied | Renter-occupied |
| 1 Room | 0 (0.0%) | 0 (0.0%) |
| 2 or 3 Rooms | 23 (11.0%) | 0 (0.0%) |
| 4 or 5 Rooms | 76 (36.2%) | 14 (100.0%) |
| 6 or 7 Rooms | 77 (36.7%) | 0 (0.0%) |
| 8 or more Rooms | 34 (16.2%) | 0 (0.0%) |
| Total | 210 (100.0%) | 14 (100.0%) |
Housing Structure by Heating Type in Pine Hollow
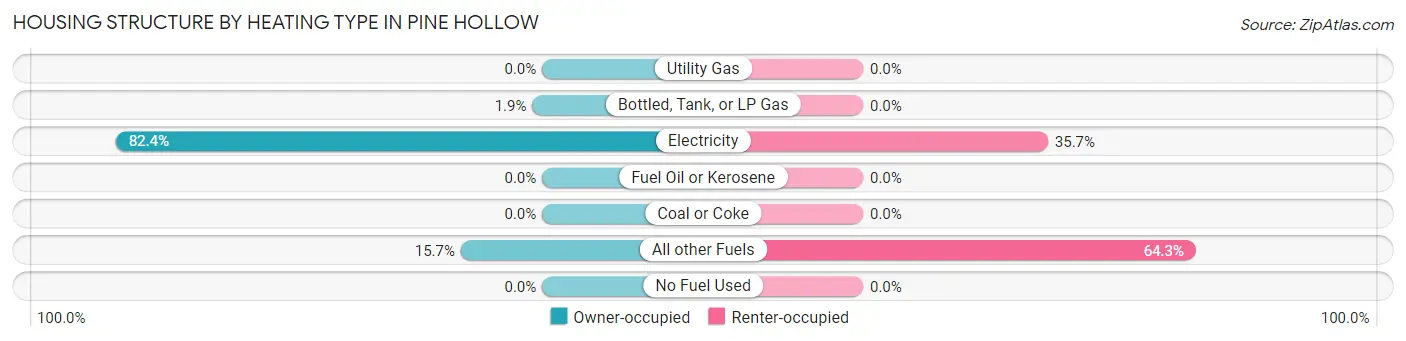
| Heating Type | Owner-occupied | Renter-occupied |
| Utility Gas | 0 (0.0%) | 0 (0.0%) |
| Bottled, Tank, or LP Gas | 4 (1.9%) | 0 (0.0%) |
| Electricity | 173 (82.4%) | 5 (35.7%) |
| Fuel Oil or Kerosene | 0 (0.0%) | 0 (0.0%) |
| Coal or Coke | 0 (0.0%) | 0 (0.0%) |
| All other Fuels | 33 (15.7%) | 9 (64.3%) |
| No Fuel Used | 0 (0.0%) | 0 (0.0%) |
| Total | 210 (100.0%) | 14 (100.0%) |
Household Vehicle Usage in Pine Hollow
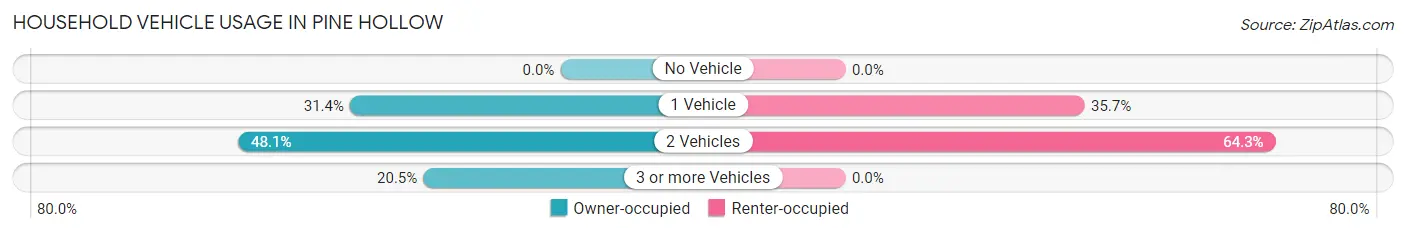
| Vehicles per Household | Owner-occupied | Renter-occupied |
| No Vehicle | 0 (0.0%) | 0 (0.0%) |
| 1 Vehicle | 66 (31.4%) | 5 (35.7%) |
| 2 Vehicles | 101 (48.1%) | 9 (64.3%) |
| 3 or more Vehicles | 43 (20.5%) | 0 (0.0%) |
| Total | 210 (100.0%) | 14 (100.0%) |
Real Estate & Mortgages in Pine Hollow
Real Estate and Mortgage Overview in Pine Hollow
| Characteristic | Without Mortgage | With Mortgage |
| Housing Units | 117 | 93 |
| Median Property Value | $199,000 | $262,500 |
| Median Household Income | $32,188 | $23 |
| Monthly Housing Costs | $539 | $0 |
| Real Estate Taxes | $1,750 | $0 |
Property Value by Mortgage Status in Pine Hollow
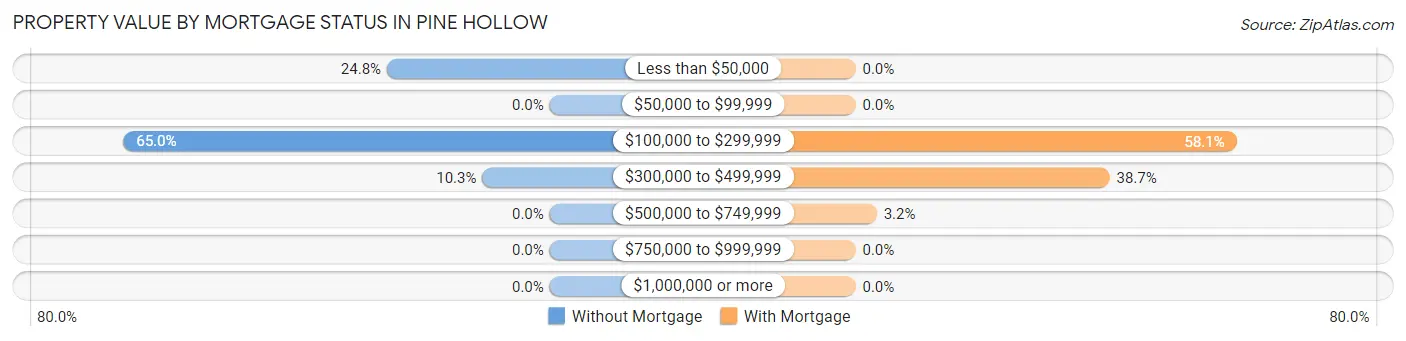
| Property Value | Without Mortgage | With Mortgage |
| Less than $50,000 | 29 (24.8%) | 0 (0.0%) |
| $50,000 to $99,999 | 0 (0.0%) | 0 (0.0%) |
| $100,000 to $299,999 | 76 (65.0%) | 54 (58.1%) |
| $300,000 to $499,999 | 12 (10.3%) | 36 (38.7%) |
| $500,000 to $749,999 | 0 (0.0%) | 3 (3.2%) |
| $750,000 to $999,999 | 0 (0.0%) | 0 (0.0%) |
| $1,000,000 or more | 0 (0.0%) | 0 (0.0%) |
| Total | 117 (100.0%) | 93 (100.0%) |
Household Income by Mortgage Status in Pine Hollow
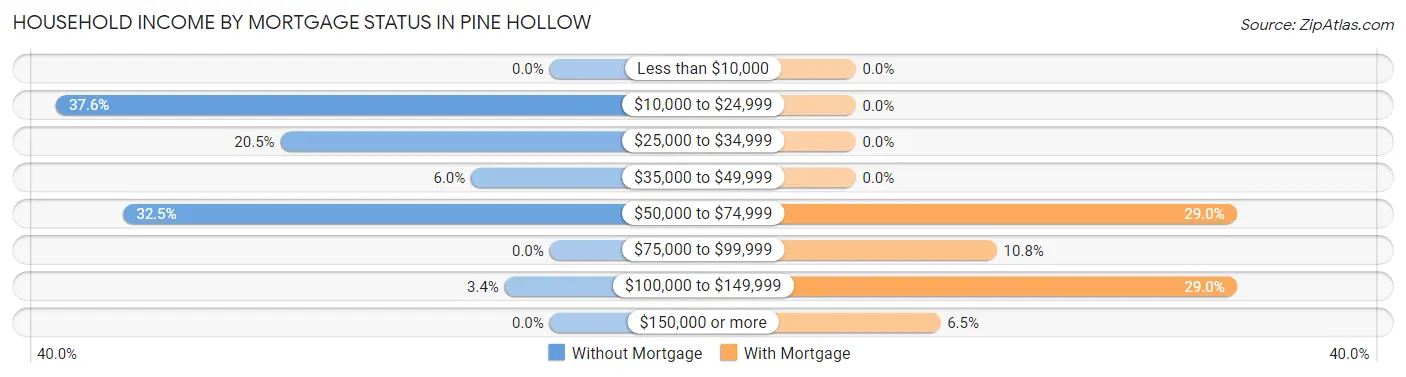
| Household Income | Without Mortgage | With Mortgage |
| Less than $10,000 | 0 (0.0%) | 0 (0.0%) |
| $10,000 to $24,999 | 44 (37.6%) | 0 (0.0%) |
| $25,000 to $34,999 | 24 (20.5%) | 0 (0.0%) |
| $35,000 to $49,999 | 7 (6.0%) | 0 (0.0%) |
| $50,000 to $74,999 | 38 (32.5%) | 27 (29.0%) |
| $75,000 to $99,999 | 0 (0.0%) | 10 (10.7%) |
| $100,000 to $149,999 | 4 (3.4%) | 27 (29.0%) |
| $150,000 or more | 0 (0.0%) | 6 (6.5%) |
| Total | 117 (100.0%) | 93 (100.0%) |
Property Value to Household Income Ratio in Pine Hollow
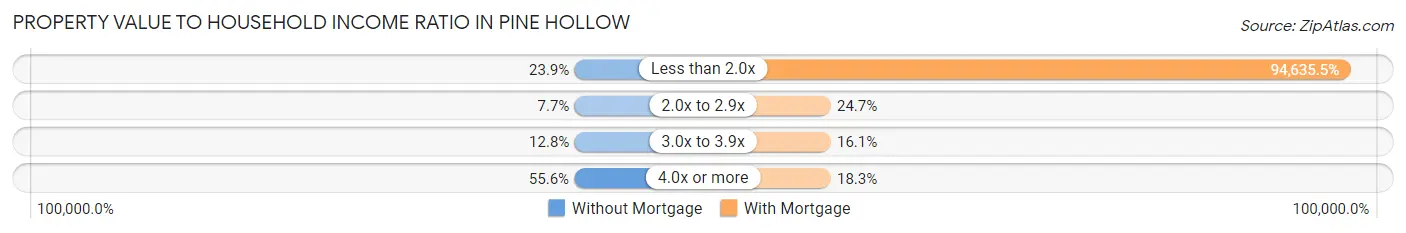
| Value-to-Income Ratio | Without Mortgage | With Mortgage |
| Less than 2.0x | 28 (23.9%) | 88,011 (94,635.5%) |
| 2.0x to 2.9x | 9 (7.7%) | 23 (24.7%) |
| 3.0x to 3.9x | 15 (12.8%) | 15 (16.1%) |
| 4.0x or more | 65 (55.6%) | 17 (18.3%) |
| Total | 117 (100.0%) | 93 (100.0%) |
Real Estate Taxes by Mortgage Status in Pine Hollow
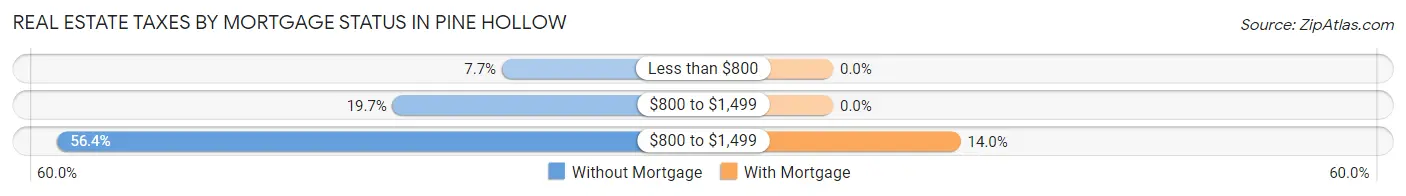
| Property Taxes | Without Mortgage | With Mortgage |
| Less than $800 | 9 (7.7%) | 0 (0.0%) |
| $800 to $1,499 | 23 (19.7%) | 0 (0.0%) |
| $800 to $1,499 | 66 (56.4%) | 13 (14.0%) |
| Total | 117 (100.0%) | 93 (100.0%) |
Health & Disability in Pine Hollow
Health Insurance Coverage by Age in Pine Hollow
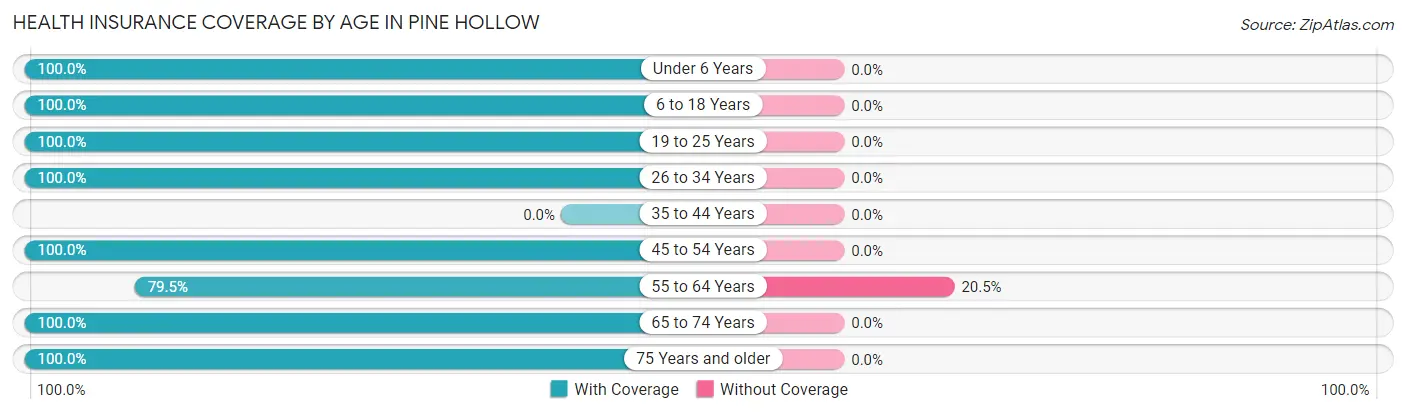
| Age Bracket | With Coverage | Without Coverage |
| Under 6 Years | 8 (100.0%) | 0 (0.0%) |
| 6 to 18 Years | 32 (100.0%) | 0 (0.0%) |
| 19 to 25 Years | 5 (100.0%) | 0 (0.0%) |
| 26 to 34 Years | 26 (100.0%) | 0 (0.0%) |
| 35 to 44 Years | 0 (0.0%) | 0 (0.0%) |
| 45 to 54 Years | 72 (100.0%) | 0 (0.0%) |
| 55 to 64 Years | 89 (79.5%) | 23 (20.5%) |
| 65 to 74 Years | 146 (100.0%) | 0 (0.0%) |
| 75 Years and older | 80 (100.0%) | 0 (0.0%) |
| Total | 458 (95.2%) | 23 (4.8%) |
Health Insurance Coverage by Citizenship Status in Pine Hollow
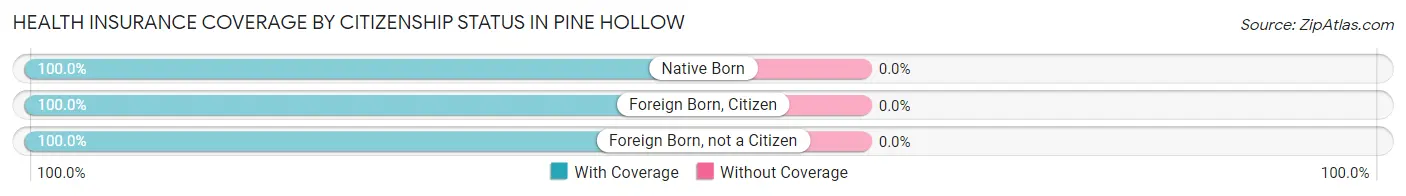
| Citizenship Status | With Coverage | Without Coverage |
| Native Born | 8 (100.0%) | 0 (0.0%) |
| Foreign Born, Citizen | 32 (100.0%) | 0 (0.0%) |
| Foreign Born, not a Citizen | 5 (100.0%) | 0 (0.0%) |
Health Insurance Coverage by Household Income in Pine Hollow
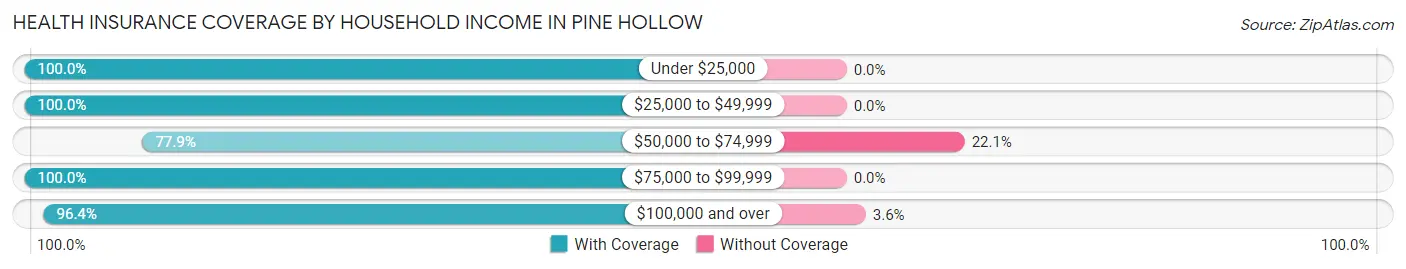
| Household Income | With Coverage | Without Coverage |
| Under $25,000 | 76 (100.0%) | 0 (0.0%) |
| $25,000 to $49,999 | 123 (100.0%) | 0 (0.0%) |
| $50,000 to $74,999 | 67 (77.9%) | 19 (22.1%) |
| $75,000 to $99,999 | 84 (100.0%) | 0 (0.0%) |
| $100,000 and over | 108 (96.4%) | 4 (3.6%) |
Public vs Private Health Insurance Coverage by Age in Pine Hollow
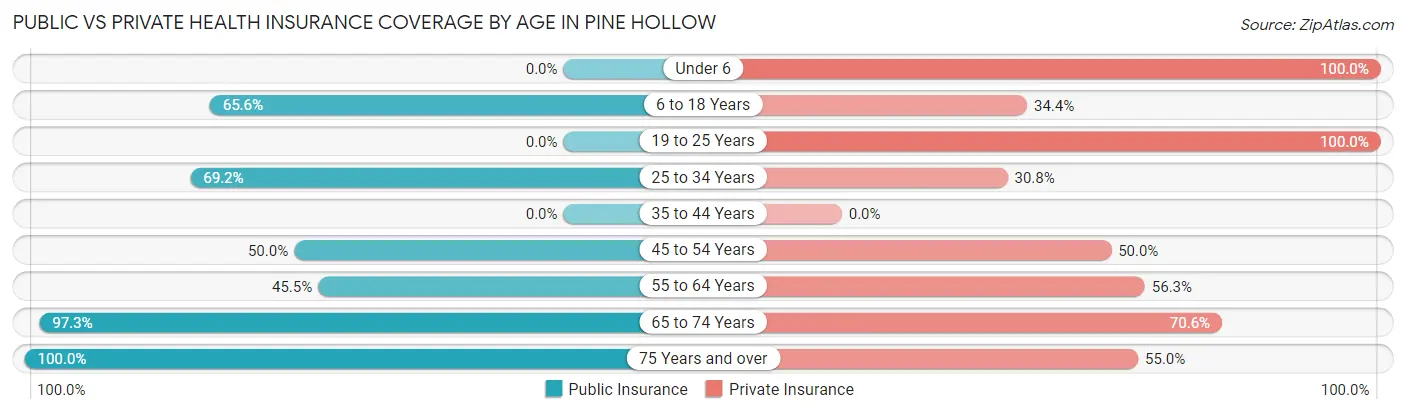
| Age Bracket | Public Insurance | Private Insurance |
| Under 6 | 0 (0.0%) | 8 (100.0%) |
| 6 to 18 Years | 21 (65.6%) | 11 (34.4%) |
| 19 to 25 Years | 0 (0.0%) | 5 (100.0%) |
| 25 to 34 Years | 18 (69.2%) | 8 (30.8%) |
| 35 to 44 Years | 0 (0.0%) | 0 (0.0%) |
| 45 to 54 Years | 36 (50.0%) | 36 (50.0%) |
| 55 to 64 Years | 51 (45.5%) | 63 (56.2%) |
| 65 to 74 Years | 142 (97.3%) | 103 (70.6%) |
| 75 Years and over | 80 (100.0%) | 44 (55.0%) |
| Total | 348 (72.4%) | 278 (57.8%) |
Disability Status by Sex by Age in Pine Hollow
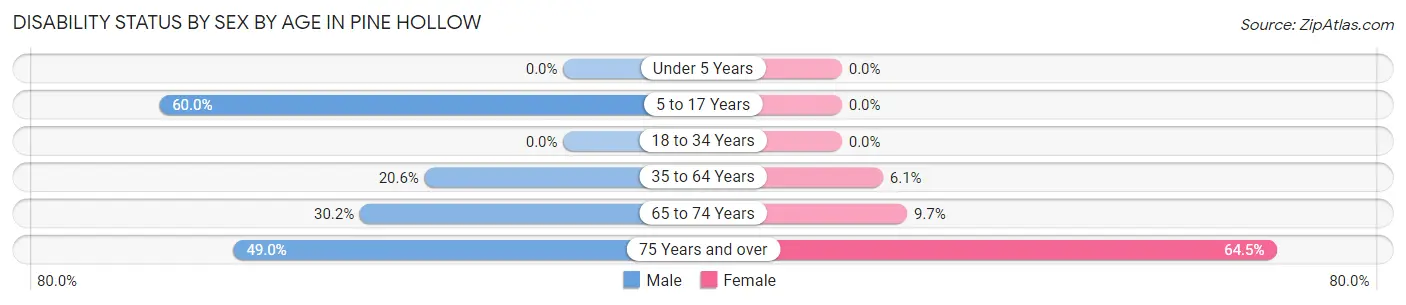
| Age Bracket | Male | Female |
| Under 5 Years | 0 (0.0%) | 0 (0.0%) |
| 5 to 17 Years | 6 (60.0%) | 0 (0.0%) |
| 18 to 34 Years | 0 (0.0%) | 0 (0.0%) |
| 35 to 64 Years | 21 (20.6%) | 5 (6.1%) |
| 65 to 74 Years | 16 (30.2%) | 9 (9.7%) |
| 75 Years and over | 24 (49.0%) | 20 (64.5%) |
Disability Class by Sex by Age in Pine Hollow
Disability Class: Hearing Difficulty
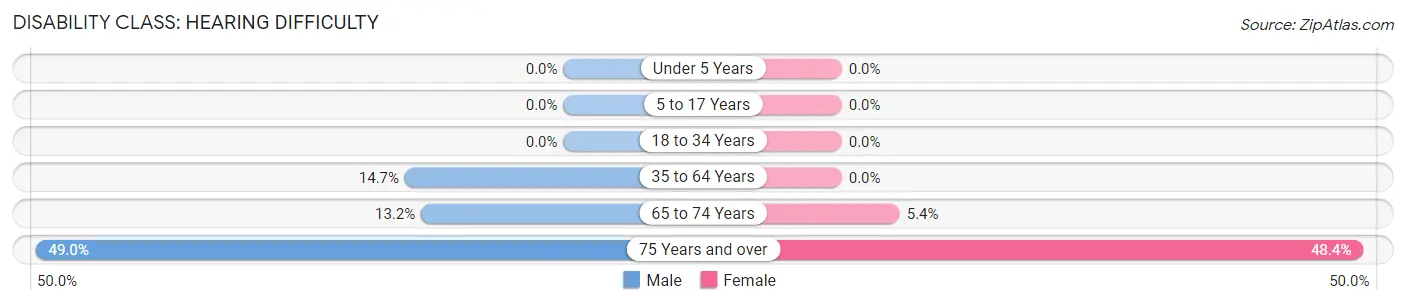
| Age Bracket | Male | Female |
| Under 5 Years | 0 (0.0%) | 0 (0.0%) |
| 5 to 17 Years | 0 (0.0%) | 0 (0.0%) |
| 18 to 34 Years | 0 (0.0%) | 0 (0.0%) |
| 35 to 64 Years | 15 (14.7%) | 0 (0.0%) |
| 65 to 74 Years | 7 (13.2%) | 5 (5.4%) |
| 75 Years and over | 24 (49.0%) | 15 (48.4%) |
Disability Class: Vision Difficulty
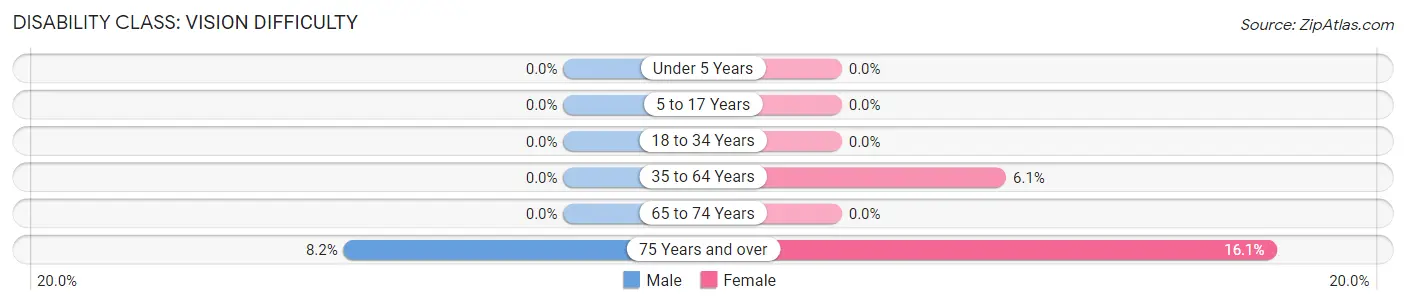
| Age Bracket | Male | Female |
| Under 5 Years | 0 (0.0%) | 0 (0.0%) |
| 5 to 17 Years | 0 (0.0%) | 0 (0.0%) |
| 18 to 34 Years | 0 (0.0%) | 0 (0.0%) |
| 35 to 64 Years | 0 (0.0%) | 5 (6.1%) |
| 65 to 74 Years | 0 (0.0%) | 0 (0.0%) |
| 75 Years and over | 4 (8.2%) | 5 (16.1%) |
Disability Class: Cognitive Difficulty
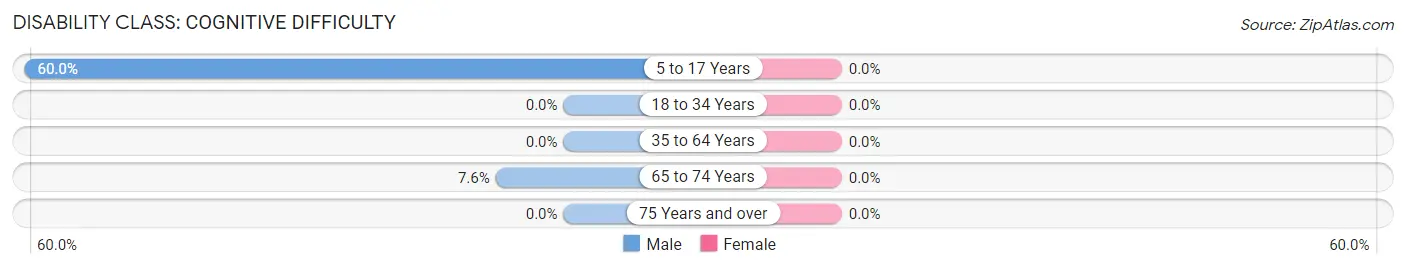
| Age Bracket | Male | Female |
| 5 to 17 Years | 6 (60.0%) | 0 (0.0%) |
| 18 to 34 Years | 0 (0.0%) | 0 (0.0%) |
| 35 to 64 Years | 0 (0.0%) | 0 (0.0%) |
| 65 to 74 Years | 4 (7.5%) | 0 (0.0%) |
| 75 Years and over | 0 (0.0%) | 0 (0.0%) |
Disability Class: Ambulatory Difficulty
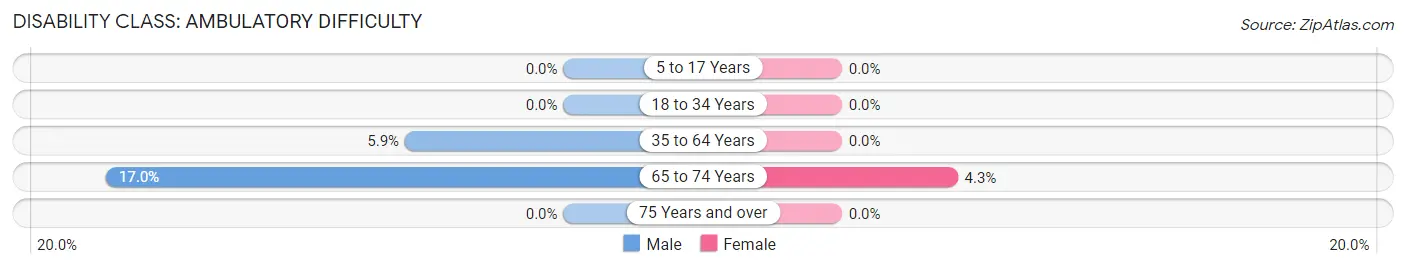
| Age Bracket | Male | Female |
| 5 to 17 Years | 0 (0.0%) | 0 (0.0%) |
| 18 to 34 Years | 0 (0.0%) | 0 (0.0%) |
| 35 to 64 Years | 6 (5.9%) | 0 (0.0%) |
| 65 to 74 Years | 9 (17.0%) | 4 (4.3%) |
| 75 Years and over | 0 (0.0%) | 0 (0.0%) |
Disability Class: Self-Care Difficulty
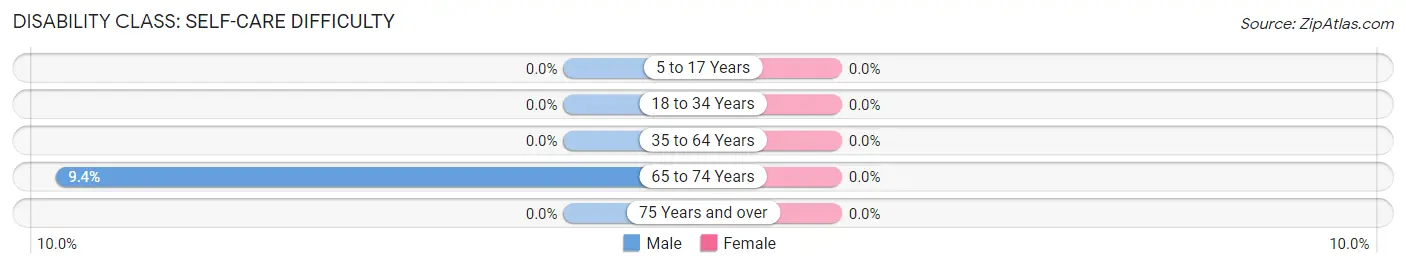
| Age Bracket | Male | Female |
| 5 to 17 Years | 0 (0.0%) | 0 (0.0%) |
| 18 to 34 Years | 0 (0.0%) | 0 (0.0%) |
| 35 to 64 Years | 0 (0.0%) | 0 (0.0%) |
| 65 to 74 Years | 5 (9.4%) | 0 (0.0%) |
| 75 Years and over | 0 (0.0%) | 0 (0.0%) |
Technology Access in Pine Hollow
Computing Device Access in Pine Hollow
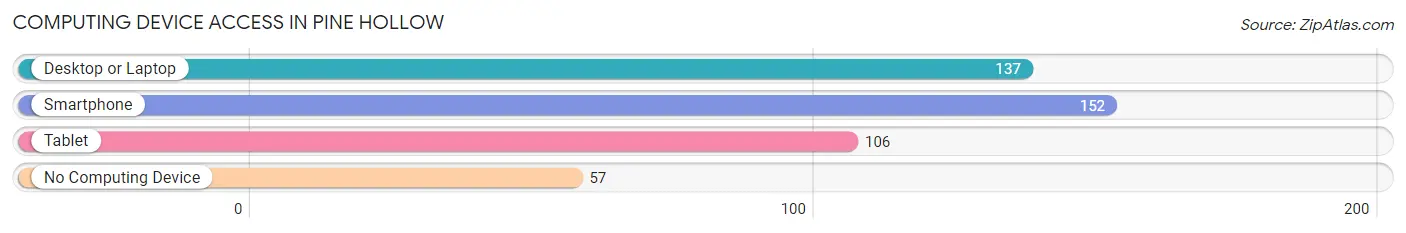
| Device Type | # Households | % Households |
| Desktop or Laptop | 137 | 61.2% |
| Smartphone | 152 | 67.9% |
| Tablet | 106 | 47.3% |
| No Computing Device | 57 | 25.5% |
| Total | 224 | 100.0% |
Internet Access in Pine Hollow
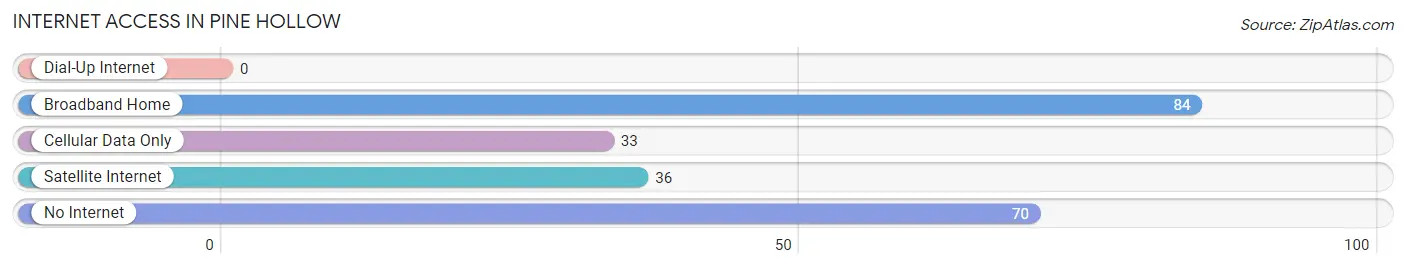
| Internet Type | # Households | % Households |
| Dial-Up Internet | 0 | 0.0% |
| Broadband Home | 84 | 37.5% |
| Cellular Data Only | 33 | 14.7% |
| Satellite Internet | 36 | 16.1% |
| No Internet | 70 | 31.2% |
| Total | 224 | 100.0% |
Pine Hollow Summary
Pine Hollow is a small unincorporated community located in the foothills of the Cascade Mountains in Oregon. It is situated in the Willamette Valley, approximately 25 miles south of Portland. The community is home to a population of approximately 500 people, and is known for its rural charm and close-knit community.
History
Pine Hollow was first settled in the late 1800s by a group of homesteaders who were drawn to the area by its abundance of natural resources. The settlers built a small sawmill and began harvesting timber from the surrounding forests. The timber industry was the primary source of income for the community until the early 1900s, when the railroad arrived and brought with it a new wave of settlers.
The railroad brought with it a new economy, and the town began to grow. The population increased, and new businesses began to open. The town was incorporated in 1910, and the first post office was established in 1911.
In the 1920s, the timber industry began to decline, and the town began to look for other sources of income. The local economy shifted to agriculture, and the town became known for its apple orchards and dairy farms. The town also became a popular tourist destination, and the local economy was bolstered by the influx of visitors.
Geography
Pine Hollow is located in the foothills of the Cascade Mountains in Oregon. The town is situated in the Willamette Valley, approximately 25 miles south of Portland. The town is surrounded by rolling hills and lush forests, and is home to a variety of wildlife. The climate is mild, with warm summers and cool winters.
Economy
The local economy is largely based on agriculture and tourism. The town is home to several apple orchards, and the surrounding area is known for its dairy farms. The town is also a popular tourist destination, and the local economy is bolstered by the influx of visitors.
The town is also home to several small businesses, including a grocery store, a hardware store, and a few restaurants. There is also a small airport located nearby, which serves as a hub for private and commercial flights.
Demographics
As of the 2010 census, the population of Pine Hollow was 498. The racial makeup of the town was 95.2% White, 0.2% African American, 0.4% Native American, 0.6% Asian, 0.2% Pacific Islander, 1.2% from other races, and 2.2% from two or more races. Hispanic or Latino of any race were 3.2% of the population.
The median income for a household in the town was $41,250, and the median income for a family was $50,000. The per capita income for the town was $20,845. About 11.2% of families and 14.2% of the population were below the poverty line, including 18.2% of those under age 18 and 8.2% of those age 65 or over.
Conclusion
Pine Hollow is a small unincorporated community located in the foothills of the Cascade Mountains in Oregon. It is situated in the Willamette Valley, approximately 25 miles south of Portland. The community is home to a population of approximately 500 people, and is known for its rural charm and close-knit community. The local economy is largely based on agriculture and tourism, and the town is home to several apple orchards and dairy farms. The town is also a popular tourist destination, and the local economy is bolstered by the influx of visitors. The population of Pine Hollow is largely white, with a small percentage of other races. The median income for a household in the town is $41,250, and the median income for a family is $50,000.
Common Questions
What is the Total Population of Pine Hollow?
Total Population of Pine Hollow is 481.
What is the Total Male Population of Pine Hollow?
Total Male Population of Pine Hollow is 223.
What is the Total Female Population of Pine Hollow?
Total Female Population of Pine Hollow is 258.
What is the Ratio of Males per 100 Females in Pine Hollow?
There are 86.43 Males per 100 Females in Pine Hollow.
What is the Ratio of Females per 100 Males in Pine Hollow?
There are 115.70 Females per 100 Males in Pine Hollow.
What is the Median Population Age in Pine Hollow?
Median Population Age in Pine Hollow is 63.8 Years.
What is the Average Family Size in Pine Hollow
Average Family Size in Pine Hollow is 2.5 People.
What is the Average Household Size in Pine Hollow
Average Household Size in Pine Hollow is 2.1 People.
What is Per Capita Income in Pine Hollow?
Per Capita income in Pine Hollow is $32,062.
What is the Median Family Income in Pine Hollow?
Median Family Income in Pine Hollow is $51,750.
What is the Median Household income in Pine Hollow?
Median Household Income in Pine Hollow is $50,089.
What is Inequality or Gini Index in Pine Hollow?
Inequality or Gini Index in Pine Hollow is 0.42.
How Large is the Labor Force in Pine Hollow?
There are 158 People in the Labor Forcein in Pine Hollow.
What is the Percentage of People in the Labor Force in Pine Hollow?
35.0% of People are in the Labor Force in Pine Hollow.