Pacific City, OR
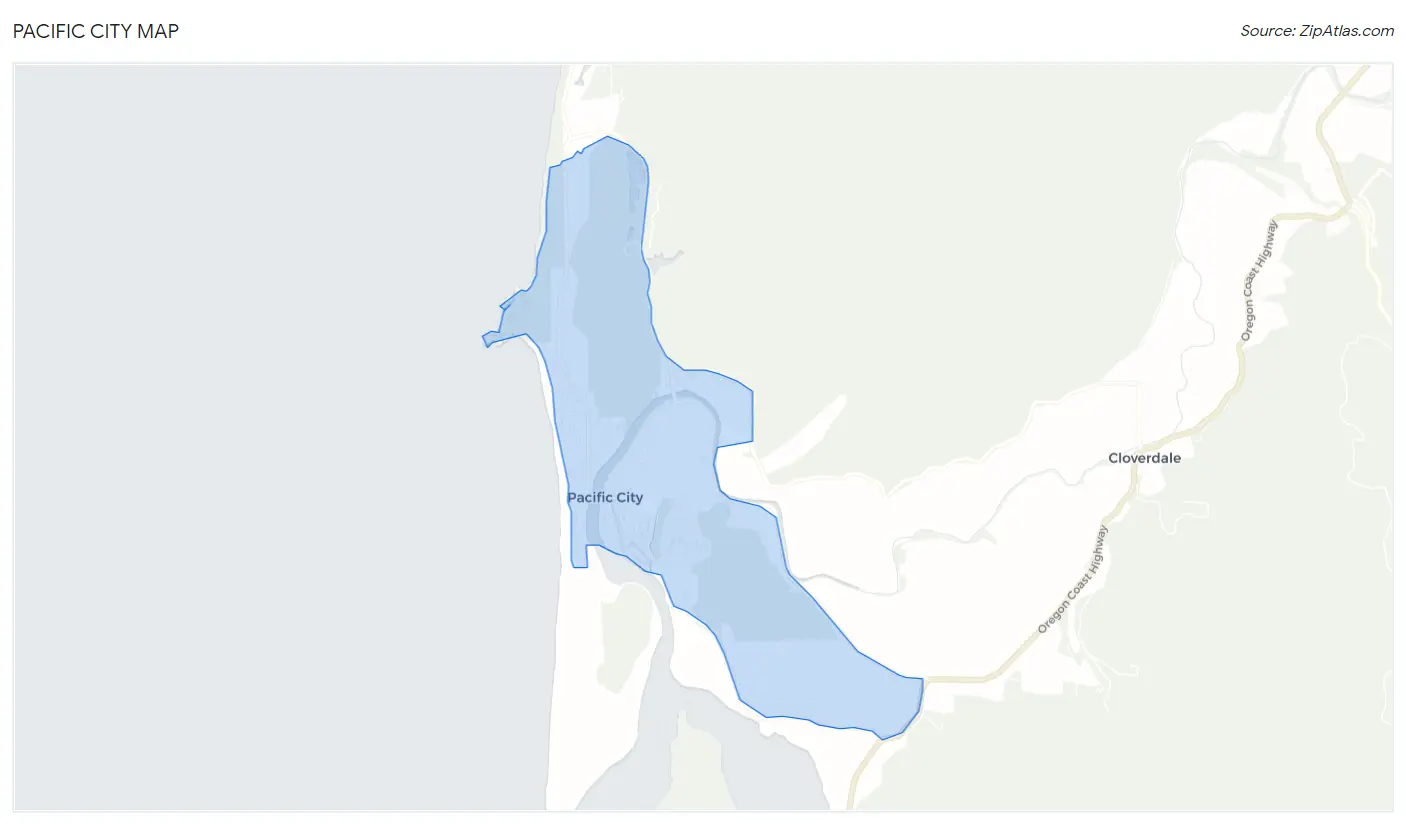
Pacific City Map
Pacific City Overview
1,767
TOTAL POPULATION
952
MALE POPULATION
815
FEMALE POPULATION
116.81
MALES / 100 FEMALES
85.61
FEMALES / 100 MALES
46.4
MEDIAN AGE
2.7
AVG FAMILY SIZE
2.3
AVG HOUSEHOLD SIZE
$29,603
PER CAPITA INCOME
$80,519
AVG FAMILY INCOME
$65,385
AVG HOUSEHOLD INCOME
41.2%
WAGE / INCOME GAP [ % ]
58.8¢/ $1
WAGE / INCOME GAP [ $ ]
0.37
INEQUALITY / GINI INDEX
622
LABOR FORCE [ PEOPLE ]
44.0%
PERCENT IN LABOR FORCE
Pacific City Zip Codes
Pacific City Area Codes
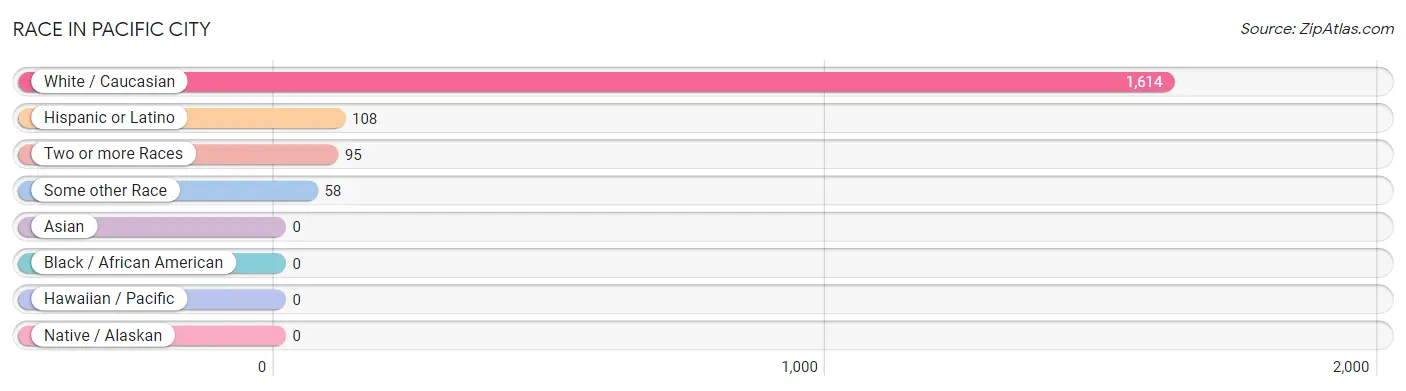
Race in Pacific City
The most populous races in Pacific City are White / Caucasian (1,614 | 91.3%), Hispanic or Latino (108 | 6.1%), and Two or more Races (95 | 5.4%).
| Race | # Population | % Population |
| Asian | 0 | 0.0% |
| Black / African American | 0 | 0.0% |
| Hawaiian / Pacific | 0 | 0.0% |
| Hispanic or Latino | 108 | 6.1% |
| Native / Alaskan | 0 | 0.0% |
| White / Caucasian | 1,614 | 91.3% |
| Two or more Races | 95 | 5.4% |
| Some other Race | 58 | 3.3% |
| Total | 1,767 | 100.0% |
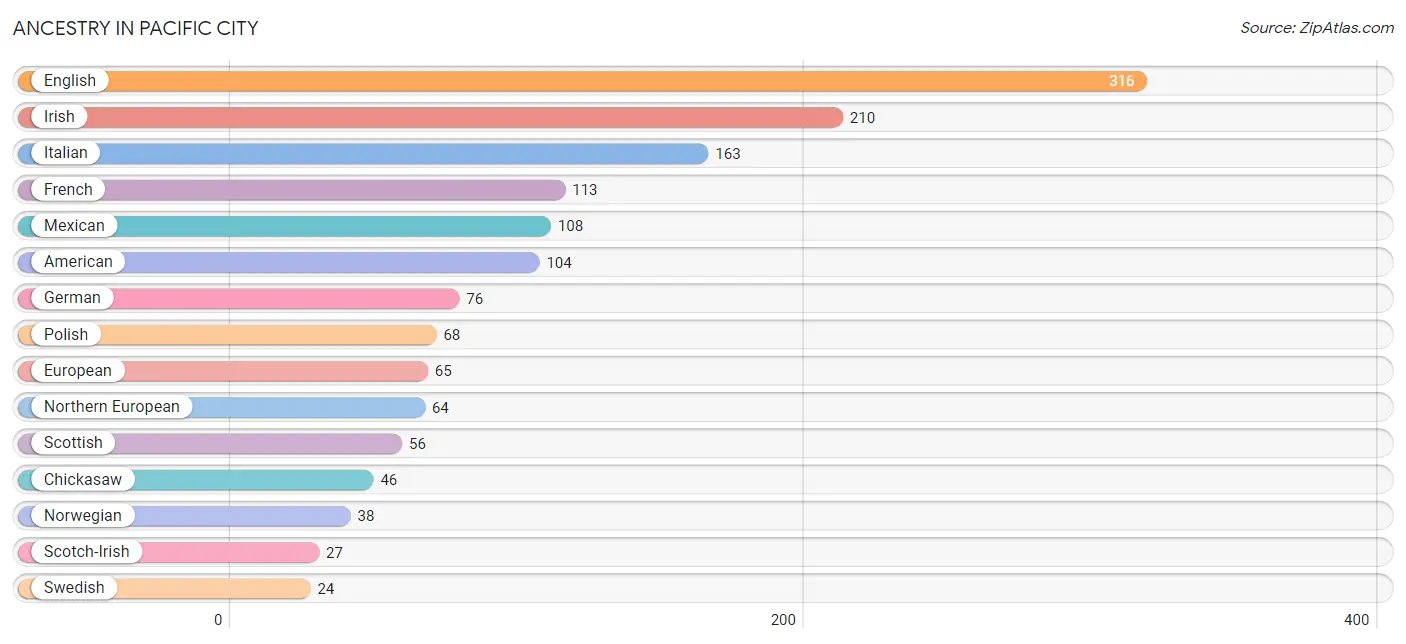
Ancestry in Pacific City
The most populous ancestries reported in Pacific City are English (316 | 17.9%), Irish (210 | 11.9%), Italian (163 | 9.2%), French (113 | 6.4%), and Mexican (108 | 6.1%), together accounting for 51.5% of all Pacific City residents.
| Ancestry | # Population | % Population |
| American | 104 | 5.9% |
| Arab | 13 | 0.7% |
| Chickasaw | 46 | 2.6% |
| Dutch | 20 | 1.1% |
| English | 316 | 17.9% |
| European | 65 | 3.7% |
| French | 113 | 6.4% |
| German | 76 | 4.3% |
| Irish | 210 | 11.9% |
| Italian | 163 | 9.2% |
| Lebanese | 13 | 0.7% |
| Mexican | 108 | 6.1% |
| Northern European | 64 | 3.6% |
| Norwegian | 38 | 2.1% |
| Polish | 68 | 3.8% |
| Scotch-Irish | 27 | 1.5% |
| Scottish | 56 | 3.2% |
| Swedish | 24 | 1.4% | View All 18 Rows |
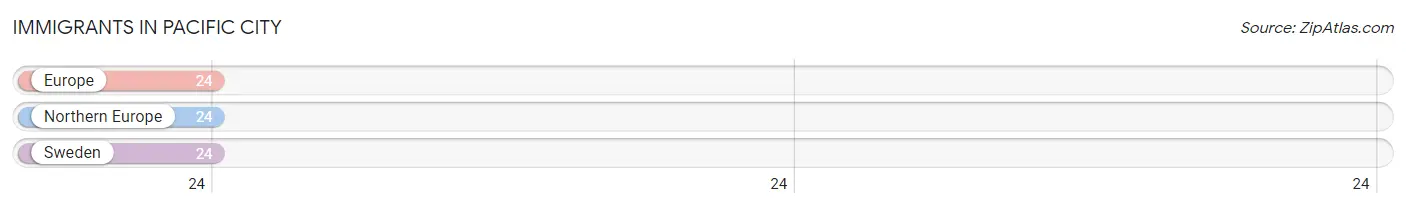
Immigrants in Pacific City
The most numerous immigrant groups reported in Pacific City came from Europe (24 | 1.4%), Northern Europe (24 | 1.4%), and Sweden (24 | 1.4%), together accounting for 4.1% of all Pacific City residents.
| Immigration Origin | # Population | % Population |
| Europe | 24 | 1.4% |
| Northern Europe | 24 | 1.4% |
| Sweden | 24 | 1.4% | View All 3 Rows |
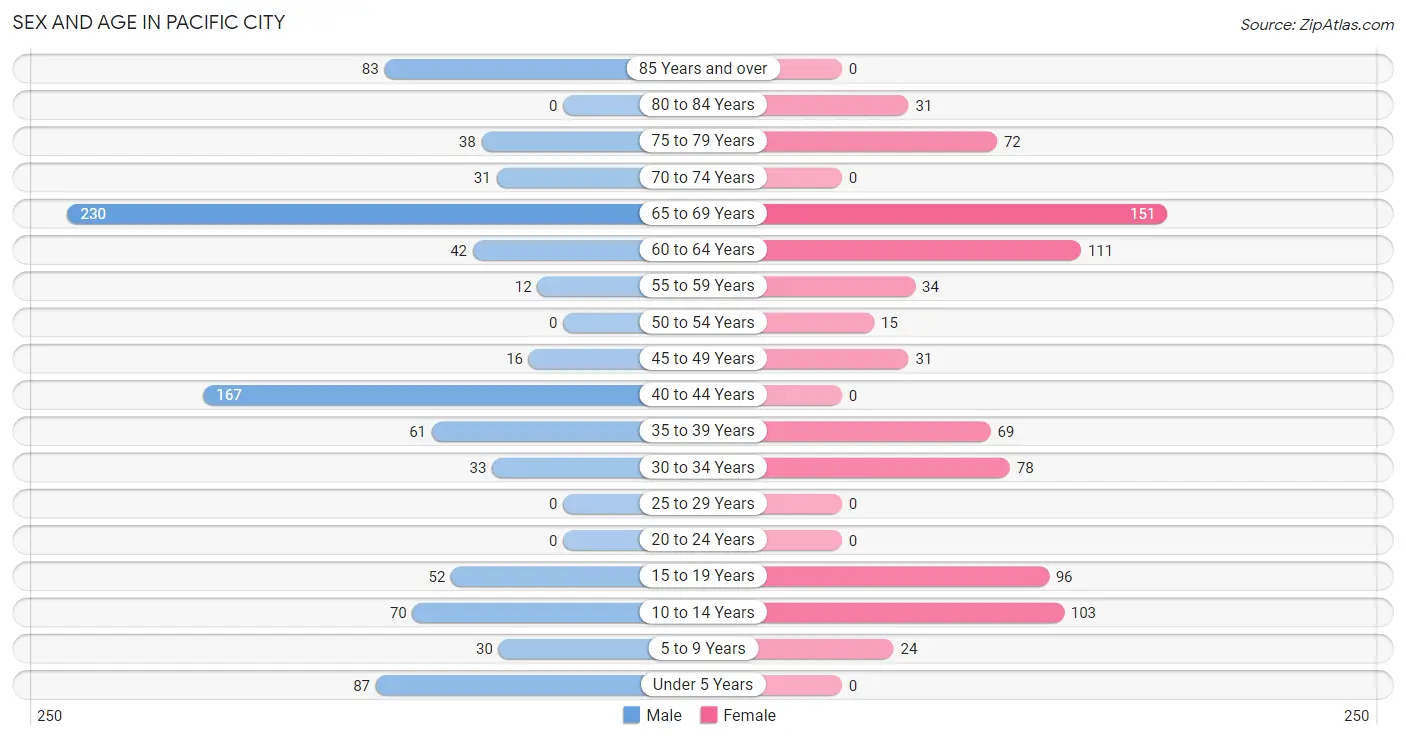
Sex and Age in Pacific City
Sex and Age in Pacific City
The most populous age groups in Pacific City are 65 to 69 Years (230 | 24.2%) for men and 65 to 69 Years (151 | 18.5%) for women.
| Age Bracket | Male | Female |
| Under 5 Years | 87 (9.1%) | 0 (0.0%) |
| 5 to 9 Years | 30 (3.2%) | 24 (2.9%) |
| 10 to 14 Years | 70 (7.3%) | 103 (12.6%) |
| 15 to 19 Years | 52 (5.5%) | 96 (11.8%) |
| 20 to 24 Years | 0 (0.0%) | 0 (0.0%) |
| 25 to 29 Years | 0 (0.0%) | 0 (0.0%) |
| 30 to 34 Years | 33 (3.5%) | 78 (9.6%) |
| 35 to 39 Years | 61 (6.4%) | 69 (8.5%) |
| 40 to 44 Years | 167 (17.5%) | 0 (0.0%) |
| 45 to 49 Years | 16 (1.7%) | 31 (3.8%) |
| 50 to 54 Years | 0 (0.0%) | 15 (1.8%) |
| 55 to 59 Years | 12 (1.3%) | 34 (4.2%) |
| 60 to 64 Years | 42 (4.4%) | 111 (13.6%) |
| 65 to 69 Years | 230 (24.2%) | 151 (18.5%) |
| 70 to 74 Years | 31 (3.3%) | 0 (0.0%) |
| 75 to 79 Years | 38 (4.0%) | 72 (8.8%) |
| 80 to 84 Years | 0 (0.0%) | 31 (3.8%) |
| 85 Years and over | 83 (8.7%) | 0 (0.0%) |
| Total | 952 (100.0%) | 815 (100.0%) |
Families and Households in Pacific City
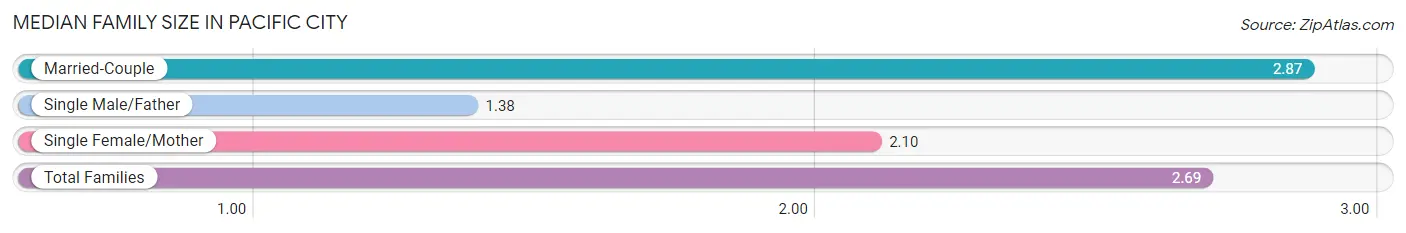
Median Family Size in Pacific City
The median family size in Pacific City is 2.69 persons per family, with married-couple families (468 | 85.7%) accounting for the largest median family size of 2.87 persons per family. On the other hand, single male/father families (47 | 8.6%) represent the smallest median family size with 1.38 persons per family.
| Family Type | # Families | Family Size |
| Married-Couple | 468 (85.7%) | 2.87 |
| Single Male/Father | 47 (8.6%) | 1.38 |
| Single Female/Mother | 31 (5.7%) | 2.10 |
| Total Families | 546 (100.0%) | 2.69 |
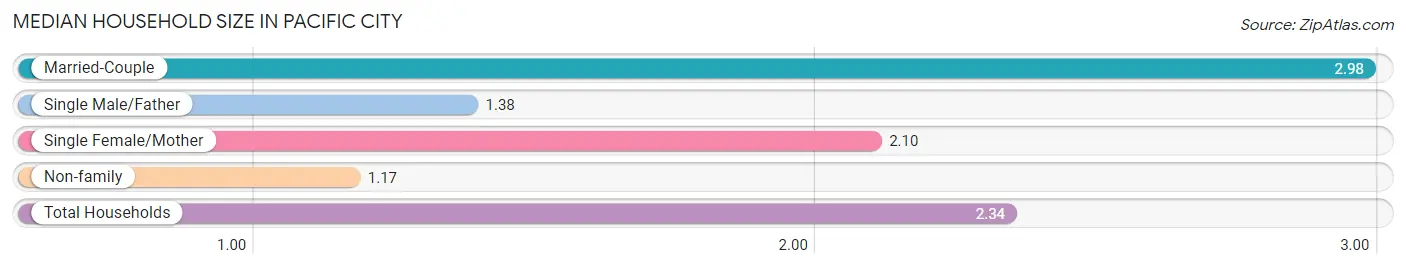
Median Household Size in Pacific City
The median household size in Pacific City is 2.34 persons per household, with married-couple households (468 | 62.1%) accounting for the largest median household size of 2.98 persons per household. non-family households (208 | 27.6%) represent the smallest median household size with 1.17 persons per household.
| Household Type | # Households | Household Size |
| Married-Couple | 468 (62.1%) | 2.98 |
| Single Male/Father | 47 (6.2%) | 1.38 |
| Single Female/Mother | 31 (4.1%) | 2.10 |
| Non-family | 208 (27.6%) | 1.17 |
| Total Households | 754 (100.0%) | 2.34 |
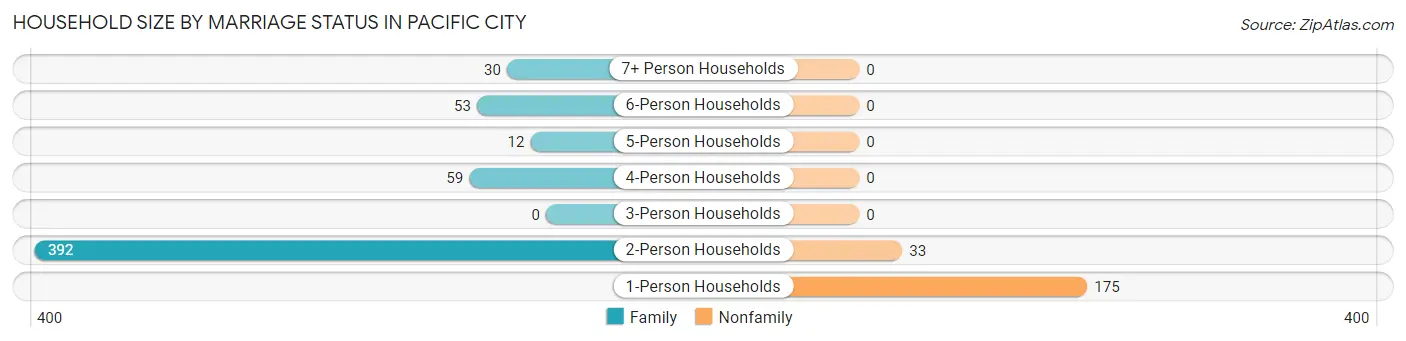
Household Size by Marriage Status in Pacific City
Out of a total of 754 households in Pacific City, 546 (72.4%) are family households, while 208 (27.6%) are nonfamily households. The most numerous type of family households are 2-person households, comprising 392, and the most common type of nonfamily households are 1-person households, comprising 175.
| Household Size | Family Households | Nonfamily Households |
| 1-Person Households | - | 175 (23.2%) |
| 2-Person Households | 392 (52.0%) | 33 (4.4%) |
| 3-Person Households | 0 (0.0%) | 0 (0.0%) |
| 4-Person Households | 59 (7.8%) | 0 (0.0%) |
| 5-Person Households | 12 (1.6%) | 0 (0.0%) |
| 6-Person Households | 53 (7.0%) | 0 (0.0%) |
| 7+ Person Households | 30 (4.0%) | 0 (0.0%) |
| Total | 546 (72.4%) | 208 (27.6%) |
Female Fertility in Pacific City
Fertility by Age in Pacific City
| Age Bracket | Women with Births | Births / 1,000 Women |
| 15 to 19 years | 0 (0.0%) | 0.0 |
| 20 to 34 years | 0 (0.0%) | 0.0 |
| 35 to 50 years | 0 (0.0%) | 0.0 |
| Total | 0 (0.0%) | 0.0 |
Fertility by Age by Marriage Status in Pacific City
| Age Bracket | Married | Unmarried |
| 15 to 19 years | 0 (0.0%) | 0 (0.0%) |
| 20 to 34 years | 0 (0.0%) | 0 (0.0%) |
| 35 to 50 years | 0 (0.0%) | 0 (0.0%) |
| Total | 0 (0.0%) | 0 (0.0%) |
Fertility by Education in Pacific City
| Educational Attainment | Women with Births | Births / 1,000 Women |
| Less than High School | 0 (0.0%) | 0.0 |
| High School Diploma | 0 (0.0%) | 0.0 |
| College or Associate's Degree | 0 (0.0%) | 0.0 |
| Bachelor's Degree | 0 (0.0%) | 0.0 |
| Graduate Degree | 0 (0.0%) | 0.0 |
| Total | 0 (0.0%) | 0.0 |
Fertility by Education by Marriage Status in Pacific City
| Educational Attainment | Married | Unmarried |
| Less than High School | 0 (0.0%) | 0 (0.0%) |
| High School Diploma | 0 (0.0%) | 0 (0.0%) |
| College or Associate's Degree | 0 (0.0%) | 0 (0.0%) |
| Bachelor's Degree | 0 (0.0%) | 0 (0.0%) |
| Graduate Degree | 0 (0.0%) | 0 (0.0%) |
| Total | 0 (0.0%) | 0 (0.0%) |
Income in Pacific City
Income Overview in Pacific City
Per Capita Income in Pacific City is $29,603, while median incomes of families and households are $80,519 and $65,385 respectively.
| Characteristic | Number | Measure |
| Per Capita Income | 1,767 | $29,603 |
| Median Family Income | 546 | $80,519 |
| Mean Family Income | 546 | $81,265 |
| Median Household Income | 754 | $65,385 |
| Mean Household Income | 754 | $69,853 |
| Income Deficit | 546 | $0 |
| Wage / Income Gap (%) | 1,767 | 41.19% |
| Wage / Income Gap ($) | 1,767 | 58.81¢ per $1 |
| Gini / Inequality Index | 1,767 | 0.37 |
Earnings by Sex in Pacific City
Average Earnings in Pacific City are $39,184, $37,674 for men and $64,063 for women, a difference of 41.2%.
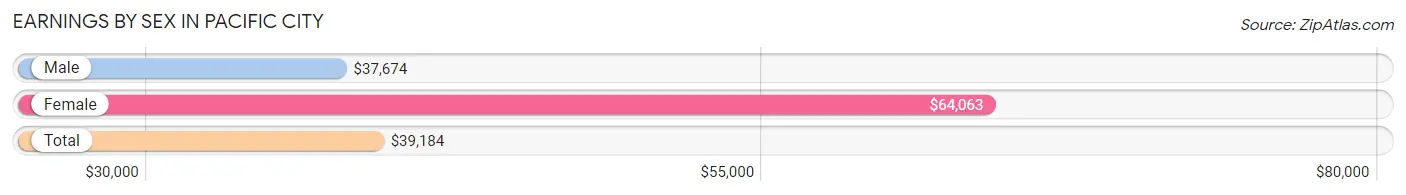
| Sex | Number | Average Earnings |
| Male | 370 (56.8%) | $37,674 |
| Female | 281 (43.2%) | $64,063 |
| Total | 651 (100.0%) | $39,184 |
Earnings by Sex by Income Bracket in Pacific City
The most common earnings brackets in Pacific City are $35,000 to $39,999 for men (125 | 33.8%) and $75,000 to $99,999 for women (74 | 26.3%).
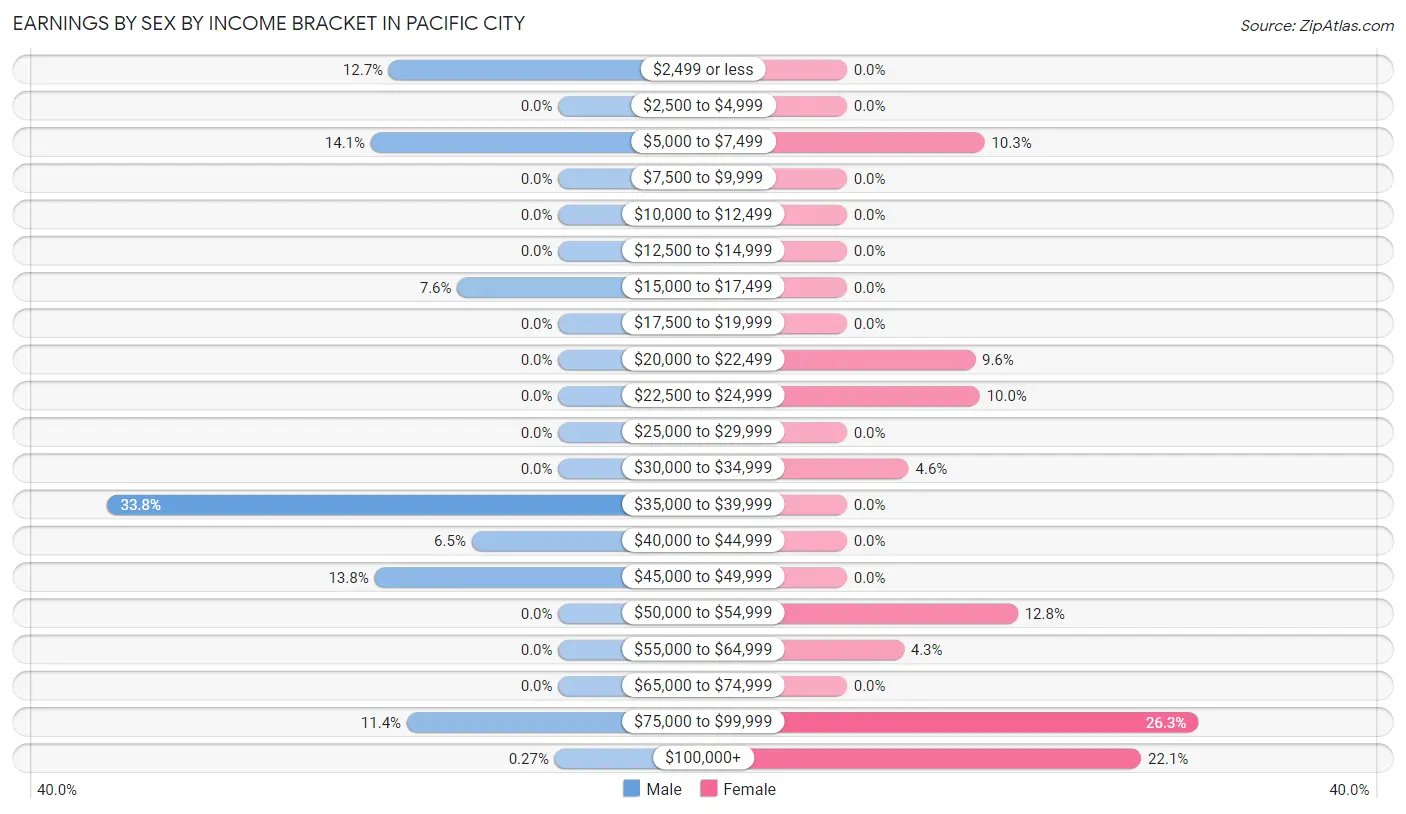
| Income | Male | Female |
| $2,499 or less | 47 (12.7%) | 0 (0.0%) |
| $2,500 to $4,999 | 0 (0.0%) | 0 (0.0%) |
| $5,000 to $7,499 | 52 (14.1%) | 29 (10.3%) |
| $7,500 to $9,999 | 0 (0.0%) | 0 (0.0%) |
| $10,000 to $12,499 | 0 (0.0%) | 0 (0.0%) |
| $12,500 to $14,999 | 0 (0.0%) | 0 (0.0%) |
| $15,000 to $17,499 | 28 (7.6%) | 0 (0.0%) |
| $17,500 to $19,999 | 0 (0.0%) | 0 (0.0%) |
| $20,000 to $22,499 | 0 (0.0%) | 27 (9.6%) |
| $22,500 to $24,999 | 0 (0.0%) | 28 (10.0%) |
| $25,000 to $29,999 | 0 (0.0%) | 0 (0.0%) |
| $30,000 to $34,999 | 0 (0.0%) | 13 (4.6%) |
| $35,000 to $39,999 | 125 (33.8%) | 0 (0.0%) |
| $40,000 to $44,999 | 24 (6.5%) | 0 (0.0%) |
| $45,000 to $49,999 | 51 (13.8%) | 0 (0.0%) |
| $50,000 to $54,999 | 0 (0.0%) | 36 (12.8%) |
| $55,000 to $64,999 | 0 (0.0%) | 12 (4.3%) |
| $65,000 to $74,999 | 0 (0.0%) | 0 (0.0%) |
| $75,000 to $99,999 | 42 (11.4%) | 74 (26.3%) |
| $100,000+ | 1 (0.3%) | 62 (22.1%) |
| Total | 370 (100.0%) | 281 (100.0%) |
Earnings by Sex by Educational Attainment in Pacific City
Average earnings in Pacific City are $38,576 for men and $85,833 for women, a difference of 55.1%. Men with an educational attainment of college or associate's degree enjoy the highest average annual earnings of $40,469, while those with high school diploma education earn the least with $36,816. Women with an educational attainment of college or associate's degree earn the most with the average annual earnings of $80,234, while those with college or associate's degree education have the smallest earnings of $80,234.
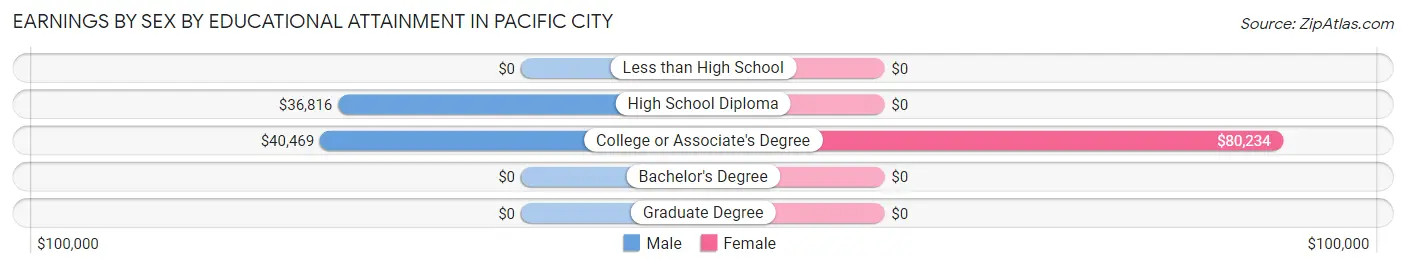
| Educational Attainment | Male Income | Female Income |
| Less than High School | - | - |
| High School Diploma | $36,816 | $0 |
| College or Associate's Degree | $40,469 | $80,234 |
| Bachelor's Degree | - | - |
| Graduate Degree | - | - |
| Total | $38,576 | $85,833 |
Family Income in Pacific City
Family Income Brackets in Pacific City
According to the Pacific City family income data, there are 141 families falling into the $100,000 to $149,999 income range, which is the most common income bracket and makes up 25.8% of all families.
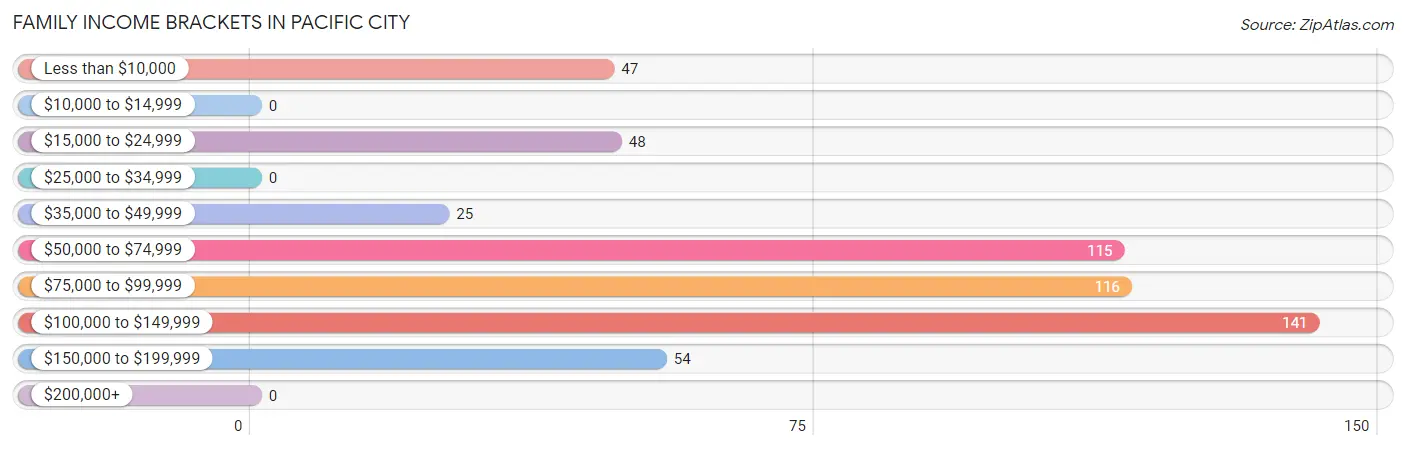
| Income Bracket | # Families | % Families |
| Less than $10,000 | 47 | 8.6% |
| $10,000 to $14,999 | 0 | 0.0% |
| $15,000 to $24,999 | 48 | 8.8% |
| $25,000 to $34,999 | 0 | 0.0% |
| $35,000 to $49,999 | 25 | 4.6% |
| $50,000 to $74,999 | 115 | 21.1% |
| $75,000 to $99,999 | 116 | 21.2% |
| $100,000 to $149,999 | 141 | 25.8% |
| $150,000 to $199,999 | 54 | 9.9% |
| $200,000+ | 0 | 0.0% |
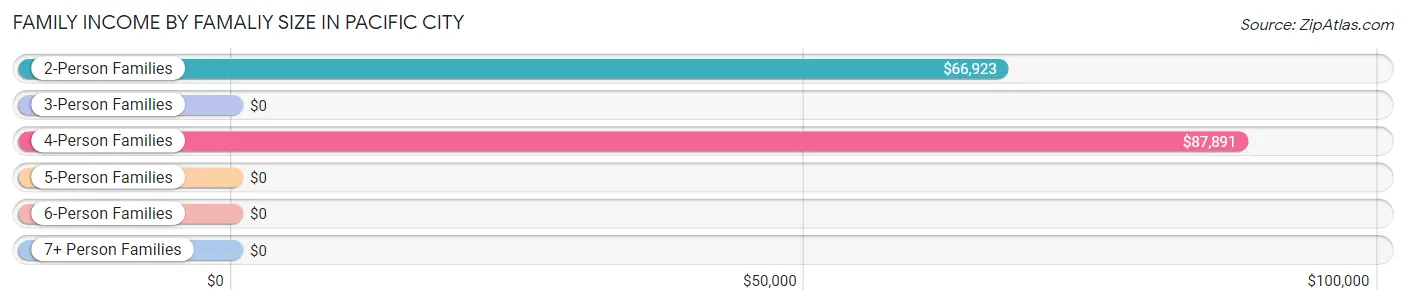
Family Income by Famaliy Size in Pacific City
4-person families (59 | 10.8%) account for the highest median family income in Pacific City with $87,891 per family, while 2-person families (392 | 71.8%) have the highest median income of $33,462 per family member.
| Income Bracket | # Families | Median Income |
| 2-Person Families | 392 (71.8%) | $66,923 |
| 3-Person Families | 0 (0.0%) | $0 |
| 4-Person Families | 59 (10.8%) | $87,891 |
| 5-Person Families | 65 (11.9%) | $0 |
| 6-Person Families | 0 (0.0%) | $0 |
| 7+ Person Families | 30 (5.5%) | $0 |
| Total | 546 (100.0%) | $80,519 |
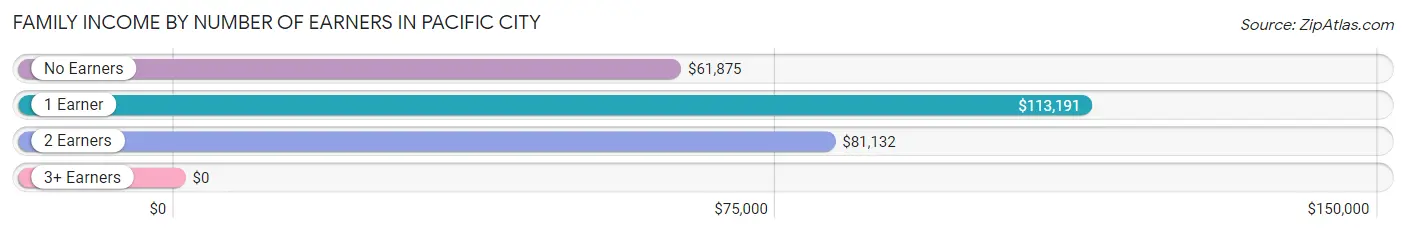
Family Income by Number of Earners in Pacific City
| Number of Earners | # Families | Median Income |
| No Earners | 215 (39.4%) | $61,875 |
| 1 Earner | 169 (30.9%) | $113,191 |
| 2 Earners | 162 (29.7%) | $81,132 |
| 3+ Earners | 0 (0.0%) | $0 |
| Total | 546 (100.0%) | $80,519 |
Household Income in Pacific City
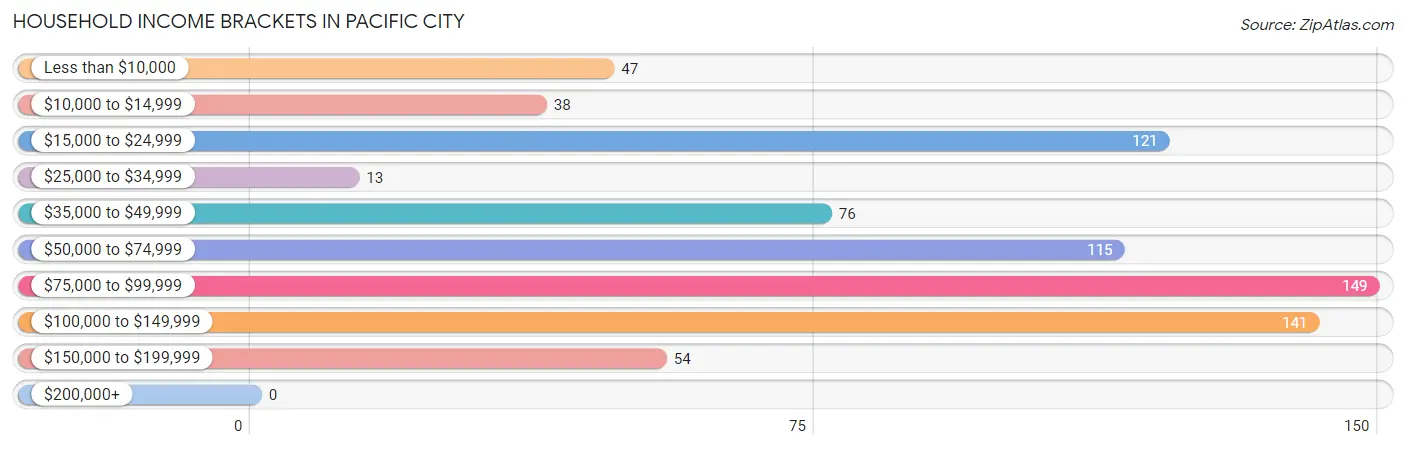
Household Income Brackets in Pacific City
With 149 households falling in the category, the $75,000 to $99,999 income range is the most frequent in Pacific City, accounting for 19.8% of all households.
| Income Bracket | # Households | % Households |
| Less than $10,000 | 47 | 6.2% |
| $10,000 to $14,999 | 38 | 5.0% |
| $15,000 to $24,999 | 121 | 16.0% |
| $25,000 to $34,999 | 13 | 1.7% |
| $35,000 to $49,999 | 76 | 10.1% |
| $50,000 to $74,999 | 115 | 15.3% |
| $75,000 to $99,999 | 149 | 19.8% |
| $100,000 to $149,999 | 141 | 18.7% |
| $150,000 to $199,999 | 54 | 7.2% |
| $200,000+ | 0 | 0.0% |
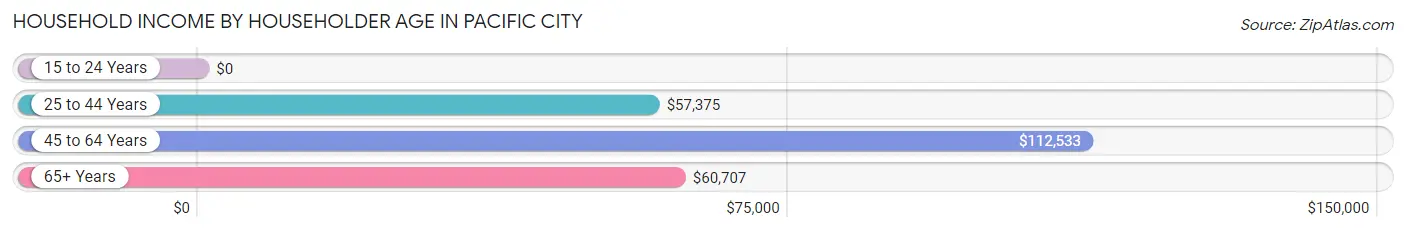
Household Income by Householder Age in Pacific City
The median household income in Pacific City is $65,385, with the highest median household income of $112,533 found in the 45 to 64 years age bracket for the primary householder. A total of 107 households (14.2%) fall into this category.
| Income Bracket | # Households | Median Income |
| 15 to 24 Years | 0 (0.0%) | $0 |
| 25 to 44 Years | 253 (33.6%) | $57,375 |
| 45 to 64 Years | 107 (14.2%) | $112,533 |
| 65+ Years | 394 (52.2%) | $60,707 |
| Total | 754 (100.0%) | $65,385 |
Poverty in Pacific City
Income Below Poverty by Sex and Age in Pacific City
With 25.0% poverty level for males and 5.9% for females among the residents of Pacific City, 18 to 24 year old males and 75 year old and over females are the most vulnerable to poverty, with 52 males (100.0%) and 48 females (46.6%) in their respective age groups living below the poverty level.
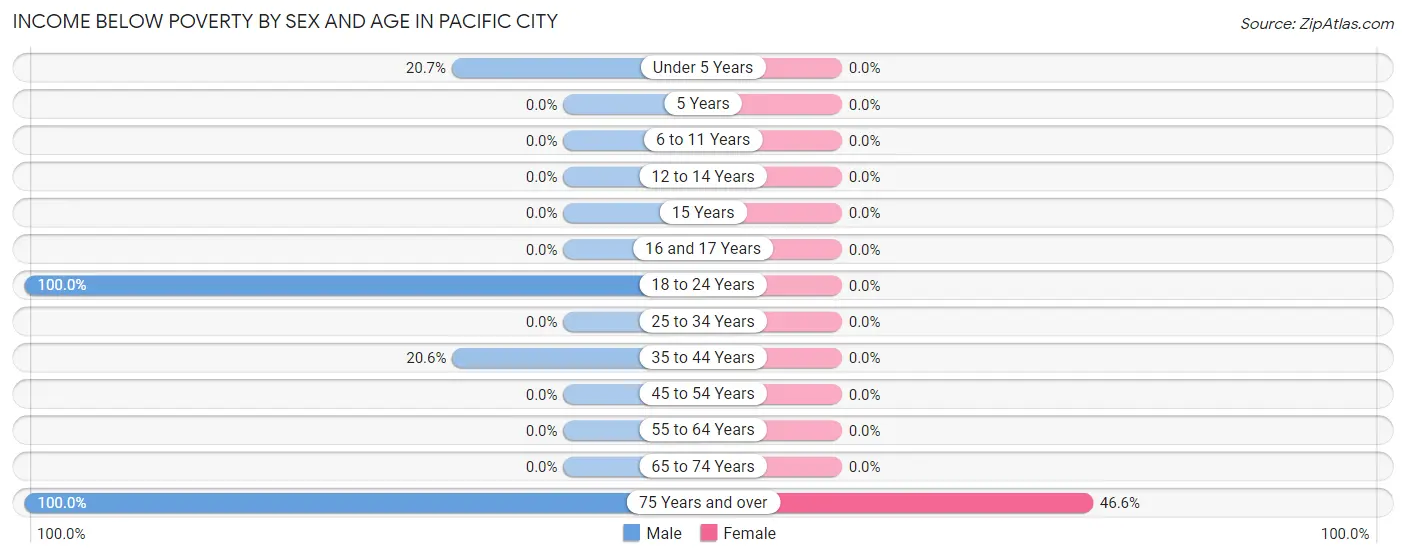
| Age Bracket | Male | Female |
| Under 5 Years | 18 (20.7%) | 0 (0.0%) |
| 5 Years | 0 (0.0%) | 0 (0.0%) |
| 6 to 11 Years | 0 (0.0%) | 0 (0.0%) |
| 12 to 14 Years | 0 (0.0%) | 0 (0.0%) |
| 15 Years | 0 (0.0%) | 0 (0.0%) |
| 16 and 17 Years | 0 (0.0%) | 0 (0.0%) |
| 18 to 24 Years | 52 (100.0%) | 0 (0.0%) |
| 25 to 34 Years | 0 (0.0%) | 0 (0.0%) |
| 35 to 44 Years | 47 (20.6%) | 0 (0.0%) |
| 45 to 54 Years | 0 (0.0%) | 0 (0.0%) |
| 55 to 64 Years | 0 (0.0%) | 0 (0.0%) |
| 65 to 74 Years | 0 (0.0%) | 0 (0.0%) |
| 75 Years and over | 121 (100.0%) | 48 (46.6%) |
| Total | 238 (25.0%) | 48 (5.9%) |
Income Above Poverty by Sex and Age in Pacific City
According to the poverty statistics in Pacific City, males aged 6 to 11 years and females aged 6 to 11 years are the age groups that are most secure financially, with 100.0% of males and 100.0% of females in these age groups living above the poverty line.
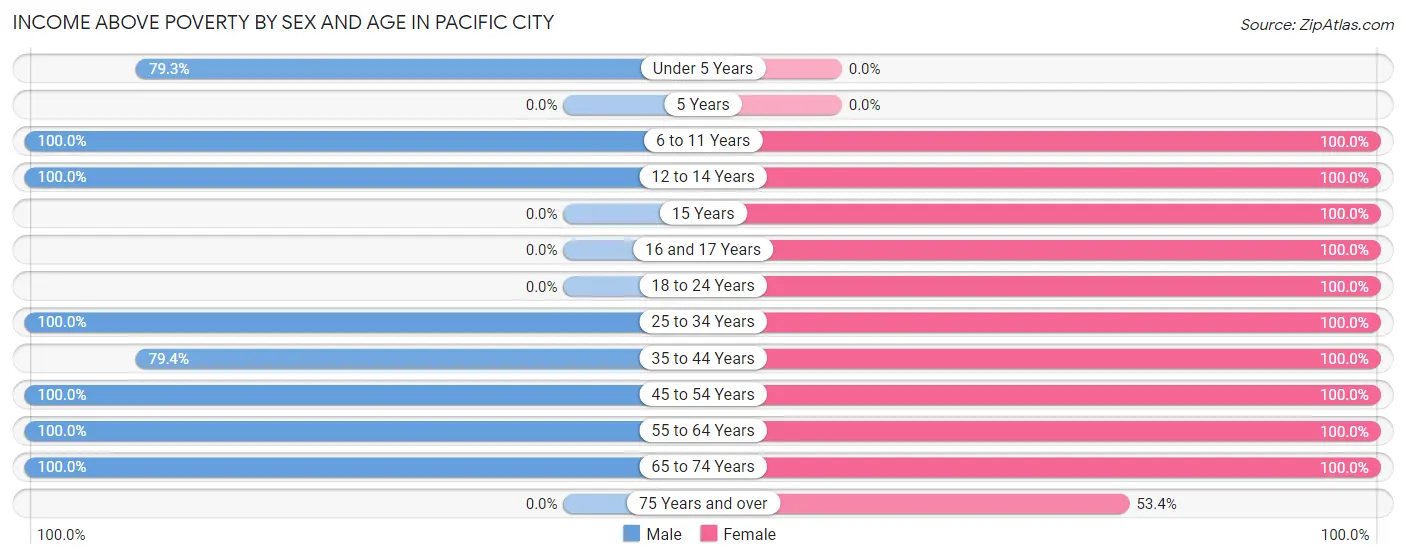
| Age Bracket | Male | Female |
| Under 5 Years | 69 (79.3%) | 0 (0.0%) |
| 5 Years | 0 (0.0%) | 0 (0.0%) |
| 6 to 11 Years | 30 (100.0%) | 53 (100.0%) |
| 12 to 14 Years | 70 (100.0%) | 74 (100.0%) |
| 15 Years | 0 (0.0%) | 39 (100.0%) |
| 16 and 17 Years | 0 (0.0%) | 29 (100.0%) |
| 18 to 24 Years | 0 (0.0%) | 28 (100.0%) |
| 25 to 34 Years | 33 (100.0%) | 78 (100.0%) |
| 35 to 44 Years | 181 (79.4%) | 69 (100.0%) |
| 45 to 54 Years | 16 (100.0%) | 46 (100.0%) |
| 55 to 64 Years | 54 (100.0%) | 145 (100.0%) |
| 65 to 74 Years | 261 (100.0%) | 151 (100.0%) |
| 75 Years and over | 0 (0.0%) | 55 (53.4%) |
| Total | 714 (75.0%) | 767 (94.1%) |
Income Below Poverty Among Married-Couple Families in Pacific City
The poverty statistics for married-couple families in Pacific City show that 10.3% or 48 of the total 468 families live below the poverty line. Families with no children have the highest poverty rate of 15.3%, comprising of 48 families. On the other hand, families with 1 or 2 children have the lowest poverty rate of 0.0%, which includes 0 families.
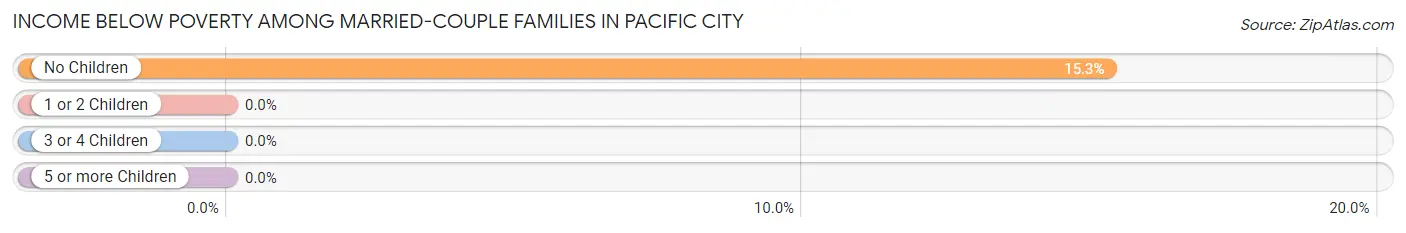
| Children | Above Poverty | Below Poverty |
| No Children | 266 (84.7%) | 48 (15.3%) |
| 1 or 2 Children | 112 (100.0%) | 0 (0.0%) |
| 3 or 4 Children | 12 (100.0%) | 0 (0.0%) |
| 5 or more Children | 30 (100.0%) | 0 (0.0%) |
| Total | 420 (89.7%) | 48 (10.3%) |
Income Below Poverty Among Single-Parent Households in Pacific City
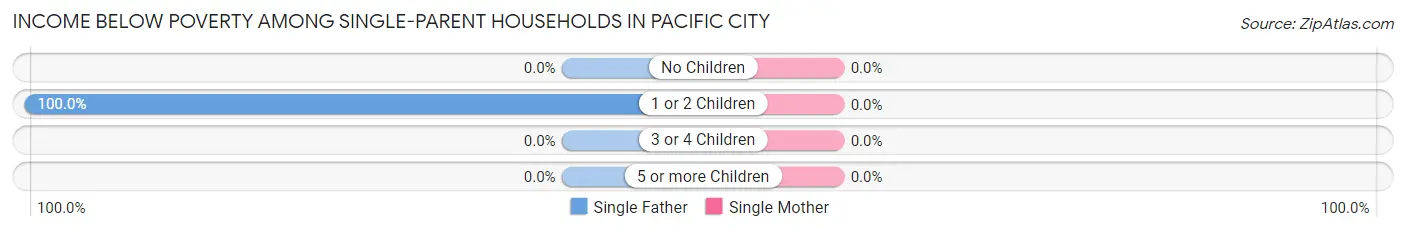
| Children | Single Father | Single Mother |
| No Children | 0 (0.0%) | 0 (0.0%) |
| 1 or 2 Children | 47 (100.0%) | 0 (0.0%) |
| 3 or 4 Children | 0 (0.0%) | 0 (0.0%) |
| 5 or more Children | 0 (0.0%) | 0 (0.0%) |
| Total | 47 (100.0%) | 0 (0.0%) |
Income Below Poverty Among Married-Couple vs Single-Parent Households in Pacific City
The poverty data for Pacific City shows that 48 of the married-couple family households (10.3%) and 47 of the single-parent households (60.3%) are living below the poverty level. Within the married-couple family households, those with no children have the highest poverty rate, with 48 households (15.3%) falling below the poverty line. Among the single-parent households, those with 1 or 2 children have the highest poverty rate, with 47 household (100.0%) living below poverty.
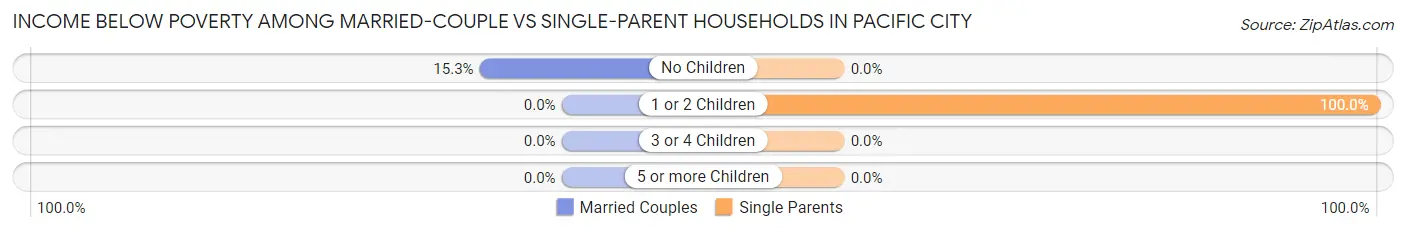
| Children | Married-Couple Families | Single-Parent Households |
| No Children | 48 (15.3%) | 0 (0.0%) |
| 1 or 2 Children | 0 (0.0%) | 47 (100.0%) |
| 3 or 4 Children | 0 (0.0%) | 0 (0.0%) |
| 5 or more Children | 0 (0.0%) | 0 (0.0%) |
| Total | 48 (10.3%) | 47 (60.3%) |
Employment Characteristics in Pacific City
Employment by Class of Employer in Pacific City
Among the 622 employed individuals in Pacific City, private company employees (340 | 54.7%), state government employees (129 | 20.7%), and local government employees (72 | 11.6%) make up the most common classes of employment.
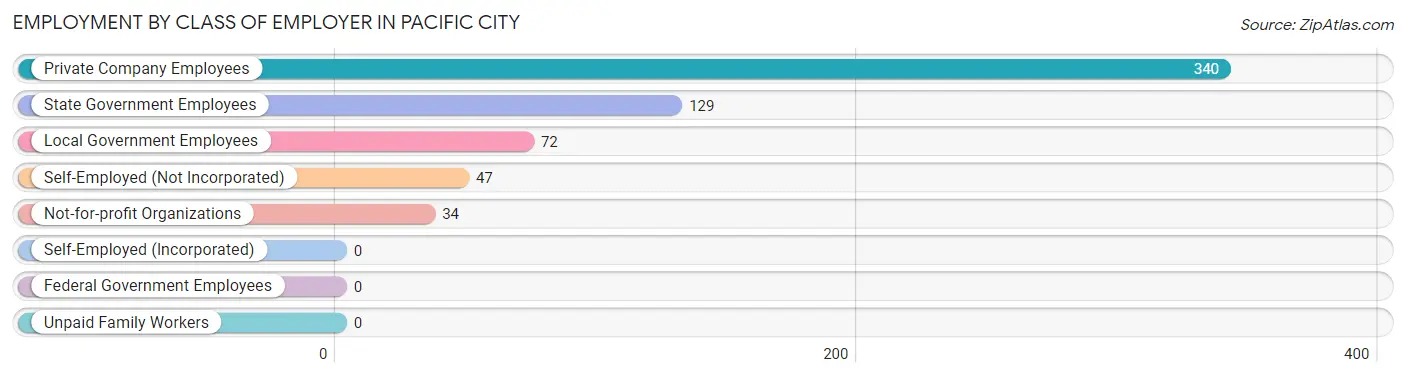
| Employer Class | # Employees | % Employees |
| Private Company Employees | 340 | 54.7% |
| Self-Employed (Incorporated) | 0 | 0.0% |
| Self-Employed (Not Incorporated) | 47 | 7.6% |
| Not-for-profit Organizations | 34 | 5.5% |
| Local Government Employees | 72 | 11.6% |
| State Government Employees | 129 | 20.7% |
| Federal Government Employees | 0 | 0.0% |
| Unpaid Family Workers | 0 | 0.0% |
| Total | 622 | 100.0% |
Employment Status by Age in Pacific City
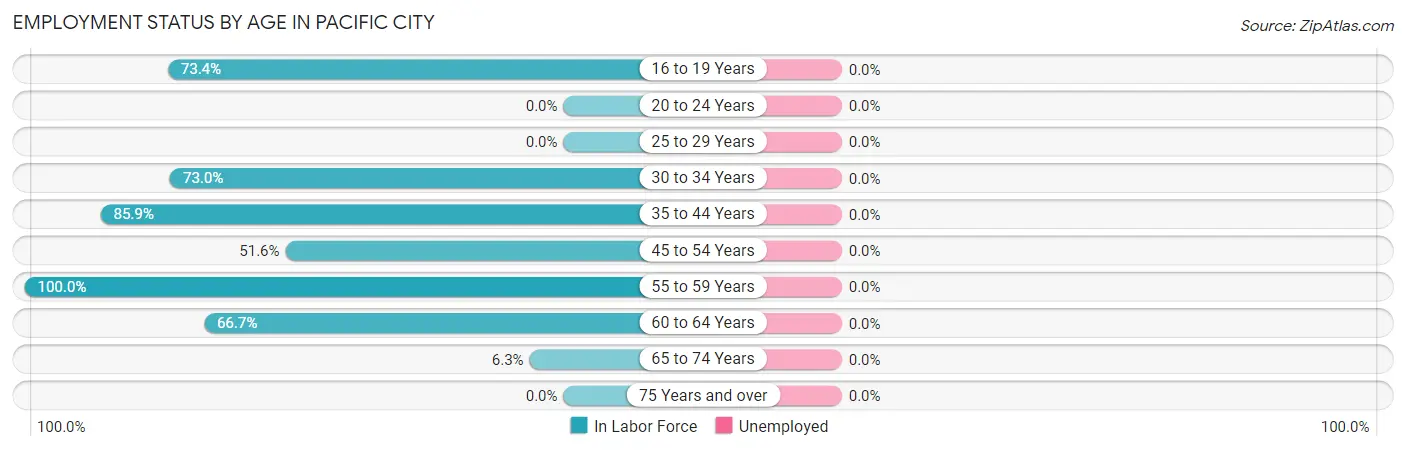
| Age Bracket | In Labor Force | Unemployed |
| 16 to 19 Years | 80 (73.4%) | 0 (0.0%) |
| 20 to 24 Years | 0 (0.0%) | 0 (0.0%) |
| 25 to 29 Years | 0 (0.0%) | 0 (0.0%) |
| 30 to 34 Years | 81 (73.0%) | 0 (0.0%) |
| 35 to 44 Years | 255 (85.9%) | 0 (0.0%) |
| 45 to 54 Years | 32 (51.6%) | 0 (0.0%) |
| 55 to 59 Years | 46 (100.0%) | 0 (0.0%) |
| 60 to 64 Years | 102 (66.7%) | 0 (0.0%) |
| 65 to 74 Years | 26 (6.3%) | 0 (0.0%) |
| 75 Years and over | 0 (0.0%) | 0 (0.0%) |
| Total | 622 (44.0%) | 0 (0.0%) |
Employment Status by Educational Attainment in Pacific City
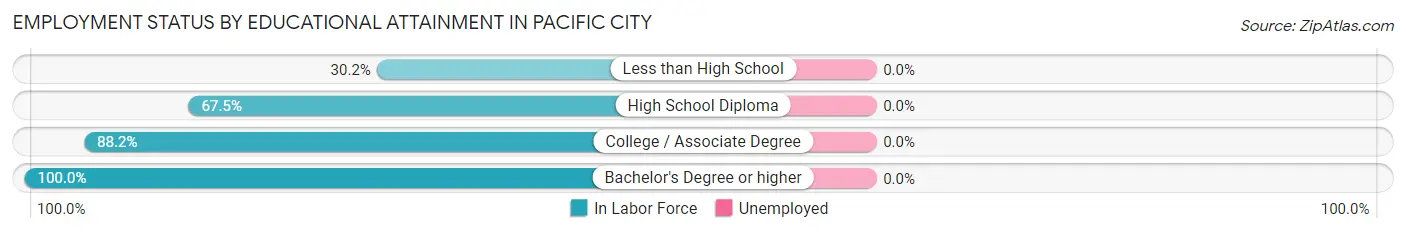
| Educational Attainment | In Labor Force | Unemployed |
| Less than High School | 13 (30.2%) | 0 (0.0%) |
| High School Diploma | 193 (67.5%) | 0 (0.0%) |
| College / Associate Degree | 224 (88.2%) | 0 (0.0%) |
| Bachelor's Degree or higher | 86 (100.0%) | 0 (0.0%) |
| Total | 516 (77.1%) | 0 (0.0%) |
Employment Occupations by Sex in Pacific City
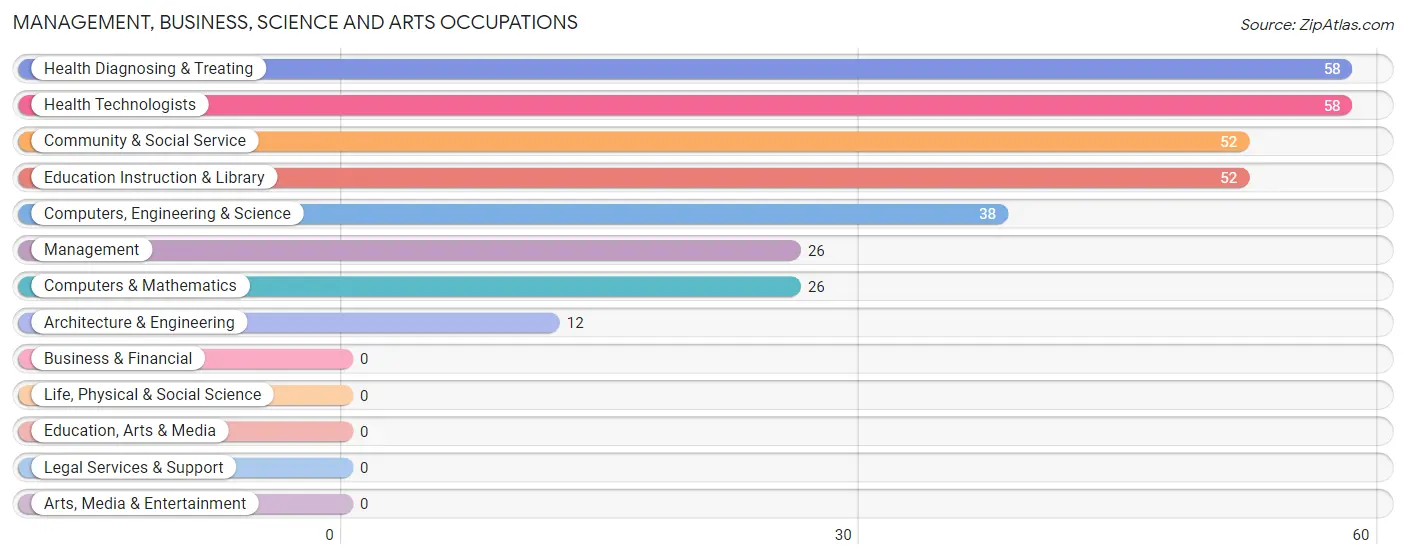
Management, Business, Science and Arts Occupations
The most common Management, Business, Science and Arts occupations in Pacific City are Health Diagnosing & Treating (58 | 9.3%), Health Technologists (58 | 9.3%), Community & Social Service (52 | 8.4%), Education Instruction & Library (52 | 8.4%), and Computers, Engineering & Science (38 | 6.1%).
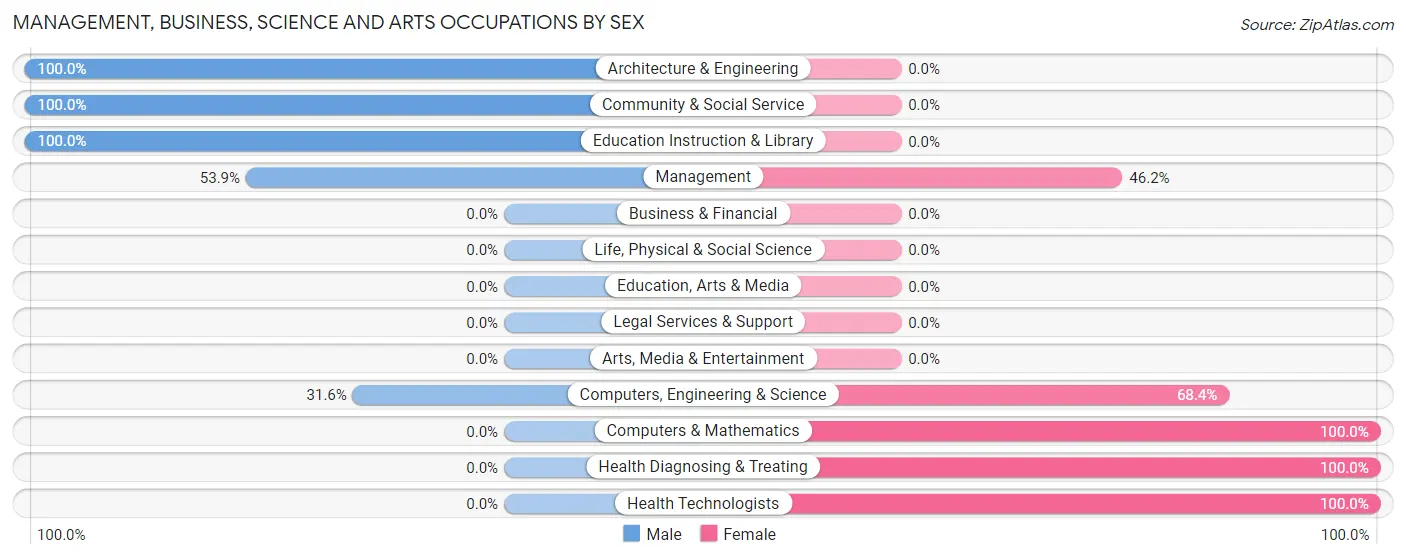
Management, Business, Science and Arts Occupations by Sex
Within the Management, Business, Science and Arts occupations in Pacific City, the most male-oriented occupations are Architecture & Engineering (100.0%), Community & Social Service (100.0%), and Education Instruction & Library (100.0%), while the most female-oriented occupations are Computers & Mathematics (100.0%), Health Diagnosing & Treating (100.0%), and Health Technologists (100.0%).
| Occupation | Male | Female |
| Management | 14 (53.8%) | 12 (46.2%) |
| Business & Financial | 0 (0.0%) | 0 (0.0%) |
| Computers, Engineering & Science | 12 (31.6%) | 26 (68.4%) |
| Computers & Mathematics | 0 (0.0%) | 26 (100.0%) |
| Architecture & Engineering | 12 (100.0%) | 0 (0.0%) |
| Life, Physical & Social Science | 0 (0.0%) | 0 (0.0%) |
| Community & Social Service | 52 (100.0%) | 0 (0.0%) |
| Education, Arts & Media | 0 (0.0%) | 0 (0.0%) |
| Legal Services & Support | 0 (0.0%) | 0 (0.0%) |
| Education Instruction & Library | 52 (100.0%) | 0 (0.0%) |
| Arts, Media & Entertainment | 0 (0.0%) | 0 (0.0%) |
| Health Diagnosing & Treating | 0 (0.0%) | 58 (100.0%) |
| Health Technologists | 0 (0.0%) | 58 (100.0%) |
| Total (Category) | 78 (44.8%) | 96 (55.2%) |
| Total (Overall) | 370 (59.5%) | 252 (40.5%) |
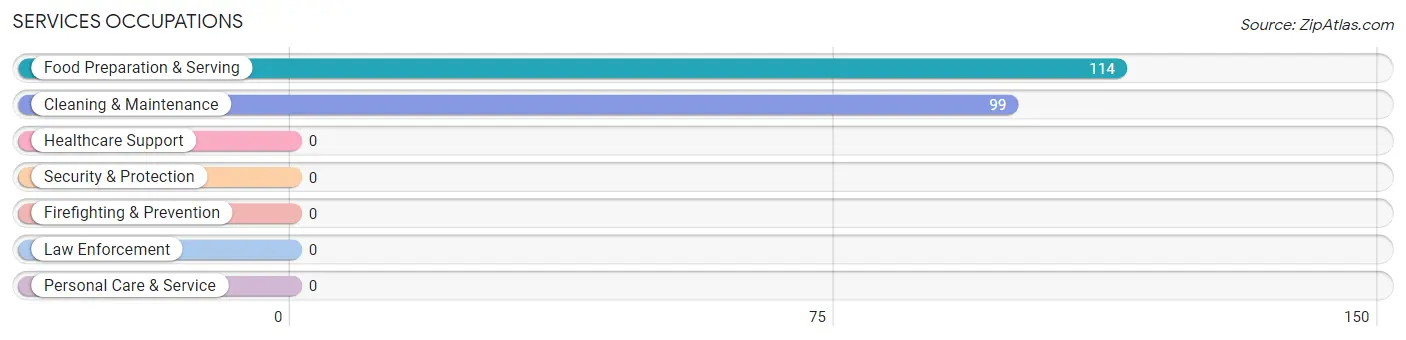
Services Occupations
The most common Services occupations in Pacific City are Food Preparation & Serving (114 | 18.3%), and Cleaning & Maintenance (99 | 15.9%).
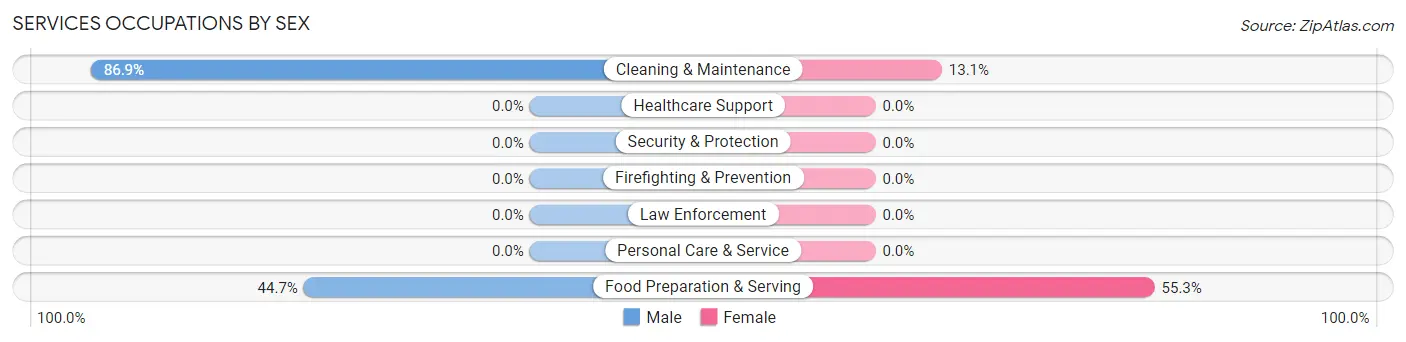
Services Occupations by Sex
Within the Services occupations in Pacific City, the most male-oriented occupations are Cleaning & Maintenance (86.9%), and Food Preparation & Serving (44.7%), while the most female-oriented occupations are Food Preparation & Serving (55.3%), and Cleaning & Maintenance (13.1%).
| Occupation | Male | Female |
| Healthcare Support | 0 (0.0%) | 0 (0.0%) |
| Security & Protection | 0 (0.0%) | 0 (0.0%) |
| Firefighting & Prevention | 0 (0.0%) | 0 (0.0%) |
| Law Enforcement | 0 (0.0%) | 0 (0.0%) |
| Food Preparation & Serving | 51 (44.7%) | 63 (55.3%) |
| Cleaning & Maintenance | 86 (86.9%) | 13 (13.1%) |
| Personal Care & Service | 0 (0.0%) | 0 (0.0%) |
| Total (Category) | 137 (64.3%) | 76 (35.7%) |
| Total (Overall) | 370 (59.5%) | 252 (40.5%) |
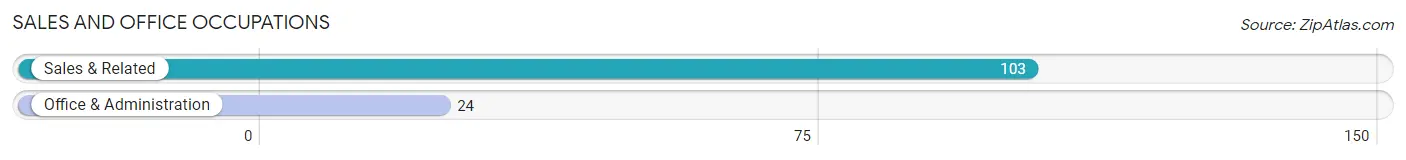
Sales and Office Occupations
The most common Sales and Office occupations in Pacific City are Sales & Related (103 | 16.6%), and Office & Administration (24 | 3.9%).
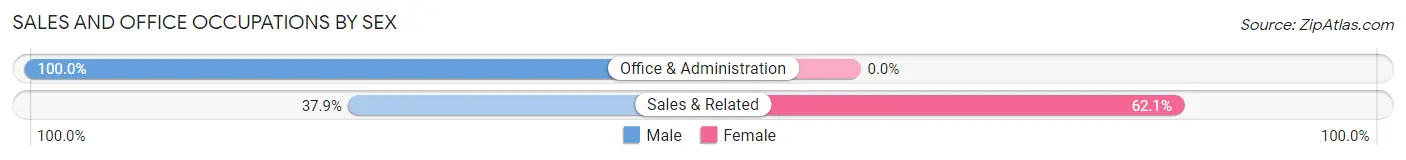
Sales and Office Occupations by Sex
| Occupation | Male | Female |
| Sales & Related | 39 (37.9%) | 64 (62.1%) |
| Office & Administration | 24 (100.0%) | 0 (0.0%) |
| Total (Category) | 63 (49.6%) | 64 (50.4%) |
| Total (Overall) | 370 (59.5%) | 252 (40.5%) |
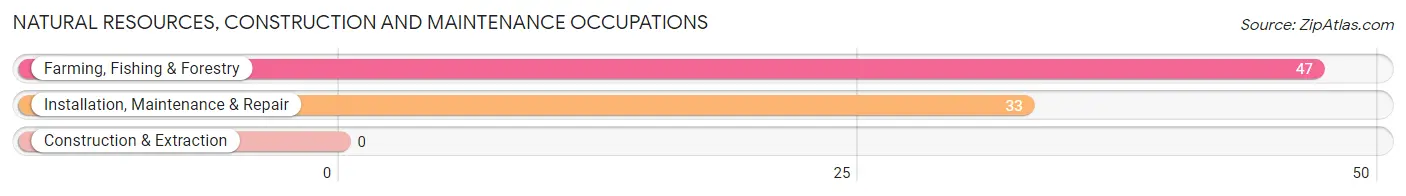
Natural Resources, Construction and Maintenance Occupations
The most common Natural Resources, Construction and Maintenance occupations in Pacific City are Farming, Fishing & Forestry (47 | 7.6%), and Installation, Maintenance & Repair (33 | 5.3%).
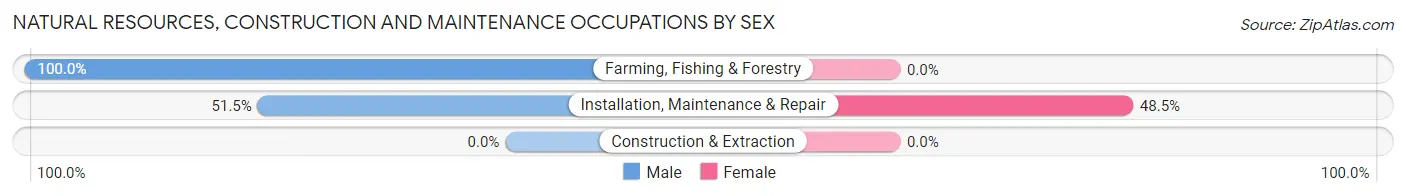
Natural Resources, Construction and Maintenance Occupations by Sex
| Occupation | Male | Female |
| Farming, Fishing & Forestry | 47 (100.0%) | 0 (0.0%) |
| Construction & Extraction | 0 (0.0%) | 0 (0.0%) |
| Installation, Maintenance & Repair | 17 (51.5%) | 16 (48.5%) |
| Total (Category) | 64 (80.0%) | 16 (20.0%) |
| Total (Overall) | 370 (59.5%) | 252 (40.5%) |
Production, Transportation and Moving Occupations
The most common Production, Transportation and Moving occupations in Pacific City are , and Transportation (28 | 4.5%).
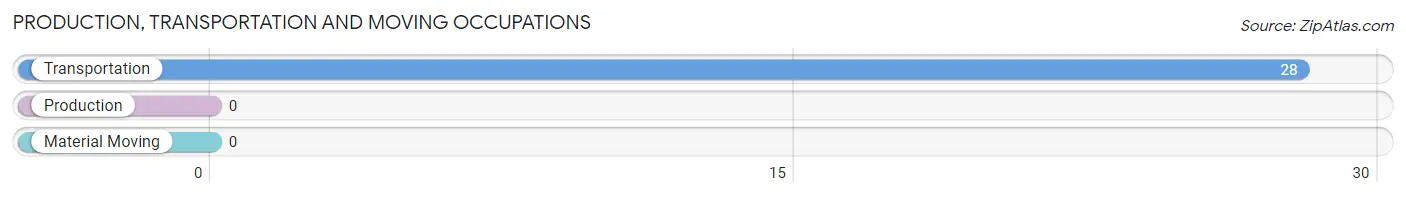
Production, Transportation and Moving Occupations by Sex
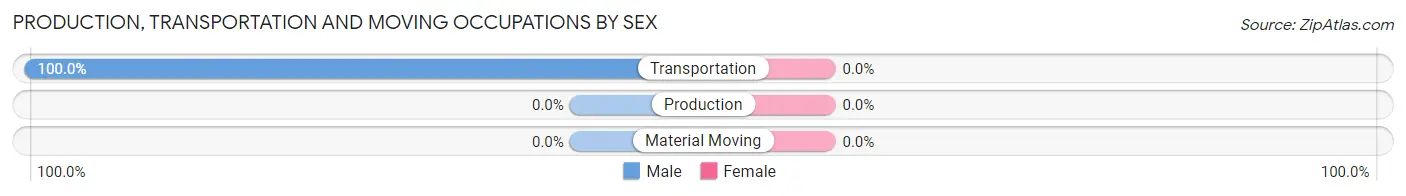
| Occupation | Male | Female |
| Production | 0 (0.0%) | 0 (0.0%) |
| Transportation | 28 (100.0%) | 0 (0.0%) |
| Material Moving | 0 (0.0%) | 0 (0.0%) |
| Total (Category) | 28 (100.0%) | 0 (0.0%) |
| Total (Overall) | 370 (59.5%) | 252 (40.5%) |
Employment Industries by Sex in Pacific City
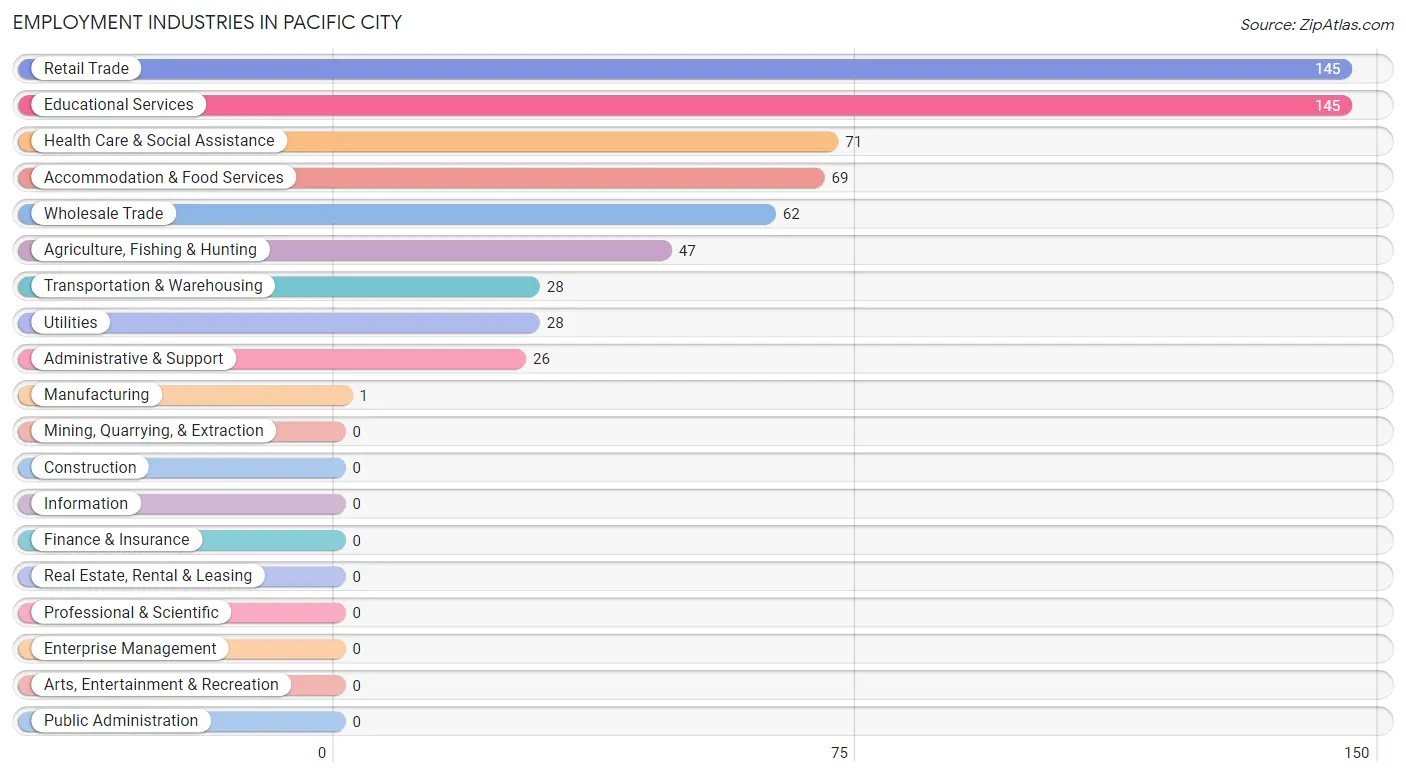
Employment Industries in Pacific City
The major employment industries in Pacific City include Retail Trade (145 | 23.3%), Educational Services (145 | 23.3%), Health Care & Social Assistance (71 | 11.4%), Accommodation & Food Services (69 | 11.1%), and Wholesale Trade (62 | 10.0%).
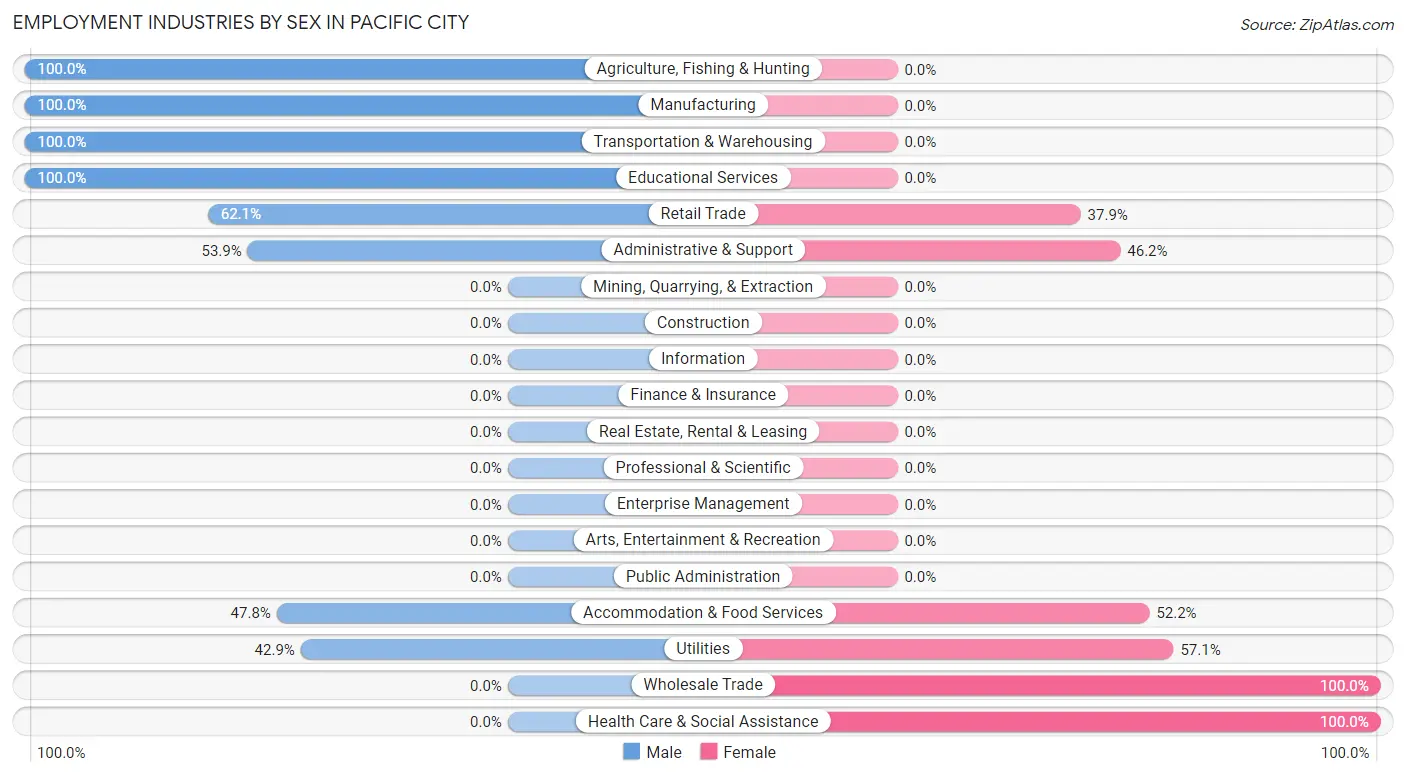
Employment Industries by Sex in Pacific City
The Pacific City industries that see more men than women are Agriculture, Fishing & Hunting (100.0%), Manufacturing (100.0%), and Transportation & Warehousing (100.0%), whereas the industries that tend to have a higher number of women are Wholesale Trade (100.0%), Health Care & Social Assistance (100.0%), and Utilities (57.1%).
| Industry | Male | Female |
| Agriculture, Fishing & Hunting | 47 (100.0%) | 0 (0.0%) |
| Mining, Quarrying, & Extraction | 0 (0.0%) | 0 (0.0%) |
| Construction | 0 (0.0%) | 0 (0.0%) |
| Manufacturing | 1 (100.0%) | 0 (0.0%) |
| Wholesale Trade | 0 (0.0%) | 62 (100.0%) |
| Retail Trade | 90 (62.1%) | 55 (37.9%) |
| Transportation & Warehousing | 28 (100.0%) | 0 (0.0%) |
| Utilities | 12 (42.9%) | 16 (57.1%) |
| Information | 0 (0.0%) | 0 (0.0%) |
| Finance & Insurance | 0 (0.0%) | 0 (0.0%) |
| Real Estate, Rental & Leasing | 0 (0.0%) | 0 (0.0%) |
| Professional & Scientific | 0 (0.0%) | 0 (0.0%) |
| Enterprise Management | 0 (0.0%) | 0 (0.0%) |
| Administrative & Support | 14 (53.8%) | 12 (46.2%) |
| Educational Services | 145 (100.0%) | 0 (0.0%) |
| Health Care & Social Assistance | 0 (0.0%) | 71 (100.0%) |
| Arts, Entertainment & Recreation | 0 (0.0%) | 0 (0.0%) |
| Accommodation & Food Services | 33 (47.8%) | 36 (52.2%) |
| Public Administration | 0 (0.0%) | 0 (0.0%) |
| Total | 370 (59.5%) | 252 (40.5%) |
Education in Pacific City
School Enrollment in Pacific City
The most common levels of schooling among the 424 students in Pacific City are middle school (197 | 46.5%), high school (124 | 29.2%), and elementary school (54 | 12.7%).
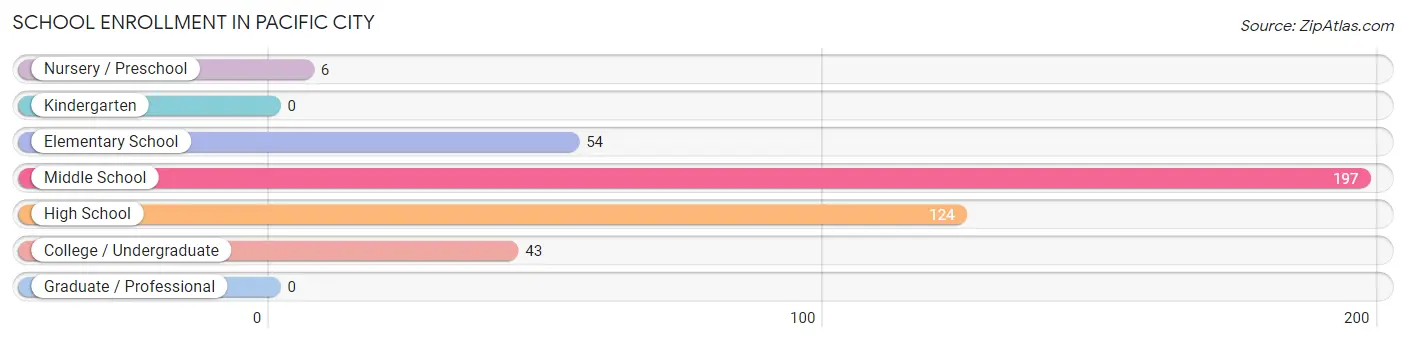
| School Level | # Students | % Students |
| Nursery / Preschool | 6 | 1.4% |
| Kindergarten | 0 | 0.0% |
| Elementary School | 54 | 12.7% |
| Middle School | 197 | 46.5% |
| High School | 124 | 29.2% |
| College / Undergraduate | 43 | 10.1% |
| Graduate / Professional | 0 | 0.0% |
| Total | 424 | 100.0% |
School Enrollment by Age by Funding Source in Pacific City
Out of a total of 424 students who are enrolled in schools in Pacific City, 13 (3.1%) attend a private institution, while the remaining 411 (96.9%) are enrolled in public schools. The age group of 5 to 9 year old has the highest likelihood of being enrolled in private schools, with 13 (24.1% in the age bracket) enrolled. Conversely, the age group of 3 to 4 year olds has the lowest likelihood of being enrolled in a private school, with 6 (100.0% in the age bracket) attending a public institution.
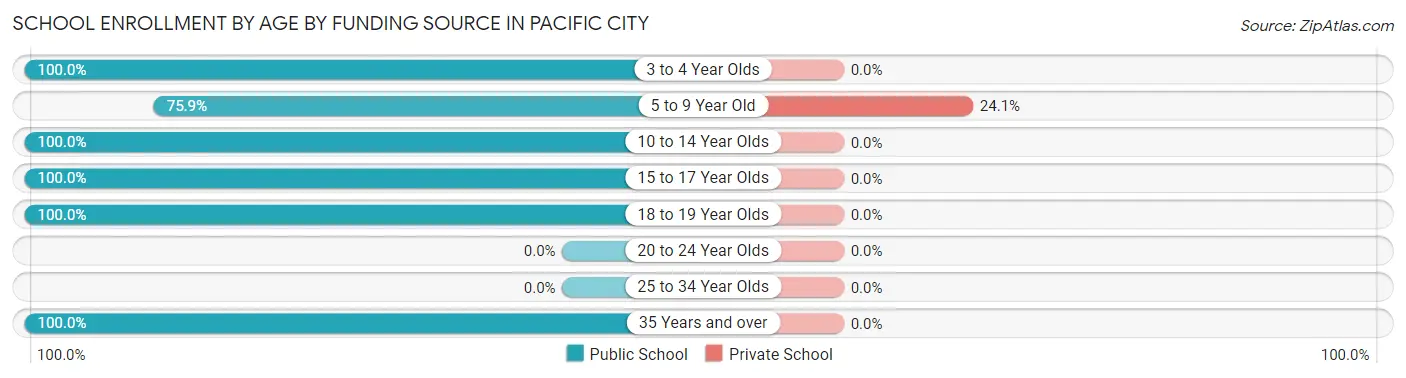
| Age Bracket | Public School | Private School |
| 3 to 4 Year Olds | 6 (100.0%) | 0 (0.0%) |
| 5 to 9 Year Old | 41 (75.9%) | 13 (24.1%) |
| 10 to 14 Year Olds | 173 (100.0%) | 0 (0.0%) |
| 15 to 17 Year Olds | 68 (100.0%) | 0 (0.0%) |
| 18 to 19 Year Olds | 80 (100.0%) | 0 (0.0%) |
| 20 to 24 Year Olds | 0 (0.0%) | 0 (0.0%) |
| 25 to 34 Year Olds | 0 (0.0%) | 0 (0.0%) |
| 35 Years and over | 43 (100.0%) | 0 (0.0%) |
| Total | 411 (96.9%) | 13 (3.1%) |
Educational Attainment by Field of Study in Pacific City
Education (83 | 29.2%), business (63 | 22.2%), bio, nature & agricultural (38 | 13.4%), science & technology (34 | 12.0%), and social sciences (28 | 9.9%) are the most common fields of study among 284 individuals in Pacific City who have obtained a bachelor's degree or higher.
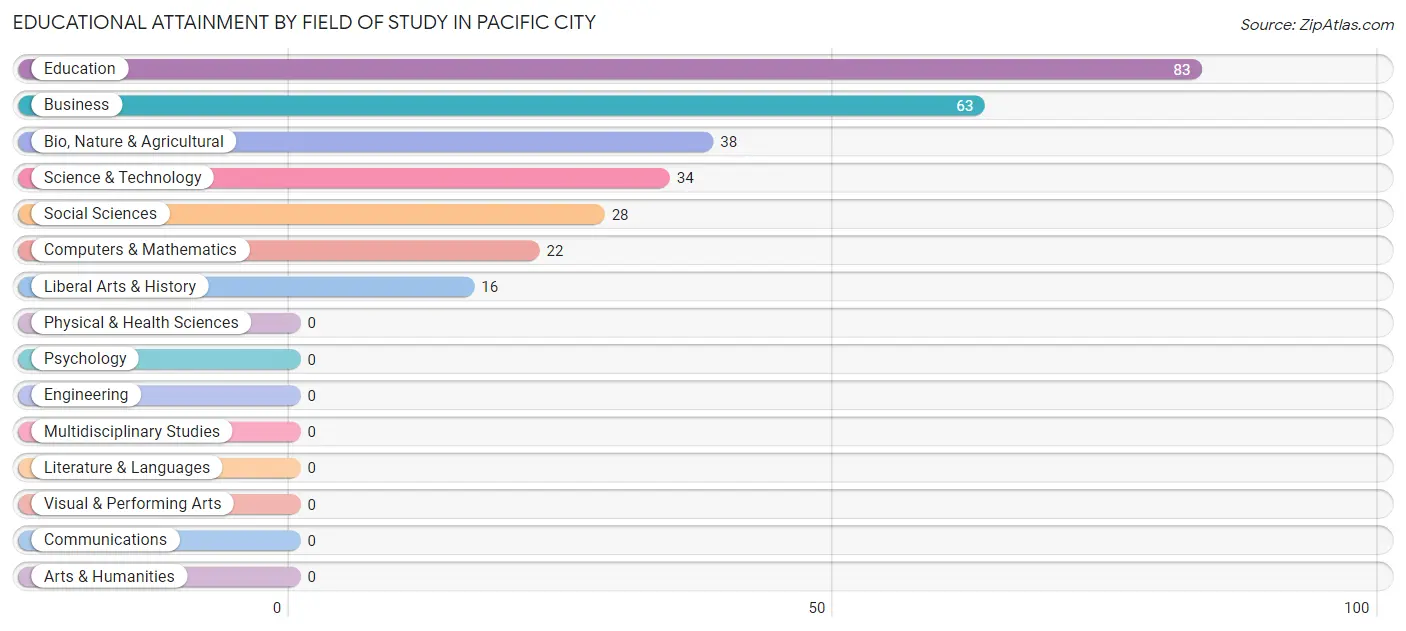
| Field of Study | # Graduates | % Graduates |
| Computers & Mathematics | 22 | 7.7% |
| Bio, Nature & Agricultural | 38 | 13.4% |
| Physical & Health Sciences | 0 | 0.0% |
| Psychology | 0 | 0.0% |
| Social Sciences | 28 | 9.9% |
| Engineering | 0 | 0.0% |
| Multidisciplinary Studies | 0 | 0.0% |
| Science & Technology | 34 | 12.0% |
| Business | 63 | 22.2% |
| Education | 83 | 29.2% |
| Literature & Languages | 0 | 0.0% |
| Liberal Arts & History | 16 | 5.6% |
| Visual & Performing Arts | 0 | 0.0% |
| Communications | 0 | 0.0% |
| Arts & Humanities | 0 | 0.0% |
| Total | 284 | 100.0% |
Transportation & Commute in Pacific City
Vehicle Availability by Sex in Pacific City
The most prevalent vehicle ownership categories in Pacific City are males with 1 vehicle (195, accounting for 52.7%) and females with 1 vehicle (28, making up 77.4%).
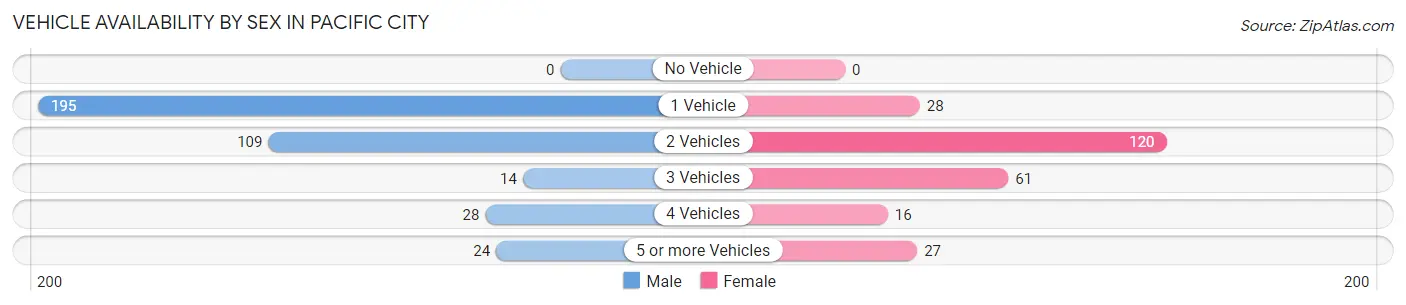
| Vehicles Available | Male | Female |
| No Vehicle | 0 (0.0%) | 0 (0.0%) |
| 1 Vehicle | 195 (52.7%) | 28 (11.1%) |
| 2 Vehicles | 109 (29.5%) | 120 (47.6%) |
| 3 Vehicles | 14 (3.8%) | 61 (24.2%) |
| 4 Vehicles | 28 (7.6%) | 16 (6.4%) |
| 5 or more Vehicles | 24 (6.5%) | 27 (10.7%) |
| Total | 370 (100.0%) | 252 (100.0%) |
Commute Time in Pacific City
The most frequently occuring commute durations in Pacific City are 5 to 9 minutes (228 commuters, 38.9%), less than 5 minutes (123 commuters, 21.0%), and 10 to 14 minutes (81 commuters, 13.8%).
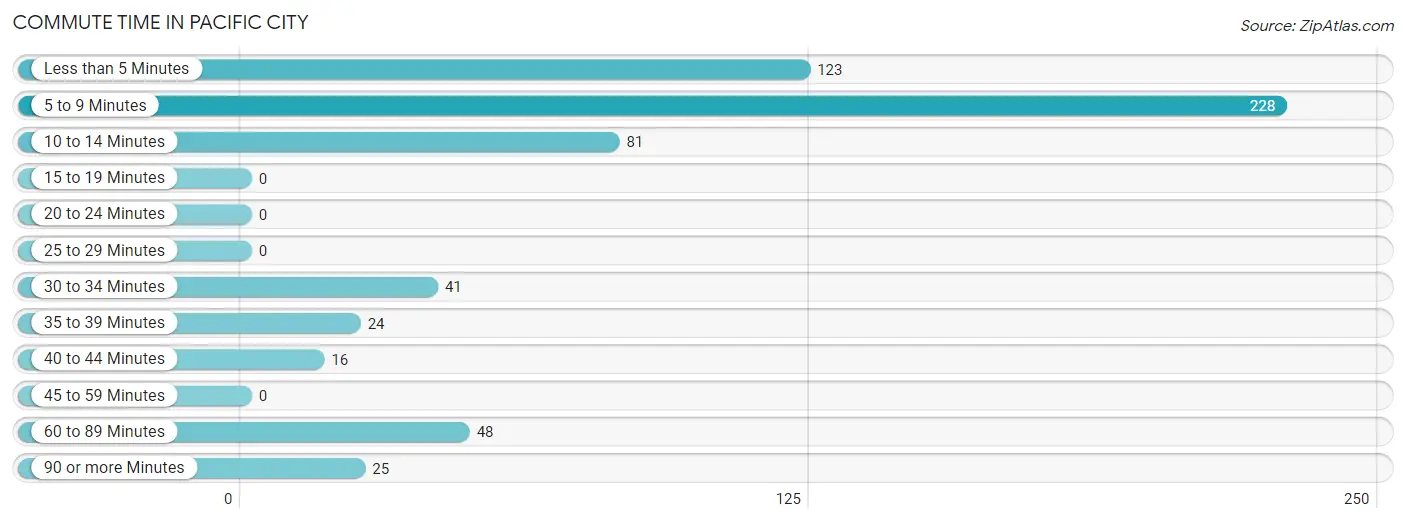
| Commute Time | # Commuters | % Commuters |
| Less than 5 Minutes | 123 | 21.0% |
| 5 to 9 Minutes | 228 | 38.9% |
| 10 to 14 Minutes | 81 | 13.8% |
| 15 to 19 Minutes | 0 | 0.0% |
| 20 to 24 Minutes | 0 | 0.0% |
| 25 to 29 Minutes | 0 | 0.0% |
| 30 to 34 Minutes | 41 | 7.0% |
| 35 to 39 Minutes | 24 | 4.1% |
| 40 to 44 Minutes | 16 | 2.7% |
| 45 to 59 Minutes | 0 | 0.0% |
| 60 to 89 Minutes | 48 | 8.2% |
| 90 or more Minutes | 25 | 4.3% |
Commute Time by Sex in Pacific City
The most common commute times in Pacific City are 5 to 9 minutes (138 commuters, 37.3%) for males and 5 to 9 minutes (90 commuters, 41.7%) for females.
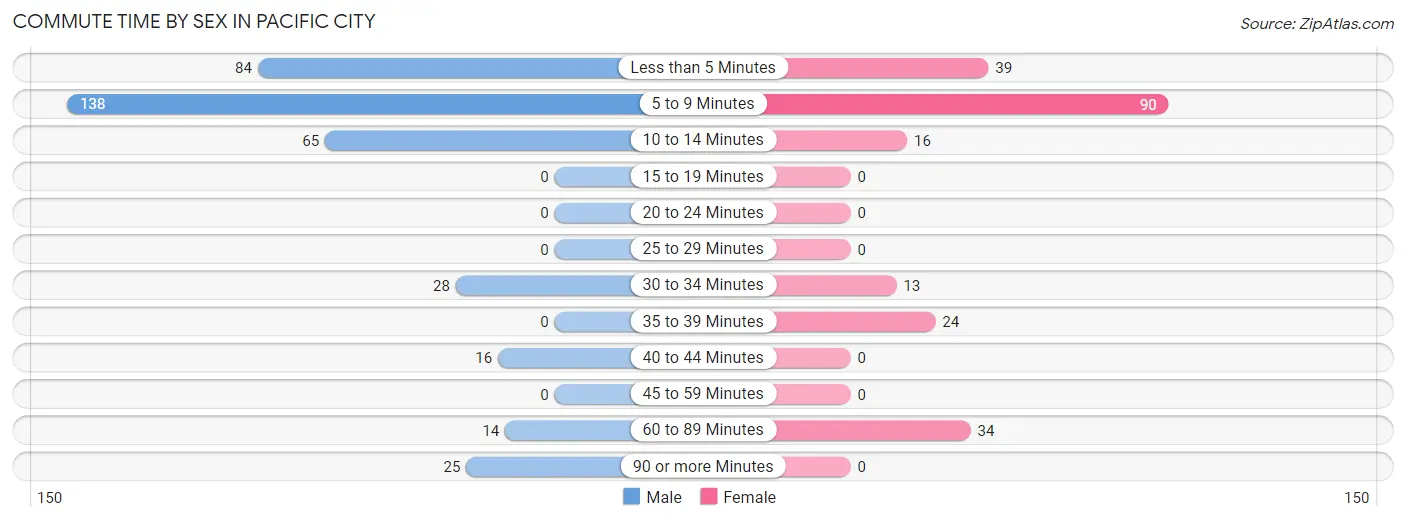
| Commute Time | Male | Female |
| Less than 5 Minutes | 84 (22.7%) | 39 (18.1%) |
| 5 to 9 Minutes | 138 (37.3%) | 90 (41.7%) |
| 10 to 14 Minutes | 65 (17.6%) | 16 (7.4%) |
| 15 to 19 Minutes | 0 (0.0%) | 0 (0.0%) |
| 20 to 24 Minutes | 0 (0.0%) | 0 (0.0%) |
| 25 to 29 Minutes | 0 (0.0%) | 0 (0.0%) |
| 30 to 34 Minutes | 28 (7.6%) | 13 (6.0%) |
| 35 to 39 Minutes | 0 (0.0%) | 24 (11.1%) |
| 40 to 44 Minutes | 16 (4.3%) | 0 (0.0%) |
| 45 to 59 Minutes | 0 (0.0%) | 0 (0.0%) |
| 60 to 89 Minutes | 14 (3.8%) | 34 (15.7%) |
| 90 or more Minutes | 25 (6.8%) | 0 (0.0%) |
Time of Departure to Work by Sex in Pacific City
The most frequent times of departure to work in Pacific City are 12:00 PM to 3:59 PM (103, 27.8%) for males and 12:00 PM to 3:59 PM (75, 34.7%) for females.
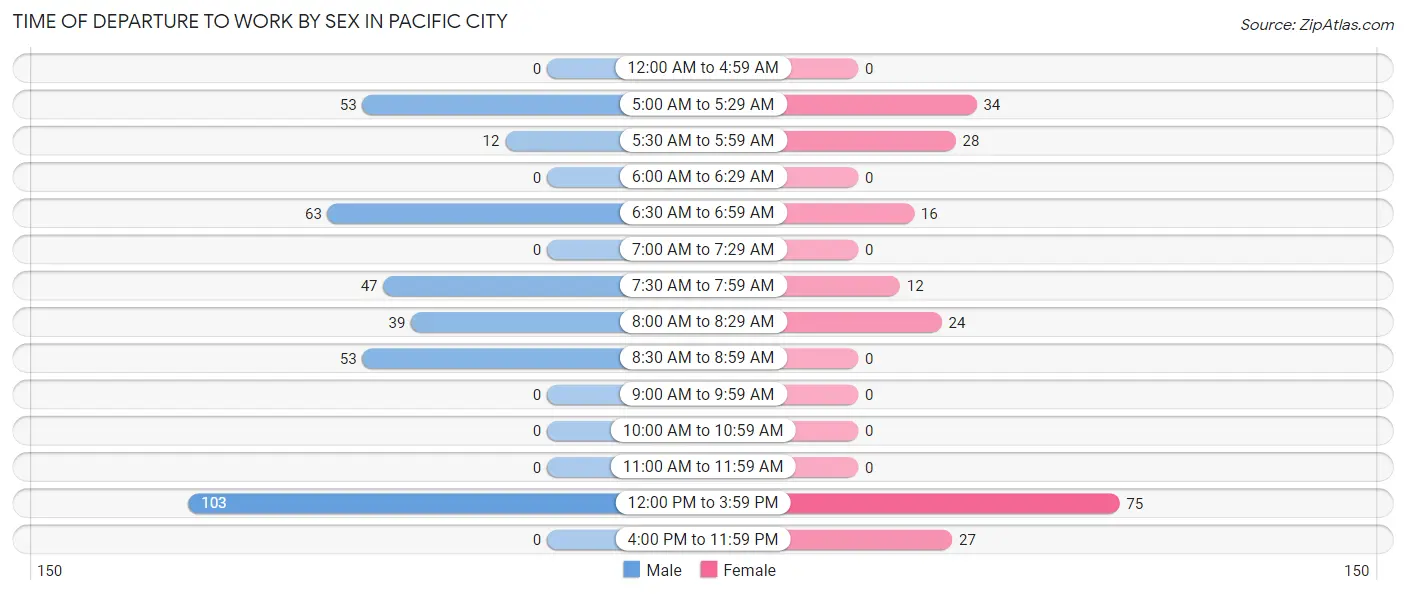
| Time of Departure | Male | Female |
| 12:00 AM to 4:59 AM | 0 (0.0%) | 0 (0.0%) |
| 5:00 AM to 5:29 AM | 53 (14.3%) | 34 (15.7%) |
| 5:30 AM to 5:59 AM | 12 (3.2%) | 28 (13.0%) |
| 6:00 AM to 6:29 AM | 0 (0.0%) | 0 (0.0%) |
| 6:30 AM to 6:59 AM | 63 (17.0%) | 16 (7.4%) |
| 7:00 AM to 7:29 AM | 0 (0.0%) | 0 (0.0%) |
| 7:30 AM to 7:59 AM | 47 (12.7%) | 12 (5.6%) |
| 8:00 AM to 8:29 AM | 39 (10.5%) | 24 (11.1%) |
| 8:30 AM to 8:59 AM | 53 (14.3%) | 0 (0.0%) |
| 9:00 AM to 9:59 AM | 0 (0.0%) | 0 (0.0%) |
| 10:00 AM to 10:59 AM | 0 (0.0%) | 0 (0.0%) |
| 11:00 AM to 11:59 AM | 0 (0.0%) | 0 (0.0%) |
| 12:00 PM to 3:59 PM | 103 (27.8%) | 75 (34.7%) |
| 4:00 PM to 11:59 PM | 0 (0.0%) | 27 (12.5%) |
| Total | 370 (100.0%) | 216 (100.0%) |
Housing Occupancy in Pacific City
Occupancy by Ownership in Pacific City
Of the total 754 dwellings in Pacific City, owner-occupied units account for 513 (68.0%), while renter-occupied units make up 241 (32.0%).
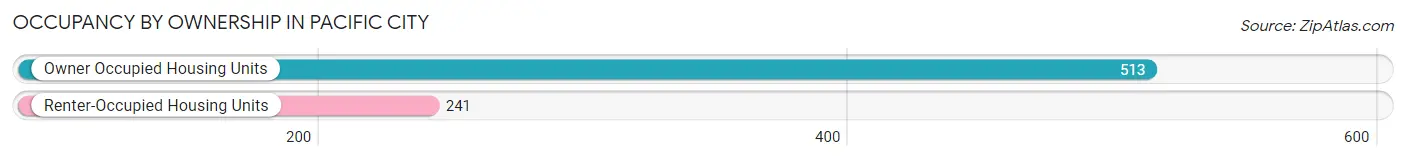
| Occupancy | # Housing Units | % Housing Units |
| Owner Occupied Housing Units | 513 | 68.0% |
| Renter-Occupied Housing Units | 241 | 32.0% |
| Total Occupied Housing Units | 754 | 100.0% |
Occupancy by Household Size in Pacific City
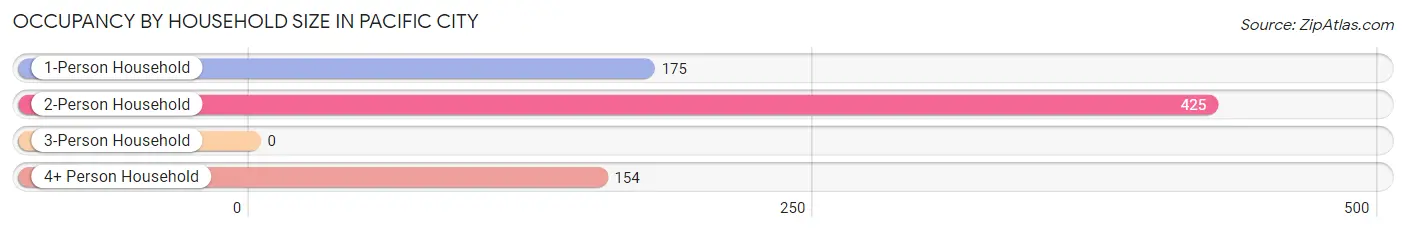
| Household Size | # Housing Units | % Housing Units |
| 1-Person Household | 175 | 23.2% |
| 2-Person Household | 425 | 56.4% |
| 3-Person Household | 0 | 0.0% |
| 4+ Person Household | 154 | 20.4% |
| Total Housing Units | 754 | 100.0% |
Occupancy by Ownership by Household Size in Pacific City
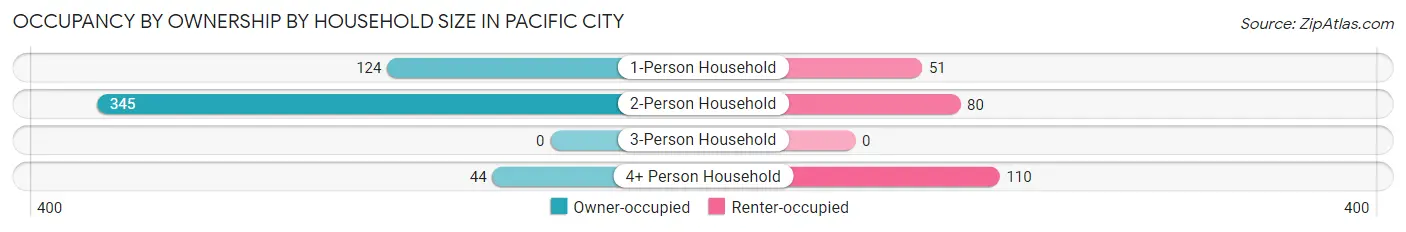
| Household Size | Owner-occupied | Renter-occupied |
| 1-Person Household | 124 (70.9%) | 51 (29.1%) |
| 2-Person Household | 345 (81.2%) | 80 (18.8%) |
| 3-Person Household | 0 (0.0%) | 0 (0.0%) |
| 4+ Person Household | 44 (28.6%) | 110 (71.4%) |
| Total Housing Units | 513 (68.0%) | 241 (32.0%) |
Occupancy by Educational Attainment in Pacific City
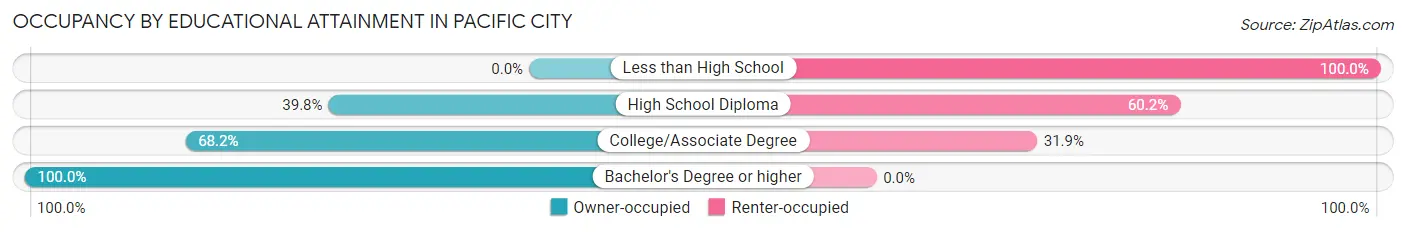
| Household Size | Owner-occupied | Renter-occupied |
| Less than High School | 0 (0.0%) | 30 (100.0%) |
| High School Diploma | 35 (39.8%) | 53 (60.2%) |
| College/Associate Degree | 338 (68.1%) | 158 (31.9%) |
| Bachelor's Degree or higher | 140 (100.0%) | 0 (0.0%) |
Occupancy by Age of Householder in Pacific City
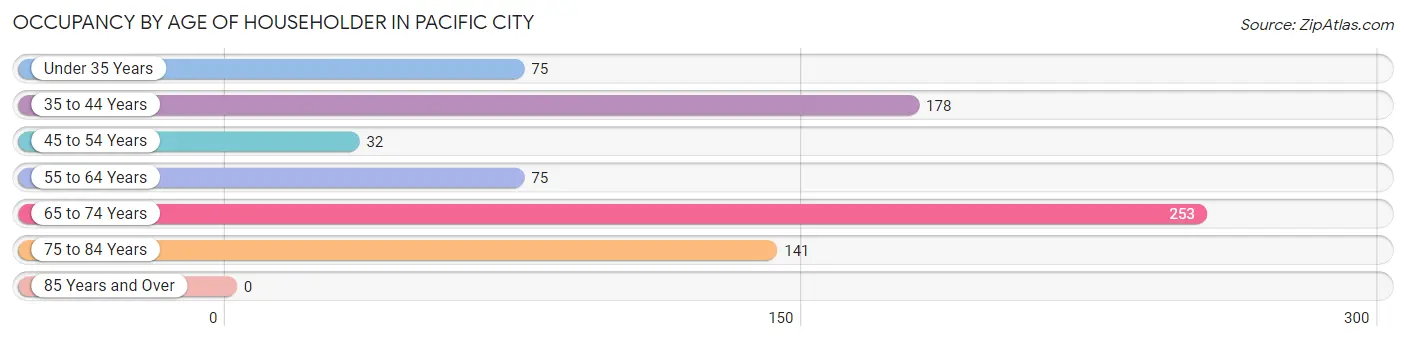
| Age Bracket | # Households | % Households |
| Under 35 Years | 75 | 10.0% |
| 35 to 44 Years | 178 | 23.6% |
| 45 to 54 Years | 32 | 4.2% |
| 55 to 64 Years | 75 | 10.0% |
| 65 to 74 Years | 253 | 33.6% |
| 75 to 84 Years | 141 | 18.7% |
| 85 Years and Over | 0 | 0.0% |
| Total | 754 | 100.0% |
Housing Finances in Pacific City
Median Income by Occupancy in Pacific City
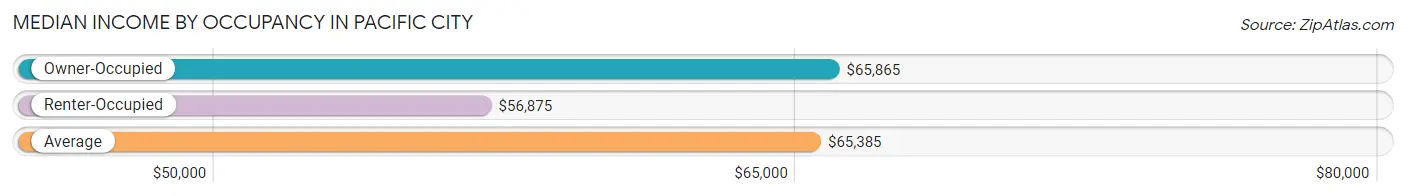
| Occupancy Type | # Households | Median Income |
| Owner-Occupied | 513 (68.0%) | $65,865 |
| Renter-Occupied | 241 (32.0%) | $56,875 |
| Average | 754 (100.0%) | $65,385 |
Occupancy by Householder Income Bracket in Pacific City
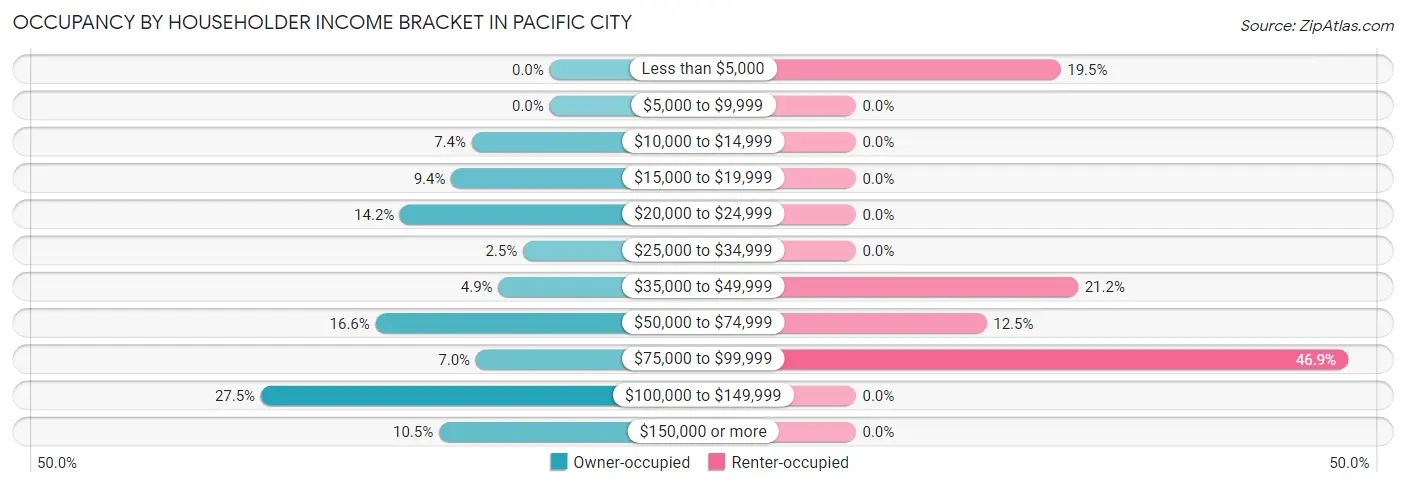
| Income Bracket | Owner-occupied | Renter-occupied |
| Less than $5,000 | 0 (0.0%) | 47 (19.5%) |
| $5,000 to $9,999 | 0 (0.0%) | 0 (0.0%) |
| $10,000 to $14,999 | 38 (7.4%) | 0 (0.0%) |
| $15,000 to $19,999 | 48 (9.4%) | 0 (0.0%) |
| $20,000 to $24,999 | 73 (14.2%) | 0 (0.0%) |
| $25,000 to $34,999 | 13 (2.5%) | 0 (0.0%) |
| $35,000 to $49,999 | 25 (4.9%) | 51 (21.2%) |
| $50,000 to $74,999 | 85 (16.6%) | 30 (12.4%) |
| $75,000 to $99,999 | 36 (7.0%) | 113 (46.9%) |
| $100,000 to $149,999 | 141 (27.5%) | 0 (0.0%) |
| $150,000 or more | 54 (10.5%) | 0 (0.0%) |
| Total | 513 (100.0%) | 241 (100.0%) |
Monthly Housing Cost Tiers in Pacific City
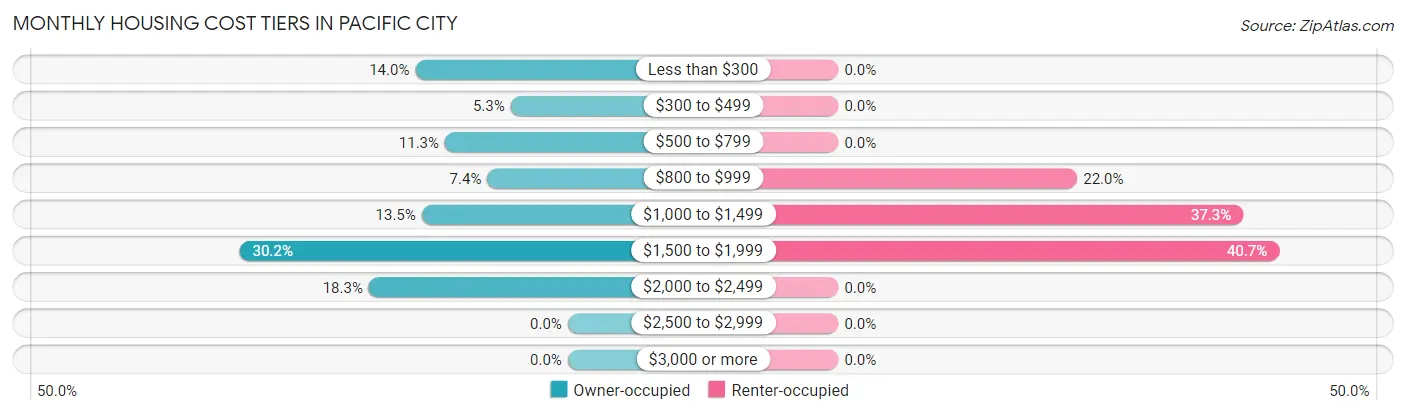
| Monthly Cost | Owner-occupied | Renter-occupied |
| Less than $300 | 72 (14.0%) | 0 (0.0%) |
| $300 to $499 | 27 (5.3%) | 0 (0.0%) |
| $500 to $799 | 58 (11.3%) | 0 (0.0%) |
| $800 to $999 | 38 (7.4%) | 53 (22.0%) |
| $1,000 to $1,499 | 69 (13.5%) | 90 (37.3%) |
| $1,500 to $1,999 | 155 (30.2%) | 98 (40.7%) |
| $2,000 to $2,499 | 94 (18.3%) | 0 (0.0%) |
| $2,500 to $2,999 | 0 (0.0%) | 0 (0.0%) |
| $3,000 or more | 0 (0.0%) | 0 (0.0%) |
| Total | 513 (100.0%) | 241 (100.0%) |
Physical Housing Characteristics in Pacific City
Housing Structures in Pacific City
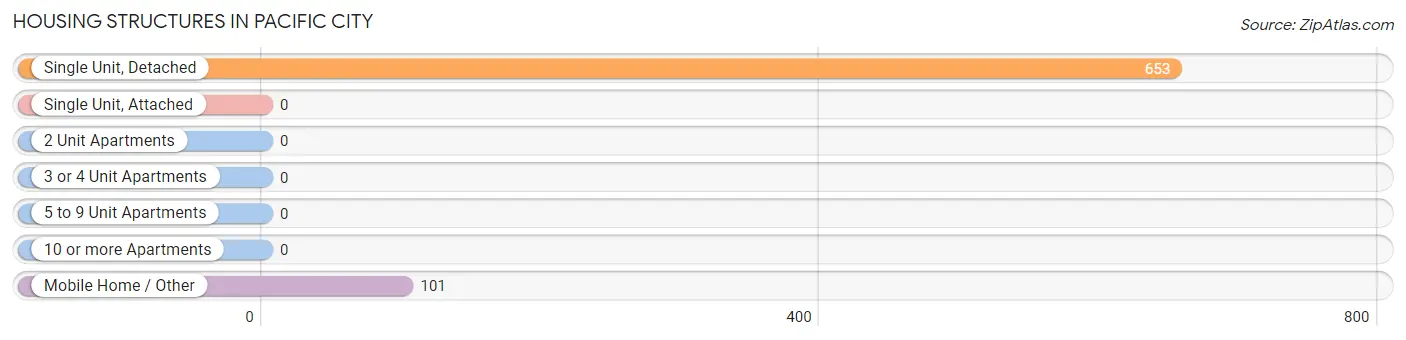
| Structure Type | # Housing Units | % Housing Units |
| Single Unit, Detached | 653 | 86.6% |
| Single Unit, Attached | 0 | 0.0% |
| 2 Unit Apartments | 0 | 0.0% |
| 3 or 4 Unit Apartments | 0 | 0.0% |
| 5 to 9 Unit Apartments | 0 | 0.0% |
| 10 or more Apartments | 0 | 0.0% |
| Mobile Home / Other | 101 | 13.4% |
| Total | 754 | 100.0% |
Housing Structures by Occupancy in Pacific City
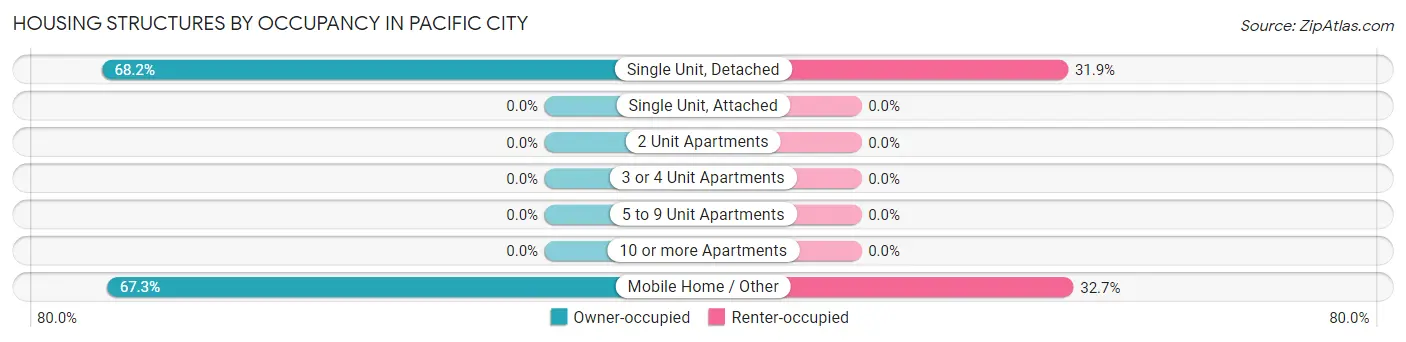
| Structure Type | Owner-occupied | Renter-occupied |
| Single Unit, Detached | 445 (68.1%) | 208 (31.9%) |
| Single Unit, Attached | 0 (0.0%) | 0 (0.0%) |
| 2 Unit Apartments | 0 (0.0%) | 0 (0.0%) |
| 3 or 4 Unit Apartments | 0 (0.0%) | 0 (0.0%) |
| 5 to 9 Unit Apartments | 0 (0.0%) | 0 (0.0%) |
| 10 or more Apartments | 0 (0.0%) | 0 (0.0%) |
| Mobile Home / Other | 68 (67.3%) | 33 (32.7%) |
| Total | 513 (68.0%) | 241 (32.0%) |
Housing Structures by Number of Rooms in Pacific City
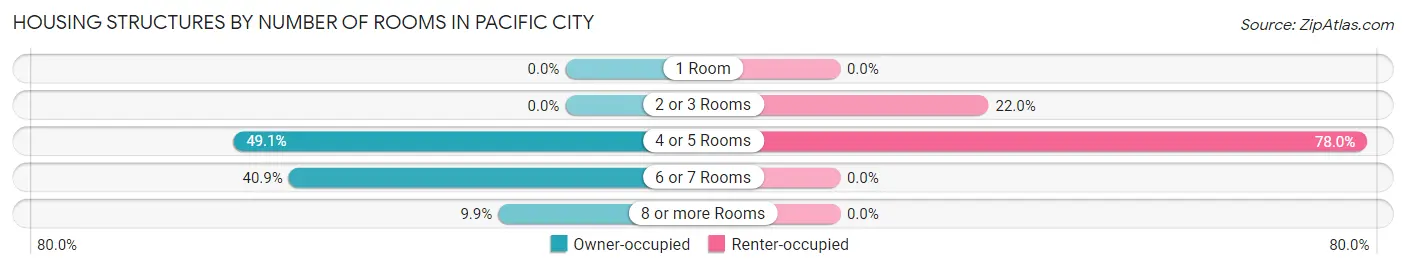
| Number of Rooms | Owner-occupied | Renter-occupied |
| 1 Room | 0 (0.0%) | 0 (0.0%) |
| 2 or 3 Rooms | 0 (0.0%) | 53 (22.0%) |
| 4 or 5 Rooms | 252 (49.1%) | 188 (78.0%) |
| 6 or 7 Rooms | 210 (40.9%) | 0 (0.0%) |
| 8 or more Rooms | 51 (9.9%) | 0 (0.0%) |
| Total | 513 (100.0%) | 241 (100.0%) |
Housing Structure by Heating Type in Pacific City
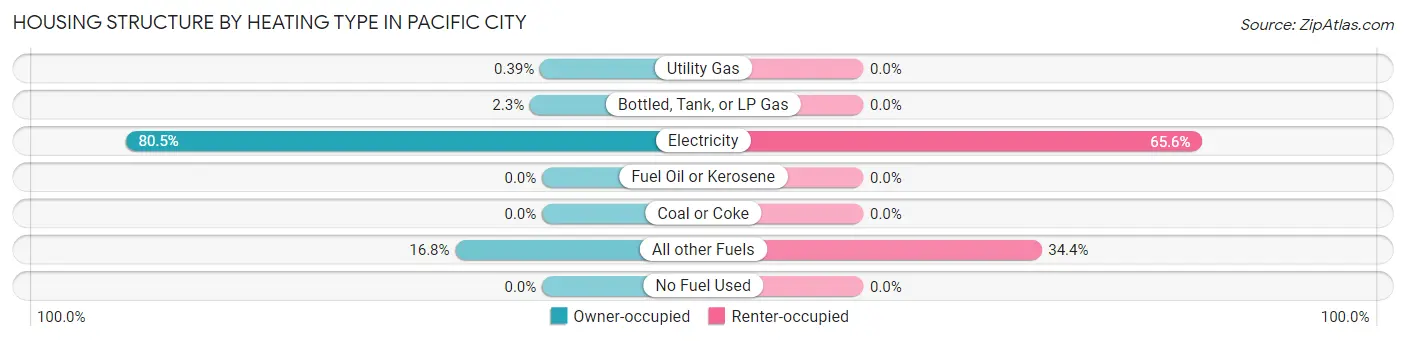
| Heating Type | Owner-occupied | Renter-occupied |
| Utility Gas | 2 (0.4%) | 0 (0.0%) |
| Bottled, Tank, or LP Gas | 12 (2.3%) | 0 (0.0%) |
| Electricity | 413 (80.5%) | 158 (65.6%) |
| Fuel Oil or Kerosene | 0 (0.0%) | 0 (0.0%) |
| Coal or Coke | 0 (0.0%) | 0 (0.0%) |
| All other Fuels | 86 (16.8%) | 83 (34.4%) |
| No Fuel Used | 0 (0.0%) | 0 (0.0%) |
| Total | 513 (100.0%) | 241 (100.0%) |
Household Vehicle Usage in Pacific City
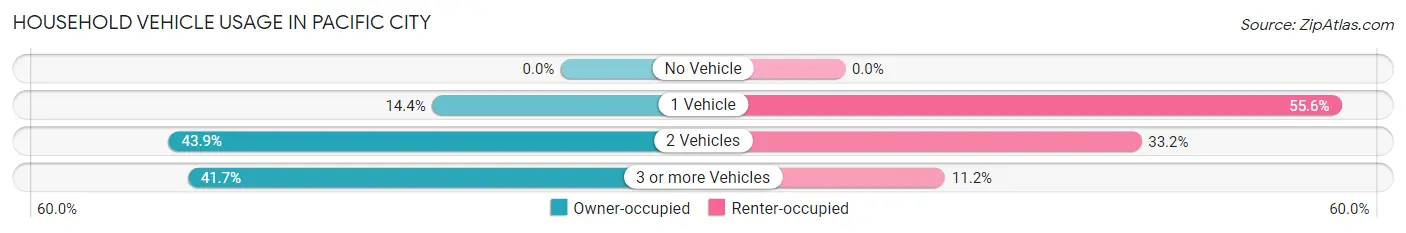
| Vehicles per Household | Owner-occupied | Renter-occupied |
| No Vehicle | 0 (0.0%) | 0 (0.0%) |
| 1 Vehicle | 74 (14.4%) | 134 (55.6%) |
| 2 Vehicles | 225 (43.9%) | 80 (33.2%) |
| 3 or more Vehicles | 214 (41.7%) | 27 (11.2%) |
| Total | 513 (100.0%) | 241 (100.0%) |
Real Estate & Mortgages in Pacific City
Real Estate and Mortgage Overview in Pacific City
| Characteristic | Without Mortgage | With Mortgage |
| Housing Units | 211 | 302 |
| Median Property Value | $329,500 | $490,600 |
| Median Household Income | $20,995 | $38 |
| Monthly Housing Costs | $530 | $0 |
| Real Estate Taxes | - | - |
Property Value by Mortgage Status in Pacific City
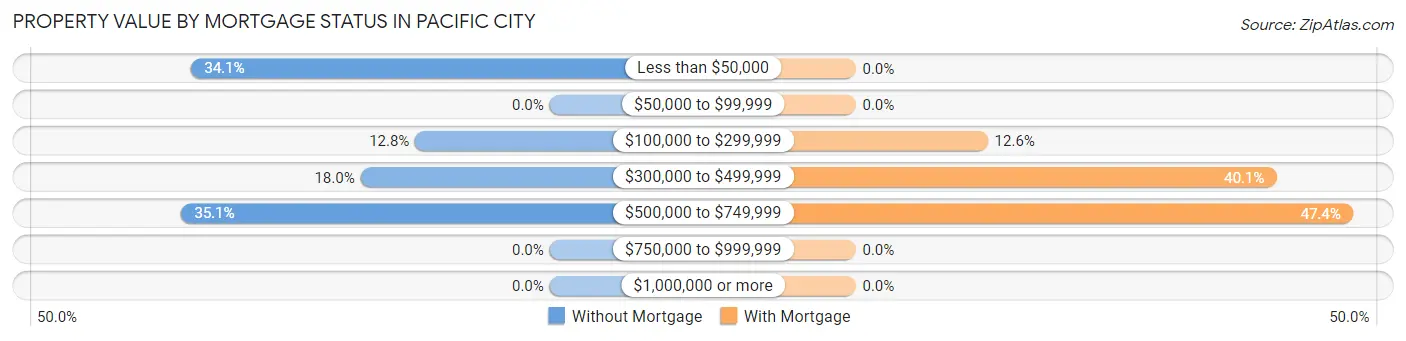
| Property Value | Without Mortgage | With Mortgage |
| Less than $50,000 | 72 (34.1%) | 0 (0.0%) |
| $50,000 to $99,999 | 0 (0.0%) | 0 (0.0%) |
| $100,000 to $299,999 | 27 (12.8%) | 38 (12.6%) |
| $300,000 to $499,999 | 38 (18.0%) | 121 (40.1%) |
| $500,000 to $749,999 | 74 (35.1%) | 143 (47.3%) |
| $750,000 to $999,999 | 0 (0.0%) | 0 (0.0%) |
| $1,000,000 or more | 0 (0.0%) | 0 (0.0%) |
| Total | 211 (100.0%) | 302 (100.0%) |
Household Income by Mortgage Status in Pacific City
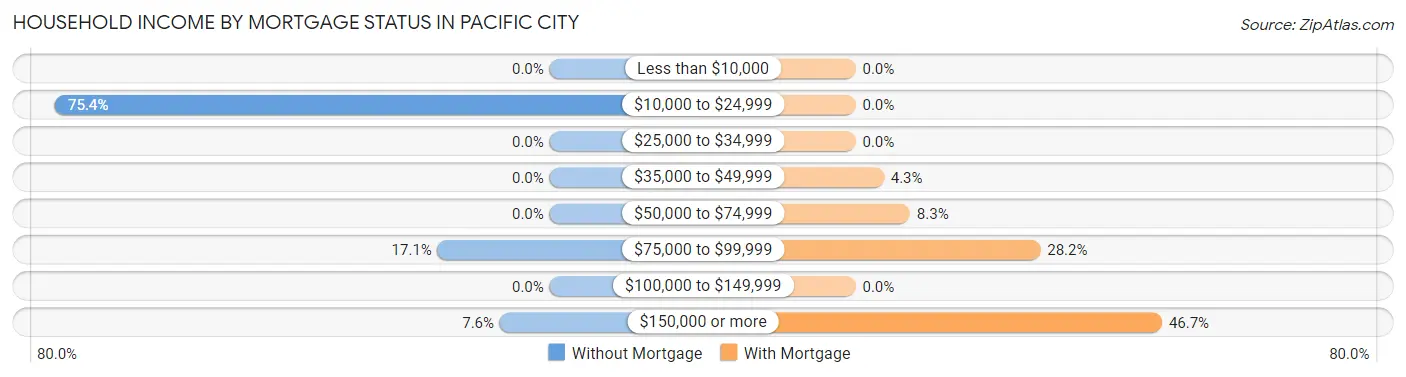
| Household Income | Without Mortgage | With Mortgage |
| Less than $10,000 | 0 (0.0%) | 0 (0.0%) |
| $10,000 to $24,999 | 159 (75.4%) | 0 (0.0%) |
| $25,000 to $34,999 | 0 (0.0%) | 0 (0.0%) |
| $35,000 to $49,999 | 0 (0.0%) | 13 (4.3%) |
| $50,000 to $74,999 | 0 (0.0%) | 25 (8.3%) |
| $75,000 to $99,999 | 36 (17.1%) | 85 (28.1%) |
| $100,000 to $149,999 | 0 (0.0%) | 0 (0.0%) |
| $150,000 or more | 16 (7.6%) | 141 (46.7%) |
| Total | 211 (100.0%) | 302 (100.0%) |
Property Value to Household Income Ratio in Pacific City
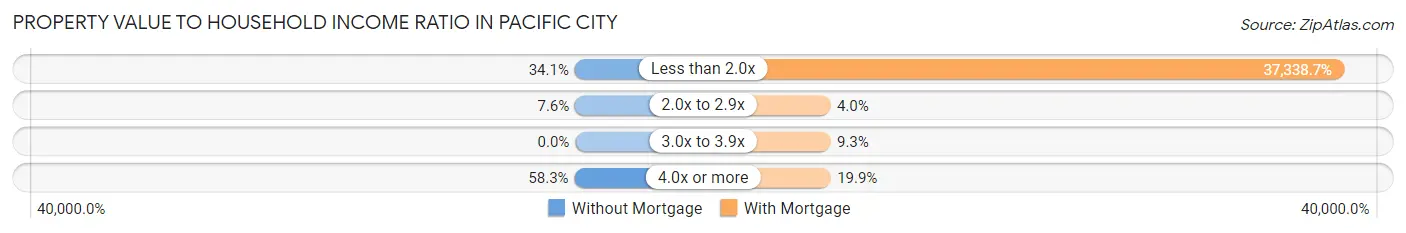
| Value-to-Income Ratio | Without Mortgage | With Mortgage |
| Less than 2.0x | 72 (34.1%) | 112,763 (37,338.7%) |
| 2.0x to 2.9x | 16 (7.6%) | 12 (4.0%) |
| 3.0x to 3.9x | 0 (0.0%) | 28 (9.3%) |
| 4.0x or more | 123 (58.3%) | 60 (19.9%) |
| Total | 211 (100.0%) | 302 (100.0%) |
Real Estate Taxes by Mortgage Status in Pacific City
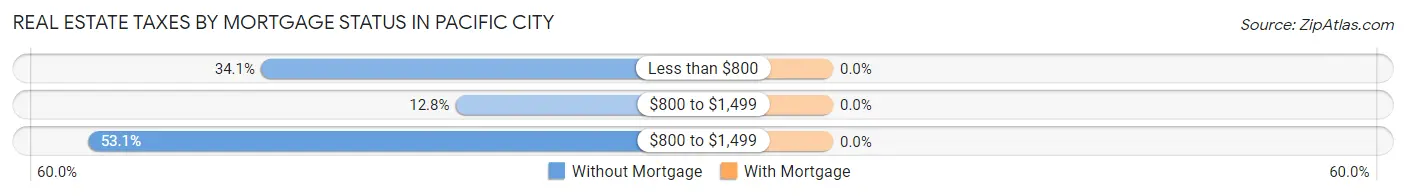
| Property Taxes | Without Mortgage | With Mortgage |
| Less than $800 | 72 (34.1%) | 0 (0.0%) |
| $800 to $1,499 | 27 (12.8%) | 0 (0.0%) |
| $800 to $1,499 | 112 (53.1%) | 0 (0.0%) |
| Total | 211 (100.0%) | 302 (100.0%) |
Health & Disability in Pacific City
Health Insurance Coverage by Age in Pacific City
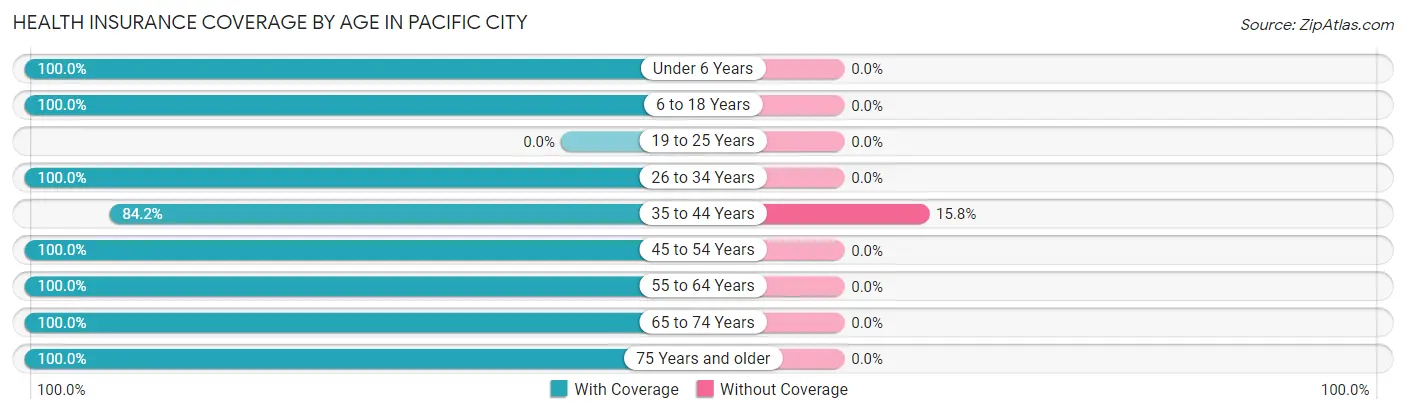
| Age Bracket | With Coverage | Without Coverage |
| Under 6 Years | 87 (100.0%) | 0 (0.0%) |
| 6 to 18 Years | 375 (100.0%) | 0 (0.0%) |
| 19 to 25 Years | 0 (0.0%) | 0 (0.0%) |
| 26 to 34 Years | 111 (100.0%) | 0 (0.0%) |
| 35 to 44 Years | 250 (84.2%) | 47 (15.8%) |
| 45 to 54 Years | 62 (100.0%) | 0 (0.0%) |
| 55 to 64 Years | 199 (100.0%) | 0 (0.0%) |
| 65 to 74 Years | 412 (100.0%) | 0 (0.0%) |
| 75 Years and older | 224 (100.0%) | 0 (0.0%) |
| Total | 1,720 (97.3%) | 47 (2.7%) |
Health Insurance Coverage by Citizenship Status in Pacific City
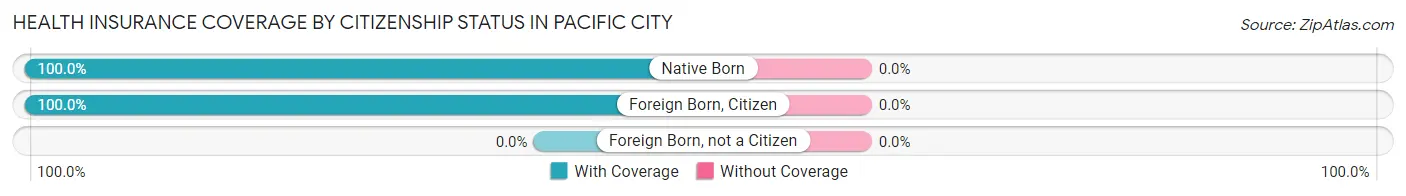
| Citizenship Status | With Coverage | Without Coverage |
| Native Born | 87 (100.0%) | 0 (0.0%) |
| Foreign Born, Citizen | 375 (100.0%) | 0 (0.0%) |
| Foreign Born, not a Citizen | 0 (0.0%) | 0 (0.0%) |
Health Insurance Coverage by Household Income in Pacific City
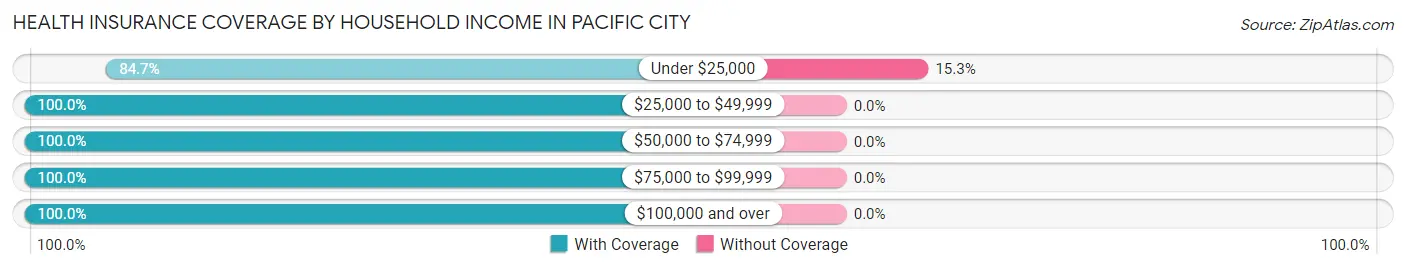
| Household Income | With Coverage | Without Coverage |
| Under $25,000 | 260 (84.7%) | 47 (15.3%) |
| $25,000 to $49,999 | 104 (100.0%) | 0 (0.0%) |
| $50,000 to $74,999 | 377 (100.0%) | 0 (0.0%) |
| $75,000 to $99,999 | 530 (100.0%) | 0 (0.0%) |
| $100,000 and over | 449 (100.0%) | 0 (0.0%) |
Public vs Private Health Insurance Coverage by Age in Pacific City
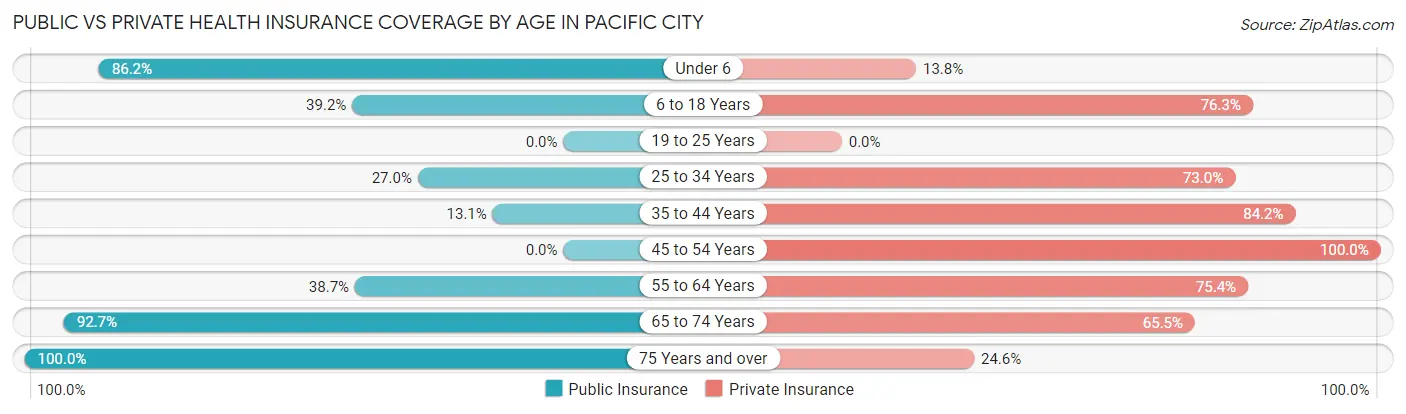
| Age Bracket | Public Insurance | Private Insurance |
| Under 6 | 75 (86.2%) | 12 (13.8%) |
| 6 to 18 Years | 147 (39.2%) | 286 (76.3%) |
| 19 to 25 Years | 0 (0.0%) | 0 (0.0%) |
| 25 to 34 Years | 30 (27.0%) | 81 (73.0%) |
| 35 to 44 Years | 39 (13.1%) | 250 (84.2%) |
| 45 to 54 Years | 0 (0.0%) | 62 (100.0%) |
| 55 to 64 Years | 77 (38.7%) | 150 (75.4%) |
| 65 to 74 Years | 382 (92.7%) | 270 (65.5%) |
| 75 Years and over | 224 (100.0%) | 55 (24.5%) |
| Total | 974 (55.1%) | 1,166 (66.0%) |
Disability Status by Sex by Age in Pacific City
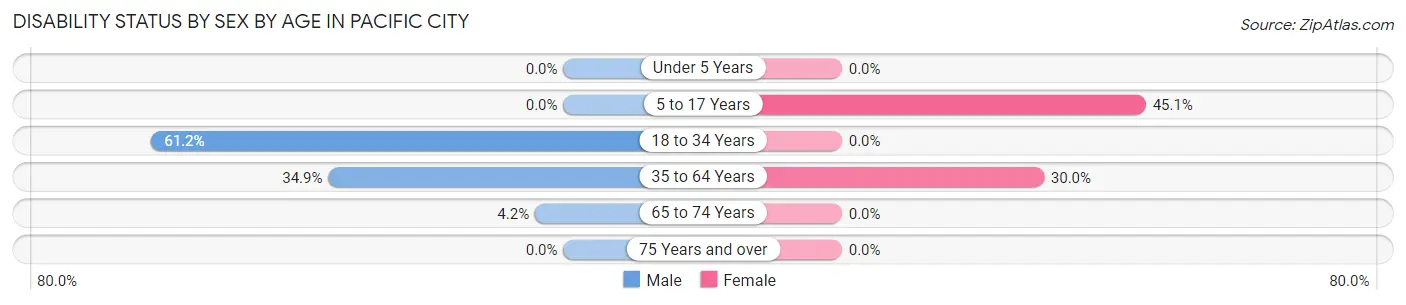
| Age Bracket | Male | Female |
| Under 5 Years | 0 (0.0%) | 0 (0.0%) |
| 5 to 17 Years | 0 (0.0%) | 88 (45.1%) |
| 18 to 34 Years | 52 (61.2%) | 0 (0.0%) |
| 35 to 64 Years | 104 (34.9%) | 78 (30.0%) |
| 65 to 74 Years | 11 (4.2%) | 0 (0.0%) |
| 75 Years and over | 0 (0.0%) | 0 (0.0%) |
Disability Class by Sex by Age in Pacific City
Disability Class: Hearing Difficulty
| Age Bracket | Male | Female |
| Under 5 Years | 0 (0.0%) | 0 (0.0%) |
| 5 to 17 Years | 0 (0.0%) | 0 (0.0%) |
| 18 to 34 Years | 0 (0.0%) | 0 (0.0%) |
| 35 to 64 Years | 0 (0.0%) | 0 (0.0%) |
| 65 to 74 Years | 0 (0.0%) | 0 (0.0%) |
| 75 Years and over | 0 (0.0%) | 0 (0.0%) |
Disability Class: Vision Difficulty
| Age Bracket | Male | Female |
| Under 5 Years | 0 (0.0%) | 0 (0.0%) |
| 5 to 17 Years | 0 (0.0%) | 0 (0.0%) |
| 18 to 34 Years | 0 (0.0%) | 0 (0.0%) |
| 35 to 64 Years | 0 (0.0%) | 0 (0.0%) |
| 65 to 74 Years | 0 (0.0%) | 0 (0.0%) |
| 75 Years and over | 0 (0.0%) | 0 (0.0%) |
Disability Class: Cognitive Difficulty
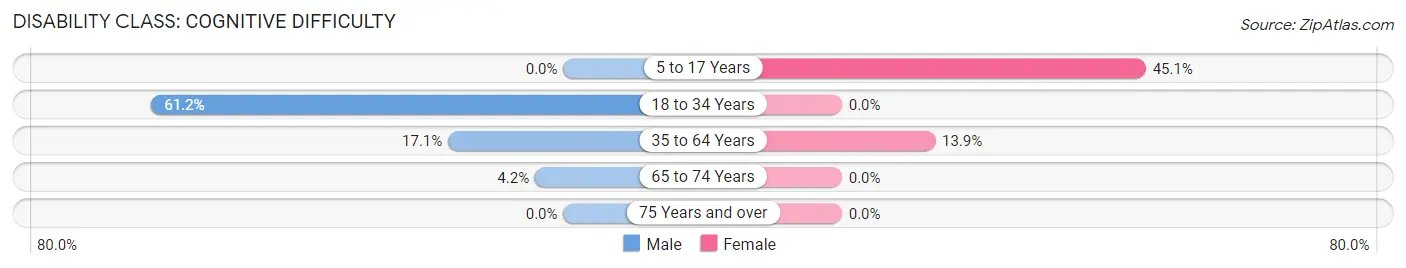
| Age Bracket | Male | Female |
| 5 to 17 Years | 0 (0.0%) | 88 (45.1%) |
| 18 to 34 Years | 52 (61.2%) | 0 (0.0%) |
| 35 to 64 Years | 51 (17.1%) | 36 (13.9%) |
| 65 to 74 Years | 11 (4.2%) | 0 (0.0%) |
| 75 Years and over | 0 (0.0%) | 0 (0.0%) |
Disability Class: Ambulatory Difficulty
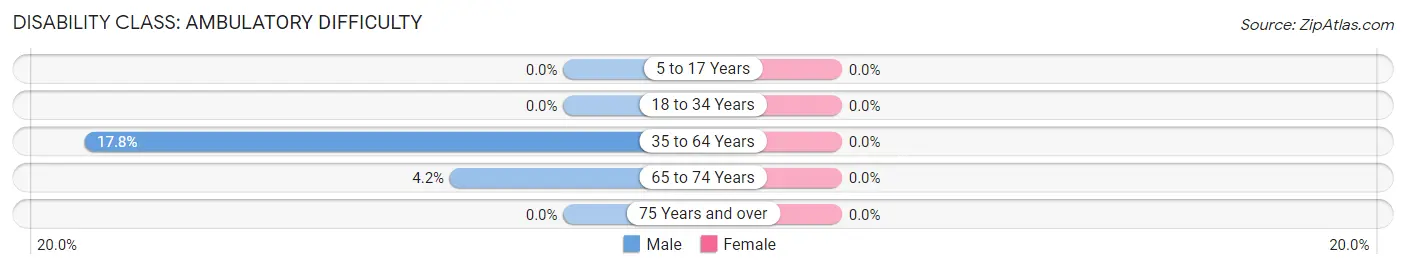
| Age Bracket | Male | Female |
| 5 to 17 Years | 0 (0.0%) | 0 (0.0%) |
| 18 to 34 Years | 0 (0.0%) | 0 (0.0%) |
| 35 to 64 Years | 53 (17.8%) | 0 (0.0%) |
| 65 to 74 Years | 11 (4.2%) | 0 (0.0%) |
| 75 Years and over | 0 (0.0%) | 0 (0.0%) |
Disability Class: Self-Care Difficulty
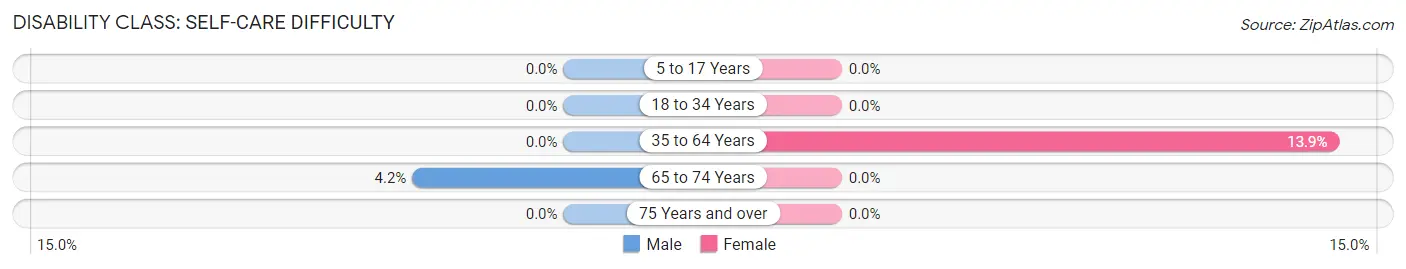
| Age Bracket | Male | Female |
| 5 to 17 Years | 0 (0.0%) | 0 (0.0%) |
| 18 to 34 Years | 0 (0.0%) | 0 (0.0%) |
| 35 to 64 Years | 0 (0.0%) | 36 (13.9%) |
| 65 to 74 Years | 11 (4.2%) | 0 (0.0%) |
| 75 Years and over | 0 (0.0%) | 0 (0.0%) |
Technology Access in Pacific City
Computing Device Access in Pacific City
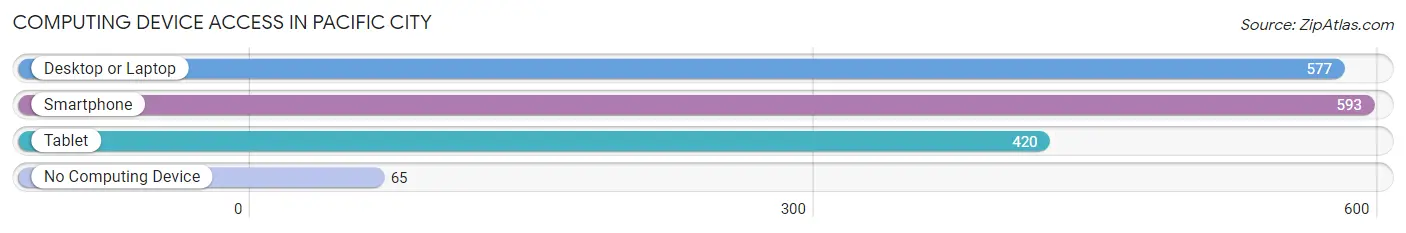
| Device Type | # Households | % Households |
| Desktop or Laptop | 577 | 76.5% |
| Smartphone | 593 | 78.6% |
| Tablet | 420 | 55.7% |
| No Computing Device | 65 | 8.6% |
| Total | 754 | 100.0% |
Internet Access in Pacific City
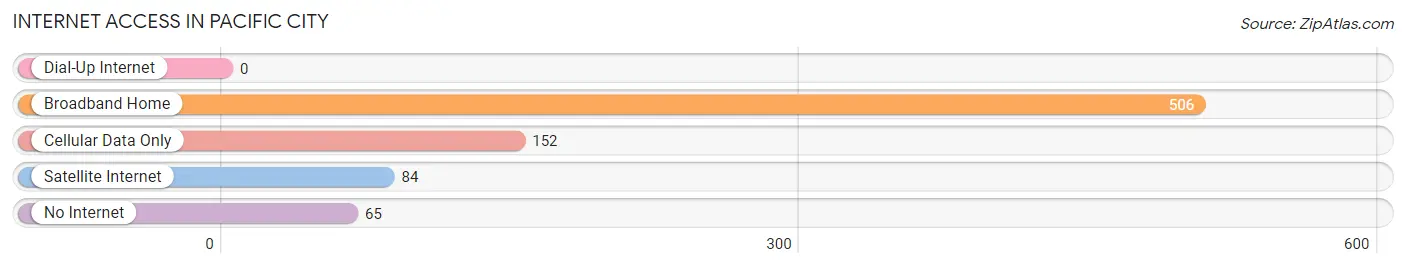
| Internet Type | # Households | % Households |
| Dial-Up Internet | 0 | 0.0% |
| Broadband Home | 506 | 67.1% |
| Cellular Data Only | 152 | 20.2% |
| Satellite Internet | 84 | 11.1% |
| No Internet | 65 | 8.6% |
| Total | 754 | 100.0% |
Pacific City Summary
Pacific City, Oregon is a small coastal town located in Tillamook County, Oregon. It is situated on the Nestucca River, approximately 50 miles south of Portland. The town is known for its beautiful beaches, fishing, and outdoor recreation. The population of Pacific City was 1,072 at the 2010 census.
History
The area that is now Pacific City was first inhabited by the Nestucca Indians, who lived in the area for thousands of years before the arrival of European settlers. The first European settlers arrived in the area in the late 1800s, and the town was officially founded in 1891. The town was named after the Pacific Ocean, which is visible from the town.
In the early 1900s, the town was a popular destination for tourists, who came to enjoy the beaches and fishing. The town was also home to a number of canneries, which processed the abundant seafood in the area.
In the 1950s, the town began to decline as the canneries closed and the tourist industry declined. The town was revitalized in the 1970s, when the Nestucca River was dammed to create a reservoir for irrigation and recreation. The reservoir, known as the Nestucca Bay National Wildlife Refuge, is now a popular destination for fishing, boating, and wildlife viewing.
Geography
Pacific City is located in Tillamook County, Oregon, on the Nestucca River. The town is situated on a peninsula, with the Pacific Ocean to the west and the Nestucca Bay to the east. The town is surrounded by the Nestucca Bay National Wildlife Refuge, which is a popular destination for fishing, boating, and wildlife viewing.
The town has a total area of 1.2 square miles, all of which is land. The town has a mild climate, with temperatures ranging from the mid-50s in the winter to the mid-70s in the summer.
Economy
The economy of Pacific City is largely based on tourism and fishing. The town is home to a number of hotels, restaurants, and other tourist-related businesses. The town is also home to a number of seafood processing plants, which process the abundant seafood in the area.
The town is also home to a number of art galleries, which feature the work of local artists. The town is also home to a number of wineries, which produce a variety of wines.
Demographics
As of the 2010 census, the population of Pacific City was 1,072. The racial makeup of the town was 94.3% White, 0.7% Native American, 0.3% Asian, 0.2% Pacific Islander, 0.2% from other races, and 4.3% from two or more races. The median age of the population was 44.7 years.
The median household income in Pacific City was $41,250, and the median family income was $50,000. The per capita income in the town was $21,945. The poverty rate in the town was 11.3%.
Conclusion
Pacific City, Oregon is a small coastal town located in Tillamook County, Oregon. It is situated on the Nestucca River, approximately 50 miles south of Portland. The town is known for its beautiful beaches, fishing, and outdoor recreation. The economy of Pacific City is largely based on tourism and fishing, and the town is home to a number of hotels, restaurants, and other tourist-related businesses. The population of Pacific City was 1,072 at the 2010 census, and the median household income was $41,250. Pacific City is a popular destination for tourists and locals alike, and is a great place to enjoy the outdoors and experience the beauty of the Oregon coast.
Common Questions
What is the Total Population of Pacific City?
Total Population of Pacific City is 1,767.
What is the Total Male Population of Pacific City?
Total Male Population of Pacific City is 952.
What is the Total Female Population of Pacific City?
Total Female Population of Pacific City is 815.
What is the Ratio of Males per 100 Females in Pacific City?
There are 116.81 Males per 100 Females in Pacific City.
What is the Ratio of Females per 100 Males in Pacific City?
There are 85.61 Females per 100 Males in Pacific City.
What is the Median Population Age in Pacific City?
Median Population Age in Pacific City is 46.4 Years.
What is the Average Family Size in Pacific City
Average Family Size in Pacific City is 2.7 People.
What is the Average Household Size in Pacific City
Average Household Size in Pacific City is 2.3 People.
What is Per Capita Income in Pacific City?
Per Capita income in Pacific City is $29,603.
What is the Median Family Income in Pacific City?
Median Family Income in Pacific City is $80,519.
What is the Median Household income in Pacific City?
Median Household Income in Pacific City is $65,385.
What is Income or Wage Gap in Pacific City?
Income or Wage Gap in Pacific City is 41.2%.
Women in Pacific City earn 58.8 cents for every dollar earned by a man.
What is Inequality or Gini Index in Pacific City?
Inequality or Gini Index in Pacific City is 0.37.
How Large is the Labor Force in Pacific City?
There are 622 People in the Labor Forcein in Pacific City.
What is the Percentage of People in the Labor Force in Pacific City?
44.0% of People are in the Labor Force in Pacific City.