Zip Codes with the Highest Percentage of Population Employed in Farming, Fishing & Forestry in Toledo, OH
RELATED REPORTS & OPTIONS
Farming, Fishing & Forestry
Toledo
Compare Zip Codes
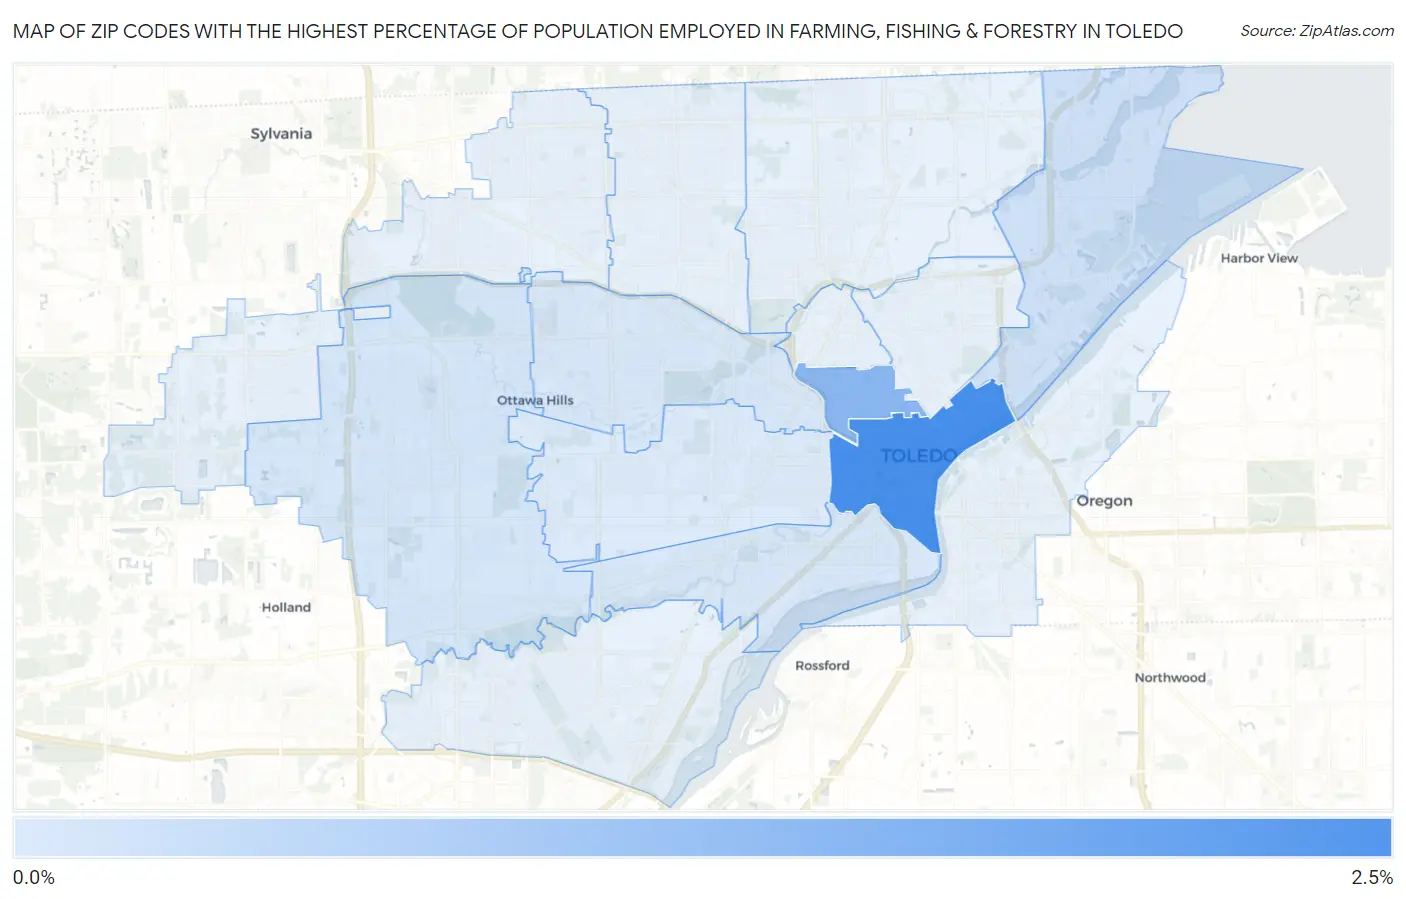
Map of Zip Codes with the Highest Percentage of Population Employed in Farming, Fishing & Forestry in Toledo
0.0%
2.5%
Zip Codes with the Highest Percentage of Population Employed in Farming, Fishing & Forestry in Toledo, OH
| Zip Code | % Employed | vs State | vs National | |
| 1. | 43604 | 2.2% | 0.29%(+1.91)#94 | 0.61%(+1.59)#6,133 |
| 2. | 43620 | 1.2% | 0.29%(+0.934)#162 | 0.61%(+0.617)#8,849 |
| 3. | 43611 | 0.22% | 0.29%(-0.068)#407 | 0.61%(-0.385)#15,829 |
| 4. | 43615 | 0.12% | 0.29%(-0.164)#482 | 0.61%(-0.481)#17,360 |
| 5. | 43606 | 0.11% | 0.29%(-0.183)#490 | 0.61%(-0.500)#17,660 |
| 6. | 43609 | 0.076% | 0.29%(-0.213)#516 | 0.61%(-0.529)#18,191 |
| 7. | 43607 | 0.023% | 0.29%(-0.266)#564 | 0.61%(-0.583)#19,044 |
1
Common Questions
What are the Top 10 Zip Codes with the Highest Percentage of Population Employed in Farming, Fishing & Forestry in Toledo, OH?
Top 10 Zip Codes with the Highest Percentage of Population Employed in Farming, Fishing & Forestry in Toledo, OH are:
What zip code has the Highest Percentage of Population Employed in Farming, Fishing & Forestry in Toledo, OH?
43604 has the Highest Percentage of Population Employed in Farming, Fishing & Forestry in Toledo, OH with 2.2%.
What is the Percentage of Population Employed in Farming, Fishing & Forestry in Toledo, OH?
Percentage of Population Employed in Farming, Fishing & Forestry in Toledo is 0.13%.
What is the Percentage of Population Employed in Farming, Fishing & Forestry in Ohio?
Percentage of Population Employed in Farming, Fishing & Forestry in Ohio is 0.29%.
What is the Percentage of Population Employed in Farming, Fishing & Forestry in the United States?
Percentage of Population Employed in Farming, Fishing & Forestry in the United States is 0.61%.