Cities with the Highest Percentage of Population Employed in Farming, Fishing & Forestry in Iowa
RELATED REPORTS & OPTIONS
Farming, Fishing & Forestry
Iowa
Compare Cities
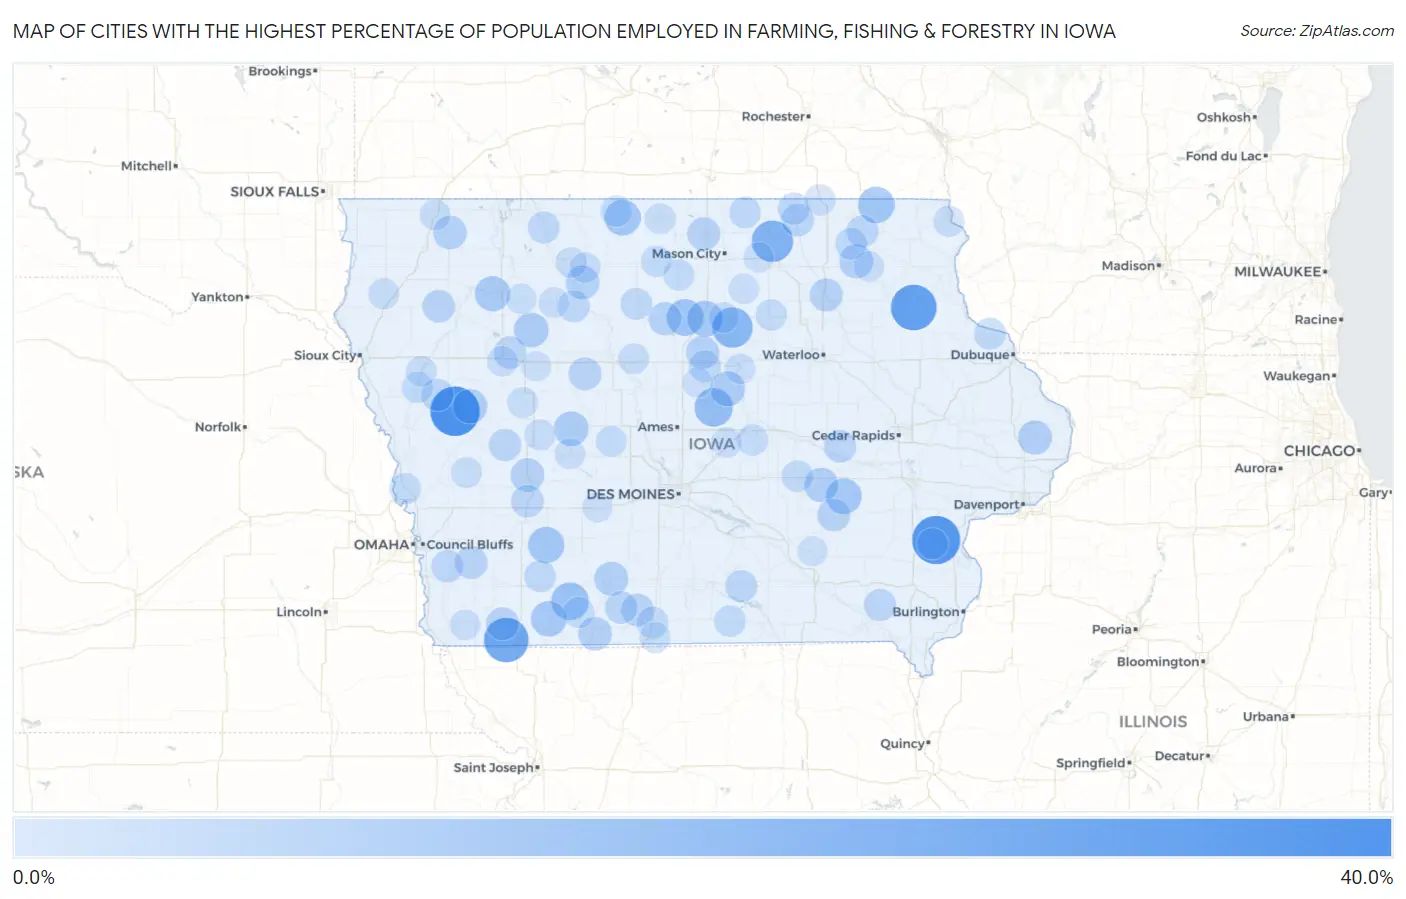
Map of Cities with the Highest Percentage of Population Employed in Farming, Fishing & Forestry in Iowa
0.0%
40.0%
Cities with the Highest Percentage of Population Employed in Farming, Fishing & Forestry in Iowa
| City | % Employed | vs State | vs National | |
| 1. | Ricketts | 35.3% | 1.1%(+34.2)#1 | 0.61%(+34.7)#161 |
| 2. | Fredonia | 32.9% | 1.1%(+31.8)#2 | 0.61%(+32.3)#182 |
| 3. | Volga | 29.1% | 1.1%(+28.0)#3 | 0.61%(+28.5)#233 |
| 4. | College Springs | 27.4% | 1.1%(+26.3)#4 | 0.61%(+26.7)#267 |
| 5. | Orchard | 22.2% | 1.1%(+21.1)#5 | 0.61%(+21.6)#376 |
| 6. | Geneva | 20.5% | 1.1%(+19.4)#6 | 0.61%(+19.8)#427 |
| 7. | Lowell | 20.5% | 1.1%(+19.4)#7 | 0.61%(+19.8)#428 |
| 8. | Zearing | 17.4% | 1.1%(+16.4)#8 | 0.61%(+16.8)#538 |
| 9. | Lenox | 16.1% | 1.1%(+15.0)#9 | 0.61%(+15.5)#589 |
| 10. | Rowan | 14.8% | 1.1%(+13.7)#10 | 0.61%(+14.2)#654 |
| 11. | Burr Oak | 14.3% | 1.1%(+13.2)#11 | 0.61%(+13.7)#681 |
| 12. | Massena | 14.1% | 1.1%(+13.0)#12 | 0.61%(+13.5)#702 |
| 13. | Lakota | 13.8% | 1.1%(+12.7)#13 | 0.61%(+13.2)#724 |
| 14. | Coulter | 13.7% | 1.1%(+12.6)#14 | 0.61%(+13.1)#729 |
| 15. | Millersburg | 13.2% | 1.1%(+12.1)#15 | 0.61%(+12.6)#763 |
| 16. | Gravity | 12.9% | 1.1%(+11.8)#16 | 0.61%(+12.3)#791 |
| 17. | Linn Grove | 12.5% | 1.1%(+11.4)#17 | 0.61%(+11.9)#822 |
| 18. | New Providence | 12.1% | 1.1%(+11.0)#18 | 0.61%(+11.5)#857 |
| 19. | Varina | 11.8% | 1.1%(+10.7)#19 | 0.61%(+11.2)#886 |
| 20. | Scranton | 11.7% | 1.1%(+10.6)#20 | 0.61%(+11.1)#889 |
| 21. | Schleswig | 11.4% | 1.1%(+10.3)#21 | 0.61%(+10.8)#916 |
| 22. | Guernsey | 11.1% | 1.1%(+10.0)#22 | 0.61%(+10.5)#941 |
| 23. | Charlotte | 10.7% | 1.1%(+9.64)#23 | 0.61%(+10.1)#987 |
| 24. | Afton | 10.6% | 1.1%(+9.54)#24 | 0.61%(+10.0)#1,002 |
| 25. | Jackson Junction | 10.5% | 1.1%(+9.44)#25 | 0.61%(+9.92)#1,011 |
| 26. | West Bend | 10.1% | 1.1%(+9.06)#26 | 0.61%(+9.54)#1,055 |
| 27. | Delphos | 10.0% | 1.1%(+8.91)#27 | 0.61%(+9.39)#1,079 |
| 28. | Audubon | 10.0% | 1.1%(+8.86)#28 | 0.61%(+9.35)#1,080 |
| 29. | Melvin | 9.8% | 1.1%(+8.72)#29 | 0.61%(+9.20)#1,103 |
| 30. | Alden | 9.6% | 1.1%(+8.49)#30 | 0.61%(+8.98)#1,134 |
| 31. | Clarion | 9.5% | 1.1%(+8.43)#31 | 0.61%(+8.92)#1,140 |
| 32. | Hanlontown | 9.2% | 1.1%(+8.15)#32 | 0.61%(+8.64)#1,188 |
| 33. | Frederika | 9.1% | 1.1%(+8.05)#33 | 0.61%(+8.54)#1,200 |
| 34. | Yorktown | 9.1% | 1.1%(+8.00)#34 | 0.61%(+8.49)#1,215 |
| 35. | Somers | 8.9% | 1.1%(+7.84)#35 | 0.61%(+8.32)#1,246 |
| 36. | Henderson | 8.7% | 1.1%(+7.61)#36 | 0.61%(+8.09)#1,280 |
| 37. | Grand River | 8.7% | 1.1%(+7.61)#37 | 0.61%(+8.09)#1,281 |
| 38. | Cleghorn | 8.6% | 1.1%(+7.54)#38 | 0.61%(+8.03)#1,293 |
| 39. | Keswick | 8.6% | 1.1%(+7.53)#39 | 0.61%(+8.02)#1,296 |
| 40. | Riceville | 8.6% | 1.1%(+7.51)#40 | 0.61%(+7.99)#1,299 |
| 41. | Luzerne | 8.6% | 1.1%(+7.48)#41 | 0.61%(+7.97)#1,309 |
| 42. | Brayton | 8.6% | 1.1%(+7.48)#42 | 0.61%(+7.97)#1,310 |
| 43. | Nemaha | 8.6% | 1.1%(+7.48)#43 | 0.61%(+7.97)#1,311 |
| 44. | Ellston | 8.3% | 1.1%(+7.24)#44 | 0.61%(+7.73)#1,361 |
| 45. | Aspinwall | 8.3% | 1.1%(+7.24)#45 | 0.61%(+7.73)#1,363 |
| 46. | Silver City | 8.1% | 1.1%(+7.01)#46 | 0.61%(+7.49)#1,407 |
| 47. | Danbury | 8.0% | 1.1%(+6.94)#47 | 0.61%(+7.42)#1,425 |
| 48. | Stockport | 8.0% | 1.1%(+6.87)#48 | 0.61%(+7.35)#1,440 |
| 49. | Melrose | 7.7% | 1.1%(+6.60)#49 | 0.61%(+7.09)#1,497 |
| 50. | Ridgeway | 7.6% | 1.1%(+6.51)#50 | 0.61%(+6.99)#1,522 |
| 51. | Rolfe | 7.6% | 1.1%(+6.50)#51 | 0.61%(+6.98)#1,524 |
| 52. | Wallingford | 7.4% | 1.1%(+6.32)#52 | 0.61%(+6.80)#1,571 |
| 53. | Mcintire | 7.3% | 1.1%(+6.23)#53 | 0.61%(+6.71)#1,592 |
| 54. | Buckeye | 7.3% | 1.1%(+6.23)#54 | 0.61%(+6.71)#1,593 |
| 55. | Protivin | 7.3% | 1.1%(+6.21)#55 | 0.61%(+6.70)#1,596 |
| 56. | Renwick | 7.2% | 1.1%(+6.14)#56 | 0.61%(+6.62)#1,609 |
| 57. | Carpenter | 7.1% | 1.1%(+6.05)#57 | 0.61%(+6.54)#1,630 |
| 58. | Carbon | 7.1% | 1.1%(+6.05)#58 | 0.61%(+6.54)#1,633 |
| 59. | Balltown | 7.1% | 1.1%(+6.05)#59 | 0.61%(+6.54)#1,634 |
| 60. | Decatur City | 7.0% | 1.1%(+5.95)#60 | 0.61%(+6.44)#1,654 |
| 61. | Malcom | 7.0% | 1.1%(+5.90)#61 | 0.61%(+6.39)#1,665 |
| 62. | Promise City | 6.9% | 1.1%(+5.81)#62 | 0.61%(+6.29)#1,695 |
| 63. | Modale | 6.7% | 1.1%(+5.58)#63 | 0.61%(+6.06)#1,742 |
| 64. | Oto | 6.7% | 1.1%(+5.58)#64 | 0.61%(+6.06)#1,749 |
| 65. | Haverhill | 6.5% | 1.1%(+5.43)#65 | 0.61%(+5.92)#1,783 |
| 66. | Ledyard | 6.5% | 1.1%(+5.43)#66 | 0.61%(+5.92)#1,785 |
| 67. | Clearfield | 6.4% | 1.1%(+5.32)#67 | 0.61%(+5.80)#1,806 |
| 68. | Klemme | 6.3% | 1.1%(+5.21)#68 | 0.61%(+5.70)#1,835 |
| 69. | Columbus City | 6.3% | 1.1%(+5.20)#69 | 0.61%(+5.69)#1,836 |
| 70. | Britt | 6.3% | 1.1%(+5.18)#70 | 0.61%(+5.67)#1,840 |
| 71. | Allison | 6.2% | 1.1%(+5.15)#71 | 0.61%(+5.63)#1,856 |
| 72. | Rippey | 6.1% | 1.1%(+5.03)#72 | 0.61%(+5.52)#1,884 |
| 73. | Lansing | 6.1% | 1.1%(+4.97)#73 | 0.61%(+5.46)#1,902 |
| 74. | Chester | 6.0% | 1.1%(+4.88)#74 | 0.61%(+5.36)#1,933 |
| 75. | Willey | 6.0% | 1.1%(+4.88)#75 | 0.61%(+5.36)#1,935 |
| 76. | Davis City | 5.9% | 1.1%(+4.85)#76 | 0.61%(+5.34)#1,943 |
| 77. | Panama | 5.9% | 1.1%(+4.84)#77 | 0.61%(+5.32)#1,949 |
| 78. | Thompson | 5.9% | 1.1%(+4.79)#78 | 0.61%(+5.28)#1,958 |
| 79. | Struble | 5.9% | 1.1%(+4.79)#79 | 0.61%(+5.28)#1,967 |
| 80. | Duncombe | 5.8% | 1.1%(+4.73)#80 | 0.61%(+5.21)#1,983 |
| 81. | Cylinder | 5.8% | 1.1%(+4.68)#81 | 0.61%(+5.16)#2,000 |
| 82. | Breda | 5.7% | 1.1%(+4.58)#82 | 0.61%(+5.07)#2,025 |
| 83. | Anthon | 5.7% | 1.1%(+4.57)#83 | 0.61%(+5.05)#2,030 |
| 84. | Early | 5.6% | 1.1%(+4.55)#84 | 0.61%(+5.04)#2,037 |
| 85. | Whittemore | 5.6% | 1.1%(+4.48)#85 | 0.61%(+4.97)#2,063 |
| 86. | Sibley | 5.6% | 1.1%(+4.48)#86 | 0.61%(+4.96)#2,065 |
| 87. | Hampton | 5.5% | 1.1%(+4.40)#87 | 0.61%(+4.88)#2,099 |
| 88. | Rhodes | 5.4% | 1.1%(+4.34)#88 | 0.61%(+4.82)#2,136 |
| 89. | Bayard | 5.4% | 1.1%(+4.32)#89 | 0.61%(+4.80)#2,141 |
| 90. | Havelock | 5.4% | 1.1%(+4.29)#90 | 0.61%(+4.77)#2,162 |
| 91. | St Lucas | 5.3% | 1.1%(+4.24)#91 | 0.61%(+4.73)#2,173 |
| 92. | Farragut | 5.3% | 1.1%(+4.20)#92 | 0.61%(+4.68)#2,191 |
| 93. | Dougherty | 5.3% | 1.1%(+4.17)#93 | 0.61%(+4.66)#2,207 |
| 94. | Steamboat Rock | 5.2% | 1.1%(+4.13)#94 | 0.61%(+4.61)#2,218 |
| 95. | Marathon | 5.2% | 1.1%(+4.07)#95 | 0.61%(+4.55)#2,241 |
| 96. | Rudd | 4.9% | 1.1%(+3.79)#96 | 0.61%(+4.27)#2,351 |
| 97. | Fremont | 4.8% | 1.1%(+3.76)#97 | 0.61%(+4.24)#2,372 |
| 98. | Stuart | 4.8% | 1.1%(+3.75)#98 | 0.61%(+4.24)#2,376 |
| 99. | Lytton | 4.8% | 1.1%(+3.73)#99 | 0.61%(+4.21)#2,388 |
| 100. | Radcliffe | 4.8% | 1.1%(+3.71)#100 | 0.61%(+4.19)#2,397 |
Common Questions
What are the Top 10 Cities with the Highest Percentage of Population Employed in Farming, Fishing & Forestry in Iowa?
Top 10 Cities with the Highest Percentage of Population Employed in Farming, Fishing & Forestry in Iowa are:
What city has the Highest Percentage of Population Employed in Farming, Fishing & Forestry in Iowa?
Ricketts has the Highest Percentage of Population Employed in Farming, Fishing & Forestry in Iowa with 35.3%.
What is the Percentage of Population Employed in Farming, Fishing & Forestry in the State of Iowa?
Percentage of Population Employed in Farming, Fishing & Forestry in Iowa is 1.1%.
What is the Percentage of Population Employed in Farming, Fishing & Forestry in the United States?
Percentage of Population Employed in Farming, Fishing & Forestry in the United States is 0.61%.