New Straitsville, OH
New Straitsville Map
New Straitsville Overview
764
TOTAL POPULATION
403
MALE POPULATION
361
FEMALE POPULATION
111.63
MALES / 100 FEMALES
89.58
FEMALES / 100 MALES
40.9
MEDIAN AGE
3.2
AVG FAMILY SIZE
2.4
AVG HOUSEHOLD SIZE
$21,556
PER CAPITA INCOME
$58,523
AVG FAMILY INCOME
$44,777
AVG HOUSEHOLD INCOME
38.8%
WAGE / INCOME GAP [ % ]
61.2¢/ $1
WAGE / INCOME GAP [ $ ]
0.44
INEQUALITY / GINI INDEX
319
LABOR FORCE [ PEOPLE ]
50.1%
PERCENT IN LABOR FORCE
6.6%
UNEMPLOYMENT RATE
New Straitsville Zip Codes
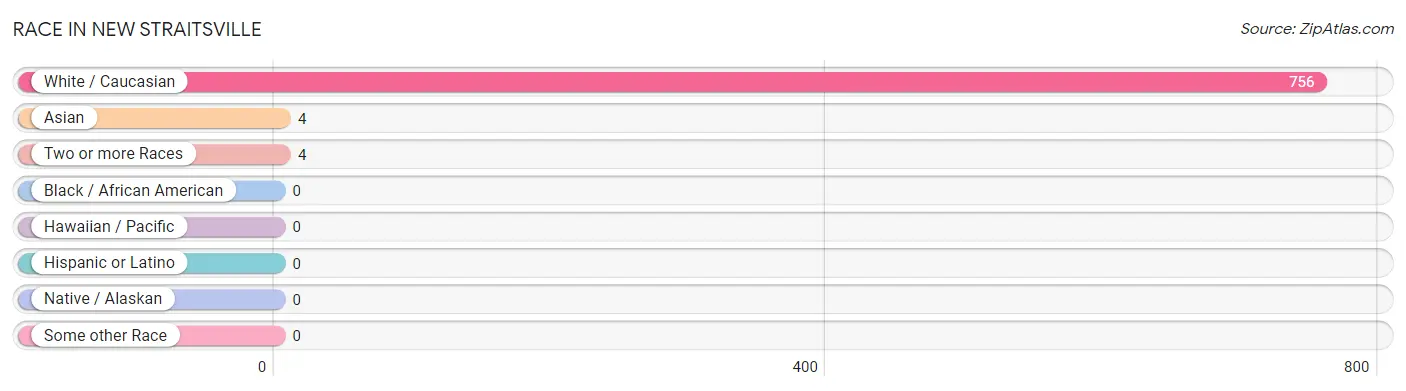
Race in New Straitsville
The most populous races in New Straitsville are White / Caucasian (756 | 99.0%), Asian (4 | 0.5%), and Two or more Races (4 | 0.5%).
| Race | # Population | % Population |
| Asian | 4 | 0.5% |
| Black / African American | 0 | 0.0% |
| Hawaiian / Pacific | 0 | 0.0% |
| Hispanic or Latino | 0 | 0.0% |
| Native / Alaskan | 0 | 0.0% |
| White / Caucasian | 756 | 99.0% |
| Two or more Races | 4 | 0.5% |
| Some other Race | 0 | 0.0% |
| Total | 764 | 100.0% |
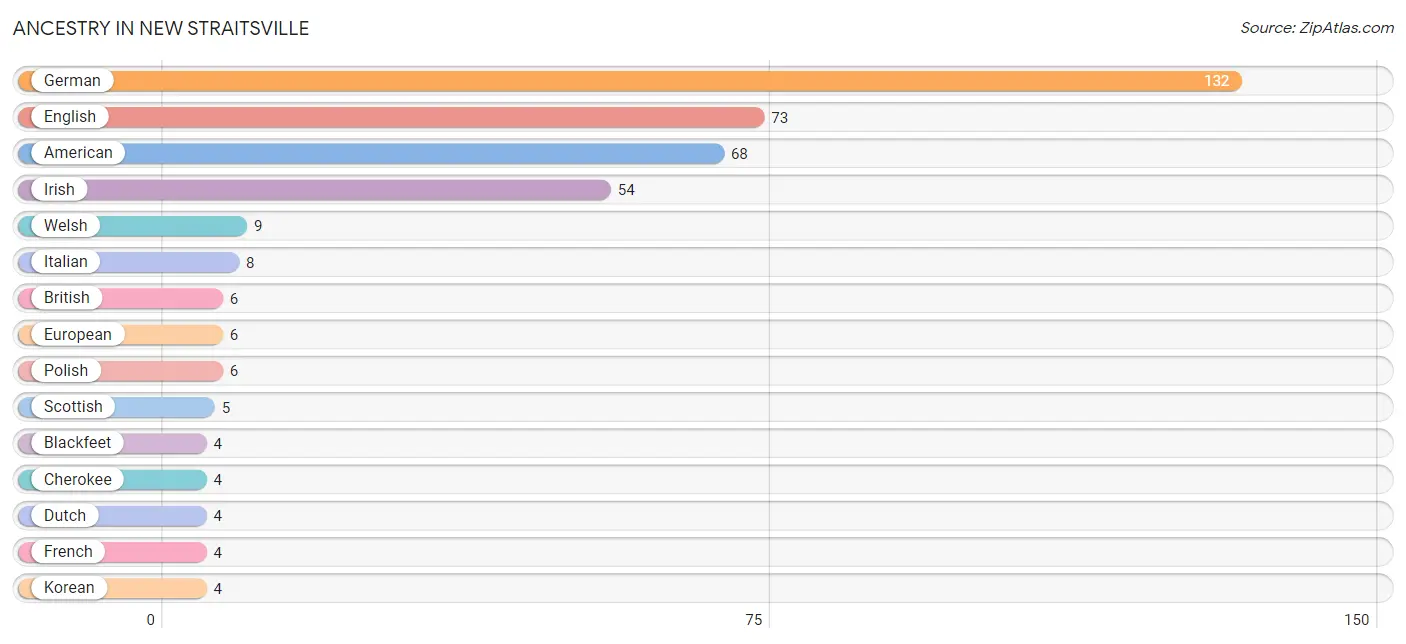
Ancestry in New Straitsville
The most populous ancestries reported in New Straitsville are German (132 | 17.3%), English (73 | 9.6%), American (68 | 8.9%), Irish (54 | 7.1%), and Welsh (9 | 1.2%), together accounting for 44.0% of all New Straitsville residents.
| Ancestry | # Population | % Population |
| American | 68 | 8.9% |
| Blackfeet | 4 | 0.5% |
| British | 6 | 0.8% |
| Cherokee | 4 | 0.5% |
| Dutch | 4 | 0.5% |
| English | 73 | 9.6% |
| European | 6 | 0.8% |
| French | 4 | 0.5% |
| German | 132 | 17.3% |
| Hungarian | 3 | 0.4% |
| Irish | 54 | 7.1% |
| Italian | 8 | 1.1% |
| Korean | 4 | 0.5% |
| Polish | 6 | 0.8% |
| Scotch-Irish | 2 | 0.3% |
| Scottish | 5 | 0.6% |
| Welsh | 9 | 1.2% | View All 17 Rows |
Immigrants in New Straitsville

| Immigration Origin | # Population | % Population | View All 0 Rows |
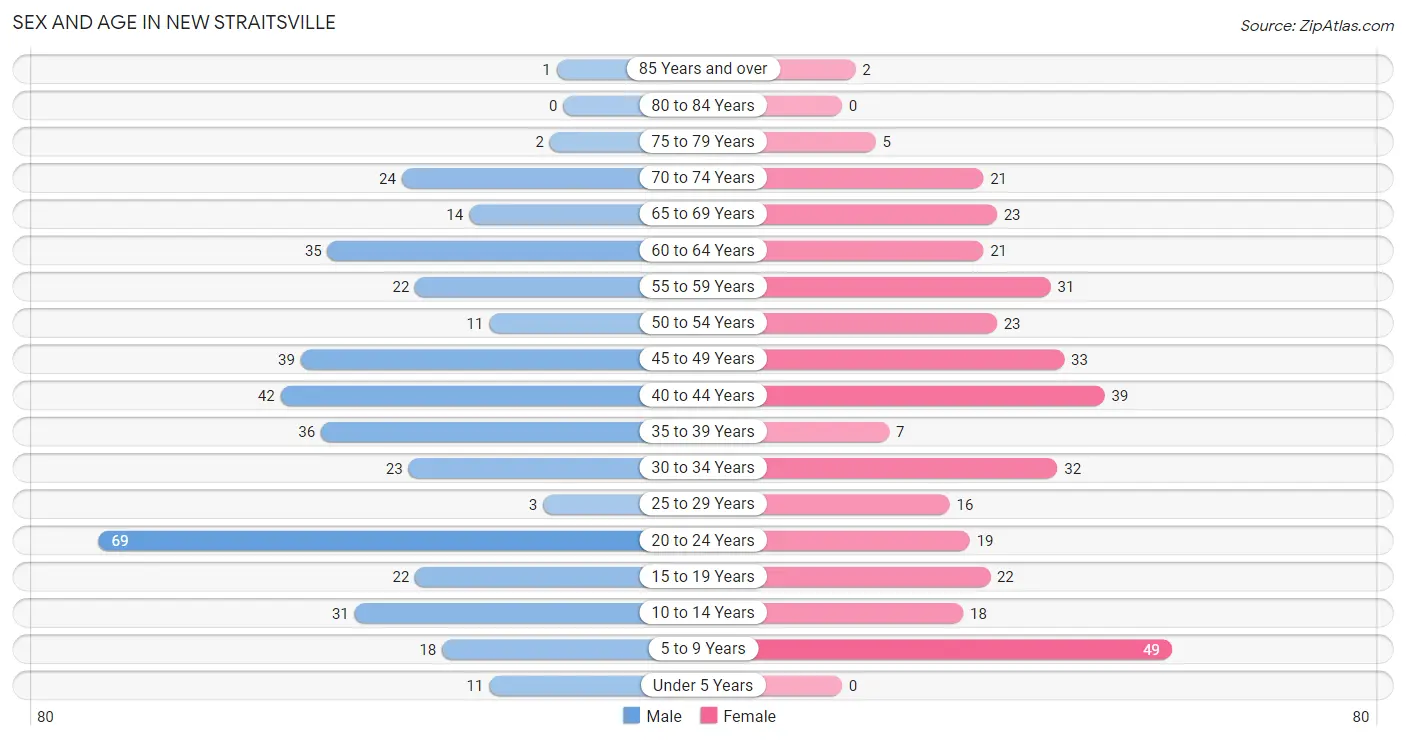
Sex and Age in New Straitsville
Sex and Age in New Straitsville
The most populous age groups in New Straitsville are 20 to 24 Years (69 | 17.1%) for men and 5 to 9 Years (49 | 13.6%) for women.
| Age Bracket | Male | Female |
| Under 5 Years | 11 (2.7%) | 0 (0.0%) |
| 5 to 9 Years | 18 (4.5%) | 49 (13.6%) |
| 10 to 14 Years | 31 (7.7%) | 18 (5.0%) |
| 15 to 19 Years | 22 (5.5%) | 22 (6.1%) |
| 20 to 24 Years | 69 (17.1%) | 19 (5.3%) |
| 25 to 29 Years | 3 (0.7%) | 16 (4.4%) |
| 30 to 34 Years | 23 (5.7%) | 32 (8.9%) |
| 35 to 39 Years | 36 (8.9%) | 7 (1.9%) |
| 40 to 44 Years | 42 (10.4%) | 39 (10.8%) |
| 45 to 49 Years | 39 (9.7%) | 33 (9.1%) |
| 50 to 54 Years | 11 (2.7%) | 23 (6.4%) |
| 55 to 59 Years | 22 (5.5%) | 31 (8.6%) |
| 60 to 64 Years | 35 (8.7%) | 21 (5.8%) |
| 65 to 69 Years | 14 (3.5%) | 23 (6.4%) |
| 70 to 74 Years | 24 (6.0%) | 21 (5.8%) |
| 75 to 79 Years | 2 (0.5%) | 5 (1.4%) |
| 80 to 84 Years | 0 (0.0%) | 0 (0.0%) |
| 85 Years and over | 1 (0.3%) | 2 (0.5%) |
| Total | 403 (100.0%) | 361 (100.0%) |
Families and Households in New Straitsville
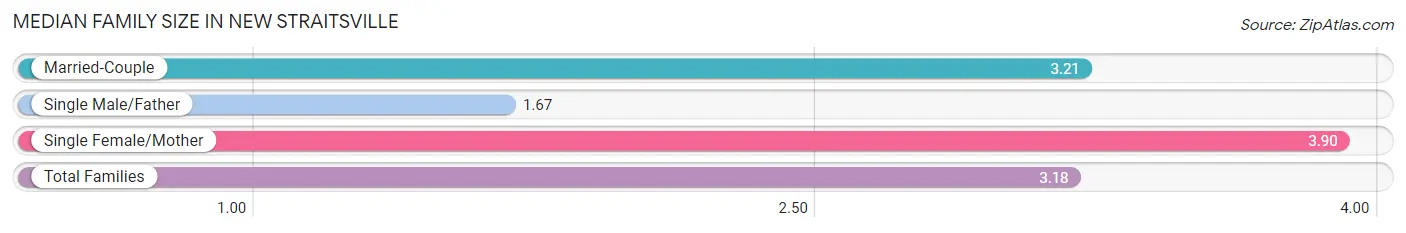
Median Family Size in New Straitsville
The median family size in New Straitsville is 3.18 persons per family, with single female/mother families (52 | 27.5%) accounting for the largest median family size of 3.9 persons per family. On the other hand, single male/father families (27 | 14.3%) represent the smallest median family size with 1.67 persons per family.
| Family Type | # Families | Family Size |
| Married-Couple | 110 (58.2%) | 3.21 |
| Single Male/Father | 27 (14.3%) | 1.67 |
| Single Female/Mother | 52 (27.5%) | 3.90 |
| Total Families | 189 (100.0%) | 3.18 |
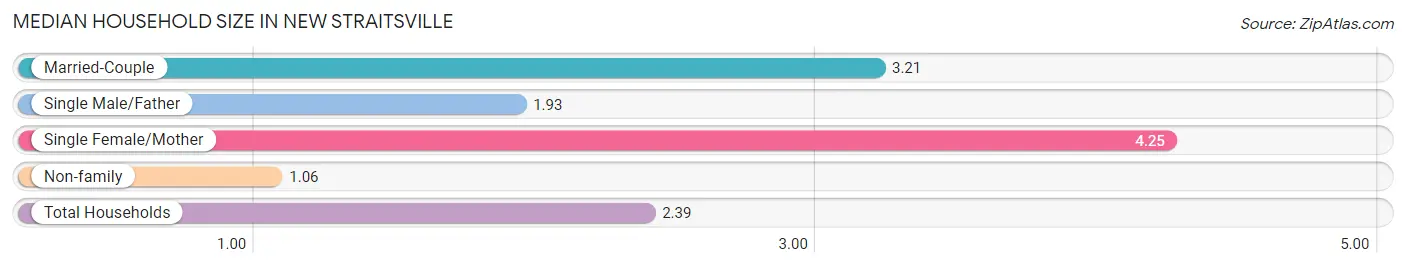
Median Household Size in New Straitsville
The median household size in New Straitsville is 2.39 persons per household, with single female/mother households (52 | 16.3%) accounting for the largest median household size of 4.25 persons per household. non-family households (130 | 40.7%) represent the smallest median household size with 1.06 persons per household.
| Household Type | # Households | Household Size |
| Married-Couple | 110 (34.5%) | 3.21 |
| Single Male/Father | 27 (8.5%) | 1.93 |
| Single Female/Mother | 52 (16.3%) | 4.25 |
| Non-family | 130 (40.7%) | 1.06 |
| Total Households | 319 (100.0%) | 2.39 |
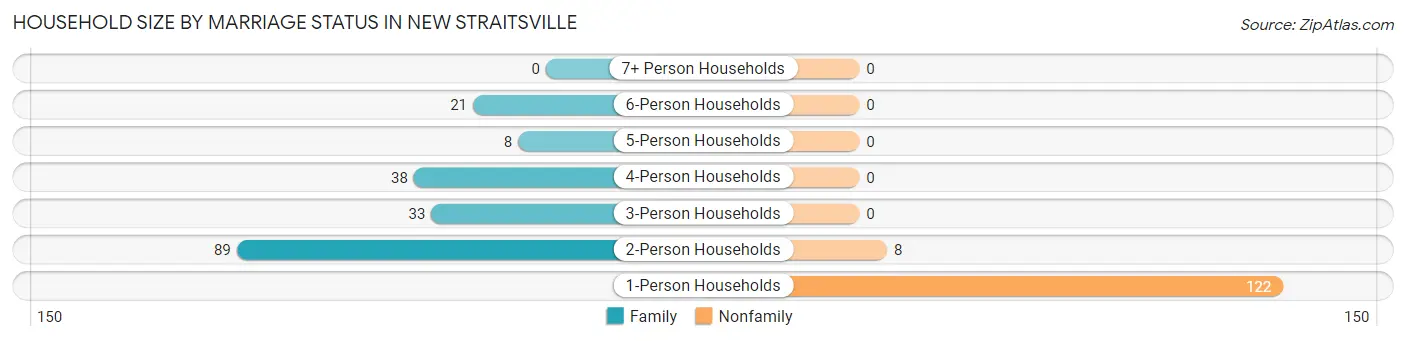
Household Size by Marriage Status in New Straitsville
Out of a total of 319 households in New Straitsville, 189 (59.3%) are family households, while 130 (40.7%) are nonfamily households. The most numerous type of family households are 2-person households, comprising 89, and the most common type of nonfamily households are 1-person households, comprising 122.
| Household Size | Family Households | Nonfamily Households |
| 1-Person Households | - | 122 (38.2%) |
| 2-Person Households | 89 (27.9%) | 8 (2.5%) |
| 3-Person Households | 33 (10.3%) | 0 (0.0%) |
| 4-Person Households | 38 (11.9%) | 0 (0.0%) |
| 5-Person Households | 8 (2.5%) | 0 (0.0%) |
| 6-Person Households | 21 (6.6%) | 0 (0.0%) |
| 7+ Person Households | 0 (0.0%) | 0 (0.0%) |
| Total | 189 (59.3%) | 130 (40.7%) |
Female Fertility in New Straitsville
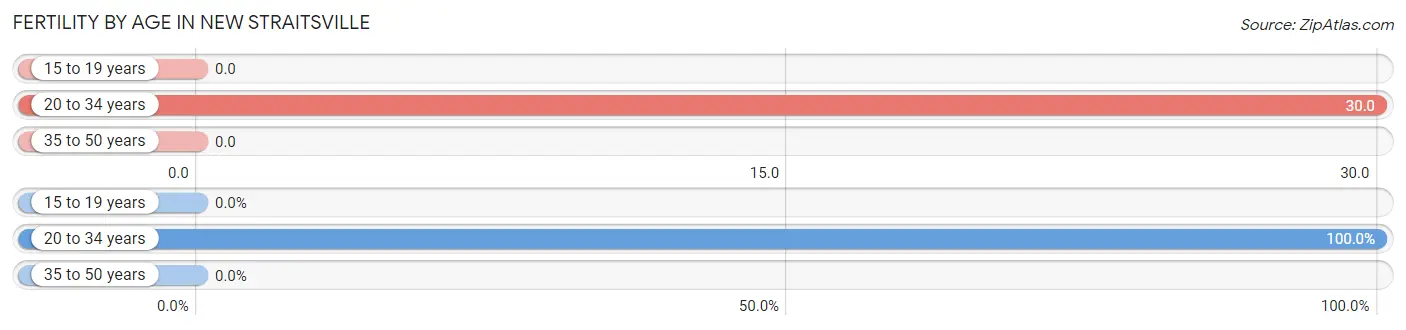
Fertility by Age in New Straitsville
Average fertility rate in New Straitsville is 11.0 births per 1,000 women. Women in the age bracket of 20 to 34 years have the highest fertility rate with 30.0 births per 1,000 women. Women in the age bracket of 20 to 34 years acount for 100.0% of all women with births.
| Age Bracket | Women with Births | Births / 1,000 Women |
| 15 to 19 years | 0 (0.0%) | 0.0 |
| 20 to 34 years | 2 (100.0%) | 30.0 |
| 35 to 50 years | 0 (0.0%) | 0.0 |
| Total | 2 (100.0%) | 11.0 |
Fertility by Age by Marriage Status in New Straitsville
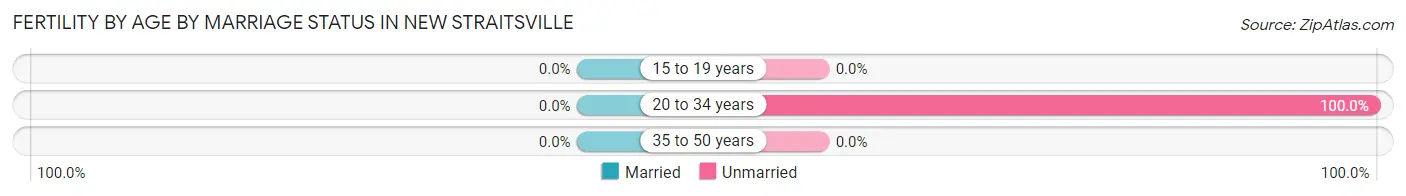
| Age Bracket | Married | Unmarried |
| 15 to 19 years | 0 (0.0%) | 0 (0.0%) |
| 20 to 34 years | 0 (0.0%) | 2 (100.0%) |
| 35 to 50 years | 0 (0.0%) | 0 (0.0%) |
| Total | 0 (0.0%) | 2 (100.0%) |
Fertility by Education in New Straitsville
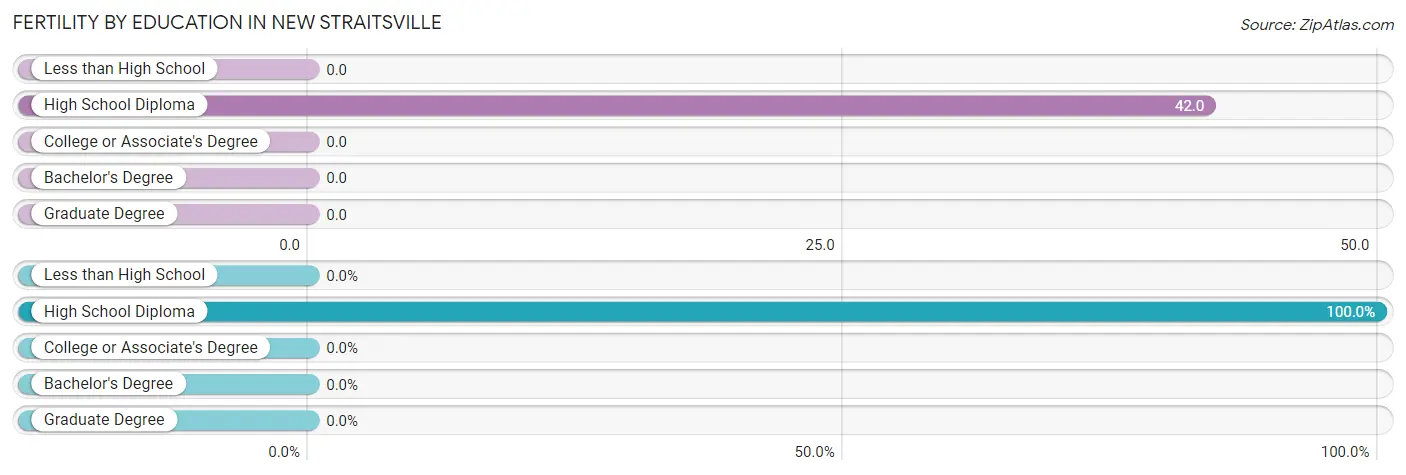
| Educational Attainment | Women with Births | Births / 1,000 Women |
| Less than High School | 0 (0.0%) | 0.0 |
| High School Diploma | 2 (100.0%) | 42.0 |
| College or Associate's Degree | 0 (0.0%) | 0.0 |
| Bachelor's Degree | 0 (0.0%) | 0.0 |
| Graduate Degree | 0 (0.0%) | 0.0 |
| Total | 2 (100.0%) | 11.0 |
Fertility by Education by Marriage Status in New Straitsville
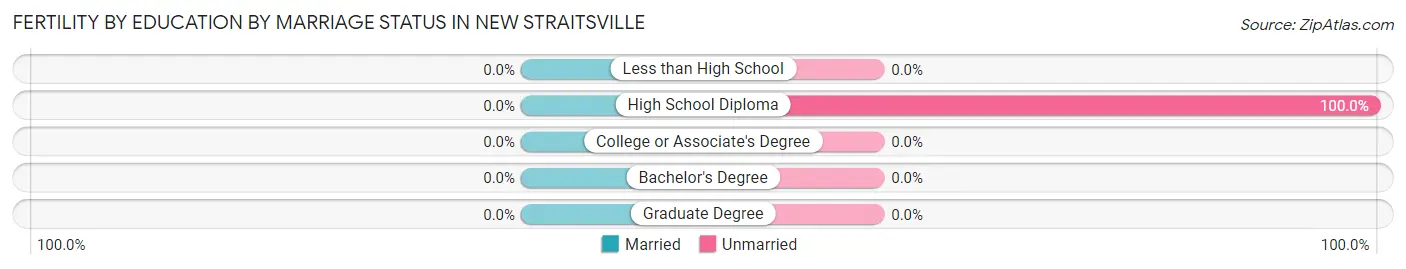
| Educational Attainment | Married | Unmarried |
| Less than High School | 0 (0.0%) | 0 (0.0%) |
| High School Diploma | 0 (0.0%) | 2 (100.0%) |
| College or Associate's Degree | 0 (0.0%) | 0 (0.0%) |
| Bachelor's Degree | 0 (0.0%) | 0 (0.0%) |
| Graduate Degree | 0 (0.0%) | 0 (0.0%) |
| Total | 0 (0.0%) | 2 (100.0%) |
Income in New Straitsville
Income Overview in New Straitsville
Per Capita Income in New Straitsville is $21,556, while median incomes of families and households are $58,523 and $44,777 respectively.
| Characteristic | Number | Measure |
| Per Capita Income | 764 | $21,556 |
| Median Family Income | 189 | $58,523 |
| Mean Family Income | 189 | $64,562 |
| Median Household Income | 319 | $44,777 |
| Mean Household Income | 319 | $50,387 |
| Income Deficit | 189 | $0 |
| Wage / Income Gap (%) | 764 | 38.79% |
| Wage / Income Gap ($) | 764 | 61.21¢ per $1 |
| Gini / Inequality Index | 764 | 0.44 |
Earnings by Sex in New Straitsville
Average Earnings in New Straitsville are $29,250, $40,375 for men and $24,712 for women, a difference of 38.8%.
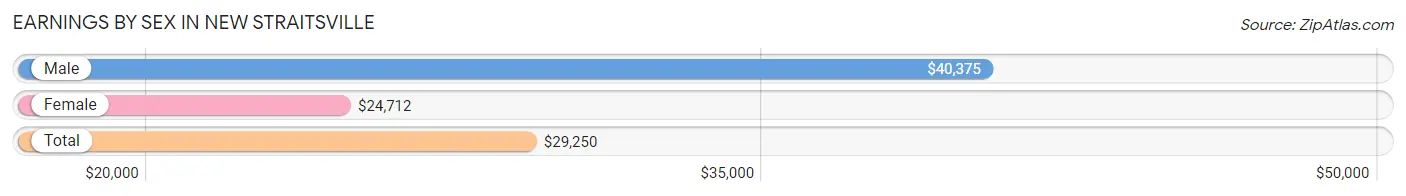
| Sex | Number | Average Earnings |
| Male | 209 (60.1%) | $40,375 |
| Female | 139 (39.9%) | $24,712 |
| Total | 348 (100.0%) | $29,250 |
Earnings by Sex by Income Bracket in New Straitsville
The most common earnings brackets in New Straitsville are $17,500 to $19,999 for men (24 | 11.5%) and $25,000 to $29,999 for women (19 | 13.7%).
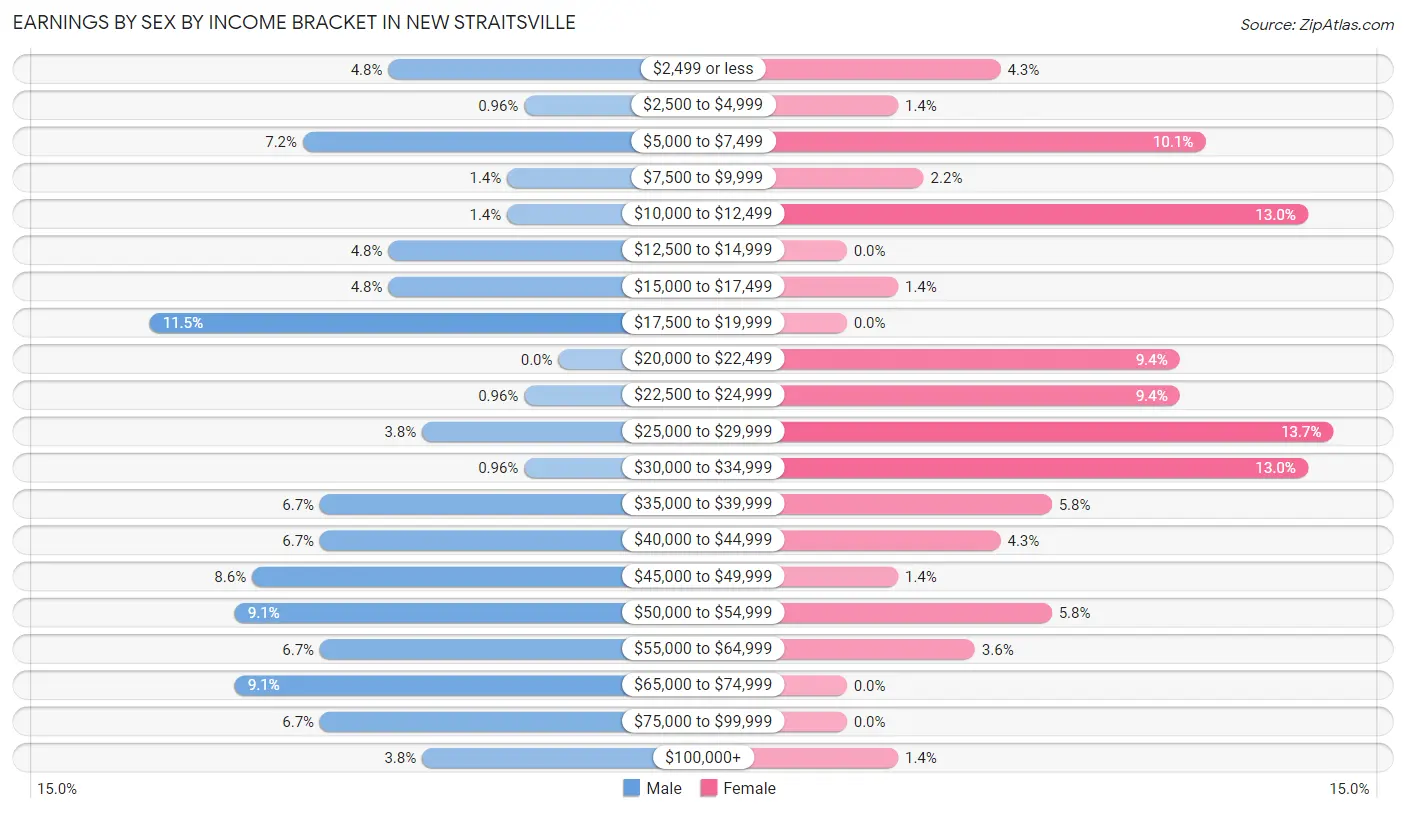
| Income | Male | Female |
| $2,499 or less | 10 (4.8%) | 6 (4.3%) |
| $2,500 to $4,999 | 2 (1.0%) | 2 (1.4%) |
| $5,000 to $7,499 | 15 (7.2%) | 14 (10.1%) |
| $7,500 to $9,999 | 3 (1.4%) | 3 (2.2%) |
| $10,000 to $12,499 | 3 (1.4%) | 18 (13.0%) |
| $12,500 to $14,999 | 10 (4.8%) | 0 (0.0%) |
| $15,000 to $17,499 | 10 (4.8%) | 2 (1.4%) |
| $17,500 to $19,999 | 24 (11.5%) | 0 (0.0%) |
| $20,000 to $22,499 | 0 (0.0%) | 13 (9.3%) |
| $22,500 to $24,999 | 2 (1.0%) | 13 (9.3%) |
| $25,000 to $29,999 | 8 (3.8%) | 19 (13.7%) |
| $30,000 to $34,999 | 2 (1.0%) | 18 (13.0%) |
| $35,000 to $39,999 | 14 (6.7%) | 8 (5.8%) |
| $40,000 to $44,999 | 14 (6.7%) | 6 (4.3%) |
| $45,000 to $49,999 | 18 (8.6%) | 2 (1.4%) |
| $50,000 to $54,999 | 19 (9.1%) | 8 (5.8%) |
| $55,000 to $64,999 | 14 (6.7%) | 5 (3.6%) |
| $65,000 to $74,999 | 19 (9.1%) | 0 (0.0%) |
| $75,000 to $99,999 | 14 (6.7%) | 0 (0.0%) |
| $100,000+ | 8 (3.8%) | 2 (1.4%) |
| Total | 209 (100.0%) | 139 (100.0%) |
Earnings by Sex by Educational Attainment in New Straitsville
Average earnings in New Straitsville are $43,125 for men and $26,827 for women, a difference of 37.8%. Men with an educational attainment of college or associate's degree enjoy the highest average annual earnings of $61,818, while those with bachelor's degree education earn the least with $29,063. Women with an educational attainment of college or associate's degree earn the most with the average annual earnings of $29,375, while those with high school diploma education have the smallest earnings of $26,346.
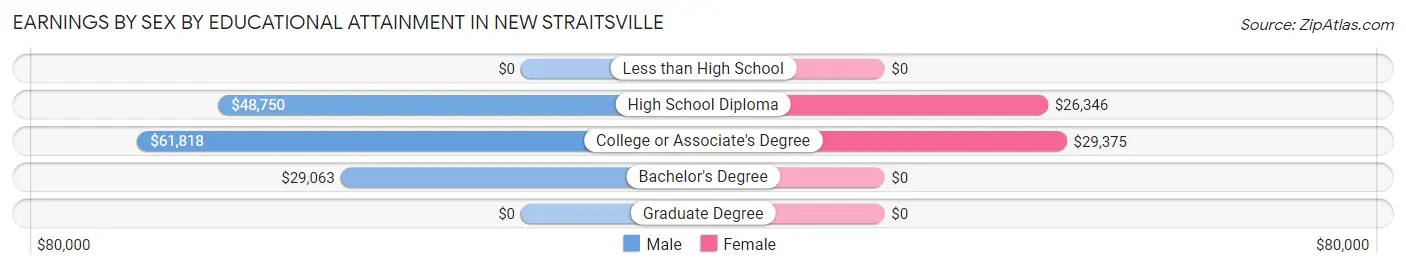
| Educational Attainment | Male Income | Female Income |
| Less than High School | - | - |
| High School Diploma | $48,750 | $26,346 |
| College or Associate's Degree | $61,818 | $29,375 |
| Bachelor's Degree | $29,063 | $0 |
| Graduate Degree | - | - |
| Total | $43,125 | $26,827 |
Family Income in New Straitsville
Family Income Brackets in New Straitsville
According to the New Straitsville family income data, there are 57 families falling into the $50,000 to $74,999 income range, which is the most common income bracket and makes up 30.2% of all families. Conversely, the $200,000+ income bracket is the least frequent group with only 2 families (1.1%) belonging to this category.
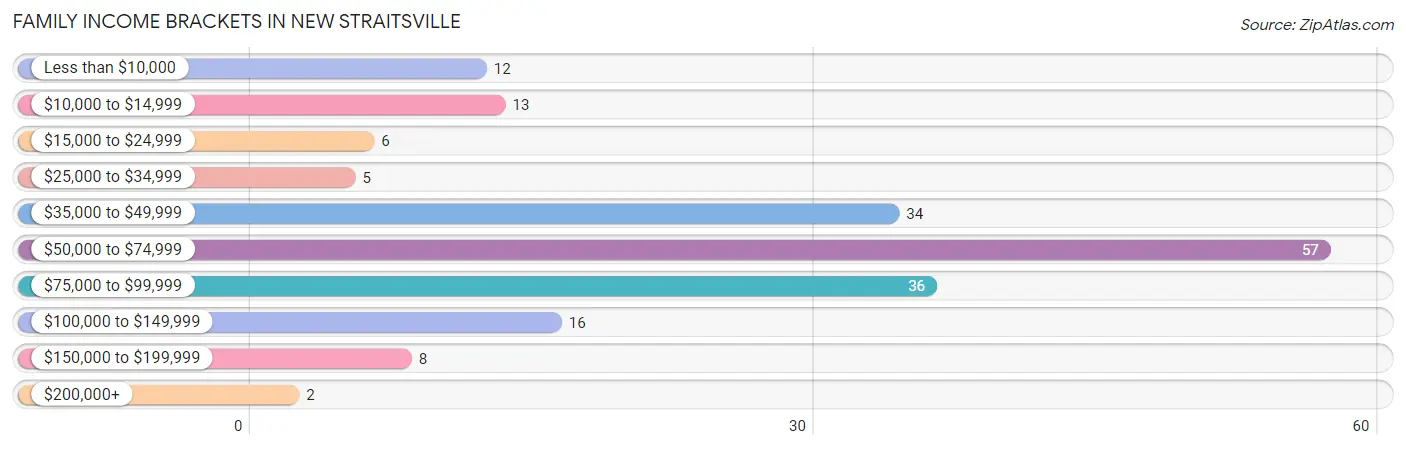
| Income Bracket | # Families | % Families |
| Less than $10,000 | 12 | 6.3% |
| $10,000 to $14,999 | 13 | 6.9% |
| $15,000 to $24,999 | 6 | 3.2% |
| $25,000 to $34,999 | 5 | 2.6% |
| $35,000 to $49,999 | 34 | 18.0% |
| $50,000 to $74,999 | 57 | 30.2% |
| $75,000 to $99,999 | 36 | 19.0% |
| $100,000 to $149,999 | 16 | 8.5% |
| $150,000 to $199,999 | 8 | 4.2% |
| $200,000+ | 2 | 1.1% |
Family Income by Famaliy Size in New Straitsville
6-person families (14 | 7.4%) account for the highest median family income in New Straitsville with $75,000 per family, while 2-person families (103 | 54.5%) have the highest median income of $29,262 per family member.
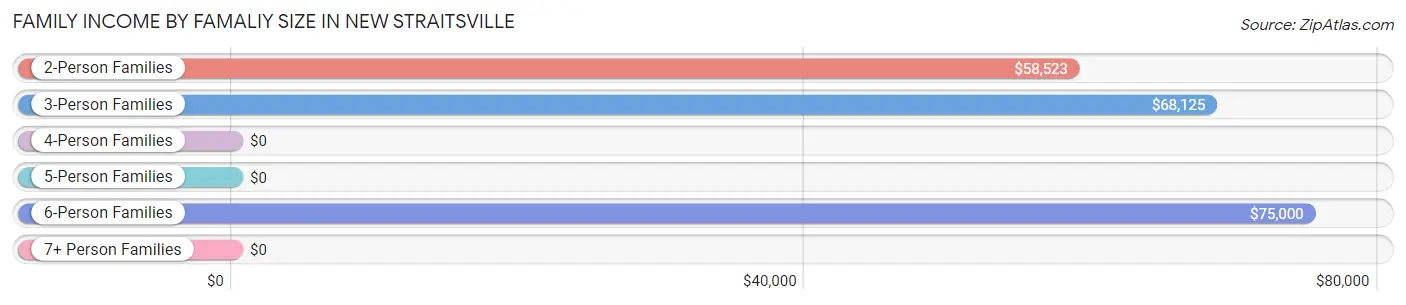
| Income Bracket | # Families | Median Income |
| 2-Person Families | 103 (54.5%) | $58,523 |
| 3-Person Families | 19 (10.1%) | $68,125 |
| 4-Person Families | 45 (23.8%) | $0 |
| 5-Person Families | 8 (4.2%) | $0 |
| 6-Person Families | 14 (7.4%) | $75,000 |
| 7+ Person Families | 0 (0.0%) | $0 |
| Total | 189 (100.0%) | $58,523 |
Family Income by Number of Earners in New Straitsville
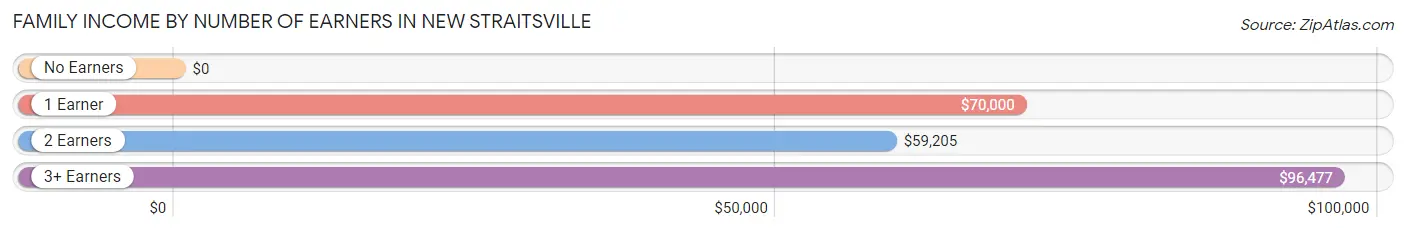
| Number of Earners | # Families | Median Income |
| No Earners | 33 (17.5%) | $0 |
| 1 Earner | 58 (30.7%) | $70,000 |
| 2 Earners | 79 (41.8%) | $59,205 |
| 3+ Earners | 19 (10.1%) | $96,477 |
| Total | 189 (100.0%) | $58,523 |
Household Income in New Straitsville
Household Income Brackets in New Straitsville
With 77 households falling in the category, the $10,000 to $14,999 income range is the most frequent in New Straitsville, accounting for 24.1% of all households. In contrast, only 3 households (0.9%) fall into the $25,000 to $34,999 income bracket, making it the least populous group.
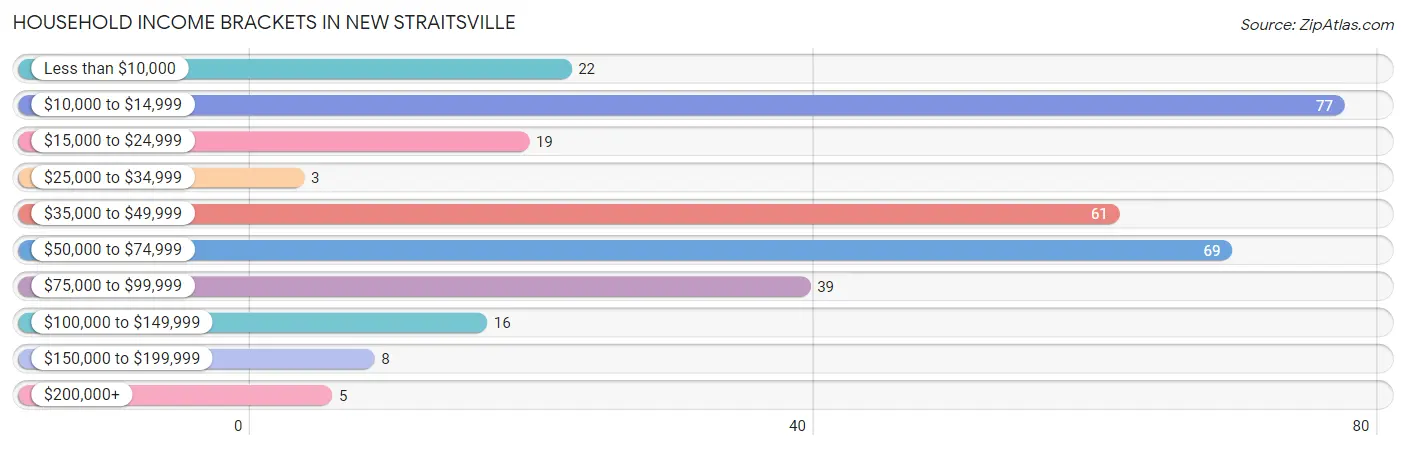
| Income Bracket | # Households | % Households |
| Less than $10,000 | 22 | 6.9% |
| $10,000 to $14,999 | 77 | 24.1% |
| $15,000 to $24,999 | 19 | 6.0% |
| $25,000 to $34,999 | 3 | 0.9% |
| $35,000 to $49,999 | 61 | 19.1% |
| $50,000 to $74,999 | 69 | 21.6% |
| $75,000 to $99,999 | 39 | 12.2% |
| $100,000 to $149,999 | 16 | 5.0% |
| $150,000 to $199,999 | 8 | 2.5% |
| $200,000+ | 5 | 1.6% |
Household Income by Householder Age in New Straitsville
The median household income in New Straitsville is $44,777, with the highest median household income of $63,750 found in the 25 to 44 years age bracket for the primary householder. A total of 98 households (30.7%) fall into this category. Meanwhile, the 15 to 24 years age bracket for the primary householder has the lowest median household income of $0, with 11 households (3.5%) in this group.
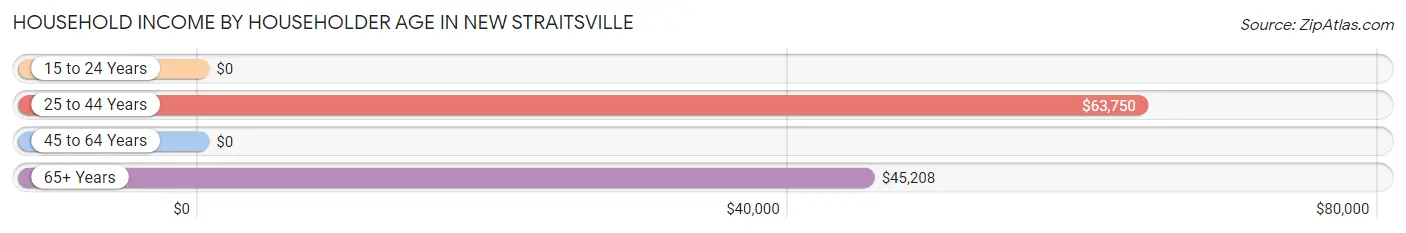
| Income Bracket | # Households | Median Income |
| 15 to 24 Years | 11 (3.5%) | $0 |
| 25 to 44 Years | 98 (30.7%) | $63,750 |
| 45 to 64 Years | 141 (44.2%) | $0 |
| 65+ Years | 69 (21.6%) | $45,208 |
| Total | 319 (100.0%) | $44,777 |
Poverty in New Straitsville
Income Below Poverty by Sex and Age in New Straitsville
With 25.3% poverty level for males and 28.8% for females among the residents of New Straitsville, 5 year old males and 12 to 14 year old females are the most vulnerable to poverty, with 7 males (100.0%) and 8 females (100.0%) in their respective age groups living below the poverty level.
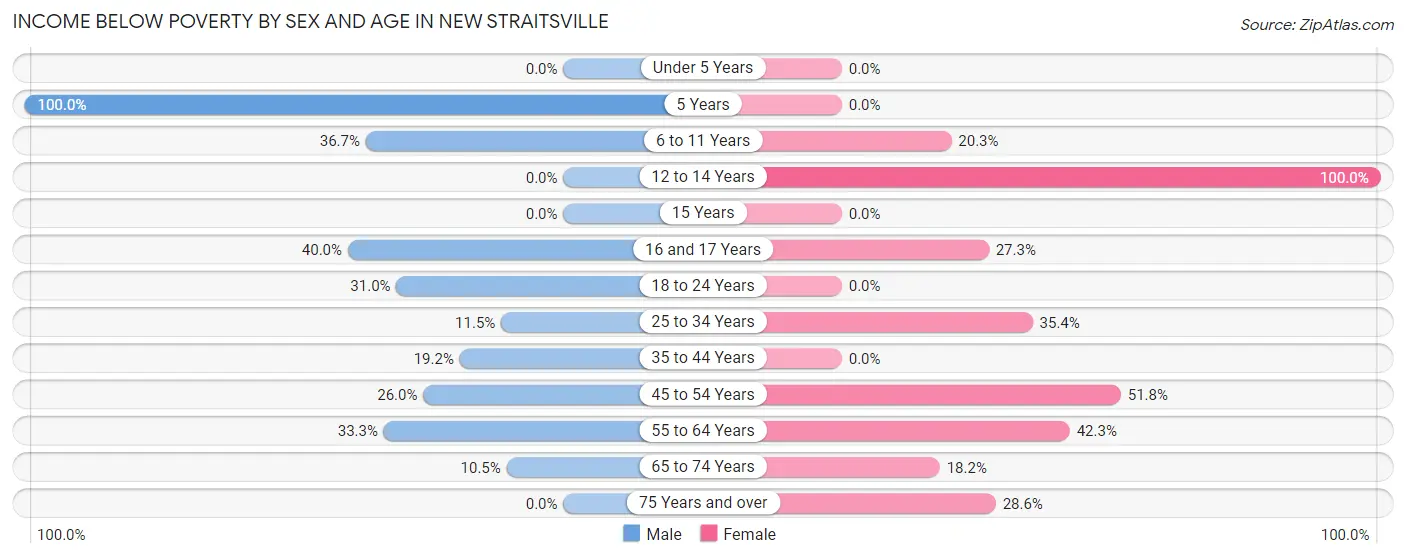
| Age Bracket | Male | Female |
| Under 5 Years | 0 (0.0%) | 0 (0.0%) |
| 5 Years | 7 (100.0%) | 0 (0.0%) |
| 6 to 11 Years | 11 (36.7%) | 12 (20.3%) |
| 12 to 14 Years | 0 (0.0%) | 8 (100.0%) |
| 15 Years | 0 (0.0%) | 0 (0.0%) |
| 16 and 17 Years | 8 (40.0%) | 6 (27.3%) |
| 18 to 24 Years | 22 (31.0%) | 0 (0.0%) |
| 25 to 34 Years | 3 (11.5%) | 17 (35.4%) |
| 35 to 44 Years | 15 (19.2%) | 0 (0.0%) |
| 45 to 54 Years | 13 (26.0%) | 29 (51.8%) |
| 55 to 64 Years | 19 (33.3%) | 22 (42.3%) |
| 65 to 74 Years | 4 (10.5%) | 8 (18.2%) |
| 75 Years and over | 0 (0.0%) | 2 (28.6%) |
| Total | 102 (25.3%) | 104 (28.8%) |
Income Above Poverty by Sex and Age in New Straitsville
According to the poverty statistics in New Straitsville, males aged under 5 years and females aged 18 to 24 years are the age groups that are most secure financially, with 100.0% of males and 100.0% of females in these age groups living above the poverty line.
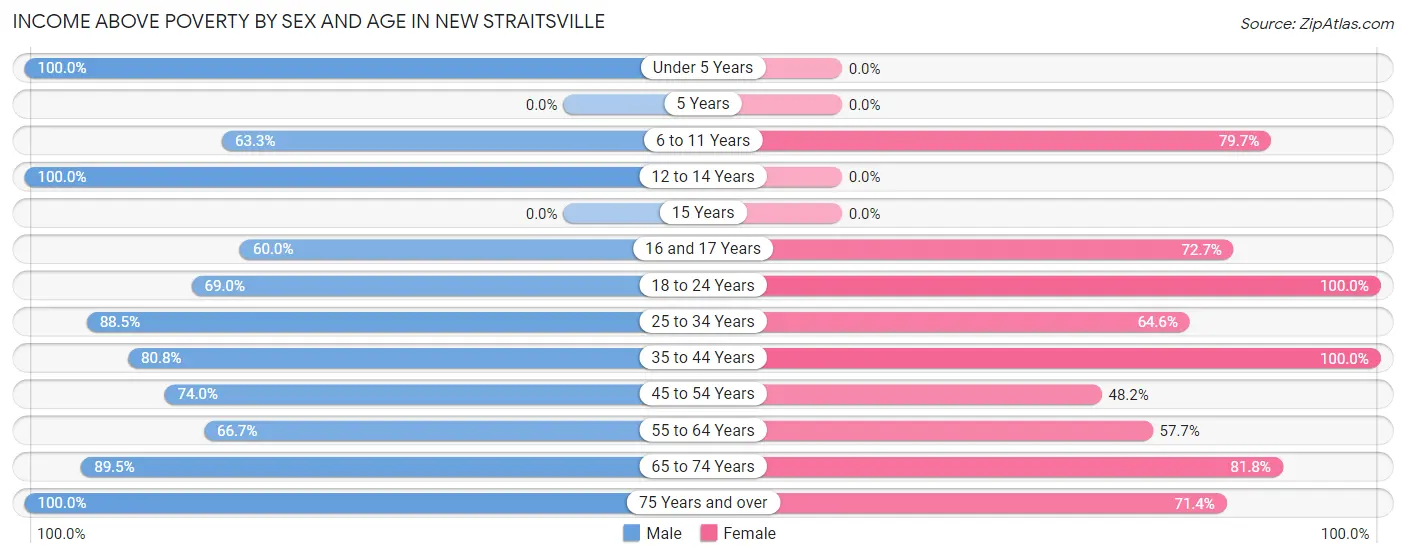
| Age Bracket | Male | Female |
| Under 5 Years | 11 (100.0%) | 0 (0.0%) |
| 5 Years | 0 (0.0%) | 0 (0.0%) |
| 6 to 11 Years | 19 (63.3%) | 47 (79.7%) |
| 12 to 14 Years | 12 (100.0%) | 0 (0.0%) |
| 15 Years | 0 (0.0%) | 0 (0.0%) |
| 16 and 17 Years | 12 (60.0%) | 16 (72.7%) |
| 18 to 24 Years | 49 (69.0%) | 19 (100.0%) |
| 25 to 34 Years | 23 (88.5%) | 31 (64.6%) |
| 35 to 44 Years | 63 (80.8%) | 46 (100.0%) |
| 45 to 54 Years | 37 (74.0%) | 27 (48.2%) |
| 55 to 64 Years | 38 (66.7%) | 30 (57.7%) |
| 65 to 74 Years | 34 (89.5%) | 36 (81.8%) |
| 75 Years and over | 3 (100.0%) | 5 (71.4%) |
| Total | 301 (74.7%) | 257 (71.2%) |
Income Below Poverty Among Married-Couple Families in New Straitsville
The poverty statistics for married-couple families in New Straitsville show that 5.4% or 6 of the total 110 families live below the poverty line. Families with no children have the highest poverty rate of 7.9%, comprising of 6 families. On the other hand, families with 1 or 2 children have the lowest poverty rate of 0.0%, which includes 0 families.
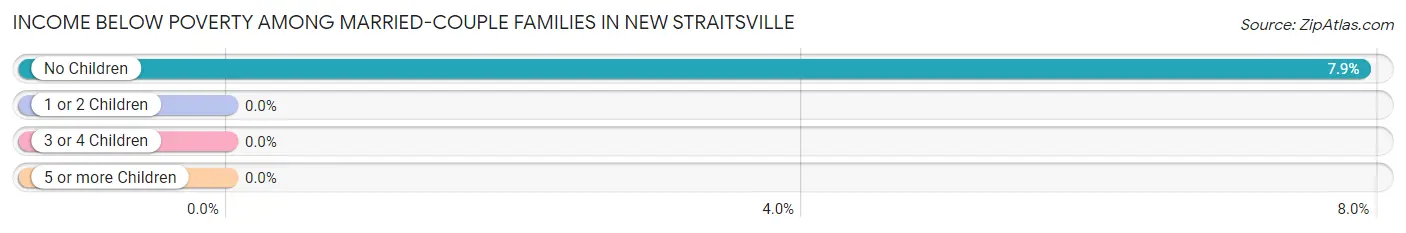
| Children | Above Poverty | Below Poverty |
| No Children | 70 (92.1%) | 6 (7.9%) |
| 1 or 2 Children | 23 (100.0%) | 0 (0.0%) |
| 3 or 4 Children | 11 (100.0%) | 0 (0.0%) |
| 5 or more Children | 0 (0.0%) | 0 (0.0%) |
| Total | 104 (94.6%) | 6 (5.4%) |
Income Below Poverty Among Single-Parent Households in New Straitsville
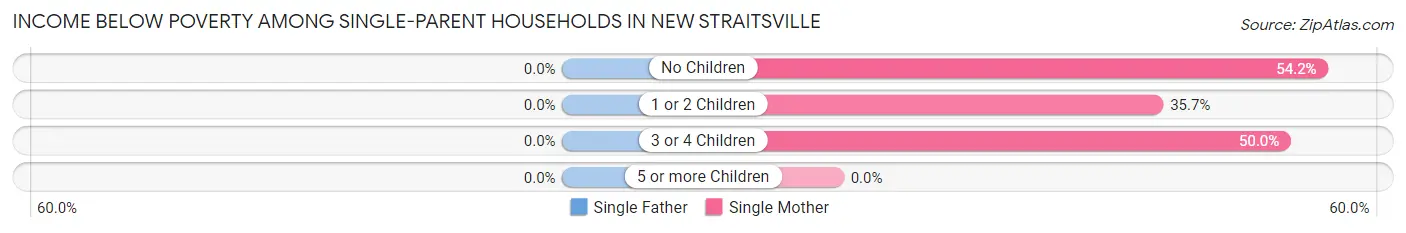
| Children | Single Father | Single Mother |
| No Children | 0 (0.0%) | 13 (54.2%) |
| 1 or 2 Children | 0 (0.0%) | 5 (35.7%) |
| 3 or 4 Children | 0 (0.0%) | 7 (50.0%) |
| 5 or more Children | 0 (0.0%) | 0 (0.0%) |
| Total | 0 (0.0%) | 25 (48.1%) |
Income Below Poverty Among Married-Couple vs Single-Parent Households in New Straitsville
The poverty data for New Straitsville shows that 6 of the married-couple family households (5.4%) and 25 of the single-parent households (31.7%) are living below the poverty level. Within the married-couple family households, those with no children have the highest poverty rate, with 6 households (7.9%) falling below the poverty line. Among the single-parent households, those with 3 or 4 children have the highest poverty rate, with 7 household (50.0%) living below poverty.
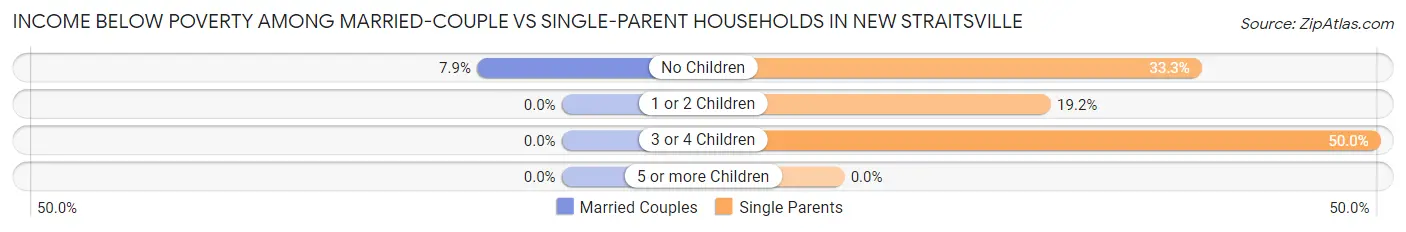
| Children | Married-Couple Families | Single-Parent Households |
| No Children | 6 (7.9%) | 13 (33.3%) |
| 1 or 2 Children | 0 (0.0%) | 5 (19.2%) |
| 3 or 4 Children | 0 (0.0%) | 7 (50.0%) |
| 5 or more Children | 0 (0.0%) | 0 (0.0%) |
| Total | 6 (5.4%) | 25 (31.7%) |
Employment Characteristics in New Straitsville
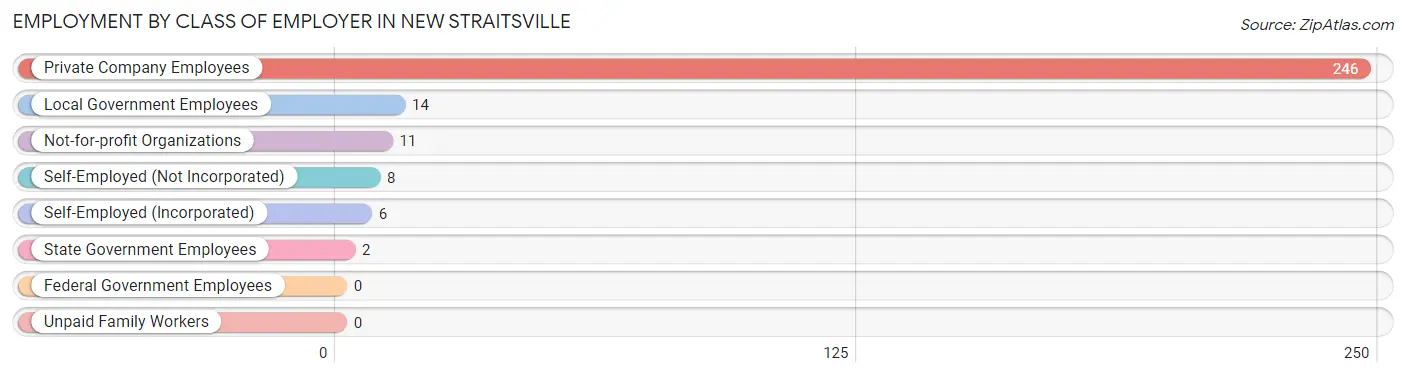
Employment by Class of Employer in New Straitsville
Among the 287 employed individuals in New Straitsville, private company employees (246 | 85.7%), local government employees (14 | 4.9%), and not-for-profit organizations (11 | 3.8%) make up the most common classes of employment.
| Employer Class | # Employees | % Employees |
| Private Company Employees | 246 | 85.7% |
| Self-Employed (Incorporated) | 6 | 2.1% |
| Self-Employed (Not Incorporated) | 8 | 2.8% |
| Not-for-profit Organizations | 11 | 3.8% |
| Local Government Employees | 14 | 4.9% |
| State Government Employees | 2 | 0.7% |
| Federal Government Employees | 0 | 0.0% |
| Unpaid Family Workers | 0 | 0.0% |
| Total | 287 | 100.0% |
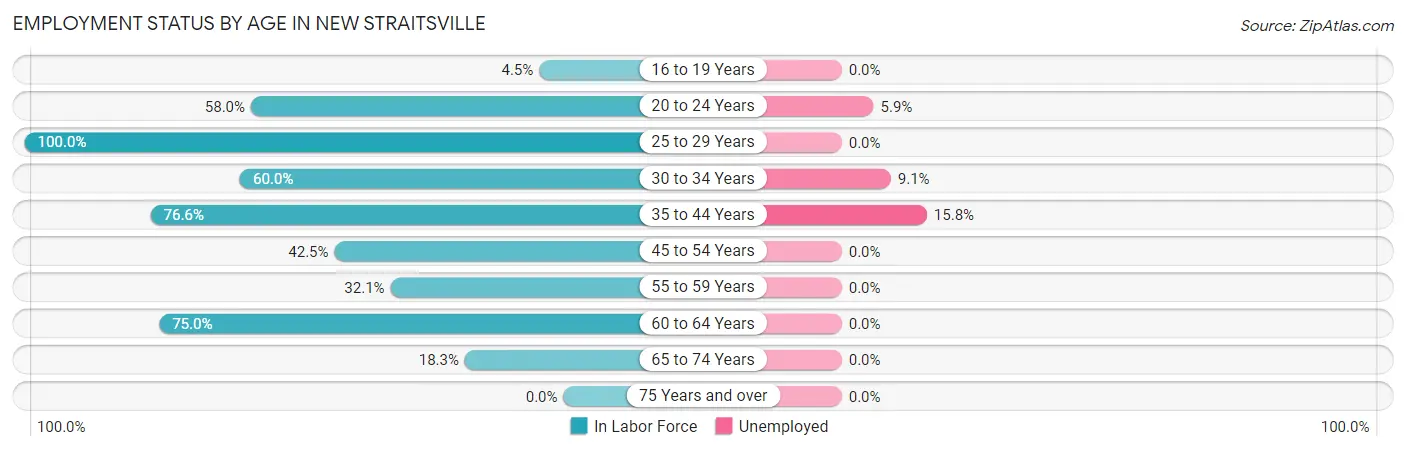
Employment Status by Age in New Straitsville
According to the labor force statistics for New Straitsville, out of the total population over 16 years of age (637), 50.1% or 319 individuals are in the labor force, with 6.6% or 21 of them unemployed. The age group with the highest labor force participation rate is 25 to 29 years, with 100.0% or 19 individuals in the labor force. Within the labor force, the 35 to 44 years age range has the highest percentage of unemployed individuals, with 15.8% or 15 of them being unemployed.
| Age Bracket | In Labor Force | Unemployed |
| 16 to 19 Years | 2 (4.5%) | 0 (0.0%) |
| 20 to 24 Years | 51 (58.0%) | 3 (5.9%) |
| 25 to 29 Years | 19 (100.0%) | 0 (0.0%) |
| 30 to 34 Years | 33 (60.0%) | 3 (9.1%) |
| 35 to 44 Years | 95 (76.6%) | 15 (15.8%) |
| 45 to 54 Years | 45 (42.5%) | 0 (0.0%) |
| 55 to 59 Years | 17 (32.1%) | 0 (0.0%) |
| 60 to 64 Years | 42 (75.0%) | 0 (0.0%) |
| 65 to 74 Years | 15 (18.3%) | 0 (0.0%) |
| 75 Years and over | 0 (0.0%) | 0 (0.0%) |
| Total | 319 (50.1%) | 21 (6.6%) |
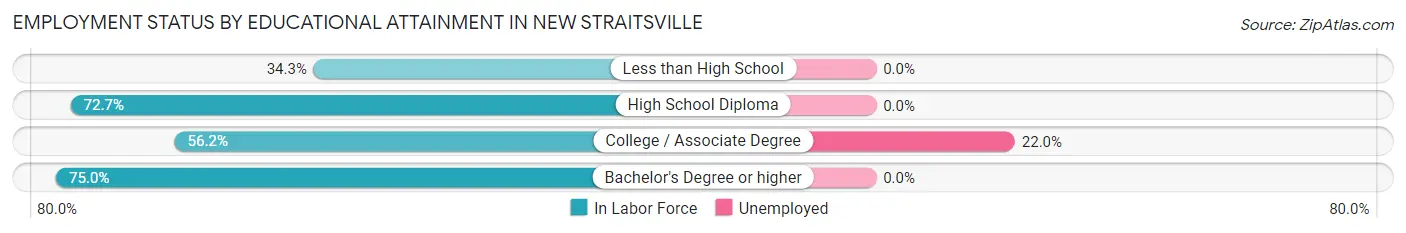
Employment Status by Educational Attainment in New Straitsville
According to labor force statistics for New Straitsville, 60.8% of individuals (251) out of the total population between 25 and 64 years of age (413) are in the labor force, with 7.2% or 18 of them being unemployed. The group with the highest labor force participation rate are those with the educational attainment of bachelor's degree or higher, with 75.0% or 18 individuals in the labor force. Within the labor force, individuals with college / associate degree education have the highest percentage of unemployment, with 22.0% or 18 of them being unemployed.
| Educational Attainment | In Labor Force | Unemployed |
| Less than High School | 23 (34.3%) | 0 (0.0%) |
| High School Diploma | 128 (72.7%) | 0 (0.0%) |
| College / Associate Degree | 82 (56.2%) | 32 (22.0%) |
| Bachelor's Degree or higher | 18 (75.0%) | 0 (0.0%) |
| Total | 251 (60.8%) | 30 (7.2%) |
Employment Occupations by Sex in New Straitsville
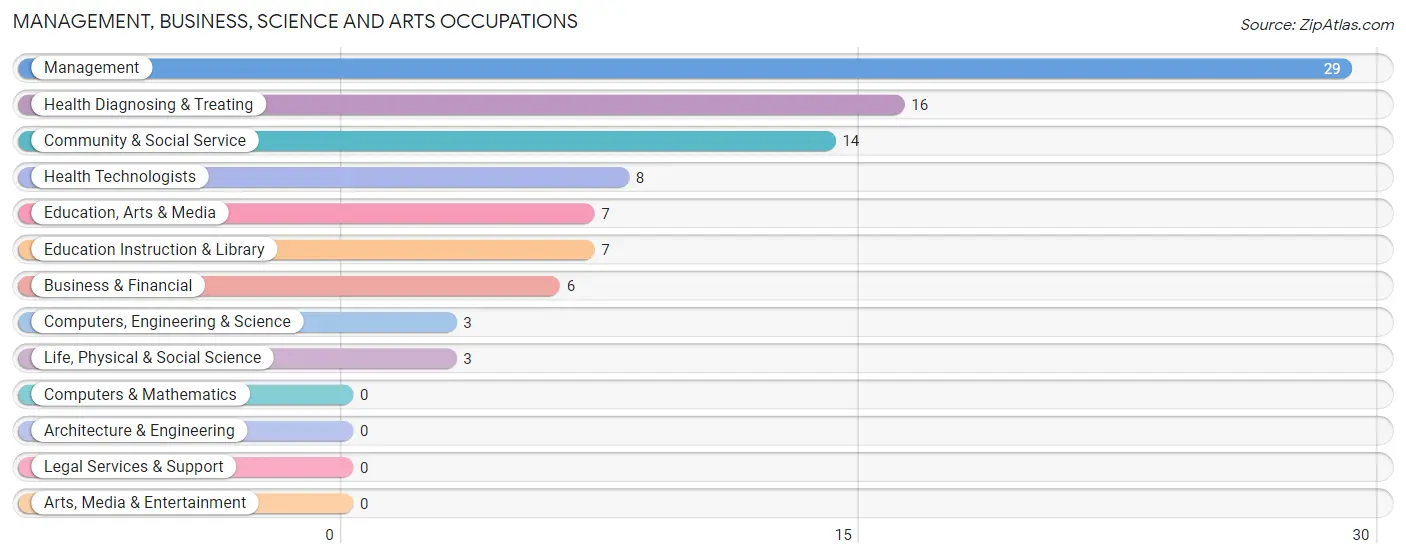
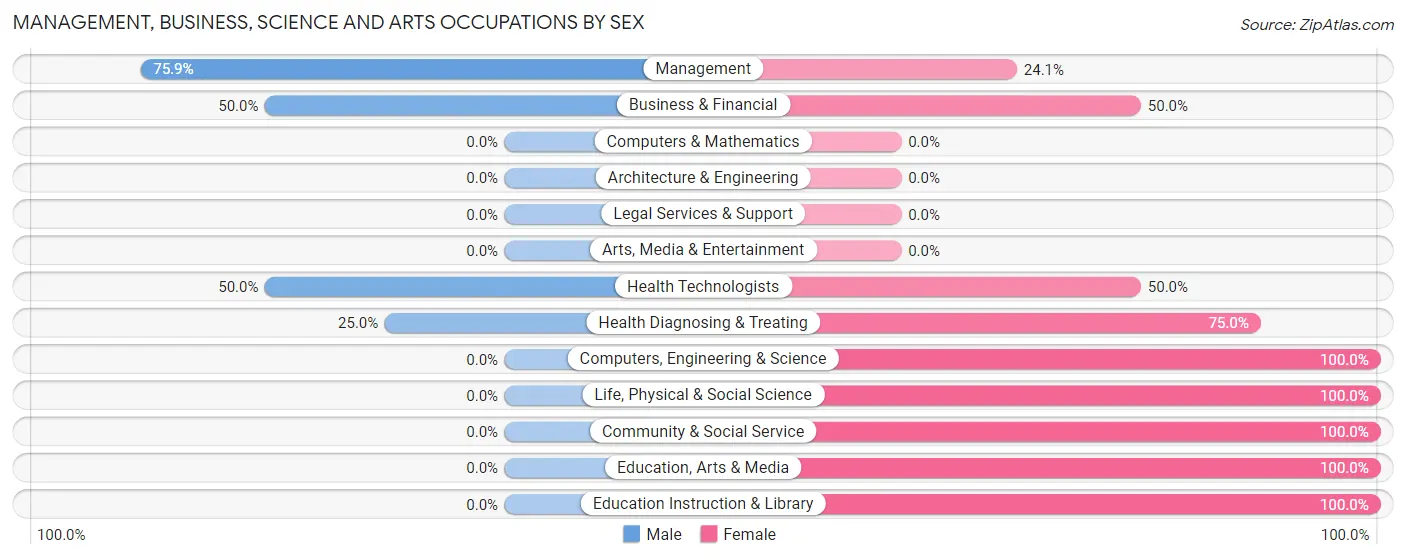
Management, Business, Science and Arts Occupations
The most common Management, Business, Science and Arts occupations in New Straitsville are Management (29 | 9.7%), Health Diagnosing & Treating (16 | 5.4%), Community & Social Service (14 | 4.7%), Health Technologists (8 | 2.7%), and Education, Arts & Media (7 | 2.4%).
Management, Business, Science and Arts Occupations by Sex
Within the Management, Business, Science and Arts occupations in New Straitsville, the most male-oriented occupations are Management (75.9%), Business & Financial (50.0%), and Health Technologists (50.0%), while the most female-oriented occupations are Computers, Engineering & Science (100.0%), Life, Physical & Social Science (100.0%), and Community & Social Service (100.0%).
| Occupation | Male | Female |
| Management | 22 (75.9%) | 7 (24.1%) |
| Business & Financial | 3 (50.0%) | 3 (50.0%) |
| Computers, Engineering & Science | 0 (0.0%) | 3 (100.0%) |
| Computers & Mathematics | 0 (0.0%) | 0 (0.0%) |
| Architecture & Engineering | 0 (0.0%) | 0 (0.0%) |
| Life, Physical & Social Science | 0 (0.0%) | 3 (100.0%) |
| Community & Social Service | 0 (0.0%) | 14 (100.0%) |
| Education, Arts & Media | 0 (0.0%) | 7 (100.0%) |
| Legal Services & Support | 0 (0.0%) | 0 (0.0%) |
| Education Instruction & Library | 0 (0.0%) | 7 (100.0%) |
| Arts, Media & Entertainment | 0 (0.0%) | 0 (0.0%) |
| Health Diagnosing & Treating | 4 (25.0%) | 12 (75.0%) |
| Health Technologists | 4 (50.0%) | 4 (50.0%) |
| Total (Category) | 29 (42.6%) | 39 (57.4%) |
| Total (Overall) | 181 (60.7%) | 117 (39.3%) |
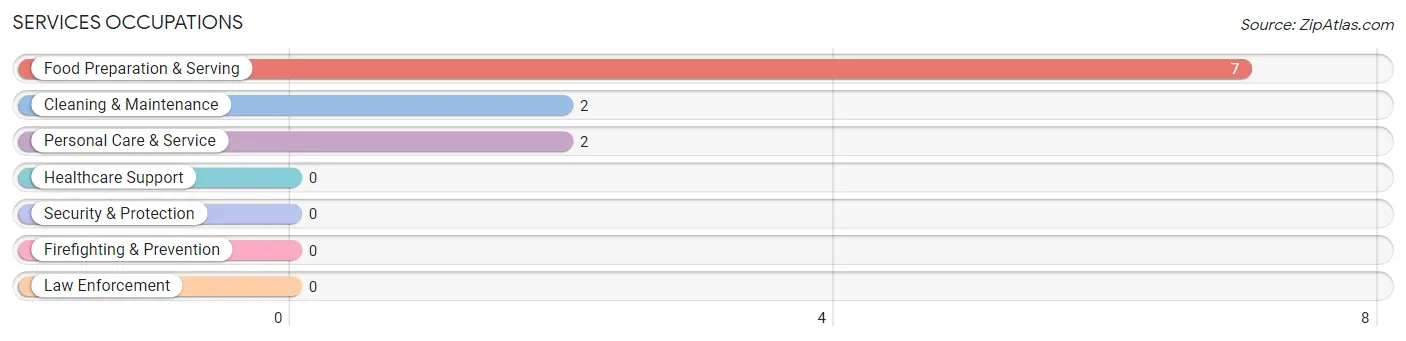
Services Occupations
The most common Services occupations in New Straitsville are Food Preparation & Serving (7 | 2.4%), Cleaning & Maintenance (2 | 0.7%), and Personal Care & Service (2 | 0.7%).
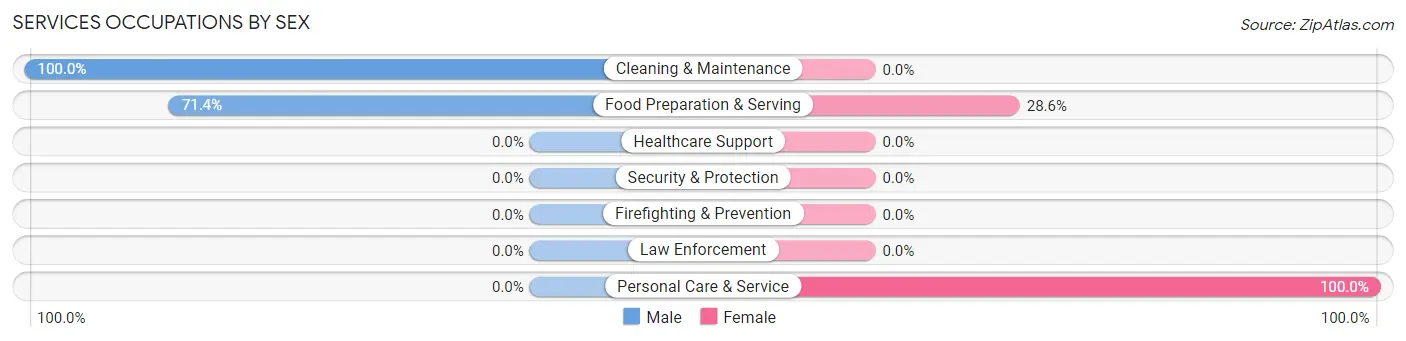
Services Occupations by Sex
Within the Services occupations in New Straitsville, the most male-oriented occupations are Cleaning & Maintenance (100.0%), and Food Preparation & Serving (71.4%), while the most female-oriented occupations are Personal Care & Service (100.0%), and Food Preparation & Serving (28.6%).
| Occupation | Male | Female |
| Healthcare Support | 0 (0.0%) | 0 (0.0%) |
| Security & Protection | 0 (0.0%) | 0 (0.0%) |
| Firefighting & Prevention | 0 (0.0%) | 0 (0.0%) |
| Law Enforcement | 0 (0.0%) | 0 (0.0%) |
| Food Preparation & Serving | 5 (71.4%) | 2 (28.6%) |
| Cleaning & Maintenance | 2 (100.0%) | 0 (0.0%) |
| Personal Care & Service | 0 (0.0%) | 2 (100.0%) |
| Total (Category) | 7 (63.6%) | 4 (36.4%) |
| Total (Overall) | 181 (60.7%) | 117 (39.3%) |
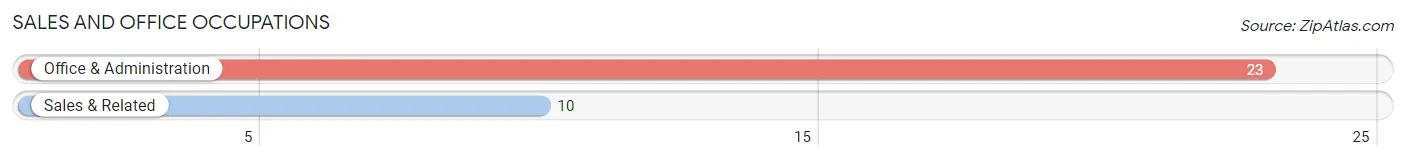
Sales and Office Occupations
The most common Sales and Office occupations in New Straitsville are Office & Administration (23 | 7.7%), and Sales & Related (10 | 3.4%).
Sales and Office Occupations by Sex
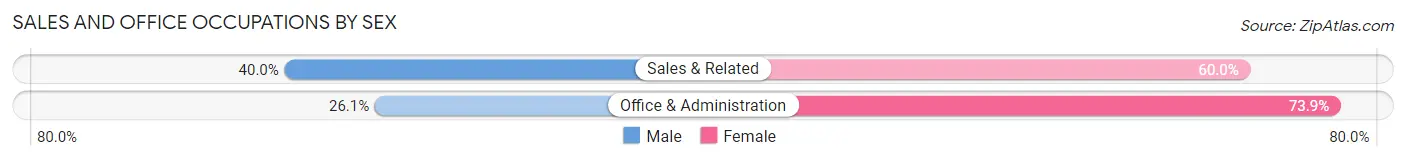
| Occupation | Male | Female |
| Sales & Related | 4 (40.0%) | 6 (60.0%) |
| Office & Administration | 6 (26.1%) | 17 (73.9%) |
| Total (Category) | 10 (30.3%) | 23 (69.7%) |
| Total (Overall) | 181 (60.7%) | 117 (39.3%) |
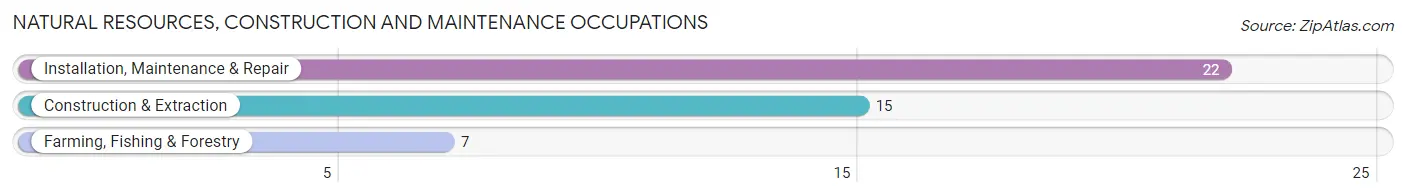
Natural Resources, Construction and Maintenance Occupations
The most common Natural Resources, Construction and Maintenance occupations in New Straitsville are Installation, Maintenance & Repair (22 | 7.4%), Construction & Extraction (15 | 5.0%), and Farming, Fishing & Forestry (7 | 2.4%).
Natural Resources, Construction and Maintenance Occupations by Sex
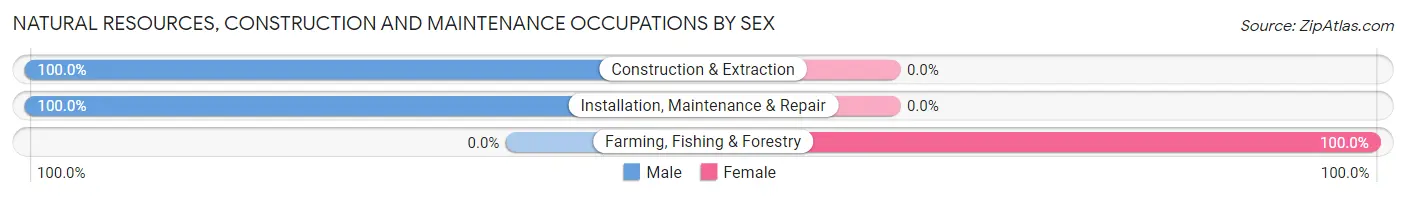
| Occupation | Male | Female |
| Farming, Fishing & Forestry | 0 (0.0%) | 7 (100.0%) |
| Construction & Extraction | 15 (100.0%) | 0 (0.0%) |
| Installation, Maintenance & Repair | 22 (100.0%) | 0 (0.0%) |
| Total (Category) | 37 (84.1%) | 7 (15.9%) |
| Total (Overall) | 181 (60.7%) | 117 (39.3%) |
Production, Transportation and Moving Occupations
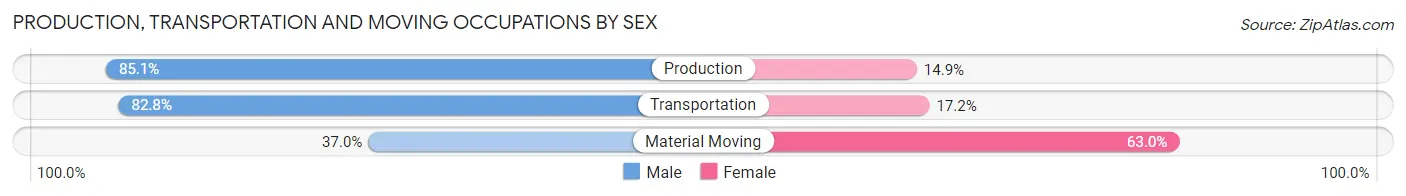
The most common Production, Transportation and Moving occupations in New Straitsville are Production (67 | 22.5%), Material Moving (46 | 15.4%), and Transportation (29 | 9.7%).
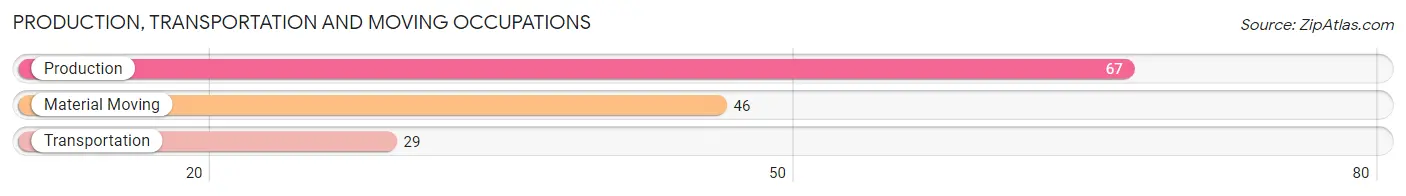
Production, Transportation and Moving Occupations by Sex
| Occupation | Male | Female |
| Production | 57 (85.1%) | 10 (14.9%) |
| Transportation | 24 (82.8%) | 5 (17.2%) |
| Material Moving | 17 (37.0%) | 29 (63.0%) |
| Total (Category) | 98 (69.0%) | 44 (31.0%) |
| Total (Overall) | 181 (60.7%) | 117 (39.3%) |
Employment Industries by Sex in New Straitsville
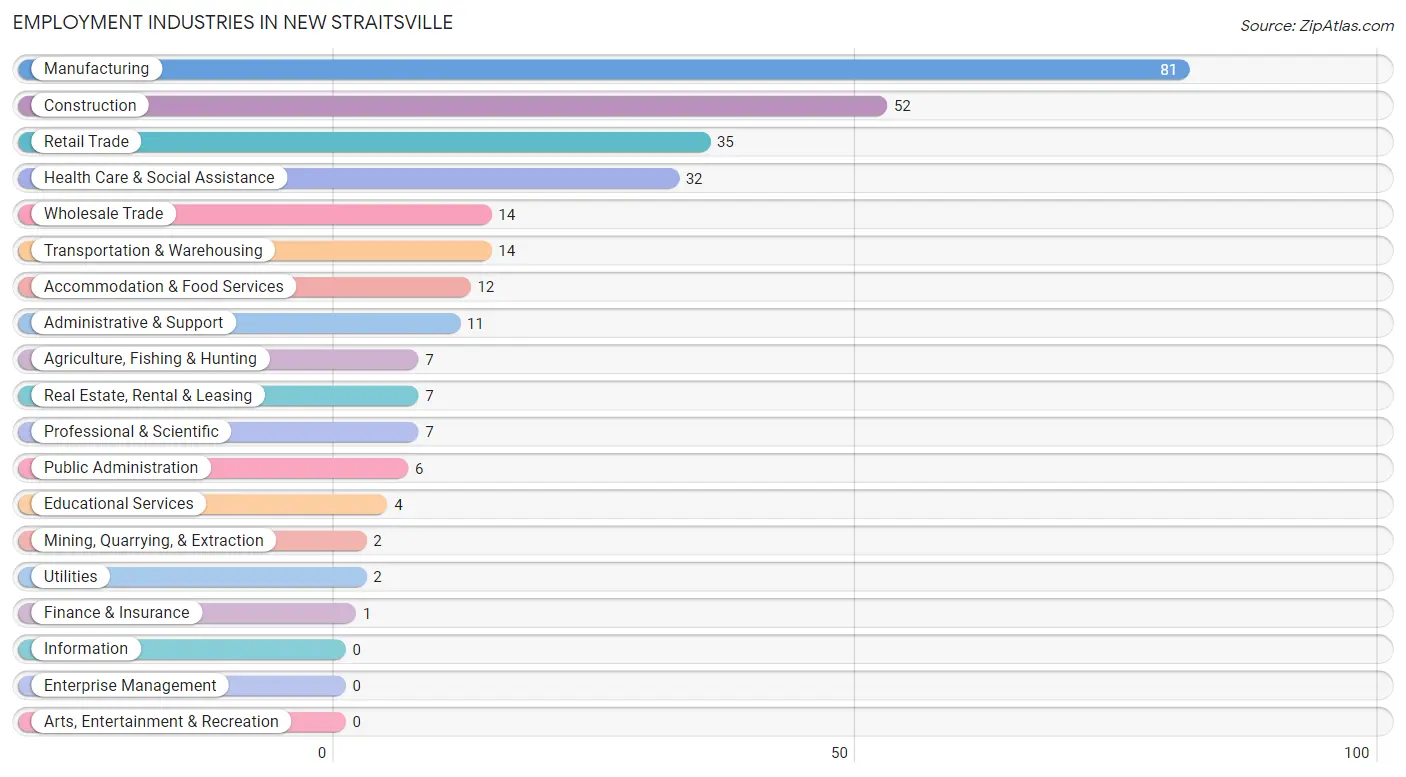
Employment Industries in New Straitsville
The major employment industries in New Straitsville include Manufacturing (81 | 27.2%), Construction (52 | 17.4%), Retail Trade (35 | 11.7%), Health Care & Social Assistance (32 | 10.7%), and Wholesale Trade (14 | 4.7%).
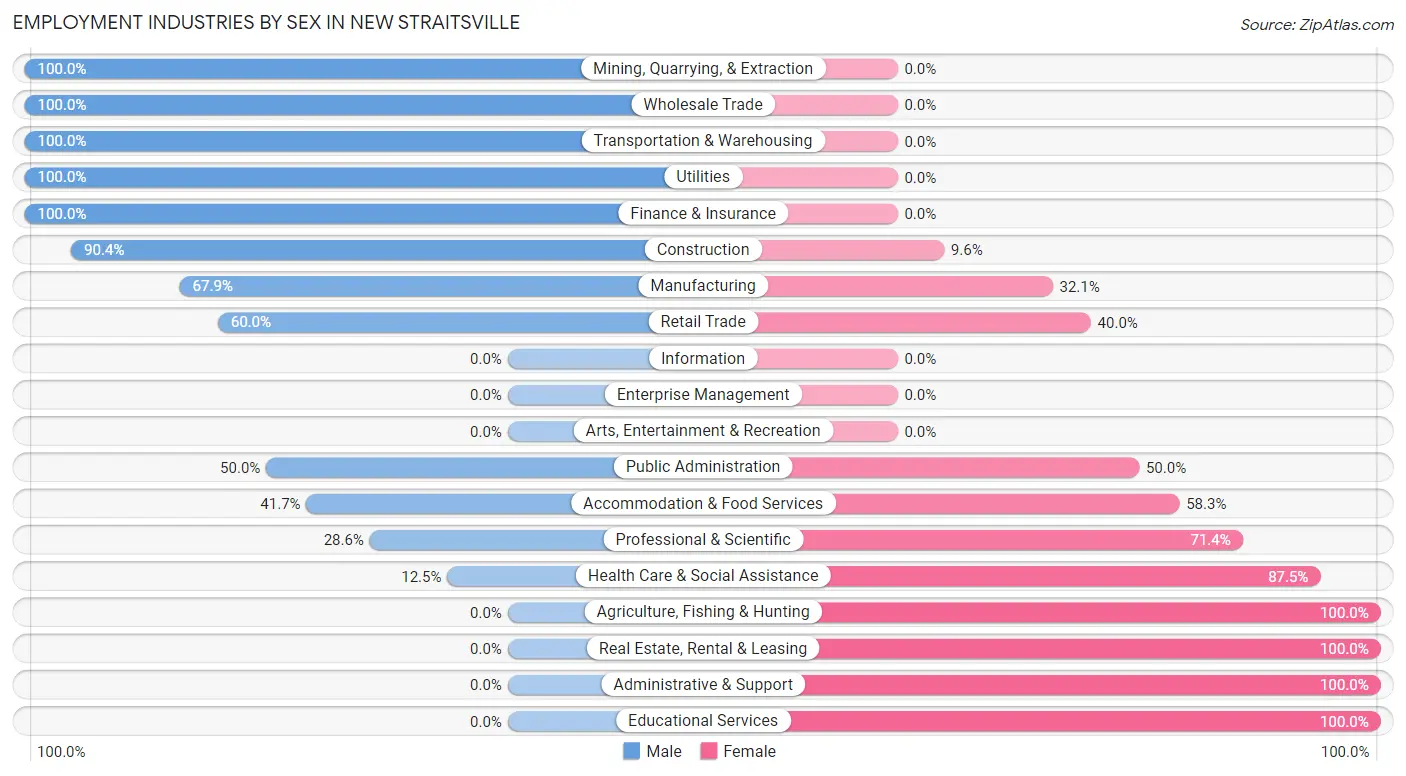
Employment Industries by Sex in New Straitsville
The New Straitsville industries that see more men than women are Mining, Quarrying, & Extraction (100.0%), Wholesale Trade (100.0%), and Transportation & Warehousing (100.0%), whereas the industries that tend to have a higher number of women are Agriculture, Fishing & Hunting (100.0%), Real Estate, Rental & Leasing (100.0%), and Administrative & Support (100.0%).
| Industry | Male | Female |
| Agriculture, Fishing & Hunting | 0 (0.0%) | 7 (100.0%) |
| Mining, Quarrying, & Extraction | 2 (100.0%) | 0 (0.0%) |
| Construction | 47 (90.4%) | 5 (9.6%) |
| Manufacturing | 55 (67.9%) | 26 (32.1%) |
| Wholesale Trade | 14 (100.0%) | 0 (0.0%) |
| Retail Trade | 21 (60.0%) | 14 (40.0%) |
| Transportation & Warehousing | 14 (100.0%) | 0 (0.0%) |
| Utilities | 2 (100.0%) | 0 (0.0%) |
| Information | 0 (0.0%) | 0 (0.0%) |
| Finance & Insurance | 1 (100.0%) | 0 (0.0%) |
| Real Estate, Rental & Leasing | 0 (0.0%) | 7 (100.0%) |
| Professional & Scientific | 2 (28.6%) | 5 (71.4%) |
| Enterprise Management | 0 (0.0%) | 0 (0.0%) |
| Administrative & Support | 0 (0.0%) | 11 (100.0%) |
| Educational Services | 0 (0.0%) | 4 (100.0%) |
| Health Care & Social Assistance | 4 (12.5%) | 28 (87.5%) |
| Arts, Entertainment & Recreation | 0 (0.0%) | 0 (0.0%) |
| Accommodation & Food Services | 5 (41.7%) | 7 (58.3%) |
| Public Administration | 3 (50.0%) | 3 (50.0%) |
| Total | 181 (60.7%) | 117 (39.3%) |
Education in New Straitsville
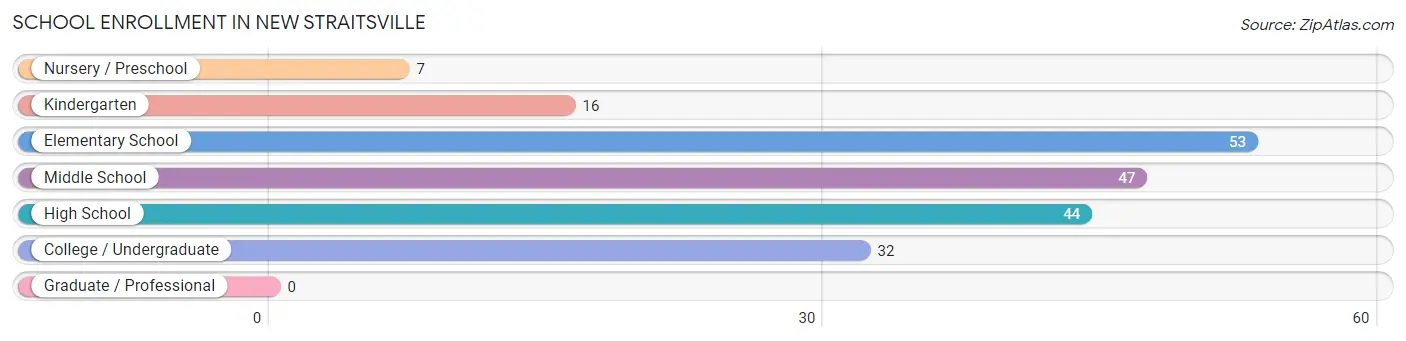
School Enrollment in New Straitsville
The most common levels of schooling among the 199 students in New Straitsville are elementary school (53 | 26.6%), middle school (47 | 23.6%), and high school (44 | 22.1%).
| School Level | # Students | % Students |
| Nursery / Preschool | 7 | 3.5% |
| Kindergarten | 16 | 8.0% |
| Elementary School | 53 | 26.6% |
| Middle School | 47 | 23.6% |
| High School | 44 | 22.1% |
| College / Undergraduate | 32 | 16.1% |
| Graduate / Professional | 0 | 0.0% |
| Total | 199 | 100.0% |
School Enrollment by Age by Funding Source in New Straitsville
Out of a total of 199 students who are enrolled in schools in New Straitsville, 14 (7.0%) attend a private institution, while the remaining 185 (93.0%) are enrolled in public schools. The age group of 35 years and over has the highest likelihood of being enrolled in private schools, with 7 (100.0% in the age bracket) enrolled. Conversely, the age group of 3 to 4 year olds has the lowest likelihood of being enrolled in a private school, with 7 (100.0% in the age bracket) attending a public institution.
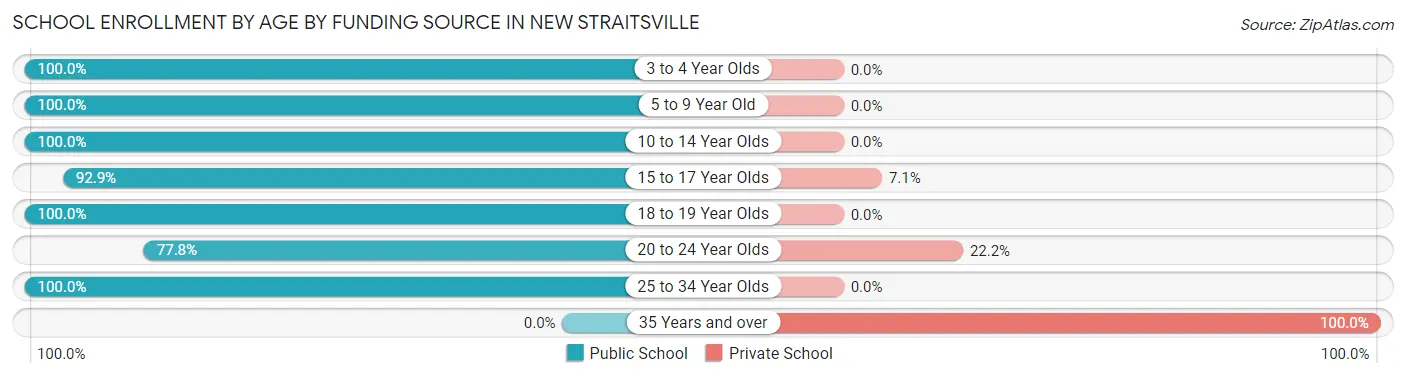
| Age Bracket | Public School | Private School |
| 3 to 4 Year Olds | 7 (100.0%) | 0 (0.0%) |
| 5 to 9 Year Old | 67 (100.0%) | 0 (0.0%) |
| 10 to 14 Year Olds | 49 (100.0%) | 0 (0.0%) |
| 15 to 17 Year Olds | 39 (92.9%) | 3 (7.1%) |
| 18 to 19 Year Olds | 2 (100.0%) | 0 (0.0%) |
| 20 to 24 Year Olds | 14 (77.8%) | 4 (22.2%) |
| 25 to 34 Year Olds | 7 (100.0%) | 0 (0.0%) |
| 35 Years and over | 0 (0.0%) | 7 (100.0%) |
| Total | 185 (93.0%) | 14 (7.0%) |
Educational Attainment by Field of Study in New Straitsville
Science & technology (13 | 38.2%), education (5 | 14.7%), social sciences (4 | 11.8%), multidisciplinary studies (4 | 11.8%), and communications (4 | 11.8%) are the most common fields of study among 34 individuals in New Straitsville who have obtained a bachelor's degree or higher.
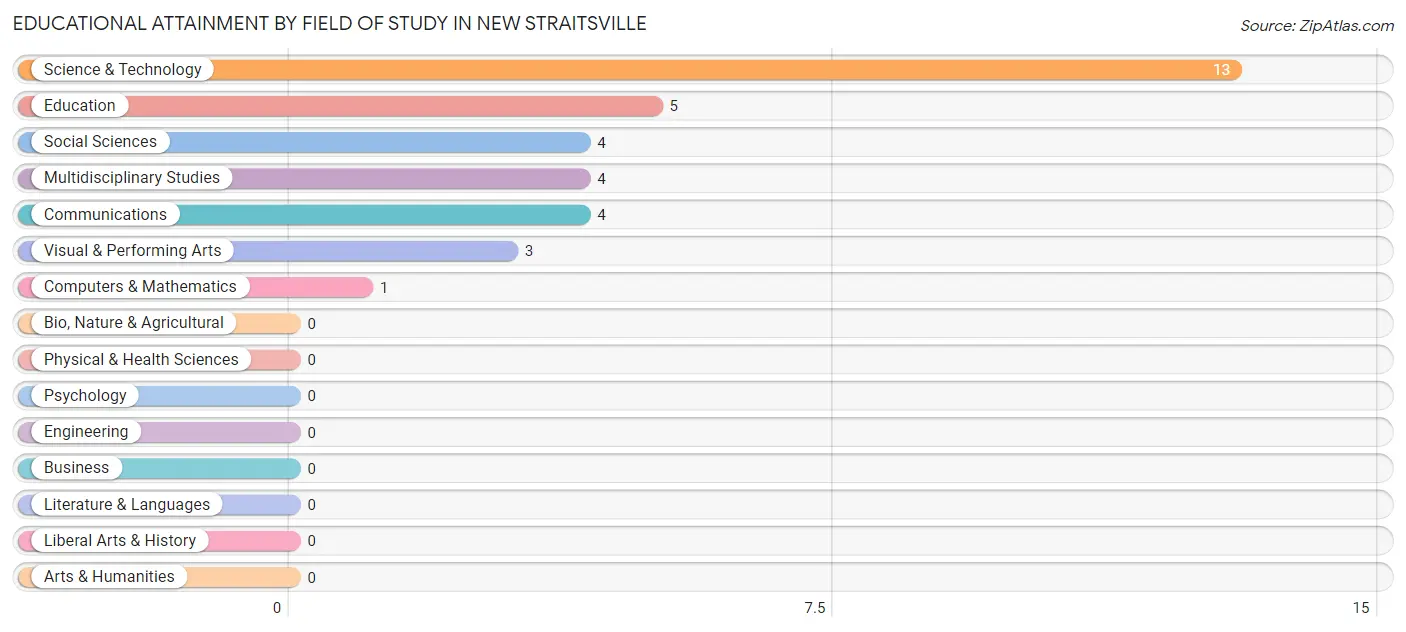
| Field of Study | # Graduates | % Graduates |
| Computers & Mathematics | 1 | 2.9% |
| Bio, Nature & Agricultural | 0 | 0.0% |
| Physical & Health Sciences | 0 | 0.0% |
| Psychology | 0 | 0.0% |
| Social Sciences | 4 | 11.8% |
| Engineering | 0 | 0.0% |
| Multidisciplinary Studies | 4 | 11.8% |
| Science & Technology | 13 | 38.2% |
| Business | 0 | 0.0% |
| Education | 5 | 14.7% |
| Literature & Languages | 0 | 0.0% |
| Liberal Arts & History | 0 | 0.0% |
| Visual & Performing Arts | 3 | 8.8% |
| Communications | 4 | 11.8% |
| Arts & Humanities | 0 | 0.0% |
| Total | 34 | 100.0% |
Transportation & Commute in New Straitsville
Vehicle Availability by Sex in New Straitsville
The most prevalent vehicle ownership categories in New Straitsville are males with 4 vehicles (51, accounting for 28.8%) and females with 4 vehicles (26, making up 46.4%).
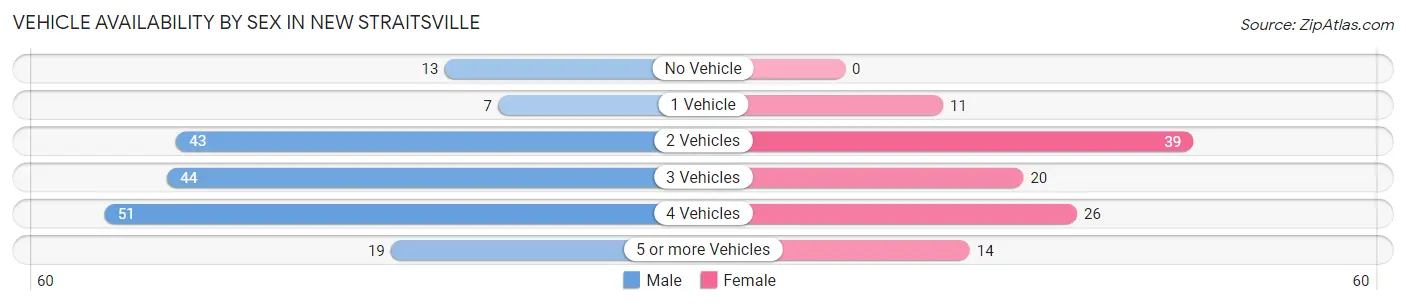
| Vehicles Available | Male | Female |
| No Vehicle | 13 (7.3%) | 0 (0.0%) |
| 1 Vehicle | 7 (4.0%) | 11 (10.0%) |
| 2 Vehicles | 43 (24.3%) | 39 (35.4%) |
| 3 Vehicles | 44 (24.9%) | 20 (18.2%) |
| 4 Vehicles | 51 (28.8%) | 26 (23.6%) |
| 5 or more Vehicles | 19 (10.7%) | 14 (12.7%) |
| Total | 177 (100.0%) | 110 (100.0%) |
Commute Time in New Straitsville
The most frequently occuring commute durations in New Straitsville are 20 to 24 minutes (88 commuters, 31.4%), 15 to 19 minutes (63 commuters, 22.5%), and 45 to 59 minutes (39 commuters, 13.9%).
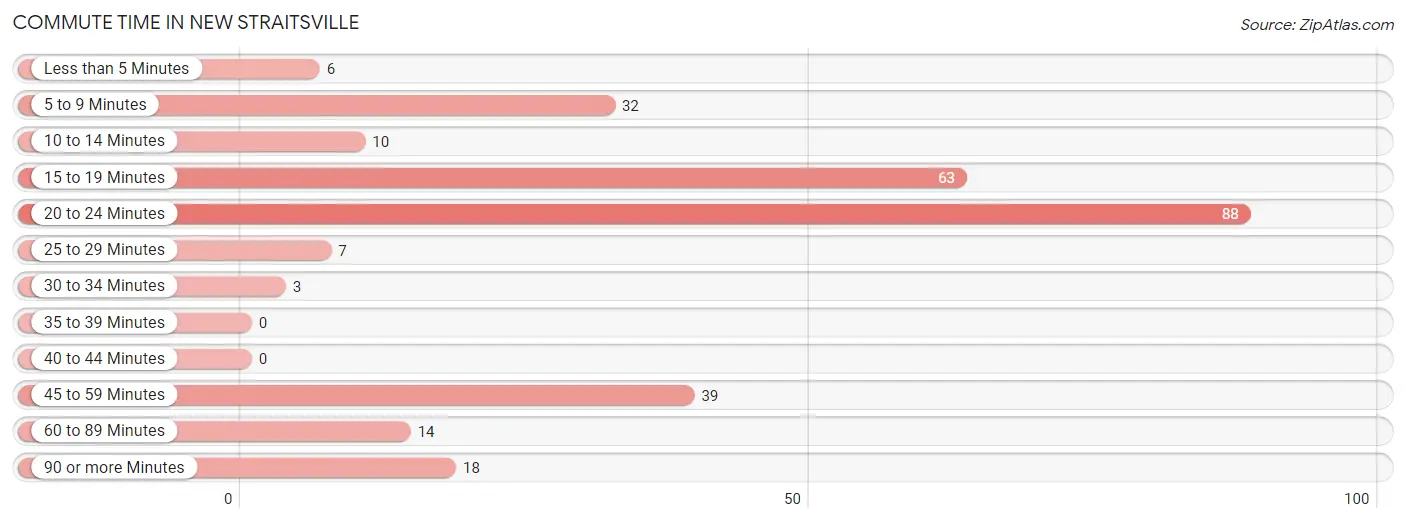
| Commute Time | # Commuters | % Commuters |
| Less than 5 Minutes | 6 | 2.1% |
| 5 to 9 Minutes | 32 | 11.4% |
| 10 to 14 Minutes | 10 | 3.6% |
| 15 to 19 Minutes | 63 | 22.5% |
| 20 to 24 Minutes | 88 | 31.4% |
| 25 to 29 Minutes | 7 | 2.5% |
| 30 to 34 Minutes | 3 | 1.1% |
| 35 to 39 Minutes | 0 | 0.0% |
| 40 to 44 Minutes | 0 | 0.0% |
| 45 to 59 Minutes | 39 | 13.9% |
| 60 to 89 Minutes | 14 | 5.0% |
| 90 or more Minutes | 18 | 6.4% |
Commute Time by Sex in New Straitsville
The most common commute times in New Straitsville are 20 to 24 minutes (58 commuters, 34.1%) for males and 20 to 24 minutes (30 commuters, 27.3%) for females.
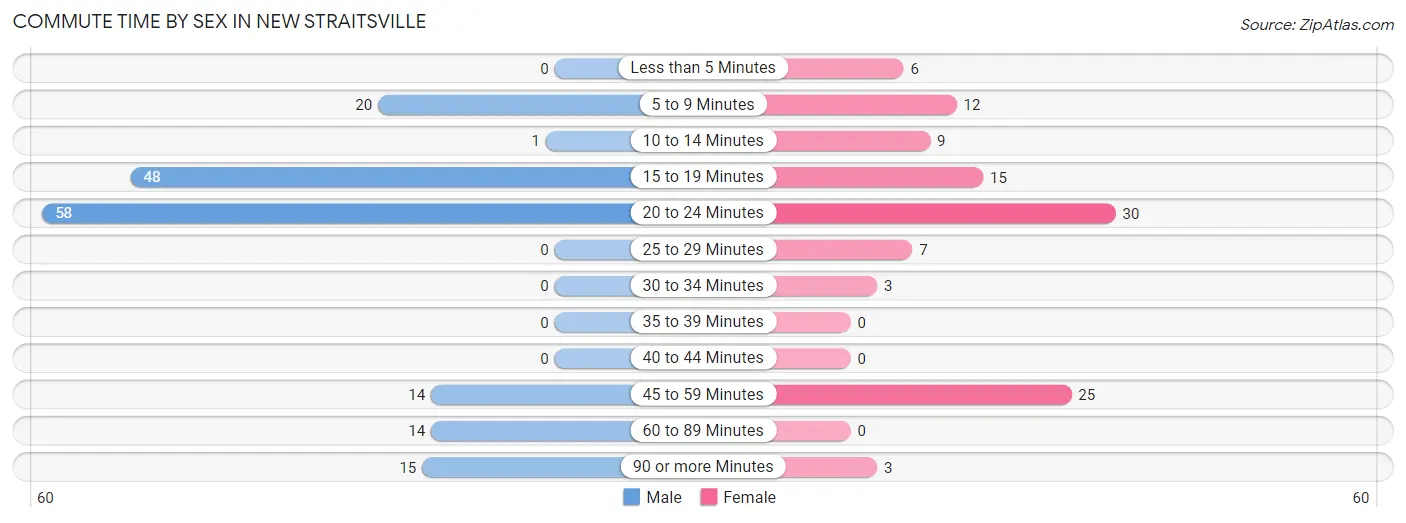
| Commute Time | Male | Female |
| Less than 5 Minutes | 0 (0.0%) | 6 (5.4%) |
| 5 to 9 Minutes | 20 (11.8%) | 12 (10.9%) |
| 10 to 14 Minutes | 1 (0.6%) | 9 (8.2%) |
| 15 to 19 Minutes | 48 (28.2%) | 15 (13.6%) |
| 20 to 24 Minutes | 58 (34.1%) | 30 (27.3%) |
| 25 to 29 Minutes | 0 (0.0%) | 7 (6.4%) |
| 30 to 34 Minutes | 0 (0.0%) | 3 (2.7%) |
| 35 to 39 Minutes | 0 (0.0%) | 0 (0.0%) |
| 40 to 44 Minutes | 0 (0.0%) | 0 (0.0%) |
| 45 to 59 Minutes | 14 (8.2%) | 25 (22.7%) |
| 60 to 89 Minutes | 14 (8.2%) | 0 (0.0%) |
| 90 or more Minutes | 15 (8.8%) | 3 (2.7%) |
Time of Departure to Work by Sex in New Straitsville
The most frequent times of departure to work in New Straitsville are 12:00 PM to 3:59 PM (44, 25.9%) for males and 7:00 AM to 7:29 AM (45, 40.9%) for females.
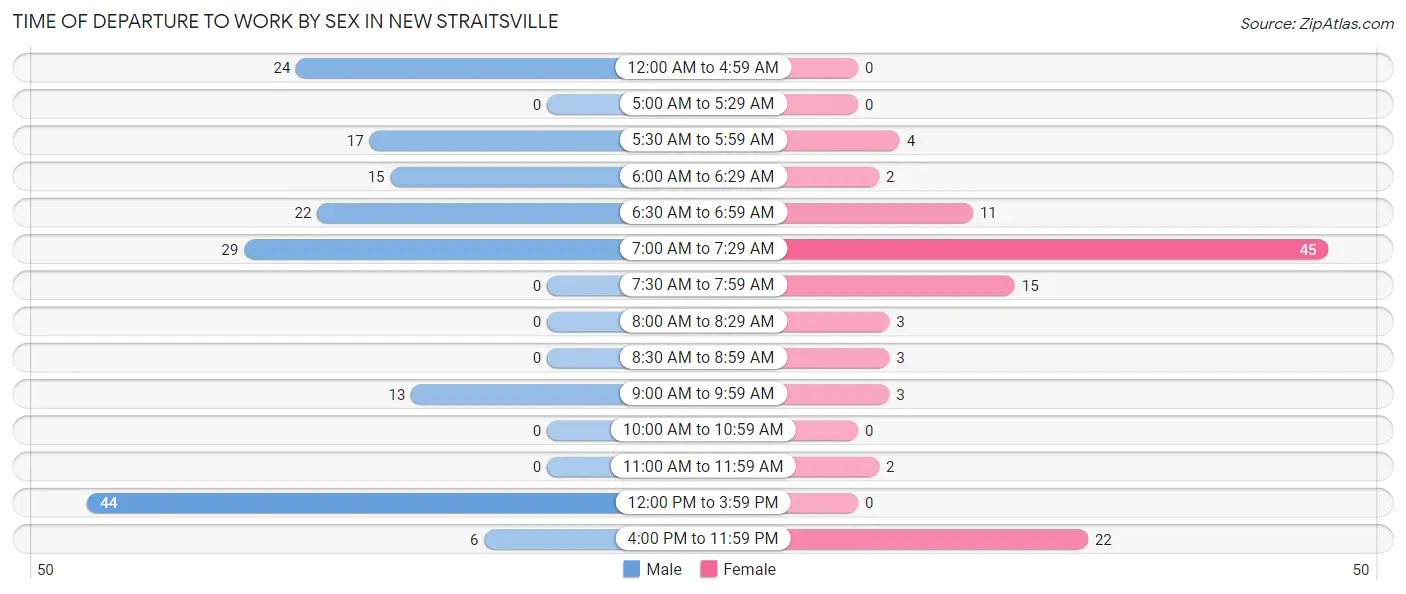
| Time of Departure | Male | Female |
| 12:00 AM to 4:59 AM | 24 (14.1%) | 0 (0.0%) |
| 5:00 AM to 5:29 AM | 0 (0.0%) | 0 (0.0%) |
| 5:30 AM to 5:59 AM | 17 (10.0%) | 4 (3.6%) |
| 6:00 AM to 6:29 AM | 15 (8.8%) | 2 (1.8%) |
| 6:30 AM to 6:59 AM | 22 (12.9%) | 11 (10.0%) |
| 7:00 AM to 7:29 AM | 29 (17.1%) | 45 (40.9%) |
| 7:30 AM to 7:59 AM | 0 (0.0%) | 15 (13.6%) |
| 8:00 AM to 8:29 AM | 0 (0.0%) | 3 (2.7%) |
| 8:30 AM to 8:59 AM | 0 (0.0%) | 3 (2.7%) |
| 9:00 AM to 9:59 AM | 13 (7.6%) | 3 (2.7%) |
| 10:00 AM to 10:59 AM | 0 (0.0%) | 0 (0.0%) |
| 11:00 AM to 11:59 AM | 0 (0.0%) | 2 (1.8%) |
| 12:00 PM to 3:59 PM | 44 (25.9%) | 0 (0.0%) |
| 4:00 PM to 11:59 PM | 6 (3.5%) | 22 (20.0%) |
| Total | 170 (100.0%) | 110 (100.0%) |
Housing Occupancy in New Straitsville
Occupancy by Ownership in New Straitsville
Of the total 319 dwellings in New Straitsville, owner-occupied units account for 173 (54.2%), while renter-occupied units make up 146 (45.8%).
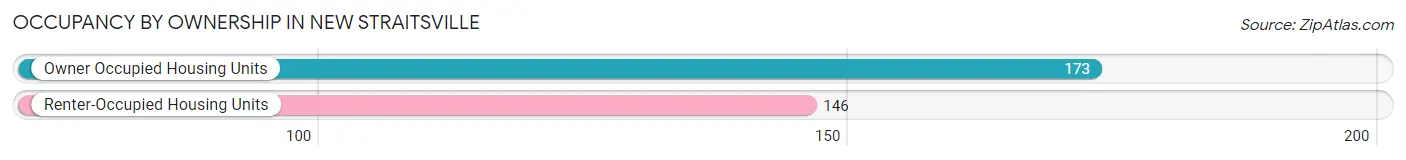
| Occupancy | # Housing Units | % Housing Units |
| Owner Occupied Housing Units | 173 | 54.2% |
| Renter-Occupied Housing Units | 146 | 45.8% |
| Total Occupied Housing Units | 319 | 100.0% |
Occupancy by Household Size in New Straitsville
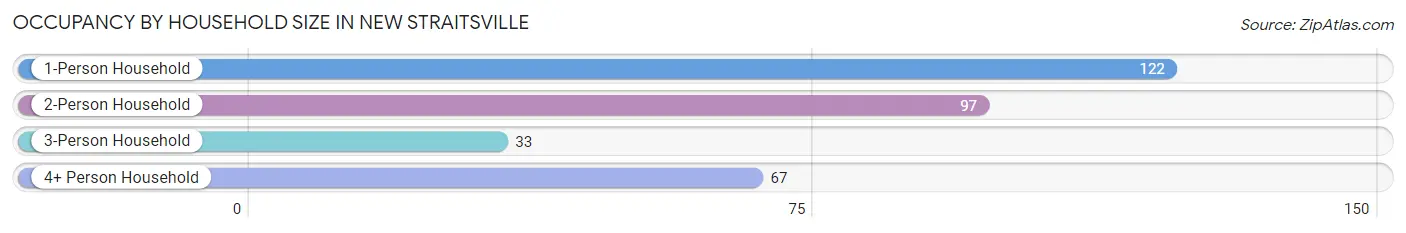
| Household Size | # Housing Units | % Housing Units |
| 1-Person Household | 122 | 38.2% |
| 2-Person Household | 97 | 30.4% |
| 3-Person Household | 33 | 10.3% |
| 4+ Person Household | 67 | 21.0% |
| Total Housing Units | 319 | 100.0% |
Occupancy by Ownership by Household Size in New Straitsville
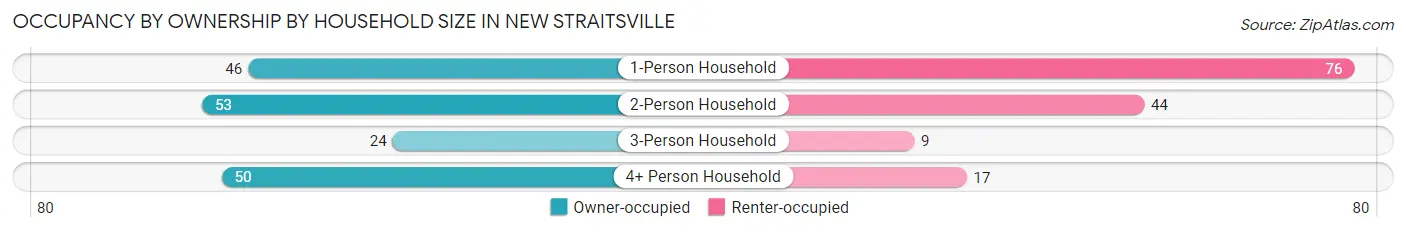
| Household Size | Owner-occupied | Renter-occupied |
| 1-Person Household | 46 (37.7%) | 76 (62.3%) |
| 2-Person Household | 53 (54.6%) | 44 (45.4%) |
| 3-Person Household | 24 (72.7%) | 9 (27.3%) |
| 4+ Person Household | 50 (74.6%) | 17 (25.4%) |
| Total Housing Units | 173 (54.2%) | 146 (45.8%) |
Occupancy by Educational Attainment in New Straitsville
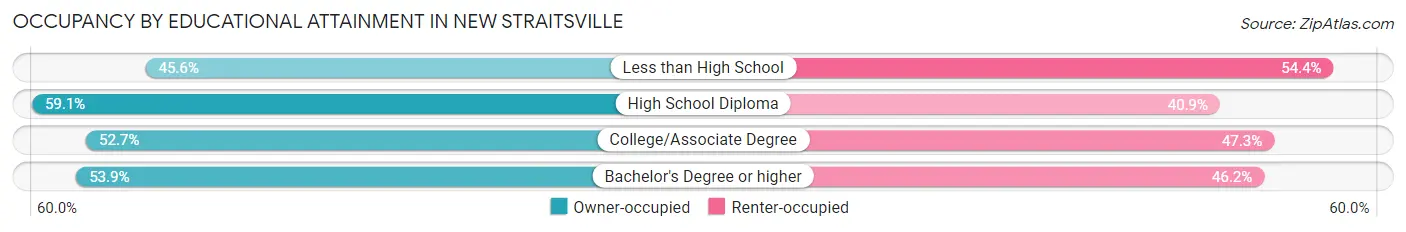
| Household Size | Owner-occupied | Renter-occupied |
| Less than High School | 26 (45.6%) | 31 (54.4%) |
| High School Diploma | 81 (59.1%) | 56 (40.9%) |
| College/Associate Degree | 59 (52.7%) | 53 (47.3%) |
| Bachelor's Degree or higher | 7 (53.8%) | 6 (46.2%) |
Occupancy by Age of Householder in New Straitsville
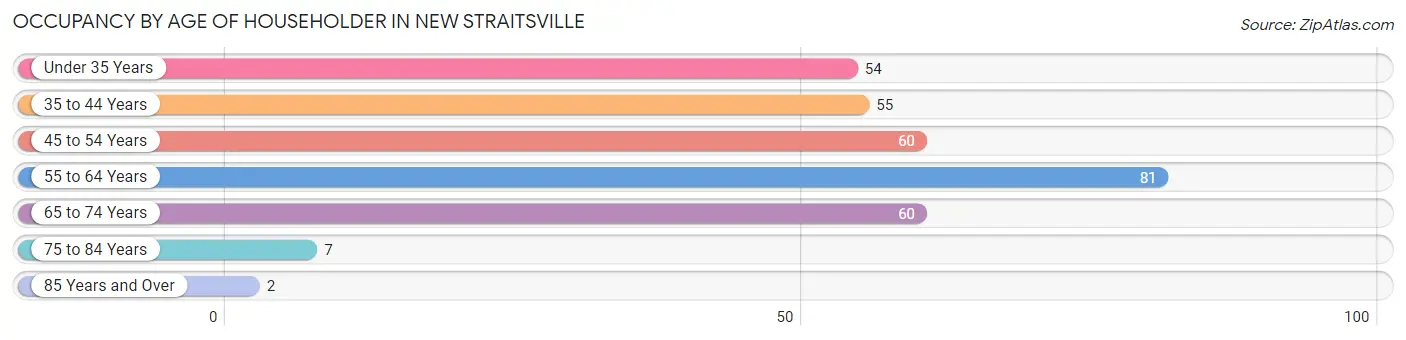
| Age Bracket | # Households | % Households |
| Under 35 Years | 54 | 16.9% |
| 35 to 44 Years | 55 | 17.2% |
| 45 to 54 Years | 60 | 18.8% |
| 55 to 64 Years | 81 | 25.4% |
| 65 to 74 Years | 60 | 18.8% |
| 75 to 84 Years | 7 | 2.2% |
| 85 Years and Over | 2 | 0.6% |
| Total | 319 | 100.0% |
Housing Finances in New Straitsville
Median Income by Occupancy in New Straitsville
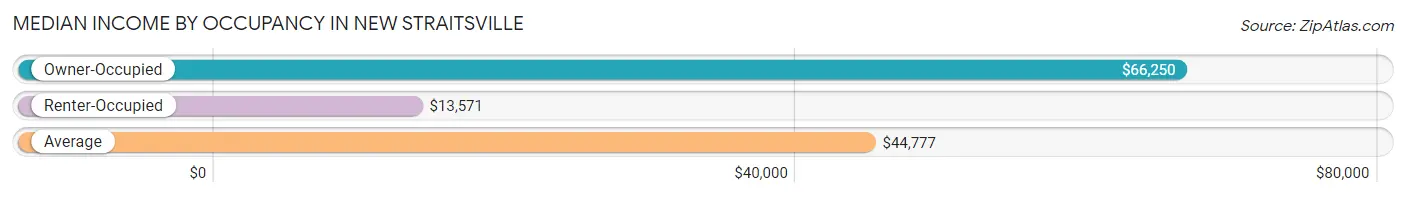
| Occupancy Type | # Households | Median Income |
| Owner-Occupied | 173 (54.2%) | $66,250 |
| Renter-Occupied | 146 (45.8%) | $13,571 |
| Average | 319 (100.0%) | $44,777 |
Occupancy by Householder Income Bracket in New Straitsville
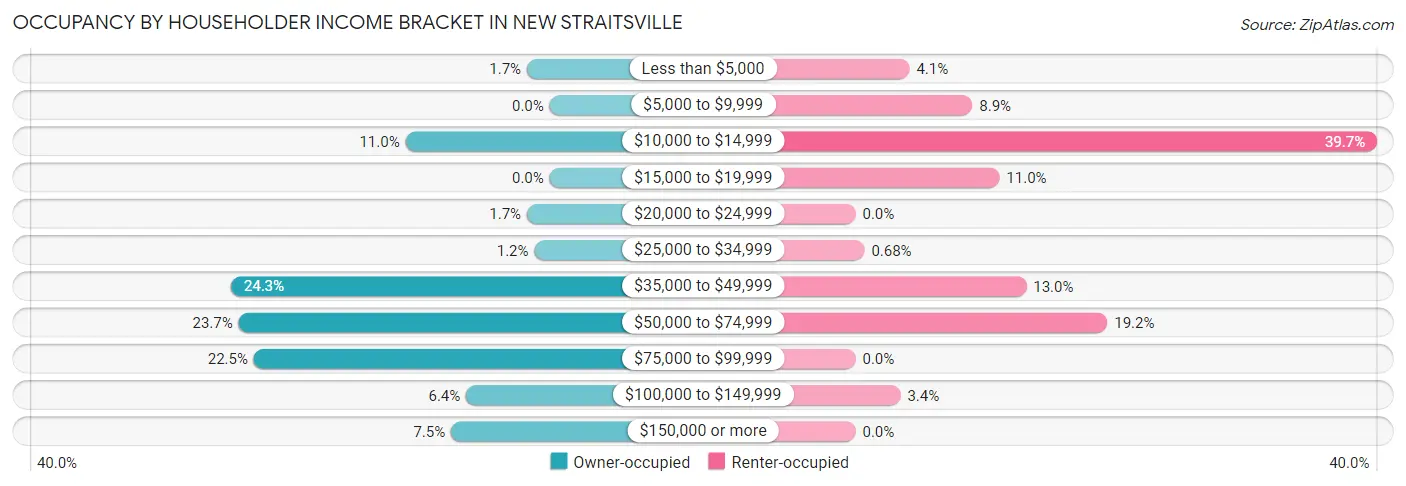
| Income Bracket | Owner-occupied | Renter-occupied |
| Less than $5,000 | 3 (1.7%) | 6 (4.1%) |
| $5,000 to $9,999 | 0 (0.0%) | 13 (8.9%) |
| $10,000 to $14,999 | 19 (11.0%) | 58 (39.7%) |
| $15,000 to $19,999 | 0 (0.0%) | 16 (11.0%) |
| $20,000 to $24,999 | 3 (1.7%) | 0 (0.0%) |
| $25,000 to $34,999 | 2 (1.2%) | 1 (0.7%) |
| $35,000 to $49,999 | 42 (24.3%) | 19 (13.0%) |
| $50,000 to $74,999 | 41 (23.7%) | 28 (19.2%) |
| $75,000 to $99,999 | 39 (22.5%) | 0 (0.0%) |
| $100,000 to $149,999 | 11 (6.4%) | 5 (3.4%) |
| $150,000 or more | 13 (7.5%) | 0 (0.0%) |
| Total | 173 (100.0%) | 146 (100.0%) |
Monthly Housing Cost Tiers in New Straitsville
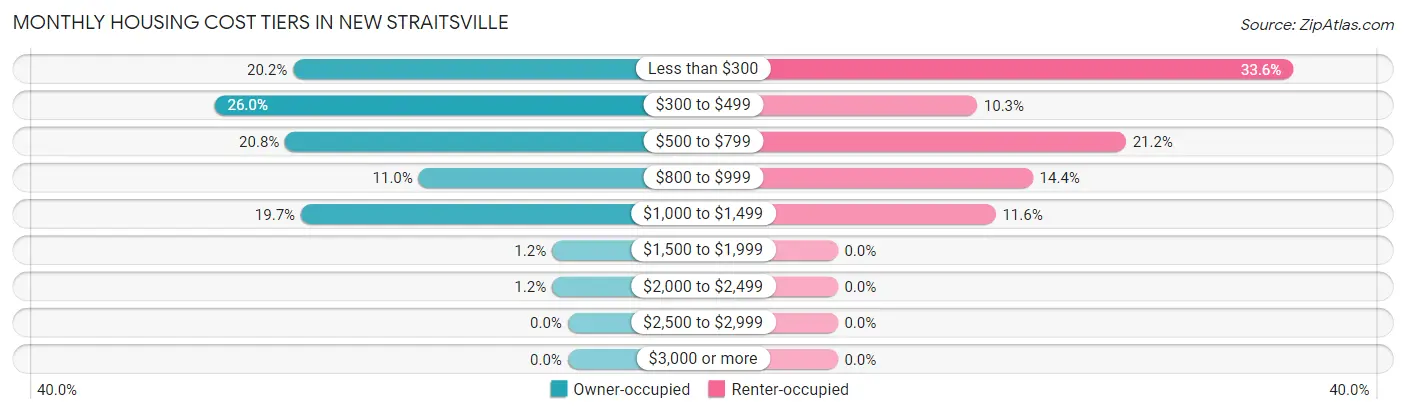
| Monthly Cost | Owner-occupied | Renter-occupied |
| Less than $300 | 35 (20.2%) | 49 (33.6%) |
| $300 to $499 | 45 (26.0%) | 15 (10.3%) |
| $500 to $799 | 36 (20.8%) | 31 (21.2%) |
| $800 to $999 | 19 (11.0%) | 21 (14.4%) |
| $1,000 to $1,499 | 34 (19.7%) | 17 (11.6%) |
| $1,500 to $1,999 | 2 (1.2%) | 0 (0.0%) |
| $2,000 to $2,499 | 2 (1.2%) | 0 (0.0%) |
| $2,500 to $2,999 | 0 (0.0%) | 0 (0.0%) |
| $3,000 or more | 0 (0.0%) | 0 (0.0%) |
| Total | 173 (100.0%) | 146 (100.0%) |
Physical Housing Characteristics in New Straitsville
Housing Structures in New Straitsville
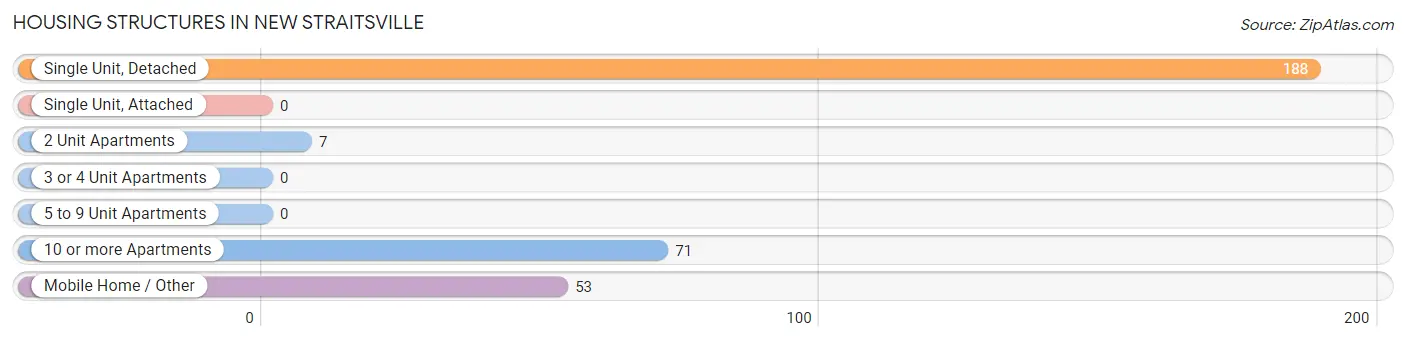
| Structure Type | # Housing Units | % Housing Units |
| Single Unit, Detached | 188 | 58.9% |
| Single Unit, Attached | 0 | 0.0% |
| 2 Unit Apartments | 7 | 2.2% |
| 3 or 4 Unit Apartments | 0 | 0.0% |
| 5 to 9 Unit Apartments | 0 | 0.0% |
| 10 or more Apartments | 71 | 22.3% |
| Mobile Home / Other | 53 | 16.6% |
| Total | 319 | 100.0% |
Housing Structures by Occupancy in New Straitsville
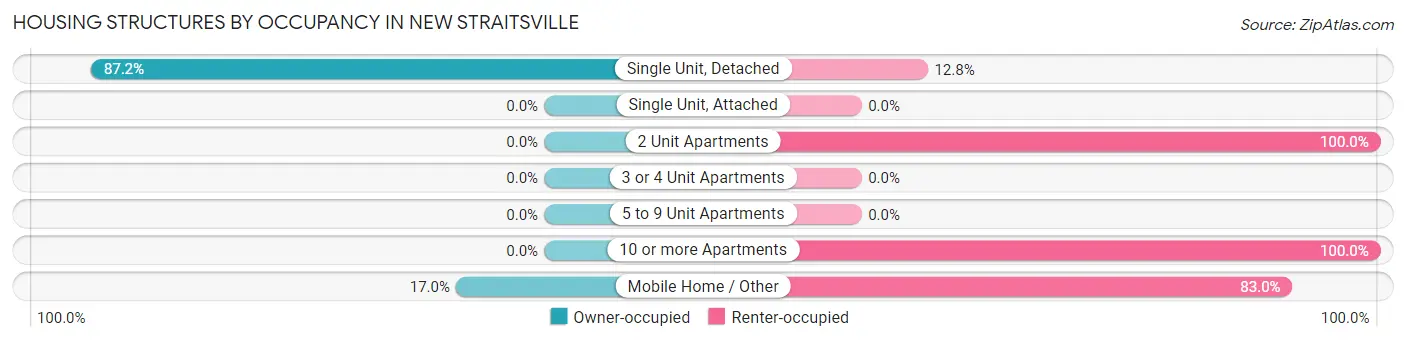
| Structure Type | Owner-occupied | Renter-occupied |
| Single Unit, Detached | 164 (87.2%) | 24 (12.8%) |
| Single Unit, Attached | 0 (0.0%) | 0 (0.0%) |
| 2 Unit Apartments | 0 (0.0%) | 7 (100.0%) |
| 3 or 4 Unit Apartments | 0 (0.0%) | 0 (0.0%) |
| 5 to 9 Unit Apartments | 0 (0.0%) | 0 (0.0%) |
| 10 or more Apartments | 0 (0.0%) | 71 (100.0%) |
| Mobile Home / Other | 9 (17.0%) | 44 (83.0%) |
| Total | 173 (54.2%) | 146 (45.8%) |
Housing Structures by Number of Rooms in New Straitsville
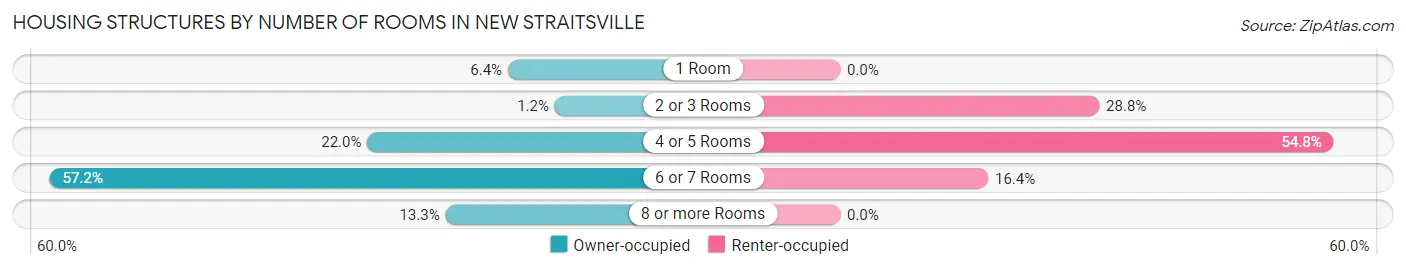
| Number of Rooms | Owner-occupied | Renter-occupied |
| 1 Room | 11 (6.4%) | 0 (0.0%) |
| 2 or 3 Rooms | 2 (1.2%) | 42 (28.8%) |
| 4 or 5 Rooms | 38 (22.0%) | 80 (54.8%) |
| 6 or 7 Rooms | 99 (57.2%) | 24 (16.4%) |
| 8 or more Rooms | 23 (13.3%) | 0 (0.0%) |
| Total | 173 (100.0%) | 146 (100.0%) |
Housing Structure by Heating Type in New Straitsville
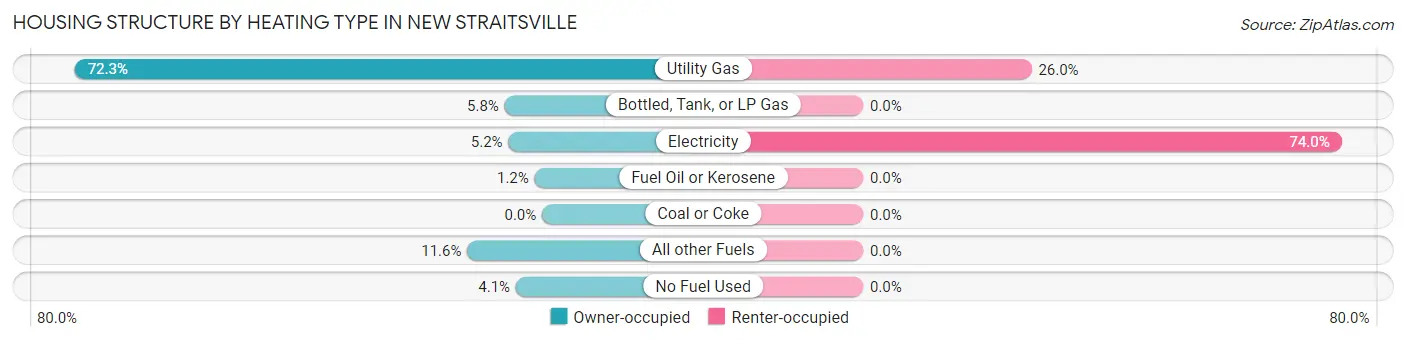
| Heating Type | Owner-occupied | Renter-occupied |
| Utility Gas | 125 (72.3%) | 38 (26.0%) |
| Bottled, Tank, or LP Gas | 10 (5.8%) | 0 (0.0%) |
| Electricity | 9 (5.2%) | 108 (74.0%) |
| Fuel Oil or Kerosene | 2 (1.2%) | 0 (0.0%) |
| Coal or Coke | 0 (0.0%) | 0 (0.0%) |
| All other Fuels | 20 (11.6%) | 0 (0.0%) |
| No Fuel Used | 7 (4.1%) | 0 (0.0%) |
| Total | 173 (100.0%) | 146 (100.0%) |
Household Vehicle Usage in New Straitsville
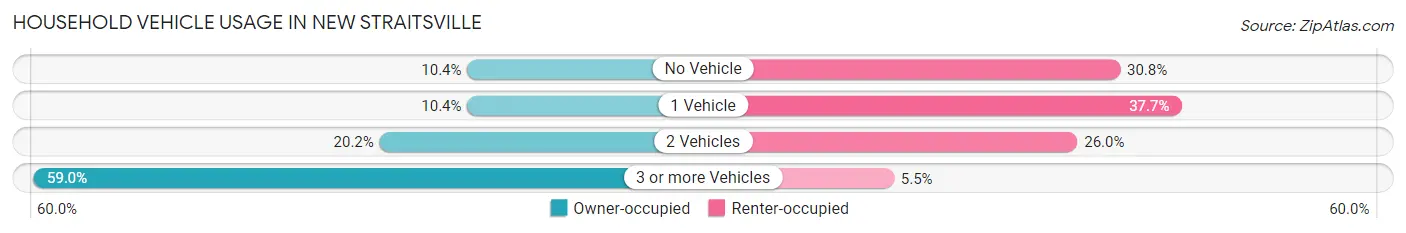
| Vehicles per Household | Owner-occupied | Renter-occupied |
| No Vehicle | 18 (10.4%) | 45 (30.8%) |
| 1 Vehicle | 18 (10.4%) | 55 (37.7%) |
| 2 Vehicles | 35 (20.2%) | 38 (26.0%) |
| 3 or more Vehicles | 102 (59.0%) | 8 (5.5%) |
| Total | 173 (100.0%) | 146 (100.0%) |
Real Estate & Mortgages in New Straitsville
Real Estate and Mortgage Overview in New Straitsville
| Characteristic | Without Mortgage | With Mortgage |
| Housing Units | 86 | 87 |
| Median Property Value | $46,000 | $81,700 |
| Median Household Income | $47,143 | $10 |
| Monthly Housing Costs | $340 | $0 |
| Real Estate Taxes | $850 | $2 |
Property Value by Mortgage Status in New Straitsville
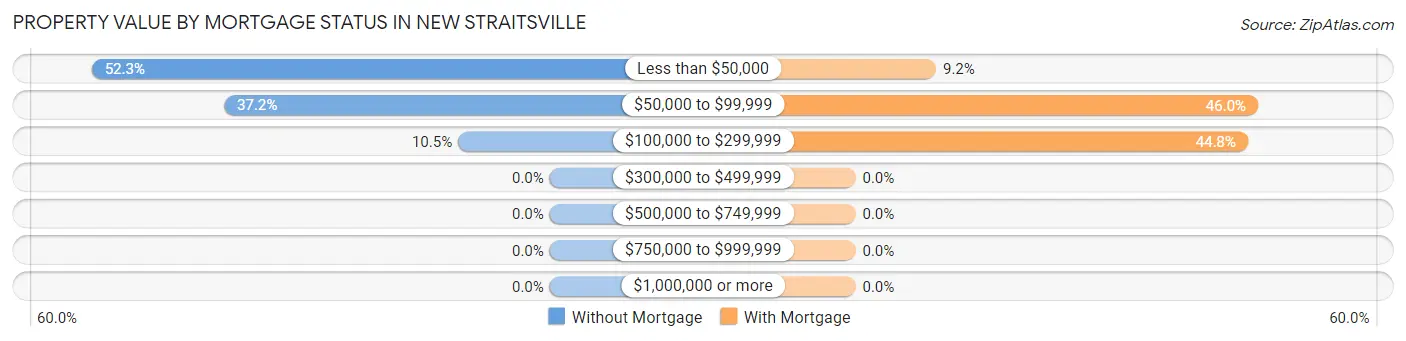
| Property Value | Without Mortgage | With Mortgage |
| Less than $50,000 | 45 (52.3%) | 8 (9.2%) |
| $50,000 to $99,999 | 32 (37.2%) | 40 (46.0%) |
| $100,000 to $299,999 | 9 (10.5%) | 39 (44.8%) |
| $300,000 to $499,999 | 0 (0.0%) | 0 (0.0%) |
| $500,000 to $749,999 | 0 (0.0%) | 0 (0.0%) |
| $750,000 to $999,999 | 0 (0.0%) | 0 (0.0%) |
| $1,000,000 or more | 0 (0.0%) | 0 (0.0%) |
| Total | 86 (100.0%) | 87 (100.0%) |
Household Income by Mortgage Status in New Straitsville
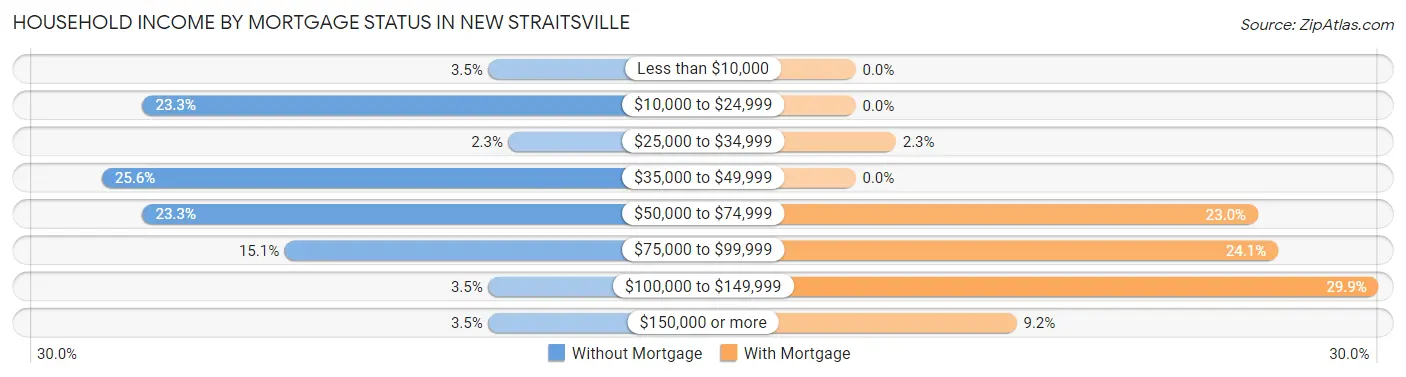
| Household Income | Without Mortgage | With Mortgage |
| Less than $10,000 | 3 (3.5%) | 0 (0.0%) |
| $10,000 to $24,999 | 20 (23.3%) | 0 (0.0%) |
| $25,000 to $34,999 | 2 (2.3%) | 2 (2.3%) |
| $35,000 to $49,999 | 22 (25.6%) | 0 (0.0%) |
| $50,000 to $74,999 | 20 (23.3%) | 20 (23.0%) |
| $75,000 to $99,999 | 13 (15.1%) | 21 (24.1%) |
| $100,000 to $149,999 | 3 (3.5%) | 26 (29.9%) |
| $150,000 or more | 3 (3.5%) | 8 (9.2%) |
| Total | 86 (100.0%) | 87 (100.0%) |
Property Value to Household Income Ratio in New Straitsville
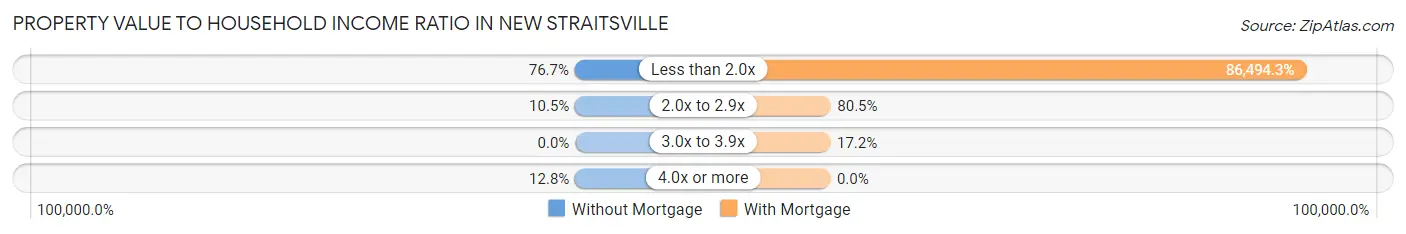
| Value-to-Income Ratio | Without Mortgage | With Mortgage |
| Less than 2.0x | 66 (76.7%) | 75,250 (86,494.2%) |
| 2.0x to 2.9x | 9 (10.5%) | 70 (80.5%) |
| 3.0x to 3.9x | 0 (0.0%) | 15 (17.2%) |
| 4.0x or more | 11 (12.8%) | 0 (0.0%) |
| Total | 86 (100.0%) | 87 (100.0%) |
Real Estate Taxes by Mortgage Status in New Straitsville
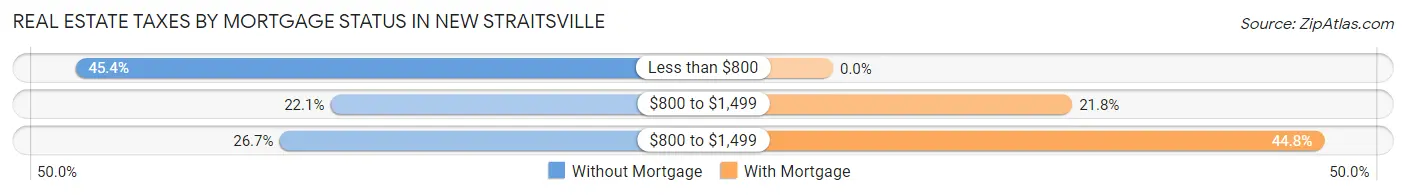
| Property Taxes | Without Mortgage | With Mortgage |
| Less than $800 | 39 (45.4%) | 0 (0.0%) |
| $800 to $1,499 | 19 (22.1%) | 19 (21.8%) |
| $800 to $1,499 | 23 (26.7%) | 39 (44.8%) |
| Total | 86 (100.0%) | 87 (100.0%) |
Health & Disability in New Straitsville
Health Insurance Coverage by Age in New Straitsville
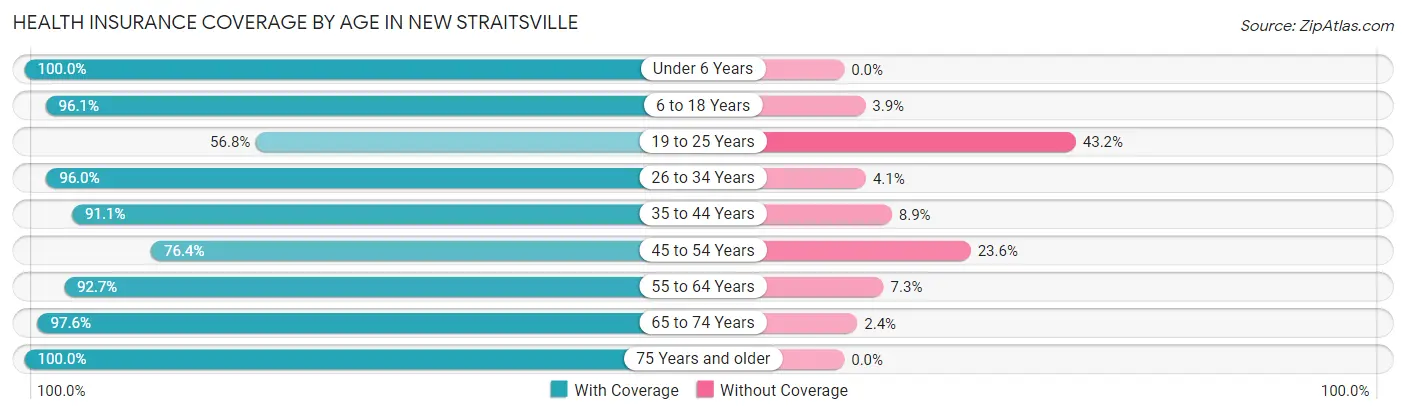
| Age Bracket | With Coverage | Without Coverage |
| Under 6 Years | 18 (100.0%) | 0 (0.0%) |
| 6 to 18 Years | 147 (96.1%) | 6 (3.9%) |
| 19 to 25 Years | 50 (56.8%) | 38 (43.2%) |
| 26 to 34 Years | 71 (96.0%) | 3 (4.1%) |
| 35 to 44 Years | 113 (91.1%) | 11 (8.9%) |
| 45 to 54 Years | 81 (76.4%) | 25 (23.6%) |
| 55 to 64 Years | 101 (92.7%) | 8 (7.3%) |
| 65 to 74 Years | 80 (97.6%) | 2 (2.4%) |
| 75 Years and older | 10 (100.0%) | 0 (0.0%) |
| Total | 671 (87.8%) | 93 (12.2%) |
Health Insurance Coverage by Citizenship Status in New Straitsville
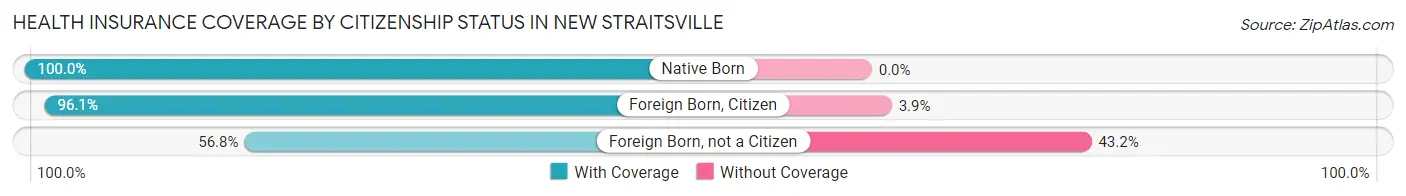
| Citizenship Status | With Coverage | Without Coverage |
| Native Born | 18 (100.0%) | 0 (0.0%) |
| Foreign Born, Citizen | 147 (96.1%) | 6 (3.9%) |
| Foreign Born, not a Citizen | 50 (56.8%) | 38 (43.2%) |
Health Insurance Coverage by Household Income in New Straitsville
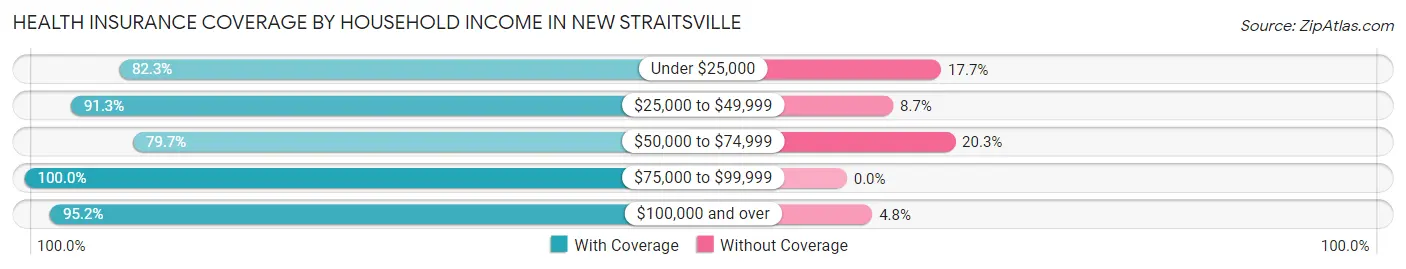
| Household Income | With Coverage | Without Coverage |
| Under $25,000 | 163 (82.3%) | 35 (17.7%) |
| $25,000 to $49,999 | 137 (91.3%) | 13 (8.7%) |
| $50,000 to $74,999 | 161 (79.7%) | 41 (20.3%) |
| $75,000 to $99,999 | 130 (100.0%) | 0 (0.0%) |
| $100,000 and over | 80 (95.2%) | 4 (4.8%) |
Public vs Private Health Insurance Coverage by Age in New Straitsville
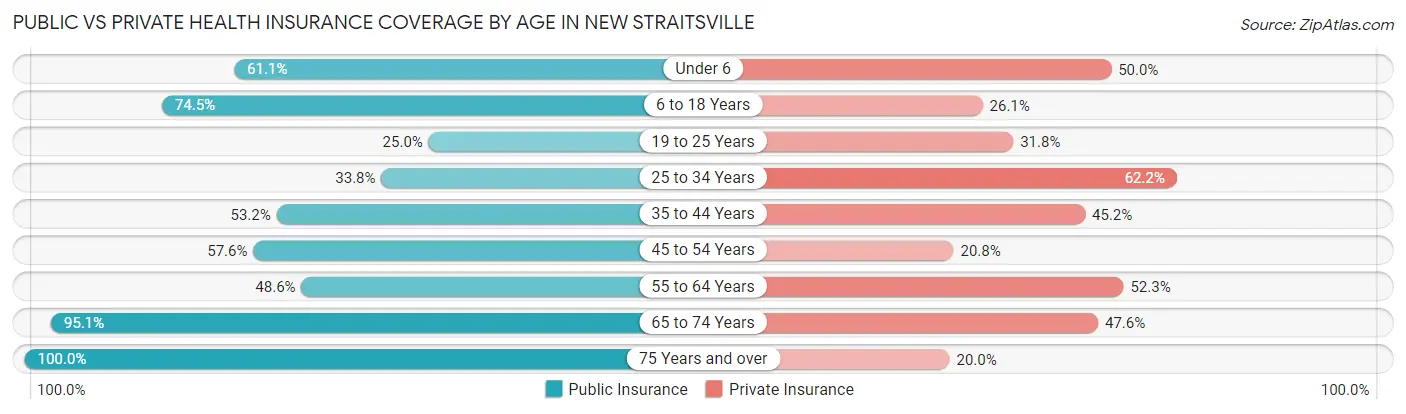
| Age Bracket | Public Insurance | Private Insurance |
| Under 6 | 11 (61.1%) | 9 (50.0%) |
| 6 to 18 Years | 114 (74.5%) | 40 (26.1%) |
| 19 to 25 Years | 22 (25.0%) | 28 (31.8%) |
| 25 to 34 Years | 25 (33.8%) | 46 (62.2%) |
| 35 to 44 Years | 66 (53.2%) | 56 (45.2%) |
| 45 to 54 Years | 61 (57.6%) | 22 (20.7%) |
| 55 to 64 Years | 53 (48.6%) | 57 (52.3%) |
| 65 to 74 Years | 78 (95.1%) | 39 (47.6%) |
| 75 Years and over | 10 (100.0%) | 2 (20.0%) |
| Total | 440 (57.6%) | 299 (39.1%) |
Disability Status by Sex by Age in New Straitsville
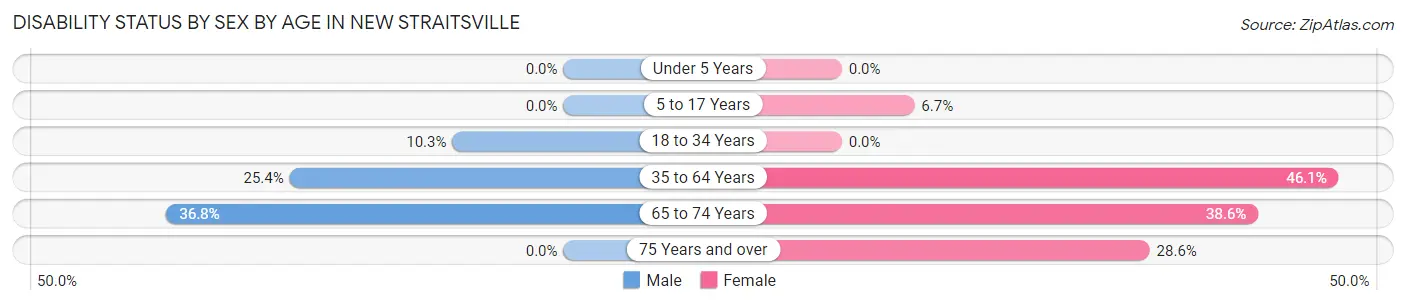
| Age Bracket | Male | Female |
| Under 5 Years | 0 (0.0%) | 0 (0.0%) |
| 5 to 17 Years | 0 (0.0%) | 6 (6.7%) |
| 18 to 34 Years | 10 (10.3%) | 0 (0.0%) |
| 35 to 64 Years | 47 (25.4%) | 71 (46.1%) |
| 65 to 74 Years | 14 (36.8%) | 17 (38.6%) |
| 75 Years and over | 0 (0.0%) | 2 (28.6%) |
Disability Class by Sex by Age in New Straitsville
Disability Class: Hearing Difficulty
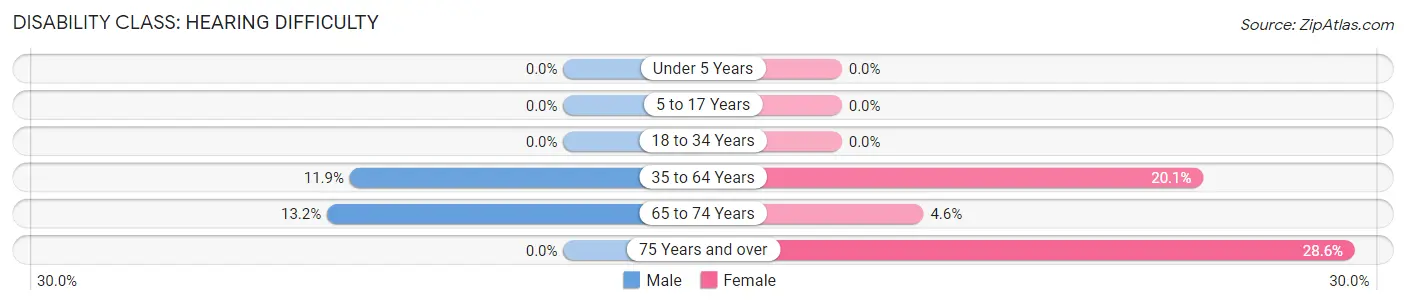
| Age Bracket | Male | Female |
| Under 5 Years | 0 (0.0%) | 0 (0.0%) |
| 5 to 17 Years | 0 (0.0%) | 0 (0.0%) |
| 18 to 34 Years | 0 (0.0%) | 0 (0.0%) |
| 35 to 64 Years | 22 (11.9%) | 31 (20.1%) |
| 65 to 74 Years | 5 (13.2%) | 2 (4.5%) |
| 75 Years and over | 0 (0.0%) | 2 (28.6%) |
Disability Class: Vision Difficulty
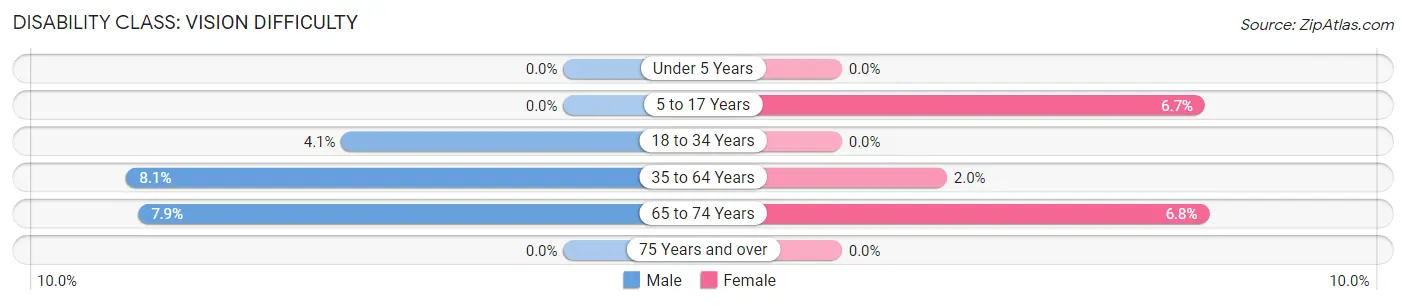
| Age Bracket | Male | Female |
| Under 5 Years | 0 (0.0%) | 0 (0.0%) |
| 5 to 17 Years | 0 (0.0%) | 6 (6.7%) |
| 18 to 34 Years | 4 (4.1%) | 0 (0.0%) |
| 35 to 64 Years | 15 (8.1%) | 3 (1.9%) |
| 65 to 74 Years | 3 (7.9%) | 3 (6.8%) |
| 75 Years and over | 0 (0.0%) | 0 (0.0%) |
Disability Class: Cognitive Difficulty
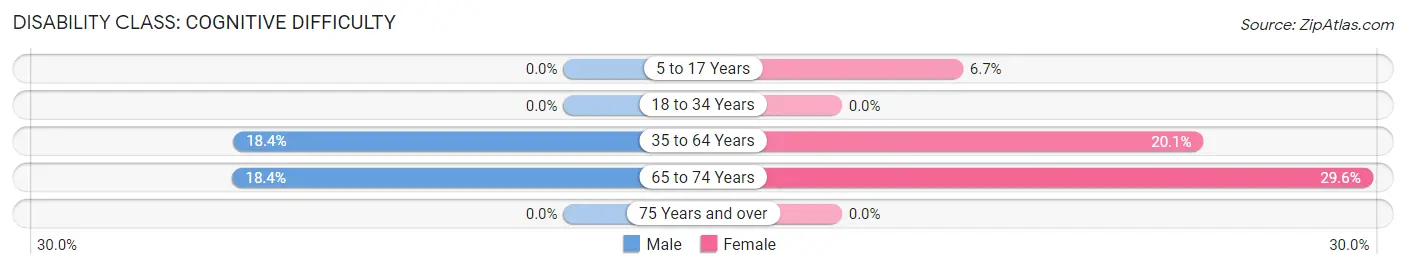
| Age Bracket | Male | Female |
| 5 to 17 Years | 0 (0.0%) | 6 (6.7%) |
| 18 to 34 Years | 0 (0.0%) | 0 (0.0%) |
| 35 to 64 Years | 34 (18.4%) | 31 (20.1%) |
| 65 to 74 Years | 7 (18.4%) | 13 (29.5%) |
| 75 Years and over | 0 (0.0%) | 0 (0.0%) |
Disability Class: Ambulatory Difficulty
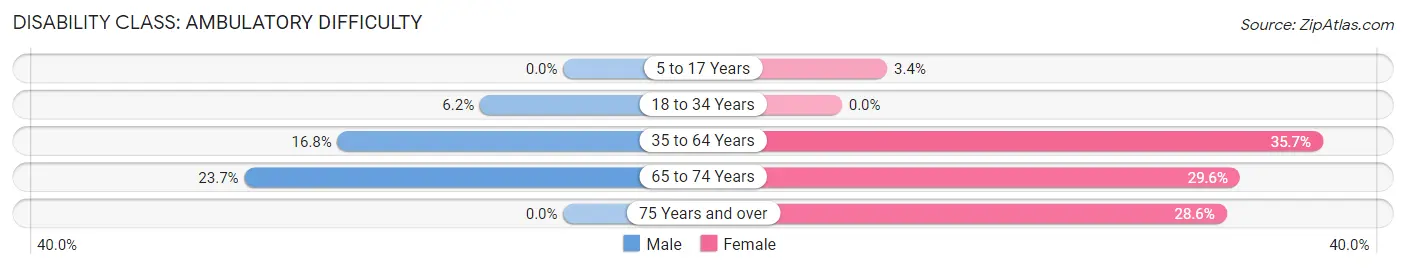
| Age Bracket | Male | Female |
| 5 to 17 Years | 0 (0.0%) | 3 (3.4%) |
| 18 to 34 Years | 6 (6.2%) | 0 (0.0%) |
| 35 to 64 Years | 31 (16.8%) | 55 (35.7%) |
| 65 to 74 Years | 9 (23.7%) | 13 (29.5%) |
| 75 Years and over | 0 (0.0%) | 2 (28.6%) |
Disability Class: Self-Care Difficulty
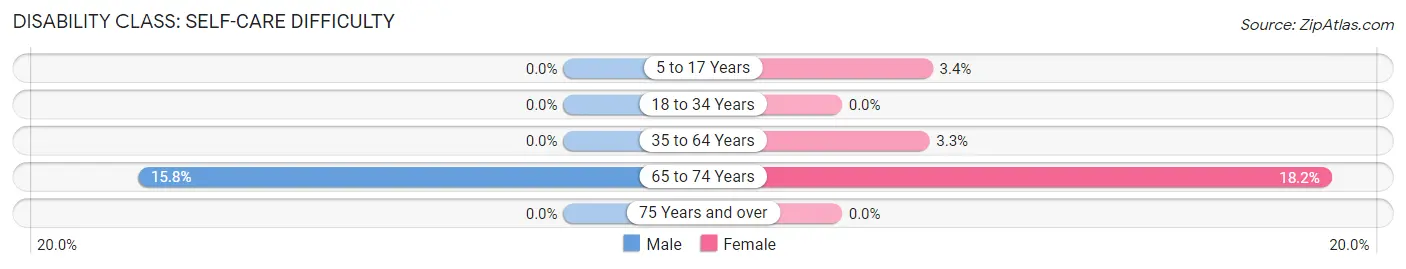
| Age Bracket | Male | Female |
| 5 to 17 Years | 0 (0.0%) | 3 (3.4%) |
| 18 to 34 Years | 0 (0.0%) | 0 (0.0%) |
| 35 to 64 Years | 0 (0.0%) | 5 (3.3%) |
| 65 to 74 Years | 6 (15.8%) | 8 (18.2%) |
| 75 Years and over | 0 (0.0%) | 0 (0.0%) |
Technology Access in New Straitsville
Computing Device Access in New Straitsville
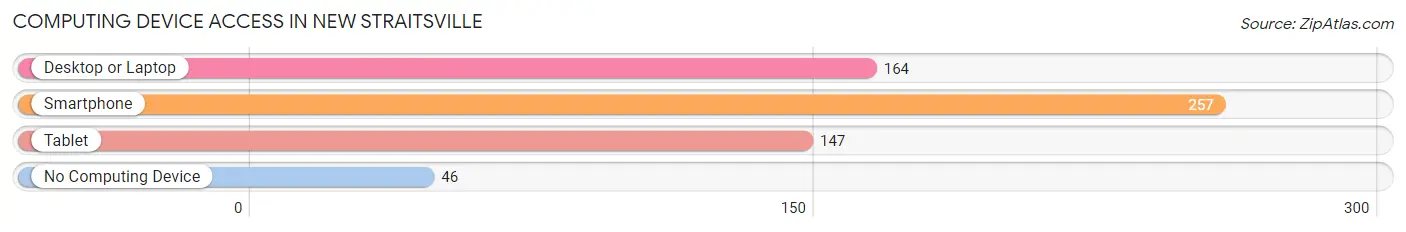
| Device Type | # Households | % Households |
| Desktop or Laptop | 164 | 51.4% |
| Smartphone | 257 | 80.6% |
| Tablet | 147 | 46.1% |
| No Computing Device | 46 | 14.4% |
| Total | 319 | 100.0% |
Internet Access in New Straitsville
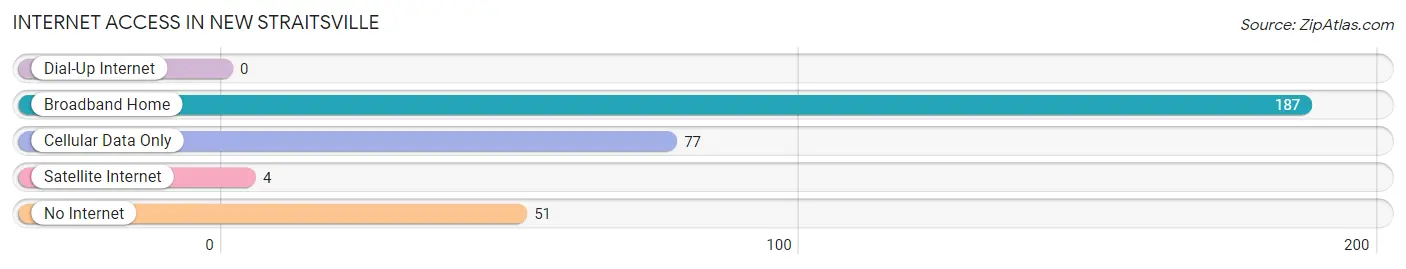
| Internet Type | # Households | % Households |
| Dial-Up Internet | 0 | 0.0% |
| Broadband Home | 187 | 58.6% |
| Cellular Data Only | 77 | 24.1% |
| Satellite Internet | 4 | 1.3% |
| No Internet | 51 | 16.0% |
| Total | 319 | 100.0% |
New Straitsville Summary
New Straitsville is a small village located in Perry County, Ohio, United States. It is situated in the southeastern part of the state, approximately 40 miles southeast of Columbus. The village has a population of approximately 1,000 people and is part of the larger Perry County area.
History
New Straitsville was founded in 1845 by a group of settlers from Pennsylvania. The village was named after the Straits family, who were among the first settlers. The village was originally a coal mining town, and the coal industry was the main source of income for the town. The coal mines were owned by the Straits family, and the town was known as Straitsville.
In 1873, the town was renamed New Straitsville after the original Straitsville was destroyed by a fire. The town was rebuilt and the coal industry continued to be the main source of income for the town. The coal mines were eventually closed in the 1950s, and the town began to decline.
Geography
New Straitsville is located in southeastern Ohio, approximately 40 miles southeast of Columbus. The village is situated in the Appalachian foothills, and the terrain is mostly hilly and wooded. The village is located near the Hocking River, which is a tributary of the Ohio River.
The climate in New Straitsville is humid continental, with hot summers and cold winters. The average annual temperature is around 50 degrees Fahrenheit, and the average annual precipitation is around 40 inches.
Economy
The economy of New Straitsville is largely based on agriculture and tourism. The village is home to several small farms, and the surrounding area is known for its production of apples, peaches, and other fruits and vegetables. The village also has several small businesses, including restaurants, shops, and a few small manufacturing companies.
Tourism is also an important part of the economy of New Straitsville. The village is home to several historic sites, including the New Straitsville Historic District, which is listed on the National Register of Historic Places. The village also hosts several festivals and events throughout the year, including the New Straitsville Moonshine Festival, which celebrates the town’s history of moonshine production.
Demographics
As of the 2010 census, the population of New Straitsville was 1,000 people. The racial makeup of the village was 97.2% White, 0.7% African American, 0.2% Native American, 0.2% Asian, 0.2% from other races, and 1.7% from two or more races. The median household income was $31,250, and the median family income was $37,500.
New Straitsville is a small, rural village with a close-knit community. The village is home to several churches, and the residents are very active in the community. The village is also home to several parks and recreational areas, including the New Straitsville Community Park, which offers a variety of activities for residents and visitors.
Common Questions
What is the Total Population of New Straitsville?
Total Population of New Straitsville is 764.
What is the Total Male Population of New Straitsville?
Total Male Population of New Straitsville is 403.
What is the Total Female Population of New Straitsville?
Total Female Population of New Straitsville is 361.
What is the Ratio of Males per 100 Females in New Straitsville?
There are 111.63 Males per 100 Females in New Straitsville.
What is the Ratio of Females per 100 Males in New Straitsville?
There are 89.58 Females per 100 Males in New Straitsville.
What is the Median Population Age in New Straitsville?
Median Population Age in New Straitsville is 40.9 Years.
What is the Average Family Size in New Straitsville
Average Family Size in New Straitsville is 3.2 People.
What is the Average Household Size in New Straitsville
Average Household Size in New Straitsville is 2.4 People.
What is Per Capita Income in New Straitsville?
Per Capita income in New Straitsville is $21,556.
What is the Median Family Income in New Straitsville?
Median Family Income in New Straitsville is $58,523.
What is the Median Household income in New Straitsville?
Median Household Income in New Straitsville is $44,777.
What is Income or Wage Gap in New Straitsville?
Income or Wage Gap in New Straitsville is 38.8%.
Women in New Straitsville earn 61.2 cents for every dollar earned by a man.
What is Inequality or Gini Index in New Straitsville?
Inequality or Gini Index in New Straitsville is 0.44.
How Large is the Labor Force in New Straitsville?
There are 319 People in the Labor Forcein in New Straitsville.
What is the Percentage of People in the Labor Force in New Straitsville?
50.1% of People are in the Labor Force in New Straitsville.
What is the Unemployment Rate in New Straitsville?
Unemployment Rate in New Straitsville is 6.6%.