Butlerville, OH
Butlerville Map
Butlerville Overview
213
TOTAL POPULATION
92
MALE POPULATION
121
FEMALE POPULATION
76.03
MALES / 100 FEMALES
131.52
FEMALES / 100 MALES
34.1
MEDIAN AGE
3.0
AVG FAMILY SIZE
2.8
AVG HOUSEHOLD SIZE
$23,479
PER CAPITA INCOME
$64,000
AVG FAMILY INCOME
$63,523
AVG HOUSEHOLD INCOME
41.0%
WAGE / INCOME GAP [ % ]
59.0¢/ $1
WAGE / INCOME GAP [ $ ]
0.32
INEQUALITY / GINI INDEX
105
LABOR FORCE [ PEOPLE ]
65.2%
PERCENT IN LABOR FORCE
10.5%
UNEMPLOYMENT RATE
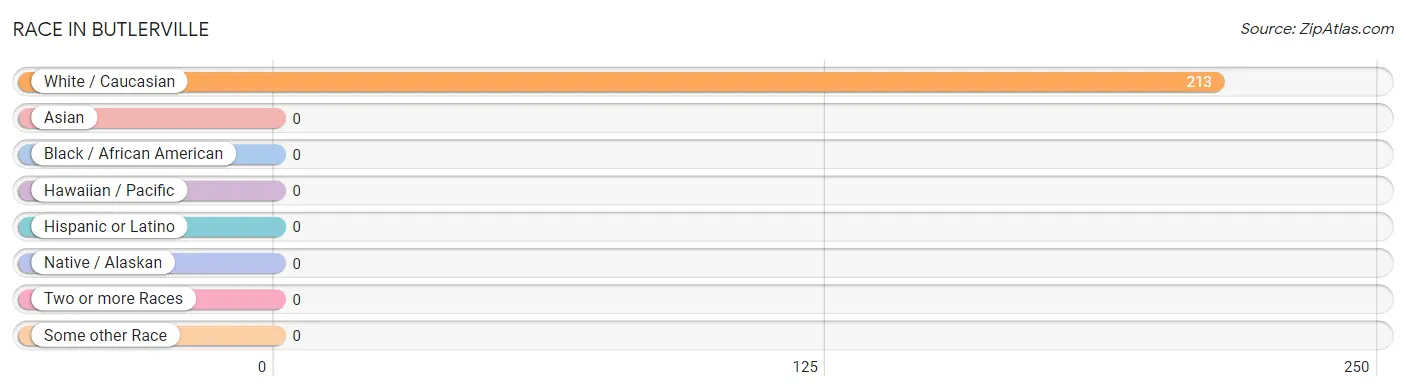
Race in Butlerville
The most populous races in Butlerville are , and White / Caucasian (213 | 100.0%).
| Race | # Population | % Population |
| Asian | 0 | 0.0% |
| Black / African American | 0 | 0.0% |
| Hawaiian / Pacific | 0 | 0.0% |
| Hispanic or Latino | 0 | 0.0% |
| Native / Alaskan | 0 | 0.0% |
| White / Caucasian | 213 | 100.0% |
| Two or more Races | 0 | 0.0% |
| Some other Race | 0 | 0.0% |
| Total | 213 | 100.0% |
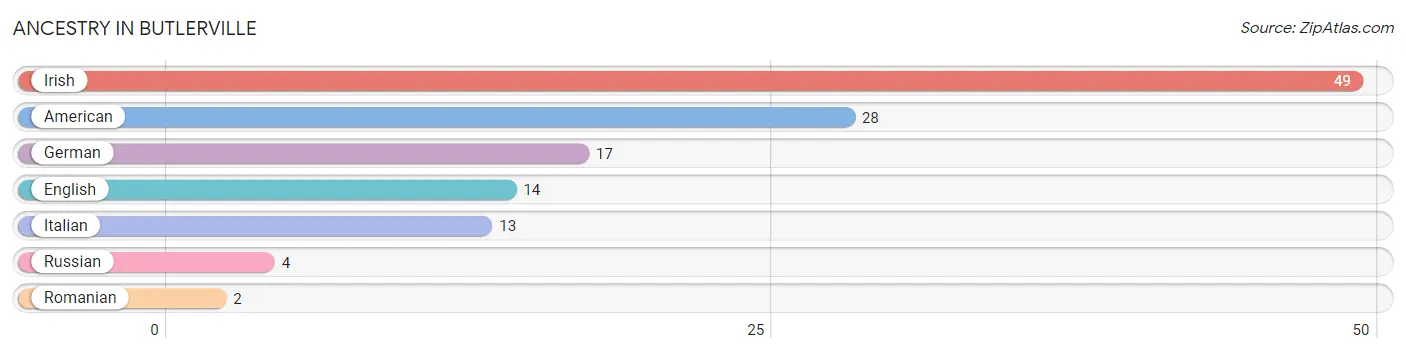
Ancestry in Butlerville
The most populous ancestries reported in Butlerville are Irish (49 | 23.0%), American (28 | 13.2%), German (17 | 8.0%), English (14 | 6.6%), and Italian (13 | 6.1%), together accounting for 56.8% of all Butlerville residents.
| Ancestry | # Population | % Population |
| American | 28 | 13.2% |
| English | 14 | 6.6% |
| German | 17 | 8.0% |
| Irish | 49 | 23.0% |
| Italian | 13 | 6.1% |
| Romanian | 2 | 0.9% |
| Russian | 4 | 1.9% | View All 7 Rows |
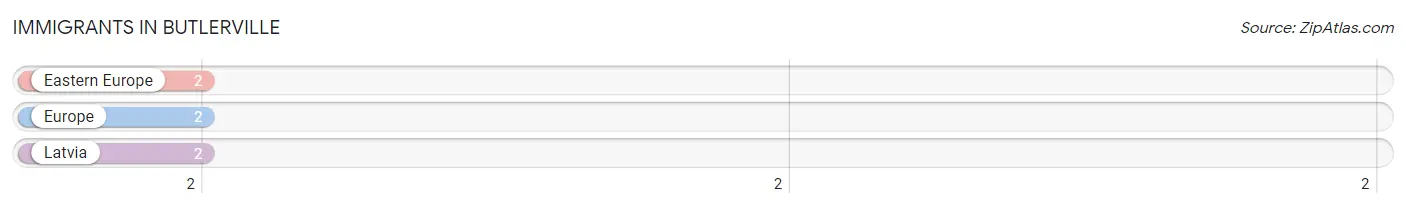
Immigrants in Butlerville
The most numerous immigrant groups reported in Butlerville came from Eastern Europe (2 | 0.9%), Europe (2 | 0.9%), and Latvia (2 | 0.9%), together accounting for 2.8% of all Butlerville residents.
| Immigration Origin | # Population | % Population |
| Eastern Europe | 2 | 0.9% |
| Europe | 2 | 0.9% |
| Latvia | 2 | 0.9% | View All 3 Rows |
Sex and Age in Butlerville
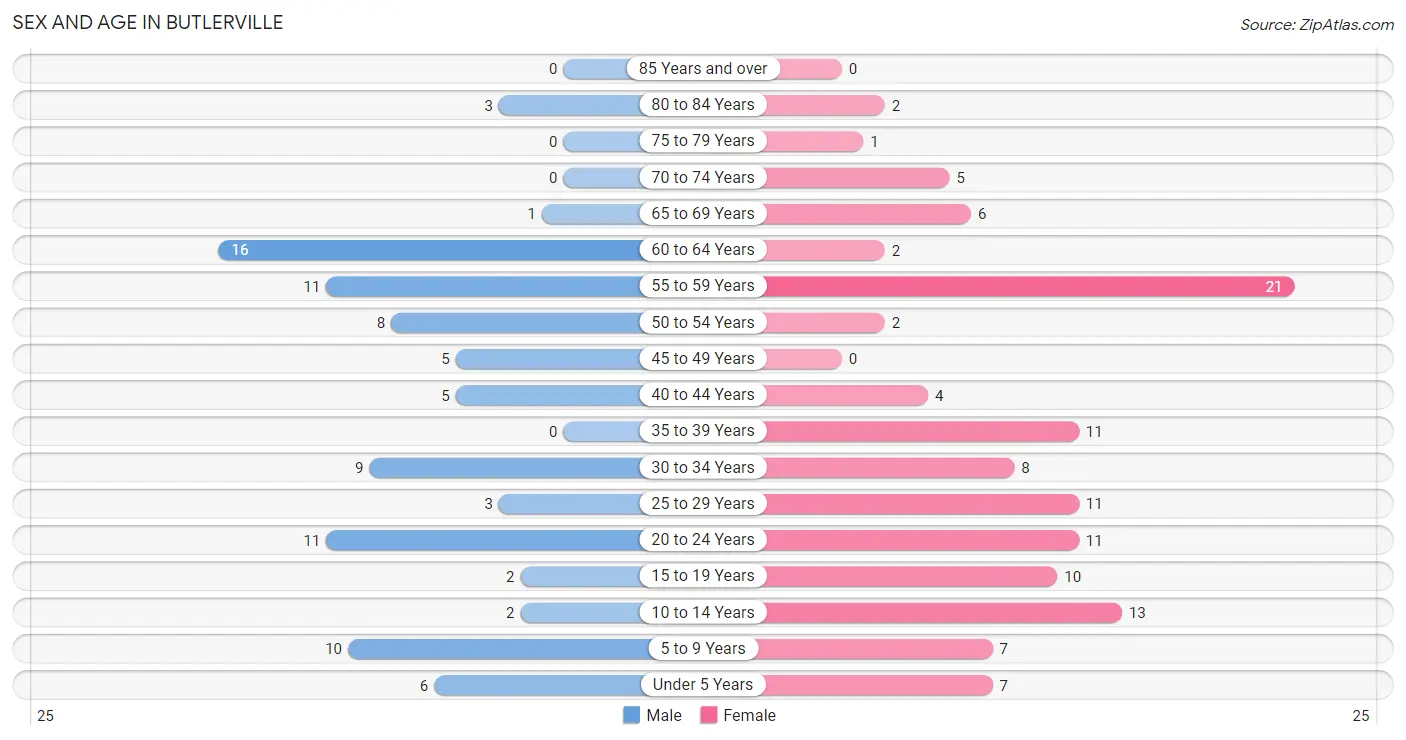
Sex and Age in Butlerville
The most populous age groups in Butlerville are 60 to 64 Years (16 | 17.4%) for men and 55 to 59 Years (21 | 17.4%) for women.
| Age Bracket | Male | Female |
| Under 5 Years | 6 (6.5%) | 7 (5.8%) |
| 5 to 9 Years | 10 (10.9%) | 7 (5.8%) |
| 10 to 14 Years | 2 (2.2%) | 13 (10.7%) |
| 15 to 19 Years | 2 (2.2%) | 10 (8.3%) |
| 20 to 24 Years | 11 (12.0%) | 11 (9.1%) |
| 25 to 29 Years | 3 (3.3%) | 11 (9.1%) |
| 30 to 34 Years | 9 (9.8%) | 8 (6.6%) |
| 35 to 39 Years | 0 (0.0%) | 11 (9.1%) |
| 40 to 44 Years | 5 (5.4%) | 4 (3.3%) |
| 45 to 49 Years | 5 (5.4%) | 0 (0.0%) |
| 50 to 54 Years | 8 (8.7%) | 2 (1.7%) |
| 55 to 59 Years | 11 (12.0%) | 21 (17.4%) |
| 60 to 64 Years | 16 (17.4%) | 2 (1.7%) |
| 65 to 69 Years | 1 (1.1%) | 6 (5.0%) |
| 70 to 74 Years | 0 (0.0%) | 5 (4.1%) |
| 75 to 79 Years | 0 (0.0%) | 1 (0.8%) |
| 80 to 84 Years | 3 (3.3%) | 2 (1.7%) |
| 85 Years and over | 0 (0.0%) | 0 (0.0%) |
| Total | 92 (100.0%) | 121 (100.0%) |
Families and Households in Butlerville
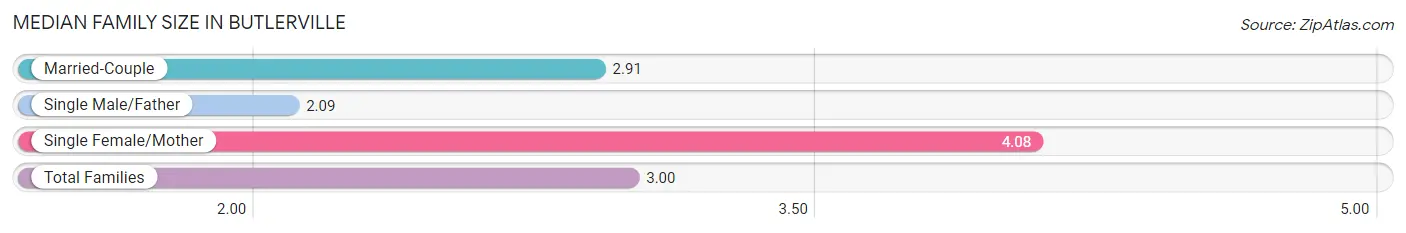
Median Family Size in Butlerville
The median family size in Butlerville is 3.00 persons per family, with single female/mother families (12 | 21.4%) accounting for the largest median family size of 4.08 persons per family. On the other hand, single male/father families (11 | 19.6%) represent the smallest median family size with 2.09 persons per family.
| Family Type | # Families | Family Size |
| Married-Couple | 33 (58.9%) | 2.91 |
| Single Male/Father | 11 (19.6%) | 2.09 |
| Single Female/Mother | 12 (21.4%) | 4.08 |
| Total Families | 56 (100.0%) | 3.00 |
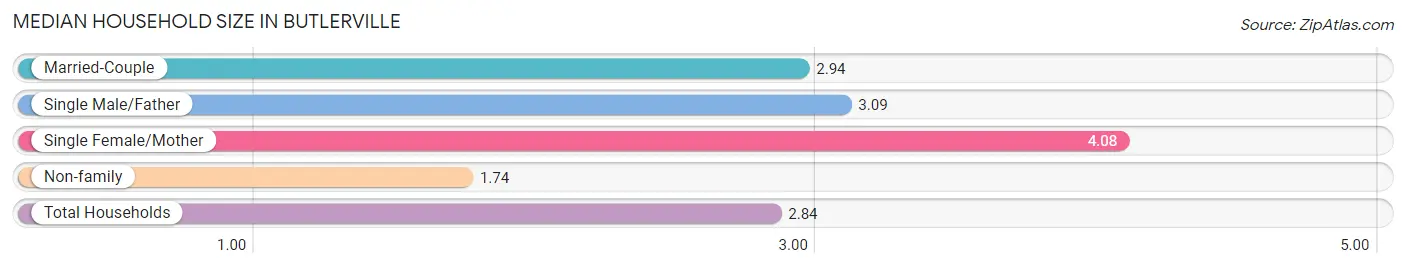
Median Household Size in Butlerville
The median household size in Butlerville is 2.84 persons per household, with single female/mother households (12 | 16.0%) accounting for the largest median household size of 4.08 persons per household. non-family households (19 | 25.3%) represent the smallest median household size with 1.74 persons per household.
| Household Type | # Households | Household Size |
| Married-Couple | 33 (44.0%) | 2.94 |
| Single Male/Father | 11 (14.7%) | 3.09 |
| Single Female/Mother | 12 (16.0%) | 4.08 |
| Non-family | 19 (25.3%) | 1.74 |
| Total Households | 75 (100.0%) | 2.84 |
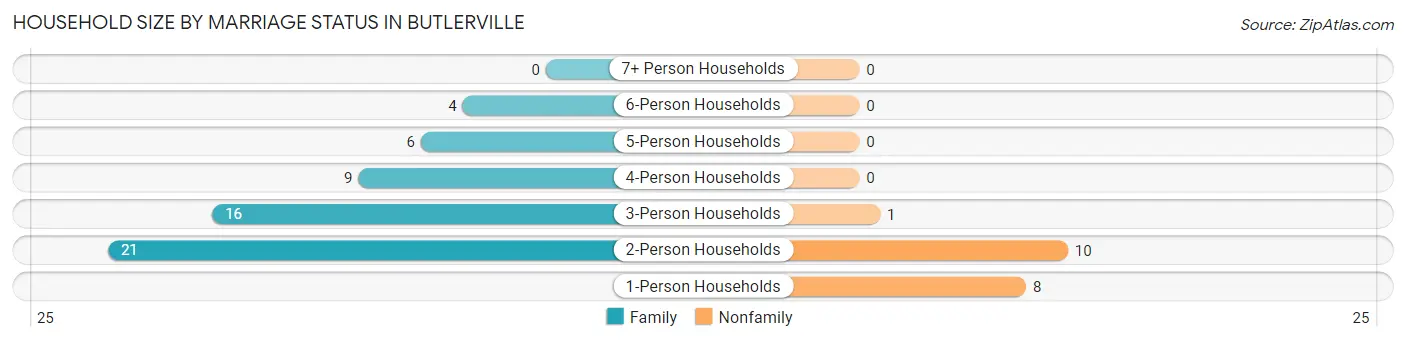
Household Size by Marriage Status in Butlerville
Out of a total of 75 households in Butlerville, 56 (74.7%) are family households, while 19 (25.3%) are nonfamily households. The most numerous type of family households are 2-person households, comprising 21, and the most common type of nonfamily households are 2-person households, comprising 10.
| Household Size | Family Households | Nonfamily Households |
| 1-Person Households | - | 8 (10.7%) |
| 2-Person Households | 21 (28.0%) | 10 (13.3%) |
| 3-Person Households | 16 (21.3%) | 1 (1.3%) |
| 4-Person Households | 9 (12.0%) | 0 (0.0%) |
| 5-Person Households | 6 (8.0%) | 0 (0.0%) |
| 6-Person Households | 4 (5.3%) | 0 (0.0%) |
| 7+ Person Households | 0 (0.0%) | 0 (0.0%) |
| Total | 56 (74.7%) | 19 (25.3%) |
Female Fertility in Butlerville
Fertility by Age in Butlerville
Average fertility rate in Butlerville is 36.0 births per 1,000 women. Women in the age bracket of 20 to 34 years have the highest fertility rate with 67.0 births per 1,000 women. Women in the age bracket of 20 to 34 years acount for 100.0% of all women with births.
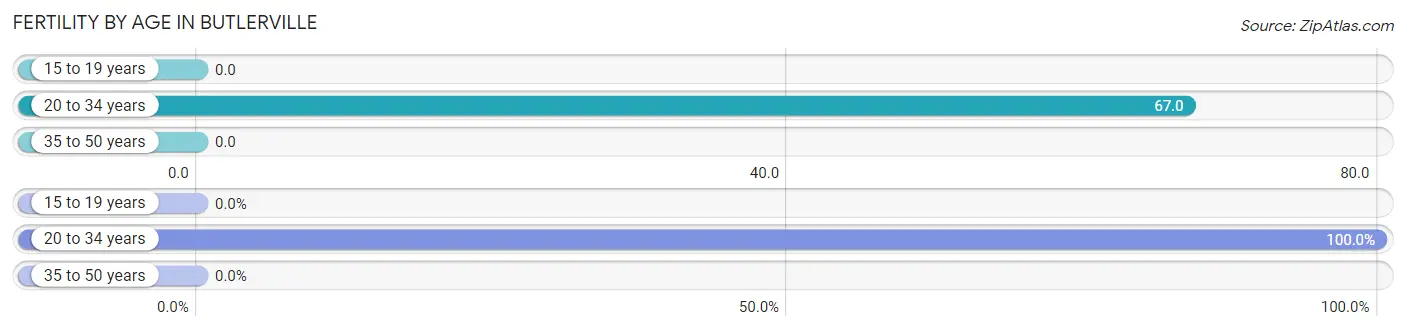
| Age Bracket | Women with Births | Births / 1,000 Women |
| 15 to 19 years | 0 (0.0%) | 0.0 |
| 20 to 34 years | 2 (100.0%) | 67.0 |
| 35 to 50 years | 0 (0.0%) | 0.0 |
| Total | 2 (100.0%) | 36.0 |
Fertility by Age by Marriage Status in Butlerville
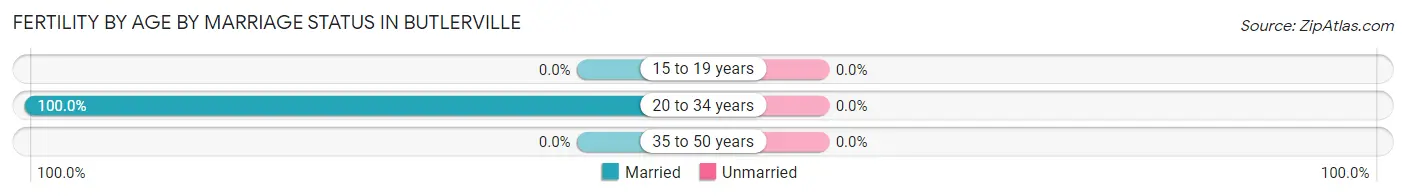
| Age Bracket | Married | Unmarried |
| 15 to 19 years | 0 (0.0%) | 0 (0.0%) |
| 20 to 34 years | 2 (100.0%) | 0 (0.0%) |
| 35 to 50 years | 0 (0.0%) | 0 (0.0%) |
| Total | 2 (100.0%) | 0 (0.0%) |
Fertility by Education in Butlerville
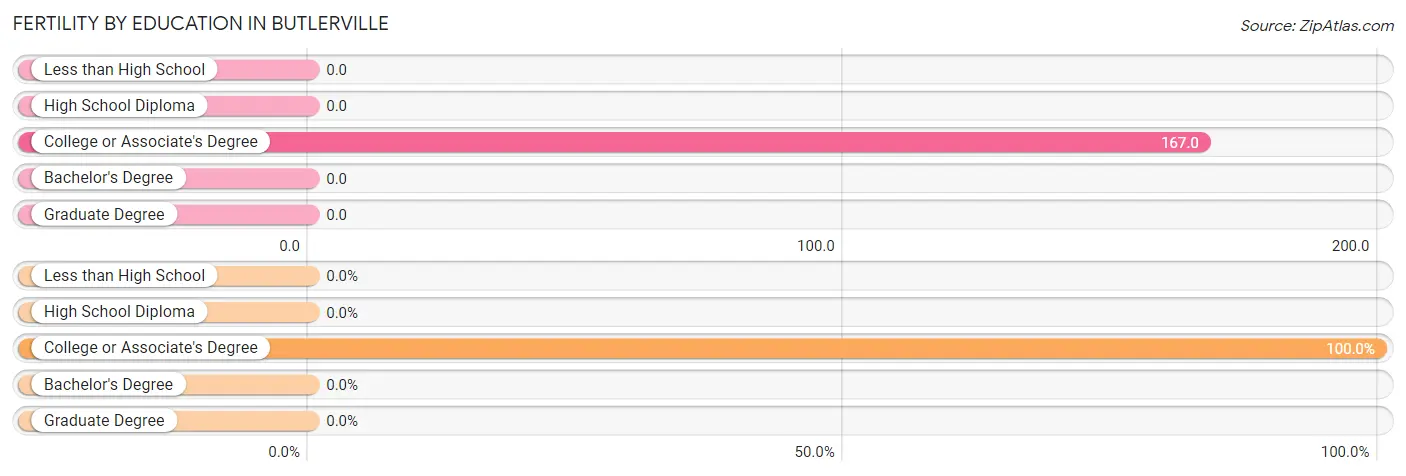
| Educational Attainment | Women with Births | Births / 1,000 Women |
| Less than High School | 0 (0.0%) | 0.0 |
| High School Diploma | 0 (0.0%) | 0.0 |
| College or Associate's Degree | 2 (100.0%) | 167.0 |
| Bachelor's Degree | 0 (0.0%) | 0.0 |
| Graduate Degree | 0 (0.0%) | 0.0 |
| Total | 2 (100.0%) | 36.0 |
Fertility by Education by Marriage Status in Butlerville
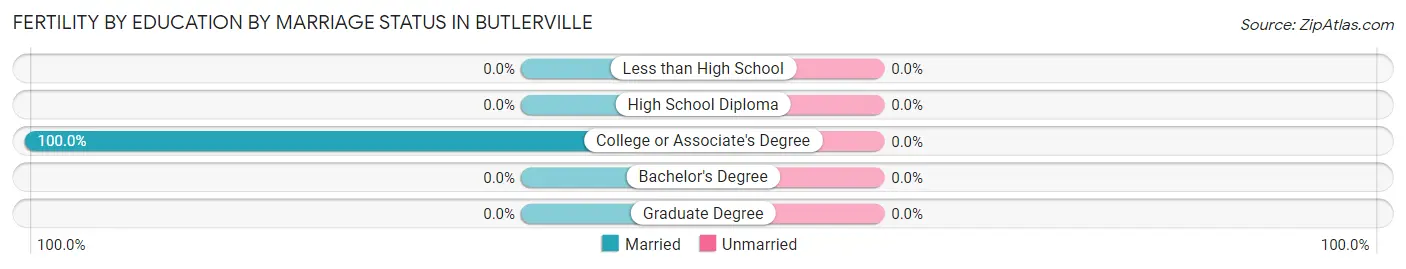
| Educational Attainment | Married | Unmarried |
| Less than High School | 0 (0.0%) | 0 (0.0%) |
| High School Diploma | 0 (0.0%) | 0 (0.0%) |
| College or Associate's Degree | 2 (100.0%) | 0 (0.0%) |
| Bachelor's Degree | 0 (0.0%) | 0 (0.0%) |
| Graduate Degree | 0 (0.0%) | 0 (0.0%) |
| Total | 2 (100.0%) | 0 (0.0%) |
Income in Butlerville
Income Overview in Butlerville
Per Capita Income in Butlerville is $23,479, while median incomes of families and households are $64,000 and $63,523 respectively.
| Characteristic | Number | Measure |
| Per Capita Income | 213 | $23,479 |
| Median Family Income | 56 | $64,000 |
| Mean Family Income | 56 | $68,757 |
| Median Household Income | 75 | $63,523 |
| Mean Household Income | 75 | $66,960 |
| Income Deficit | 56 | $0 |
| Wage / Income Gap (%) | 213 | 41.01% |
| Wage / Income Gap ($) | 213 | 58.99¢ per $1 |
| Gini / Inequality Index | 213 | 0.32 |
Earnings by Sex in Butlerville
Average Earnings in Butlerville are $37,500, $41,250 for men and $24,333 for women, a difference of 41.0%.
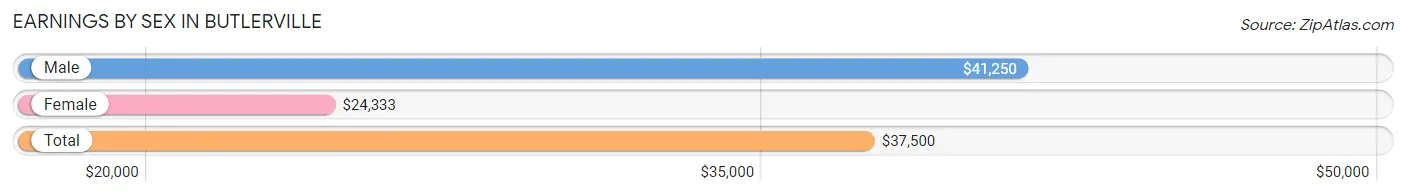
| Sex | Number | Average Earnings |
| Male | 56 (51.8%) | $41,250 |
| Female | 52 (48.1%) | $24,333 |
| Total | 108 (100.0%) | $37,500 |
Earnings by Sex by Income Bracket in Butlerville
The most common earnings brackets in Butlerville are $35,000 to $39,999 for men (10 | 17.9%) and $22,500 to $24,999 for women (15 | 28.8%).
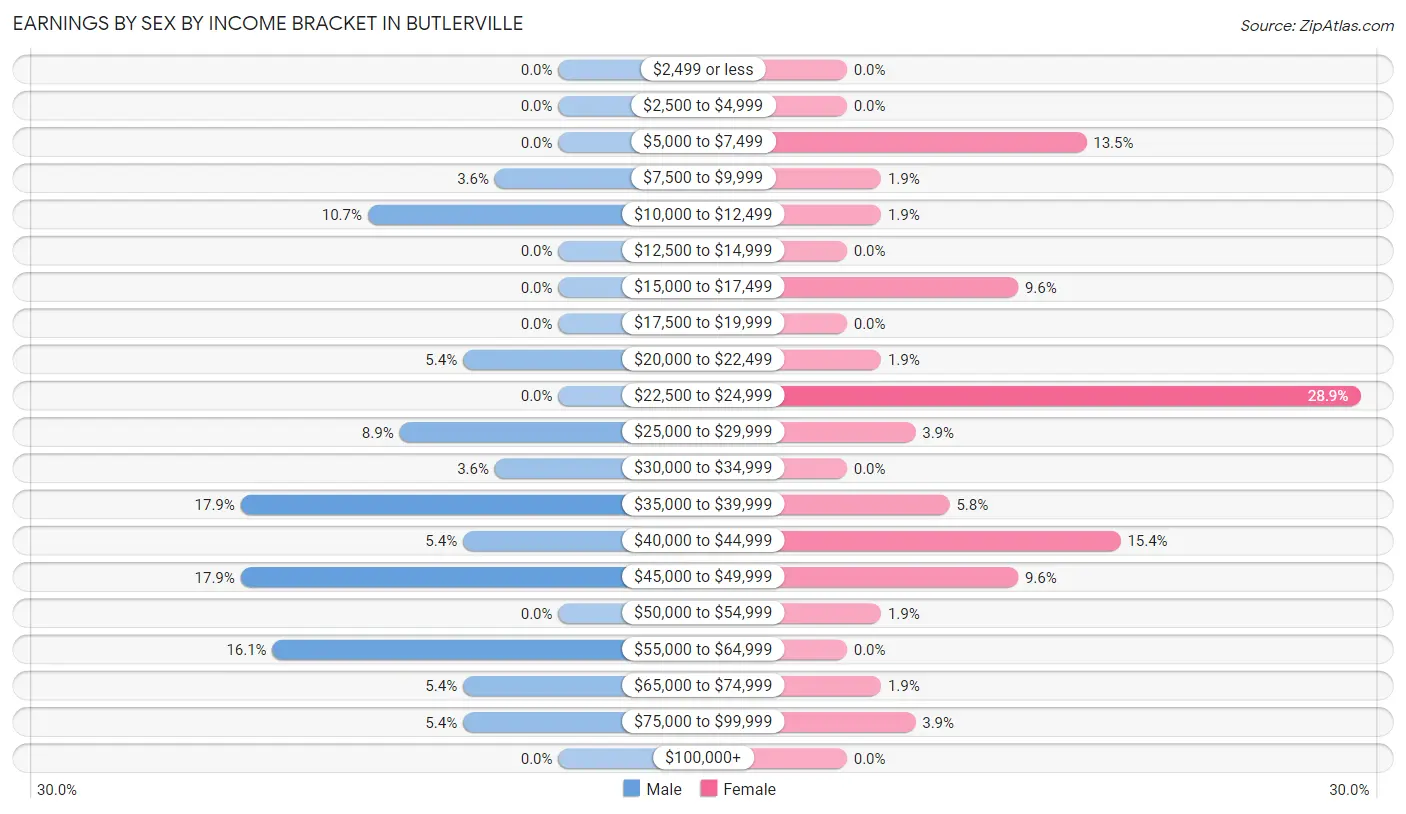
| Income | Male | Female |
| $2,499 or less | 0 (0.0%) | 0 (0.0%) |
| $2,500 to $4,999 | 0 (0.0%) | 0 (0.0%) |
| $5,000 to $7,499 | 0 (0.0%) | 7 (13.5%) |
| $7,500 to $9,999 | 2 (3.6%) | 1 (1.9%) |
| $10,000 to $12,499 | 6 (10.7%) | 1 (1.9%) |
| $12,500 to $14,999 | 0 (0.0%) | 0 (0.0%) |
| $15,000 to $17,499 | 0 (0.0%) | 5 (9.6%) |
| $17,500 to $19,999 | 0 (0.0%) | 0 (0.0%) |
| $20,000 to $22,499 | 3 (5.4%) | 1 (1.9%) |
| $22,500 to $24,999 | 0 (0.0%) | 15 (28.8%) |
| $25,000 to $29,999 | 5 (8.9%) | 2 (3.8%) |
| $30,000 to $34,999 | 2 (3.6%) | 0 (0.0%) |
| $35,000 to $39,999 | 10 (17.9%) | 3 (5.8%) |
| $40,000 to $44,999 | 3 (5.4%) | 8 (15.4%) |
| $45,000 to $49,999 | 10 (17.9%) | 5 (9.6%) |
| $50,000 to $54,999 | 0 (0.0%) | 1 (1.9%) |
| $55,000 to $64,999 | 9 (16.1%) | 0 (0.0%) |
| $65,000 to $74,999 | 3 (5.4%) | 1 (1.9%) |
| $75,000 to $99,999 | 3 (5.4%) | 2 (3.8%) |
| $100,000+ | 0 (0.0%) | 0 (0.0%) |
| Total | 56 (100.0%) | 52 (100.0%) |
Earnings by Sex by Educational Attainment in Butlerville
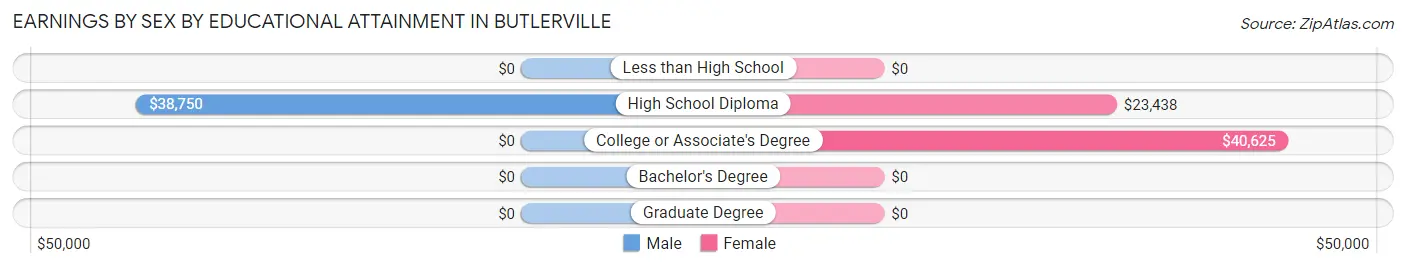
| Educational Attainment | Male Income | Female Income |
| Less than High School | - | - |
| High School Diploma | $38,750 | $23,438 |
| College or Associate's Degree | - | - |
| Bachelor's Degree | - | - |
| Graduate Degree | - | - |
| Total | $39,375 | $0 |
Family Income in Butlerville
Family Income Brackets in Butlerville
According to the Butlerville family income data, there are 15 families falling into the $50,000 to $74,999 income range, which is the most common income bracket and makes up 26.8% of all families.
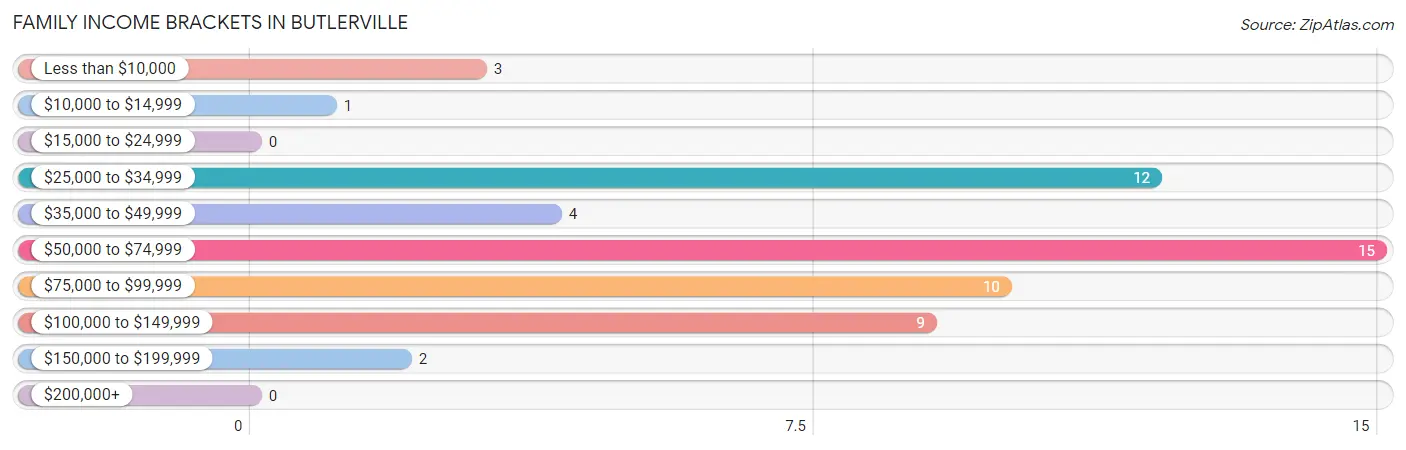
| Income Bracket | # Families | % Families |
| Less than $10,000 | 3 | 5.4% |
| $10,000 to $14,999 | 1 | 1.8% |
| $15,000 to $24,999 | 0 | 0.0% |
| $25,000 to $34,999 | 12 | 21.4% |
| $35,000 to $49,999 | 4 | 7.1% |
| $50,000 to $74,999 | 15 | 26.8% |
| $75,000 to $99,999 | 10 | 17.9% |
| $100,000 to $149,999 | 9 | 16.1% |
| $150,000 to $199,999 | 2 | 3.6% |
| $200,000+ | 0 | 0.0% |
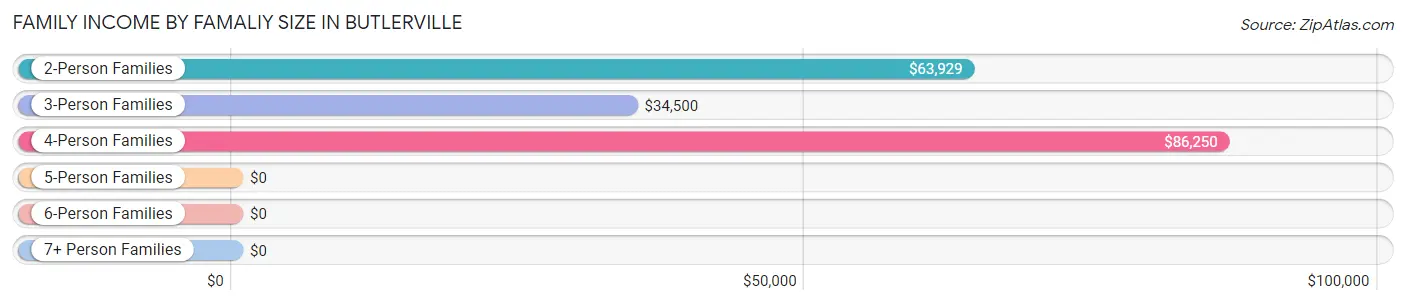
Family Income by Famaliy Size in Butlerville
4-person families (4 | 7.1%) account for the highest median family income in Butlerville with $86,250 per family, while 2-person families (30 | 53.6%) have the highest median income of $31,964 per family member.
| Income Bracket | # Families | Median Income |
| 2-Person Families | 30 (53.6%) | $63,929 |
| 3-Person Families | 12 (21.4%) | $34,500 |
| 4-Person Families | 4 (7.1%) | $86,250 |
| 5-Person Families | 6 (10.7%) | $0 |
| 6-Person Families | 4 (7.1%) | $0 |
| 7+ Person Families | 0 (0.0%) | $0 |
| Total | 56 (100.0%) | $64,000 |
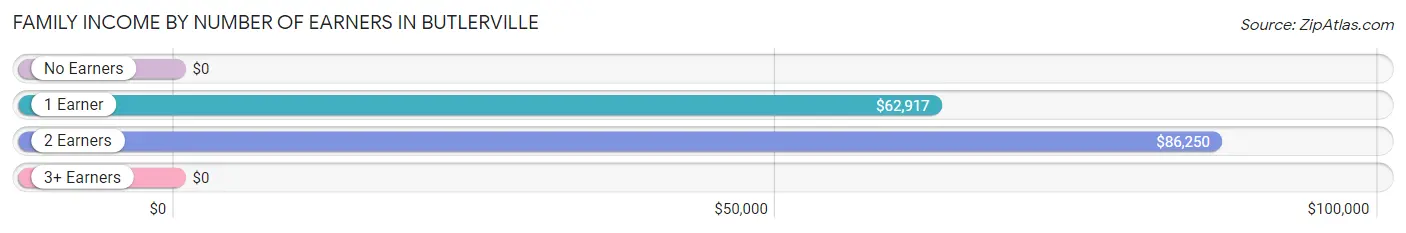
Family Income by Number of Earners in Butlerville
| Number of Earners | # Families | Median Income |
| No Earners | 10 (17.9%) | $0 |
| 1 Earner | 25 (44.6%) | $62,917 |
| 2 Earners | 16 (28.6%) | $86,250 |
| 3+ Earners | 5 (8.9%) | $0 |
| Total | 56 (100.0%) | $64,000 |
Household Income in Butlerville
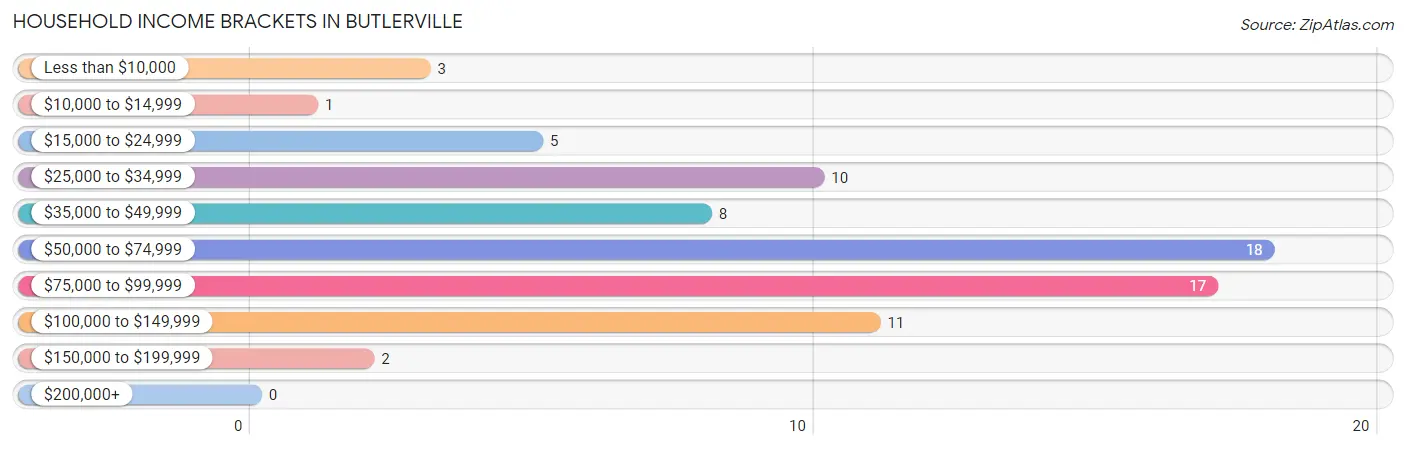
Household Income Brackets in Butlerville
With 18 households falling in the category, the $50,000 to $74,999 income range is the most frequent in Butlerville, accounting for 24.0% of all households.
| Income Bracket | # Households | % Households |
| Less than $10,000 | 3 | 4.0% |
| $10,000 to $14,999 | 1 | 1.3% |
| $15,000 to $24,999 | 5 | 6.7% |
| $25,000 to $34,999 | 10 | 13.3% |
| $35,000 to $49,999 | 8 | 10.7% |
| $50,000 to $74,999 | 18 | 24.0% |
| $75,000 to $99,999 | 17 | 22.7% |
| $100,000 to $149,999 | 11 | 14.7% |
| $150,000 to $199,999 | 2 | 2.7% |
| $200,000+ | 0 | 0.0% |
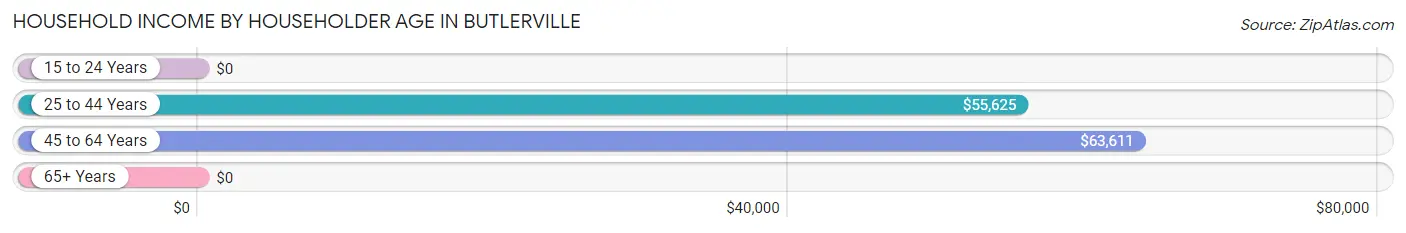
Household Income by Householder Age in Butlerville
The median household income in Butlerville is $63,523, with the highest median household income of $63,611 found in the 45 to 64 years age bracket for the primary householder. A total of 34 households (45.3%) fall into this category. Meanwhile, the 15 to 24 years age bracket for the primary householder has the lowest median household income of $0, with 8 households (10.7%) in this group.
| Income Bracket | # Households | Median Income |
| 15 to 24 Years | 8 (10.7%) | $0 |
| 25 to 44 Years | 21 (28.0%) | $55,625 |
| 45 to 64 Years | 34 (45.3%) | $63,611 |
| 65+ Years | 12 (16.0%) | $0 |
| Total | 75 (100.0%) | $63,523 |
Poverty in Butlerville
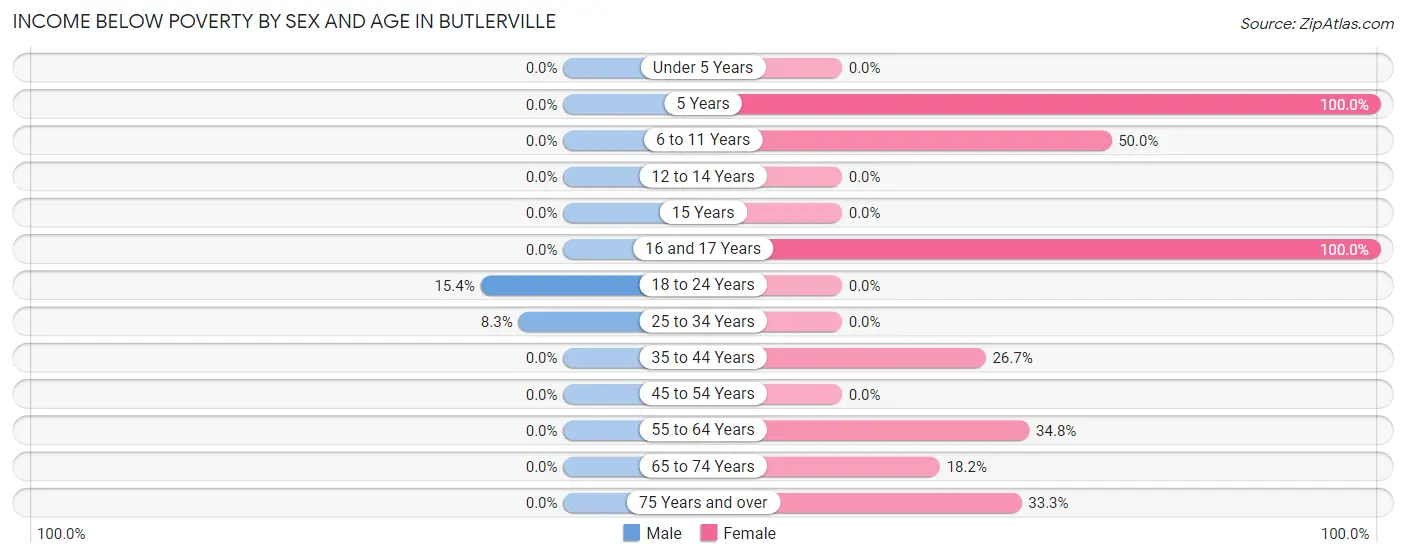
Income Below Poverty by Sex and Age in Butlerville
With 3.3% poverty level for males and 21.5% for females among the residents of Butlerville, 18 to 24 year old males and 5 year old females are the most vulnerable to poverty, with 2 males (15.4%) and 5 females (100.0%) in their respective age groups living below the poverty level.
| Age Bracket | Male | Female |
| Under 5 Years | 0 (0.0%) | 0 (0.0%) |
| 5 Years | 0 (0.0%) | 5 (100.0%) |
| 6 to 11 Years | 0 (0.0%) | 4 (50.0%) |
| 12 to 14 Years | 0 (0.0%) | 0 (0.0%) |
| 15 Years | 0 (0.0%) | 0 (0.0%) |
| 16 and 17 Years | 0 (0.0%) | 2 (100.0%) |
| 18 to 24 Years | 2 (15.4%) | 0 (0.0%) |
| 25 to 34 Years | 1 (8.3%) | 0 (0.0%) |
| 35 to 44 Years | 0 (0.0%) | 4 (26.7%) |
| 45 to 54 Years | 0 (0.0%) | 0 (0.0%) |
| 55 to 64 Years | 0 (0.0%) | 8 (34.8%) |
| 65 to 74 Years | 0 (0.0%) | 2 (18.2%) |
| 75 Years and over | 0 (0.0%) | 1 (33.3%) |
| Total | 3 (3.3%) | 26 (21.5%) |
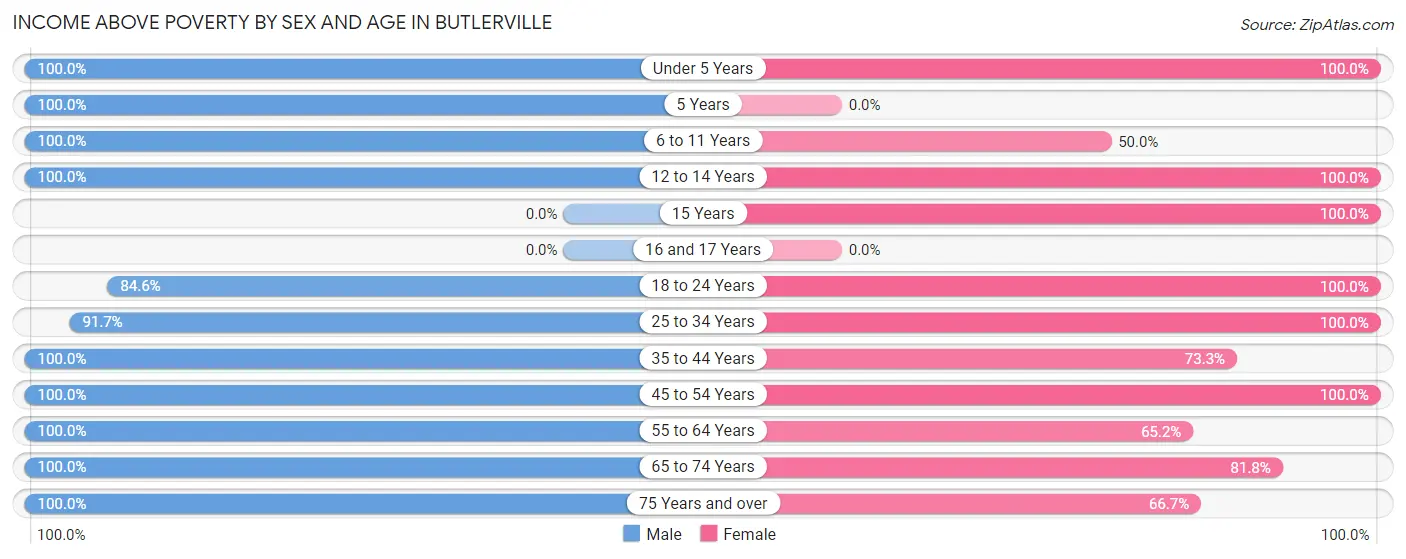
Income Above Poverty by Sex and Age in Butlerville
According to the poverty statistics in Butlerville, males aged under 5 years and females aged under 5 years are the age groups that are most secure financially, with 100.0% of males and 100.0% of females in these age groups living above the poverty line.
| Age Bracket | Male | Female |
| Under 5 Years | 6 (100.0%) | 7 (100.0%) |
| 5 Years | 4 (100.0%) | 0 (0.0%) |
| 6 to 11 Years | 6 (100.0%) | 4 (50.0%) |
| 12 to 14 Years | 2 (100.0%) | 7 (100.0%) |
| 15 Years | 0 (0.0%) | 7 (100.0%) |
| 16 and 17 Years | 0 (0.0%) | 0 (0.0%) |
| 18 to 24 Years | 11 (84.6%) | 12 (100.0%) |
| 25 to 34 Years | 11 (91.7%) | 19 (100.0%) |
| 35 to 44 Years | 5 (100.0%) | 11 (73.3%) |
| 45 to 54 Years | 13 (100.0%) | 2 (100.0%) |
| 55 to 64 Years | 27 (100.0%) | 15 (65.2%) |
| 65 to 74 Years | 1 (100.0%) | 9 (81.8%) |
| 75 Years and over | 3 (100.0%) | 2 (66.7%) |
| Total | 89 (96.7%) | 95 (78.5%) |
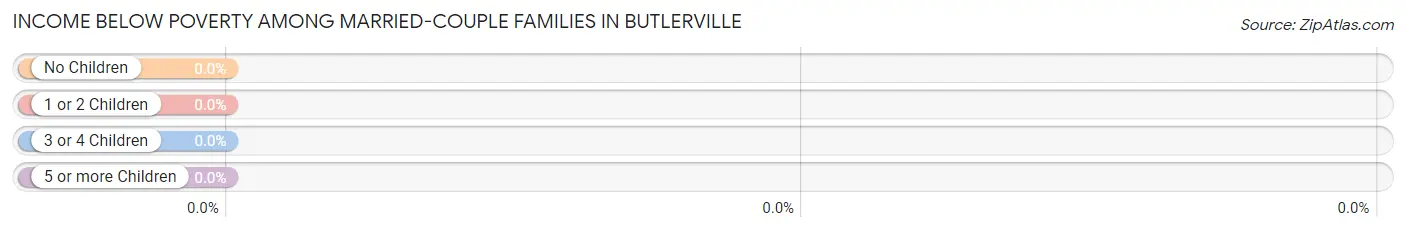
Income Below Poverty Among Married-Couple Families in Butlerville
| Children | Above Poverty | Below Poverty |
| No Children | 22 (100.0%) | 0 (0.0%) |
| 1 or 2 Children | 11 (100.0%) | 0 (0.0%) |
| 3 or 4 Children | 0 (0.0%) | 0 (0.0%) |
| 5 or more Children | 0 (0.0%) | 0 (0.0%) |
| Total | 33 (100.0%) | 0 (0.0%) |
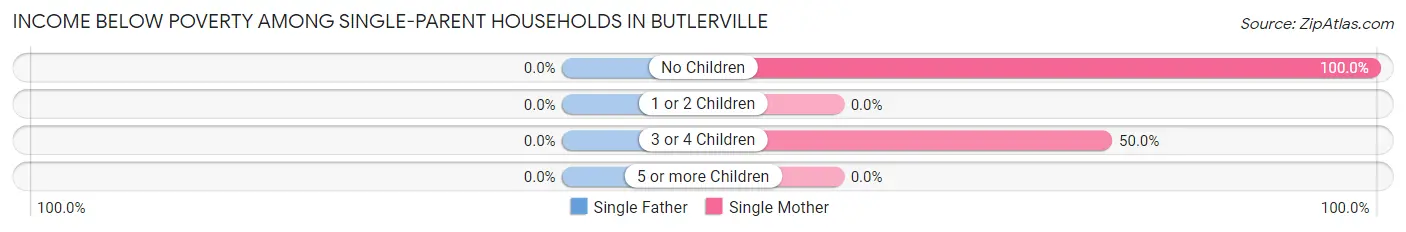
Income Below Poverty Among Single-Parent Households in Butlerville
| Children | Single Father | Single Mother |
| No Children | 0 (0.0%) | 1 (100.0%) |
| 1 or 2 Children | 0 (0.0%) | 0 (0.0%) |
| 3 or 4 Children | 0 (0.0%) | 3 (50.0%) |
| 5 or more Children | 0 (0.0%) | 0 (0.0%) |
| Total | 0 (0.0%) | 4 (33.3%) |
Income Below Poverty Among Married-Couple vs Single-Parent Households in Butlerville
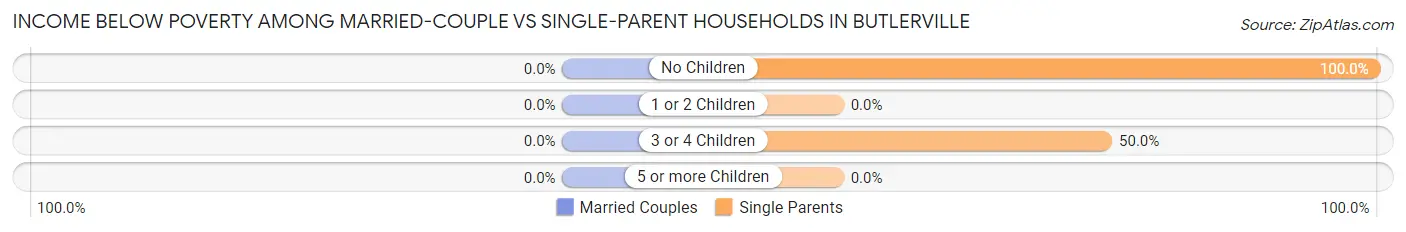
| Children | Married-Couple Families | Single-Parent Households |
| No Children | 0 (0.0%) | 1 (100.0%) |
| 1 or 2 Children | 0 (0.0%) | 0 (0.0%) |
| 3 or 4 Children | 0 (0.0%) | 3 (50.0%) |
| 5 or more Children | 0 (0.0%) | 0 (0.0%) |
| Total | 0 (0.0%) | 4 (17.4%) |
Employment Characteristics in Butlerville
Employment by Class of Employer in Butlerville
Among the 93 employed individuals in Butlerville, private company employees (54 | 58.1%), self-employed (not incorporated) (11 | 11.8%), and local government employees (10 | 10.7%) make up the most common classes of employment.
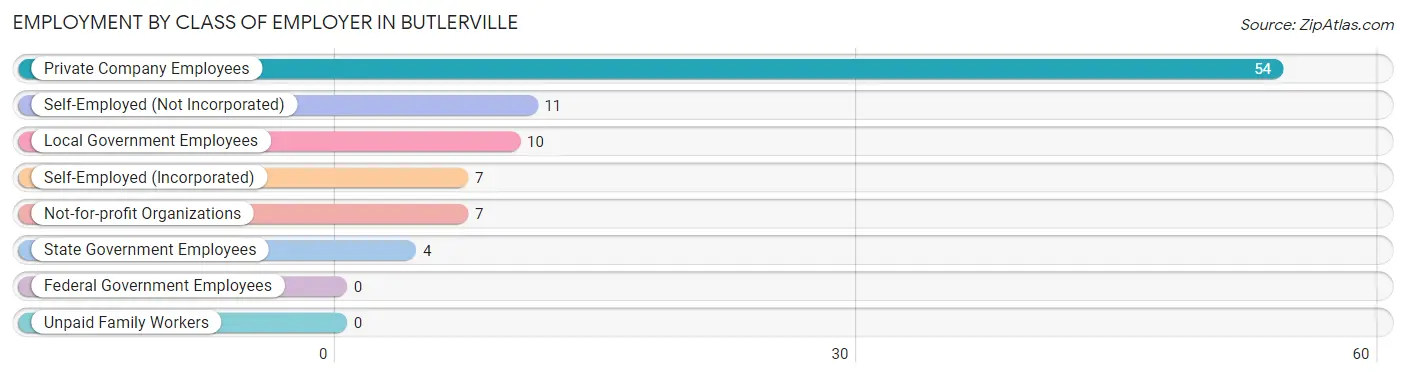
| Employer Class | # Employees | % Employees |
| Private Company Employees | 54 | 58.1% |
| Self-Employed (Incorporated) | 7 | 7.5% |
| Self-Employed (Not Incorporated) | 11 | 11.8% |
| Not-for-profit Organizations | 7 | 7.5% |
| Local Government Employees | 10 | 10.7% |
| State Government Employees | 4 | 4.3% |
| Federal Government Employees | 0 | 0.0% |
| Unpaid Family Workers | 0 | 0.0% |
| Total | 93 | 100.0% |
Employment Status by Age in Butlerville
According to the labor force statistics for Butlerville, out of the total population over 16 years of age (161), 65.2% or 105 individuals are in the labor force, with 10.5% or 11 of them unemployed. The age group with the highest labor force participation rate is 45 to 54 years, with 100.0% or 15 individuals in the labor force. Within the labor force, the 45 to 54 years age range has the highest percentage of unemployed individuals, with 40.0% or 6 of them being unemployed.
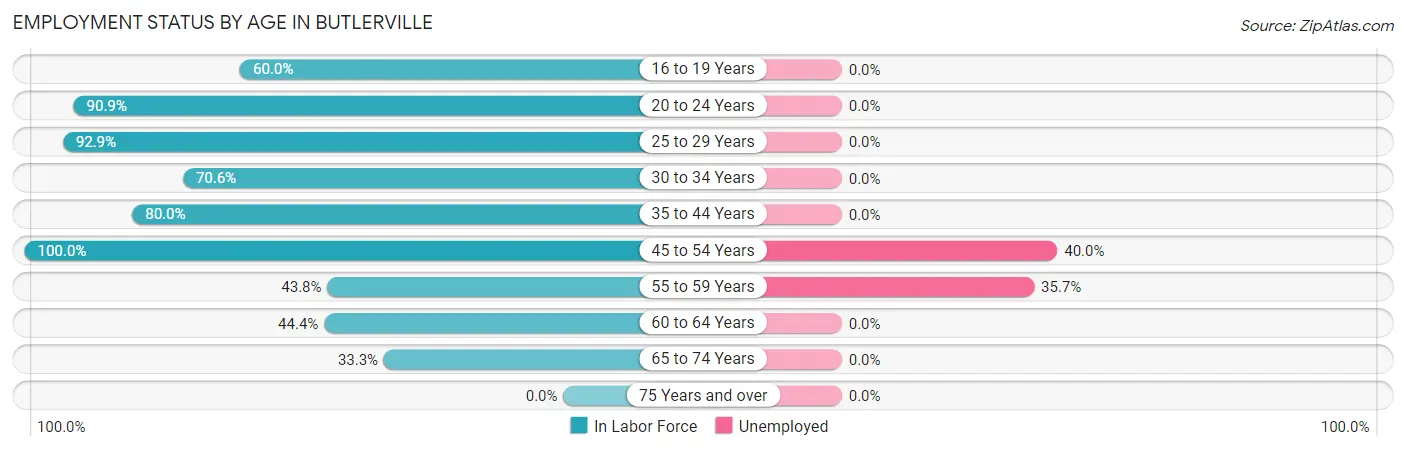
| Age Bracket | In Labor Force | Unemployed |
| 16 to 19 Years | 3 (60.0%) | 0 (0.0%) |
| 20 to 24 Years | 20 (90.9%) | 0 (0.0%) |
| 25 to 29 Years | 13 (92.9%) | 0 (0.0%) |
| 30 to 34 Years | 12 (70.6%) | 0 (0.0%) |
| 35 to 44 Years | 16 (80.0%) | 0 (0.0%) |
| 45 to 54 Years | 15 (100.0%) | 6 (40.0%) |
| 55 to 59 Years | 14 (43.8%) | 5 (35.7%) |
| 60 to 64 Years | 8 (44.4%) | 0 (0.0%) |
| 65 to 74 Years | 4 (33.3%) | 0 (0.0%) |
| 75 Years and over | 0 (0.0%) | 0 (0.0%) |
| Total | 105 (65.2%) | 11 (10.5%) |
Employment Status by Educational Attainment in Butlerville
According to labor force statistics for Butlerville, 67.2% of individuals (78) out of the total population between 25 and 64 years of age (116) are in the labor force, with 14.1% or 11 of them being unemployed. The group with the highest labor force participation rate are those with the educational attainment of bachelor's degree or higher, with 100.0% or 8 individuals in the labor force. Within the labor force, individuals with less than high school education have the highest percentage of unemployment, with 42.9% or 6 of them being unemployed.
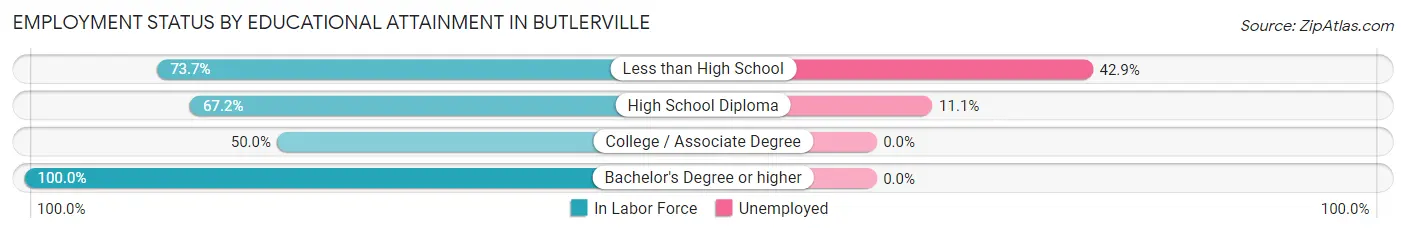
| Educational Attainment | In Labor Force | Unemployed |
| Less than High School | 14 (73.7%) | 8 (42.9%) |
| High School Diploma | 45 (67.2%) | 7 (11.1%) |
| College / Associate Degree | 11 (50.0%) | 0 (0.0%) |
| Bachelor's Degree or higher | 8 (100.0%) | 0 (0.0%) |
| Total | 78 (67.2%) | 16 (14.1%) |
Employment Occupations by Sex in Butlerville
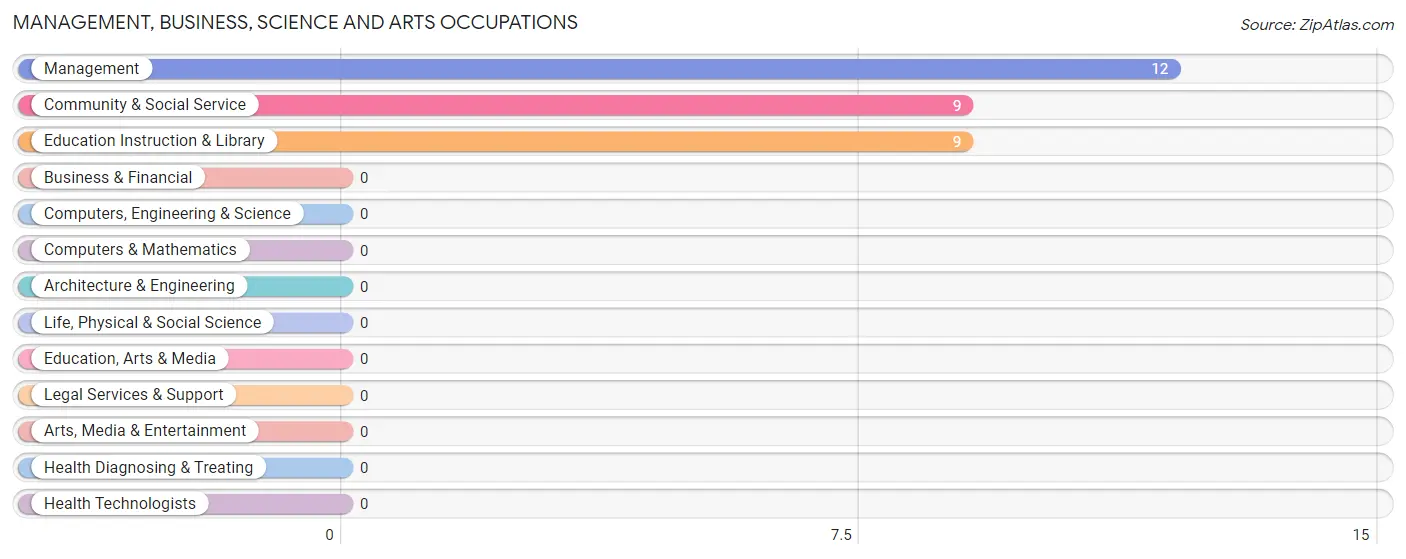
Management, Business, Science and Arts Occupations
The most common Management, Business, Science and Arts occupations in Butlerville are Management (12 | 12.8%), Community & Social Service (9 | 9.6%), and Education Instruction & Library (9 | 9.6%).
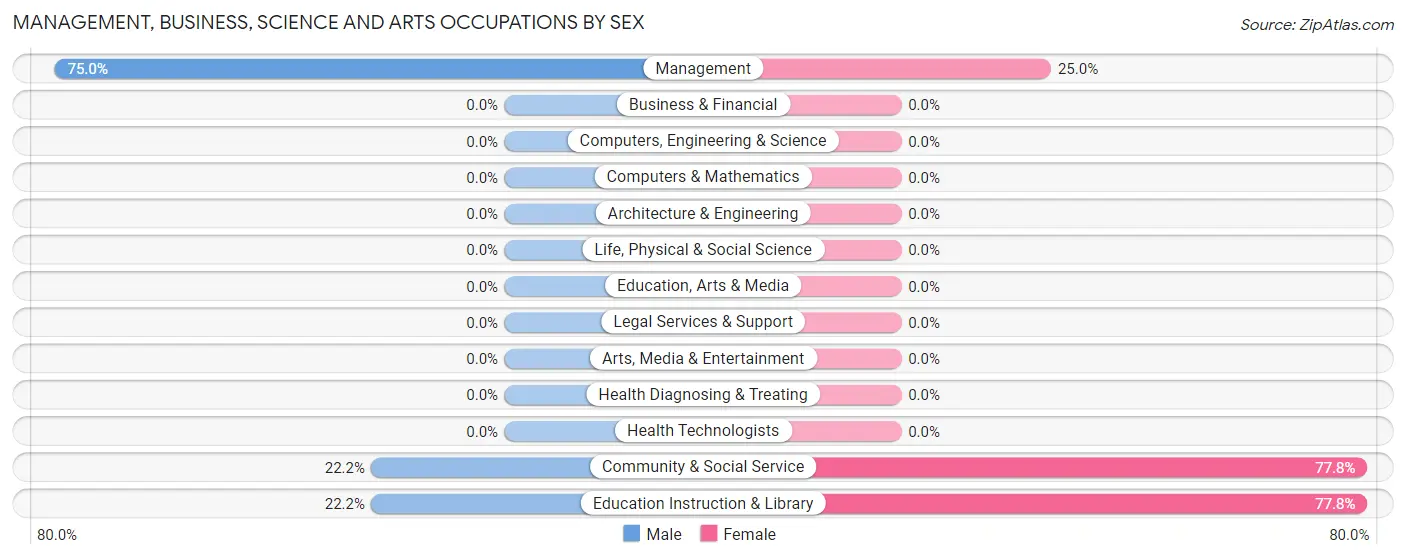
Management, Business, Science and Arts Occupations by Sex
Within the Management, Business, Science and Arts occupations in Butlerville, the most male-oriented occupations are Management (75.0%), Community & Social Service (22.2%), and Education Instruction & Library (22.2%), while the most female-oriented occupations are Community & Social Service (77.8%), Education Instruction & Library (77.8%), and Management (25.0%).
| Occupation | Male | Female |
| Management | 9 (75.0%) | 3 (25.0%) |
| Business & Financial | 0 (0.0%) | 0 (0.0%) |
| Computers, Engineering & Science | 0 (0.0%) | 0 (0.0%) |
| Computers & Mathematics | 0 (0.0%) | 0 (0.0%) |
| Architecture & Engineering | 0 (0.0%) | 0 (0.0%) |
| Life, Physical & Social Science | 0 (0.0%) | 0 (0.0%) |
| Community & Social Service | 2 (22.2%) | 7 (77.8%) |
| Education, Arts & Media | 0 (0.0%) | 0 (0.0%) |
| Legal Services & Support | 0 (0.0%) | 0 (0.0%) |
| Education Instruction & Library | 2 (22.2%) | 7 (77.8%) |
| Arts, Media & Entertainment | 0 (0.0%) | 0 (0.0%) |
| Health Diagnosing & Treating | 0 (0.0%) | 0 (0.0%) |
| Health Technologists | 0 (0.0%) | 0 (0.0%) |
| Total (Category) | 11 (52.4%) | 10 (47.6%) |
| Total (Overall) | 50 (53.2%) | 44 (46.8%) |
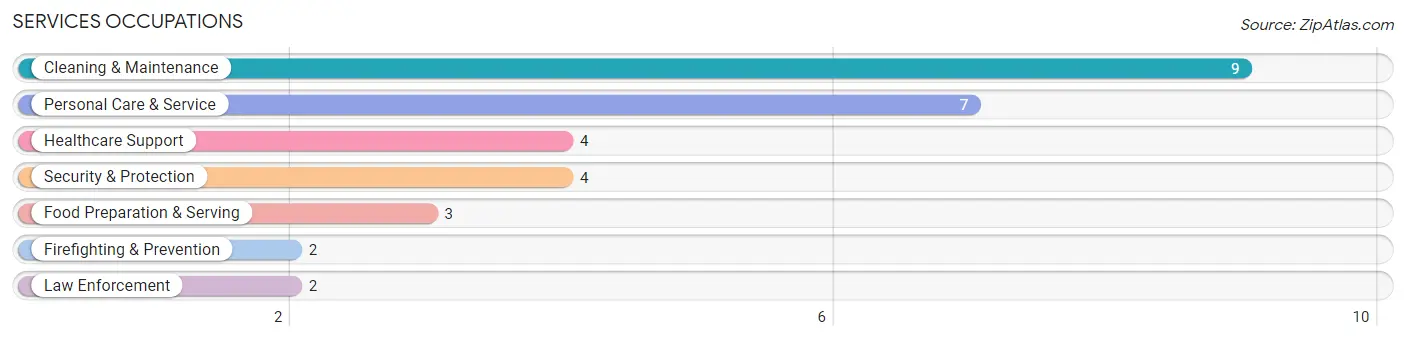
Services Occupations
The most common Services occupations in Butlerville are Cleaning & Maintenance (9 | 9.6%), Personal Care & Service (7 | 7.4%), Healthcare Support (4 | 4.3%), Security & Protection (4 | 4.3%), and Food Preparation & Serving (3 | 3.2%).
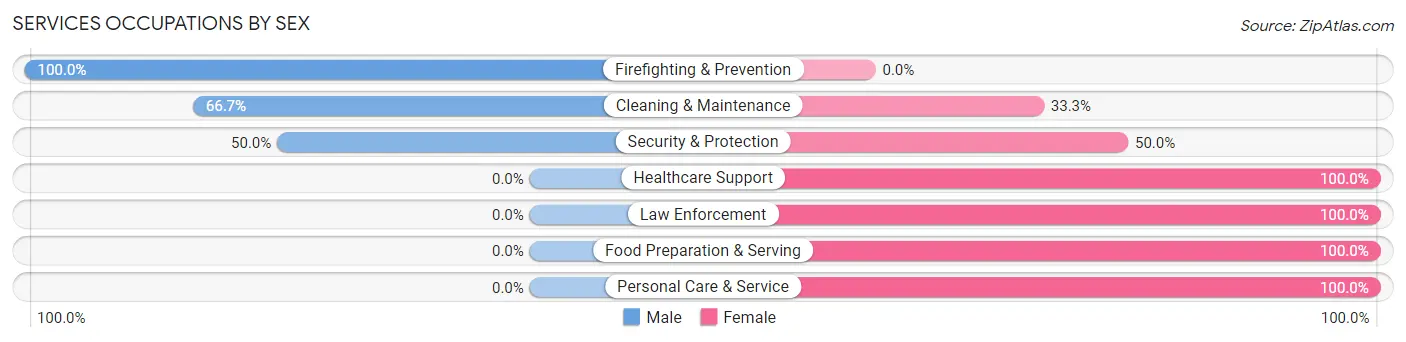
Services Occupations by Sex
Within the Services occupations in Butlerville, the most male-oriented occupations are Firefighting & Prevention (100.0%), Cleaning & Maintenance (66.7%), and Security & Protection (50.0%), while the most female-oriented occupations are Healthcare Support (100.0%), Law Enforcement (100.0%), and Food Preparation & Serving (100.0%).
| Occupation | Male | Female |
| Healthcare Support | 0 (0.0%) | 4 (100.0%) |
| Security & Protection | 2 (50.0%) | 2 (50.0%) |
| Firefighting & Prevention | 2 (100.0%) | 0 (0.0%) |
| Law Enforcement | 0 (0.0%) | 2 (100.0%) |
| Food Preparation & Serving | 0 (0.0%) | 3 (100.0%) |
| Cleaning & Maintenance | 6 (66.7%) | 3 (33.3%) |
| Personal Care & Service | 0 (0.0%) | 7 (100.0%) |
| Total (Category) | 8 (29.6%) | 19 (70.4%) |
| Total (Overall) | 50 (53.2%) | 44 (46.8%) |
Sales and Office Occupations
The most common Sales and Office occupations in Butlerville are Office & Administration (7 | 7.4%), and Sales & Related (4 | 4.3%).
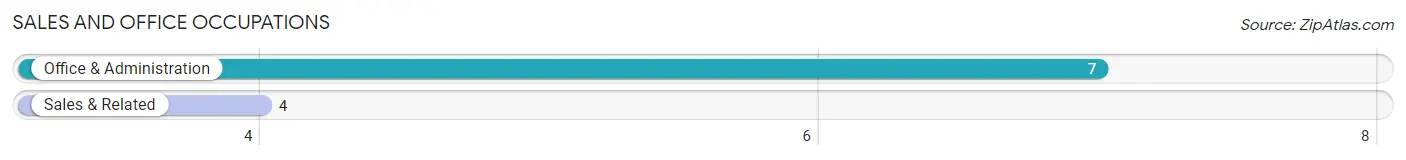
Sales and Office Occupations by Sex
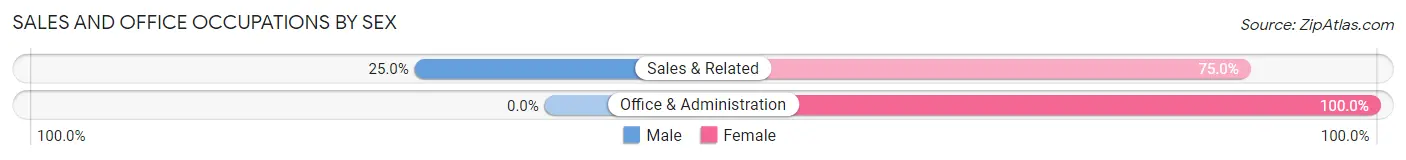
| Occupation | Male | Female |
| Sales & Related | 1 (25.0%) | 3 (75.0%) |
| Office & Administration | 0 (0.0%) | 7 (100.0%) |
| Total (Category) | 1 (9.1%) | 10 (90.9%) |
| Total (Overall) | 50 (53.2%) | 44 (46.8%) |
Natural Resources, Construction and Maintenance Occupations
The most common Natural Resources, Construction and Maintenance occupations in Butlerville are Construction & Extraction (9 | 9.6%), Installation, Maintenance & Repair (8 | 8.5%), and Farming, Fishing & Forestry (7 | 7.4%).
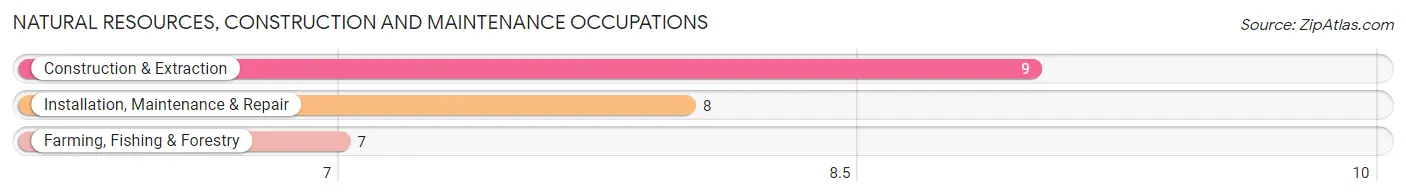
Natural Resources, Construction and Maintenance Occupations by Sex
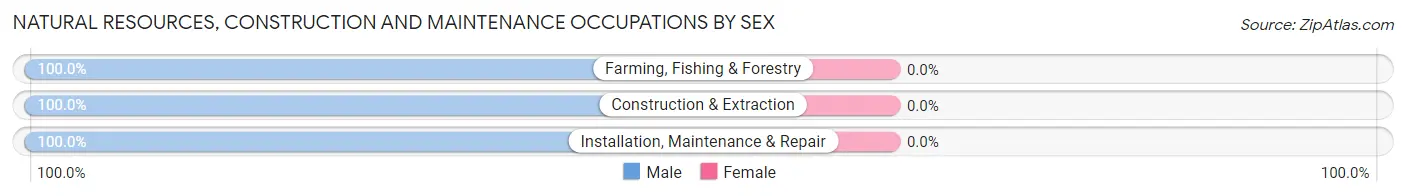
| Occupation | Male | Female |
| Farming, Fishing & Forestry | 7 (100.0%) | 0 (0.0%) |
| Construction & Extraction | 9 (100.0%) | 0 (0.0%) |
| Installation, Maintenance & Repair | 8 (100.0%) | 0 (0.0%) |
| Total (Category) | 24 (100.0%) | 0 (0.0%) |
| Total (Overall) | 50 (53.2%) | 44 (46.8%) |
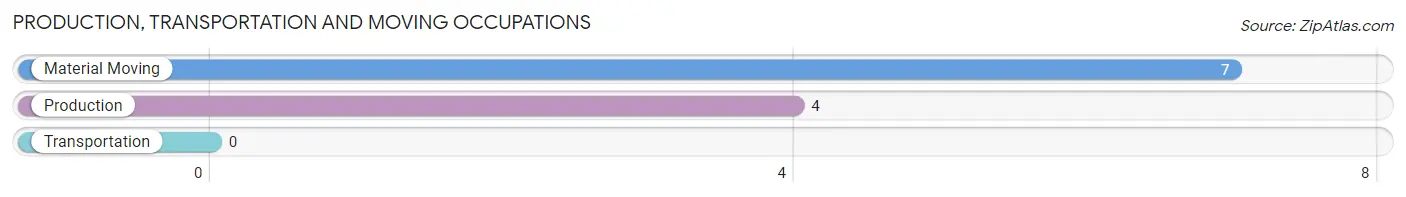
Production, Transportation and Moving Occupations
The most common Production, Transportation and Moving occupations in Butlerville are Material Moving (7 | 7.4%), and Production (4 | 4.3%).
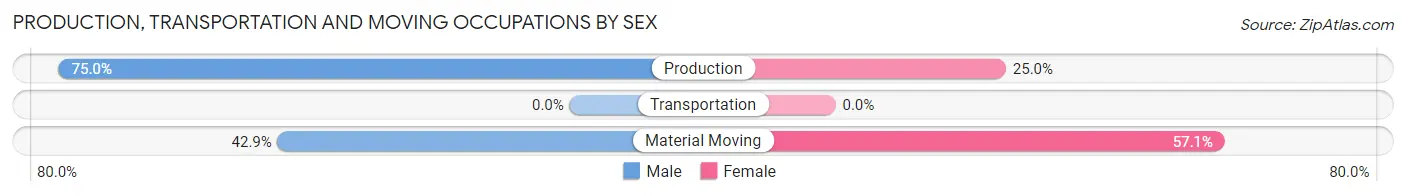
Production, Transportation and Moving Occupations by Sex
| Occupation | Male | Female |
| Production | 3 (75.0%) | 1 (25.0%) |
| Transportation | 0 (0.0%) | 0 (0.0%) |
| Material Moving | 3 (42.9%) | 4 (57.1%) |
| Total (Category) | 6 (54.5%) | 5 (45.5%) |
| Total (Overall) | 50 (53.2%) | 44 (46.8%) |
Employment Industries by Sex in Butlerville
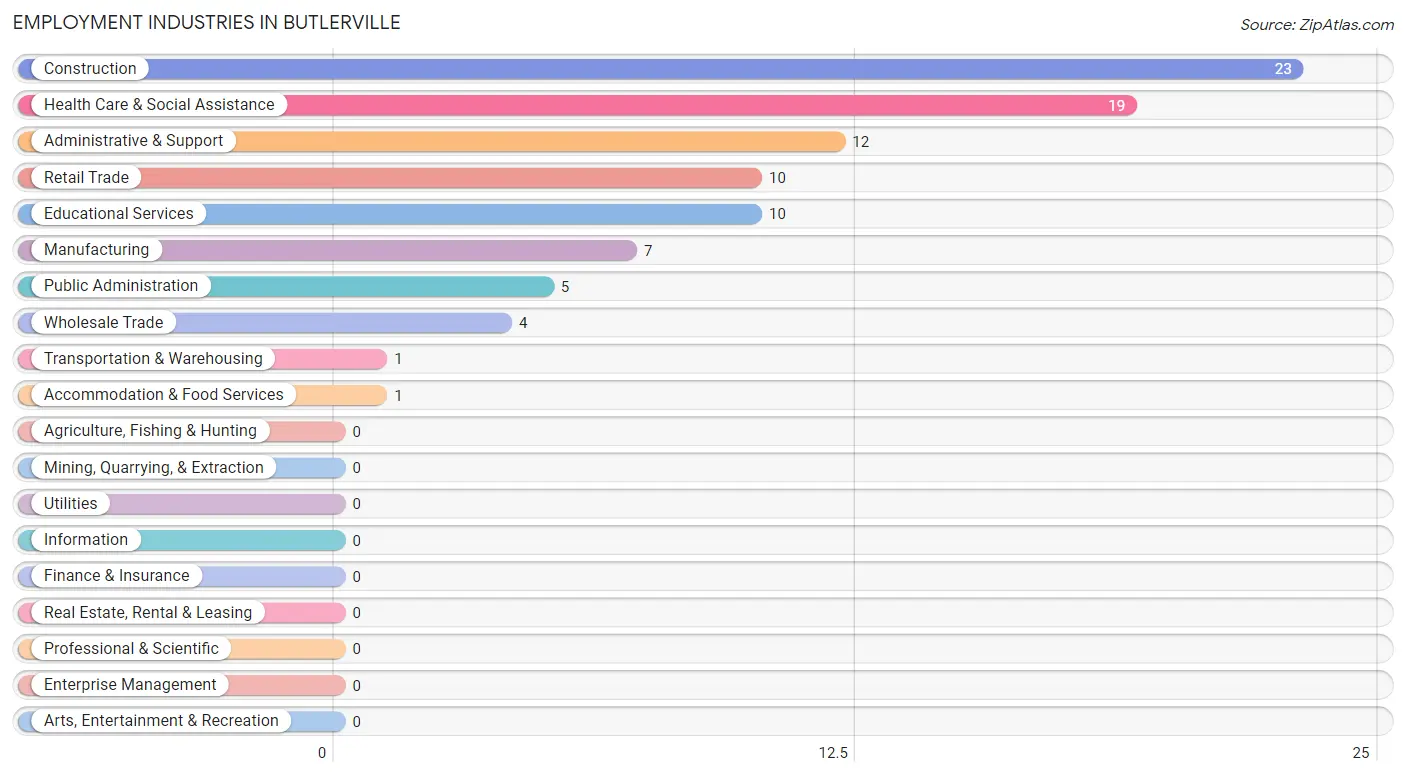
Employment Industries in Butlerville
The major employment industries in Butlerville include Construction (23 | 24.5%), Health Care & Social Assistance (19 | 20.2%), Administrative & Support (12 | 12.8%), Retail Trade (10 | 10.6%), and Educational Services (10 | 10.6%).
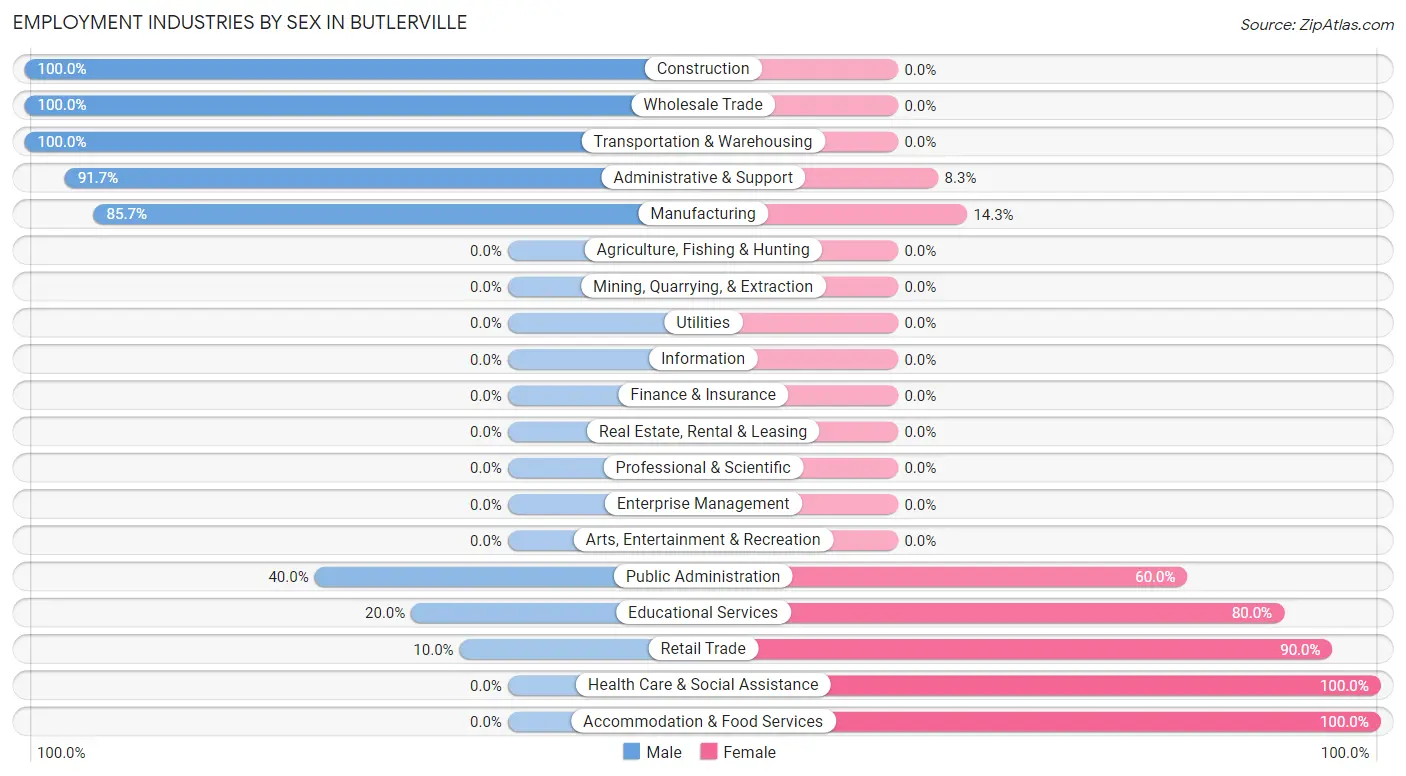
Employment Industries by Sex in Butlerville
The Butlerville industries that see more men than women are Construction (100.0%), Wholesale Trade (100.0%), and Transportation & Warehousing (100.0%), whereas the industries that tend to have a higher number of women are Health Care & Social Assistance (100.0%), Accommodation & Food Services (100.0%), and Retail Trade (90.0%).
| Industry | Male | Female |
| Agriculture, Fishing & Hunting | 0 (0.0%) | 0 (0.0%) |
| Mining, Quarrying, & Extraction | 0 (0.0%) | 0 (0.0%) |
| Construction | 23 (100.0%) | 0 (0.0%) |
| Manufacturing | 6 (85.7%) | 1 (14.3%) |
| Wholesale Trade | 4 (100.0%) | 0 (0.0%) |
| Retail Trade | 1 (10.0%) | 9 (90.0%) |
| Transportation & Warehousing | 1 (100.0%) | 0 (0.0%) |
| Utilities | 0 (0.0%) | 0 (0.0%) |
| Information | 0 (0.0%) | 0 (0.0%) |
| Finance & Insurance | 0 (0.0%) | 0 (0.0%) |
| Real Estate, Rental & Leasing | 0 (0.0%) | 0 (0.0%) |
| Professional & Scientific | 0 (0.0%) | 0 (0.0%) |
| Enterprise Management | 0 (0.0%) | 0 (0.0%) |
| Administrative & Support | 11 (91.7%) | 1 (8.3%) |
| Educational Services | 2 (20.0%) | 8 (80.0%) |
| Health Care & Social Assistance | 0 (0.0%) | 19 (100.0%) |
| Arts, Entertainment & Recreation | 0 (0.0%) | 0 (0.0%) |
| Accommodation & Food Services | 0 (0.0%) | 1 (100.0%) |
| Public Administration | 2 (40.0%) | 3 (60.0%) |
| Total | 50 (53.2%) | 44 (46.8%) |
Education in Butlerville
School Enrollment in Butlerville
The most common levels of schooling among the 41 students in Butlerville are high school (11 | 26.8%), elementary school (10 | 24.4%), and middle school (9 | 22.0%).
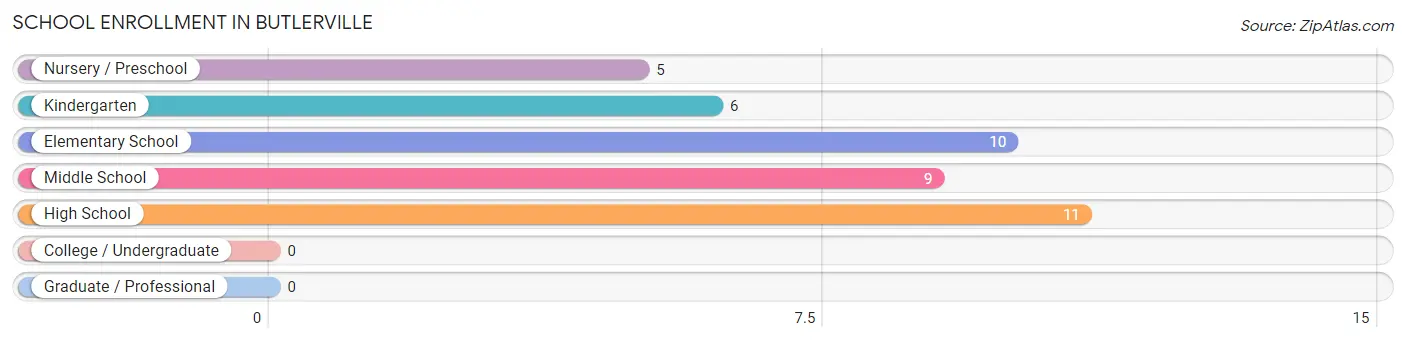
| School Level | # Students | % Students |
| Nursery / Preschool | 5 | 12.2% |
| Kindergarten | 6 | 14.6% |
| Elementary School | 10 | 24.4% |
| Middle School | 9 | 22.0% |
| High School | 11 | 26.8% |
| College / Undergraduate | 0 | 0.0% |
| Graduate / Professional | 0 | 0.0% |
| Total | 41 | 100.0% |
School Enrollment by Age by Funding Source in Butlerville
Out of a total of 41 students who are enrolled in schools in Butlerville, 5 (12.2%) attend a private institution, while the remaining 36 (87.8%) are enrolled in public schools. The age group of 15 to 17 year olds has the highest likelihood of being enrolled in private schools, with 2 (22.2% in the age bracket) enrolled. Conversely, the age group of 5 to 9 year old has the lowest likelihood of being enrolled in a private school, with 17 (100.0% in the age bracket) attending a public institution.
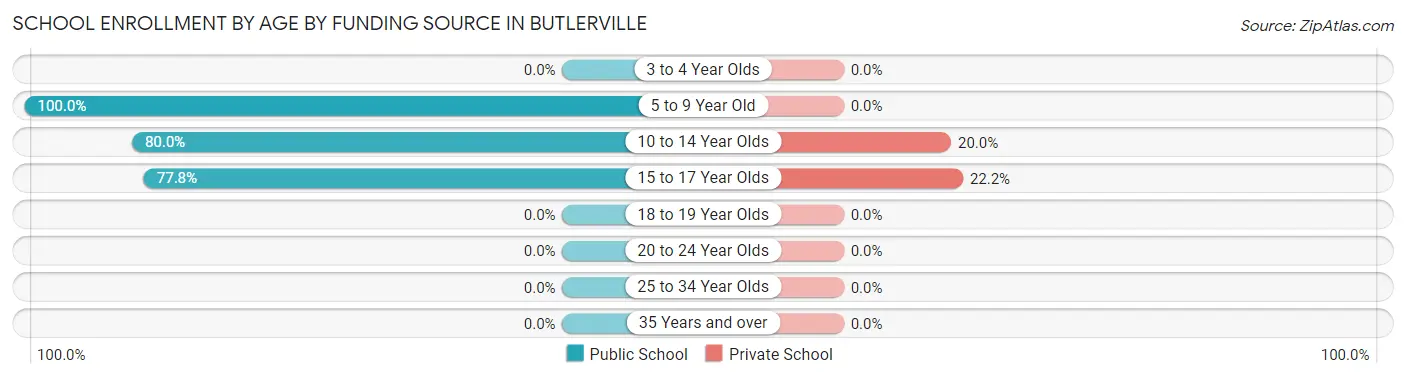
| Age Bracket | Public School | Private School |
| 3 to 4 Year Olds | 0 (0.0%) | 0 (0.0%) |
| 5 to 9 Year Old | 17 (100.0%) | 0 (0.0%) |
| 10 to 14 Year Olds | 12 (80.0%) | 3 (20.0%) |
| 15 to 17 Year Olds | 7 (77.8%) | 2 (22.2%) |
| 18 to 19 Year Olds | 0 (0.0%) | 0 (0.0%) |
| 20 to 24 Year Olds | 0 (0.0%) | 0 (0.0%) |
| 25 to 34 Year Olds | 0 (0.0%) | 0 (0.0%) |
| 35 Years and over | 0 (0.0%) | 0 (0.0%) |
| Total | 36 (87.8%) | 5 (12.2%) |
Educational Attainment by Field of Study in Butlerville
Business (5 | 62.5%), computers & mathematics (2 | 25.0%), and arts & humanities (1 | 12.5%) are the most common fields of study among 8 individuals in Butlerville who have obtained a bachelor's degree or higher.
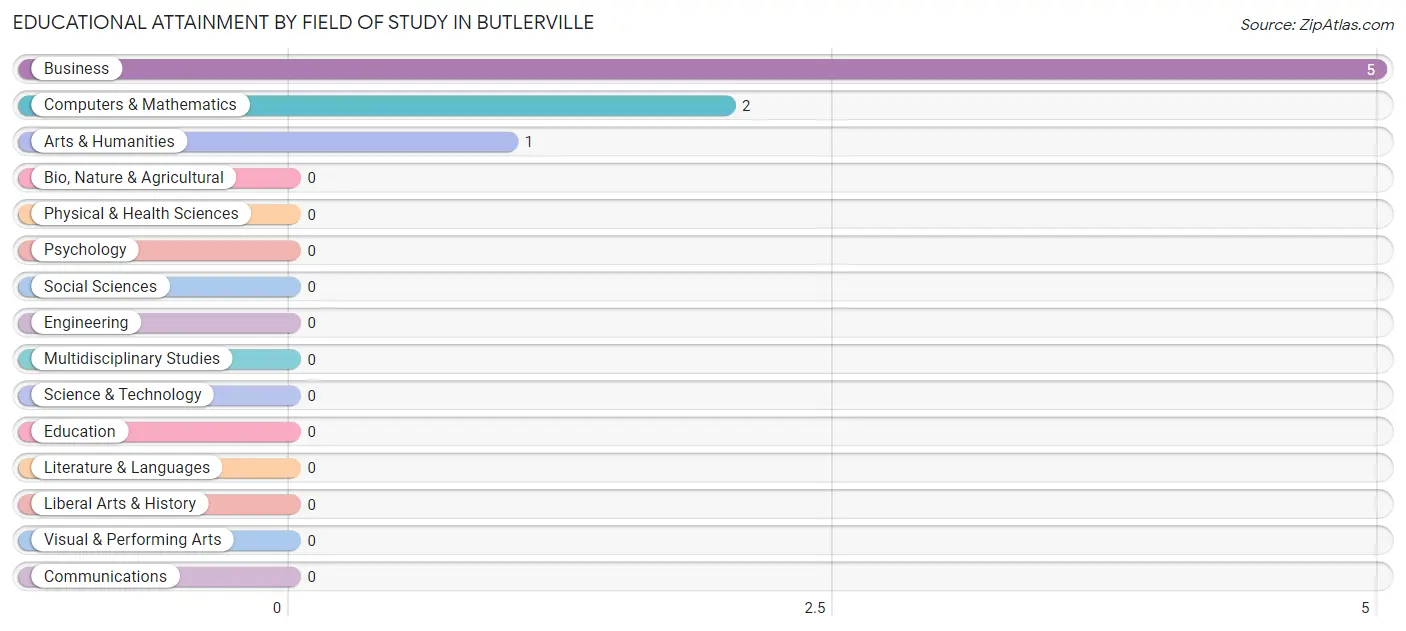
| Field of Study | # Graduates | % Graduates |
| Computers & Mathematics | 2 | 25.0% |
| Bio, Nature & Agricultural | 0 | 0.0% |
| Physical & Health Sciences | 0 | 0.0% |
| Psychology | 0 | 0.0% |
| Social Sciences | 0 | 0.0% |
| Engineering | 0 | 0.0% |
| Multidisciplinary Studies | 0 | 0.0% |
| Science & Technology | 0 | 0.0% |
| Business | 5 | 62.5% |
| Education | 0 | 0.0% |
| Literature & Languages | 0 | 0.0% |
| Liberal Arts & History | 0 | 0.0% |
| Visual & Performing Arts | 0 | 0.0% |
| Communications | 0 | 0.0% |
| Arts & Humanities | 1 | 12.5% |
| Total | 8 | 100.0% |
Transportation & Commute in Butlerville
Vehicle Availability by Sex in Butlerville
The most prevalent vehicle ownership categories in Butlerville are males with 3 vehicles (21, accounting for 42.0%) and females with 3 vehicles (11, making up 48.8%).
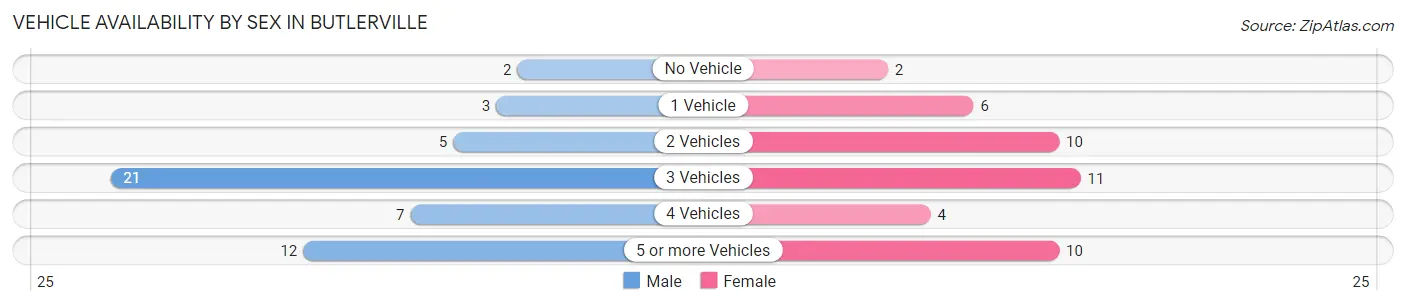
| Vehicles Available | Male | Female |
| No Vehicle | 2 (4.0%) | 2 (4.6%) |
| 1 Vehicle | 3 (6.0%) | 6 (14.0%) |
| 2 Vehicles | 5 (10.0%) | 10 (23.3%) |
| 3 Vehicles | 21 (42.0%) | 11 (25.6%) |
| 4 Vehicles | 7 (14.0%) | 4 (9.3%) |
| 5 or more Vehicles | 12 (24.0%) | 10 (23.3%) |
| Total | 50 (100.0%) | 43 (100.0%) |
Commute Time in Butlerville
The most frequently occuring commute durations in Butlerville are 30 to 34 minutes (16 commuters, 18.8%), 45 to 59 minutes (15 commuters, 17.6%), and 20 to 24 minutes (14 commuters, 16.5%).
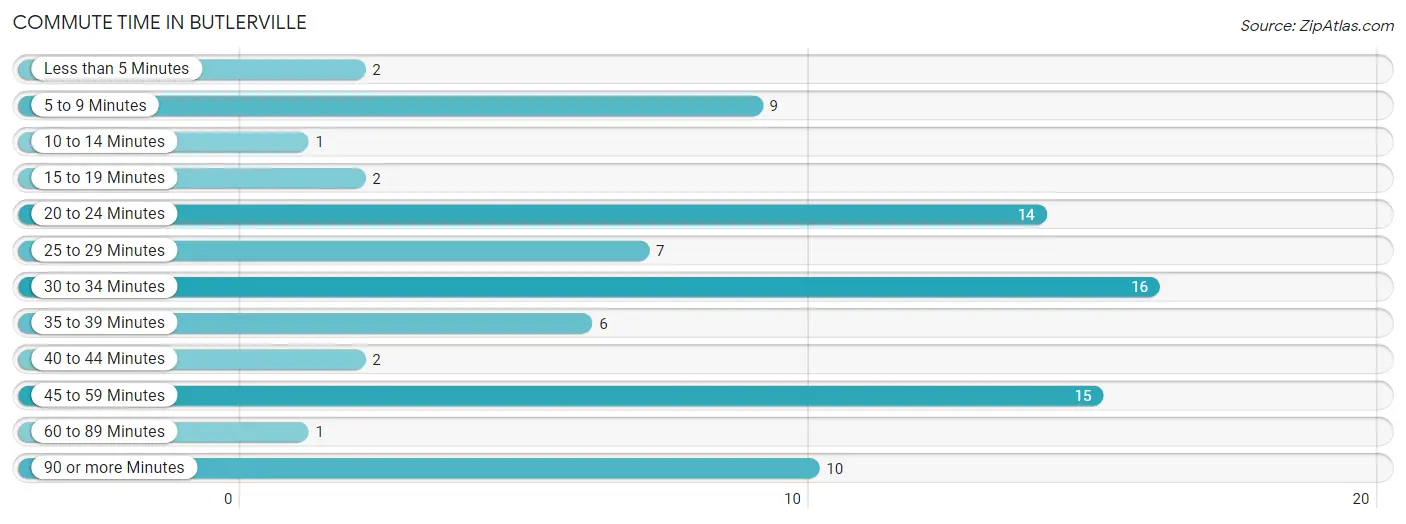
| Commute Time | # Commuters | % Commuters |
| Less than 5 Minutes | 2 | 2.4% |
| 5 to 9 Minutes | 9 | 10.6% |
| 10 to 14 Minutes | 1 | 1.2% |
| 15 to 19 Minutes | 2 | 2.4% |
| 20 to 24 Minutes | 14 | 16.5% |
| 25 to 29 Minutes | 7 | 8.2% |
| 30 to 34 Minutes | 16 | 18.8% |
| 35 to 39 Minutes | 6 | 7.1% |
| 40 to 44 Minutes | 2 | 2.4% |
| 45 to 59 Minutes | 15 | 17.6% |
| 60 to 89 Minutes | 1 | 1.2% |
| 90 or more Minutes | 10 | 11.8% |
Commute Time by Sex in Butlerville
The most common commute times in Butlerville are 45 to 59 minutes (11 commuters, 25.6%) for males and 30 to 34 minutes (14 commuters, 33.3%) for females.
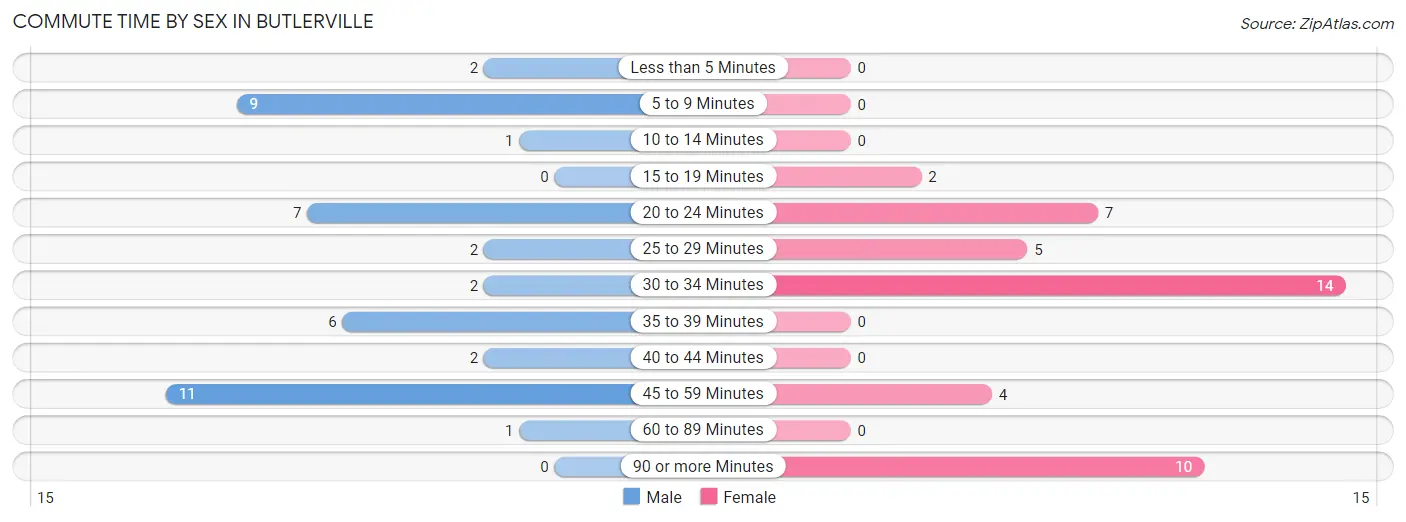
| Commute Time | Male | Female |
| Less than 5 Minutes | 2 (4.6%) | 0 (0.0%) |
| 5 to 9 Minutes | 9 (20.9%) | 0 (0.0%) |
| 10 to 14 Minutes | 1 (2.3%) | 0 (0.0%) |
| 15 to 19 Minutes | 0 (0.0%) | 2 (4.8%) |
| 20 to 24 Minutes | 7 (16.3%) | 7 (16.7%) |
| 25 to 29 Minutes | 2 (4.6%) | 5 (11.9%) |
| 30 to 34 Minutes | 2 (4.6%) | 14 (33.3%) |
| 35 to 39 Minutes | 6 (14.0%) | 0 (0.0%) |
| 40 to 44 Minutes | 2 (4.6%) | 0 (0.0%) |
| 45 to 59 Minutes | 11 (25.6%) | 4 (9.5%) |
| 60 to 89 Minutes | 1 (2.3%) | 0 (0.0%) |
| 90 or more Minutes | 0 (0.0%) | 10 (23.8%) |
Time of Departure to Work by Sex in Butlerville
The most frequent times of departure to work in Butlerville are 7:30 AM to 7:59 AM (13, 30.2%) for males and 6:30 AM to 6:59 AM (27, 64.3%) for females.
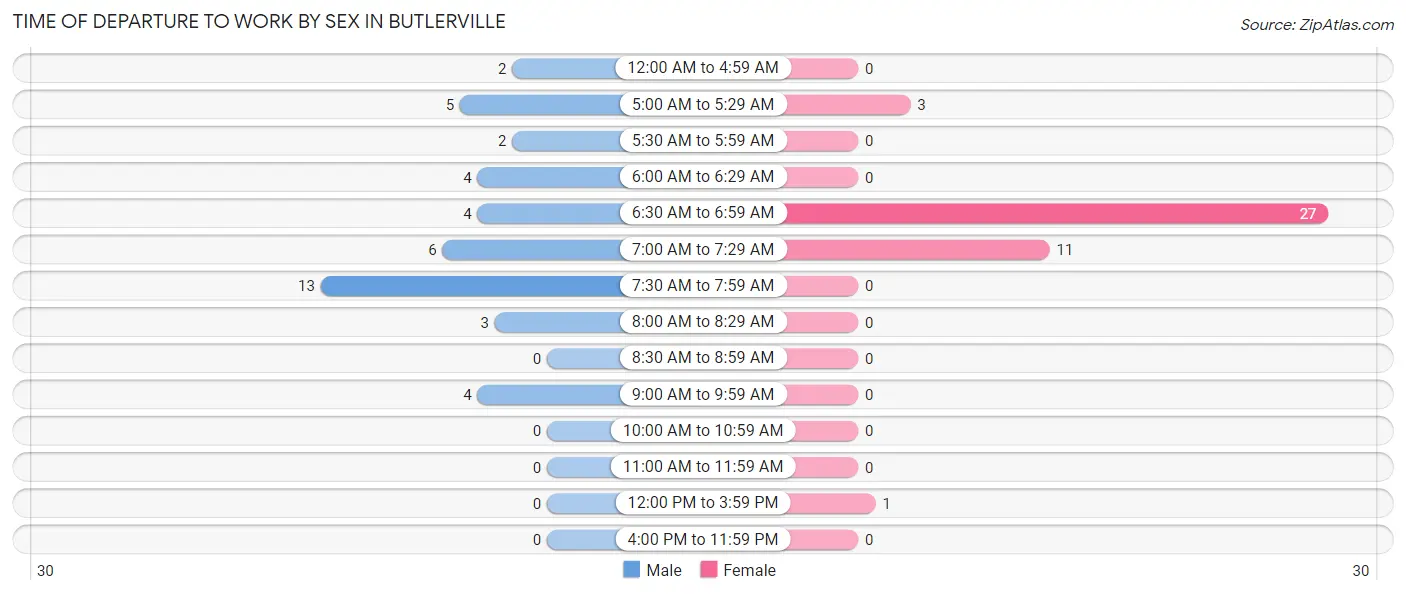
| Time of Departure | Male | Female |
| 12:00 AM to 4:59 AM | 2 (4.6%) | 0 (0.0%) |
| 5:00 AM to 5:29 AM | 5 (11.6%) | 3 (7.1%) |
| 5:30 AM to 5:59 AM | 2 (4.6%) | 0 (0.0%) |
| 6:00 AM to 6:29 AM | 4 (9.3%) | 0 (0.0%) |
| 6:30 AM to 6:59 AM | 4 (9.3%) | 27 (64.3%) |
| 7:00 AM to 7:29 AM | 6 (14.0%) | 11 (26.2%) |
| 7:30 AM to 7:59 AM | 13 (30.2%) | 0 (0.0%) |
| 8:00 AM to 8:29 AM | 3 (7.0%) | 0 (0.0%) |
| 8:30 AM to 8:59 AM | 0 (0.0%) | 0 (0.0%) |
| 9:00 AM to 9:59 AM | 4 (9.3%) | 0 (0.0%) |
| 10:00 AM to 10:59 AM | 0 (0.0%) | 0 (0.0%) |
| 11:00 AM to 11:59 AM | 0 (0.0%) | 0 (0.0%) |
| 12:00 PM to 3:59 PM | 0 (0.0%) | 1 (2.4%) |
| 4:00 PM to 11:59 PM | 0 (0.0%) | 0 (0.0%) |
| Total | 43 (100.0%) | 42 (100.0%) |
Housing Occupancy in Butlerville
Occupancy by Ownership in Butlerville
Of the total 75 dwellings in Butlerville, owner-occupied units account for 50 (66.7%), while renter-occupied units make up 25 (33.3%).
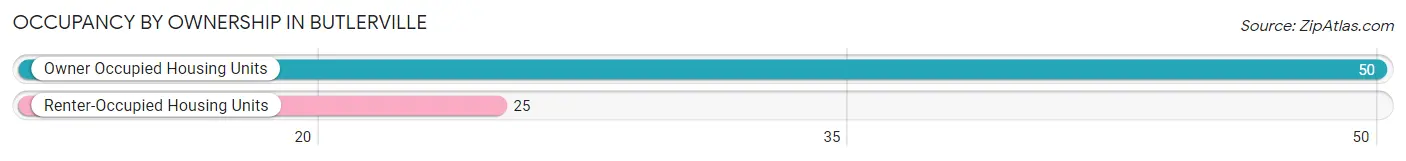
| Occupancy | # Housing Units | % Housing Units |
| Owner Occupied Housing Units | 50 | 66.7% |
| Renter-Occupied Housing Units | 25 | 33.3% |
| Total Occupied Housing Units | 75 | 100.0% |
Occupancy by Household Size in Butlerville
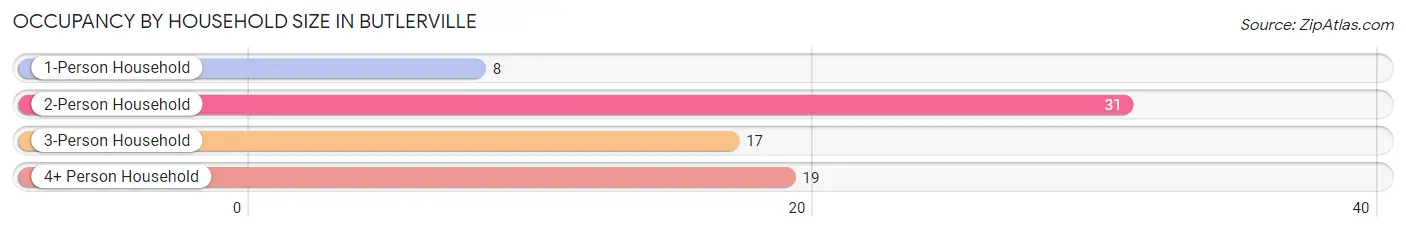
| Household Size | # Housing Units | % Housing Units |
| 1-Person Household | 8 | 10.7% |
| 2-Person Household | 31 | 41.3% |
| 3-Person Household | 17 | 22.7% |
| 4+ Person Household | 19 | 25.3% |
| Total Housing Units | 75 | 100.0% |
Occupancy by Ownership by Household Size in Butlerville
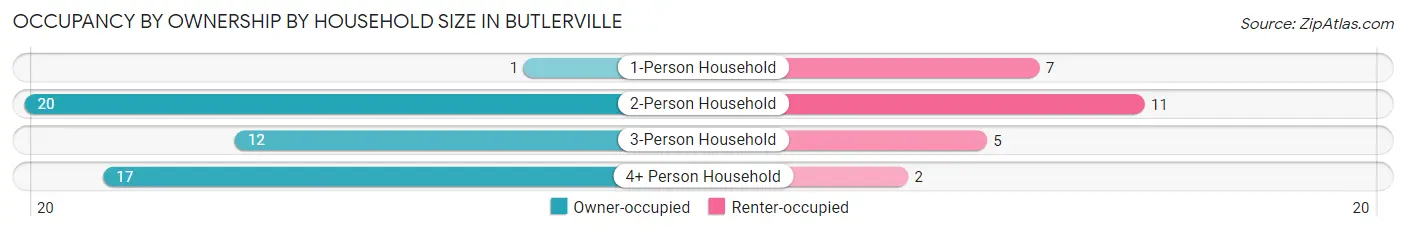
| Household Size | Owner-occupied | Renter-occupied |
| 1-Person Household | 1 (12.5%) | 7 (87.5%) |
| 2-Person Household | 20 (64.5%) | 11 (35.5%) |
| 3-Person Household | 12 (70.6%) | 5 (29.4%) |
| 4+ Person Household | 17 (89.5%) | 2 (10.5%) |
| Total Housing Units | 50 (66.7%) | 25 (33.3%) |
Occupancy by Educational Attainment in Butlerville
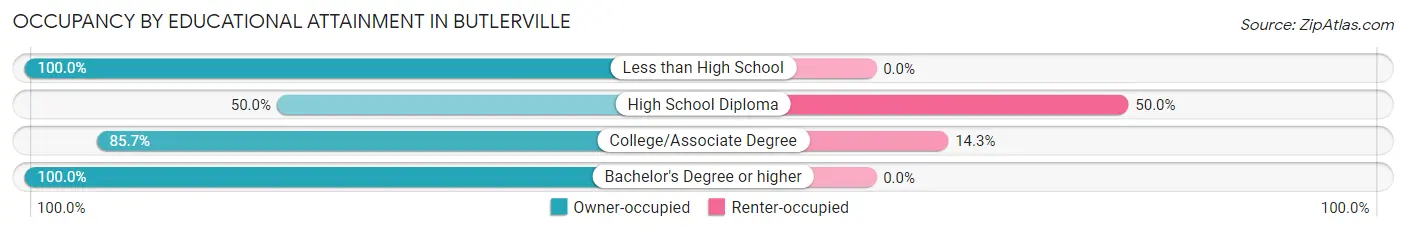
| Household Size | Owner-occupied | Renter-occupied |
| Less than High School | 11 (100.0%) | 0 (0.0%) |
| High School Diploma | 23 (50.0%) | 23 (50.0%) |
| College/Associate Degree | 12 (85.7%) | 2 (14.3%) |
| Bachelor's Degree or higher | 4 (100.0%) | 0 (0.0%) |
Occupancy by Age of Householder in Butlerville
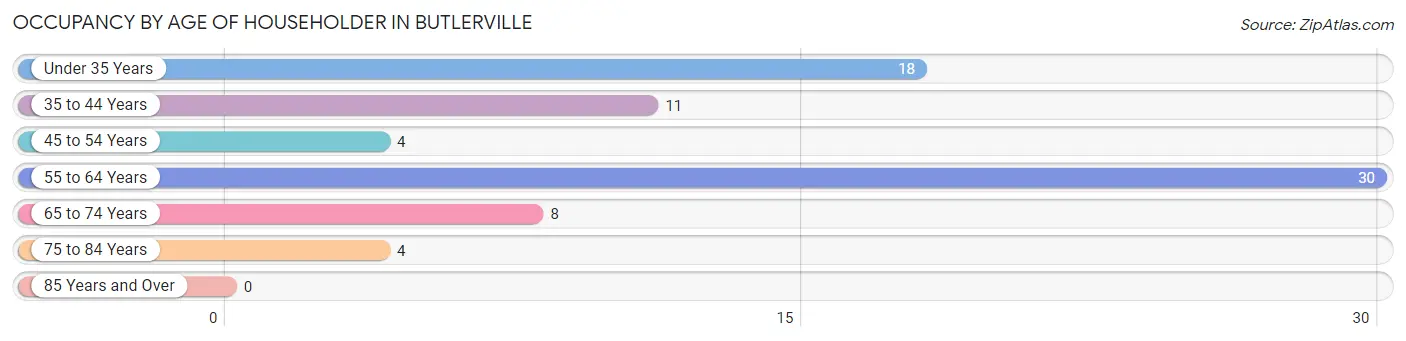
| Age Bracket | # Households | % Households |
| Under 35 Years | 18 | 24.0% |
| 35 to 44 Years | 11 | 14.7% |
| 45 to 54 Years | 4 | 5.3% |
| 55 to 64 Years | 30 | 40.0% |
| 65 to 74 Years | 8 | 10.7% |
| 75 to 84 Years | 4 | 5.3% |
| 85 Years and Over | 0 | 0.0% |
| Total | 75 | 100.0% |
Housing Finances in Butlerville
Median Income by Occupancy in Butlerville
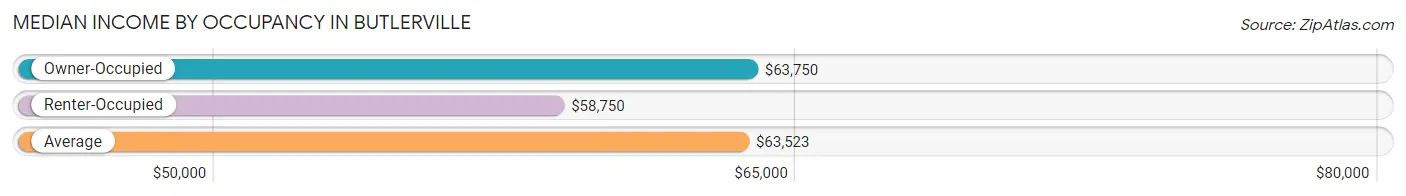
| Occupancy Type | # Households | Median Income |
| Owner-Occupied | 50 (66.7%) | $63,750 |
| Renter-Occupied | 25 (33.3%) | $58,750 |
| Average | 75 (100.0%) | $63,523 |
Occupancy by Householder Income Bracket in Butlerville
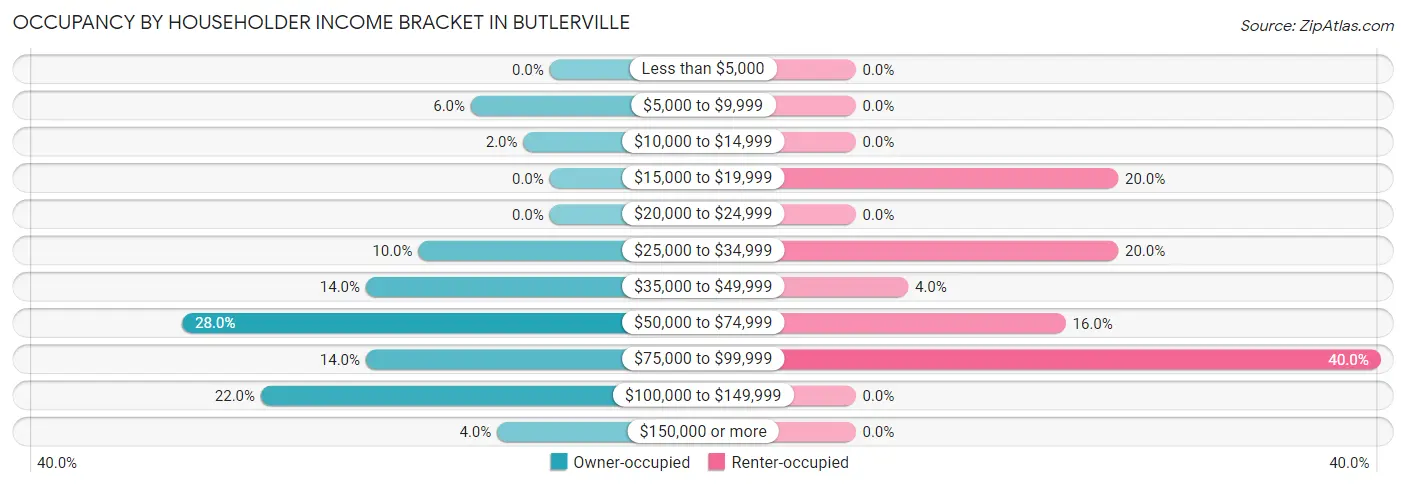
| Income Bracket | Owner-occupied | Renter-occupied |
| Less than $5,000 | 0 (0.0%) | 0 (0.0%) |
| $5,000 to $9,999 | 3 (6.0%) | 0 (0.0%) |
| $10,000 to $14,999 | 1 (2.0%) | 0 (0.0%) |
| $15,000 to $19,999 | 0 (0.0%) | 5 (20.0%) |
| $20,000 to $24,999 | 0 (0.0%) | 0 (0.0%) |
| $25,000 to $34,999 | 5 (10.0%) | 5 (20.0%) |
| $35,000 to $49,999 | 7 (14.0%) | 1 (4.0%) |
| $50,000 to $74,999 | 14 (28.0%) | 4 (16.0%) |
| $75,000 to $99,999 | 7 (14.0%) | 10 (40.0%) |
| $100,000 to $149,999 | 11 (22.0%) | 0 (0.0%) |
| $150,000 or more | 2 (4.0%) | 0 (0.0%) |
| Total | 50 (100.0%) | 25 (100.0%) |
Monthly Housing Cost Tiers in Butlerville
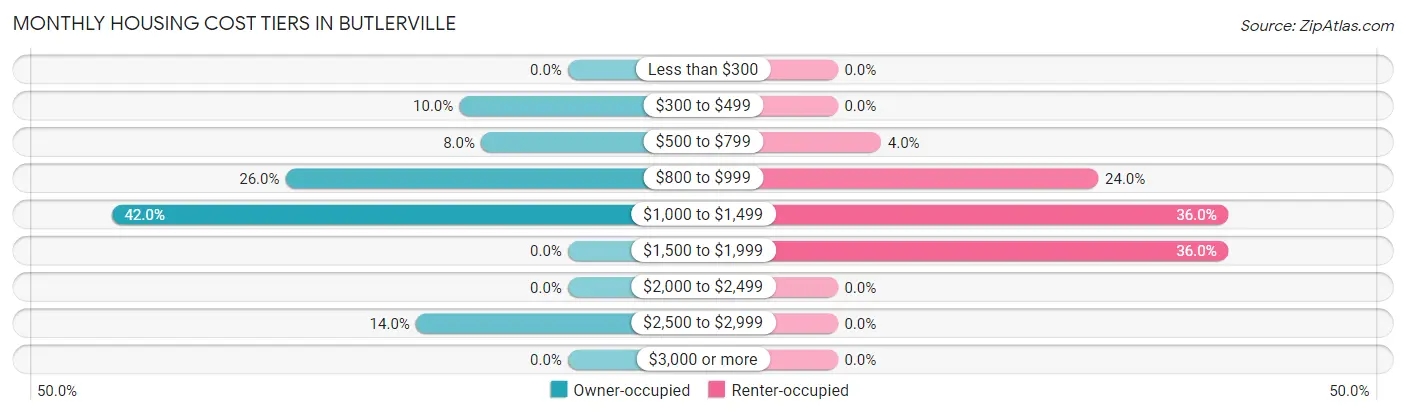
| Monthly Cost | Owner-occupied | Renter-occupied |
| Less than $300 | 0 (0.0%) | 0 (0.0%) |
| $300 to $499 | 5 (10.0%) | 0 (0.0%) |
| $500 to $799 | 4 (8.0%) | 1 (4.0%) |
| $800 to $999 | 13 (26.0%) | 6 (24.0%) |
| $1,000 to $1,499 | 21 (42.0%) | 9 (36.0%) |
| $1,500 to $1,999 | 0 (0.0%) | 9 (36.0%) |
| $2,000 to $2,499 | 0 (0.0%) | 0 (0.0%) |
| $2,500 to $2,999 | 7 (14.0%) | 0 (0.0%) |
| $3,000 or more | 0 (0.0%) | 0 (0.0%) |
| Total | 50 (100.0%) | 25 (100.0%) |
Physical Housing Characteristics in Butlerville
Housing Structures in Butlerville
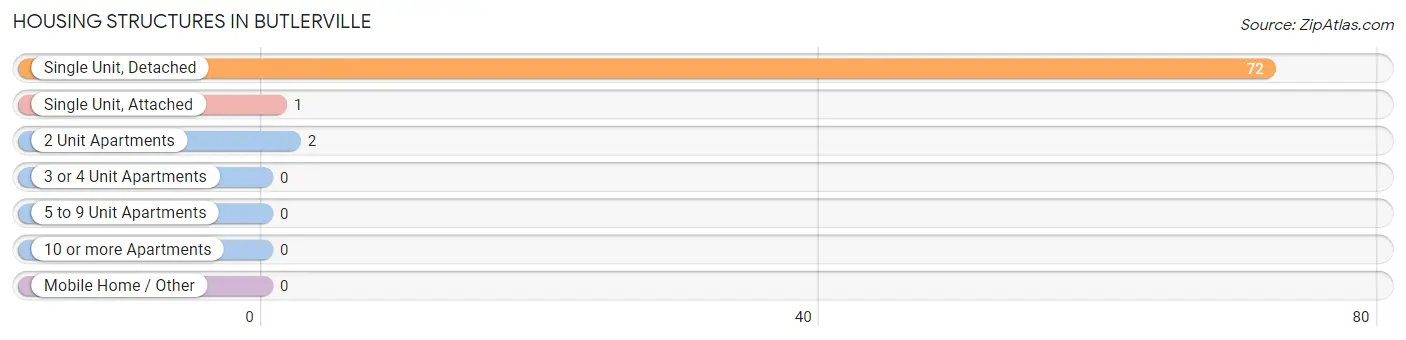
| Structure Type | # Housing Units | % Housing Units |
| Single Unit, Detached | 72 | 96.0% |
| Single Unit, Attached | 1 | 1.3% |
| 2 Unit Apartments | 2 | 2.7% |
| 3 or 4 Unit Apartments | 0 | 0.0% |
| 5 to 9 Unit Apartments | 0 | 0.0% |
| 10 or more Apartments | 0 | 0.0% |
| Mobile Home / Other | 0 | 0.0% |
| Total | 75 | 100.0% |
Housing Structures by Occupancy in Butlerville
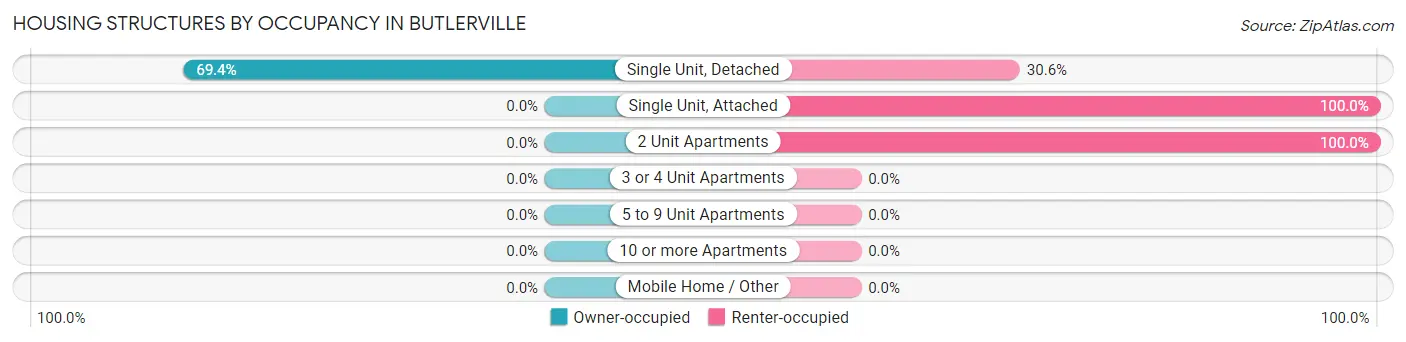
| Structure Type | Owner-occupied | Renter-occupied |
| Single Unit, Detached | 50 (69.4%) | 22 (30.6%) |
| Single Unit, Attached | 0 (0.0%) | 1 (100.0%) |
| 2 Unit Apartments | 0 (0.0%) | 2 (100.0%) |
| 3 or 4 Unit Apartments | 0 (0.0%) | 0 (0.0%) |
| 5 to 9 Unit Apartments | 0 (0.0%) | 0 (0.0%) |
| 10 or more Apartments | 0 (0.0%) | 0 (0.0%) |
| Mobile Home / Other | 0 (0.0%) | 0 (0.0%) |
| Total | 50 (66.7%) | 25 (33.3%) |
Housing Structures by Number of Rooms in Butlerville
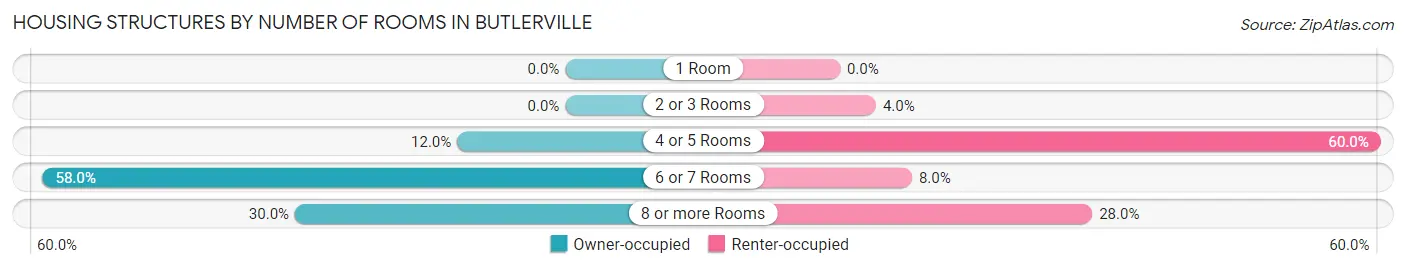
| Number of Rooms | Owner-occupied | Renter-occupied |
| 1 Room | 0 (0.0%) | 0 (0.0%) |
| 2 or 3 Rooms | 0 (0.0%) | 1 (4.0%) |
| 4 or 5 Rooms | 6 (12.0%) | 15 (60.0%) |
| 6 or 7 Rooms | 29 (58.0%) | 2 (8.0%) |
| 8 or more Rooms | 15 (30.0%) | 7 (28.0%) |
| Total | 50 (100.0%) | 25 (100.0%) |
Housing Structure by Heating Type in Butlerville
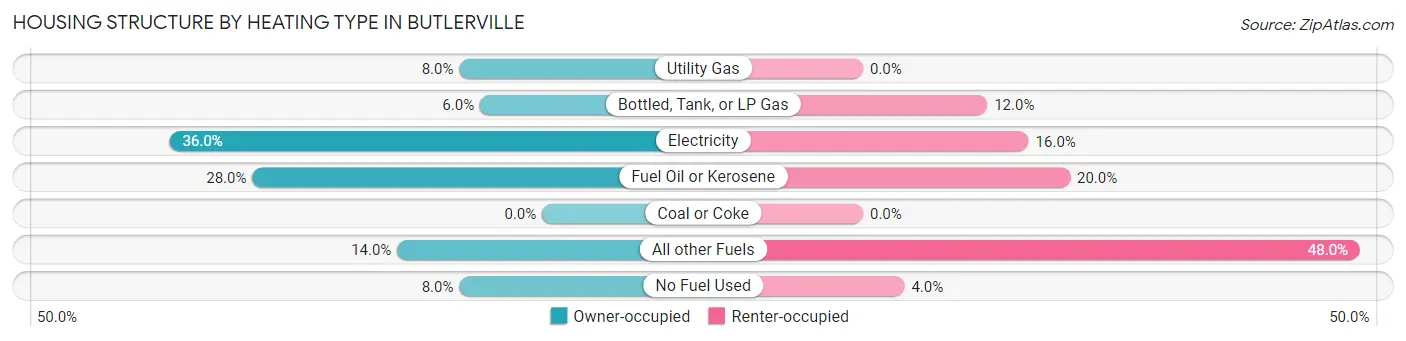
| Heating Type | Owner-occupied | Renter-occupied |
| Utility Gas | 4 (8.0%) | 0 (0.0%) |
| Bottled, Tank, or LP Gas | 3 (6.0%) | 3 (12.0%) |
| Electricity | 18 (36.0%) | 4 (16.0%) |
| Fuel Oil or Kerosene | 14 (28.0%) | 5 (20.0%) |
| Coal or Coke | 0 (0.0%) | 0 (0.0%) |
| All other Fuels | 7 (14.0%) | 12 (48.0%) |
| No Fuel Used | 4 (8.0%) | 1 (4.0%) |
| Total | 50 (100.0%) | 25 (100.0%) |
Household Vehicle Usage in Butlerville
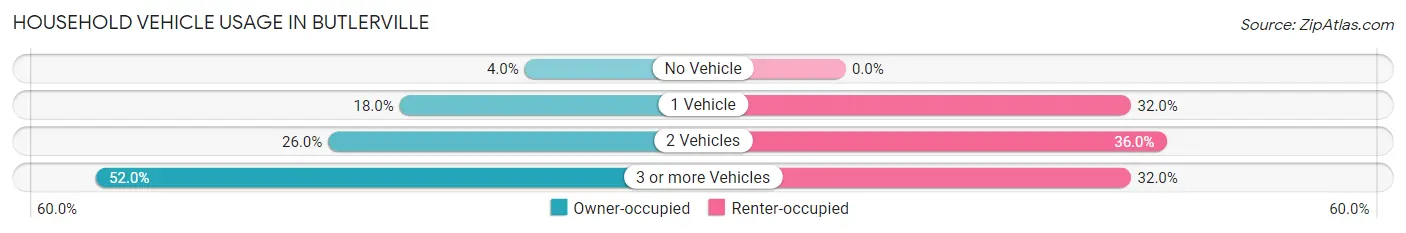
| Vehicles per Household | Owner-occupied | Renter-occupied |
| No Vehicle | 2 (4.0%) | 0 (0.0%) |
| 1 Vehicle | 9 (18.0%) | 8 (32.0%) |
| 2 Vehicles | 13 (26.0%) | 9 (36.0%) |
| 3 or more Vehicles | 26 (52.0%) | 8 (32.0%) |
| Total | 50 (100.0%) | 25 (100.0%) |
Real Estate & Mortgages in Butlerville
Real Estate and Mortgage Overview in Butlerville
| Characteristic | Without Mortgage | With Mortgage |
| Housing Units | 7 | 43 |
| Median Property Value | $184,400 | $135,200 |
| Median Household Income | - | - |
| Monthly Housing Costs | $463 | $0 |
| Real Estate Taxes | $2,300 | $8 |
Property Value by Mortgage Status in Butlerville
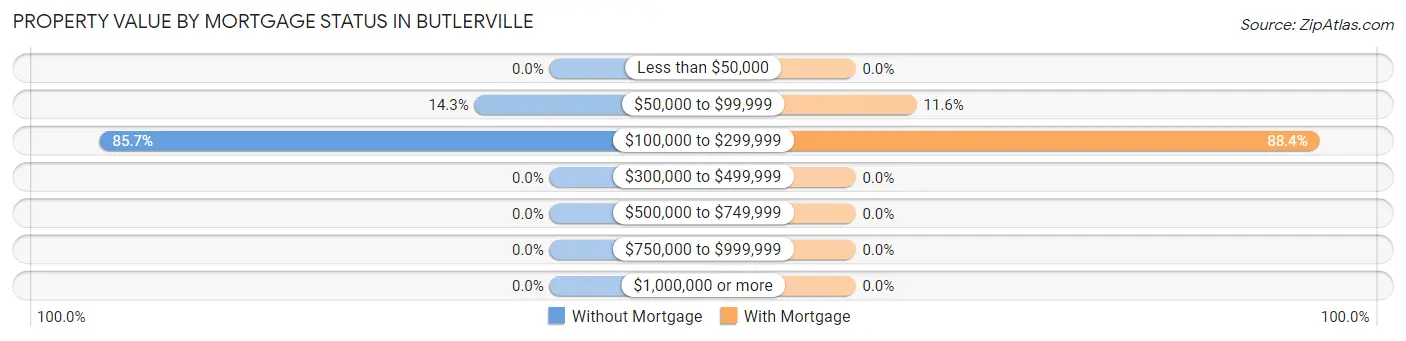
| Property Value | Without Mortgage | With Mortgage |
| Less than $50,000 | 0 (0.0%) | 0 (0.0%) |
| $50,000 to $99,999 | 1 (14.3%) | 5 (11.6%) |
| $100,000 to $299,999 | 6 (85.7%) | 38 (88.4%) |
| $300,000 to $499,999 | 0 (0.0%) | 0 (0.0%) |
| $500,000 to $749,999 | 0 (0.0%) | 0 (0.0%) |
| $750,000 to $999,999 | 0 (0.0%) | 0 (0.0%) |
| $1,000,000 or more | 0 (0.0%) | 0 (0.0%) |
| Total | 7 (100.0%) | 43 (100.0%) |
Household Income by Mortgage Status in Butlerville
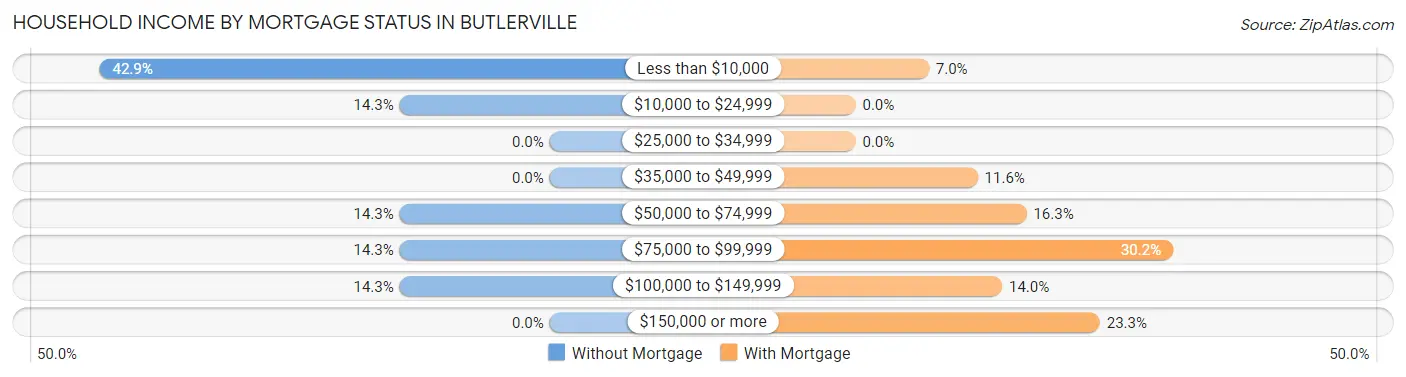
| Household Income | Without Mortgage | With Mortgage |
| Less than $10,000 | 3 (42.9%) | 3 (7.0%) |
| $10,000 to $24,999 | 1 (14.3%) | 0 (0.0%) |
| $25,000 to $34,999 | 0 (0.0%) | 0 (0.0%) |
| $35,000 to $49,999 | 0 (0.0%) | 5 (11.6%) |
| $50,000 to $74,999 | 1 (14.3%) | 7 (16.3%) |
| $75,000 to $99,999 | 1 (14.3%) | 13 (30.2%) |
| $100,000 to $149,999 | 1 (14.3%) | 6 (14.0%) |
| $150,000 or more | 0 (0.0%) | 10 (23.3%) |
| Total | 7 (100.0%) | 43 (100.0%) |
Property Value to Household Income Ratio in Butlerville
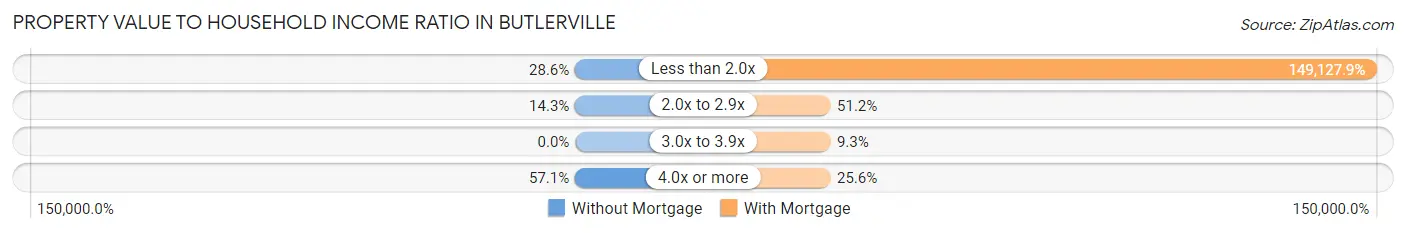
| Value-to-Income Ratio | Without Mortgage | With Mortgage |
| Less than 2.0x | 2 (28.6%) | 64,125 (149,127.9%) |
| 2.0x to 2.9x | 1 (14.3%) | 22 (51.2%) |
| 3.0x to 3.9x | 0 (0.0%) | 4 (9.3%) |
| 4.0x or more | 4 (57.1%) | 11 (25.6%) |
| Total | 7 (100.0%) | 43 (100.0%) |
Real Estate Taxes by Mortgage Status in Butlerville
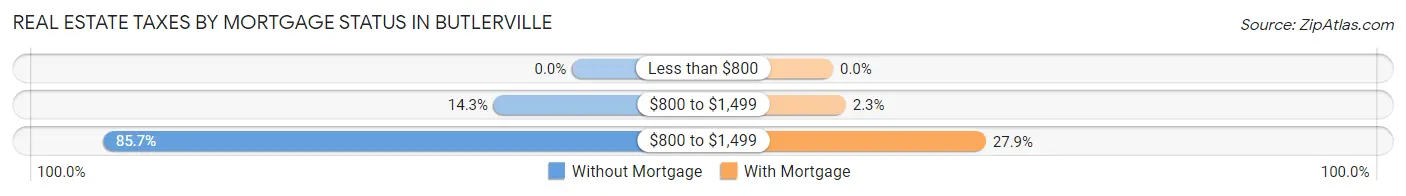
| Property Taxes | Without Mortgage | With Mortgage |
| Less than $800 | 0 (0.0%) | 0 (0.0%) |
| $800 to $1,499 | 1 (14.3%) | 1 (2.3%) |
| $800 to $1,499 | 6 (85.7%) | 12 (27.9%) |
| Total | 7 (100.0%) | 43 (100.0%) |
Health & Disability in Butlerville
Health Insurance Coverage by Age in Butlerville
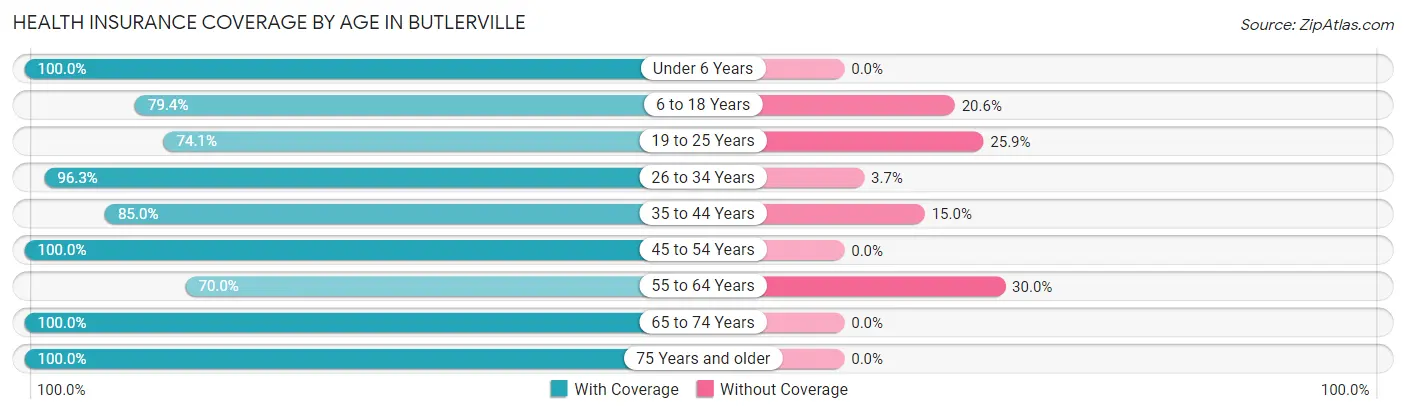
| Age Bracket | With Coverage | Without Coverage |
| Under 6 Years | 22 (100.0%) | 0 (0.0%) |
| 6 to 18 Years | 27 (79.4%) | 7 (20.6%) |
| 19 to 25 Years | 20 (74.1%) | 7 (25.9%) |
| 26 to 34 Years | 26 (96.3%) | 1 (3.7%) |
| 35 to 44 Years | 17 (85.0%) | 3 (15.0%) |
| 45 to 54 Years | 15 (100.0%) | 0 (0.0%) |
| 55 to 64 Years | 35 (70.0%) | 15 (30.0%) |
| 65 to 74 Years | 12 (100.0%) | 0 (0.0%) |
| 75 Years and older | 6 (100.0%) | 0 (0.0%) |
| Total | 180 (84.5%) | 33 (15.5%) |
Health Insurance Coverage by Citizenship Status in Butlerville
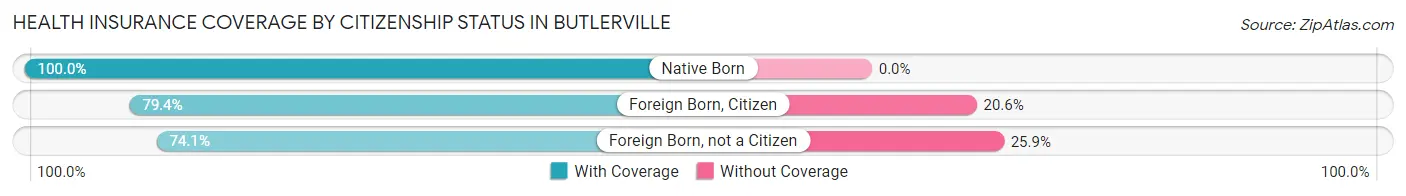
| Citizenship Status | With Coverage | Without Coverage |
| Native Born | 22 (100.0%) | 0 (0.0%) |
| Foreign Born, Citizen | 27 (79.4%) | 7 (20.6%) |
| Foreign Born, not a Citizen | 20 (74.1%) | 7 (25.9%) |
Health Insurance Coverage by Household Income in Butlerville
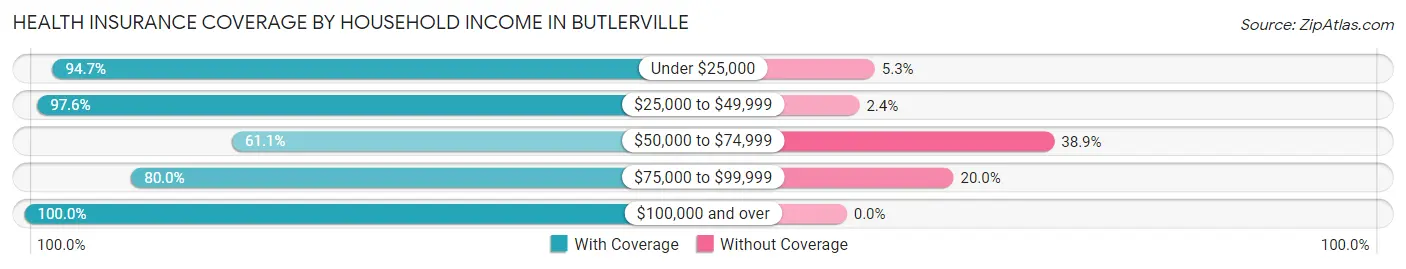
| Household Income | With Coverage | Without Coverage |
| Under $25,000 | 18 (94.7%) | 1 (5.3%) |
| $25,000 to $49,999 | 41 (97.6%) | 1 (2.4%) |
| $50,000 to $74,999 | 33 (61.1%) | 21 (38.9%) |
| $75,000 to $99,999 | 40 (80.0%) | 10 (20.0%) |
| $100,000 and over | 48 (100.0%) | 0 (0.0%) |
Public vs Private Health Insurance Coverage by Age in Butlerville
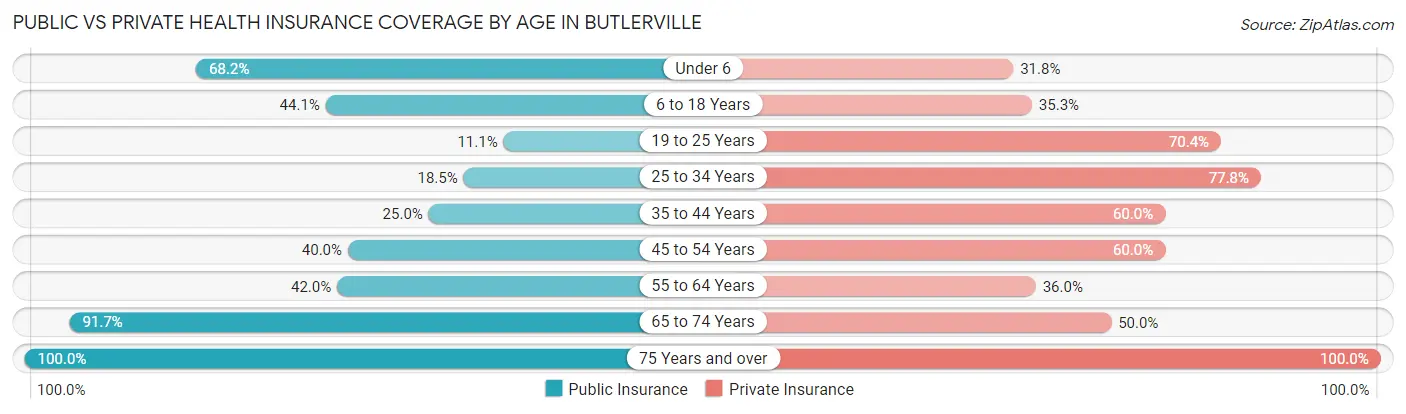
| Age Bracket | Public Insurance | Private Insurance |
| Under 6 | 15 (68.2%) | 7 (31.8%) |
| 6 to 18 Years | 15 (44.1%) | 12 (35.3%) |
| 19 to 25 Years | 3 (11.1%) | 19 (70.4%) |
| 25 to 34 Years | 5 (18.5%) | 21 (77.8%) |
| 35 to 44 Years | 5 (25.0%) | 12 (60.0%) |
| 45 to 54 Years | 6 (40.0%) | 9 (60.0%) |
| 55 to 64 Years | 21 (42.0%) | 18 (36.0%) |
| 65 to 74 Years | 11 (91.7%) | 6 (50.0%) |
| 75 Years and over | 6 (100.0%) | 6 (100.0%) |
| Total | 87 (40.8%) | 110 (51.6%) |
Disability Status by Sex by Age in Butlerville
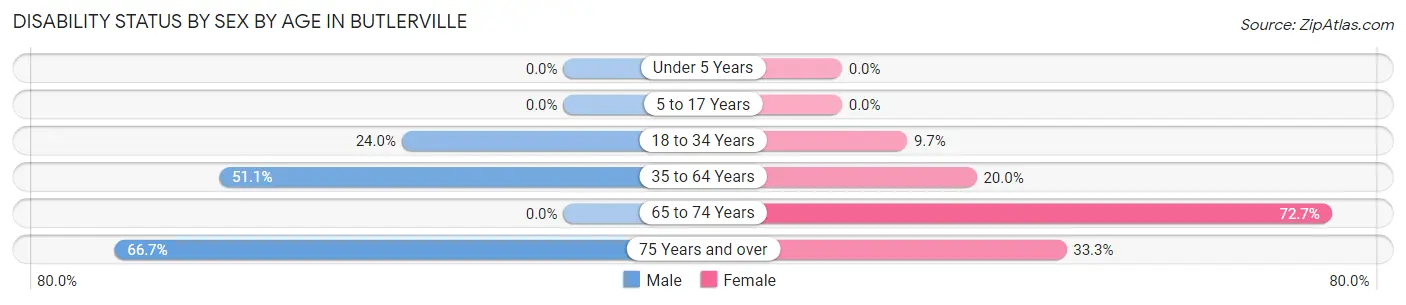
| Age Bracket | Male | Female |
| Under 5 Years | 0 (0.0%) | 0 (0.0%) |
| 5 to 17 Years | 0 (0.0%) | 0 (0.0%) |
| 18 to 34 Years | 6 (24.0%) | 3 (9.7%) |
| 35 to 64 Years | 23 (51.1%) | 8 (20.0%) |
| 65 to 74 Years | 0 (0.0%) | 8 (72.7%) |
| 75 Years and over | 2 (66.7%) | 1 (33.3%) |
Disability Class by Sex by Age in Butlerville
Disability Class: Hearing Difficulty
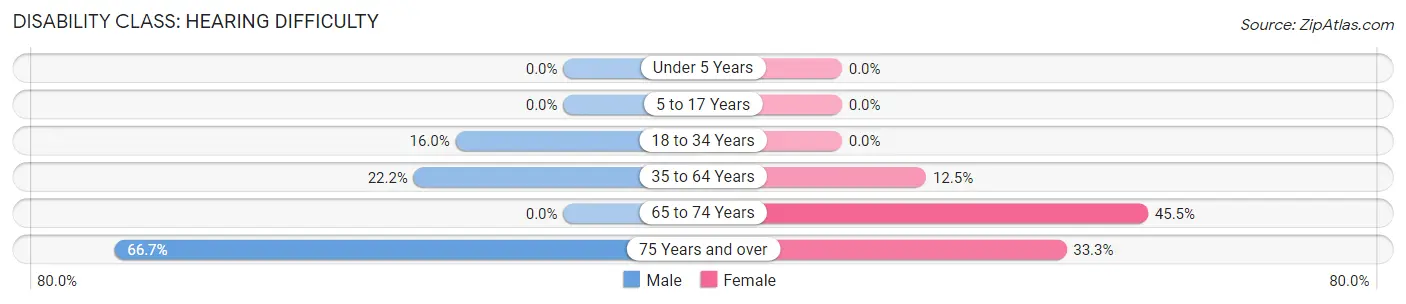
| Age Bracket | Male | Female |
| Under 5 Years | 0 (0.0%) | 0 (0.0%) |
| 5 to 17 Years | 0 (0.0%) | 0 (0.0%) |
| 18 to 34 Years | 4 (16.0%) | 0 (0.0%) |
| 35 to 64 Years | 10 (22.2%) | 5 (12.5%) |
| 65 to 74 Years | 0 (0.0%) | 5 (45.5%) |
| 75 Years and over | 2 (66.7%) | 1 (33.3%) |
Disability Class: Vision Difficulty
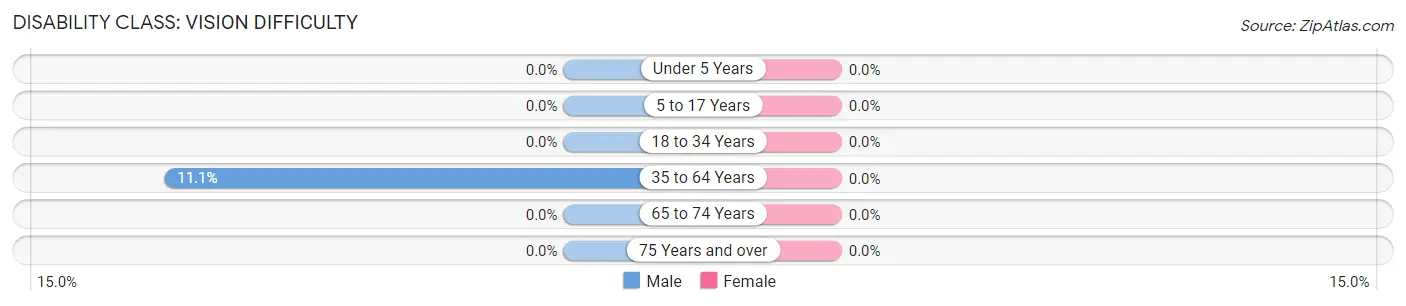
| Age Bracket | Male | Female |
| Under 5 Years | 0 (0.0%) | 0 (0.0%) |
| 5 to 17 Years | 0 (0.0%) | 0 (0.0%) |
| 18 to 34 Years | 0 (0.0%) | 0 (0.0%) |
| 35 to 64 Years | 5 (11.1%) | 0 (0.0%) |
| 65 to 74 Years | 0 (0.0%) | 0 (0.0%) |
| 75 Years and over | 0 (0.0%) | 0 (0.0%) |
Disability Class: Cognitive Difficulty
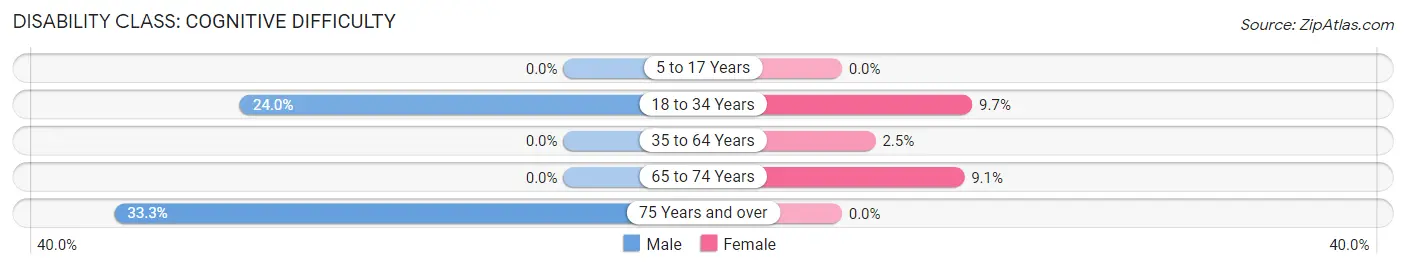
| Age Bracket | Male | Female |
| 5 to 17 Years | 0 (0.0%) | 0 (0.0%) |
| 18 to 34 Years | 6 (24.0%) | 3 (9.7%) |
| 35 to 64 Years | 0 (0.0%) | 1 (2.5%) |
| 65 to 74 Years | 0 (0.0%) | 1 (9.1%) |
| 75 Years and over | 1 (33.3%) | 0 (0.0%) |
Disability Class: Ambulatory Difficulty
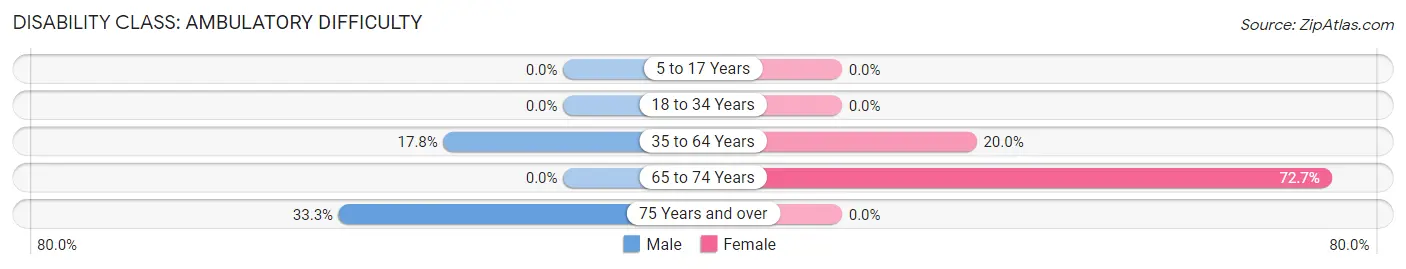
| Age Bracket | Male | Female |
| 5 to 17 Years | 0 (0.0%) | 0 (0.0%) |
| 18 to 34 Years | 0 (0.0%) | 0 (0.0%) |
| 35 to 64 Years | 8 (17.8%) | 8 (20.0%) |
| 65 to 74 Years | 0 (0.0%) | 8 (72.7%) |
| 75 Years and over | 1 (33.3%) | 0 (0.0%) |
Disability Class: Self-Care Difficulty
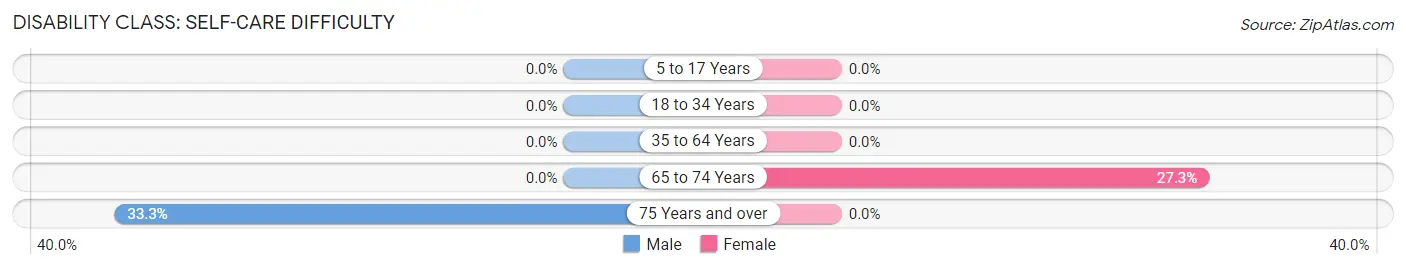
| Age Bracket | Male | Female |
| 5 to 17 Years | 0 (0.0%) | 0 (0.0%) |
| 18 to 34 Years | 0 (0.0%) | 0 (0.0%) |
| 35 to 64 Years | 0 (0.0%) | 0 (0.0%) |
| 65 to 74 Years | 0 (0.0%) | 3 (27.3%) |
| 75 Years and over | 1 (33.3%) | 0 (0.0%) |
Technology Access in Butlerville
Computing Device Access in Butlerville
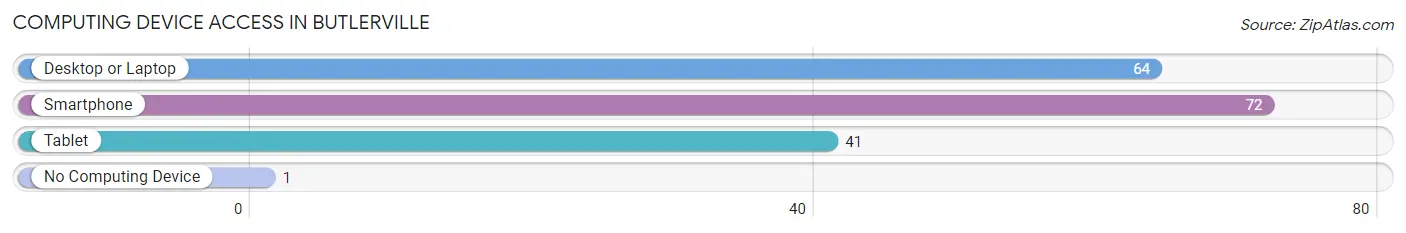
| Device Type | # Households | % Households |
| Desktop or Laptop | 64 | 85.3% |
| Smartphone | 72 | 96.0% |
| Tablet | 41 | 54.7% |
| No Computing Device | 1 | 1.3% |
| Total | 75 | 100.0% |
Internet Access in Butlerville
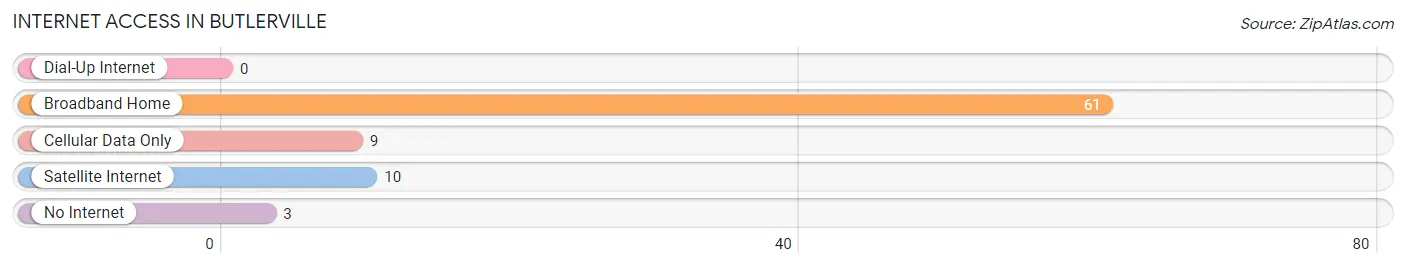
| Internet Type | # Households | % Households |
| Dial-Up Internet | 0 | 0.0% |
| Broadband Home | 61 | 81.3% |
| Cellular Data Only | 9 | 12.0% |
| Satellite Internet | 10 | 13.3% |
| No Internet | 3 | 4.0% |
| Total | 75 | 100.0% |
Butlerville Summary
Butlerville, Ohio is a small village located in the southeastern part of the state, in the county of Jackson. It is situated on the banks of the Scioto River, and is part of the Jackson County School District. The village has a population of approximately 1,000 people, and is home to a variety of businesses, including a grocery store, a gas station, a post office, and a few restaurants.
History
Butlerville was founded in 1817 by a group of settlers from Pennsylvania. The village was named after the first settler, John Butler, who had purchased the land from the Scioto Land Company. The village was originally a farming community, and the settlers grew corn, wheat, and other crops. As the village grew, more businesses began to open, including a blacksmith shop, a general store, and a post office.
In the late 1800s, the village began to experience a period of growth and prosperity. The railroad was built through the village, and the population began to increase. The village also became a popular destination for tourists, as it was located near the Scioto River and had a variety of recreational activities.
In the early 1900s, the village experienced a period of decline. The railroad was removed, and the population began to decrease. The village was also hit hard by the Great Depression, and many businesses closed.
Geography
Butlerville is located in the southeastern part of Ohio, in Jackson County. It is situated on the banks of the Scioto River, and is part of the Jackson County School District. The village has a total area of 0.6 square miles, all of which is land. The village is located approximately 25 miles from Columbus, the state capital.
Economy
Butlerville is a small village with a population of approximately 1,000 people. The village is home to a variety of businesses, including a grocery store, a gas station, a post office, and a few restaurants. The village also has a few small manufacturing businesses, such as a furniture factory and a printing company.
The village is also home to a few small farms, which produce corn, wheat, and other crops. The village also has a few small businesses, such as a hardware store and a barber shop.
Demographics
As of the 2010 census, the population of Butlerville was 1,000 people. The racial makeup of the village was 97.7% White, 0.7% African American, 0.2% Native American, 0.2% Asian, and 1.2% from other races. The median household income was $37,500, and the median family income was $45,000. The per capita income was $18,000.
Conclusion
Butlerville is a small village located in the southeastern part of Ohio, in Jackson County. It is situated on the banks of the Scioto River, and is part of the Jackson County School District. The village has a population of approximately 1,000 people, and is home to a variety of businesses, including a grocery store, a gas station, a post office, and a few restaurants. The village also has a few small manufacturing businesses, such as a furniture factory and a printing company. The village is also home to a few small farms, which produce corn, wheat, and other crops. The village has a diverse population, with a median household income of $37,500 and a median family income of $45,000.
Common Questions
What is the Total Population of Butlerville?
Total Population of Butlerville is 213.
What is the Total Male Population of Butlerville?
Total Male Population of Butlerville is 92.
What is the Total Female Population of Butlerville?
Total Female Population of Butlerville is 121.
What is the Ratio of Males per 100 Females in Butlerville?
There are 76.03 Males per 100 Females in Butlerville.
What is the Ratio of Females per 100 Males in Butlerville?
There are 131.52 Females per 100 Males in Butlerville.
What is the Median Population Age in Butlerville?
Median Population Age in Butlerville is 34.1 Years.
What is the Average Family Size in Butlerville
Average Family Size in Butlerville is 3.0 People.
What is the Average Household Size in Butlerville
Average Household Size in Butlerville is 2.8 People.
What is Per Capita Income in Butlerville?
Per Capita income in Butlerville is $23,479.
What is the Median Family Income in Butlerville?
Median Family Income in Butlerville is $64,000.
What is the Median Household income in Butlerville?
Median Household Income in Butlerville is $63,523.
What is Income or Wage Gap in Butlerville?
Income or Wage Gap in Butlerville is 41.0%.
Women in Butlerville earn 59.0 cents for every dollar earned by a man.
What is Inequality or Gini Index in Butlerville?
Inequality or Gini Index in Butlerville is 0.32.
How Large is the Labor Force in Butlerville?
There are 105 People in the Labor Forcein in Butlerville.
What is the Percentage of People in the Labor Force in Butlerville?
65.2% of People are in the Labor Force in Butlerville.
What is the Unemployment Rate in Butlerville?
Unemployment Rate in Butlerville is 10.5%.