Fayetteville, OH
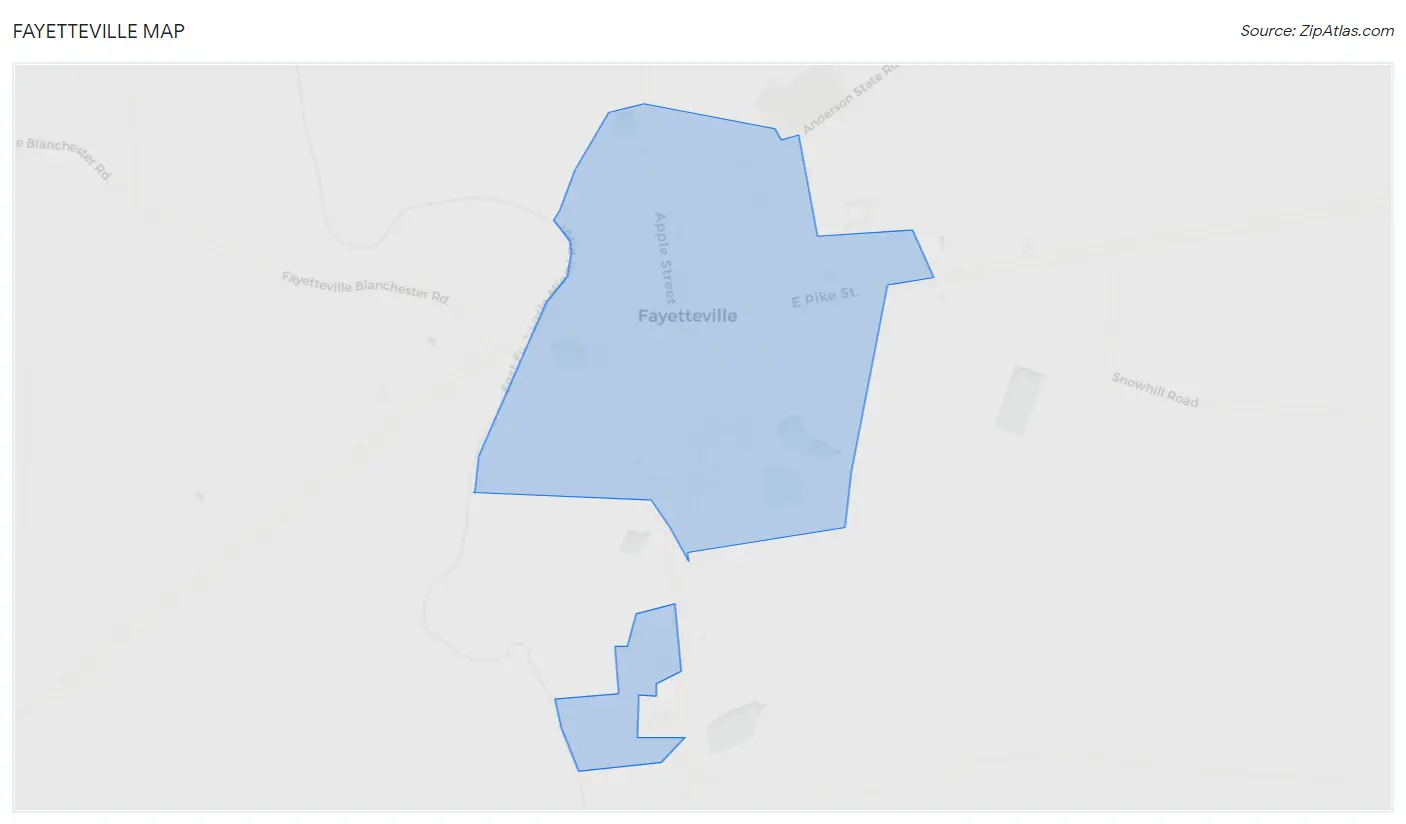
Fayetteville Map
Fayetteville Overview
241
TOTAL POPULATION
112
MALE POPULATION
129
FEMALE POPULATION
86.82
MALES / 100 FEMALES
115.18
FEMALES / 100 MALES
44.8
MEDIAN AGE
2.5
AVG FAMILY SIZE
2.3
AVG HOUSEHOLD SIZE
$36,188
PER CAPITA INCOME
$85,156
AVG FAMILY INCOME
$66,250
AVG HOUSEHOLD INCOME
8.1%
WAGE / INCOME GAP [ % ]
91.9¢/ $1
WAGE / INCOME GAP [ $ ]
0.39
INEQUALITY / GINI INDEX
135
LABOR FORCE [ PEOPLE ]
66.5%
PERCENT IN LABOR FORCE
Fayetteville Zip Codes
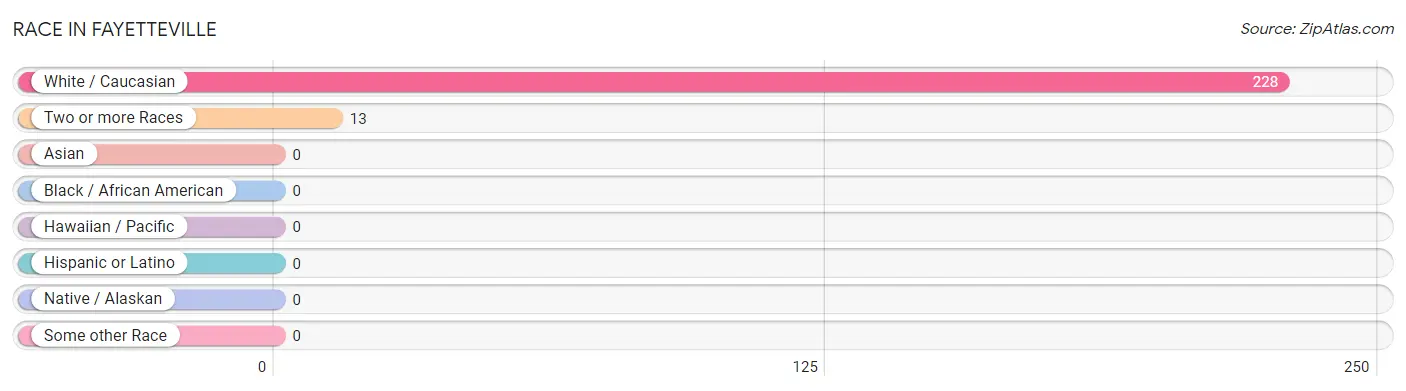
Race in Fayetteville
The most populous races in Fayetteville are White / Caucasian (228 | 94.6%), and Two or more Races (13 | 5.4%).
| Race | # Population | % Population |
| Asian | 0 | 0.0% |
| Black / African American | 0 | 0.0% |
| Hawaiian / Pacific | 0 | 0.0% |
| Hispanic or Latino | 0 | 0.0% |
| Native / Alaskan | 0 | 0.0% |
| White / Caucasian | 228 | 94.6% |
| Two or more Races | 13 | 5.4% |
| Some other Race | 0 | 0.0% |
| Total | 241 | 100.0% |
Ancestry in Fayetteville
The most populous ancestries reported in Fayetteville are German (83 | 34.4%), Irish (38 | 15.8%), English (26 | 10.8%), French (26 | 10.8%), and Italian (26 | 10.8%), together accounting for 82.6% of all Fayetteville residents.
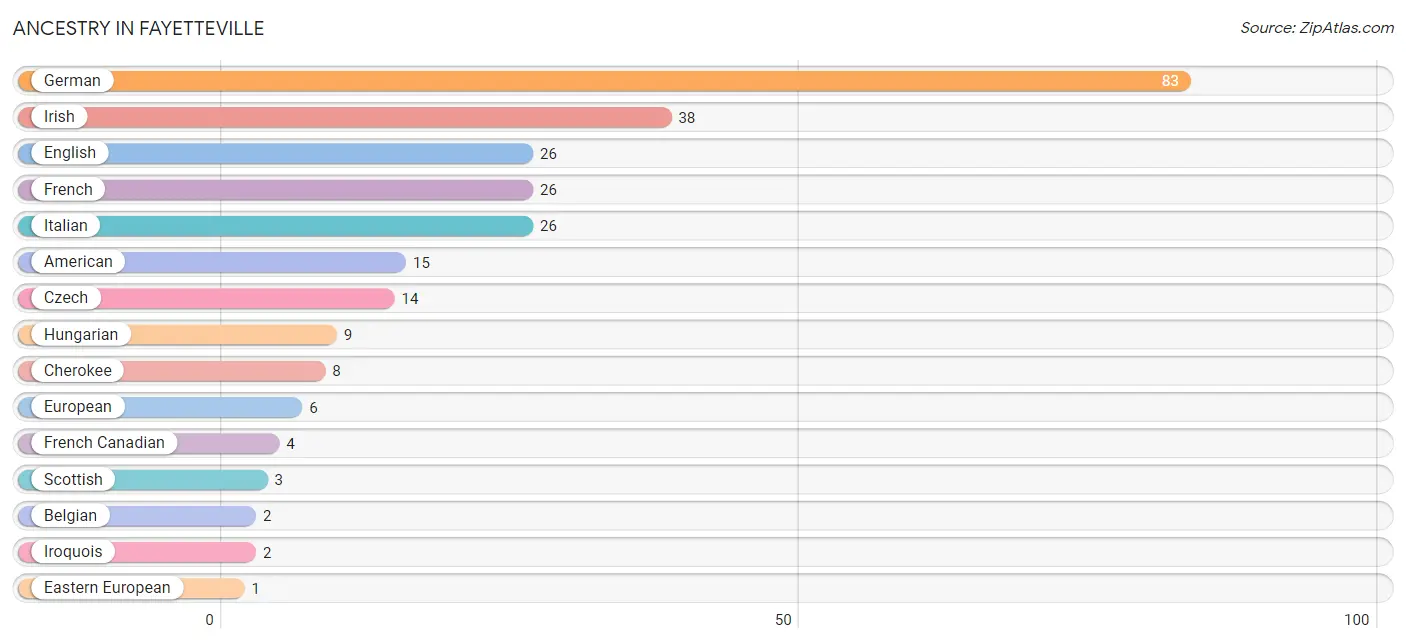
| Ancestry | # Population | % Population |
| American | 15 | 6.2% |
| Belgian | 2 | 0.8% |
| Cherokee | 8 | 3.3% |
| Czech | 14 | 5.8% |
| Eastern European | 1 | 0.4% |
| English | 26 | 10.8% |
| European | 6 | 2.5% |
| French | 26 | 10.8% |
| French American Indian | 1 | 0.4% |
| French Canadian | 4 | 1.7% |
| German | 83 | 34.4% |
| Hungarian | 9 | 3.7% |
| Irish | 38 | 15.8% |
| Iroquois | 2 | 0.8% |
| Italian | 26 | 10.8% |
| Norwegian | 1 | 0.4% |
| Scottish | 3 | 1.2% |
| Sioux | 1 | 0.4% | View All 18 Rows |
Immigrants in Fayetteville

| Immigration Origin | # Population | % Population | View All 0 Rows |
Sex and Age in Fayetteville
Sex and Age in Fayetteville
The most populous age groups in Fayetteville are 45 to 49 Years (18 | 16.1%) for men and 35 to 39 Years (17 | 13.2%) for women.
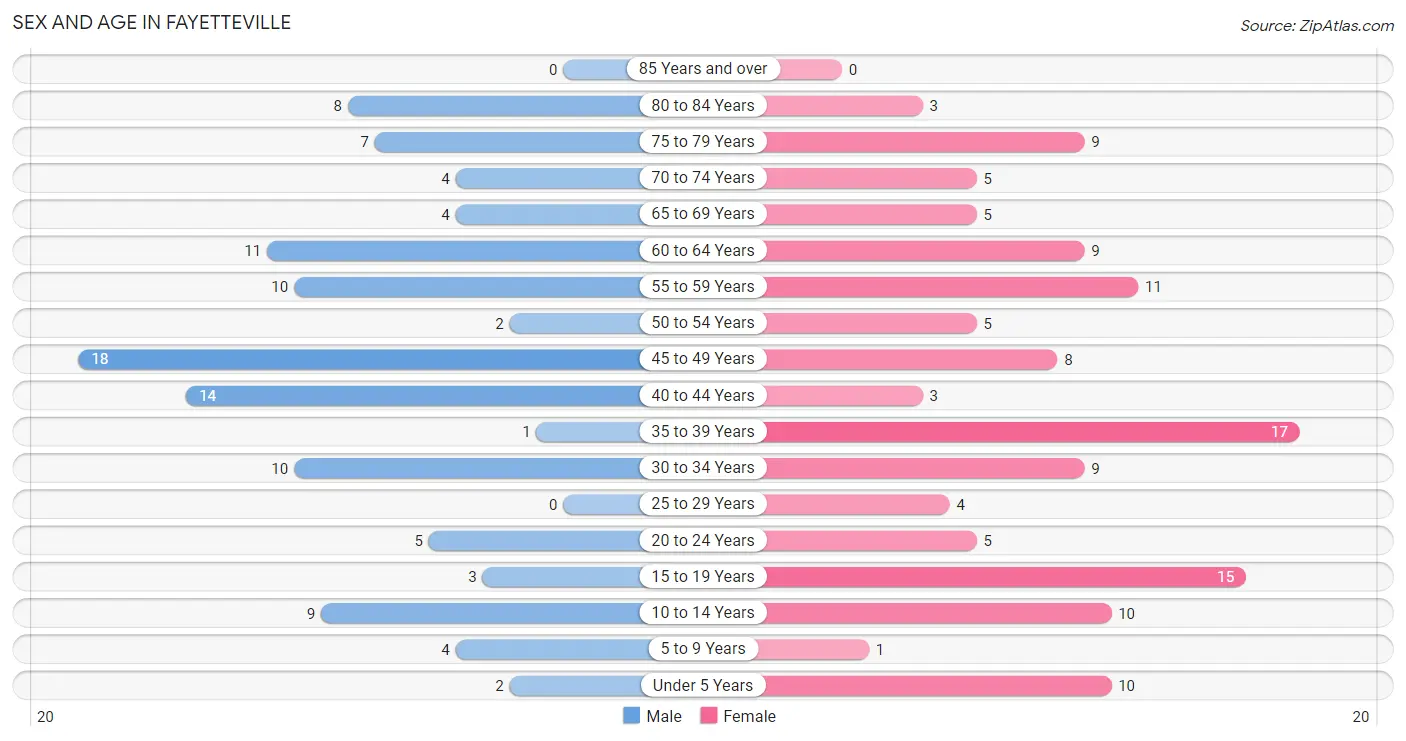
| Age Bracket | Male | Female |
| Under 5 Years | 2 (1.8%) | 10 (7.7%) |
| 5 to 9 Years | 4 (3.6%) | 1 (0.8%) |
| 10 to 14 Years | 9 (8.0%) | 10 (7.7%) |
| 15 to 19 Years | 3 (2.7%) | 15 (11.6%) |
| 20 to 24 Years | 5 (4.5%) | 5 (3.9%) |
| 25 to 29 Years | 0 (0.0%) | 4 (3.1%) |
| 30 to 34 Years | 10 (8.9%) | 9 (7.0%) |
| 35 to 39 Years | 1 (0.9%) | 17 (13.2%) |
| 40 to 44 Years | 14 (12.5%) | 3 (2.3%) |
| 45 to 49 Years | 18 (16.1%) | 8 (6.2%) |
| 50 to 54 Years | 2 (1.8%) | 5 (3.9%) |
| 55 to 59 Years | 10 (8.9%) | 11 (8.5%) |
| 60 to 64 Years | 11 (9.8%) | 9 (7.0%) |
| 65 to 69 Years | 4 (3.6%) | 5 (3.9%) |
| 70 to 74 Years | 4 (3.6%) | 5 (3.9%) |
| 75 to 79 Years | 7 (6.2%) | 9 (7.0%) |
| 80 to 84 Years | 8 (7.1%) | 3 (2.3%) |
| 85 Years and over | 0 (0.0%) | 0 (0.0%) |
| Total | 112 (100.0%) | 129 (100.0%) |
Families and Households in Fayetteville
Median Family Size in Fayetteville
The median family size in Fayetteville is 2.54 persons per family, with single male/father families (12 | 15.2%) accounting for the largest median family size of 2.92 persons per family. On the other hand, married-couple families (50 | 63.3%) represent the smallest median family size with 2.40 persons per family.
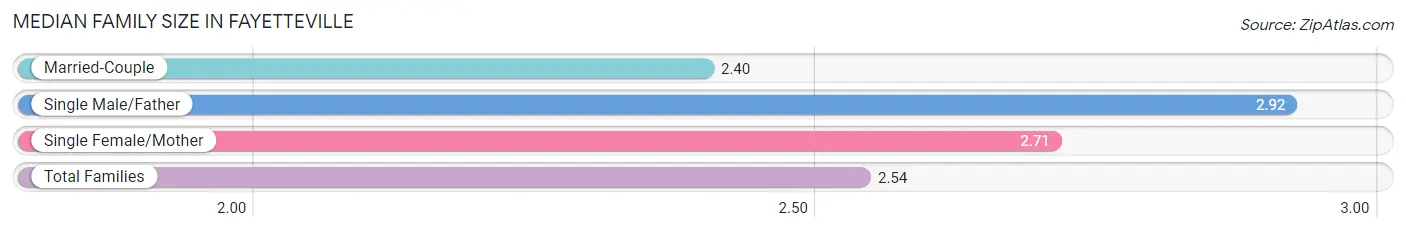
| Family Type | # Families | Family Size |
| Married-Couple | 50 (63.3%) | 2.40 |
| Single Male/Father | 12 (15.2%) | 2.92 |
| Single Female/Mother | 17 (21.5%) | 2.71 |
| Total Families | 79 (100.0%) | 2.54 |
Median Household Size in Fayetteville
The median household size in Fayetteville is 2.27 persons per household, with single female/mother households (17 | 16.0%) accounting for the largest median household size of 3.06 persons per household. non-family households (27 | 25.5%) represent the smallest median household size with 1.26 persons per household.
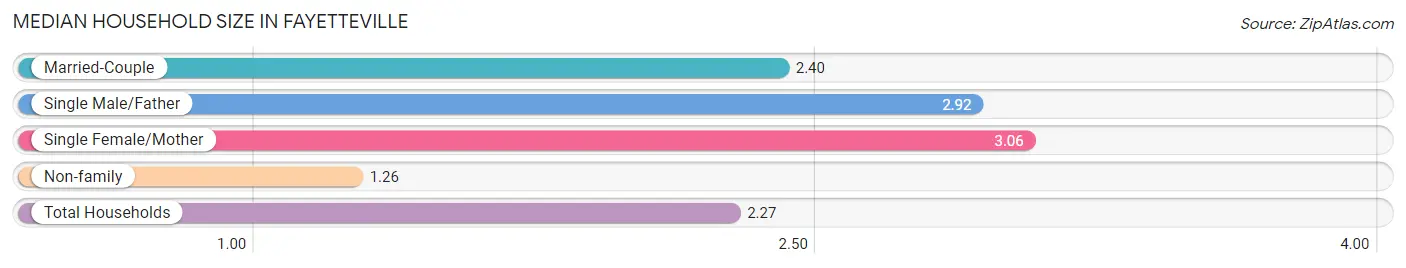
| Household Type | # Households | Household Size |
| Married-Couple | 50 (47.2%) | 2.40 |
| Single Male/Father | 12 (11.3%) | 2.92 |
| Single Female/Mother | 17 (16.0%) | 3.06 |
| Non-family | 27 (25.5%) | 1.26 |
| Total Households | 106 (100.0%) | 2.27 |
Household Size by Marriage Status in Fayetteville
Out of a total of 106 households in Fayetteville, 79 (74.5%) are family households, while 27 (25.5%) are nonfamily households. The most numerous type of family households are 2-person households, comprising 47, and the most common type of nonfamily households are 1-person households, comprising 19.
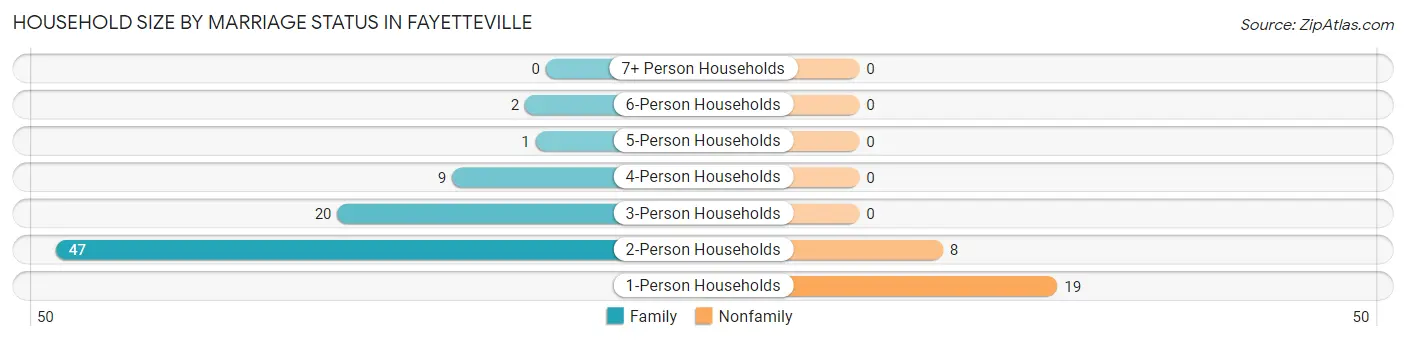
| Household Size | Family Households | Nonfamily Households |
| 1-Person Households | - | 19 (17.9%) |
| 2-Person Households | 47 (44.3%) | 8 (7.5%) |
| 3-Person Households | 20 (18.9%) | 0 (0.0%) |
| 4-Person Households | 9 (8.5%) | 0 (0.0%) |
| 5-Person Households | 1 (0.9%) | 0 (0.0%) |
| 6-Person Households | 2 (1.9%) | 0 (0.0%) |
| 7+ Person Households | 0 (0.0%) | 0 (0.0%) |
| Total | 79 (74.5%) | 27 (25.5%) |
Female Fertility in Fayetteville
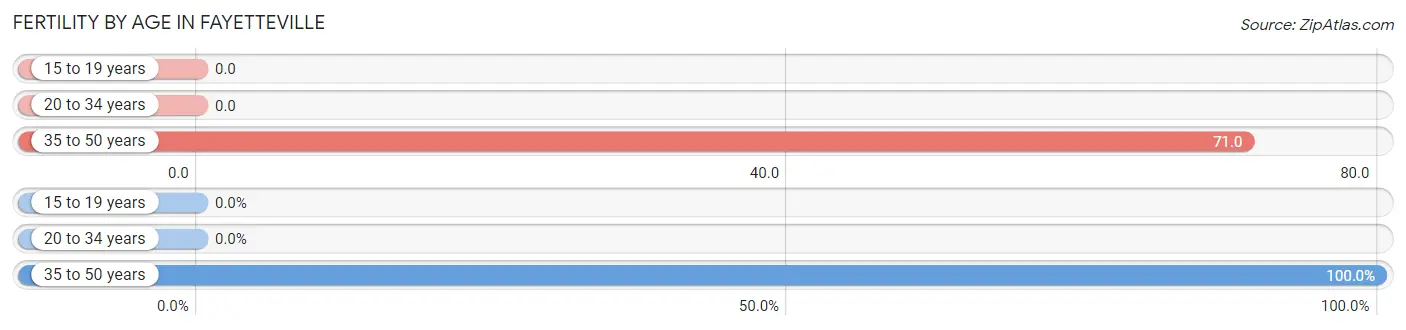
Fertility by Age in Fayetteville
Average fertility rate in Fayetteville is 33.0 births per 1,000 women. Women in the age bracket of 35 to 50 years have the highest fertility rate with 71.0 births per 1,000 women. Women in the age bracket of 35 to 50 years acount for 100.0% of all women with births.
| Age Bracket | Women with Births | Births / 1,000 Women |
| 15 to 19 years | 0 (0.0%) | 0.0 |
| 20 to 34 years | 0 (0.0%) | 0.0 |
| 35 to 50 years | 2 (100.0%) | 71.0 |
| Total | 2 (100.0%) | 33.0 |
Fertility by Age by Marriage Status in Fayetteville
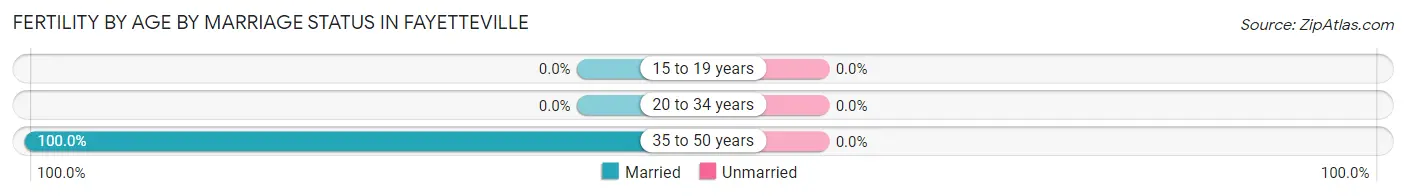
| Age Bracket | Married | Unmarried |
| 15 to 19 years | 0 (0.0%) | 0 (0.0%) |
| 20 to 34 years | 0 (0.0%) | 0 (0.0%) |
| 35 to 50 years | 2 (100.0%) | 0 (0.0%) |
| Total | 2 (100.0%) | 0 (0.0%) |
Fertility by Education in Fayetteville
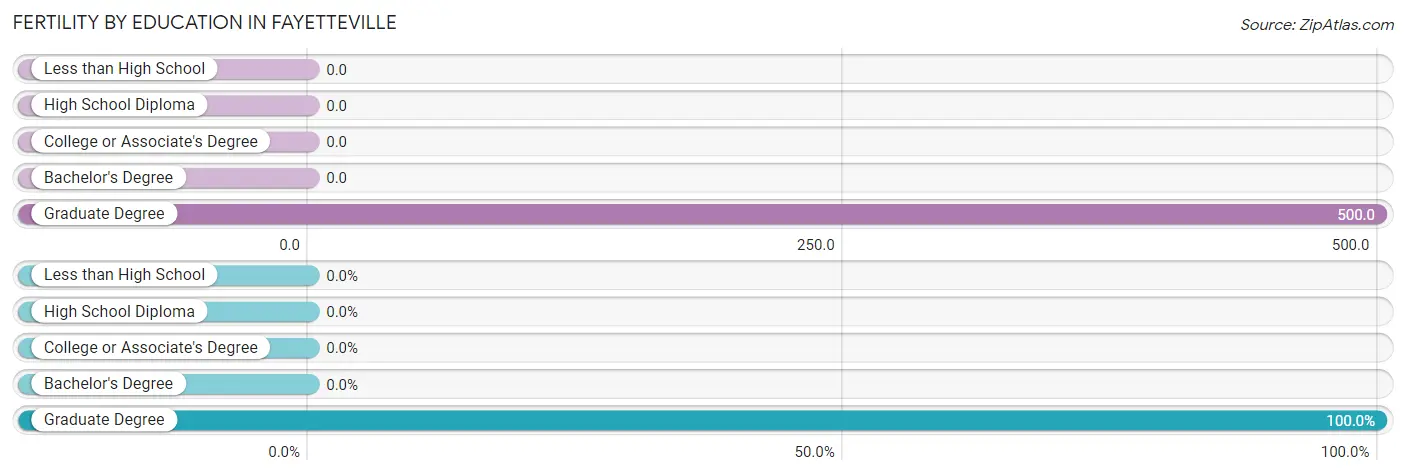
| Educational Attainment | Women with Births | Births / 1,000 Women |
| Less than High School | 0 (0.0%) | 0.0 |
| High School Diploma | 0 (0.0%) | 0.0 |
| College or Associate's Degree | 0 (0.0%) | 0.0 |
| Bachelor's Degree | 0 (0.0%) | 0.0 |
| Graduate Degree | 2 (100.0%) | 500.0 |
| Total | 2 (100.0%) | 33.0 |
Fertility by Education by Marriage Status in Fayetteville
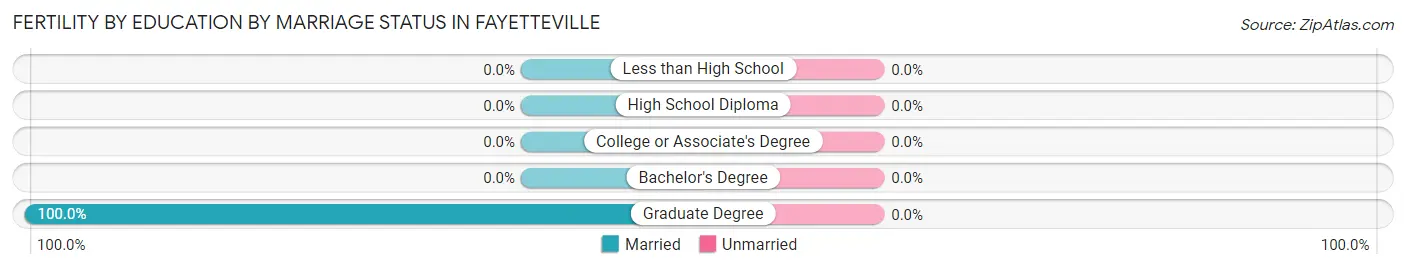
| Educational Attainment | Married | Unmarried |
| Less than High School | 0 (0.0%) | 0 (0.0%) |
| High School Diploma | 0 (0.0%) | 0 (0.0%) |
| College or Associate's Degree | 0 (0.0%) | 0 (0.0%) |
| Bachelor's Degree | 0 (0.0%) | 0 (0.0%) |
| Graduate Degree | 2 (100.0%) | 0 (0.0%) |
| Total | 2 (100.0%) | 0 (0.0%) |
Income in Fayetteville
Income Overview in Fayetteville
Per Capita Income in Fayetteville is $36,188, while median incomes of families and households are $85,156 and $66,250 respectively.
| Characteristic | Number | Measure |
| Per Capita Income | 241 | $36,188 |
| Median Family Income | 79 | $85,156 |
| Mean Family Income | 79 | $94,670 |
| Median Household Income | 106 | $66,250 |
| Mean Household Income | 106 | $84,227 |
| Income Deficit | 79 | $0 |
| Wage / Income Gap (%) | 241 | 8.12% |
| Wage / Income Gap ($) | 241 | 91.88¢ per $1 |
| Gini / Inequality Index | 241 | 0.39 |
Earnings by Sex in Fayetteville
Average Earnings in Fayetteville are $35,694, $37,188 for men and $34,167 for women, a difference of 8.1%.
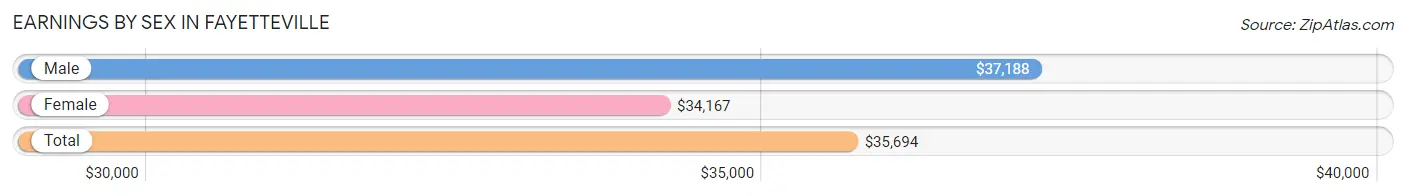
| Sex | Number | Average Earnings |
| Male | 71 (51.1%) | $37,188 |
| Female | 68 (48.9%) | $34,167 |
| Total | 139 (100.0%) | $35,694 |
Earnings by Sex by Income Bracket in Fayetteville
The most common earnings brackets in Fayetteville are $25,000 to $29,999 for men (18 | 25.4%) and $50,000 to $54,999 for women (10 | 14.7%).
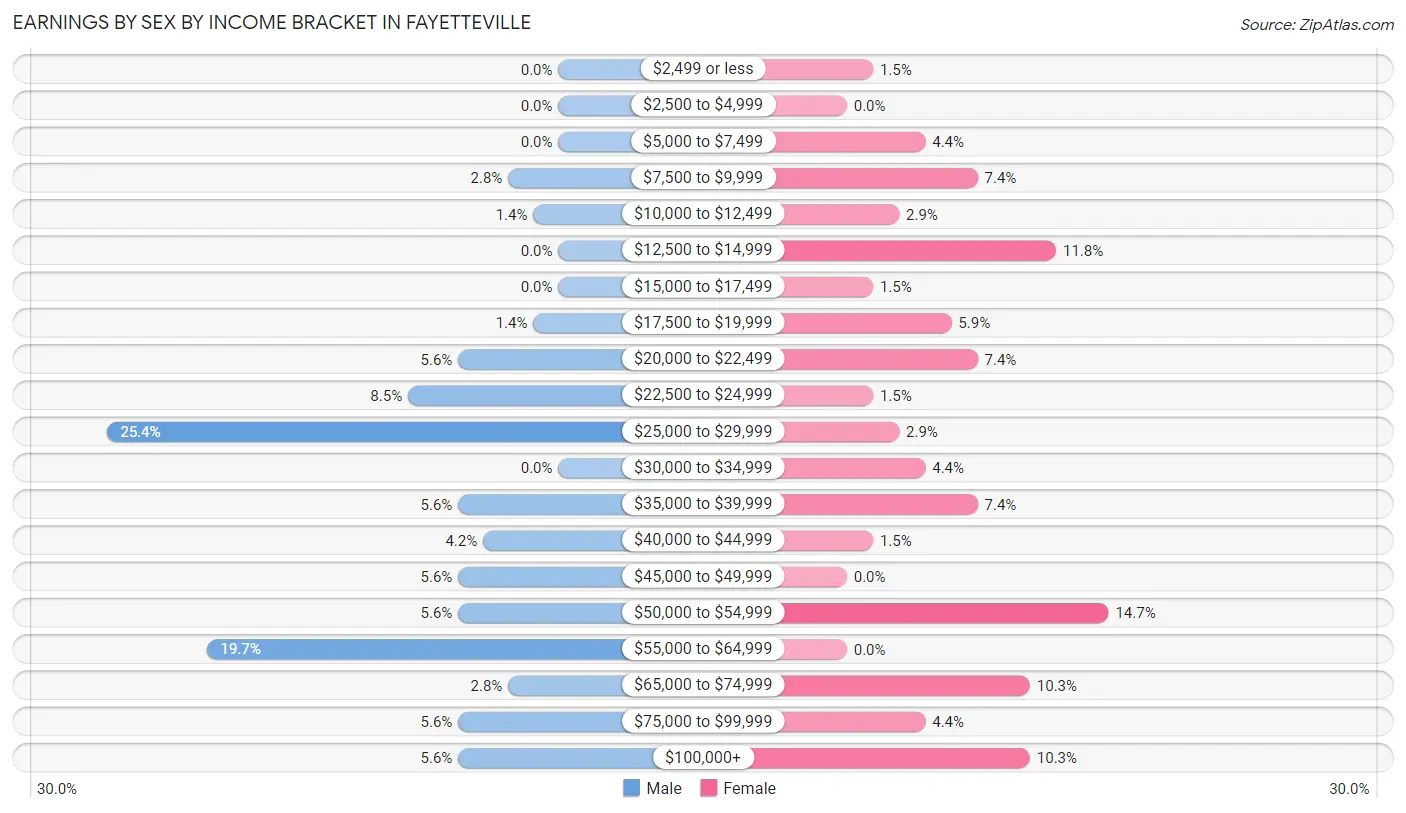
| Income | Male | Female |
| $2,499 or less | 0 (0.0%) | 1 (1.5%) |
| $2,500 to $4,999 | 0 (0.0%) | 0 (0.0%) |
| $5,000 to $7,499 | 0 (0.0%) | 3 (4.4%) |
| $7,500 to $9,999 | 2 (2.8%) | 5 (7.3%) |
| $10,000 to $12,499 | 1 (1.4%) | 2 (2.9%) |
| $12,500 to $14,999 | 0 (0.0%) | 8 (11.8%) |
| $15,000 to $17,499 | 0 (0.0%) | 1 (1.5%) |
| $17,500 to $19,999 | 1 (1.4%) | 4 (5.9%) |
| $20,000 to $22,499 | 4 (5.6%) | 5 (7.3%) |
| $22,500 to $24,999 | 6 (8.5%) | 1 (1.5%) |
| $25,000 to $29,999 | 18 (25.4%) | 2 (2.9%) |
| $30,000 to $34,999 | 0 (0.0%) | 3 (4.4%) |
| $35,000 to $39,999 | 4 (5.6%) | 5 (7.3%) |
| $40,000 to $44,999 | 3 (4.2%) | 1 (1.5%) |
| $45,000 to $49,999 | 4 (5.6%) | 0 (0.0%) |
| $50,000 to $54,999 | 4 (5.6%) | 10 (14.7%) |
| $55,000 to $64,999 | 14 (19.7%) | 0 (0.0%) |
| $65,000 to $74,999 | 2 (2.8%) | 7 (10.3%) |
| $75,000 to $99,999 | 4 (5.6%) | 3 (4.4%) |
| $100,000+ | 4 (5.6%) | 7 (10.3%) |
| Total | 71 (100.0%) | 68 (100.0%) |
Earnings by Sex by Educational Attainment in Fayetteville
Average earnings in Fayetteville are $46,250 for men and $50,156 for women, a difference of 7.8%. Men with an educational attainment of college or associate's degree enjoy the highest average annual earnings of $58,750, while those with high school diploma education earn the least with $28,125. Women with an educational attainment of graduate degree earn the most with the average annual earnings of $99,375, while those with high school diploma education have the smallest earnings of $36,000.
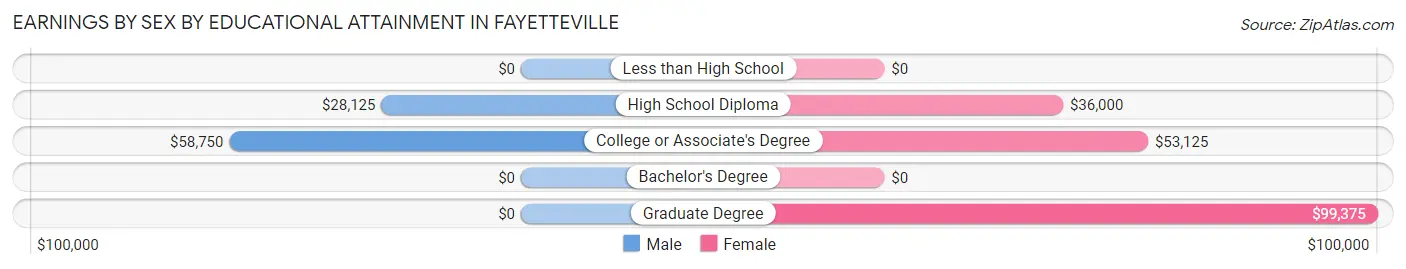
| Educational Attainment | Male Income | Female Income |
| Less than High School | - | - |
| High School Diploma | $28,125 | $36,000 |
| College or Associate's Degree | $58,750 | $53,125 |
| Bachelor's Degree | - | - |
| Graduate Degree | - | - |
| Total | $46,250 | $50,156 |
Family Income in Fayetteville
Family Income Brackets in Fayetteville
According to the Fayetteville family income data, there are 18 families falling into the $100,000 to $149,999 income range, which is the most common income bracket and makes up 22.8% of all families.
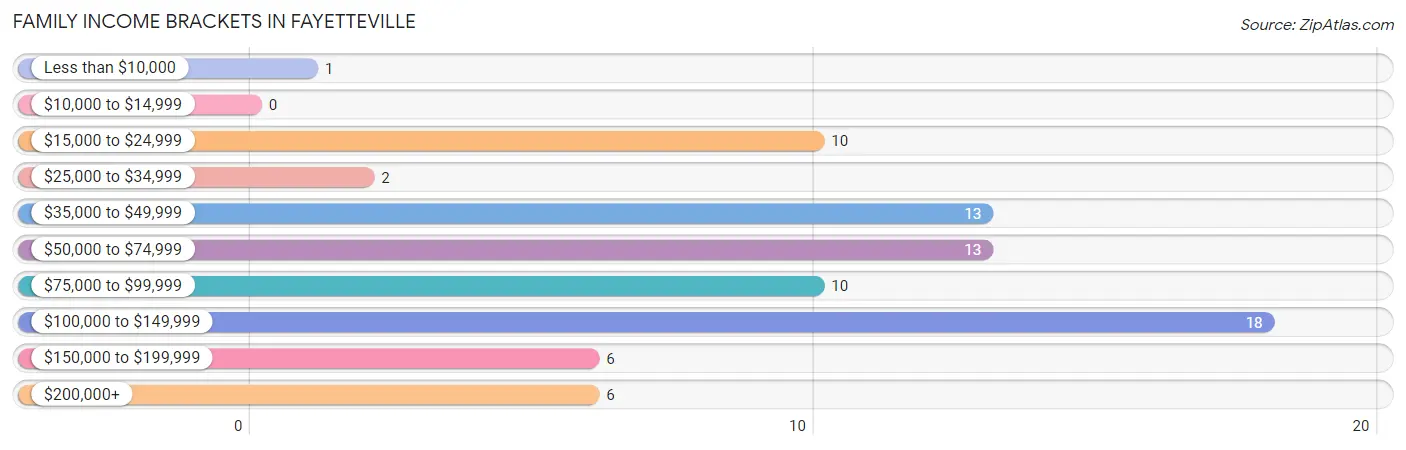
| Income Bracket | # Families | % Families |
| Less than $10,000 | 1 | 1.3% |
| $10,000 to $14,999 | 0 | 0.0% |
| $15,000 to $24,999 | 10 | 12.7% |
| $25,000 to $34,999 | 2 | 2.5% |
| $35,000 to $49,999 | 13 | 16.5% |
| $50,000 to $74,999 | 13 | 16.5% |
| $75,000 to $99,999 | 10 | 12.7% |
| $100,000 to $149,999 | 18 | 22.8% |
| $150,000 to $199,999 | 6 | 7.6% |
| $200,000+ | 6 | 7.6% |
Family Income by Famaliy Size in Fayetteville
4-person families (7 | 8.9%) account for the highest median family income in Fayetteville with $116,250 per family, while 2-person families (50 | 63.3%) have the highest median income of $30,625 per family member.
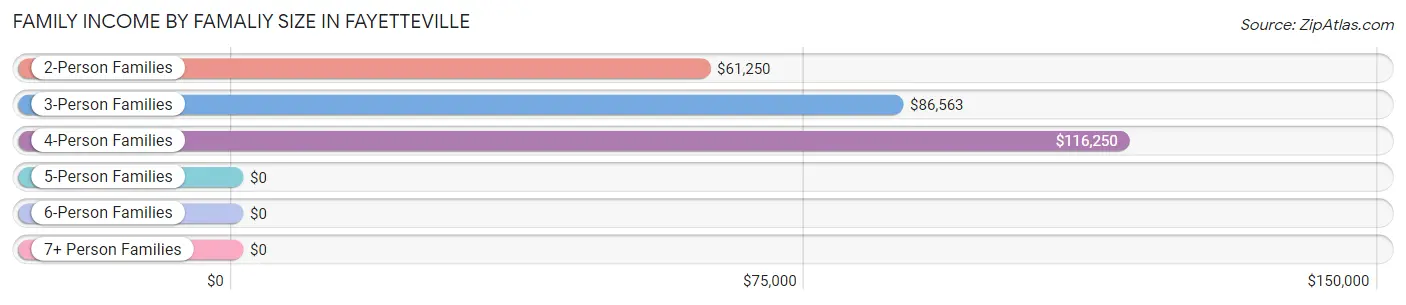
| Income Bracket | # Families | Median Income |
| 2-Person Families | 50 (63.3%) | $61,250 |
| 3-Person Families | 19 (24.0%) | $86,563 |
| 4-Person Families | 7 (8.9%) | $116,250 |
| 5-Person Families | 1 (1.3%) | $0 |
| 6-Person Families | 2 (2.5%) | $0 |
| 7+ Person Families | 0 (0.0%) | $0 |
| Total | 79 (100.0%) | $85,156 |
Family Income by Number of Earners in Fayetteville
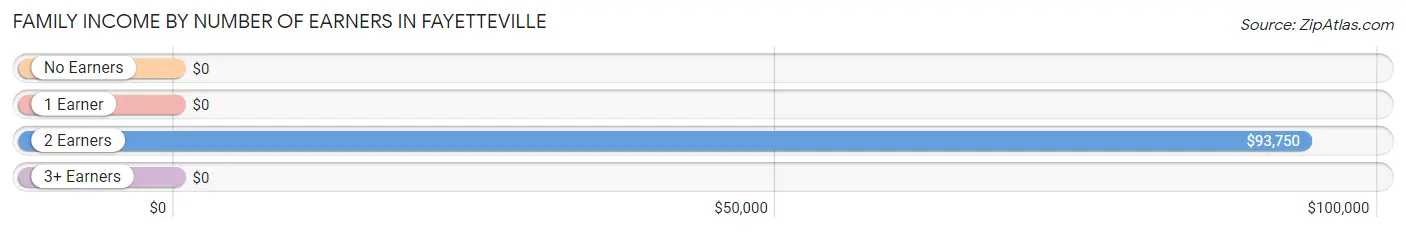
| Number of Earners | # Families | Median Income |
| No Earners | 13 (16.5%) | $0 |
| 1 Earner | 20 (25.3%) | $0 |
| 2 Earners | 45 (57.0%) | $93,750 |
| 3+ Earners | 1 (1.3%) | $0 |
| Total | 79 (100.0%) | $85,156 |
Household Income in Fayetteville
Household Income Brackets in Fayetteville
With 28 households falling in the category, the $50,000 to $74,999 income range is the most frequent in Fayetteville, accounting for 26.4% of all households.
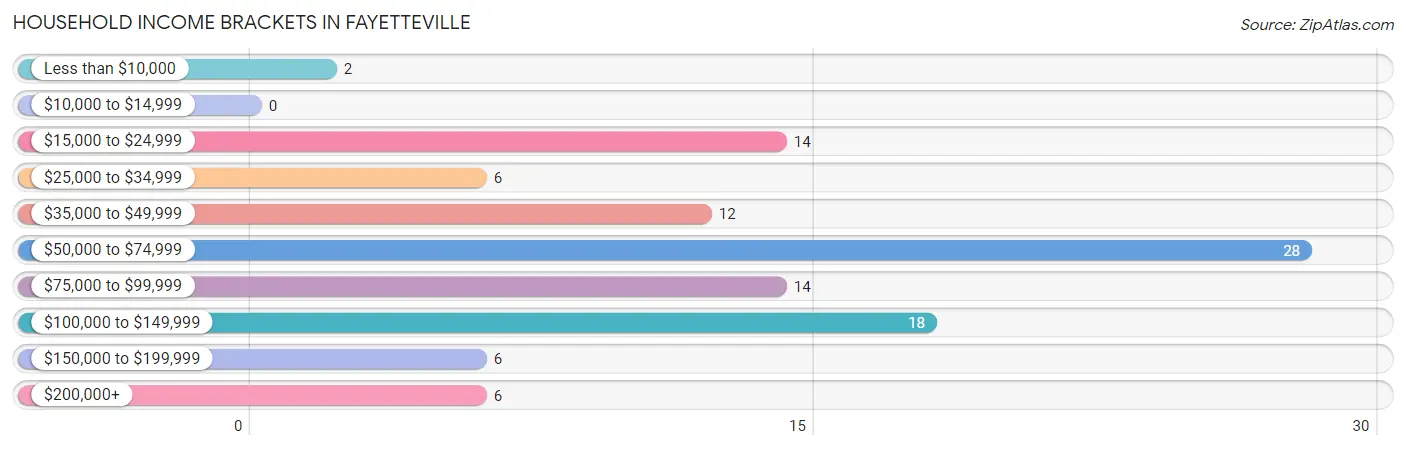
| Income Bracket | # Households | % Households |
| Less than $10,000 | 2 | 1.9% |
| $10,000 to $14,999 | 0 | 0.0% |
| $15,000 to $24,999 | 14 | 13.2% |
| $25,000 to $34,999 | 6 | 5.7% |
| $35,000 to $49,999 | 12 | 11.3% |
| $50,000 to $74,999 | 28 | 26.4% |
| $75,000 to $99,999 | 14 | 13.2% |
| $100,000 to $149,999 | 18 | 17.0% |
| $150,000 to $199,999 | 6 | 5.7% |
| $200,000+ | 6 | 5.7% |
Household Income by Householder Age in Fayetteville
The median household income in Fayetteville is $66,250, with the highest median household income of $80,000 found in the 45 to 64 years age bracket for the primary householder. A total of 42 households (39.6%) fall into this category. Meanwhile, the 15 to 24 years age bracket for the primary householder has the lowest median household income of $0, with 5 households (4.7%) in this group.
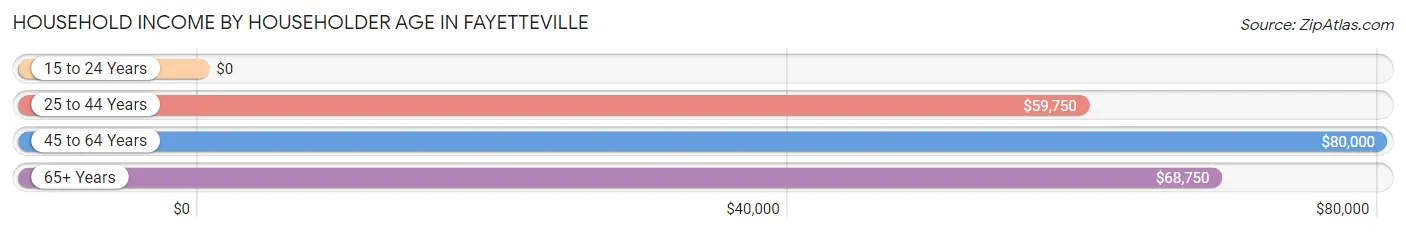
| Income Bracket | # Households | Median Income |
| 15 to 24 Years | 5 (4.7%) | $0 |
| 25 to 44 Years | 35 (33.0%) | $59,750 |
| 45 to 64 Years | 42 (39.6%) | $80,000 |
| 65+ Years | 24 (22.6%) | $68,750 |
| Total | 106 (100.0%) | $66,250 |
Poverty in Fayetteville
Income Below Poverty by Sex and Age in Fayetteville
With 0.9% poverty level for males and 10.1% for females among the residents of Fayetteville, 75 year old and over males and 6 to 11 year old females are the most vulnerable to poverty, with 1 males (6.7%) and 6 females (54.5%) in their respective age groups living below the poverty level.
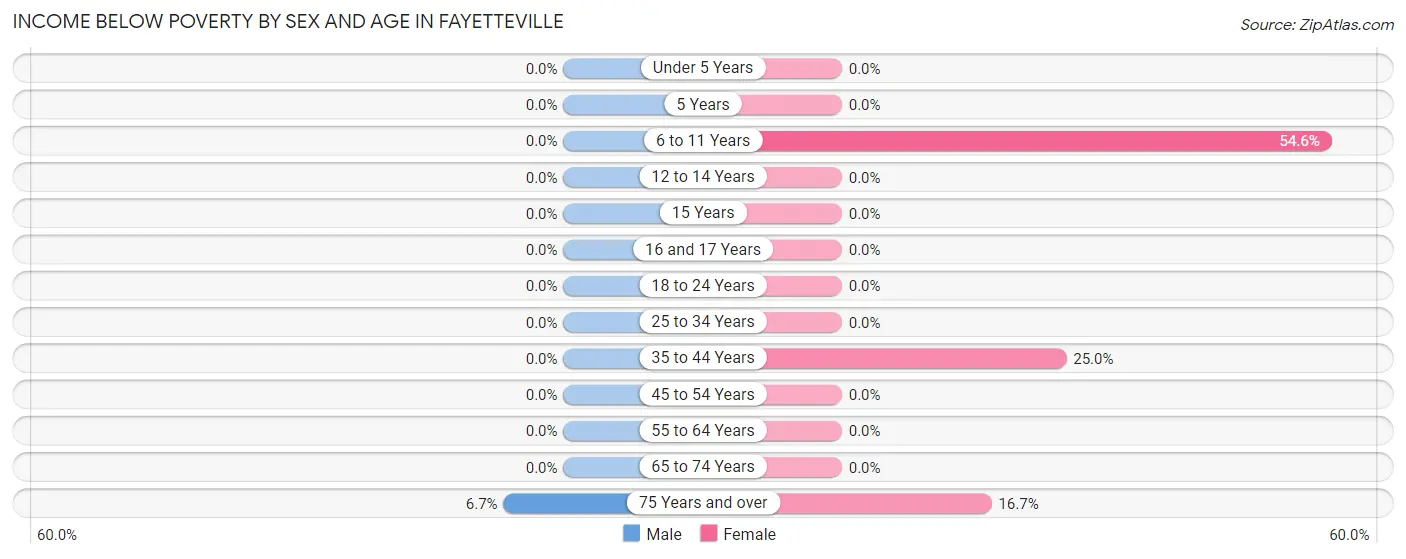
| Age Bracket | Male | Female |
| Under 5 Years | 0 (0.0%) | 0 (0.0%) |
| 5 Years | 0 (0.0%) | 0 (0.0%) |
| 6 to 11 Years | 0 (0.0%) | 6 (54.5%) |
| 12 to 14 Years | 0 (0.0%) | 0 (0.0%) |
| 15 Years | 0 (0.0%) | 0 (0.0%) |
| 16 and 17 Years | 0 (0.0%) | 0 (0.0%) |
| 18 to 24 Years | 0 (0.0%) | 0 (0.0%) |
| 25 to 34 Years | 0 (0.0%) | 0 (0.0%) |
| 35 to 44 Years | 0 (0.0%) | 5 (25.0%) |
| 45 to 54 Years | 0 (0.0%) | 0 (0.0%) |
| 55 to 64 Years | 0 (0.0%) | 0 (0.0%) |
| 65 to 74 Years | 0 (0.0%) | 0 (0.0%) |
| 75 Years and over | 1 (6.7%) | 2 (16.7%) |
| Total | 1 (0.9%) | 13 (10.1%) |
Income Above Poverty by Sex and Age in Fayetteville
According to the poverty statistics in Fayetteville, males aged under 5 years and females aged under 5 years are the age groups that are most secure financially, with 100.0% of males and 100.0% of females in these age groups living above the poverty line.
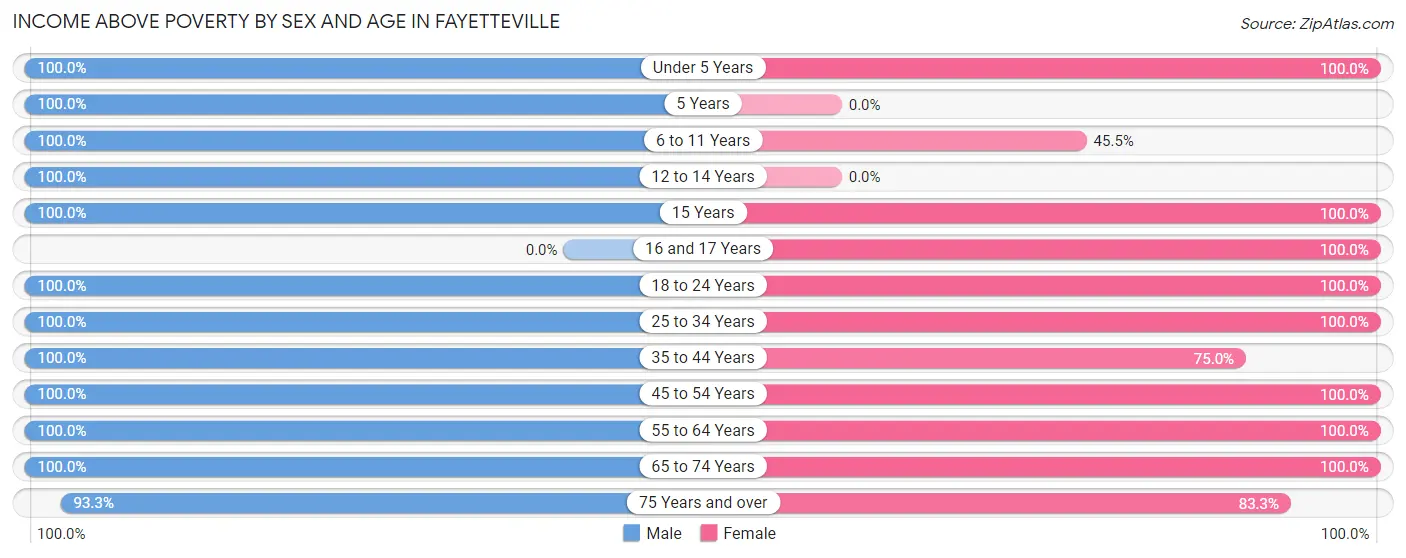
| Age Bracket | Male | Female |
| Under 5 Years | 2 (100.0%) | 10 (100.0%) |
| 5 Years | 2 (100.0%) | 0 (0.0%) |
| 6 to 11 Years | 6 (100.0%) | 5 (45.5%) |
| 12 to 14 Years | 5 (100.0%) | 0 (0.0%) |
| 15 Years | 1 (100.0%) | 1 (100.0%) |
| 16 and 17 Years | 0 (0.0%) | 7 (100.0%) |
| 18 to 24 Years | 7 (100.0%) | 12 (100.0%) |
| 25 to 34 Years | 10 (100.0%) | 13 (100.0%) |
| 35 to 44 Years | 15 (100.0%) | 15 (75.0%) |
| 45 to 54 Years | 20 (100.0%) | 13 (100.0%) |
| 55 to 64 Years | 21 (100.0%) | 20 (100.0%) |
| 65 to 74 Years | 8 (100.0%) | 10 (100.0%) |
| 75 Years and over | 14 (93.3%) | 10 (83.3%) |
| Total | 111 (99.1%) | 116 (89.9%) |
Income Below Poverty Among Married-Couple Families in Fayetteville
The poverty statistics for married-couple families in Fayetteville show that 2.0% or 1 of the total 50 families live below the poverty line. Families with no children have the highest poverty rate of 2.6%, comprising of 1 families. On the other hand, families with 1 or 2 children have the lowest poverty rate of 0.0%, which includes 0 families.
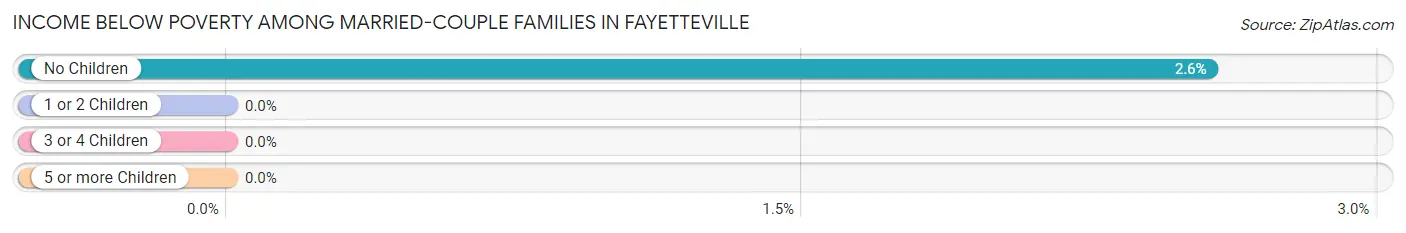
| Children | Above Poverty | Below Poverty |
| No Children | 38 (97.4%) | 1 (2.6%) |
| 1 or 2 Children | 10 (100.0%) | 0 (0.0%) |
| 3 or 4 Children | 1 (100.0%) | 0 (0.0%) |
| 5 or more Children | 0 (0.0%) | 0 (0.0%) |
| Total | 49 (98.0%) | 1 (2.0%) |
Income Below Poverty Among Single-Parent Households in Fayetteville
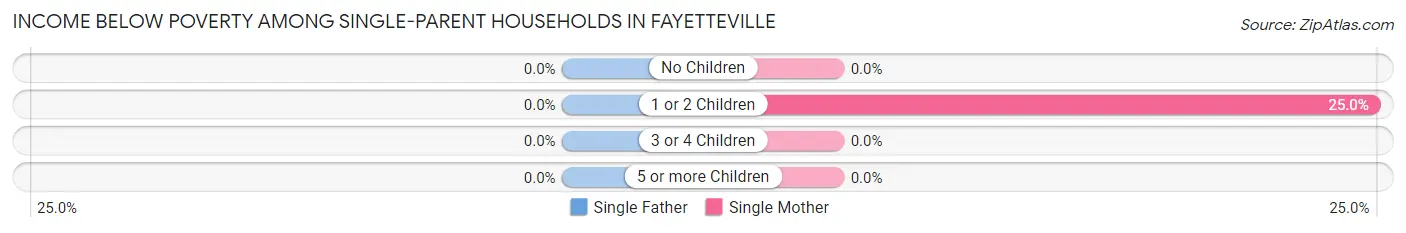
| Children | Single Father | Single Mother |
| No Children | 0 (0.0%) | 0 (0.0%) |
| 1 or 2 Children | 0 (0.0%) | 4 (25.0%) |
| 3 or 4 Children | 0 (0.0%) | 0 (0.0%) |
| 5 or more Children | 0 (0.0%) | 0 (0.0%) |
| Total | 0 (0.0%) | 4 (23.5%) |
Income Below Poverty Among Married-Couple vs Single-Parent Households in Fayetteville
The poverty data for Fayetteville shows that 1 of the married-couple family households (2.0%) and 4 of the single-parent households (13.8%) are living below the poverty level. Within the married-couple family households, those with no children have the highest poverty rate, with 1 households (2.6%) falling below the poverty line. Among the single-parent households, those with 1 or 2 children have the highest poverty rate, with 4 household (25.0%) living below poverty.
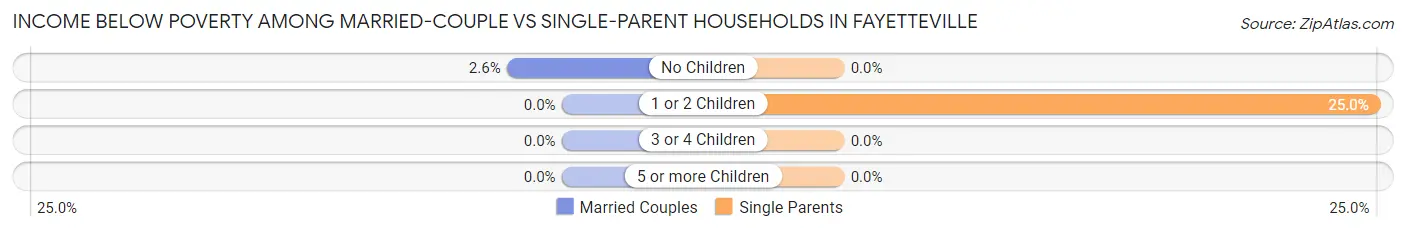
| Children | Married-Couple Families | Single-Parent Households |
| No Children | 1 (2.6%) | 0 (0.0%) |
| 1 or 2 Children | 0 (0.0%) | 4 (25.0%) |
| 3 or 4 Children | 0 (0.0%) | 0 (0.0%) |
| 5 or more Children | 0 (0.0%) | 0 (0.0%) |
| Total | 1 (2.0%) | 4 (13.8%) |
Employment Characteristics in Fayetteville
Employment by Class of Employer in Fayetteville
Among the 133 employed individuals in Fayetteville, private company employees (101 | 75.9%), self-employed (not incorporated) (10 | 7.5%), and local government employees (6 | 4.5%) make up the most common classes of employment.
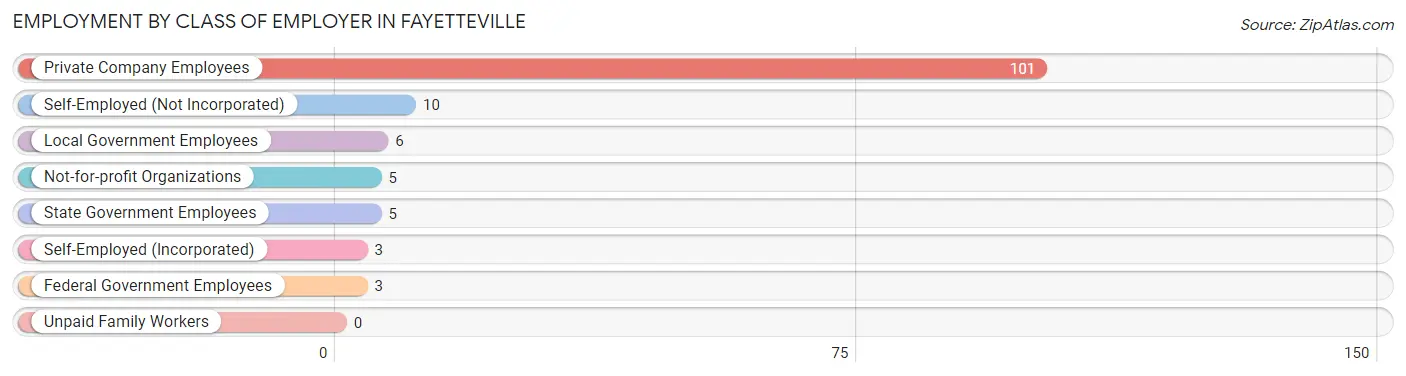
| Employer Class | # Employees | % Employees |
| Private Company Employees | 101 | 75.9% |
| Self-Employed (Incorporated) | 3 | 2.3% |
| Self-Employed (Not Incorporated) | 10 | 7.5% |
| Not-for-profit Organizations | 5 | 3.8% |
| Local Government Employees | 6 | 4.5% |
| State Government Employees | 5 | 3.8% |
| Federal Government Employees | 3 | 2.3% |
| Unpaid Family Workers | 0 | 0.0% |
| Total | 133 | 100.0% |
Employment Status by Age in Fayetteville
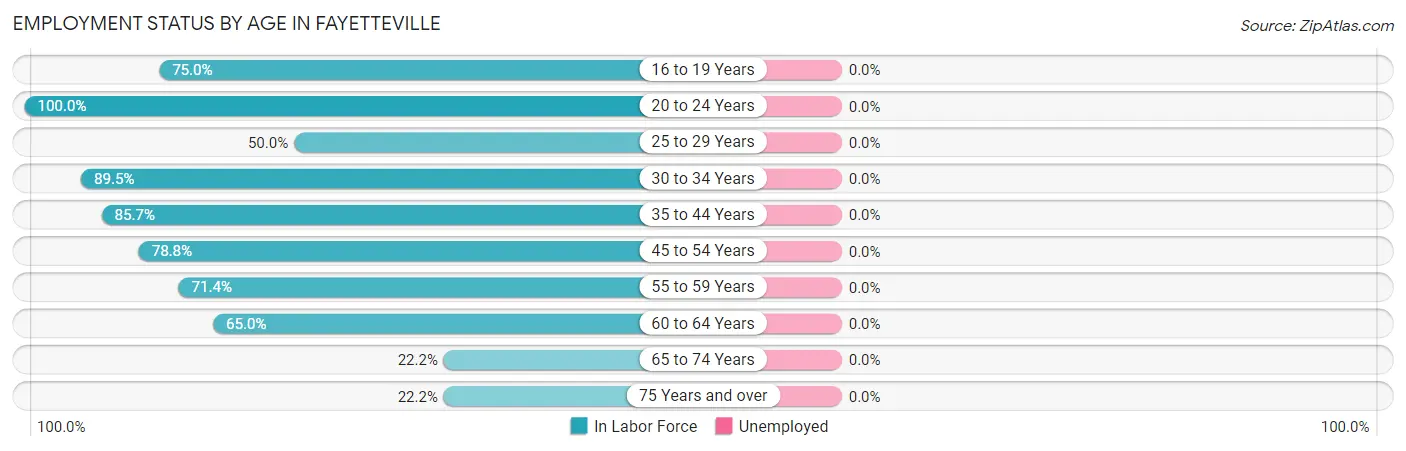
| Age Bracket | In Labor Force | Unemployed |
| 16 to 19 Years | 12 (75.0%) | 0 (0.0%) |
| 20 to 24 Years | 10 (100.0%) | 0 (0.0%) |
| 25 to 29 Years | 2 (50.0%) | 0 (0.0%) |
| 30 to 34 Years | 17 (89.5%) | 0 (0.0%) |
| 35 to 44 Years | 30 (85.7%) | 0 (0.0%) |
| 45 to 54 Years | 26 (78.8%) | 0 (0.0%) |
| 55 to 59 Years | 15 (71.4%) | 0 (0.0%) |
| 60 to 64 Years | 13 (65.0%) | 0 (0.0%) |
| 65 to 74 Years | 4 (22.2%) | 0 (0.0%) |
| 75 Years and over | 6 (22.2%) | 0 (0.0%) |
| Total | 135 (66.5%) | 0 (0.0%) |
Employment Status by Educational Attainment in Fayetteville
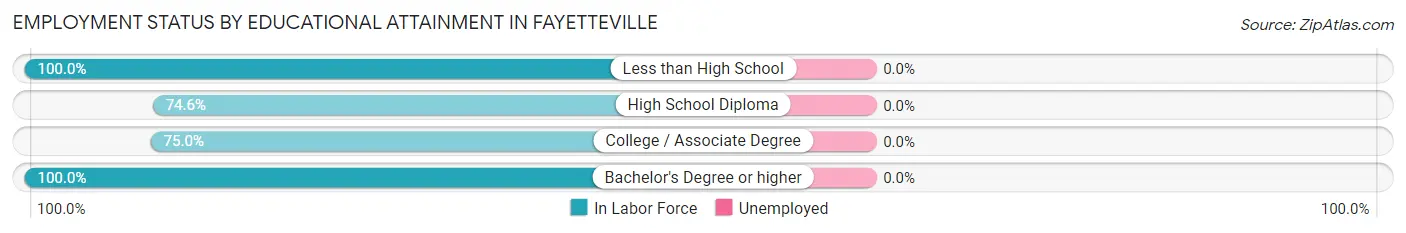
| Educational Attainment | In Labor Force | Unemployed |
| Less than High School | 7 (100.0%) | 0 (0.0%) |
| High School Diploma | 47 (74.6%) | 0 (0.0%) |
| College / Associate Degree | 39 (75.0%) | 0 (0.0%) |
| Bachelor's Degree or higher | 10 (100.0%) | 0 (0.0%) |
| Total | 103 (78.0%) | 0 (0.0%) |
Employment Occupations by Sex in Fayetteville
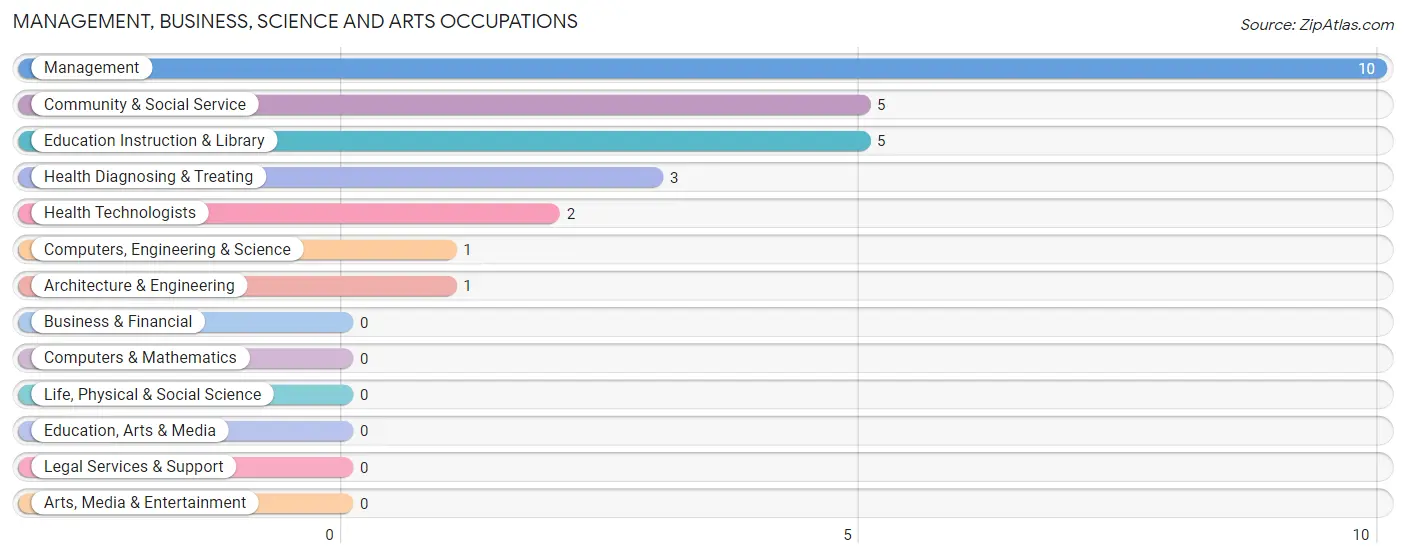
Management, Business, Science and Arts Occupations
The most common Management, Business, Science and Arts occupations in Fayetteville are Management (10 | 7.4%), Community & Social Service (5 | 3.7%), Education Instruction & Library (5 | 3.7%), Health Diagnosing & Treating (3 | 2.2%), and Health Technologists (2 | 1.5%).
Management, Business, Science and Arts Occupations by Sex
Within the Management, Business, Science and Arts occupations in Fayetteville, the most male-oriented occupations are Computers, Engineering & Science (100.0%), Architecture & Engineering (100.0%), and Health Diagnosing & Treating (33.3%), while the most female-oriented occupations are Health Technologists (100.0%), Management (80.0%), and Community & Social Service (80.0%).
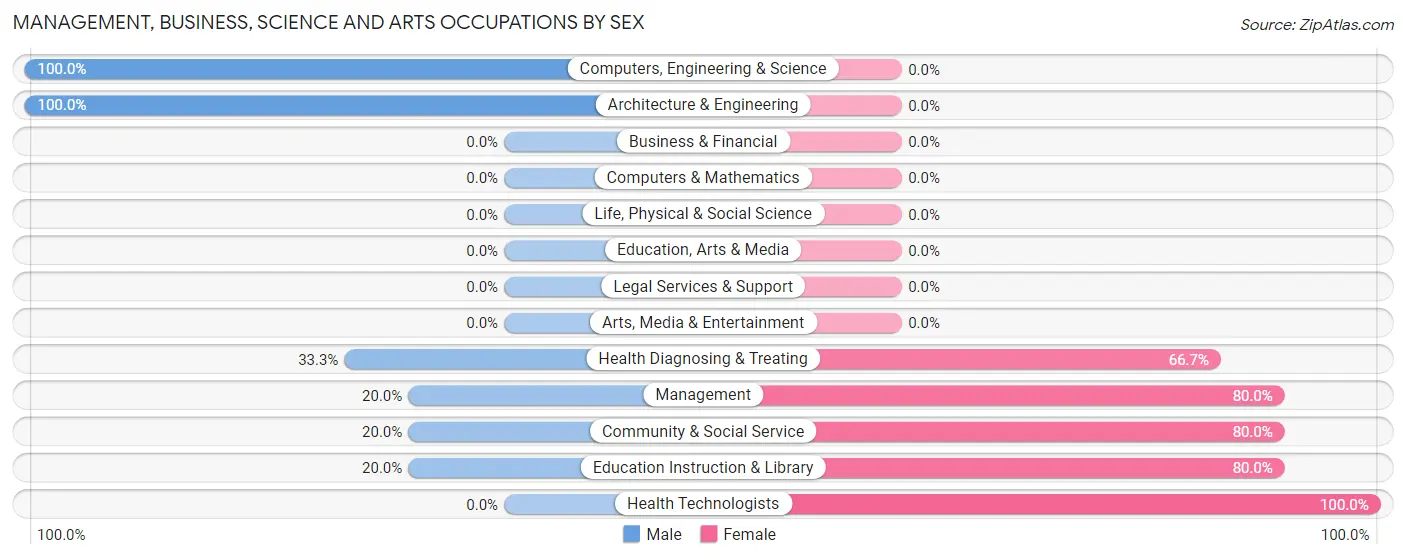
| Occupation | Male | Female |
| Management | 2 (20.0%) | 8 (80.0%) |
| Business & Financial | 0 (0.0%) | 0 (0.0%) |
| Computers, Engineering & Science | 1 (100.0%) | 0 (0.0%) |
| Computers & Mathematics | 0 (0.0%) | 0 (0.0%) |
| Architecture & Engineering | 1 (100.0%) | 0 (0.0%) |
| Life, Physical & Social Science | 0 (0.0%) | 0 (0.0%) |
| Community & Social Service | 1 (20.0%) | 4 (80.0%) |
| Education, Arts & Media | 0 (0.0%) | 0 (0.0%) |
| Legal Services & Support | 0 (0.0%) | 0 (0.0%) |
| Education Instruction & Library | 1 (20.0%) | 4 (80.0%) |
| Arts, Media & Entertainment | 0 (0.0%) | 0 (0.0%) |
| Health Diagnosing & Treating | 1 (33.3%) | 2 (66.7%) |
| Health Technologists | 0 (0.0%) | 2 (100.0%) |
| Total (Category) | 5 (26.3%) | 14 (73.7%) |
| Total (Overall) | 71 (52.6%) | 64 (47.4%) |
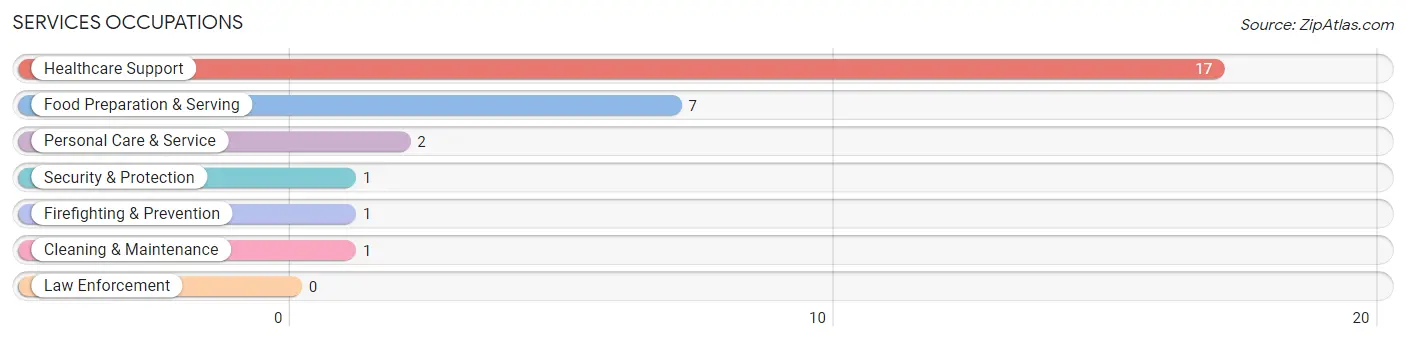
Services Occupations
The most common Services occupations in Fayetteville are Healthcare Support (17 | 12.6%), Food Preparation & Serving (7 | 5.2%), Personal Care & Service (2 | 1.5%), Security & Protection (1 | 0.7%), and Firefighting & Prevention (1 | 0.7%).
Services Occupations by Sex
Within the Services occupations in Fayetteville, the most male-oriented occupations are Security & Protection (100.0%), Firefighting & Prevention (100.0%), and Healthcare Support (11.8%), while the most female-oriented occupations are Food Preparation & Serving (100.0%), Cleaning & Maintenance (100.0%), and Personal Care & Service (100.0%).
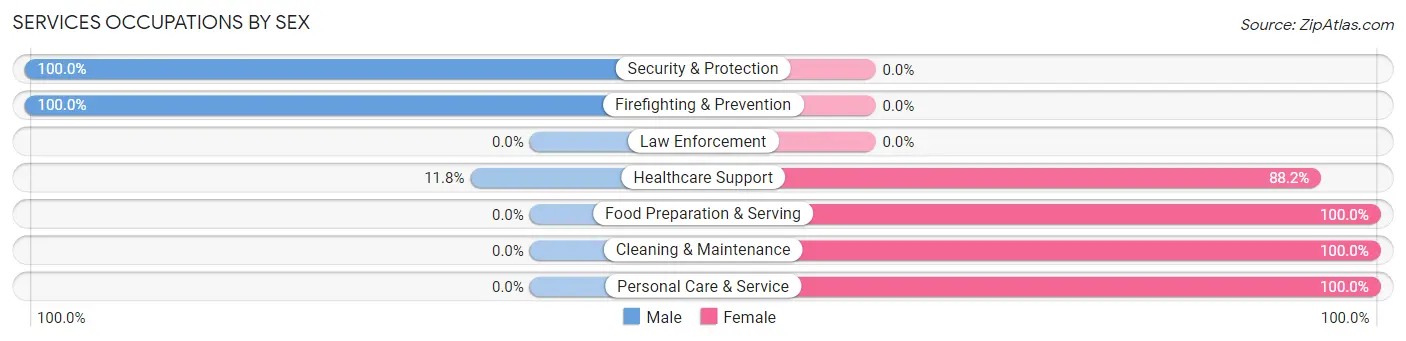
| Occupation | Male | Female |
| Healthcare Support | 2 (11.8%) | 15 (88.2%) |
| Security & Protection | 1 (100.0%) | 0 (0.0%) |
| Firefighting & Prevention | 1 (100.0%) | 0 (0.0%) |
| Law Enforcement | 0 (0.0%) | 0 (0.0%) |
| Food Preparation & Serving | 0 (0.0%) | 7 (100.0%) |
| Cleaning & Maintenance | 0 (0.0%) | 1 (100.0%) |
| Personal Care & Service | 0 (0.0%) | 2 (100.0%) |
| Total (Category) | 3 (10.7%) | 25 (89.3%) |
| Total (Overall) | 71 (52.6%) | 64 (47.4%) |
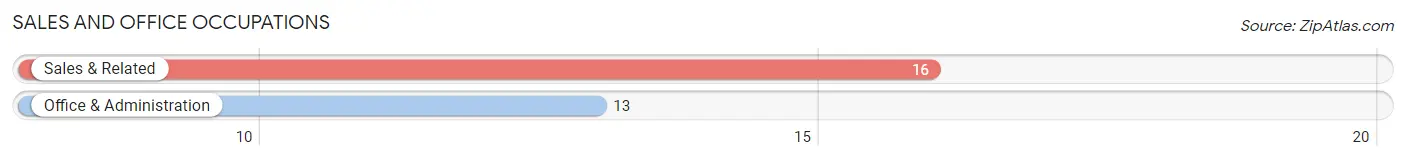
Sales and Office Occupations
The most common Sales and Office occupations in Fayetteville are Sales & Related (16 | 11.8%), and Office & Administration (13 | 9.6%).
Sales and Office Occupations by Sex
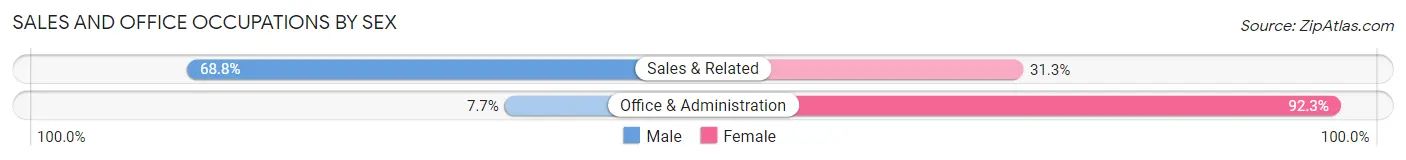
| Occupation | Male | Female |
| Sales & Related | 11 (68.8%) | 5 (31.2%) |
| Office & Administration | 1 (7.7%) | 12 (92.3%) |
| Total (Category) | 12 (41.4%) | 17 (58.6%) |
| Total (Overall) | 71 (52.6%) | 64 (47.4%) |
Natural Resources, Construction and Maintenance Occupations
The most common Natural Resources, Construction and Maintenance occupations in Fayetteville are Construction & Extraction (9 | 6.7%), Installation, Maintenance & Repair (3 | 2.2%), and Farming, Fishing & Forestry (2 | 1.5%).
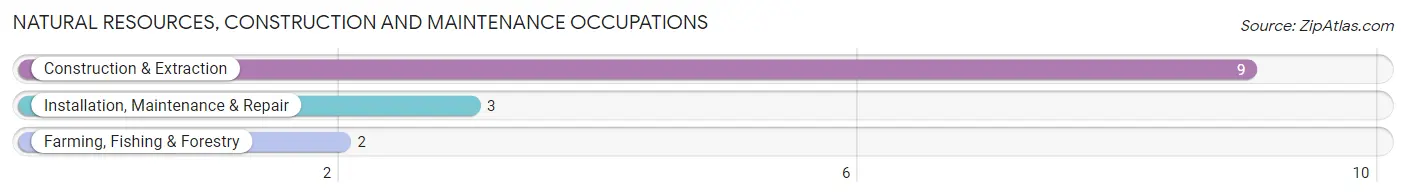
Natural Resources, Construction and Maintenance Occupations by Sex

| Occupation | Male | Female |
| Farming, Fishing & Forestry | 2 (100.0%) | 0 (0.0%) |
| Construction & Extraction | 9 (100.0%) | 0 (0.0%) |
| Installation, Maintenance & Repair | 3 (100.0%) | 0 (0.0%) |
| Total (Category) | 14 (100.0%) | 0 (0.0%) |
| Total (Overall) | 71 (52.6%) | 64 (47.4%) |
Production, Transportation and Moving Occupations
The most common Production, Transportation and Moving occupations in Fayetteville are Production (34 | 25.2%), Material Moving (7 | 5.2%), and Transportation (4 | 3.0%).
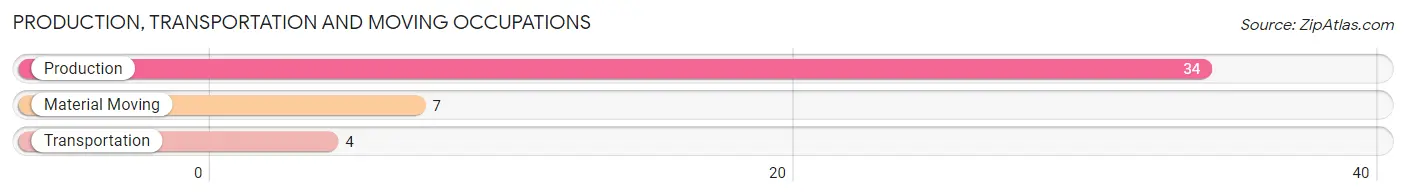
Production, Transportation and Moving Occupations by Sex
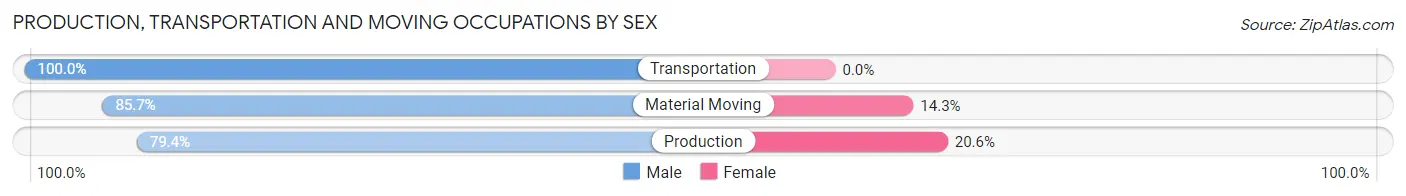
| Occupation | Male | Female |
| Production | 27 (79.4%) | 7 (20.6%) |
| Transportation | 4 (100.0%) | 0 (0.0%) |
| Material Moving | 6 (85.7%) | 1 (14.3%) |
| Total (Category) | 37 (82.2%) | 8 (17.8%) |
| Total (Overall) | 71 (52.6%) | 64 (47.4%) |
Employment Industries by Sex in Fayetteville
Employment Industries in Fayetteville
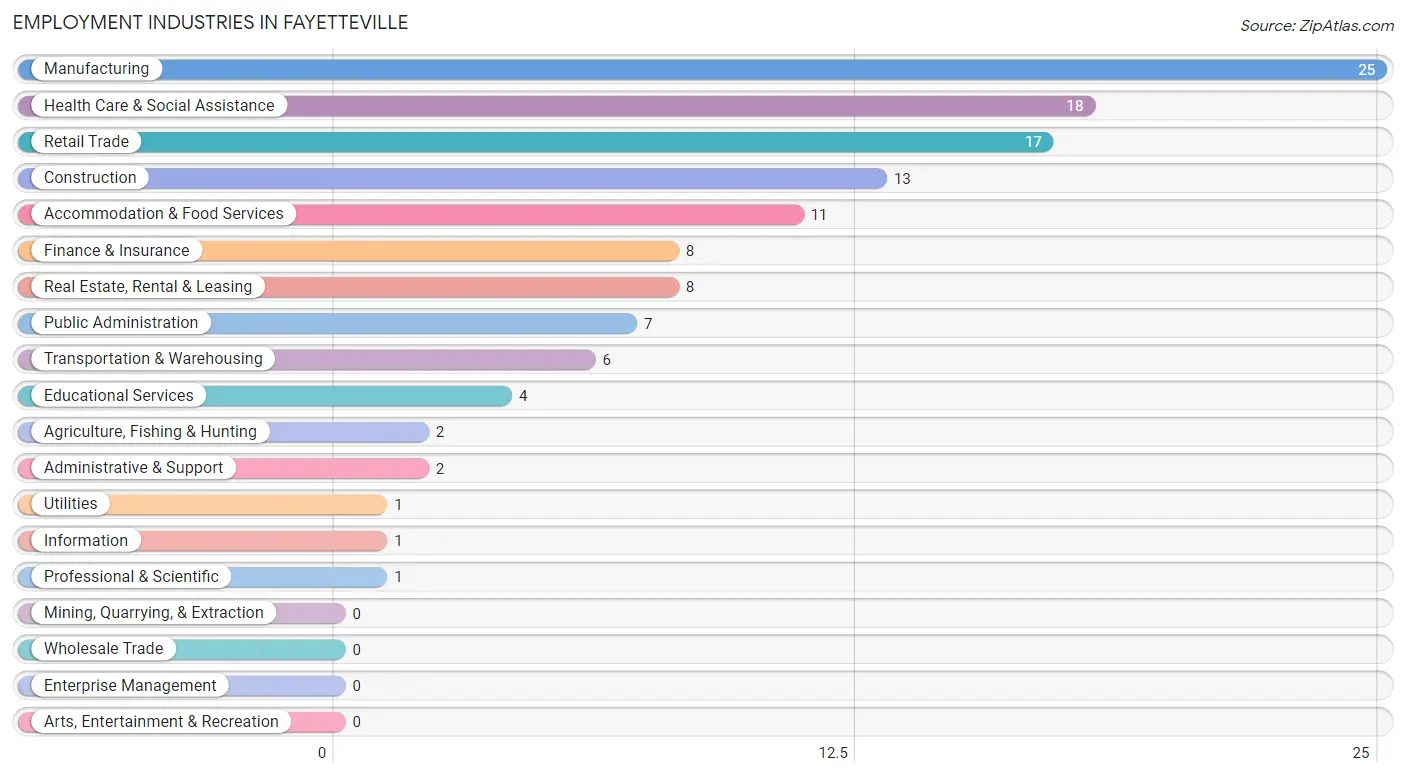
The major employment industries in Fayetteville include Manufacturing (25 | 18.5%), Health Care & Social Assistance (18 | 13.3%), Retail Trade (17 | 12.6%), Construction (13 | 9.6%), and Accommodation & Food Services (11 | 8.2%).
Employment Industries by Sex in Fayetteville
The Fayetteville industries that see more men than women are Agriculture, Fishing & Hunting (100.0%), Construction (100.0%), and Retail Trade (100.0%), whereas the industries that tend to have a higher number of women are Utilities (100.0%), Information (100.0%), and Professional & Scientific (100.0%).
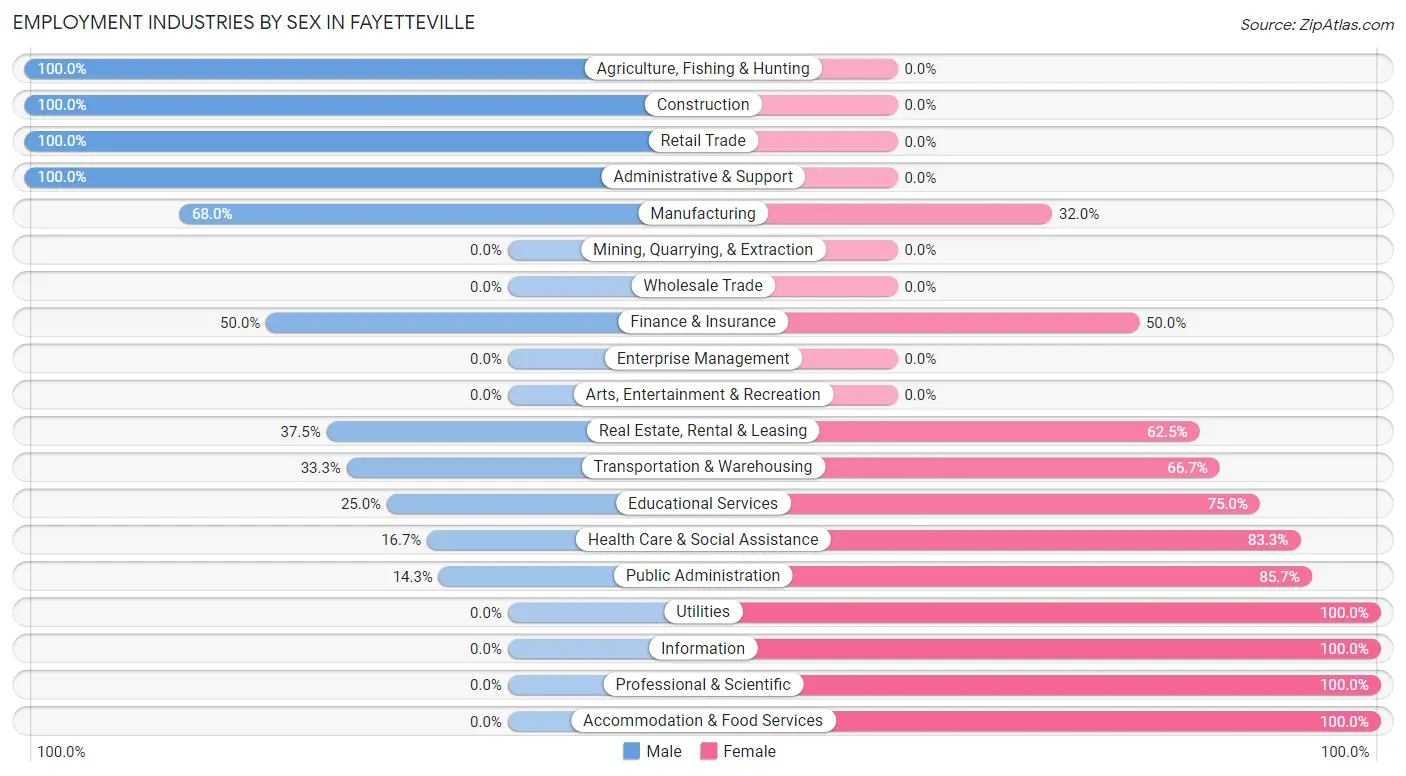
| Industry | Male | Female |
| Agriculture, Fishing & Hunting | 2 (100.0%) | 0 (0.0%) |
| Mining, Quarrying, & Extraction | 0 (0.0%) | 0 (0.0%) |
| Construction | 13 (100.0%) | 0 (0.0%) |
| Manufacturing | 17 (68.0%) | 8 (32.0%) |
| Wholesale Trade | 0 (0.0%) | 0 (0.0%) |
| Retail Trade | 17 (100.0%) | 0 (0.0%) |
| Transportation & Warehousing | 2 (33.3%) | 4 (66.7%) |
| Utilities | 0 (0.0%) | 1 (100.0%) |
| Information | 0 (0.0%) | 1 (100.0%) |
| Finance & Insurance | 4 (50.0%) | 4 (50.0%) |
| Real Estate, Rental & Leasing | 3 (37.5%) | 5 (62.5%) |
| Professional & Scientific | 0 (0.0%) | 1 (100.0%) |
| Enterprise Management | 0 (0.0%) | 0 (0.0%) |
| Administrative & Support | 2 (100.0%) | 0 (0.0%) |
| Educational Services | 1 (25.0%) | 3 (75.0%) |
| Health Care & Social Assistance | 3 (16.7%) | 15 (83.3%) |
| Arts, Entertainment & Recreation | 0 (0.0%) | 0 (0.0%) |
| Accommodation & Food Services | 0 (0.0%) | 11 (100.0%) |
| Public Administration | 1 (14.3%) | 6 (85.7%) |
| Total | 71 (52.6%) | 64 (47.4%) |
Education in Fayetteville
School Enrollment in Fayetteville
The most common levels of schooling among the 50 students in Fayetteville are middle school (19 | 38.0%), high school (16 | 32.0%), and nursery / preschool (5 | 10.0%).
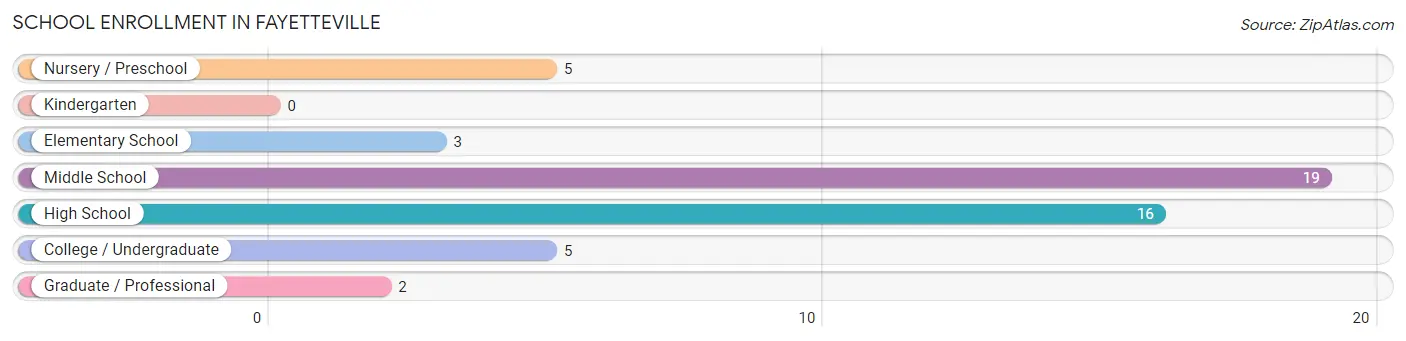
| School Level | # Students | % Students |
| Nursery / Preschool | 5 | 10.0% |
| Kindergarten | 0 | 0.0% |
| Elementary School | 3 | 6.0% |
| Middle School | 19 | 38.0% |
| High School | 16 | 32.0% |
| College / Undergraduate | 5 | 10.0% |
| Graduate / Professional | 2 | 4.0% |
| Total | 50 | 100.0% |
School Enrollment by Age by Funding Source in Fayetteville
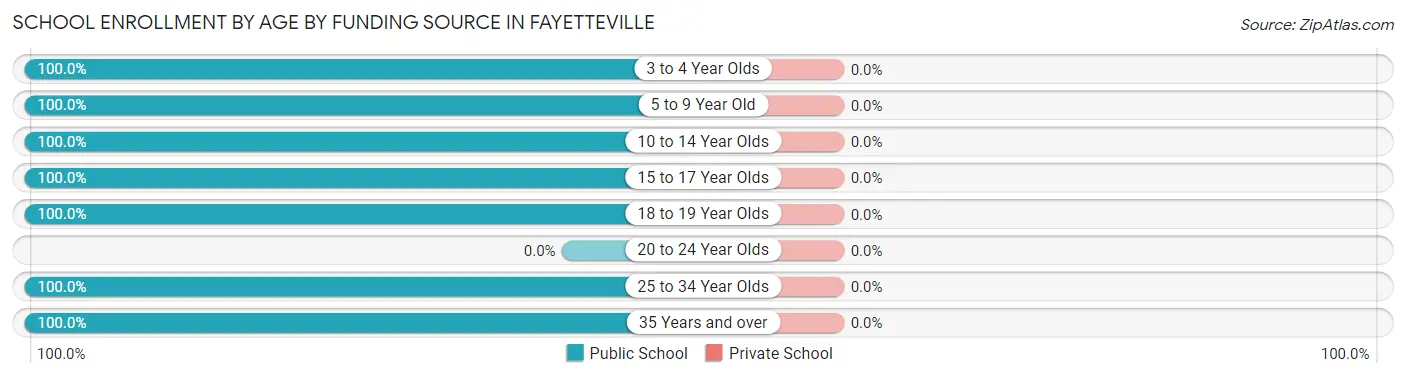
| Age Bracket | Public School | Private School |
| 3 to 4 Year Olds | 3 (100.0%) | 0 (0.0%) |
| 5 to 9 Year Old | 5 (100.0%) | 0 (0.0%) |
| 10 to 14 Year Olds | 19 (100.0%) | 0 (0.0%) |
| 15 to 17 Year Olds | 9 (100.0%) | 0 (0.0%) |
| 18 to 19 Year Olds | 9 (100.0%) | 0 (0.0%) |
| 20 to 24 Year Olds | 0 (0.0%) | 0 (0.0%) |
| 25 to 34 Year Olds | 2 (100.0%) | 0 (0.0%) |
| 35 Years and over | 3 (100.0%) | 0 (0.0%) |
| Total | 50 (100.0%) | 0 (0.0%) |
Educational Attainment by Field of Study in Fayetteville
Education (7 | 31.8%), physical & health sciences (4 | 18.2%), psychology (3 | 13.6%), science & technology (2 | 9.1%), and liberal arts & history (2 | 9.1%) are the most common fields of study among 22 individuals in Fayetteville who have obtained a bachelor's degree or higher.
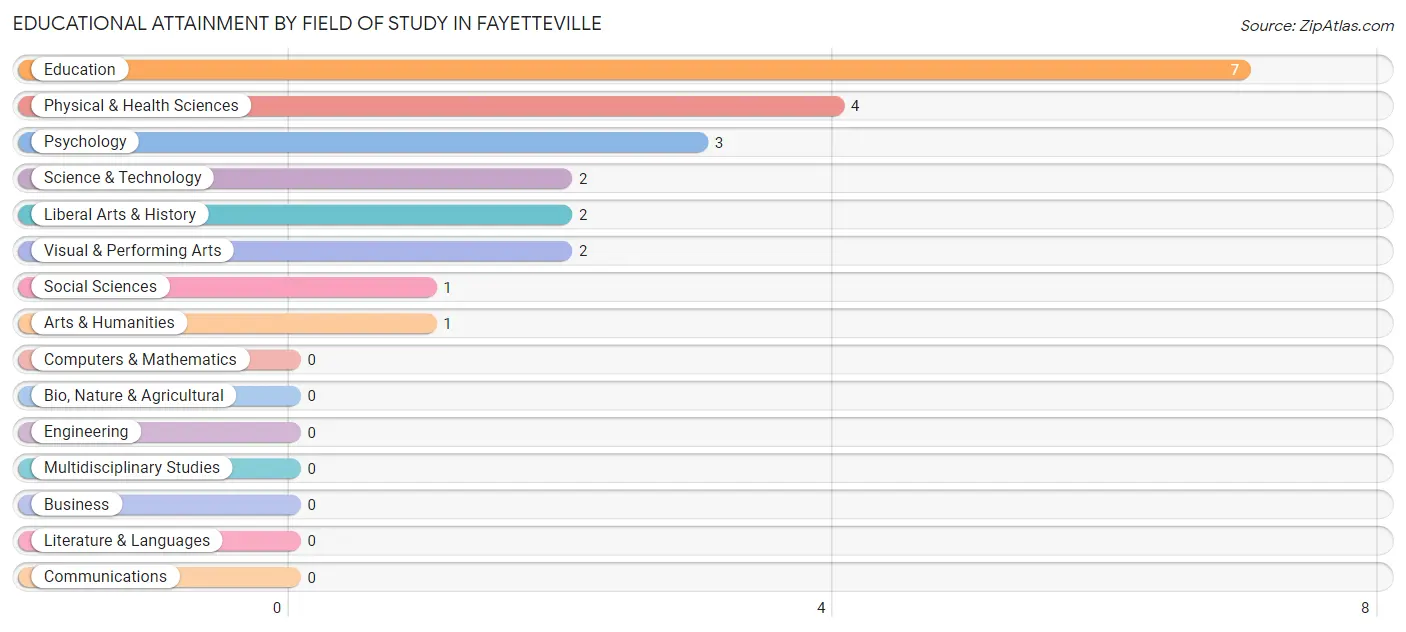
| Field of Study | # Graduates | % Graduates |
| Computers & Mathematics | 0 | 0.0% |
| Bio, Nature & Agricultural | 0 | 0.0% |
| Physical & Health Sciences | 4 | 18.2% |
| Psychology | 3 | 13.6% |
| Social Sciences | 1 | 4.5% |
| Engineering | 0 | 0.0% |
| Multidisciplinary Studies | 0 | 0.0% |
| Science & Technology | 2 | 9.1% |
| Business | 0 | 0.0% |
| Education | 7 | 31.8% |
| Literature & Languages | 0 | 0.0% |
| Liberal Arts & History | 2 | 9.1% |
| Visual & Performing Arts | 2 | 9.1% |
| Communications | 0 | 0.0% |
| Arts & Humanities | 1 | 4.5% |
| Total | 22 | 100.0% |
Transportation & Commute in Fayetteville
Vehicle Availability by Sex in Fayetteville
The most prevalent vehicle ownership categories in Fayetteville are males with 3 vehicles (25, accounting for 36.2%) and females with 3 vehicles (21, making up 39.1%).
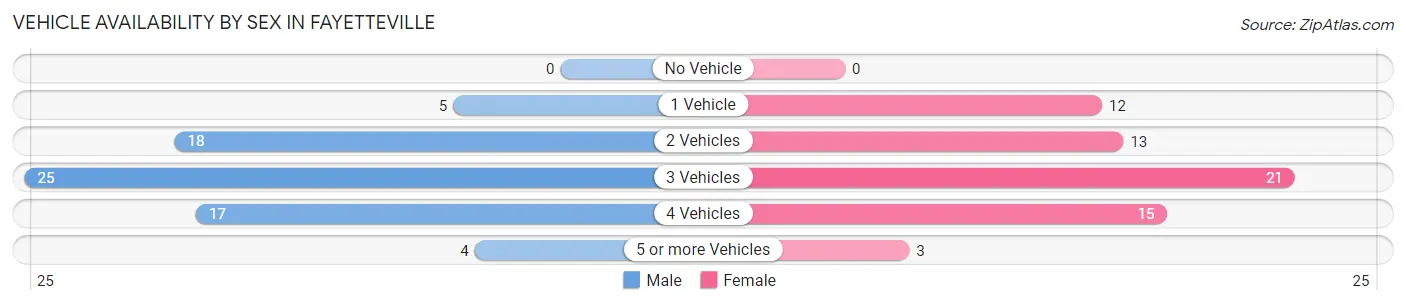
| Vehicles Available | Male | Female |
| No Vehicle | 0 (0.0%) | 0 (0.0%) |
| 1 Vehicle | 5 (7.2%) | 12 (18.8%) |
| 2 Vehicles | 18 (26.1%) | 13 (20.3%) |
| 3 Vehicles | 25 (36.2%) | 21 (32.8%) |
| 4 Vehicles | 17 (24.6%) | 15 (23.4%) |
| 5 or more Vehicles | 4 (5.8%) | 3 (4.7%) |
| Total | 69 (100.0%) | 64 (100.0%) |
Commute Time in Fayetteville
The most frequently occuring commute durations in Fayetteville are 30 to 34 minutes (31 commuters, 23.5%), 60 to 89 minutes (30 commuters, 22.7%), and 45 to 59 minutes (23 commuters, 17.4%).
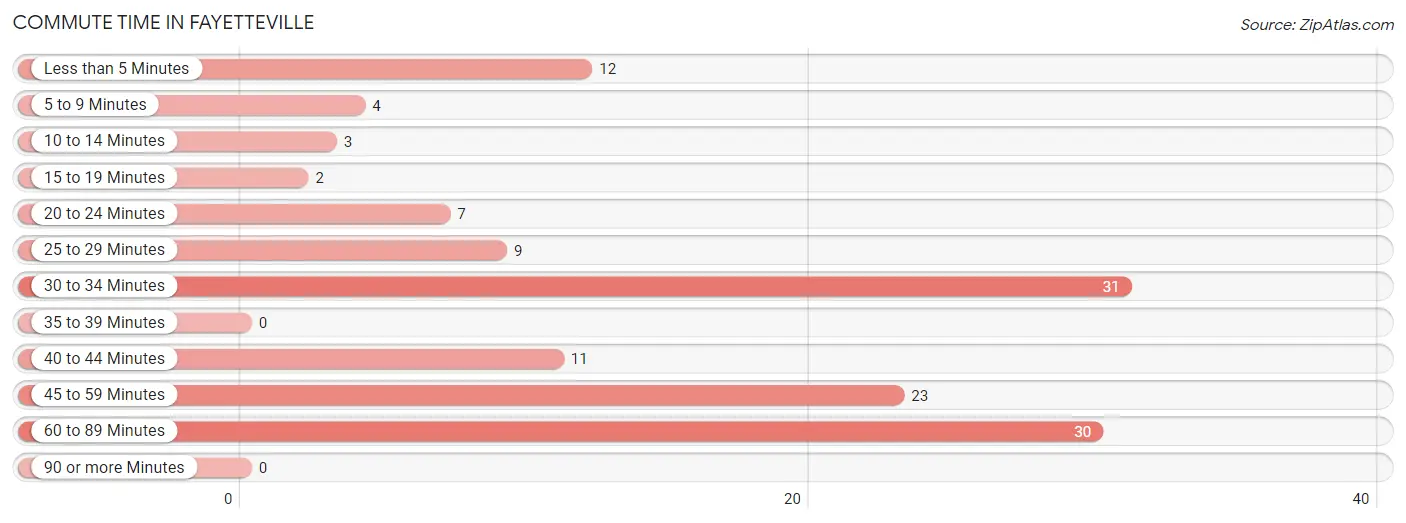
| Commute Time | # Commuters | % Commuters |
| Less than 5 Minutes | 12 | 9.1% |
| 5 to 9 Minutes | 4 | 3.0% |
| 10 to 14 Minutes | 3 | 2.3% |
| 15 to 19 Minutes | 2 | 1.5% |
| 20 to 24 Minutes | 7 | 5.3% |
| 25 to 29 Minutes | 9 | 6.8% |
| 30 to 34 Minutes | 31 | 23.5% |
| 35 to 39 Minutes | 0 | 0.0% |
| 40 to 44 Minutes | 11 | 8.3% |
| 45 to 59 Minutes | 23 | 17.4% |
| 60 to 89 Minutes | 30 | 22.7% |
| 90 or more Minutes | 0 | 0.0% |
Commute Time by Sex in Fayetteville
The most common commute times in Fayetteville are 60 to 89 minutes (22 commuters, 31.9%) for males and 30 to 34 minutes (19 commuters, 30.2%) for females.
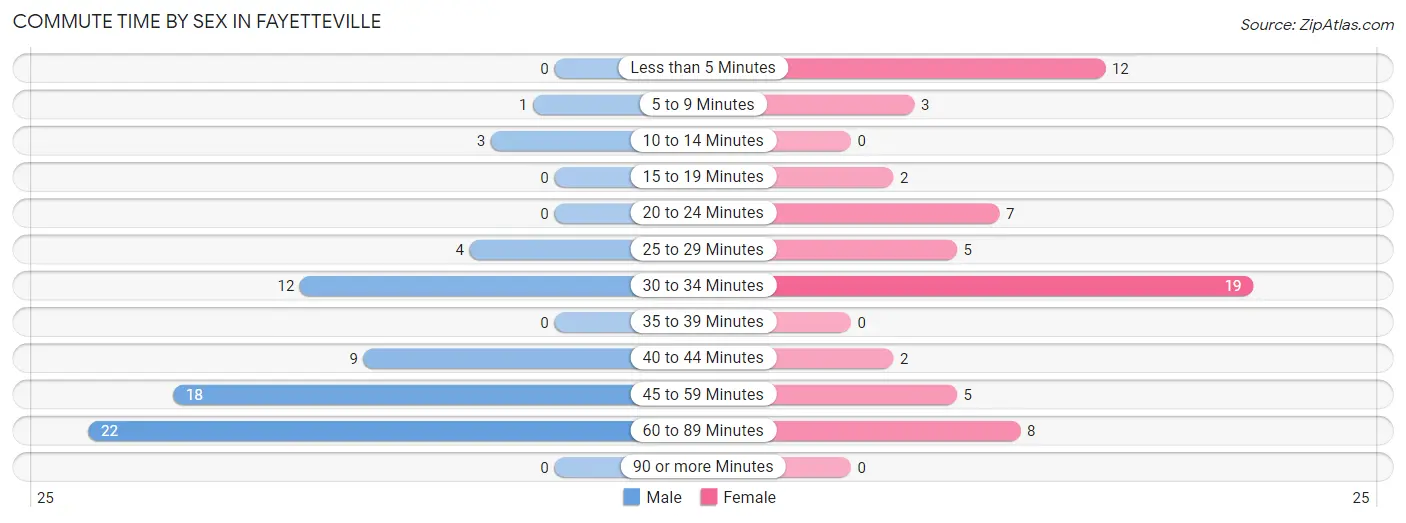
| Commute Time | Male | Female |
| Less than 5 Minutes | 0 (0.0%) | 12 (19.1%) |
| 5 to 9 Minutes | 1 (1.5%) | 3 (4.8%) |
| 10 to 14 Minutes | 3 (4.3%) | 0 (0.0%) |
| 15 to 19 Minutes | 0 (0.0%) | 2 (3.2%) |
| 20 to 24 Minutes | 0 (0.0%) | 7 (11.1%) |
| 25 to 29 Minutes | 4 (5.8%) | 5 (7.9%) |
| 30 to 34 Minutes | 12 (17.4%) | 19 (30.2%) |
| 35 to 39 Minutes | 0 (0.0%) | 0 (0.0%) |
| 40 to 44 Minutes | 9 (13.0%) | 2 (3.2%) |
| 45 to 59 Minutes | 18 (26.1%) | 5 (7.9%) |
| 60 to 89 Minutes | 22 (31.9%) | 8 (12.7%) |
| 90 or more Minutes | 0 (0.0%) | 0 (0.0%) |
Time of Departure to Work by Sex in Fayetteville
The most frequent times of departure to work in Fayetteville are 5:30 AM to 5:59 AM (13, 18.8%) for males and 6:00 AM to 6:29 AM (13, 20.6%) for females.
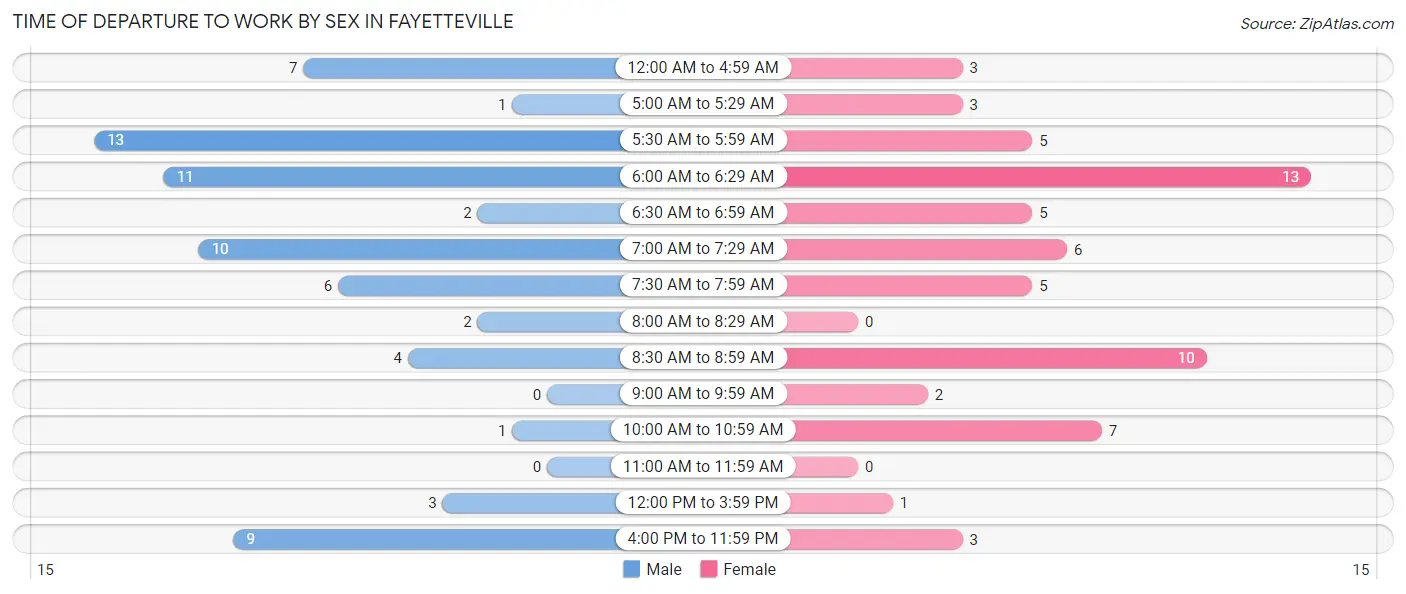
| Time of Departure | Male | Female |
| 12:00 AM to 4:59 AM | 7 (10.1%) | 3 (4.8%) |
| 5:00 AM to 5:29 AM | 1 (1.5%) | 3 (4.8%) |
| 5:30 AM to 5:59 AM | 13 (18.8%) | 5 (7.9%) |
| 6:00 AM to 6:29 AM | 11 (15.9%) | 13 (20.6%) |
| 6:30 AM to 6:59 AM | 2 (2.9%) | 5 (7.9%) |
| 7:00 AM to 7:29 AM | 10 (14.5%) | 6 (9.5%) |
| 7:30 AM to 7:59 AM | 6 (8.7%) | 5 (7.9%) |
| 8:00 AM to 8:29 AM | 2 (2.9%) | 0 (0.0%) |
| 8:30 AM to 8:59 AM | 4 (5.8%) | 10 (15.9%) |
| 9:00 AM to 9:59 AM | 0 (0.0%) | 2 (3.2%) |
| 10:00 AM to 10:59 AM | 1 (1.5%) | 7 (11.1%) |
| 11:00 AM to 11:59 AM | 0 (0.0%) | 0 (0.0%) |
| 12:00 PM to 3:59 PM | 3 (4.3%) | 1 (1.6%) |
| 4:00 PM to 11:59 PM | 9 (13.0%) | 3 (4.8%) |
| Total | 69 (100.0%) | 63 (100.0%) |
Housing Occupancy in Fayetteville
Occupancy by Ownership in Fayetteville
Of the total 106 dwellings in Fayetteville, owner-occupied units account for 62 (58.5%), while renter-occupied units make up 44 (41.5%).
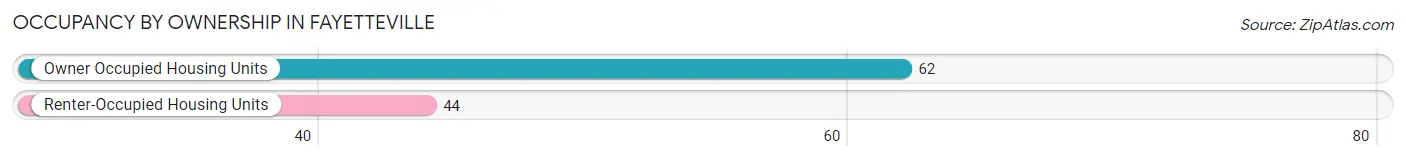
| Occupancy | # Housing Units | % Housing Units |
| Owner Occupied Housing Units | 62 | 58.5% |
| Renter-Occupied Housing Units | 44 | 41.5% |
| Total Occupied Housing Units | 106 | 100.0% |
Occupancy by Household Size in Fayetteville
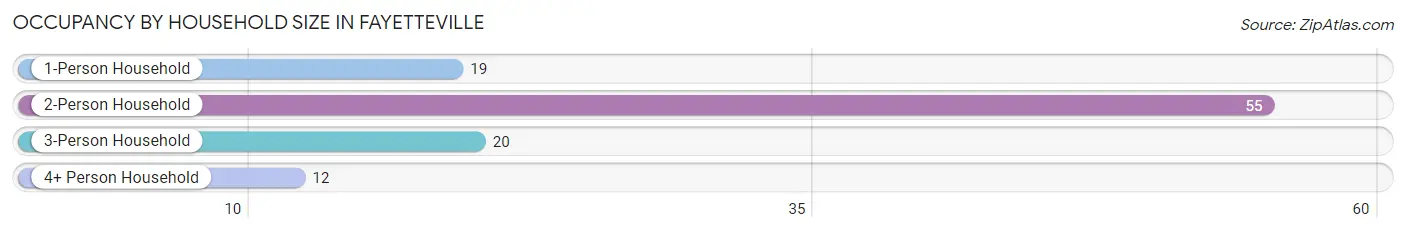
| Household Size | # Housing Units | % Housing Units |
| 1-Person Household | 19 | 17.9% |
| 2-Person Household | 55 | 51.9% |
| 3-Person Household | 20 | 18.9% |
| 4+ Person Household | 12 | 11.3% |
| Total Housing Units | 106 | 100.0% |
Occupancy by Ownership by Household Size in Fayetteville
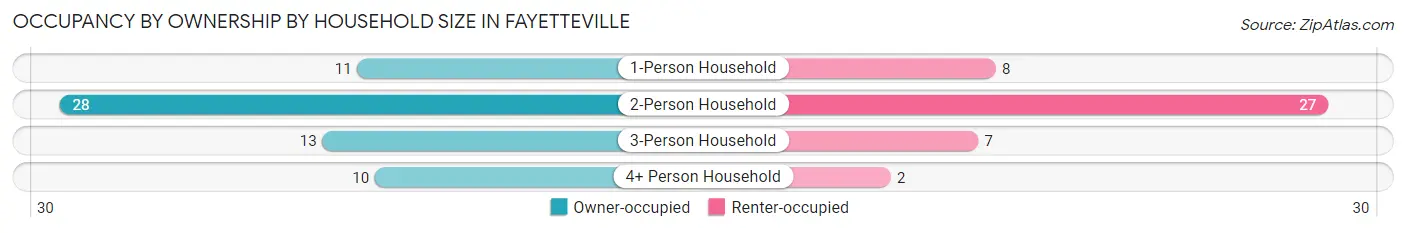
| Household Size | Owner-occupied | Renter-occupied |
| 1-Person Household | 11 (57.9%) | 8 (42.1%) |
| 2-Person Household | 28 (50.9%) | 27 (49.1%) |
| 3-Person Household | 13 (65.0%) | 7 (35.0%) |
| 4+ Person Household | 10 (83.3%) | 2 (16.7%) |
| Total Housing Units | 62 (58.5%) | 44 (41.5%) |
Occupancy by Educational Attainment in Fayetteville
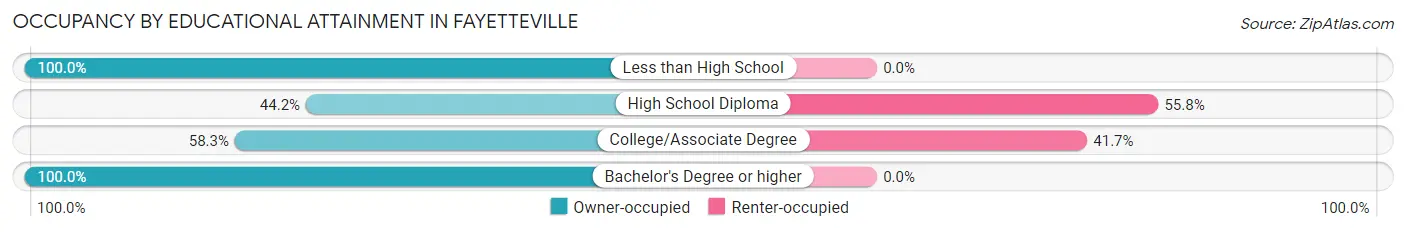
| Household Size | Owner-occupied | Renter-occupied |
| Less than High School | 5 (100.0%) | 0 (0.0%) |
| High School Diploma | 23 (44.2%) | 29 (55.8%) |
| College/Associate Degree | 21 (58.3%) | 15 (41.7%) |
| Bachelor's Degree or higher | 13 (100.0%) | 0 (0.0%) |
Occupancy by Age of Householder in Fayetteville
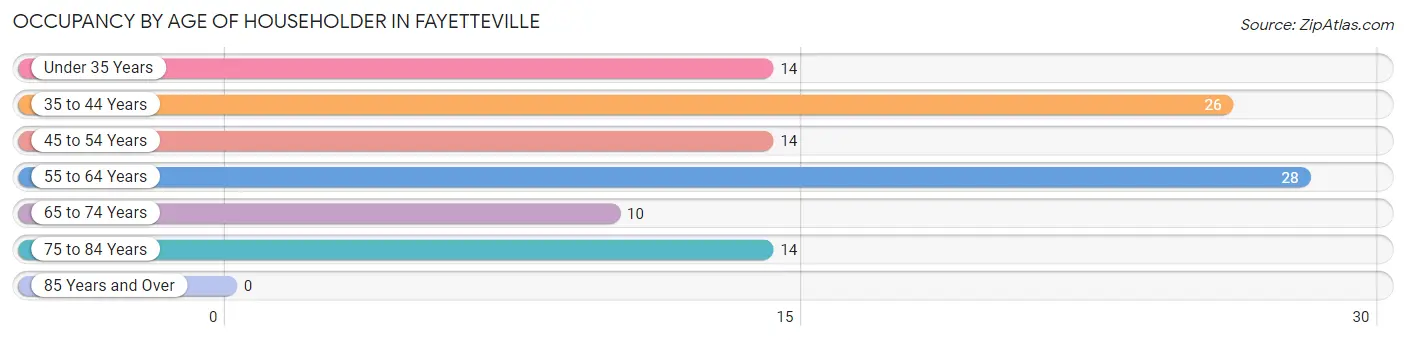
| Age Bracket | # Households | % Households |
| Under 35 Years | 14 | 13.2% |
| 35 to 44 Years | 26 | 24.5% |
| 45 to 54 Years | 14 | 13.2% |
| 55 to 64 Years | 28 | 26.4% |
| 65 to 74 Years | 10 | 9.4% |
| 75 to 84 Years | 14 | 13.2% |
| 85 Years and Over | 0 | 0.0% |
| Total | 106 | 100.0% |
Housing Finances in Fayetteville
Median Income by Occupancy in Fayetteville
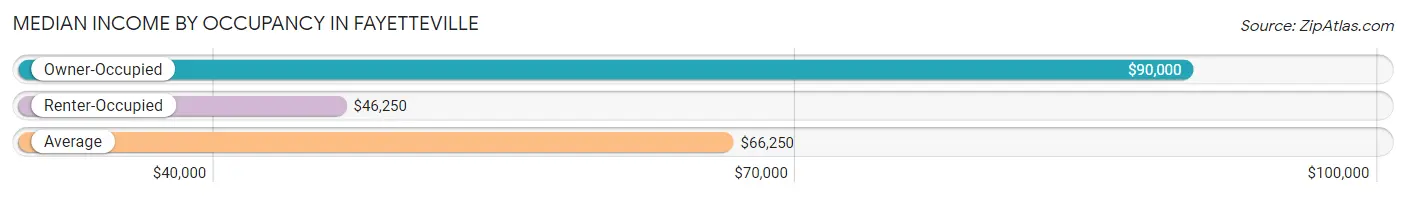
| Occupancy Type | # Households | Median Income |
| Owner-Occupied | 62 (58.5%) | $90,000 |
| Renter-Occupied | 44 (41.5%) | $46,250 |
| Average | 106 (100.0%) | $66,250 |
Occupancy by Householder Income Bracket in Fayetteville
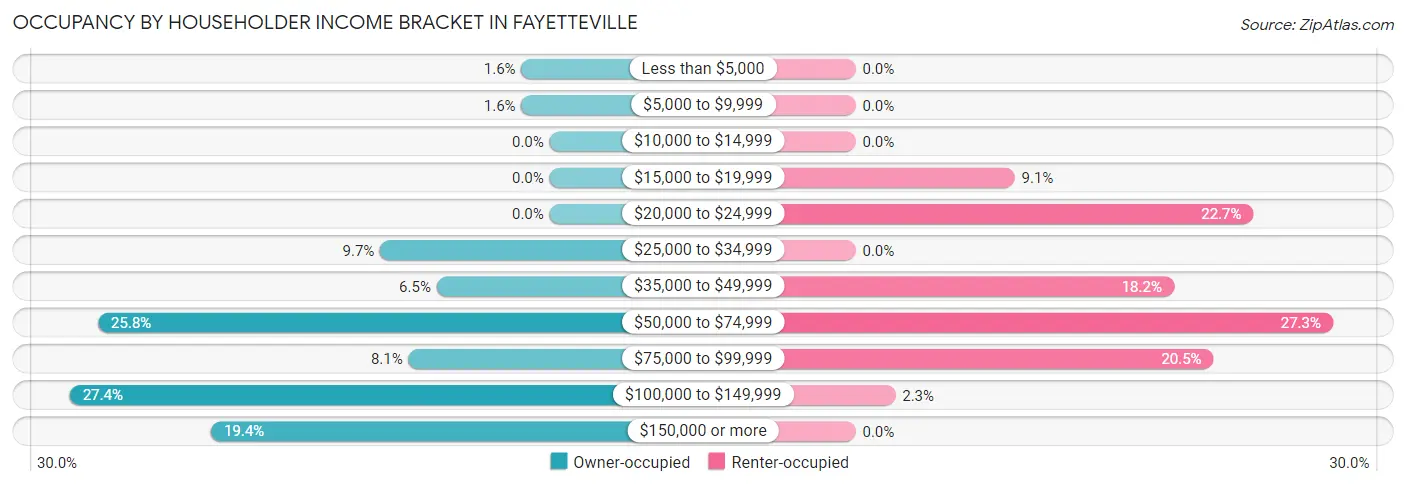
| Income Bracket | Owner-occupied | Renter-occupied |
| Less than $5,000 | 1 (1.6%) | 0 (0.0%) |
| $5,000 to $9,999 | 1 (1.6%) | 0 (0.0%) |
| $10,000 to $14,999 | 0 (0.0%) | 0 (0.0%) |
| $15,000 to $19,999 | 0 (0.0%) | 4 (9.1%) |
| $20,000 to $24,999 | 0 (0.0%) | 10 (22.7%) |
| $25,000 to $34,999 | 6 (9.7%) | 0 (0.0%) |
| $35,000 to $49,999 | 4 (6.5%) | 8 (18.2%) |
| $50,000 to $74,999 | 16 (25.8%) | 12 (27.3%) |
| $75,000 to $99,999 | 5 (8.1%) | 9 (20.4%) |
| $100,000 to $149,999 | 17 (27.4%) | 1 (2.3%) |
| $150,000 or more | 12 (19.4%) | 0 (0.0%) |
| Total | 62 (100.0%) | 44 (100.0%) |
Monthly Housing Cost Tiers in Fayetteville
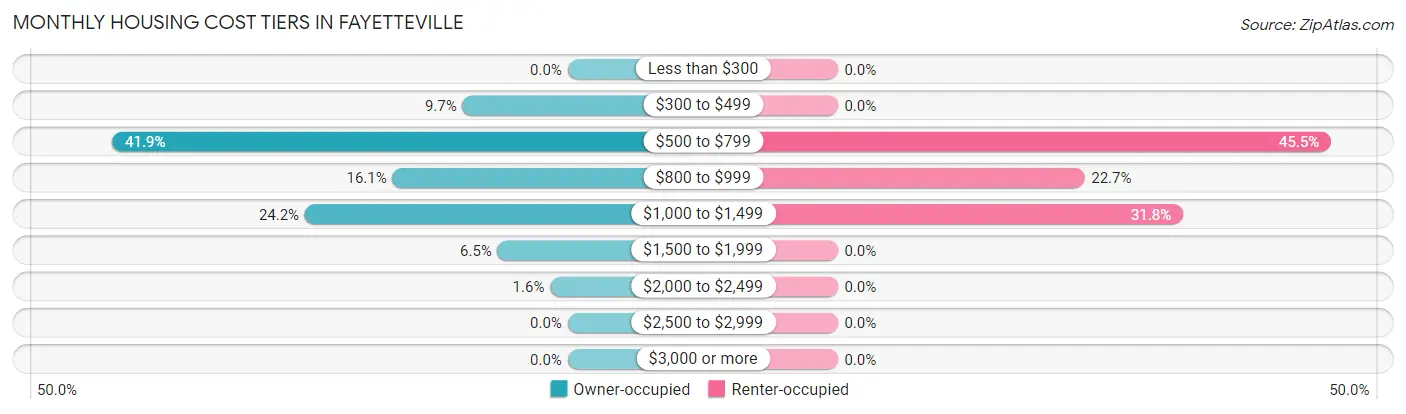
| Monthly Cost | Owner-occupied | Renter-occupied |
| Less than $300 | 0 (0.0%) | 0 (0.0%) |
| $300 to $499 | 6 (9.7%) | 0 (0.0%) |
| $500 to $799 | 26 (41.9%) | 20 (45.5%) |
| $800 to $999 | 10 (16.1%) | 10 (22.7%) |
| $1,000 to $1,499 | 15 (24.2%) | 14 (31.8%) |
| $1,500 to $1,999 | 4 (6.5%) | 0 (0.0%) |
| $2,000 to $2,499 | 1 (1.6%) | 0 (0.0%) |
| $2,500 to $2,999 | 0 (0.0%) | 0 (0.0%) |
| $3,000 or more | 0 (0.0%) | 0 (0.0%) |
| Total | 62 (100.0%) | 44 (100.0%) |
Physical Housing Characteristics in Fayetteville
Housing Structures in Fayetteville
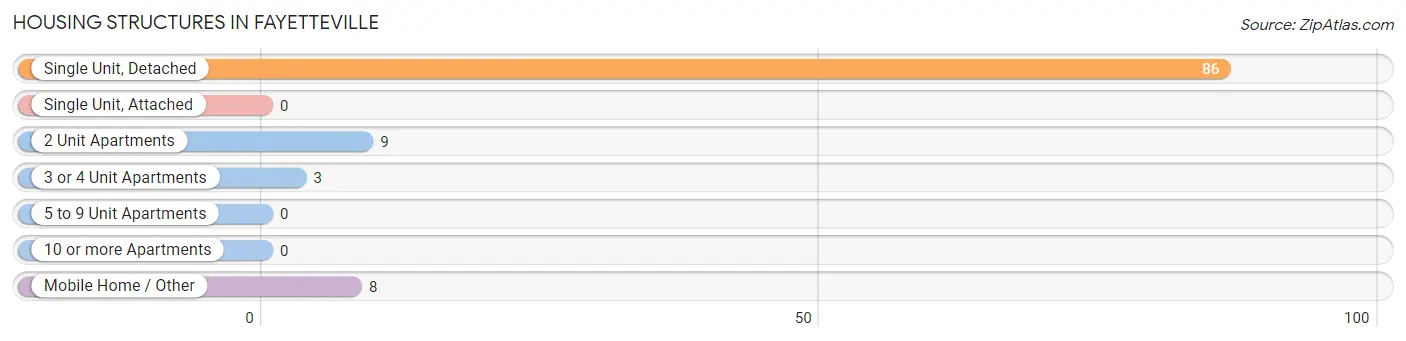
| Structure Type | # Housing Units | % Housing Units |
| Single Unit, Detached | 86 | 81.1% |
| Single Unit, Attached | 0 | 0.0% |
| 2 Unit Apartments | 9 | 8.5% |
| 3 or 4 Unit Apartments | 3 | 2.8% |
| 5 to 9 Unit Apartments | 0 | 0.0% |
| 10 or more Apartments | 0 | 0.0% |
| Mobile Home / Other | 8 | 7.5% |
| Total | 106 | 100.0% |
Housing Structures by Occupancy in Fayetteville
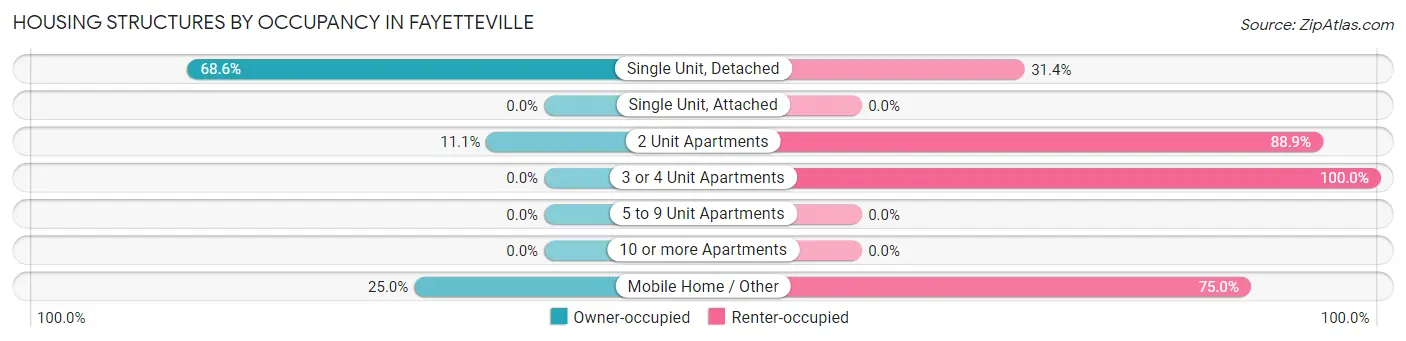
| Structure Type | Owner-occupied | Renter-occupied |
| Single Unit, Detached | 59 (68.6%) | 27 (31.4%) |
| Single Unit, Attached | 0 (0.0%) | 0 (0.0%) |
| 2 Unit Apartments | 1 (11.1%) | 8 (88.9%) |
| 3 or 4 Unit Apartments | 0 (0.0%) | 3 (100.0%) |
| 5 to 9 Unit Apartments | 0 (0.0%) | 0 (0.0%) |
| 10 or more Apartments | 0 (0.0%) | 0 (0.0%) |
| Mobile Home / Other | 2 (25.0%) | 6 (75.0%) |
| Total | 62 (58.5%) | 44 (41.5%) |
Housing Structures by Number of Rooms in Fayetteville
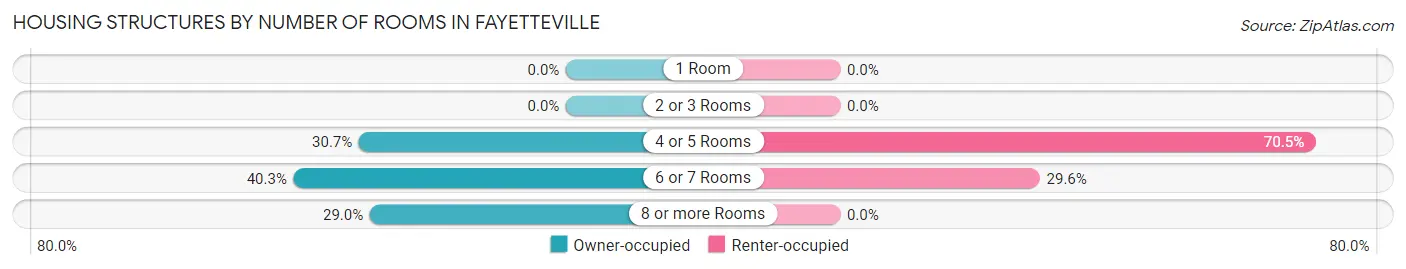
| Number of Rooms | Owner-occupied | Renter-occupied |
| 1 Room | 0 (0.0%) | 0 (0.0%) |
| 2 or 3 Rooms | 0 (0.0%) | 0 (0.0%) |
| 4 or 5 Rooms | 19 (30.6%) | 31 (70.5%) |
| 6 or 7 Rooms | 25 (40.3%) | 13 (29.5%) |
| 8 or more Rooms | 18 (29.0%) | 0 (0.0%) |
| Total | 62 (100.0%) | 44 (100.0%) |
Housing Structure by Heating Type in Fayetteville
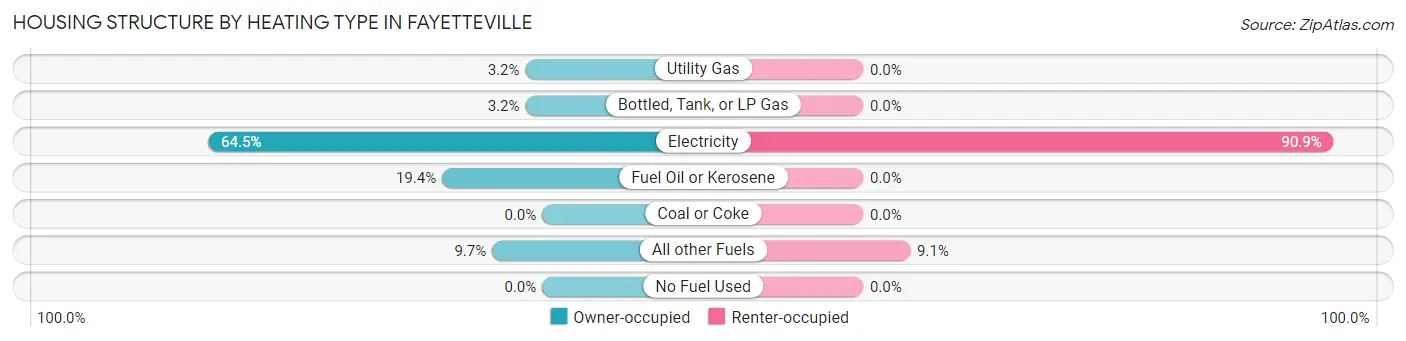
| Heating Type | Owner-occupied | Renter-occupied |
| Utility Gas | 2 (3.2%) | 0 (0.0%) |
| Bottled, Tank, or LP Gas | 2 (3.2%) | 0 (0.0%) |
| Electricity | 40 (64.5%) | 40 (90.9%) |
| Fuel Oil or Kerosene | 12 (19.4%) | 0 (0.0%) |
| Coal or Coke | 0 (0.0%) | 0 (0.0%) |
| All other Fuels | 6 (9.7%) | 4 (9.1%) |
| No Fuel Used | 0 (0.0%) | 0 (0.0%) |
| Total | 62 (100.0%) | 44 (100.0%) |
Household Vehicle Usage in Fayetteville
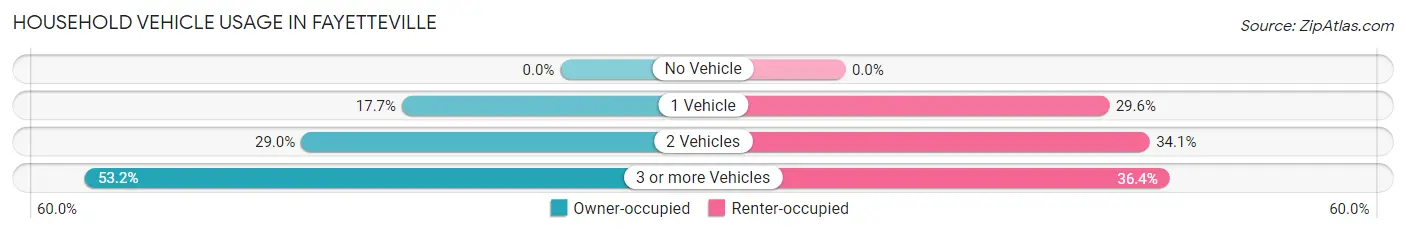
| Vehicles per Household | Owner-occupied | Renter-occupied |
| No Vehicle | 0 (0.0%) | 0 (0.0%) |
| 1 Vehicle | 11 (17.7%) | 13 (29.5%) |
| 2 Vehicles | 18 (29.0%) | 15 (34.1%) |
| 3 or more Vehicles | 33 (53.2%) | 16 (36.4%) |
| Total | 62 (100.0%) | 44 (100.0%) |
Real Estate & Mortgages in Fayetteville
Real Estate and Mortgage Overview in Fayetteville
| Characteristic | Without Mortgage | With Mortgage |
| Housing Units | 30 | 32 |
| Median Property Value | $118,800 | $141,700 |
| Median Household Income | $90,000 | $3 |
| Monthly Housing Costs | $582 | $0 |
| Real Estate Taxes | $1,500 | $4 |
Property Value by Mortgage Status in Fayetteville
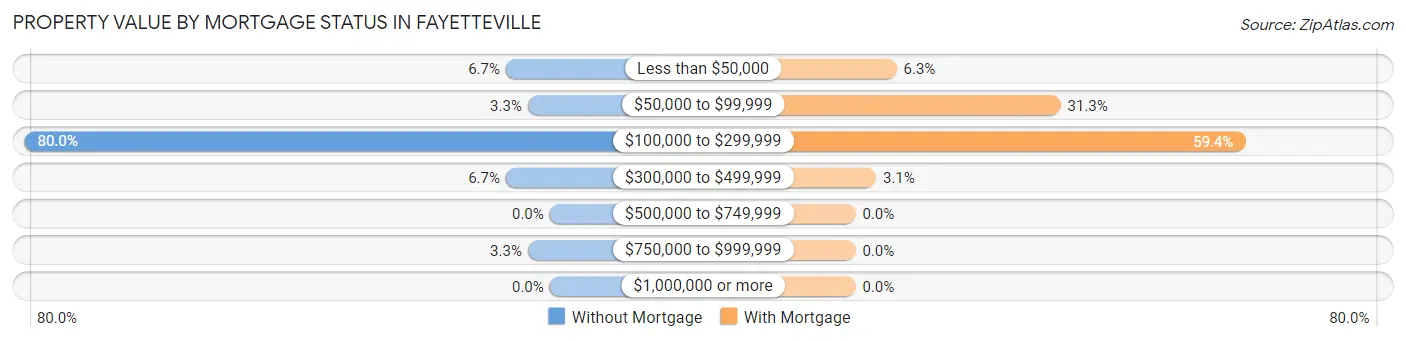
| Property Value | Without Mortgage | With Mortgage |
| Less than $50,000 | 2 (6.7%) | 2 (6.2%) |
| $50,000 to $99,999 | 1 (3.3%) | 10 (31.2%) |
| $100,000 to $299,999 | 24 (80.0%) | 19 (59.4%) |
| $300,000 to $499,999 | 2 (6.7%) | 1 (3.1%) |
| $500,000 to $749,999 | 0 (0.0%) | 0 (0.0%) |
| $750,000 to $999,999 | 1 (3.3%) | 0 (0.0%) |
| $1,000,000 or more | 0 (0.0%) | 0 (0.0%) |
| Total | 30 (100.0%) | 32 (100.0%) |
Household Income by Mortgage Status in Fayetteville
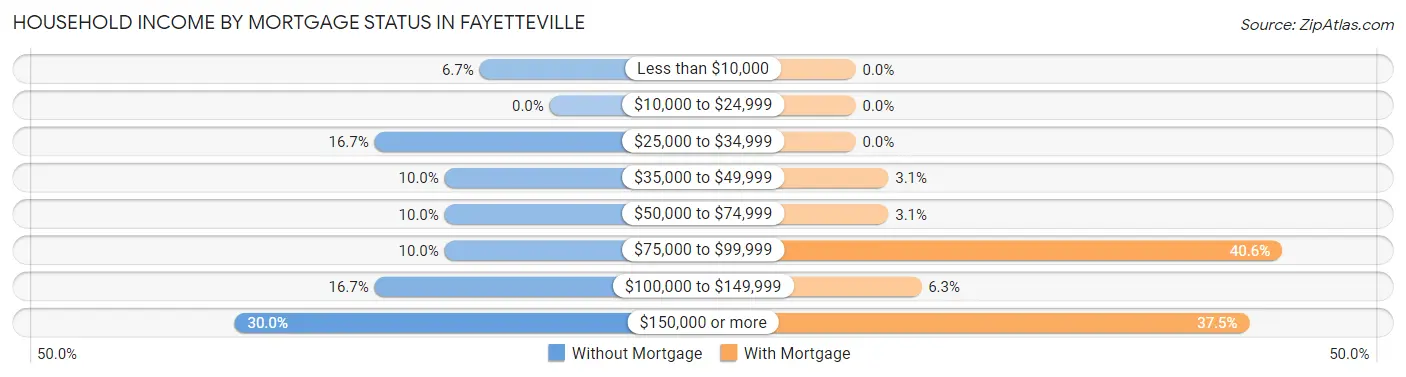
| Household Income | Without Mortgage | With Mortgage |
| Less than $10,000 | 2 (6.7%) | 0 (0.0%) |
| $10,000 to $24,999 | 0 (0.0%) | 0 (0.0%) |
| $25,000 to $34,999 | 5 (16.7%) | 0 (0.0%) |
| $35,000 to $49,999 | 3 (10.0%) | 1 (3.1%) |
| $50,000 to $74,999 | 3 (10.0%) | 1 (3.1%) |
| $75,000 to $99,999 | 3 (10.0%) | 13 (40.6%) |
| $100,000 to $149,999 | 5 (16.7%) | 2 (6.2%) |
| $150,000 or more | 9 (30.0%) | 12 (37.5%) |
| Total | 30 (100.0%) | 32 (100.0%) |
Property Value to Household Income Ratio in Fayetteville
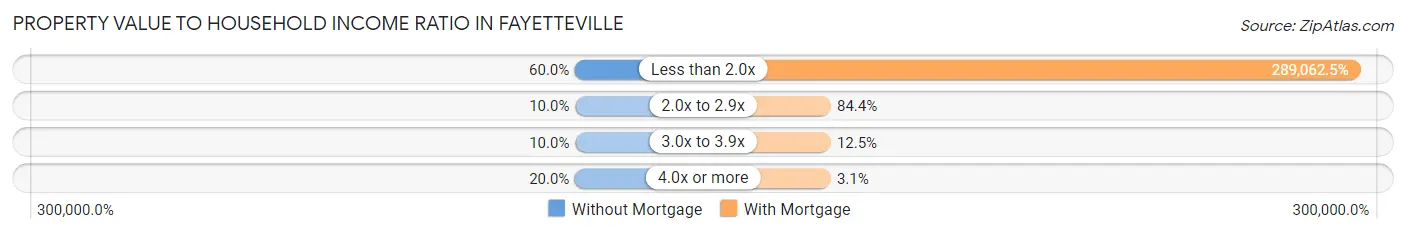
| Value-to-Income Ratio | Without Mortgage | With Mortgage |
| Less than 2.0x | 18 (60.0%) | 92,500 (289,062.5%) |
| 2.0x to 2.9x | 3 (10.0%) | 27 (84.4%) |
| 3.0x to 3.9x | 3 (10.0%) | 4 (12.5%) |
| 4.0x or more | 6 (20.0%) | 1 (3.1%) |
| Total | 30 (100.0%) | 32 (100.0%) |
Real Estate Taxes by Mortgage Status in Fayetteville
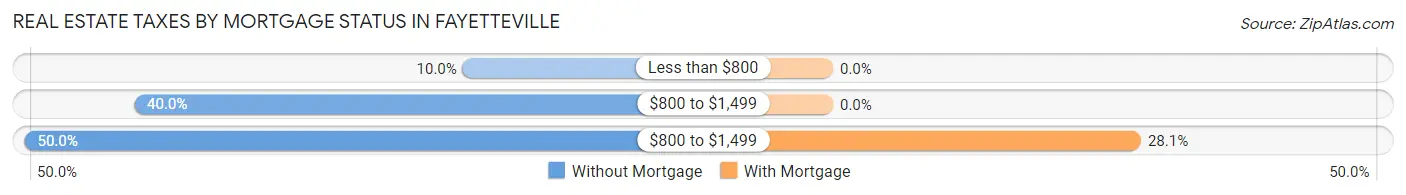
| Property Taxes | Without Mortgage | With Mortgage |
| Less than $800 | 3 (10.0%) | 0 (0.0%) |
| $800 to $1,499 | 12 (40.0%) | 0 (0.0%) |
| $800 to $1,499 | 15 (50.0%) | 9 (28.1%) |
| Total | 30 (100.0%) | 32 (100.0%) |
Health & Disability in Fayetteville
Health Insurance Coverage by Age in Fayetteville
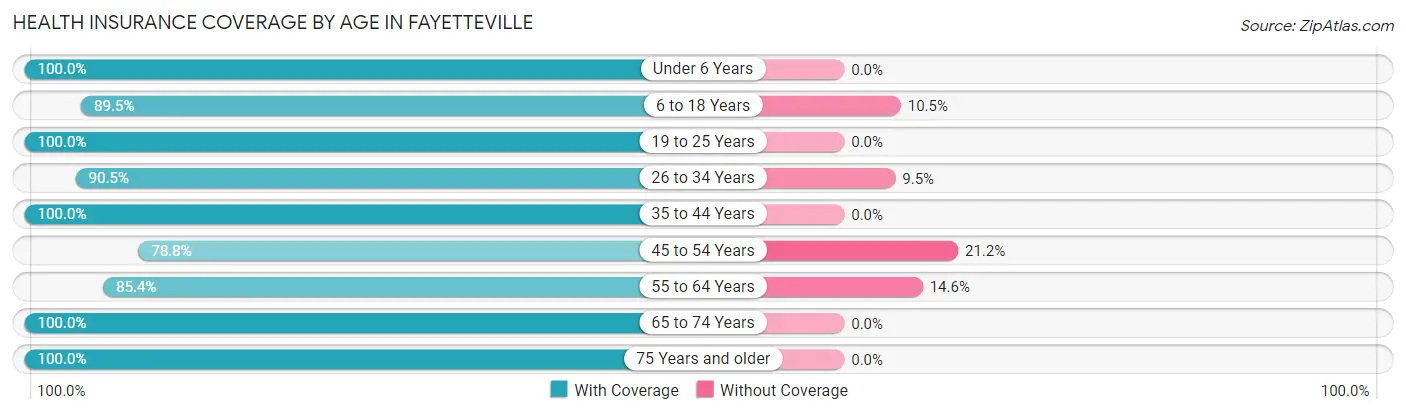
| Age Bracket | With Coverage | Without Coverage |
| Under 6 Years | 14 (100.0%) | 0 (0.0%) |
| 6 to 18 Years | 34 (89.5%) | 4 (10.5%) |
| 19 to 25 Years | 14 (100.0%) | 0 (0.0%) |
| 26 to 34 Years | 19 (90.5%) | 2 (9.5%) |
| 35 to 44 Years | 35 (100.0%) | 0 (0.0%) |
| 45 to 54 Years | 26 (78.8%) | 7 (21.2%) |
| 55 to 64 Years | 35 (85.4%) | 6 (14.6%) |
| 65 to 74 Years | 18 (100.0%) | 0 (0.0%) |
| 75 Years and older | 27 (100.0%) | 0 (0.0%) |
| Total | 222 (92.1%) | 19 (7.9%) |
Health Insurance Coverage by Citizenship Status in Fayetteville
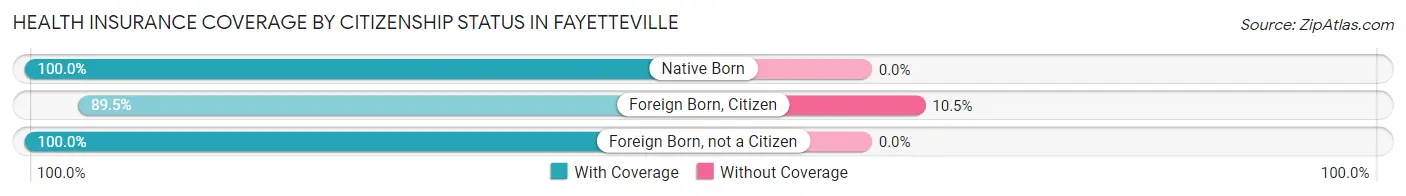
| Citizenship Status | With Coverage | Without Coverage |
| Native Born | 14 (100.0%) | 0 (0.0%) |
| Foreign Born, Citizen | 34 (89.5%) | 4 (10.5%) |
| Foreign Born, not a Citizen | 14 (100.0%) | 0 (0.0%) |
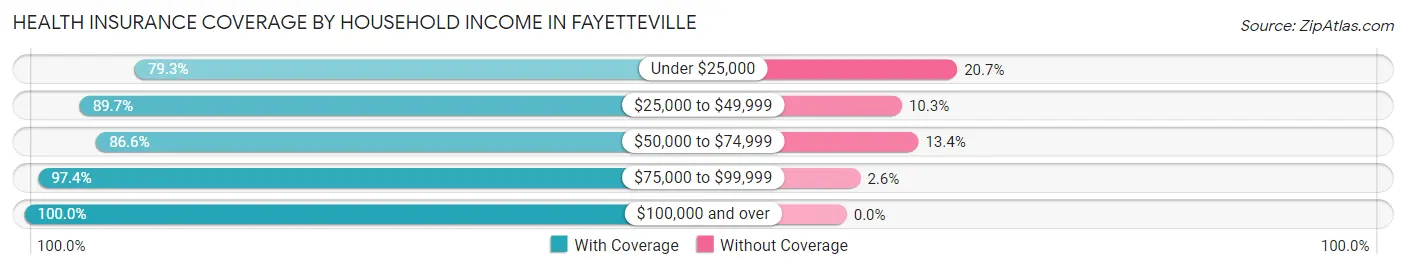
Health Insurance Coverage by Household Income in Fayetteville
| Household Income | With Coverage | Without Coverage |
| Under $25,000 | 23 (79.3%) | 6 (20.7%) |
| $25,000 to $49,999 | 26 (89.7%) | 3 (10.3%) |
| $50,000 to $74,999 | 58 (86.6%) | 9 (13.4%) |
| $75,000 to $99,999 | 38 (97.4%) | 1 (2.6%) |
| $100,000 and over | 77 (100.0%) | 0 (0.0%) |
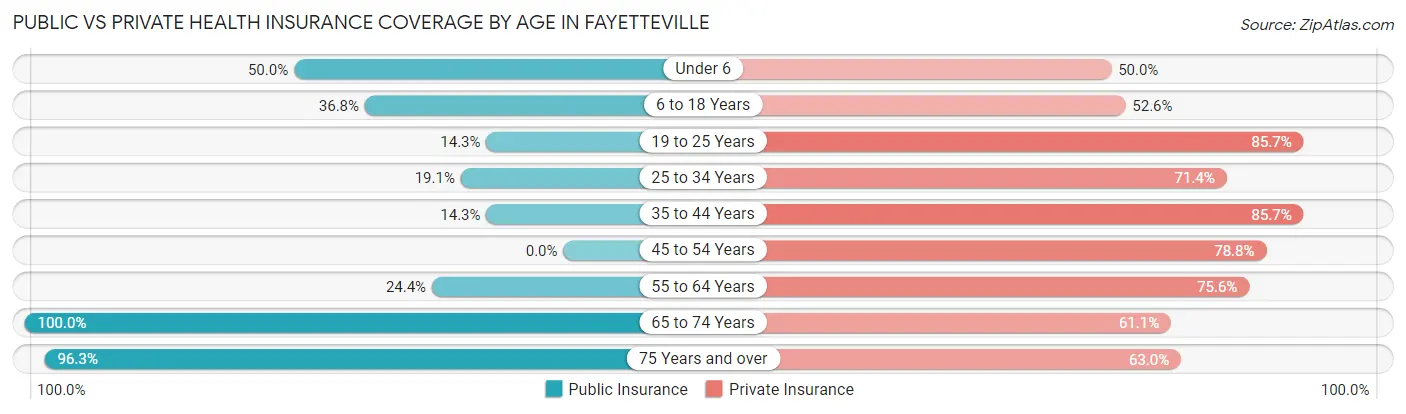
Public vs Private Health Insurance Coverage by Age in Fayetteville
| Age Bracket | Public Insurance | Private Insurance |
| Under 6 | 7 (50.0%) | 7 (50.0%) |
| 6 to 18 Years | 14 (36.8%) | 20 (52.6%) |
| 19 to 25 Years | 2 (14.3%) | 12 (85.7%) |
| 25 to 34 Years | 4 (19.1%) | 15 (71.4%) |
| 35 to 44 Years | 5 (14.3%) | 30 (85.7%) |
| 45 to 54 Years | 0 (0.0%) | 26 (78.8%) |
| 55 to 64 Years | 10 (24.4%) | 31 (75.6%) |
| 65 to 74 Years | 18 (100.0%) | 11 (61.1%) |
| 75 Years and over | 26 (96.3%) | 17 (63.0%) |
| Total | 86 (35.7%) | 169 (70.1%) |
Disability Status by Sex by Age in Fayetteville
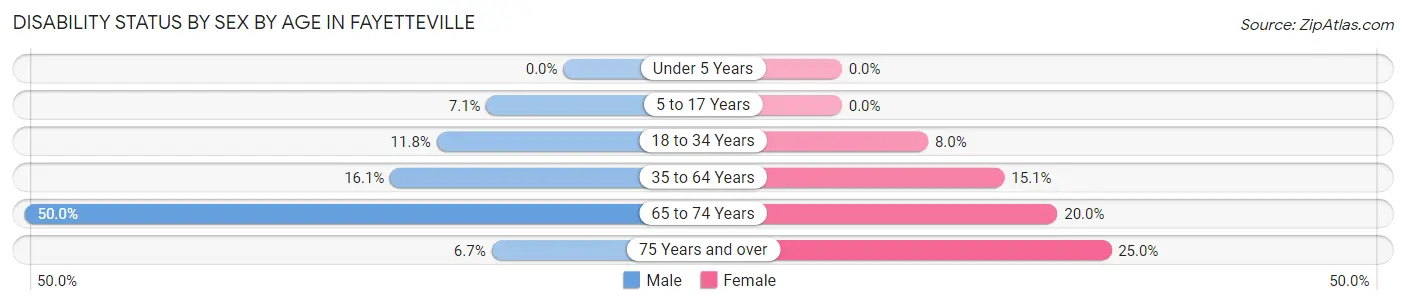
| Age Bracket | Male | Female |
| Under 5 Years | 0 (0.0%) | 0 (0.0%) |
| 5 to 17 Years | 1 (7.1%) | 0 (0.0%) |
| 18 to 34 Years | 2 (11.8%) | 2 (8.0%) |
| 35 to 64 Years | 9 (16.1%) | 8 (15.1%) |
| 65 to 74 Years | 4 (50.0%) | 2 (20.0%) |
| 75 Years and over | 1 (6.7%) | 3 (25.0%) |
Disability Class by Sex by Age in Fayetteville
Disability Class: Hearing Difficulty
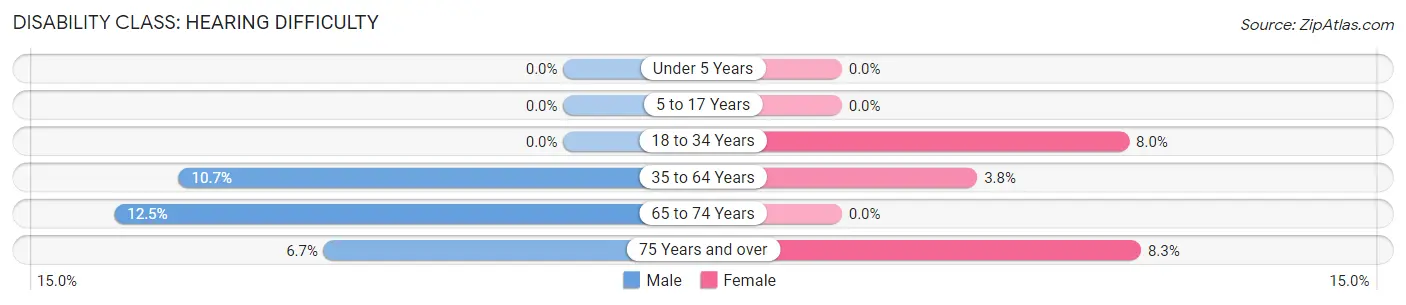
| Age Bracket | Male | Female |
| Under 5 Years | 0 (0.0%) | 0 (0.0%) |
| 5 to 17 Years | 0 (0.0%) | 0 (0.0%) |
| 18 to 34 Years | 0 (0.0%) | 2 (8.0%) |
| 35 to 64 Years | 6 (10.7%) | 2 (3.8%) |
| 65 to 74 Years | 1 (12.5%) | 0 (0.0%) |
| 75 Years and over | 1 (6.7%) | 1 (8.3%) |
Disability Class: Vision Difficulty
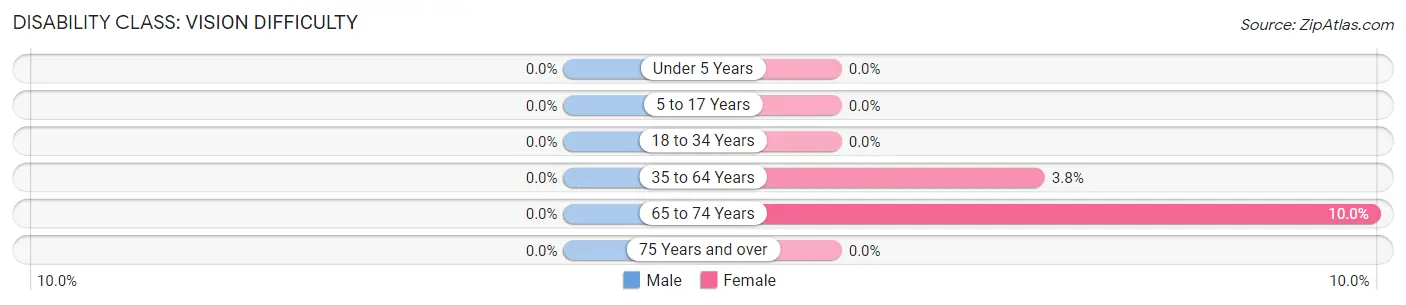
| Age Bracket | Male | Female |
| Under 5 Years | 0 (0.0%) | 0 (0.0%) |
| 5 to 17 Years | 0 (0.0%) | 0 (0.0%) |
| 18 to 34 Years | 0 (0.0%) | 0 (0.0%) |
| 35 to 64 Years | 0 (0.0%) | 2 (3.8%) |
| 65 to 74 Years | 0 (0.0%) | 1 (10.0%) |
| 75 Years and over | 0 (0.0%) | 0 (0.0%) |
Disability Class: Cognitive Difficulty
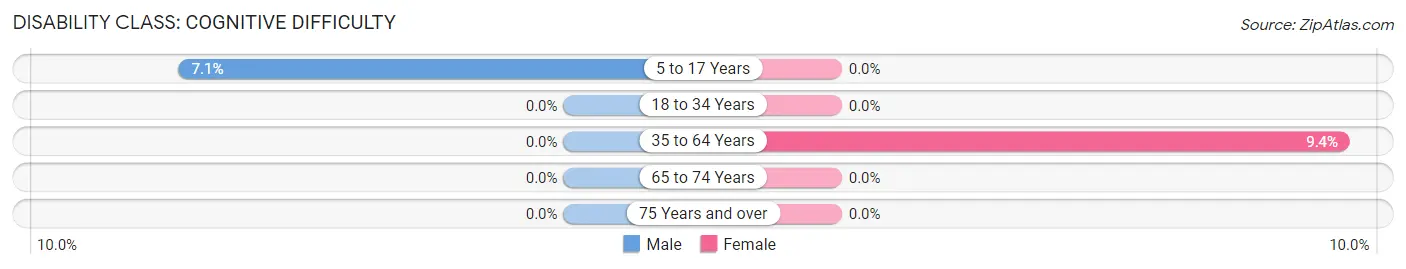
| Age Bracket | Male | Female |
| 5 to 17 Years | 1 (7.1%) | 0 (0.0%) |
| 18 to 34 Years | 0 (0.0%) | 0 (0.0%) |
| 35 to 64 Years | 0 (0.0%) | 5 (9.4%) |
| 65 to 74 Years | 0 (0.0%) | 0 (0.0%) |
| 75 Years and over | 0 (0.0%) | 0 (0.0%) |
Disability Class: Ambulatory Difficulty
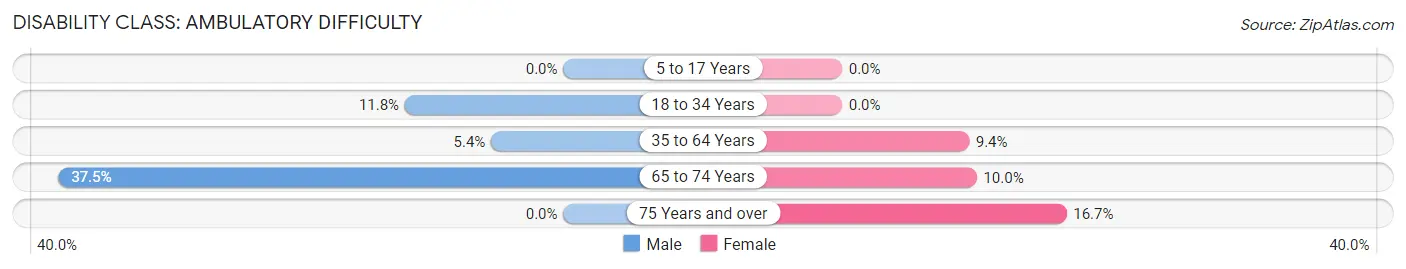
| Age Bracket | Male | Female |
| 5 to 17 Years | 0 (0.0%) | 0 (0.0%) |
| 18 to 34 Years | 2 (11.8%) | 0 (0.0%) |
| 35 to 64 Years | 3 (5.4%) | 5 (9.4%) |
| 65 to 74 Years | 3 (37.5%) | 1 (10.0%) |
| 75 Years and over | 0 (0.0%) | 2 (16.7%) |
Disability Class: Self-Care Difficulty
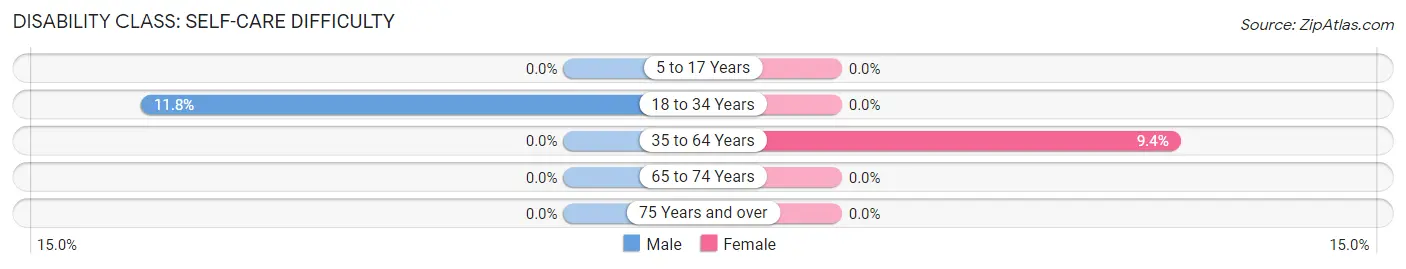
| Age Bracket | Male | Female |
| 5 to 17 Years | 0 (0.0%) | 0 (0.0%) |
| 18 to 34 Years | 2 (11.8%) | 0 (0.0%) |
| 35 to 64 Years | 0 (0.0%) | 5 (9.4%) |
| 65 to 74 Years | 0 (0.0%) | 0 (0.0%) |
| 75 Years and over | 0 (0.0%) | 0 (0.0%) |
Technology Access in Fayetteville
Computing Device Access in Fayetteville
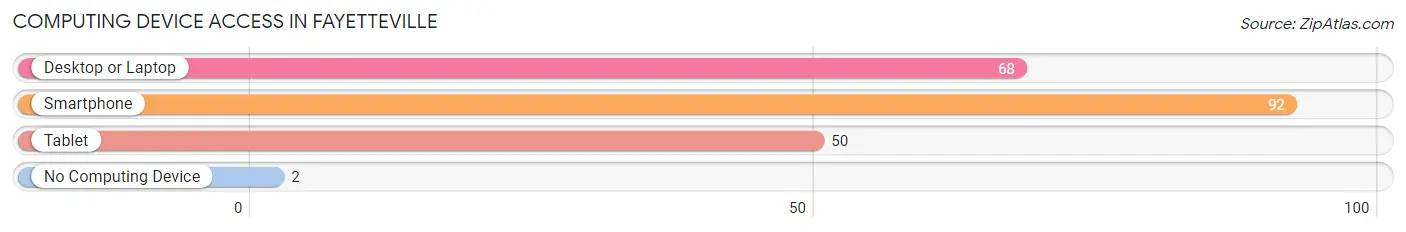
| Device Type | # Households | % Households |
| Desktop or Laptop | 68 | 64.1% |
| Smartphone | 92 | 86.8% |
| Tablet | 50 | 47.2% |
| No Computing Device | 2 | 1.9% |
| Total | 106 | 100.0% |
Internet Access in Fayetteville
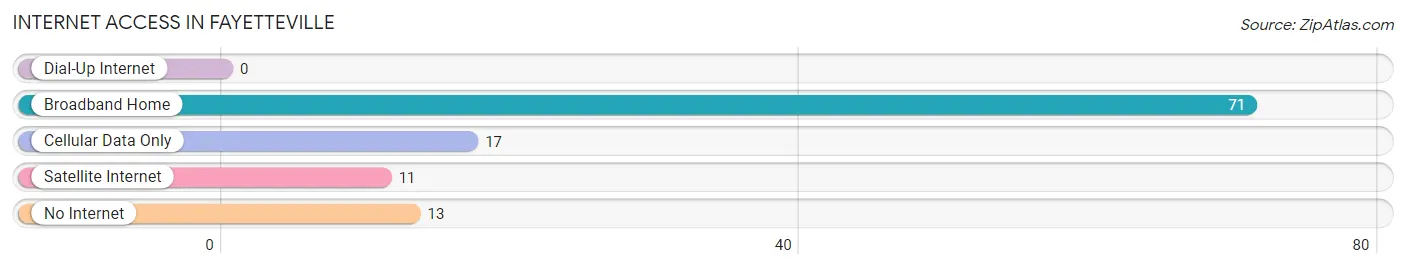
| Internet Type | # Households | % Households |
| Dial-Up Internet | 0 | 0.0% |
| Broadband Home | 71 | 67.0% |
| Cellular Data Only | 17 | 16.0% |
| Satellite Internet | 11 | 10.4% |
| No Internet | 13 | 12.3% |
| Total | 106 | 100.0% |
Fayetteville Summary
Fayetteville is a small village located in Brown County, Ohio, United States. It is situated on the banks of the Little Miami River, approximately 25 miles east of Cincinnati. The village has a population of approximately 1,000 people and is part of the Cincinnati metropolitan area.
History
Fayetteville was founded in 1817 by a group of settlers from Kentucky. The village was named after the Marquis de Lafayette, a French military leader who fought alongside the American colonists during the Revolutionary War. The village was originally a farming community, but it soon developed into a small industrial center. The village was home to several mills, including a sawmill, a gristmill, and a woolen mill.
In the late 19th century, the village was connected to the outside world by the Cincinnati, Hamilton, and Dayton Railroad. This allowed the village to become a popular tourist destination, as visitors could easily access the area from Cincinnati.
Geography
Fayetteville is located in Brown County, Ohio, approximately 25 miles east of Cincinnati. The village is situated on the banks of the Little Miami River, which flows through the village. The village is surrounded by rolling hills and wooded areas, making it a popular destination for outdoor activities such as fishing, hunting, and camping.
Economy
Fayetteville’s economy is largely based on agriculture and tourism. The village is home to several farms, which produce a variety of crops, including corn, soybeans, and wheat. The village is also home to several small businesses, including restaurants, shops, and a local winery.
Tourism is an important part of the village’s economy. The village is home to several historic sites, including the Fayetteville Historic District, which is listed on the National Register of Historic Places. The village is also home to several parks and recreational areas, including the Little Miami River State Park.
Demographics
As of the 2010 census, the population of Fayetteville was 1,000 people. The racial makeup of the village was 97.2% White, 0.7% African American, 0.3% Native American, 0.3% Asian, and 1.5% from other races. The median household income was $41,250, and the median family income was $50,000.
Fayetteville is a small, rural village with a rich history and a strong sense of community. The village is home to several farms, businesses, and recreational areas, making it a popular destination for visitors and residents alike.
Common Questions
What is the Total Population of Fayetteville?
Total Population of Fayetteville is 241.
What is the Total Male Population of Fayetteville?
Total Male Population of Fayetteville is 112.
What is the Total Female Population of Fayetteville?
Total Female Population of Fayetteville is 129.
What is the Ratio of Males per 100 Females in Fayetteville?
There are 86.82 Males per 100 Females in Fayetteville.
What is the Ratio of Females per 100 Males in Fayetteville?
There are 115.18 Females per 100 Males in Fayetteville.
What is the Median Population Age in Fayetteville?
Median Population Age in Fayetteville is 44.8 Years.
What is the Average Family Size in Fayetteville
Average Family Size in Fayetteville is 2.5 People.
What is the Average Household Size in Fayetteville
Average Household Size in Fayetteville is 2.3 People.
What is Per Capita Income in Fayetteville?
Per Capita income in Fayetteville is $36,188.
What is the Median Family Income in Fayetteville?
Median Family Income in Fayetteville is $85,156.
What is the Median Household income in Fayetteville?
Median Household Income in Fayetteville is $66,250.
What is Income or Wage Gap in Fayetteville?
Income or Wage Gap in Fayetteville is 8.1%.
Women in Fayetteville earn 91.9 cents for every dollar earned by a man.
What is Inequality or Gini Index in Fayetteville?
Inequality or Gini Index in Fayetteville is 0.39.
How Large is the Labor Force in Fayetteville?
There are 135 People in the Labor Forcein in Fayetteville.
What is the Percentage of People in the Labor Force in Fayetteville?
66.5% of People are in the Labor Force in Fayetteville.