Zip Codes with the Highest Percentage of Population Employed in Farming, Fishing & Forestry in Springfield, OH
RELATED REPORTS & OPTIONS
Farming, Fishing & Forestry
Springfield
Compare Zip Codes
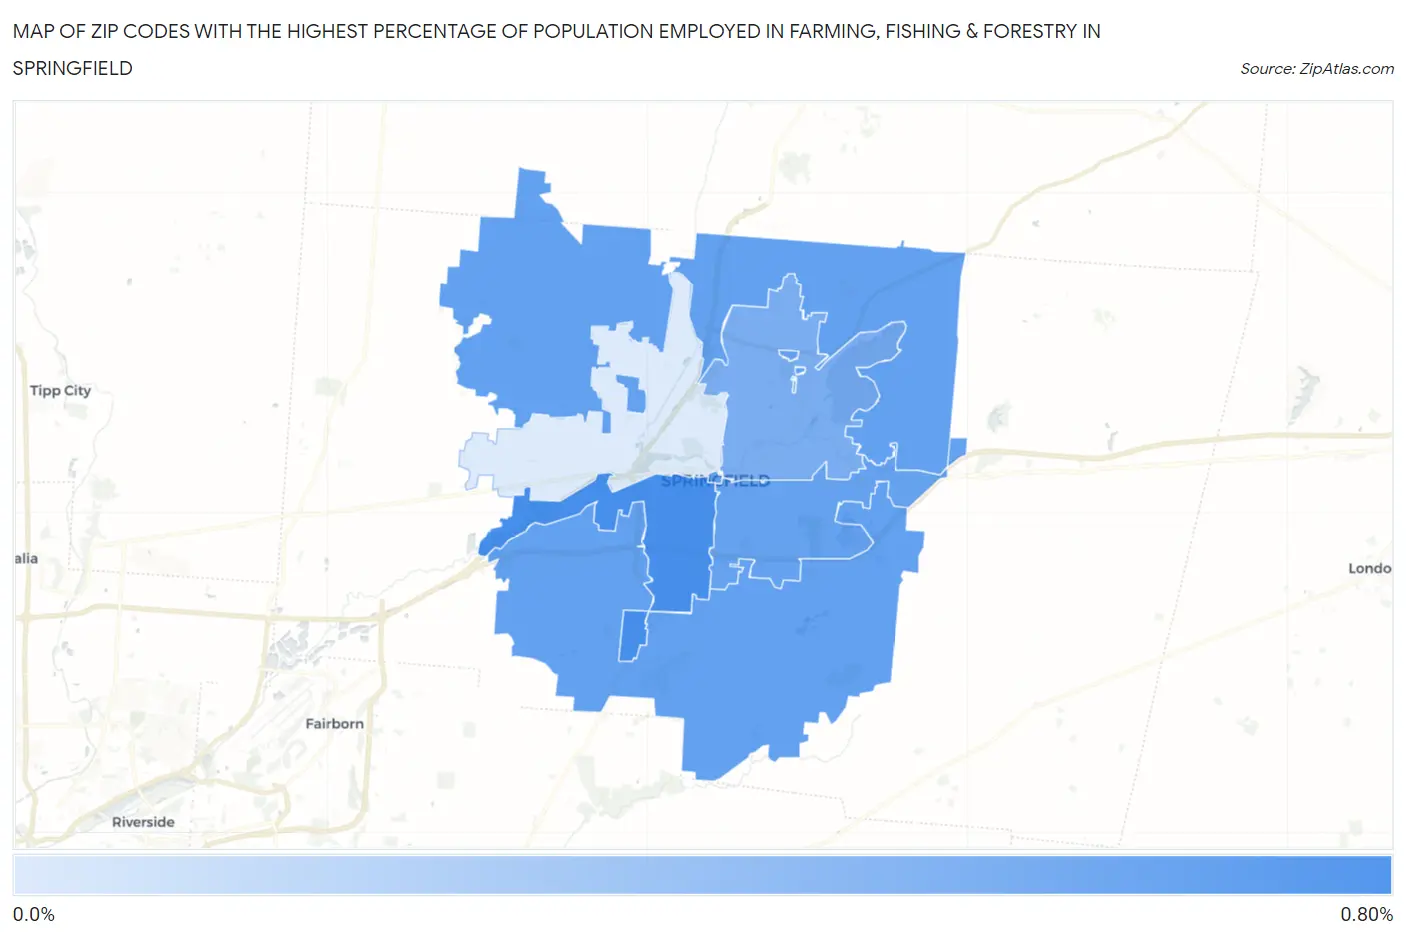
Map of Zip Codes with the Highest Percentage of Population Employed in Farming, Fishing & Forestry in Springfield
0.0%
0.80%
Zip Codes with the Highest Percentage of Population Employed in Farming, Fishing & Forestry in Springfield, OH
| Zip Code | % Employed | vs State | vs National | |
| 1. | 45506 | 0.70% | 0.29%(+0.413)#228 | 0.61%(+0.096)#11,369 |
| 2. | 45502 | 0.60% | 0.29%(+0.309)#255 | 0.61%(-0.008)#12,050 |
| 3. | 45505 | 0.58% | 0.29%(+0.294)#258 | 0.61%(-0.023)#12,181 |
| 4. | 45503 | 0.50% | 0.29%(+0.215)#286 | 0.61%(-0.102)#12,813 |
| 5. | 45504 | 0.13% | 0.29%(-0.160)#475 | 0.61%(-0.477)#17,289 |
1
Common Questions
What are the Top 3 Zip Codes with the Highest Percentage of Population Employed in Farming, Fishing & Forestry in Springfield, OH?
Top 3 Zip Codes with the Highest Percentage of Population Employed in Farming, Fishing & Forestry in Springfield, OH are:
What zip code has the Highest Percentage of Population Employed in Farming, Fishing & Forestry in Springfield, OH?
45506 has the Highest Percentage of Population Employed in Farming, Fishing & Forestry in Springfield, OH with 0.70%.
What is the Percentage of Population Employed in Farming, Fishing & Forestry in Springfield, OH?
Percentage of Population Employed in Farming, Fishing & Forestry in Springfield is 0.54%.
What is the Percentage of Population Employed in Farming, Fishing & Forestry in Ohio?
Percentage of Population Employed in Farming, Fishing & Forestry in Ohio is 0.29%.
What is the Percentage of Population Employed in Farming, Fishing & Forestry in the United States?
Percentage of Population Employed in Farming, Fishing & Forestry in the United States is 0.61%.