Kidron, OH
Kidron Map
Kidron Overview
1,001
TOTAL POPULATION
506
MALE POPULATION
495
FEMALE POPULATION
102.22
MALES / 100 FEMALES
97.83
FEMALES / 100 MALES
29.5
MEDIAN AGE
3.6
AVG FAMILY SIZE
3.1
AVG HOUSEHOLD SIZE
$29,759
PER CAPITA INCOME
$68,188
AVG FAMILY INCOME
$65,000
AVG HOUSEHOLD INCOME
69.9%
WAGE / INCOME GAP [ % ]
30.1¢/ $1
WAGE / INCOME GAP [ $ ]
0.45
INEQUALITY / GINI INDEX
429
LABOR FORCE [ PEOPLE ]
65.2%
PERCENT IN LABOR FORCE
1.2%
UNEMPLOYMENT RATE
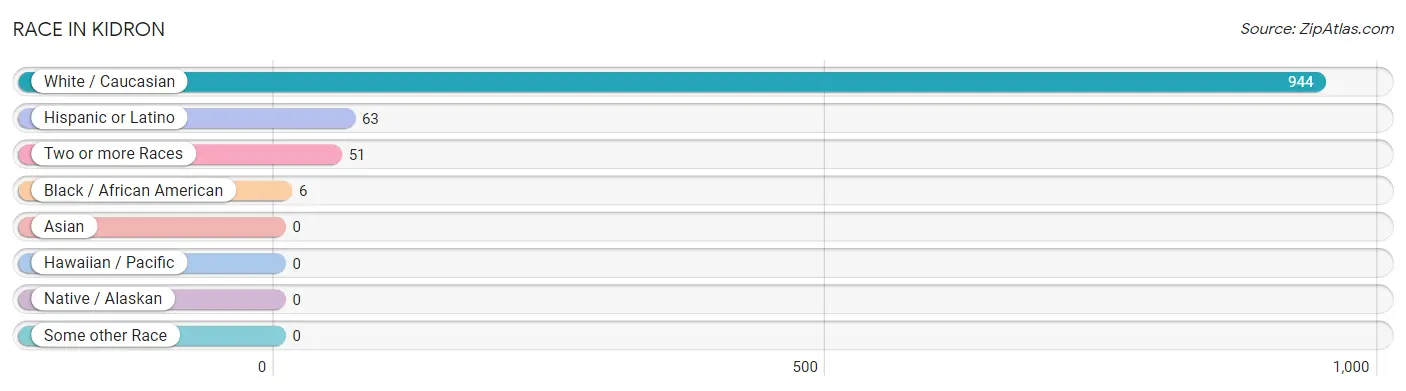
Race in Kidron
The most populous races in Kidron are White / Caucasian (944 | 94.3%), Hispanic or Latino (63 | 6.3%), and Two or more Races (51 | 5.1%).
| Race | # Population | % Population |
| Asian | 0 | 0.0% |
| Black / African American | 6 | 0.6% |
| Hawaiian / Pacific | 0 | 0.0% |
| Hispanic or Latino | 63 | 6.3% |
| Native / Alaskan | 0 | 0.0% |
| White / Caucasian | 944 | 94.3% |
| Two or more Races | 51 | 5.1% |
| Some other Race | 0 | 0.0% |
| Total | 1,001 | 100.0% |
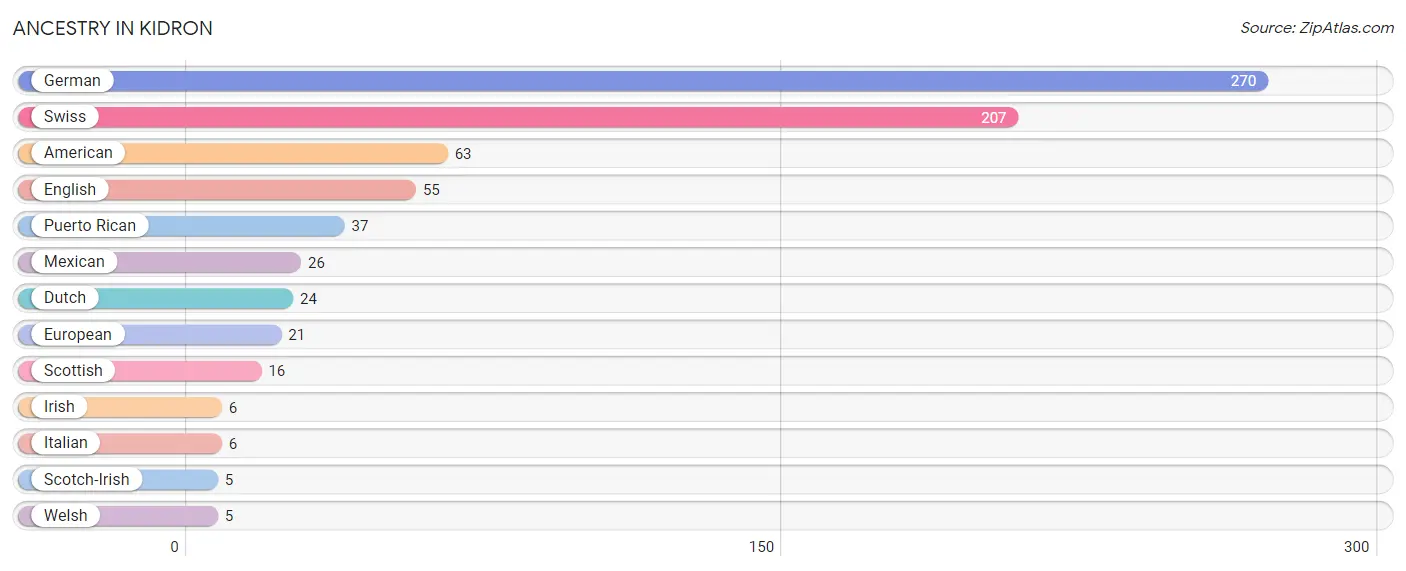
Ancestry in Kidron
The most populous ancestries reported in Kidron are German (270 | 27.0%), Swiss (207 | 20.7%), American (63 | 6.3%), English (55 | 5.5%), and Puerto Rican (37 | 3.7%), together accounting for 63.1% of all Kidron residents.
| Ancestry | # Population | % Population |
| American | 63 | 6.3% |
| Dutch | 24 | 2.4% |
| English | 55 | 5.5% |
| European | 21 | 2.1% |
| German | 270 | 27.0% |
| Irish | 6 | 0.6% |
| Italian | 6 | 0.6% |
| Mexican | 26 | 2.6% |
| Puerto Rican | 37 | 3.7% |
| Scotch-Irish | 5 | 0.5% |
| Scottish | 16 | 1.6% |
| Swiss | 207 | 20.7% |
| Welsh | 5 | 0.5% | View All 13 Rows |
Immigrants in Kidron

| Immigration Origin | # Population | % Population | View All 0 Rows |
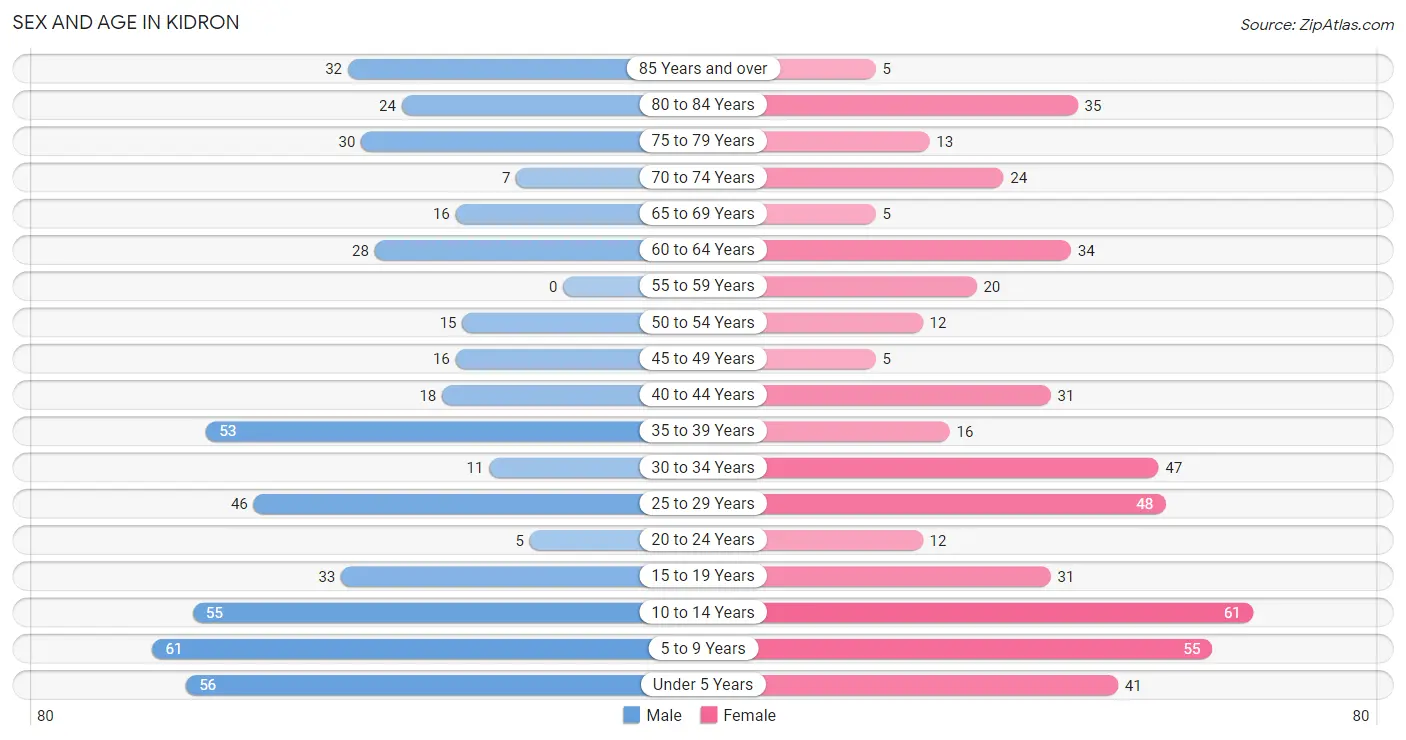
Sex and Age in Kidron
Sex and Age in Kidron
The most populous age groups in Kidron are 5 to 9 Years (61 | 12.1%) for men and 10 to 14 Years (61 | 12.3%) for women.
| Age Bracket | Male | Female |
| Under 5 Years | 56 (11.1%) | 41 (8.3%) |
| 5 to 9 Years | 61 (12.1%) | 55 (11.1%) |
| 10 to 14 Years | 55 (10.9%) | 61 (12.3%) |
| 15 to 19 Years | 33 (6.5%) | 31 (6.3%) |
| 20 to 24 Years | 5 (1.0%) | 12 (2.4%) |
| 25 to 29 Years | 46 (9.1%) | 48 (9.7%) |
| 30 to 34 Years | 11 (2.2%) | 47 (9.5%) |
| 35 to 39 Years | 53 (10.5%) | 16 (3.2%) |
| 40 to 44 Years | 18 (3.6%) | 31 (6.3%) |
| 45 to 49 Years | 16 (3.2%) | 5 (1.0%) |
| 50 to 54 Years | 15 (3.0%) | 12 (2.4%) |
| 55 to 59 Years | 0 (0.0%) | 20 (4.0%) |
| 60 to 64 Years | 28 (5.5%) | 34 (6.9%) |
| 65 to 69 Years | 16 (3.2%) | 5 (1.0%) |
| 70 to 74 Years | 7 (1.4%) | 24 (4.9%) |
| 75 to 79 Years | 30 (5.9%) | 13 (2.6%) |
| 80 to 84 Years | 24 (4.7%) | 35 (7.1%) |
| 85 Years and over | 32 (6.3%) | 5 (1.0%) |
| Total | 506 (100.0%) | 495 (100.0%) |
Families and Households in Kidron
Median Family Size in Kidron
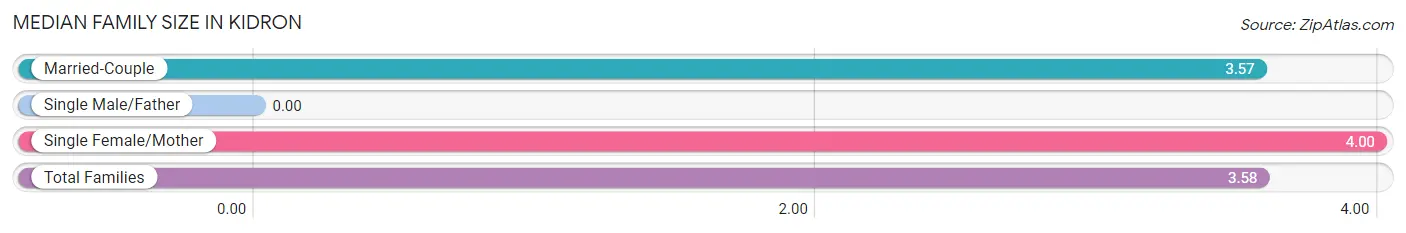
| Family Type | # Families | Family Size |
| Married-Couple | 252 (96.9%) | 3.57 |
| Single Male/Father | 0 (0.0%) | - |
| Single Female/Mother | 8 (3.1%) | 4.00 |
| Total Families | 260 (100.0%) | 3.58 |
Median Household Size in Kidron
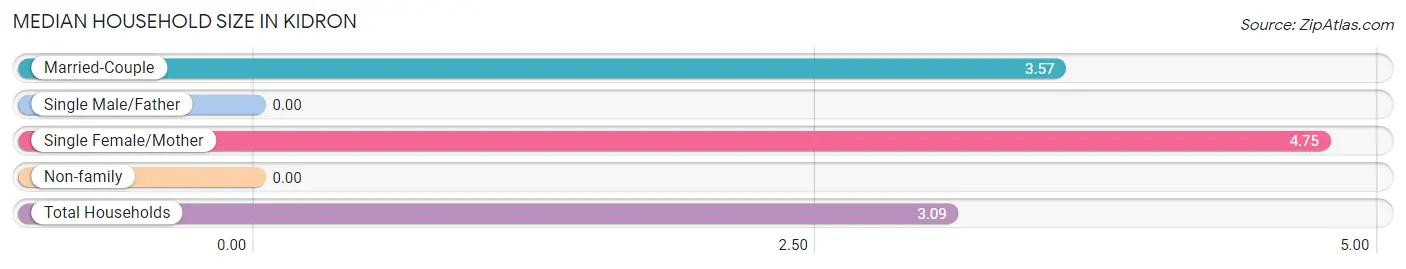
| Household Type | # Households | Household Size |
| Married-Couple | 252 (77.8%) | 3.57 |
| Single Male/Father | 0 (0.0%) | - |
| Single Female/Mother | 8 (2.5%) | 4.75 |
| Non-family | 64 (19.8%) | - |
| Total Households | 324 (100.0%) | 3.09 |
Household Size by Marriage Status in Kidron
Out of a total of 324 households in Kidron, 260 (80.2%) are family households, while 64 (19.8%) are nonfamily households. The most numerous type of family households are 2-person households, comprising 115, and the most common type of nonfamily households are 1-person households, comprising 64.
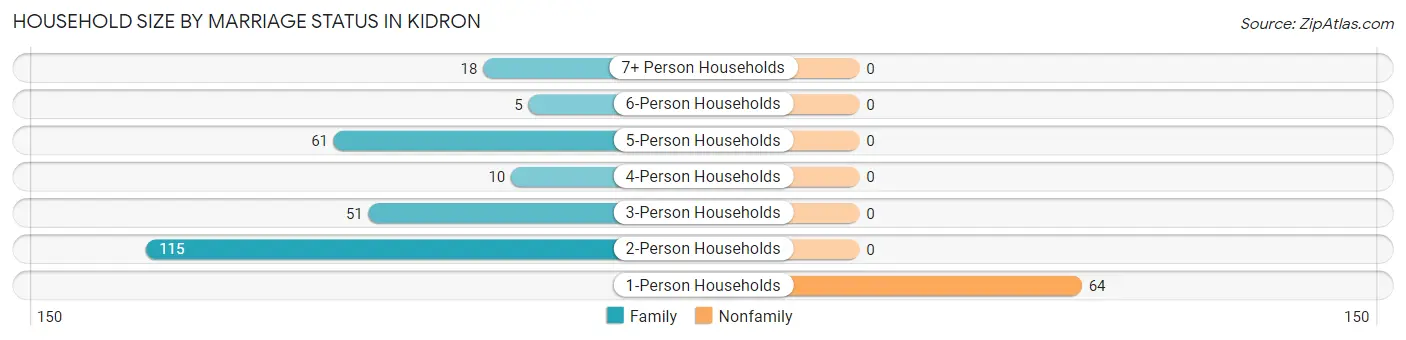
| Household Size | Family Households | Nonfamily Households |
| 1-Person Households | - | 64 (19.8%) |
| 2-Person Households | 115 (35.5%) | 0 (0.0%) |
| 3-Person Households | 51 (15.7%) | 0 (0.0%) |
| 4-Person Households | 10 (3.1%) | 0 (0.0%) |
| 5-Person Households | 61 (18.8%) | 0 (0.0%) |
| 6-Person Households | 5 (1.5%) | 0 (0.0%) |
| 7+ Person Households | 18 (5.6%) | 0 (0.0%) |
| Total | 260 (80.2%) | 64 (19.8%) |
Female Fertility in Kidron
Fertility by Age in Kidron
Average fertility rate in Kidron is 192.0 births per 1,000 women. Women in the age bracket of 20 to 34 years have the highest fertility rate with 346.0 births per 1,000 women. Women in the age bracket of 20 to 34 years acount for 100.0% of all women with births.
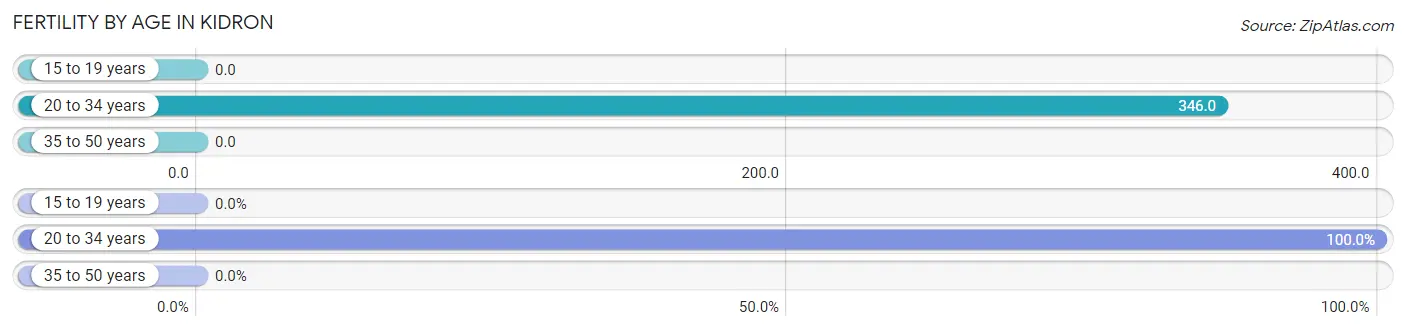
| Age Bracket | Women with Births | Births / 1,000 Women |
| 15 to 19 years | 0 (0.0%) | 0.0 |
| 20 to 34 years | 37 (100.0%) | 346.0 |
| 35 to 50 years | 0 (0.0%) | 0.0 |
| Total | 37 (100.0%) | 192.0 |
Fertility by Age by Marriage Status in Kidron
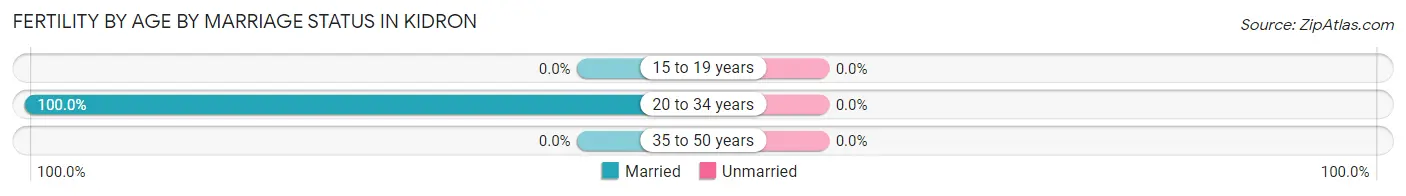
| Age Bracket | Married | Unmarried |
| 15 to 19 years | 0 (0.0%) | 0 (0.0%) |
| 20 to 34 years | 37 (100.0%) | 0 (0.0%) |
| 35 to 50 years | 0 (0.0%) | 0 (0.0%) |
| Total | 37 (100.0%) | 0 (0.0%) |
Fertility by Education in Kidron
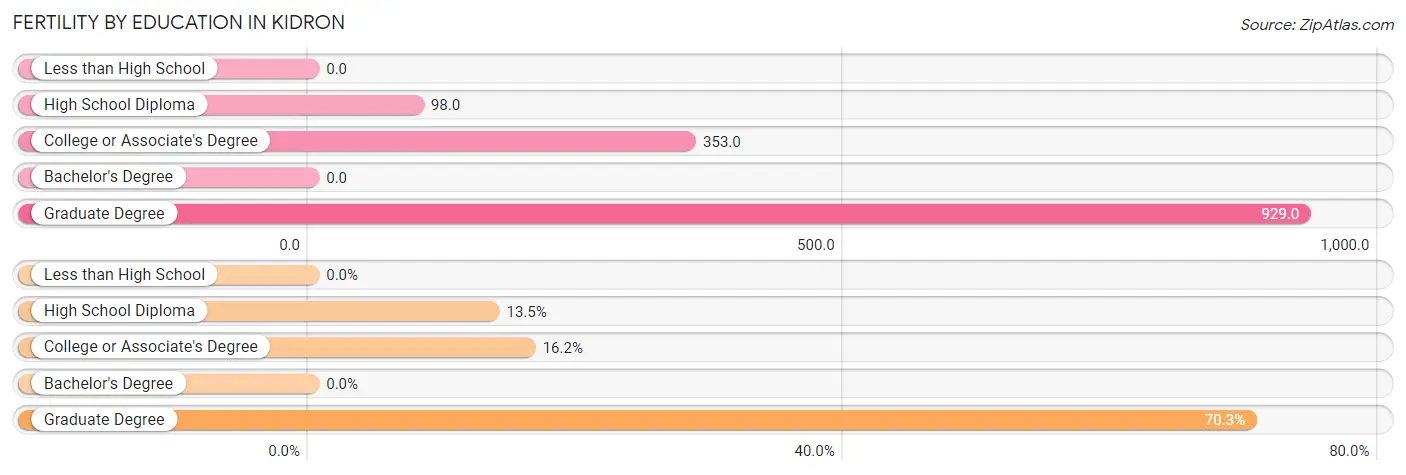
| Educational Attainment | Women with Births | Births / 1,000 Women |
| Less than High School | 0 (0.0%) | 0.0 |
| High School Diploma | 5 (13.5%) | 98.0 |
| College or Associate's Degree | 6 (16.2%) | 353.0 |
| Bachelor's Degree | 0 (0.0%) | 0.0 |
| Graduate Degree | 26 (70.3%) | 929.0 |
| Total | 37 (100.0%) | 192.0 |
Fertility by Education by Marriage Status in Kidron
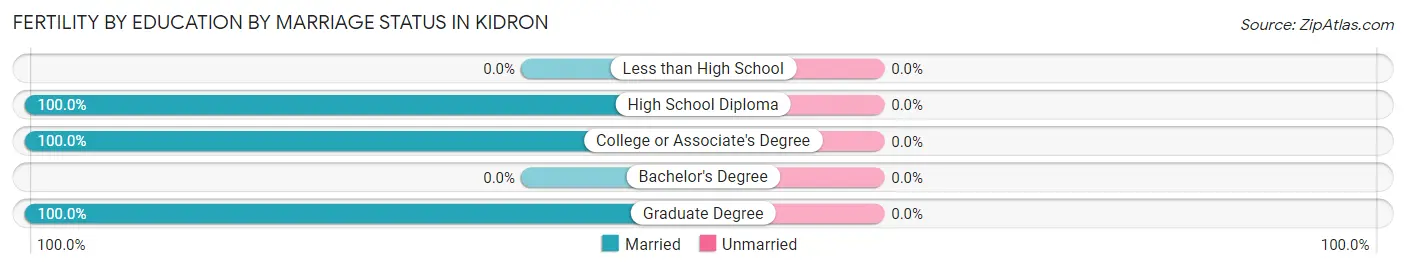
| Educational Attainment | Married | Unmarried |
| Less than High School | 0 (0.0%) | 0 (0.0%) |
| High School Diploma | 5 (100.0%) | 0 (0.0%) |
| College or Associate's Degree | 6 (100.0%) | 0 (0.0%) |
| Bachelor's Degree | 0 (0.0%) | 0 (0.0%) |
| Graduate Degree | 26 (100.0%) | 0 (0.0%) |
| Total | 37 (100.0%) | 0 (0.0%) |
Income in Kidron
Income Overview in Kidron
Per Capita Income in Kidron is $29,759, while median incomes of families and households are $68,188 and $65,000 respectively.
| Characteristic | Number | Measure |
| Per Capita Income | 1,001 | $29,759 |
| Median Family Income | 260 | $68,188 |
| Mean Family Income | 260 | $106,210 |
| Median Household Income | 324 | $65,000 |
| Mean Household Income | 324 | $91,343 |
| Income Deficit | 260 | $0 |
| Wage / Income Gap (%) | 1,001 | 69.87% |
| Wage / Income Gap ($) | 1,001 | 30.13¢ per $1 |
| Gini / Inequality Index | 1,001 | 0.45 |
Earnings by Sex in Kidron
Average Earnings in Kidron are $31,250, $58,077 for men and $17,500 for women, a difference of 69.9%.
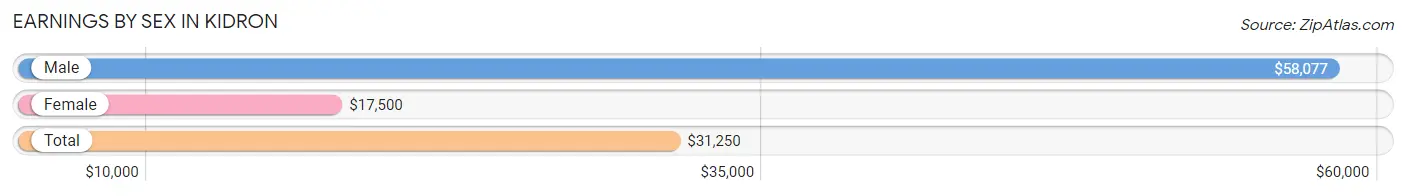
| Sex | Number | Average Earnings |
| Male | 240 (54.3%) | $58,077 |
| Female | 202 (45.7%) | $17,500 |
| Total | 442 (100.0%) | $31,250 |
Earnings by Sex by Income Bracket in Kidron
The most common earnings brackets in Kidron are $55,000 to $64,999 for men (82 | 34.2%) and $10,000 to $12,499 for women (32 | 15.8%).
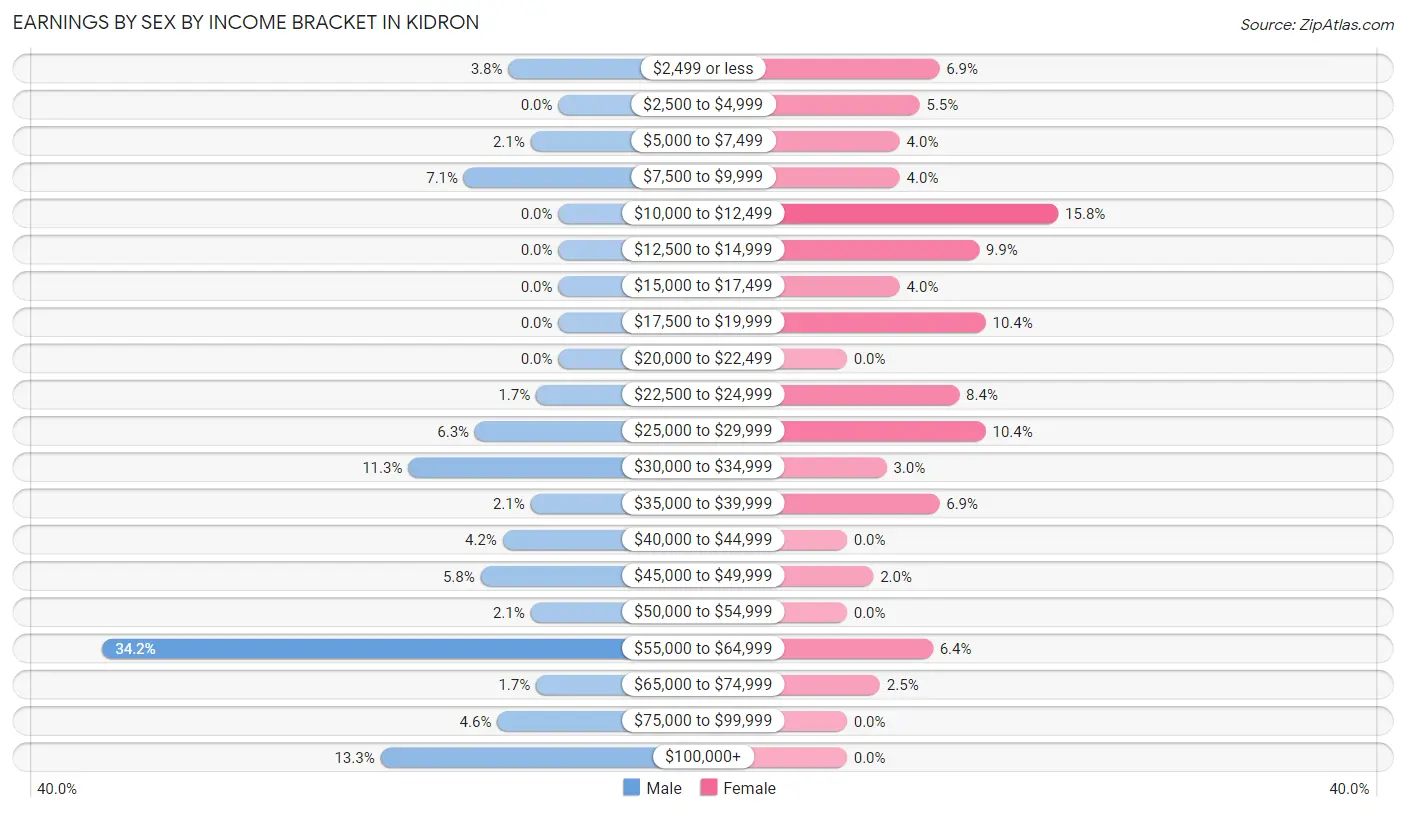
| Income | Male | Female |
| $2,499 or less | 9 (3.7%) | 14 (6.9%) |
| $2,500 to $4,999 | 0 (0.0%) | 11 (5.4%) |
| $5,000 to $7,499 | 5 (2.1%) | 8 (4.0%) |
| $7,500 to $9,999 | 17 (7.1%) | 8 (4.0%) |
| $10,000 to $12,499 | 0 (0.0%) | 32 (15.8%) |
| $12,500 to $14,999 | 0 (0.0%) | 20 (9.9%) |
| $15,000 to $17,499 | 0 (0.0%) | 8 (4.0%) |
| $17,500 to $19,999 | 0 (0.0%) | 21 (10.4%) |
| $20,000 to $22,499 | 0 (0.0%) | 0 (0.0%) |
| $22,500 to $24,999 | 4 (1.7%) | 17 (8.4%) |
| $25,000 to $29,999 | 15 (6.2%) | 21 (10.4%) |
| $30,000 to $34,999 | 27 (11.3%) | 6 (3.0%) |
| $35,000 to $39,999 | 5 (2.1%) | 14 (6.9%) |
| $40,000 to $44,999 | 10 (4.2%) | 0 (0.0%) |
| $45,000 to $49,999 | 14 (5.8%) | 4 (2.0%) |
| $50,000 to $54,999 | 5 (2.1%) | 0 (0.0%) |
| $55,000 to $64,999 | 82 (34.2%) | 13 (6.4%) |
| $65,000 to $74,999 | 4 (1.7%) | 5 (2.5%) |
| $75,000 to $99,999 | 11 (4.6%) | 0 (0.0%) |
| $100,000+ | 32 (13.3%) | 0 (0.0%) |
| Total | 240 (100.0%) | 202 (100.0%) |
Earnings by Sex by Educational Attainment in Kidron
Average earnings in Kidron are $60,833 for men and $18,274 for women, a difference of 70.0%. Men with an educational attainment of less than high school enjoy the highest average annual earnings of $63,309, while those with college or associate's degree education earn the least with $58,269. Women with an educational attainment of high school diploma earn the most with the average annual earnings of $28,355, while those with less than high school education have the smallest earnings of $3,929.
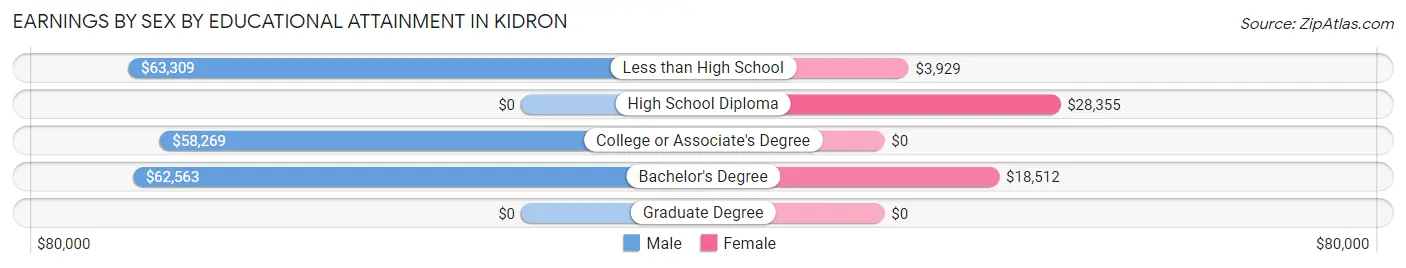
| Educational Attainment | Male Income | Female Income |
| Less than High School | $63,309 | $3,929 |
| High School Diploma | - | - |
| College or Associate's Degree | $58,269 | $0 |
| Bachelor's Degree | $62,563 | $18,512 |
| Graduate Degree | - | - |
| Total | $60,833 | $18,274 |
Family Income in Kidron
Family Income Brackets in Kidron
According to the Kidron family income data, there are 122 families falling into the $50,000 to $74,999 income range, which is the most common income bracket and makes up 46.9% of all families.
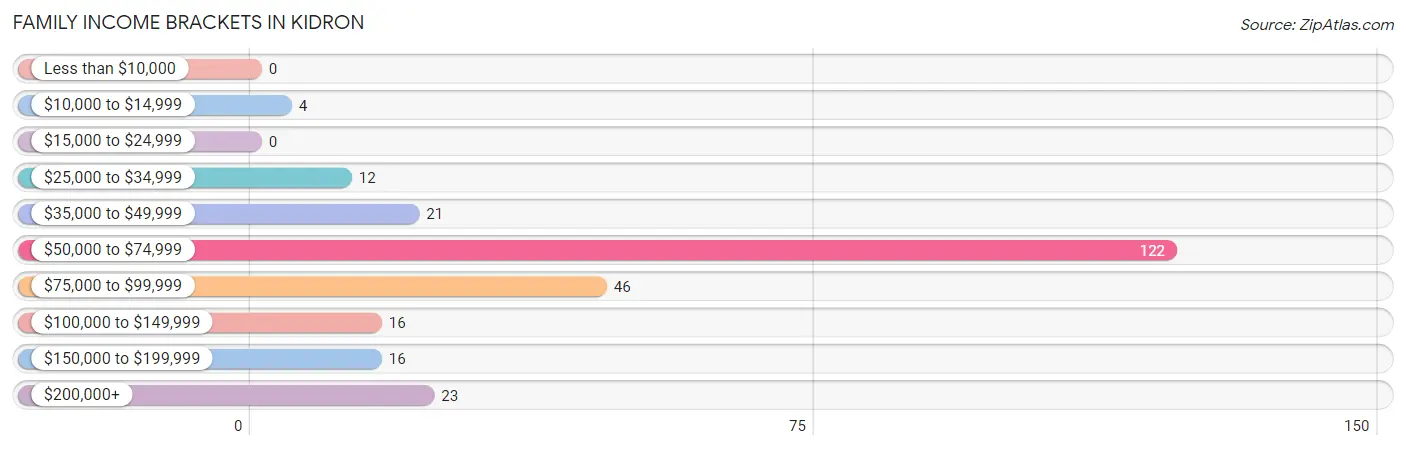
| Income Bracket | # Families | % Families |
| Less than $10,000 | 0 | 0.0% |
| $10,000 to $14,999 | 4 | 1.5% |
| $15,000 to $24,999 | 0 | 0.0% |
| $25,000 to $34,999 | 12 | 4.6% |
| $35,000 to $49,999 | 21 | 8.1% |
| $50,000 to $74,999 | 122 | 46.9% |
| $75,000 to $99,999 | 46 | 17.7% |
| $100,000 to $149,999 | 16 | 6.2% |
| $150,000 to $199,999 | 16 | 6.2% |
| $200,000+ | 23 | 8.8% |
Family Income by Famaliy Size in Kidron
7+ person families (18 | 6.9%) account for the highest median family income in Kidron with $141,250 per family, while 2-person families (115 | 44.2%) have the highest median income of $32,375 per family member.
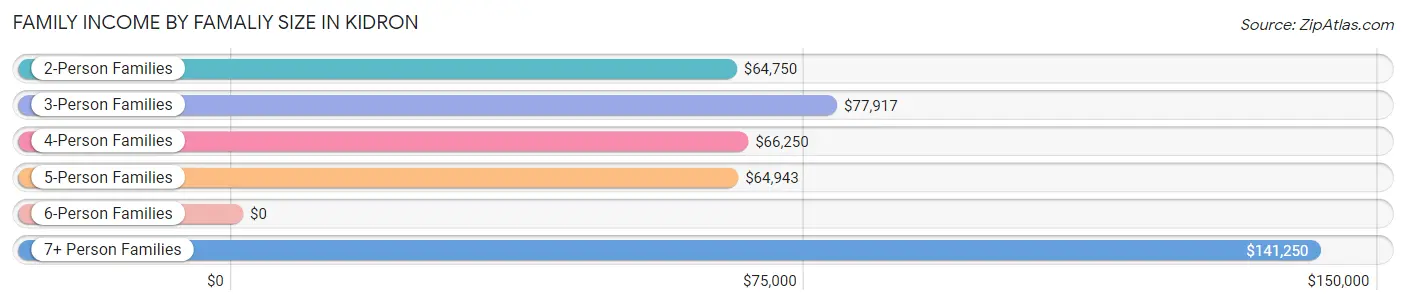
| Income Bracket | # Families | Median Income |
| 2-Person Families | 115 (44.2%) | $64,750 |
| 3-Person Families | 51 (19.6%) | $77,917 |
| 4-Person Families | 14 (5.4%) | $66,250 |
| 5-Person Families | 57 (21.9%) | $64,943 |
| 6-Person Families | 5 (1.9%) | $0 |
| 7+ Person Families | 18 (6.9%) | $141,250 |
| Total | 260 (100.0%) | $68,188 |
Family Income by Number of Earners in Kidron
The median family income in Kidron is $68,188, with families comprising 3+ earners (35) having the highest median family income of $111,875, while families with 1 earner (61) have the lowest median family income of $62,721, accounting for 13.5% and 23.5% of families, respectively.
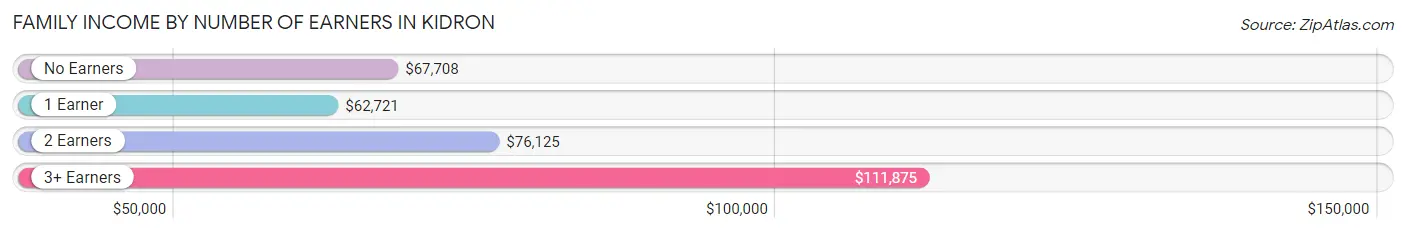
| Number of Earners | # Families | Median Income |
| No Earners | 48 (18.5%) | $67,708 |
| 1 Earner | 61 (23.5%) | $62,721 |
| 2 Earners | 116 (44.6%) | $76,125 |
| 3+ Earners | 35 (13.5%) | $111,875 |
| Total | 260 (100.0%) | $68,188 |
Household Income in Kidron
Household Income Brackets in Kidron
With 134 households falling in the category, the $50,000 to $74,999 income range is the most frequent in Kidron, accounting for 41.4% of all households.
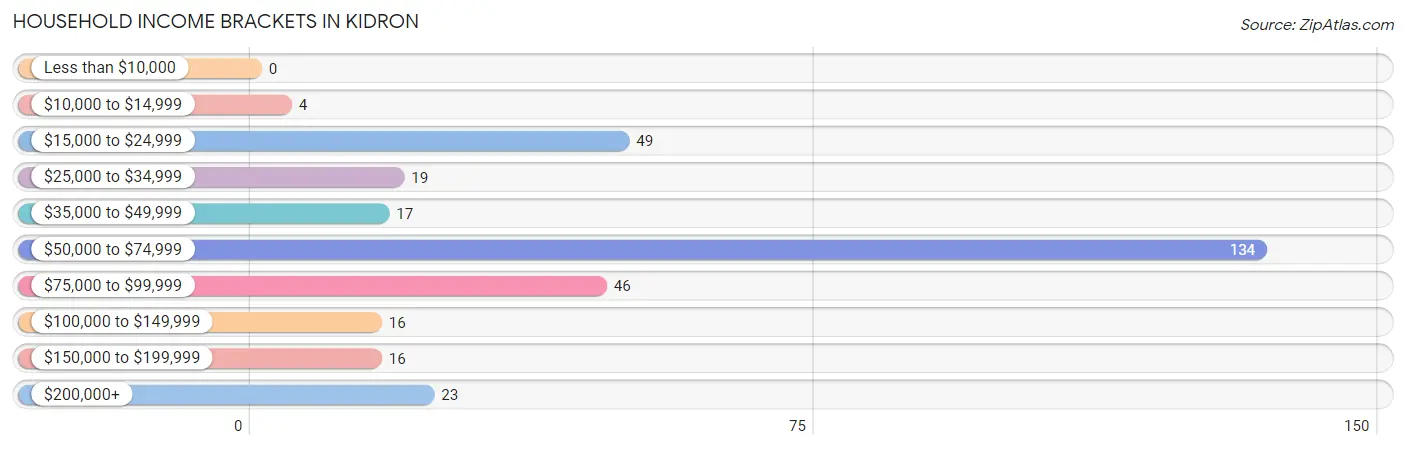
| Income Bracket | # Households | % Households |
| Less than $10,000 | 0 | 0.0% |
| $10,000 to $14,999 | 4 | 1.2% |
| $15,000 to $24,999 | 49 | 15.1% |
| $25,000 to $34,999 | 19 | 5.9% |
| $35,000 to $49,999 | 17 | 5.2% |
| $50,000 to $74,999 | 134 | 41.4% |
| $75,000 to $99,999 | 46 | 14.2% |
| $100,000 to $149,999 | 16 | 4.9% |
| $150,000 to $199,999 | 16 | 4.9% |
| $200,000+ | 23 | 7.1% |
Household Income by Householder Age in Kidron
The median household income in Kidron is $65,000, with the highest median household income of $69,141 found in the 45 to 64 years age bracket for the primary householder. A total of 73 households (22.5%) fall into this category.
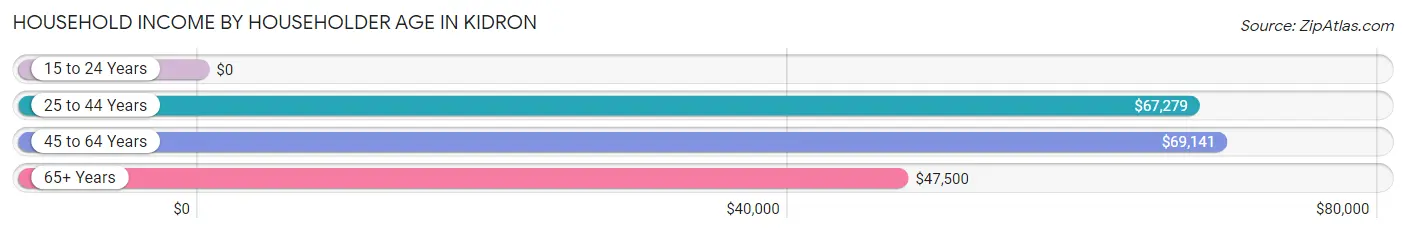
| Income Bracket | # Households | Median Income |
| 15 to 24 Years | 0 (0.0%) | $0 |
| 25 to 44 Years | 137 (42.3%) | $67,279 |
| 45 to 64 Years | 73 (22.5%) | $69,141 |
| 65+ Years | 114 (35.2%) | $47,500 |
| Total | 324 (100.0%) | $65,000 |
Poverty in Kidron
Income Below Poverty by Sex and Age in Kidron
With 6.7% poverty level for males and 10.7% for females among the residents of Kidron, 15 year old males and 16 and 17 year old females are the most vulnerable to poverty, with 4 males (66.7%) and 7 females (50.0%) in their respective age groups living below the poverty level.
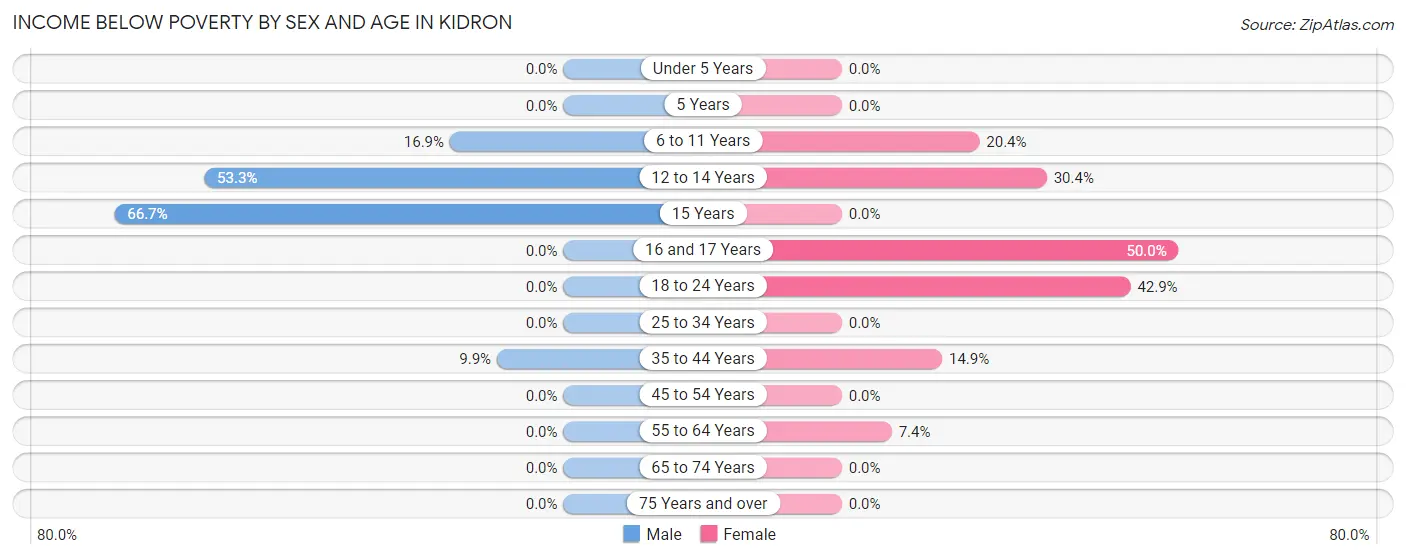
| Age Bracket | Male | Female |
| Under 5 Years | 0 (0.0%) | 0 (0.0%) |
| 5 Years | 0 (0.0%) | 0 (0.0%) |
| 6 to 11 Years | 15 (16.9%) | 19 (20.4%) |
| 12 to 14 Years | 8 (53.3%) | 7 (30.4%) |
| 15 Years | 4 (66.7%) | 0 (0.0%) |
| 16 and 17 Years | 0 (0.0%) | 7 (50.0%) |
| 18 to 24 Years | 0 (0.0%) | 9 (42.9%) |
| 25 to 34 Years | 0 (0.0%) | 0 (0.0%) |
| 35 to 44 Years | 7 (9.9%) | 7 (14.9%) |
| 45 to 54 Years | 0 (0.0%) | 0 (0.0%) |
| 55 to 64 Years | 0 (0.0%) | 4 (7.4%) |
| 65 to 74 Years | 0 (0.0%) | 0 (0.0%) |
| 75 Years and over | 0 (0.0%) | 0 (0.0%) |
| Total | 34 (6.7%) | 53 (10.7%) |
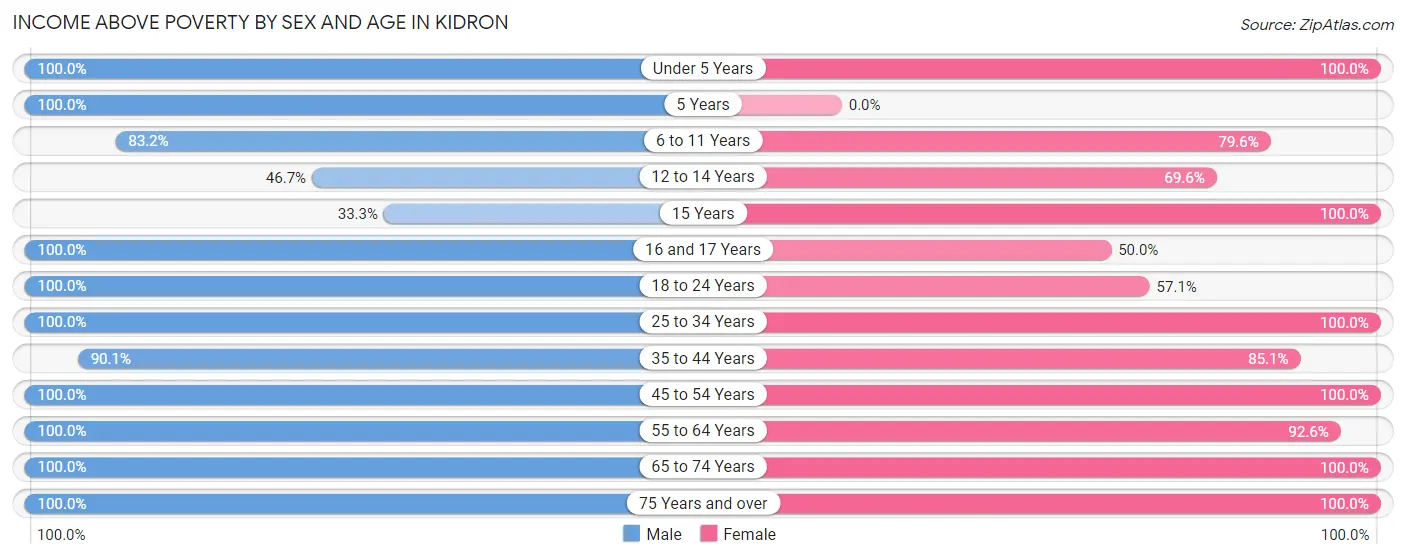
Income Above Poverty by Sex and Age in Kidron
According to the poverty statistics in Kidron, males aged under 5 years and females aged under 5 years are the age groups that are most secure financially, with 100.0% of males and 100.0% of females in these age groups living above the poverty line.
| Age Bracket | Male | Female |
| Under 5 Years | 56 (100.0%) | 41 (100.0%) |
| 5 Years | 12 (100.0%) | 0 (0.0%) |
| 6 to 11 Years | 74 (83.2%) | 74 (79.6%) |
| 12 to 14 Years | 7 (46.7%) | 16 (69.6%) |
| 15 Years | 2 (33.3%) | 8 (100.0%) |
| 16 and 17 Years | 10 (100.0%) | 7 (50.0%) |
| 18 to 24 Years | 22 (100.0%) | 12 (57.1%) |
| 25 to 34 Years | 57 (100.0%) | 95 (100.0%) |
| 35 to 44 Years | 64 (90.1%) | 40 (85.1%) |
| 45 to 54 Years | 31 (100.0%) | 17 (100.0%) |
| 55 to 64 Years | 28 (100.0%) | 50 (92.6%) |
| 65 to 74 Years | 23 (100.0%) | 29 (100.0%) |
| 75 Years and over | 86 (100.0%) | 53 (100.0%) |
| Total | 472 (93.3%) | 442 (89.3%) |
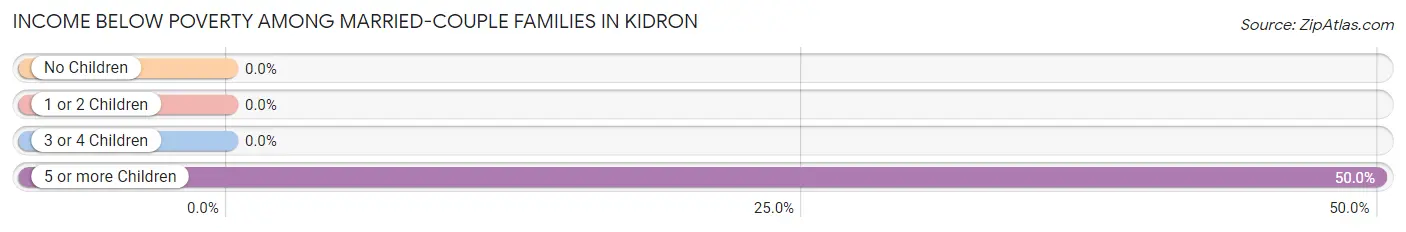
Income Below Poverty Among Married-Couple Families in Kidron
The poverty statistics for married-couple families in Kidron show that 2.8% or 7 of the total 252 families live below the poverty line. Families with 5 or more children have the highest poverty rate of 50.0%, comprising of 7 families. On the other hand, families with no children have the lowest poverty rate of 0.0%, which includes 0 families.
| Children | Above Poverty | Below Poverty |
| No Children | 123 (100.0%) | 0 (0.0%) |
| 1 or 2 Children | 59 (100.0%) | 0 (0.0%) |
| 3 or 4 Children | 56 (100.0%) | 0 (0.0%) |
| 5 or more Children | 7 (50.0%) | 7 (50.0%) |
| Total | 245 (97.2%) | 7 (2.8%) |
Income Below Poverty Among Single-Parent Households in Kidron
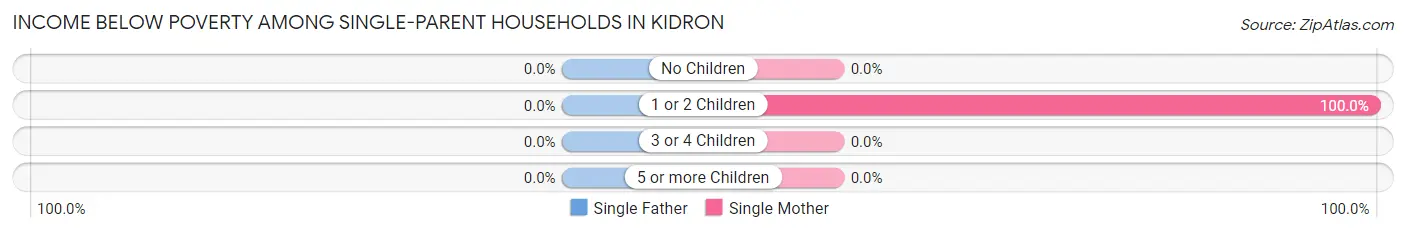
| Children | Single Father | Single Mother |
| No Children | 0 (0.0%) | 0 (0.0%) |
| 1 or 2 Children | 0 (0.0%) | 4 (100.0%) |
| 3 or 4 Children | 0 (0.0%) | 0 (0.0%) |
| 5 or more Children | 0 (0.0%) | 0 (0.0%) |
| Total | 0 (0.0%) | 4 (50.0%) |
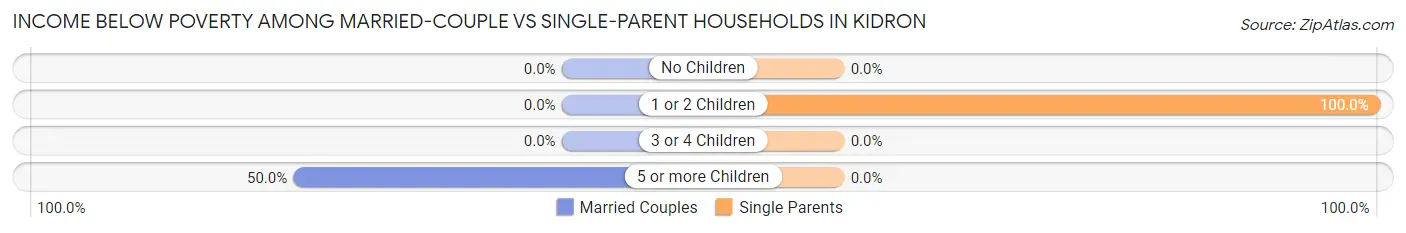
Income Below Poverty Among Married-Couple vs Single-Parent Households in Kidron
The poverty data for Kidron shows that 7 of the married-couple family households (2.8%) and 4 of the single-parent households (50.0%) are living below the poverty level. Within the married-couple family households, those with 5 or more children have the highest poverty rate, with 7 households (50.0%) falling below the poverty line. Among the single-parent households, those with 1 or 2 children have the highest poverty rate, with 4 household (100.0%) living below poverty.
| Children | Married-Couple Families | Single-Parent Households |
| No Children | 0 (0.0%) | 0 (0.0%) |
| 1 or 2 Children | 0 (0.0%) | 4 (100.0%) |
| 3 or 4 Children | 0 (0.0%) | 0 (0.0%) |
| 5 or more Children | 7 (50.0%) | 0 (0.0%) |
| Total | 7 (2.8%) | 4 (50.0%) |
Employment Characteristics in Kidron
Employment by Class of Employer in Kidron
Among the 424 employed individuals in Kidron, private company employees (228 | 53.8%), not-for-profit organizations (81 | 19.1%), and self-employed (not incorporated) (75 | 17.7%) make up the most common classes of employment.
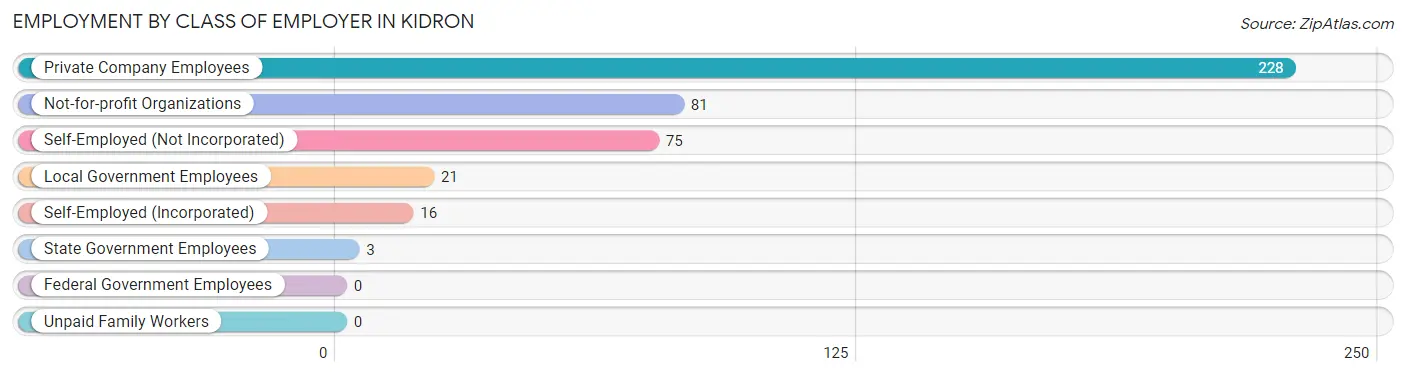
| Employer Class | # Employees | % Employees |
| Private Company Employees | 228 | 53.8% |
| Self-Employed (Incorporated) | 16 | 3.8% |
| Self-Employed (Not Incorporated) | 75 | 17.7% |
| Not-for-profit Organizations | 81 | 19.1% |
| Local Government Employees | 21 | 5.0% |
| State Government Employees | 3 | 0.7% |
| Federal Government Employees | 0 | 0.0% |
| Unpaid Family Workers | 0 | 0.0% |
| Total | 424 | 100.0% |
Employment Status by Age in Kidron
According to the labor force statistics for Kidron, out of the total population over 16 years of age (658), 65.2% or 429 individuals are in the labor force, with 1.2% or 5 of them unemployed. The age group with the highest labor force participation rate is 45 to 54 years, with 100.0% or 48 individuals in the labor force. Within the labor force, the 16 to 19 years age range has the highest percentage of unemployed individuals, with 20.8% or 5 of them being unemployed.
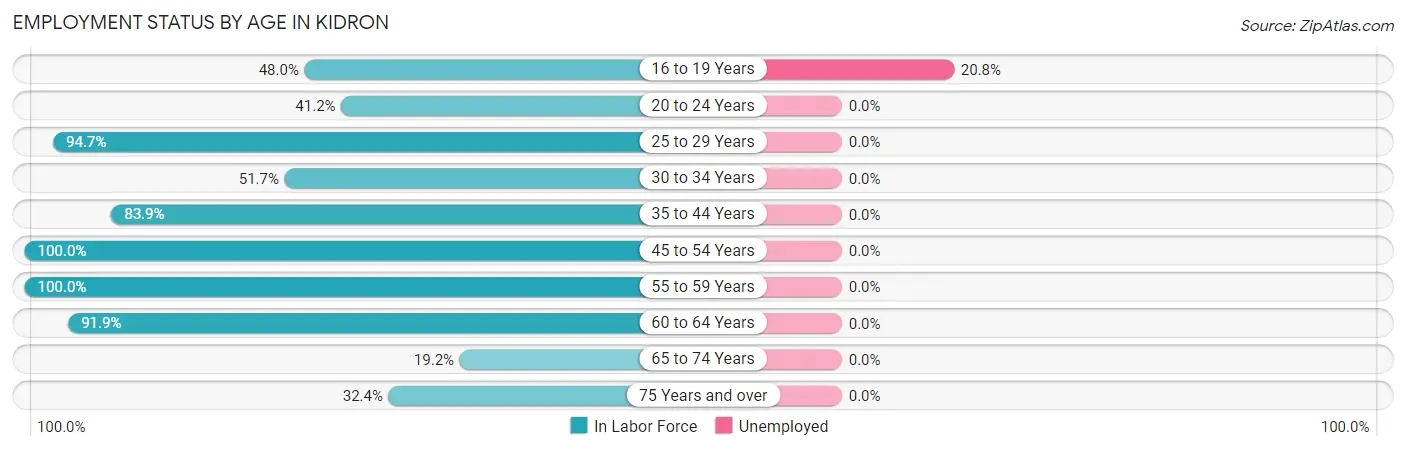
| Age Bracket | In Labor Force | Unemployed |
| 16 to 19 Years | 24 (48.0%) | 5 (20.8%) |
| 20 to 24 Years | 7 (41.2%) | 0 (0.0%) |
| 25 to 29 Years | 89 (94.7%) | 0 (0.0%) |
| 30 to 34 Years | 30 (51.7%) | 0 (0.0%) |
| 35 to 44 Years | 99 (83.9%) | 0 (0.0%) |
| 45 to 54 Years | 48 (100.0%) | 0 (0.0%) |
| 55 to 59 Years | 20 (100.0%) | 0 (0.0%) |
| 60 to 64 Years | 57 (91.9%) | 0 (0.0%) |
| 65 to 74 Years | 10 (19.2%) | 0 (0.0%) |
| 75 Years and over | 45 (32.4%) | 0 (0.0%) |
| Total | 429 (65.2%) | 5 (1.2%) |
Employment Status by Educational Attainment in Kidron
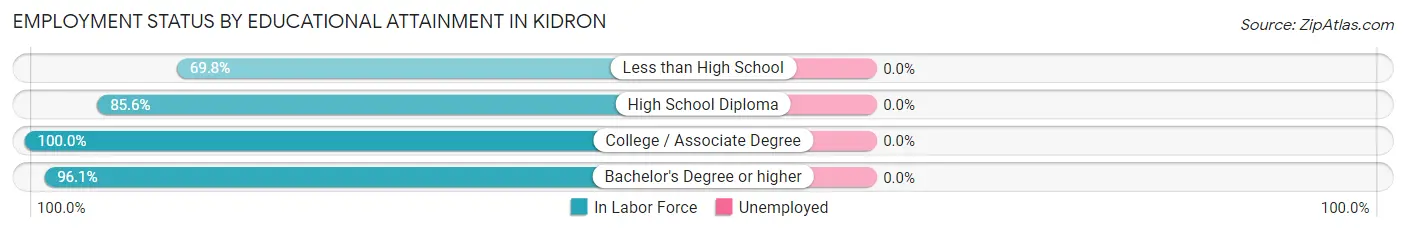
| Educational Attainment | In Labor Force | Unemployed |
| Less than High School | 81 (69.8%) | 0 (0.0%) |
| High School Diploma | 101 (85.6%) | 0 (0.0%) |
| College / Associate Degree | 39 (100.0%) | 0 (0.0%) |
| Bachelor's Degree or higher | 122 (96.1%) | 0 (0.0%) |
| Total | 343 (85.8%) | 0 (0.0%) |
Employment Occupations by Sex in Kidron
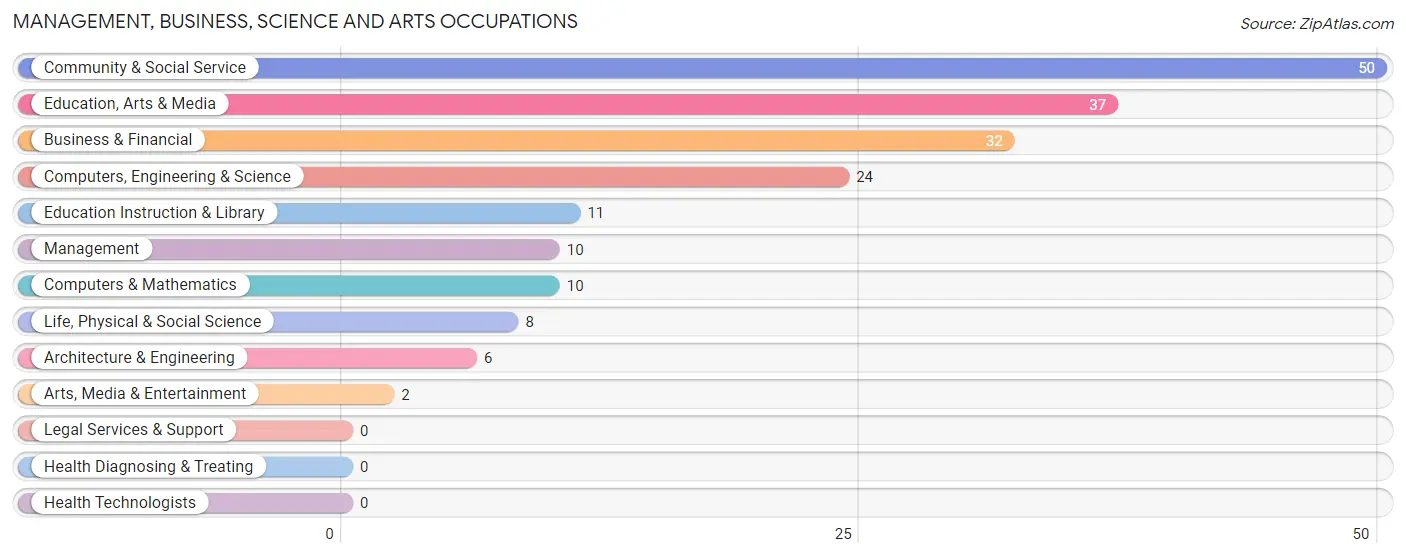
Management, Business, Science and Arts Occupations
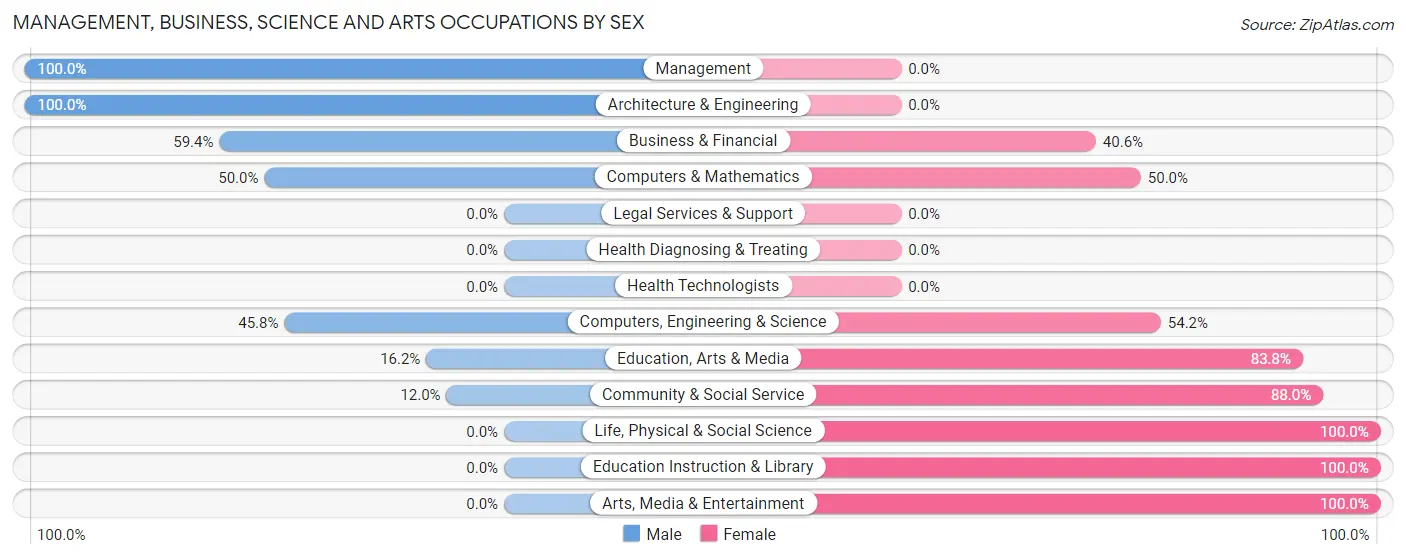
The most common Management, Business, Science and Arts occupations in Kidron are Community & Social Service (50 | 11.8%), Education, Arts & Media (37 | 8.7%), Business & Financial (32 | 7.5%), Computers, Engineering & Science (24 | 5.7%), and Education Instruction & Library (11 | 2.6%).
Management, Business, Science and Arts Occupations by Sex
Within the Management, Business, Science and Arts occupations in Kidron, the most male-oriented occupations are Management (100.0%), Architecture & Engineering (100.0%), and Business & Financial (59.4%), while the most female-oriented occupations are Life, Physical & Social Science (100.0%), Education Instruction & Library (100.0%), and Arts, Media & Entertainment (100.0%).
| Occupation | Male | Female |
| Management | 10 (100.0%) | 0 (0.0%) |
| Business & Financial | 19 (59.4%) | 13 (40.6%) |
| Computers, Engineering & Science | 11 (45.8%) | 13 (54.2%) |
| Computers & Mathematics | 5 (50.0%) | 5 (50.0%) |
| Architecture & Engineering | 6 (100.0%) | 0 (0.0%) |
| Life, Physical & Social Science | 0 (0.0%) | 8 (100.0%) |
| Community & Social Service | 6 (12.0%) | 44 (88.0%) |
| Education, Arts & Media | 6 (16.2%) | 31 (83.8%) |
| Legal Services & Support | 0 (0.0%) | 0 (0.0%) |
| Education Instruction & Library | 0 (0.0%) | 11 (100.0%) |
| Arts, Media & Entertainment | 0 (0.0%) | 2 (100.0%) |
| Health Diagnosing & Treating | 0 (0.0%) | 0 (0.0%) |
| Health Technologists | 0 (0.0%) | 0 (0.0%) |
| Total (Category) | 46 (39.7%) | 70 (60.3%) |
| Total (Overall) | 231 (54.5%) | 193 (45.5%) |
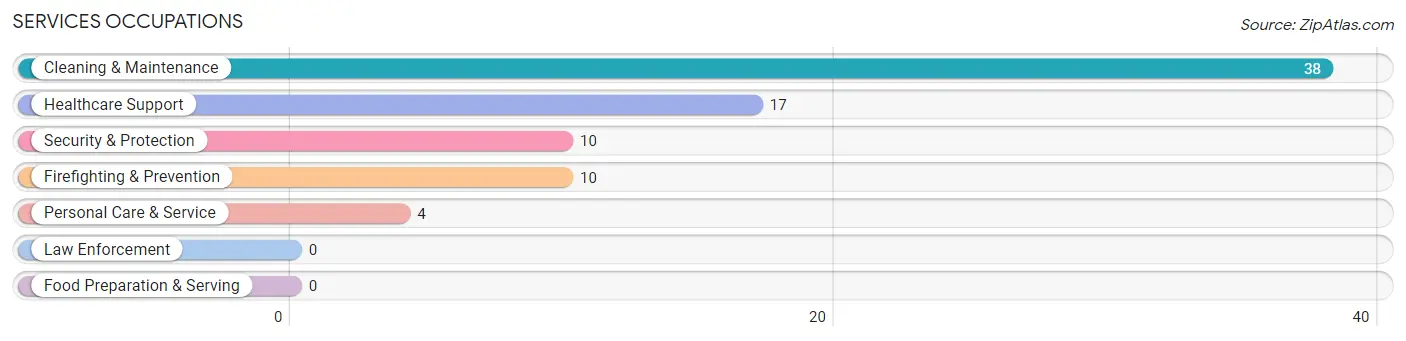
Services Occupations
The most common Services occupations in Kidron are Cleaning & Maintenance (38 | 9.0%), Healthcare Support (17 | 4.0%), Security & Protection (10 | 2.4%), Firefighting & Prevention (10 | 2.4%), and Personal Care & Service (4 | 0.9%).
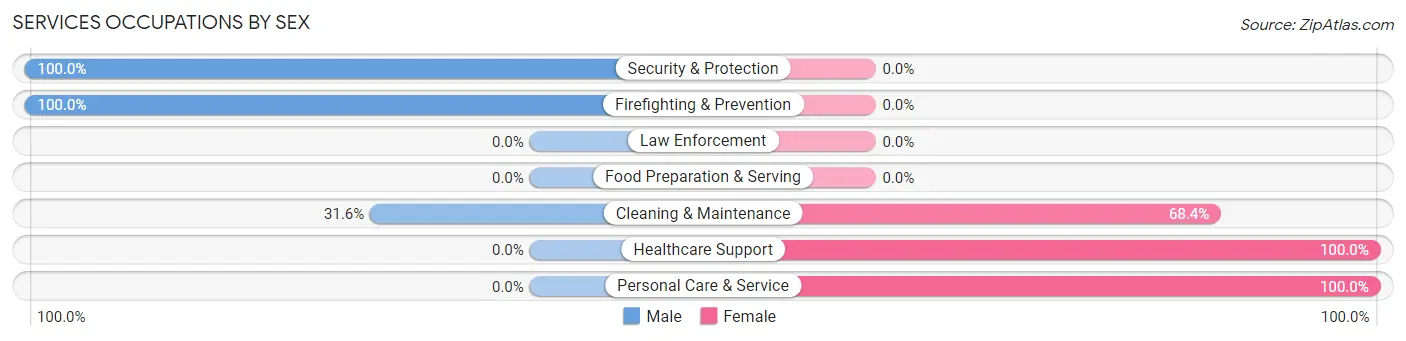
Services Occupations by Sex
Within the Services occupations in Kidron, the most male-oriented occupations are Security & Protection (100.0%), Firefighting & Prevention (100.0%), and Cleaning & Maintenance (31.6%), while the most female-oriented occupations are Healthcare Support (100.0%), Personal Care & Service (100.0%), and Cleaning & Maintenance (68.4%).
| Occupation | Male | Female |
| Healthcare Support | 0 (0.0%) | 17 (100.0%) |
| Security & Protection | 10 (100.0%) | 0 (0.0%) |
| Firefighting & Prevention | 10 (100.0%) | 0 (0.0%) |
| Law Enforcement | 0 (0.0%) | 0 (0.0%) |
| Food Preparation & Serving | 0 (0.0%) | 0 (0.0%) |
| Cleaning & Maintenance | 12 (31.6%) | 26 (68.4%) |
| Personal Care & Service | 0 (0.0%) | 4 (100.0%) |
| Total (Category) | 22 (31.9%) | 47 (68.1%) |
| Total (Overall) | 231 (54.5%) | 193 (45.5%) |
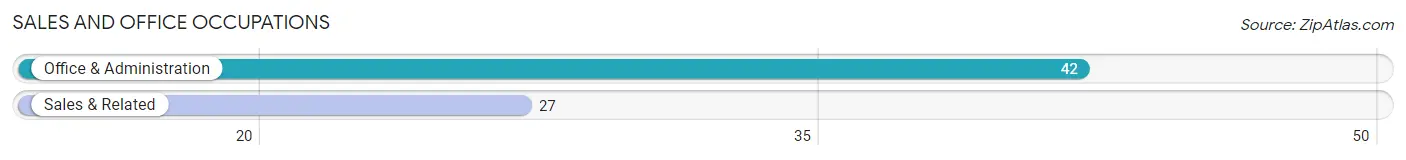
Sales and Office Occupations
The most common Sales and Office occupations in Kidron are Office & Administration (42 | 9.9%), and Sales & Related (27 | 6.4%).
Sales and Office Occupations by Sex
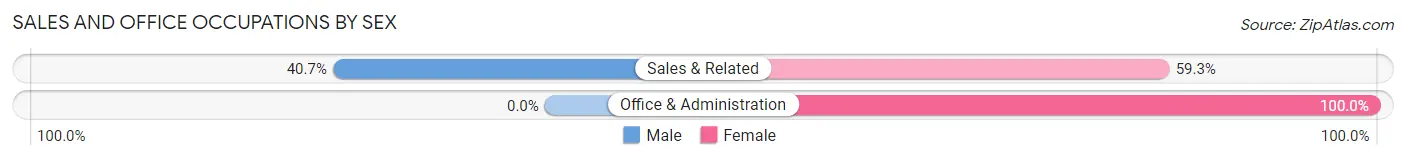
| Occupation | Male | Female |
| Sales & Related | 11 (40.7%) | 16 (59.3%) |
| Office & Administration | 0 (0.0%) | 42 (100.0%) |
| Total (Category) | 11 (15.9%) | 58 (84.1%) |
| Total (Overall) | 231 (54.5%) | 193 (45.5%) |
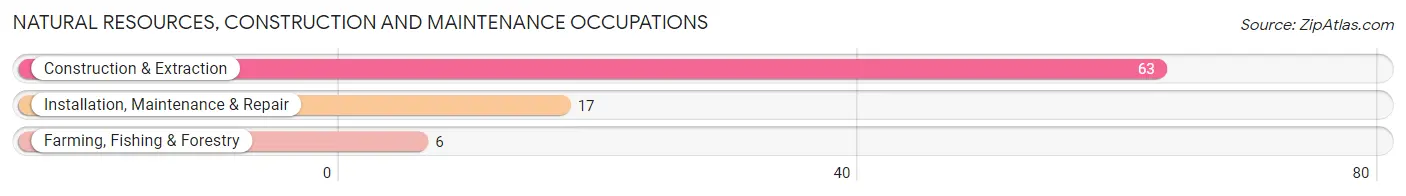
Natural Resources, Construction and Maintenance Occupations
The most common Natural Resources, Construction and Maintenance occupations in Kidron are Construction & Extraction (63 | 14.9%), Installation, Maintenance & Repair (17 | 4.0%), and Farming, Fishing & Forestry (6 | 1.4%).
Natural Resources, Construction and Maintenance Occupations by Sex
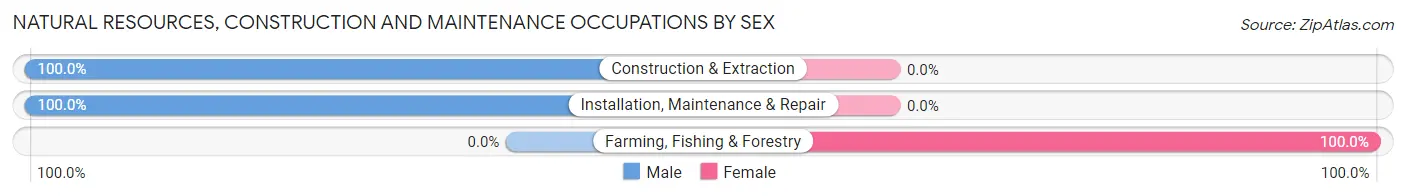
| Occupation | Male | Female |
| Farming, Fishing & Forestry | 0 (0.0%) | 6 (100.0%) |
| Construction & Extraction | 63 (100.0%) | 0 (0.0%) |
| Installation, Maintenance & Repair | 17 (100.0%) | 0 (0.0%) |
| Total (Category) | 80 (93.0%) | 6 (7.0%) |
| Total (Overall) | 231 (54.5%) | 193 (45.5%) |
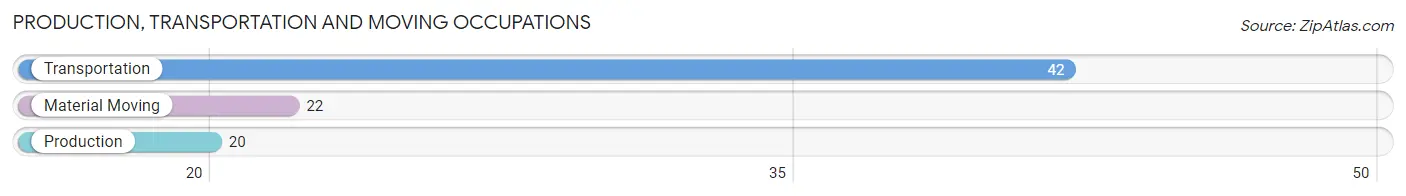
Production, Transportation and Moving Occupations
The most common Production, Transportation and Moving occupations in Kidron are Transportation (42 | 9.9%), Material Moving (22 | 5.2%), and Production (20 | 4.7%).
Production, Transportation and Moving Occupations by Sex
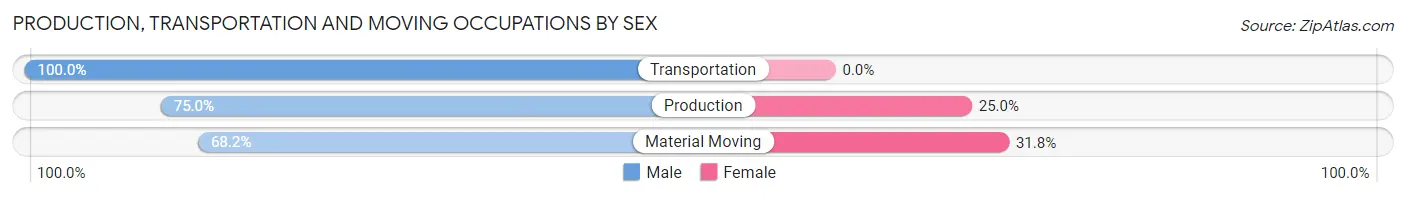
| Occupation | Male | Female |
| Production | 15 (75.0%) | 5 (25.0%) |
| Transportation | 42 (100.0%) | 0 (0.0%) |
| Material Moving | 15 (68.2%) | 7 (31.8%) |
| Total (Category) | 72 (85.7%) | 12 (14.3%) |
| Total (Overall) | 231 (54.5%) | 193 (45.5%) |
Employment Industries by Sex in Kidron
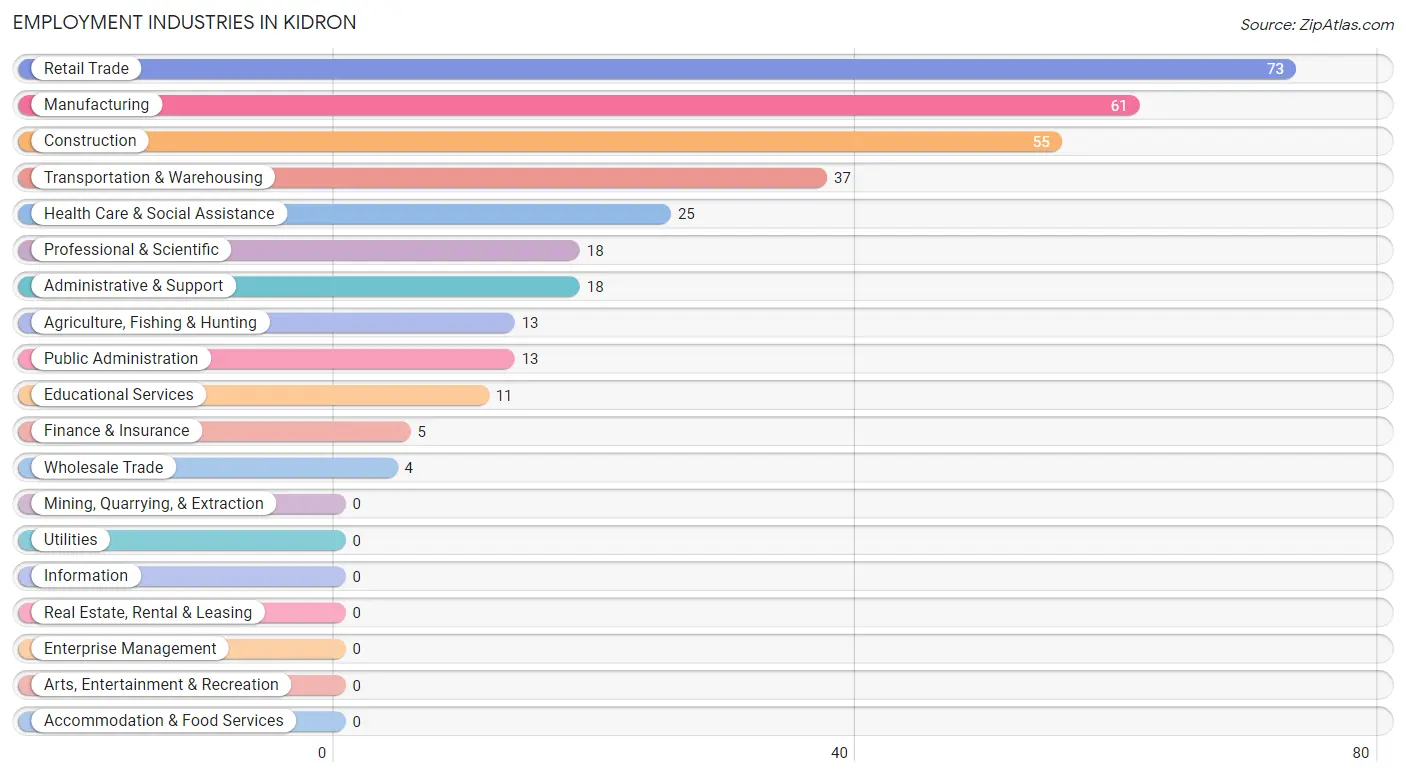
Employment Industries in Kidron
The major employment industries in Kidron include Retail Trade (73 | 17.2%), Manufacturing (61 | 14.4%), Construction (55 | 13.0%), Transportation & Warehousing (37 | 8.7%), and Health Care & Social Assistance (25 | 5.9%).
Employment Industries by Sex in Kidron
The Kidron industries that see more men than women are Construction (100.0%), Transportation & Warehousing (100.0%), and Public Administration (100.0%), whereas the industries that tend to have a higher number of women are Wholesale Trade (100.0%), Finance & Insurance (100.0%), and Educational Services (100.0%).
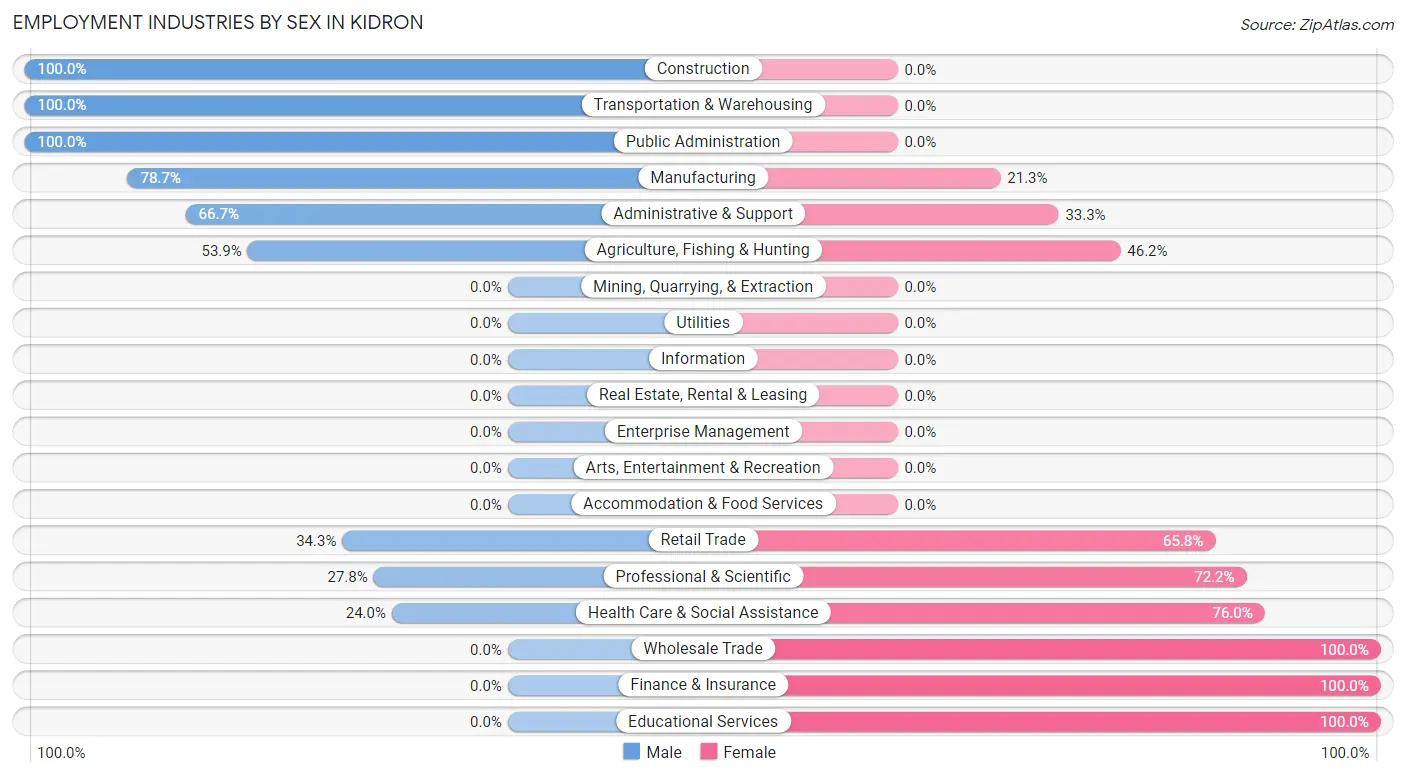
| Industry | Male | Female |
| Agriculture, Fishing & Hunting | 7 (53.8%) | 6 (46.2%) |
| Mining, Quarrying, & Extraction | 0 (0.0%) | 0 (0.0%) |
| Construction | 55 (100.0%) | 0 (0.0%) |
| Manufacturing | 48 (78.7%) | 13 (21.3%) |
| Wholesale Trade | 0 (0.0%) | 4 (100.0%) |
| Retail Trade | 25 (34.3%) | 48 (65.7%) |
| Transportation & Warehousing | 37 (100.0%) | 0 (0.0%) |
| Utilities | 0 (0.0%) | 0 (0.0%) |
| Information | 0 (0.0%) | 0 (0.0%) |
| Finance & Insurance | 0 (0.0%) | 5 (100.0%) |
| Real Estate, Rental & Leasing | 0 (0.0%) | 0 (0.0%) |
| Professional & Scientific | 5 (27.8%) | 13 (72.2%) |
| Enterprise Management | 0 (0.0%) | 0 (0.0%) |
| Administrative & Support | 12 (66.7%) | 6 (33.3%) |
| Educational Services | 0 (0.0%) | 11 (100.0%) |
| Health Care & Social Assistance | 6 (24.0%) | 19 (76.0%) |
| Arts, Entertainment & Recreation | 0 (0.0%) | 0 (0.0%) |
| Accommodation & Food Services | 0 (0.0%) | 0 (0.0%) |
| Public Administration | 13 (100.0%) | 0 (0.0%) |
| Total | 231 (54.5%) | 193 (45.5%) |
Education in Kidron
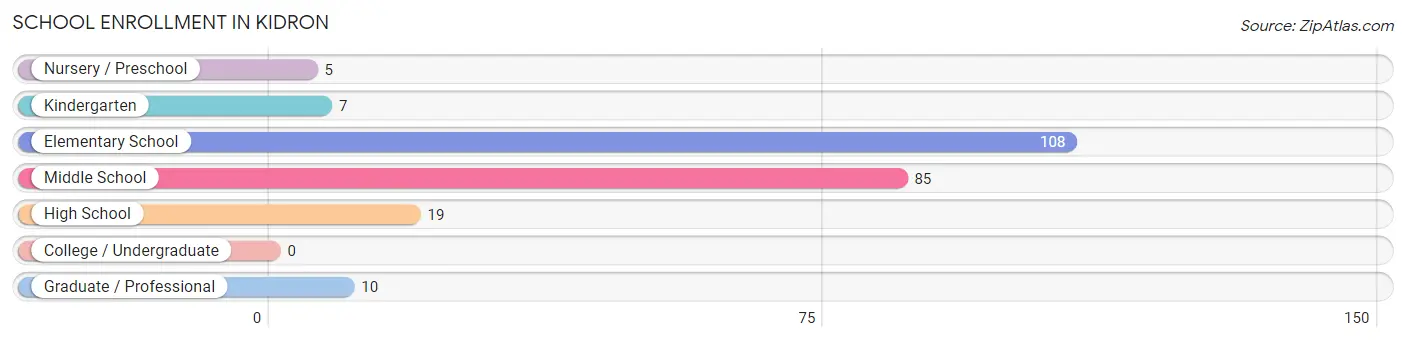
School Enrollment in Kidron
The most common levels of schooling among the 234 students in Kidron are elementary school (108 | 46.2%), middle school (85 | 36.3%), and high school (19 | 8.1%).
| School Level | # Students | % Students |
| Nursery / Preschool | 5 | 2.1% |
| Kindergarten | 7 | 3.0% |
| Elementary School | 108 | 46.2% |
| Middle School | 85 | 36.3% |
| High School | 19 | 8.1% |
| College / Undergraduate | 0 | 0.0% |
| Graduate / Professional | 10 | 4.3% |
| Total | 234 | 100.0% |
School Enrollment by Age by Funding Source in Kidron
Out of a total of 234 students who are enrolled in schools in Kidron, 78 (33.3%) attend a private institution, while the remaining 156 (66.7%) are enrolled in public schools. The age group of 3 to 4 year olds has the highest likelihood of being enrolled in private schools, with 5 (100.0% in the age bracket) enrolled. Conversely, the age group of 18 to 19 year olds has the lowest likelihood of being enrolled in a private school, with 4 (100.0% in the age bracket) attending a public institution.
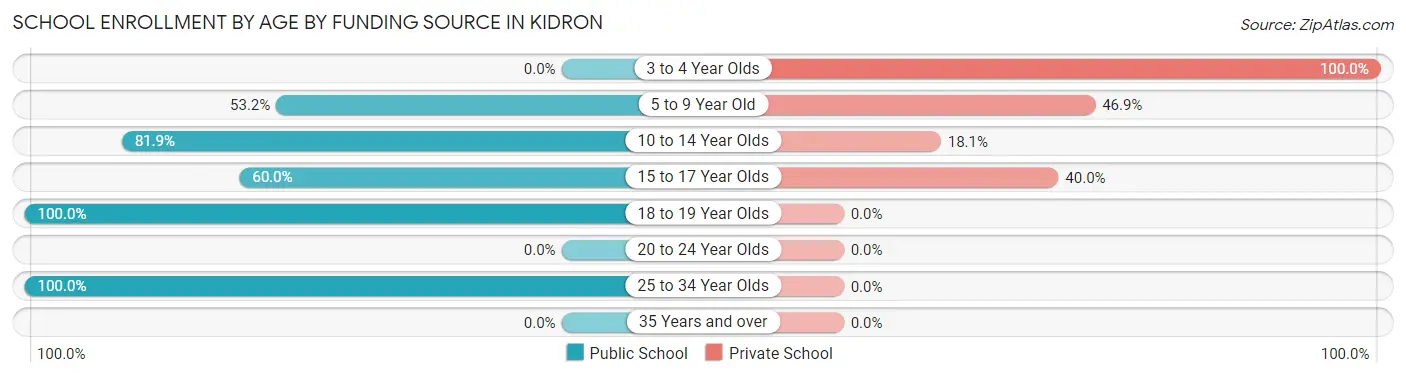
| Age Bracket | Public School | Private School |
| 3 to 4 Year Olds | 0 (0.0%) | 5 (100.0%) |
| 5 to 9 Year Old | 59 (53.1%) | 52 (46.9%) |
| 10 to 14 Year Olds | 77 (81.9%) | 17 (18.1%) |
| 15 to 17 Year Olds | 6 (60.0%) | 4 (40.0%) |
| 18 to 19 Year Olds | 4 (100.0%) | 0 (0.0%) |
| 20 to 24 Year Olds | 0 (0.0%) | 0 (0.0%) |
| 25 to 34 Year Olds | 10 (100.0%) | 0 (0.0%) |
| 35 Years and over | 0 (0.0%) | 0 (0.0%) |
| Total | 156 (66.7%) | 78 (33.3%) |
Educational Attainment by Field of Study in Kidron
Liberal arts & history (41 | 28.3%), computers & mathematics (23 | 15.9%), arts & humanities (20 | 13.8%), business (16 | 11.0%), and visual & performing arts (15 | 10.3%) are the most common fields of study among 145 individuals in Kidron who have obtained a bachelor's degree or higher.
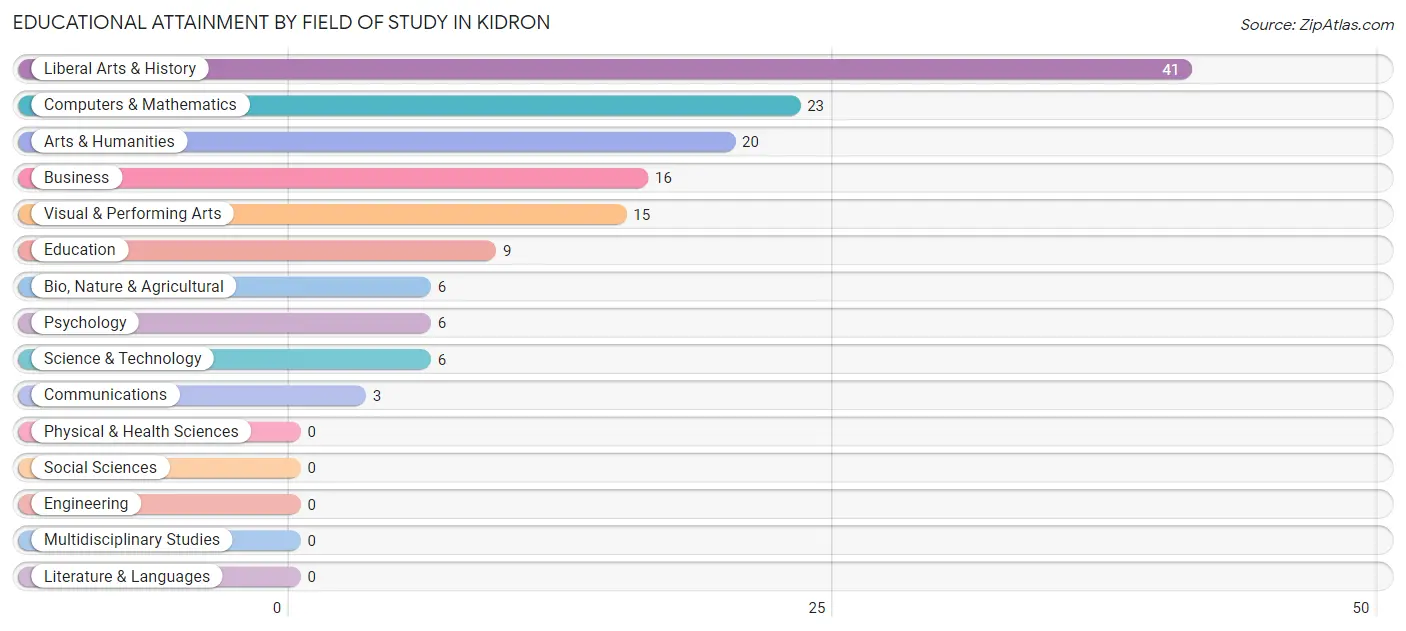
| Field of Study | # Graduates | % Graduates |
| Computers & Mathematics | 23 | 15.9% |
| Bio, Nature & Agricultural | 6 | 4.1% |
| Physical & Health Sciences | 0 | 0.0% |
| Psychology | 6 | 4.1% |
| Social Sciences | 0 | 0.0% |
| Engineering | 0 | 0.0% |
| Multidisciplinary Studies | 0 | 0.0% |
| Science & Technology | 6 | 4.1% |
| Business | 16 | 11.0% |
| Education | 9 | 6.2% |
| Literature & Languages | 0 | 0.0% |
| Liberal Arts & History | 41 | 28.3% |
| Visual & Performing Arts | 15 | 10.3% |
| Communications | 3 | 2.1% |
| Arts & Humanities | 20 | 13.8% |
| Total | 145 | 100.0% |
Transportation & Commute in Kidron
Vehicle Availability by Sex in Kidron
The most prevalent vehicle ownership categories in Kidron are males with 2 vehicles (137, accounting for 59.3%) and females with 2 vehicles (123, making up 71.0%).
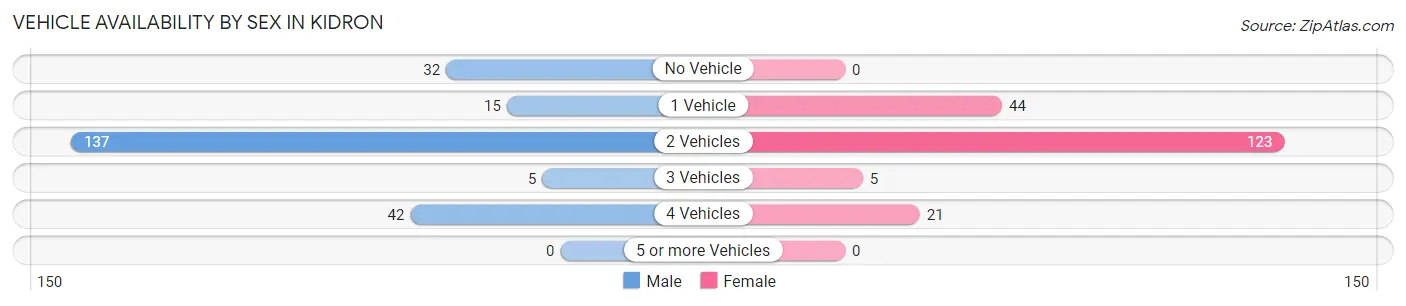
| Vehicles Available | Male | Female |
| No Vehicle | 32 (13.9%) | 0 (0.0%) |
| 1 Vehicle | 15 (6.5%) | 44 (22.8%) |
| 2 Vehicles | 137 (59.3%) | 123 (63.7%) |
| 3 Vehicles | 5 (2.2%) | 5 (2.6%) |
| 4 Vehicles | 42 (18.2%) | 21 (10.9%) |
| 5 or more Vehicles | 0 (0.0%) | 0 (0.0%) |
| Total | 231 (100.0%) | 193 (100.0%) |
Commute Time in Kidron
The most frequently occuring commute durations in Kidron are 5 to 9 minutes (96 commuters, 24.5%), 20 to 24 minutes (79 commuters, 20.2%), and 10 to 14 minutes (55 commuters, 14.0%).
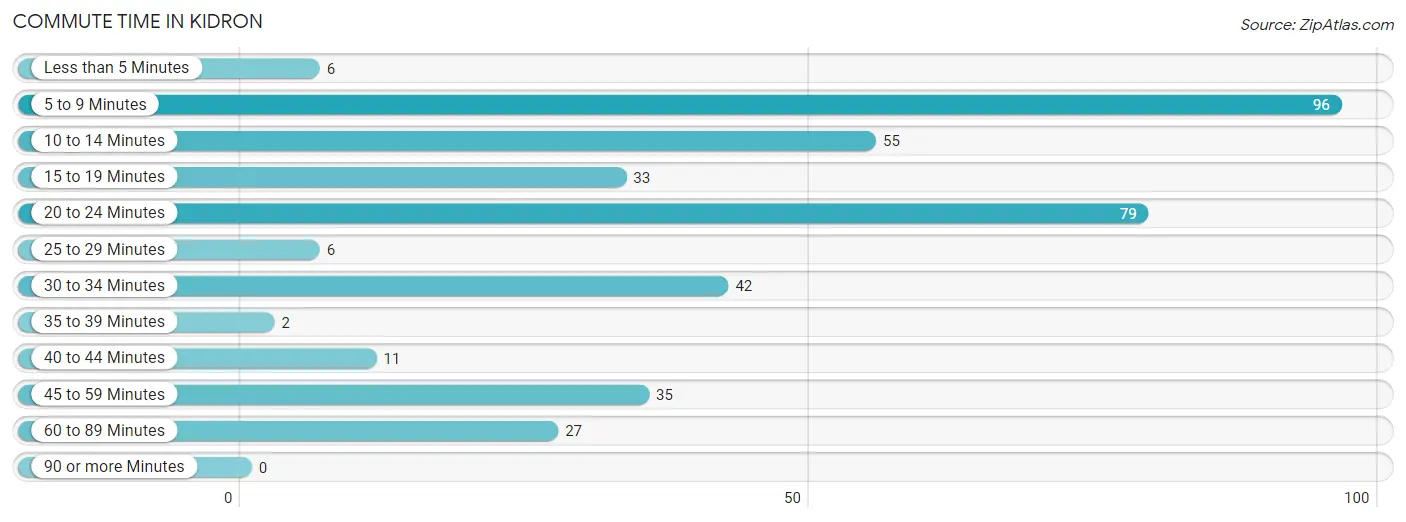
| Commute Time | # Commuters | % Commuters |
| Less than 5 Minutes | 6 | 1.5% |
| 5 to 9 Minutes | 96 | 24.5% |
| 10 to 14 Minutes | 55 | 14.0% |
| 15 to 19 Minutes | 33 | 8.4% |
| 20 to 24 Minutes | 79 | 20.2% |
| 25 to 29 Minutes | 6 | 1.5% |
| 30 to 34 Minutes | 42 | 10.7% |
| 35 to 39 Minutes | 2 | 0.5% |
| 40 to 44 Minutes | 11 | 2.8% |
| 45 to 59 Minutes | 35 | 8.9% |
| 60 to 89 Minutes | 27 | 6.9% |
| 90 or more Minutes | 0 | 0.0% |
Commute Time by Sex in Kidron
The most common commute times in Kidron are 30 to 34 minutes (42 commuters, 19.6%) for males and 5 to 9 minutes (57 commuters, 32.0%) for females.
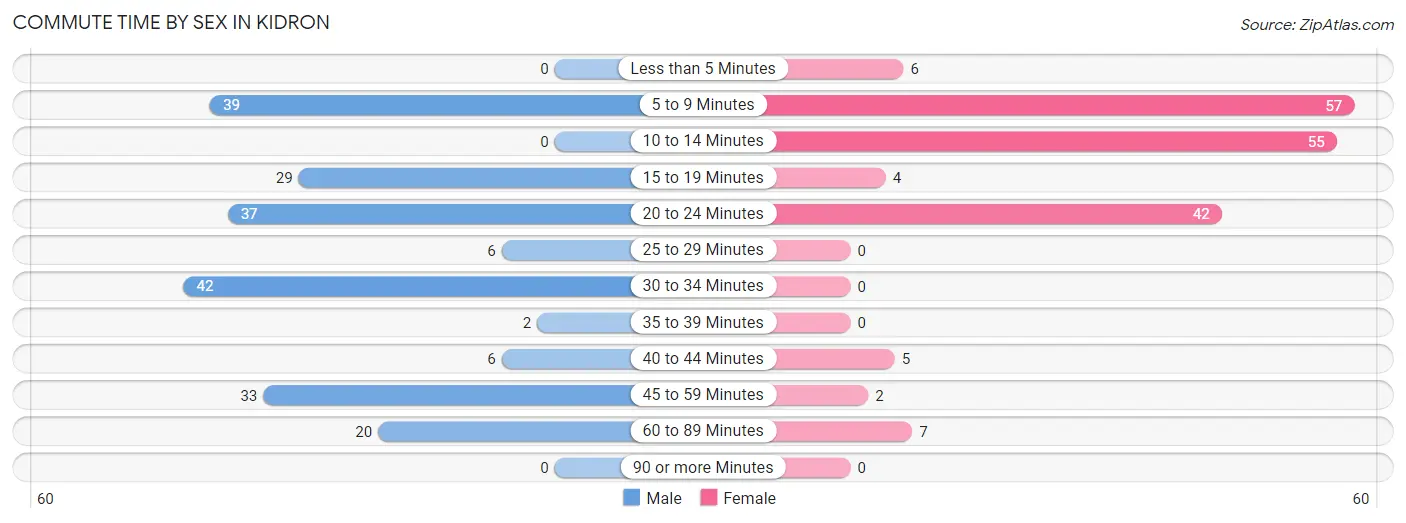
| Commute Time | Male | Female |
| Less than 5 Minutes | 0 (0.0%) | 6 (3.4%) |
| 5 to 9 Minutes | 39 (18.2%) | 57 (32.0%) |
| 10 to 14 Minutes | 0 (0.0%) | 55 (30.9%) |
| 15 to 19 Minutes | 29 (13.6%) | 4 (2.2%) |
| 20 to 24 Minutes | 37 (17.3%) | 42 (23.6%) |
| 25 to 29 Minutes | 6 (2.8%) | 0 (0.0%) |
| 30 to 34 Minutes | 42 (19.6%) | 0 (0.0%) |
| 35 to 39 Minutes | 2 (0.9%) | 0 (0.0%) |
| 40 to 44 Minutes | 6 (2.8%) | 5 (2.8%) |
| 45 to 59 Minutes | 33 (15.4%) | 2 (1.1%) |
| 60 to 89 Minutes | 20 (9.3%) | 7 (3.9%) |
| 90 or more Minutes | 0 (0.0%) | 0 (0.0%) |
Time of Departure to Work by Sex in Kidron
The most frequent times of departure to work in Kidron are 6:00 AM to 6:29 AM (49, 22.9%) for males and 8:00 AM to 8:29 AM (58, 32.6%) for females.
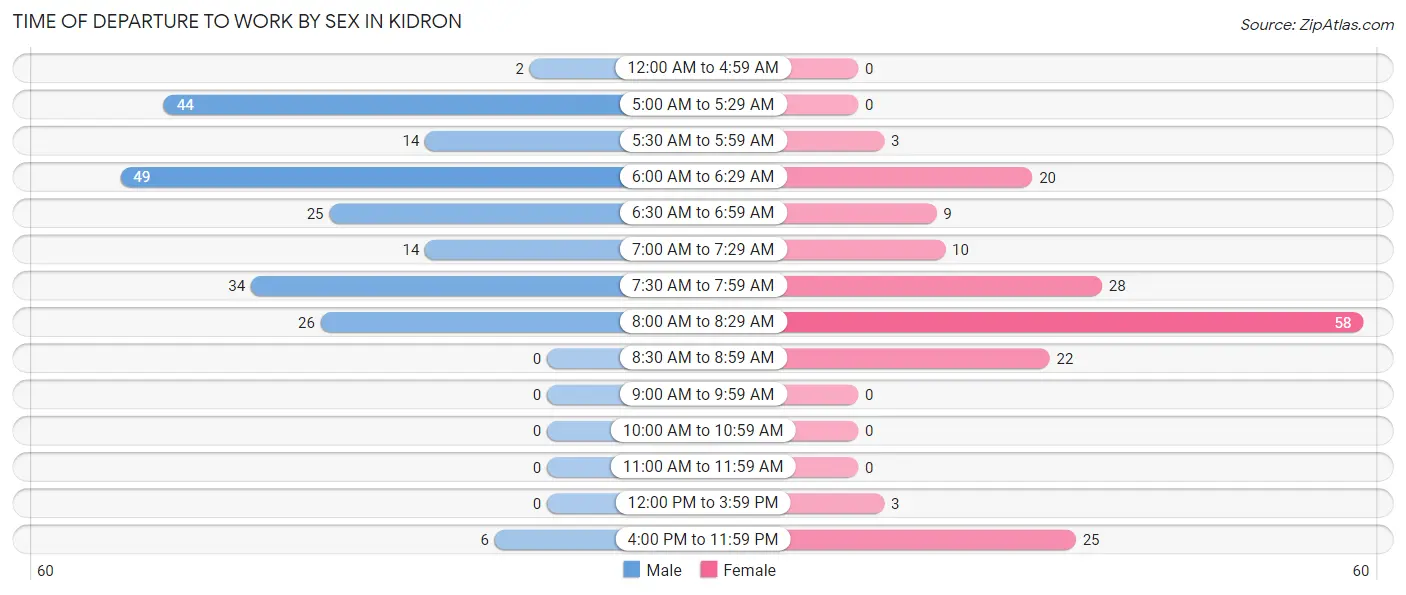
| Time of Departure | Male | Female |
| 12:00 AM to 4:59 AM | 2 (0.9%) | 0 (0.0%) |
| 5:00 AM to 5:29 AM | 44 (20.6%) | 0 (0.0%) |
| 5:30 AM to 5:59 AM | 14 (6.5%) | 3 (1.7%) |
| 6:00 AM to 6:29 AM | 49 (22.9%) | 20 (11.2%) |
| 6:30 AM to 6:59 AM | 25 (11.7%) | 9 (5.1%) |
| 7:00 AM to 7:29 AM | 14 (6.5%) | 10 (5.6%) |
| 7:30 AM to 7:59 AM | 34 (15.9%) | 28 (15.7%) |
| 8:00 AM to 8:29 AM | 26 (12.1%) | 58 (32.6%) |
| 8:30 AM to 8:59 AM | 0 (0.0%) | 22 (12.4%) |
| 9:00 AM to 9:59 AM | 0 (0.0%) | 0 (0.0%) |
| 10:00 AM to 10:59 AM | 0 (0.0%) | 0 (0.0%) |
| 11:00 AM to 11:59 AM | 0 (0.0%) | 0 (0.0%) |
| 12:00 PM to 3:59 PM | 0 (0.0%) | 3 (1.7%) |
| 4:00 PM to 11:59 PM | 6 (2.8%) | 25 (14.0%) |
| Total | 214 (100.0%) | 178 (100.0%) |
Housing Occupancy in Kidron
Occupancy by Ownership in Kidron
Of the total 324 dwellings in Kidron, owner-occupied units account for 261 (80.6%), while renter-occupied units make up 63 (19.4%).
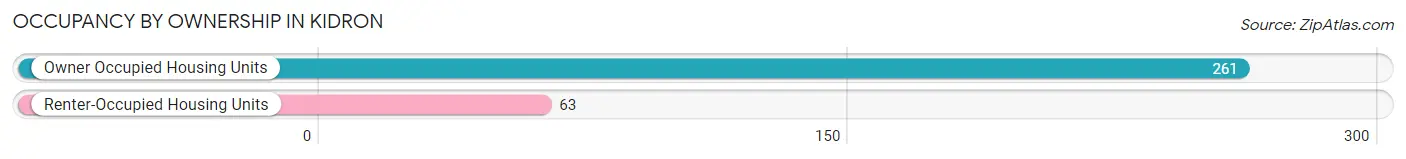
| Occupancy | # Housing Units | % Housing Units |
| Owner Occupied Housing Units | 261 | 80.6% |
| Renter-Occupied Housing Units | 63 | 19.4% |
| Total Occupied Housing Units | 324 | 100.0% |
Occupancy by Household Size in Kidron
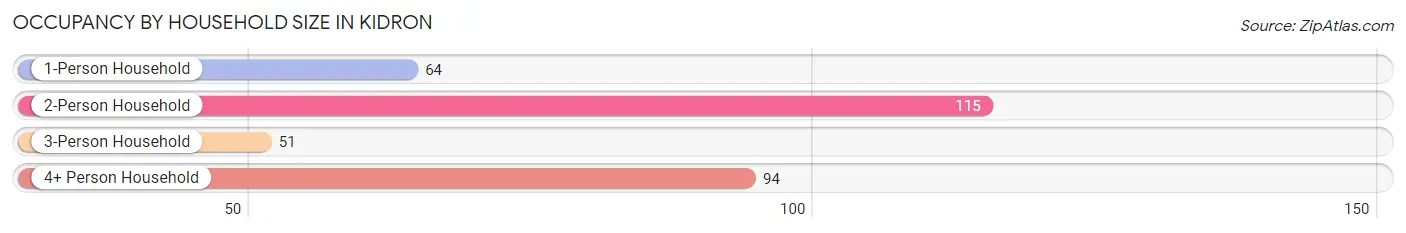
| Household Size | # Housing Units | % Housing Units |
| 1-Person Household | 64 | 19.8% |
| 2-Person Household | 115 | 35.5% |
| 3-Person Household | 51 | 15.7% |
| 4+ Person Household | 94 | 29.0% |
| Total Housing Units | 324 | 100.0% |
Occupancy by Ownership by Household Size in Kidron
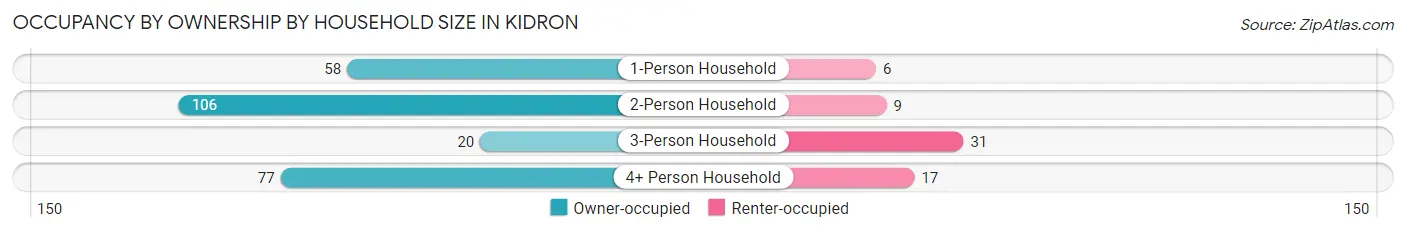
| Household Size | Owner-occupied | Renter-occupied |
| 1-Person Household | 58 (90.6%) | 6 (9.4%) |
| 2-Person Household | 106 (92.2%) | 9 (7.8%) |
| 3-Person Household | 20 (39.2%) | 31 (60.8%) |
| 4+ Person Household | 77 (81.9%) | 17 (18.1%) |
| Total Housing Units | 261 (80.6%) | 63 (19.4%) |
Occupancy by Educational Attainment in Kidron
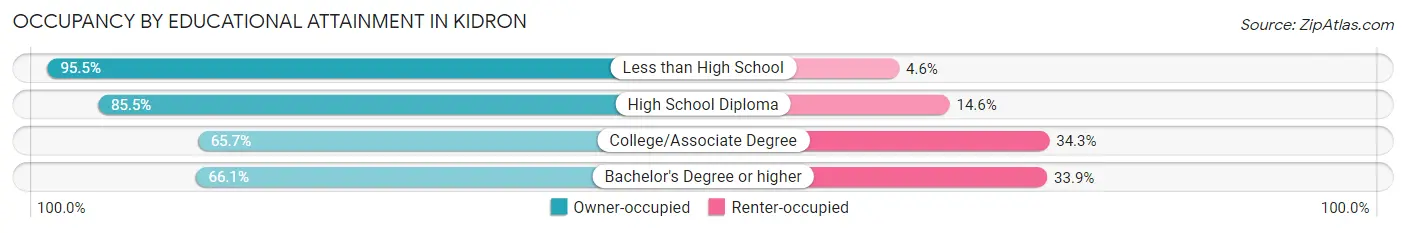
| Household Size | Owner-occupied | Renter-occupied |
| Less than High School | 84 (95.5%) | 4 (4.5%) |
| High School Diploma | 94 (85.5%) | 16 (14.5%) |
| College/Associate Degree | 44 (65.7%) | 23 (34.3%) |
| Bachelor's Degree or higher | 39 (66.1%) | 20 (33.9%) |
Occupancy by Age of Householder in Kidron
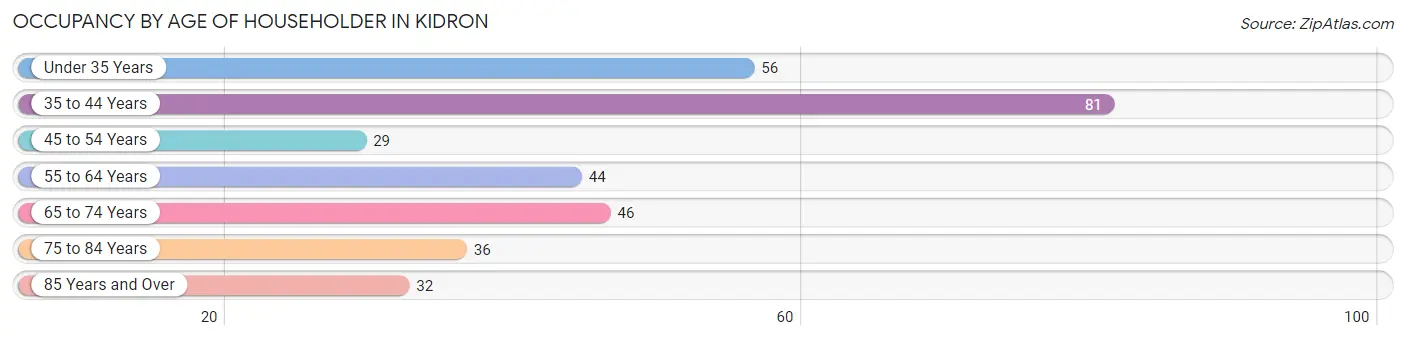
| Age Bracket | # Households | % Households |
| Under 35 Years | 56 | 17.3% |
| 35 to 44 Years | 81 | 25.0% |
| 45 to 54 Years | 29 | 8.9% |
| 55 to 64 Years | 44 | 13.6% |
| 65 to 74 Years | 46 | 14.2% |
| 75 to 84 Years | 36 | 11.1% |
| 85 Years and Over | 32 | 9.9% |
| Total | 324 | 100.0% |
Housing Finances in Kidron
Median Income by Occupancy in Kidron
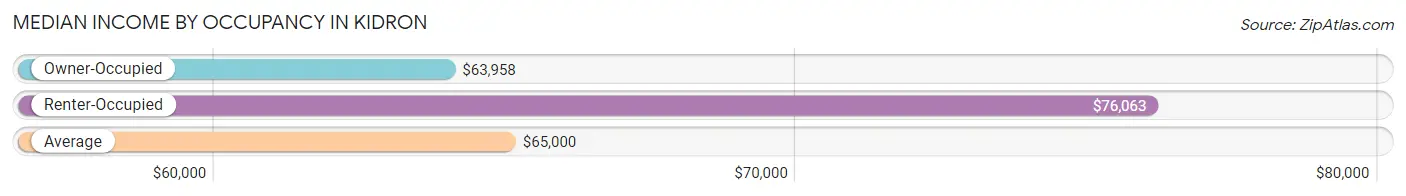
| Occupancy Type | # Households | Median Income |
| Owner-Occupied | 261 (80.6%) | $63,958 |
| Renter-Occupied | 63 (19.4%) | $76,063 |
| Average | 324 (100.0%) | $65,000 |
Occupancy by Householder Income Bracket in Kidron
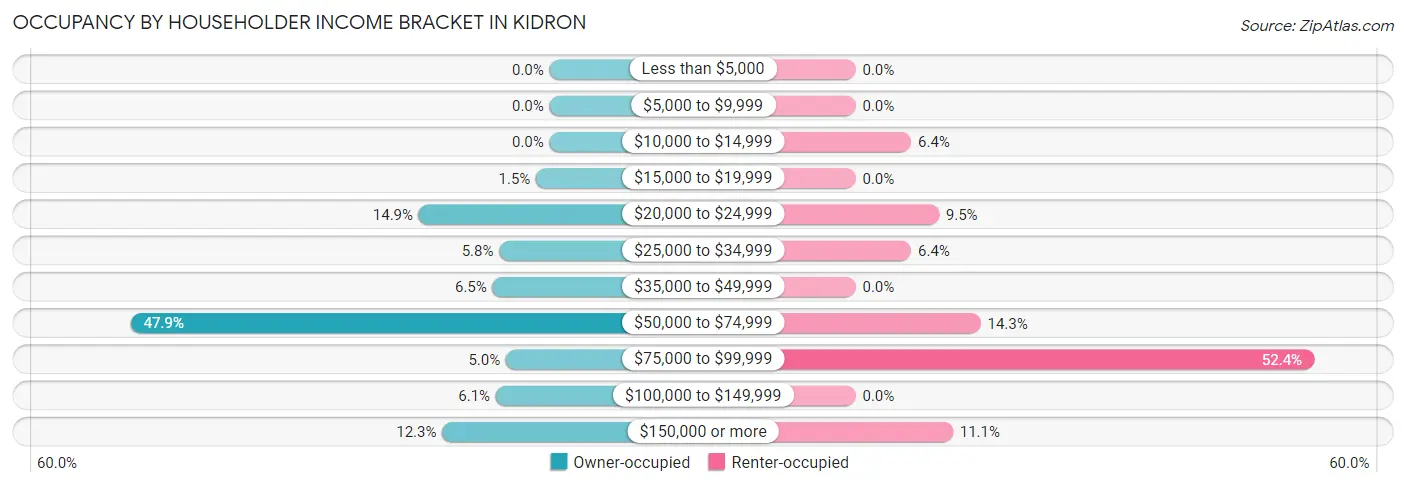
| Income Bracket | Owner-occupied | Renter-occupied |
| Less than $5,000 | 0 (0.0%) | 0 (0.0%) |
| $5,000 to $9,999 | 0 (0.0%) | 0 (0.0%) |
| $10,000 to $14,999 | 0 (0.0%) | 4 (6.4%) |
| $15,000 to $19,999 | 4 (1.5%) | 0 (0.0%) |
| $20,000 to $24,999 | 39 (14.9%) | 6 (9.5%) |
| $25,000 to $34,999 | 15 (5.8%) | 4 (6.4%) |
| $35,000 to $49,999 | 17 (6.5%) | 0 (0.0%) |
| $50,000 to $74,999 | 125 (47.9%) | 9 (14.3%) |
| $75,000 to $99,999 | 13 (5.0%) | 33 (52.4%) |
| $100,000 to $149,999 | 16 (6.1%) | 0 (0.0%) |
| $150,000 or more | 32 (12.3%) | 7 (11.1%) |
| Total | 261 (100.0%) | 63 (100.0%) |
Monthly Housing Cost Tiers in Kidron
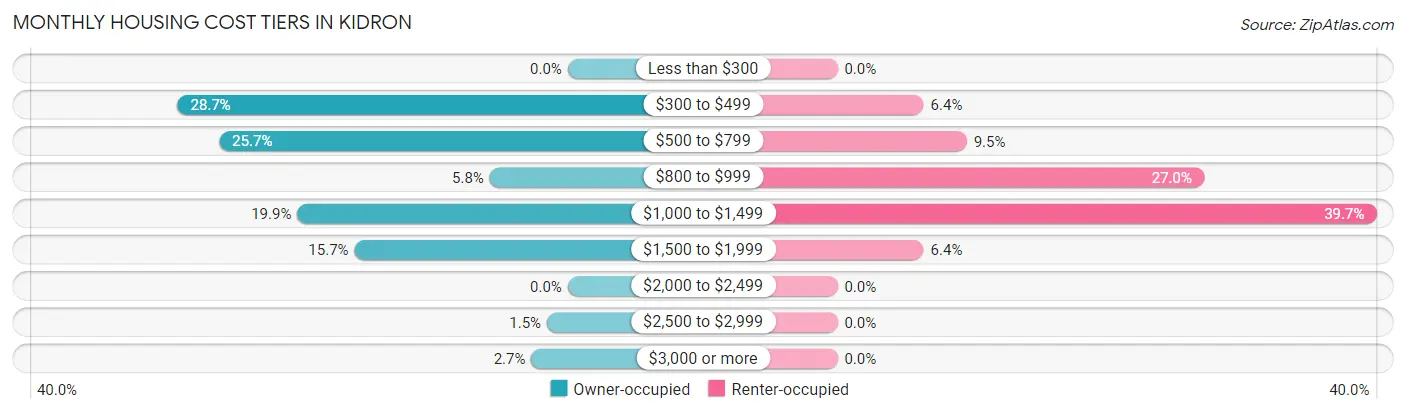
| Monthly Cost | Owner-occupied | Renter-occupied |
| Less than $300 | 0 (0.0%) | 0 (0.0%) |
| $300 to $499 | 75 (28.7%) | 4 (6.4%) |
| $500 to $799 | 67 (25.7%) | 6 (9.5%) |
| $800 to $999 | 15 (5.8%) | 17 (27.0%) |
| $1,000 to $1,499 | 52 (19.9%) | 25 (39.7%) |
| $1,500 to $1,999 | 41 (15.7%) | 4 (6.4%) |
| $2,000 to $2,499 | 0 (0.0%) | 0 (0.0%) |
| $2,500 to $2,999 | 4 (1.5%) | 0 (0.0%) |
| $3,000 or more | 7 (2.7%) | 0 (0.0%) |
| Total | 261 (100.0%) | 63 (100.0%) |
Physical Housing Characteristics in Kidron
Housing Structures in Kidron
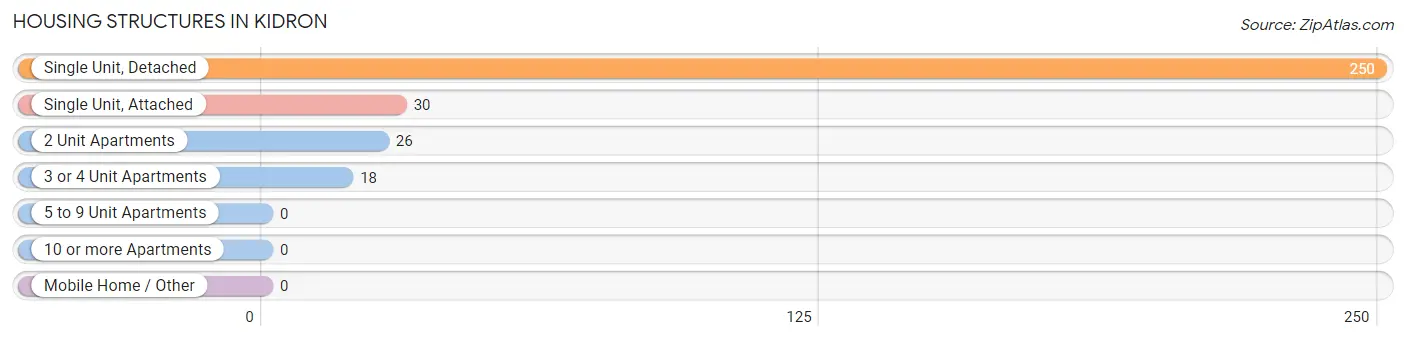
| Structure Type | # Housing Units | % Housing Units |
| Single Unit, Detached | 250 | 77.2% |
| Single Unit, Attached | 30 | 9.3% |
| 2 Unit Apartments | 26 | 8.0% |
| 3 or 4 Unit Apartments | 18 | 5.6% |
| 5 to 9 Unit Apartments | 0 | 0.0% |
| 10 or more Apartments | 0 | 0.0% |
| Mobile Home / Other | 0 | 0.0% |
| Total | 324 | 100.0% |
Housing Structures by Occupancy in Kidron
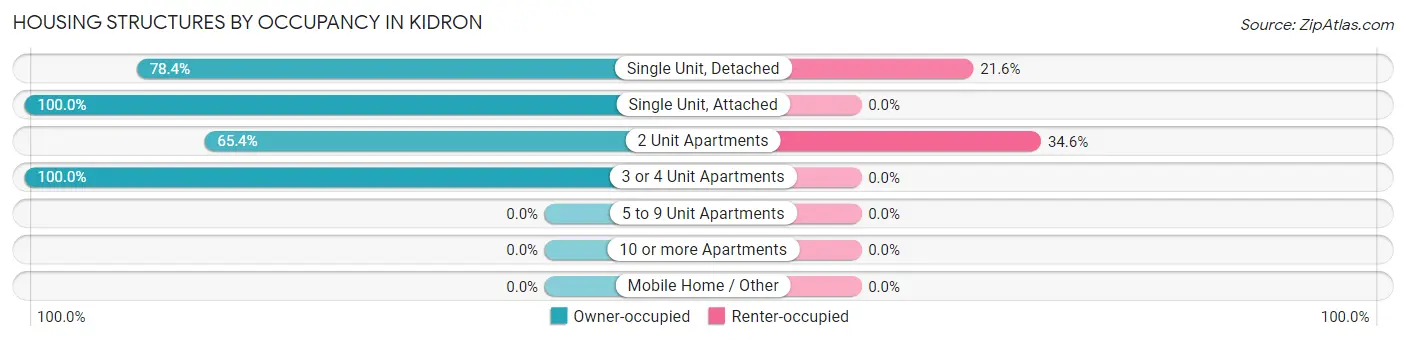
| Structure Type | Owner-occupied | Renter-occupied |
| Single Unit, Detached | 196 (78.4%) | 54 (21.6%) |
| Single Unit, Attached | 30 (100.0%) | 0 (0.0%) |
| 2 Unit Apartments | 17 (65.4%) | 9 (34.6%) |
| 3 or 4 Unit Apartments | 18 (100.0%) | 0 (0.0%) |
| 5 to 9 Unit Apartments | 0 (0.0%) | 0 (0.0%) |
| 10 or more Apartments | 0 (0.0%) | 0 (0.0%) |
| Mobile Home / Other | 0 (0.0%) | 0 (0.0%) |
| Total | 261 (80.6%) | 63 (19.4%) |
Housing Structures by Number of Rooms in Kidron
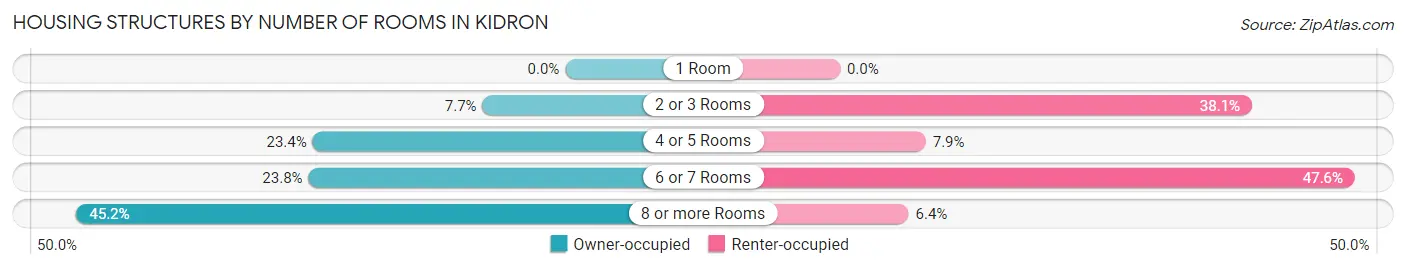
| Number of Rooms | Owner-occupied | Renter-occupied |
| 1 Room | 0 (0.0%) | 0 (0.0%) |
| 2 or 3 Rooms | 20 (7.7%) | 24 (38.1%) |
| 4 or 5 Rooms | 61 (23.4%) | 5 (7.9%) |
| 6 or 7 Rooms | 62 (23.7%) | 30 (47.6%) |
| 8 or more Rooms | 118 (45.2%) | 4 (6.4%) |
| Total | 261 (100.0%) | 63 (100.0%) |
Housing Structure by Heating Type in Kidron
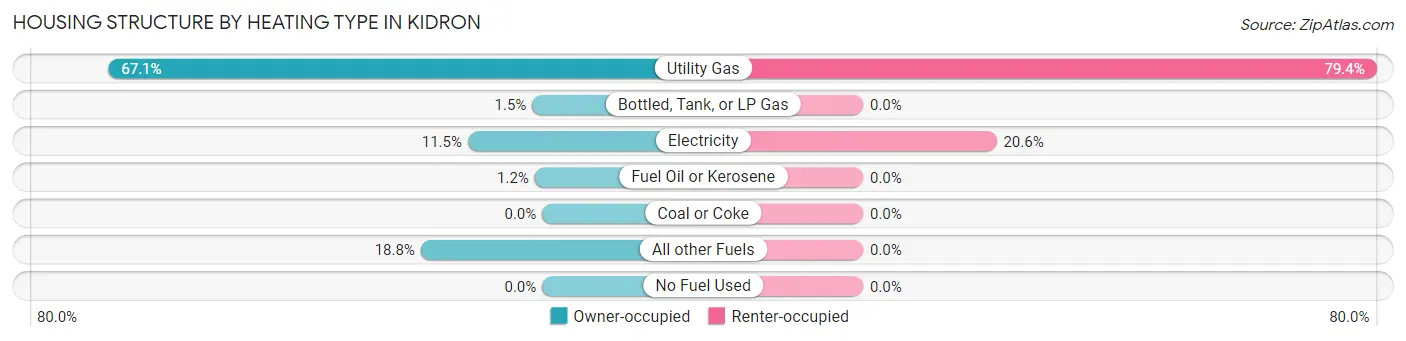
| Heating Type | Owner-occupied | Renter-occupied |
| Utility Gas | 175 (67.0%) | 50 (79.4%) |
| Bottled, Tank, or LP Gas | 4 (1.5%) | 0 (0.0%) |
| Electricity | 30 (11.5%) | 13 (20.6%) |
| Fuel Oil or Kerosene | 3 (1.1%) | 0 (0.0%) |
| Coal or Coke | 0 (0.0%) | 0 (0.0%) |
| All other Fuels | 49 (18.8%) | 0 (0.0%) |
| No Fuel Used | 0 (0.0%) | 0 (0.0%) |
| Total | 261 (100.0%) | 63 (100.0%) |
Household Vehicle Usage in Kidron
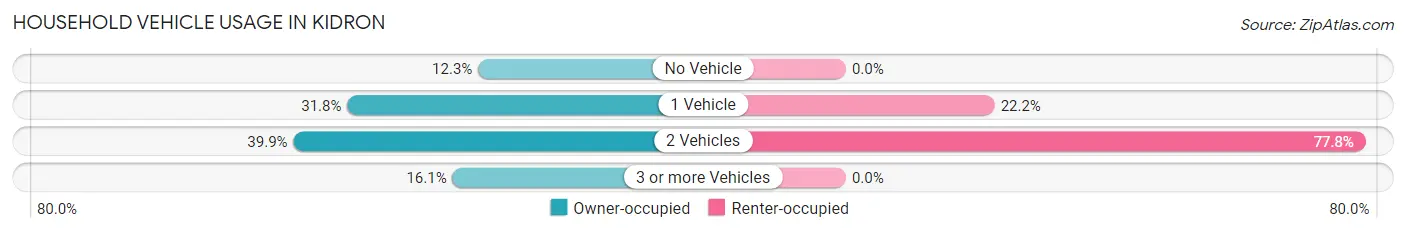
| Vehicles per Household | Owner-occupied | Renter-occupied |
| No Vehicle | 32 (12.3%) | 0 (0.0%) |
| 1 Vehicle | 83 (31.8%) | 14 (22.2%) |
| 2 Vehicles | 104 (39.9%) | 49 (77.8%) |
| 3 or more Vehicles | 42 (16.1%) | 0 (0.0%) |
| Total | 261 (100.0%) | 63 (100.0%) |
Real Estate & Mortgages in Kidron
Real Estate and Mortgage Overview in Kidron
| Characteristic | Without Mortgage | With Mortgage |
| Housing Units | 135 | 126 |
| Median Property Value | $172,100 | $232,500 |
| Median Household Income | $58,162 | $32 |
| Monthly Housing Costs | $481 | $7 |
| Real Estate Taxes | $2,254 | $0 |
Property Value by Mortgage Status in Kidron
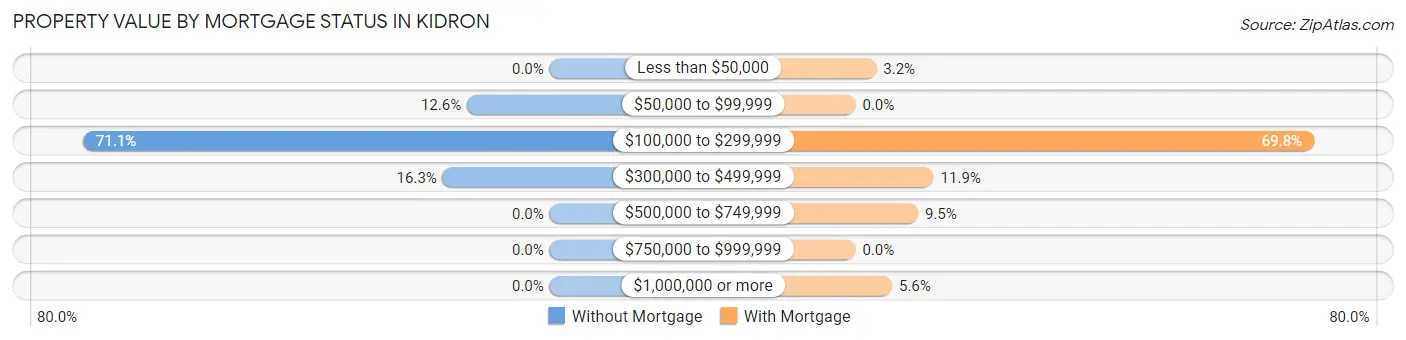
| Property Value | Without Mortgage | With Mortgage |
| Less than $50,000 | 0 (0.0%) | 4 (3.2%) |
| $50,000 to $99,999 | 17 (12.6%) | 0 (0.0%) |
| $100,000 to $299,999 | 96 (71.1%) | 88 (69.8%) |
| $300,000 to $499,999 | 22 (16.3%) | 15 (11.9%) |
| $500,000 to $749,999 | 0 (0.0%) | 12 (9.5%) |
| $750,000 to $999,999 | 0 (0.0%) | 0 (0.0%) |
| $1,000,000 or more | 0 (0.0%) | 7 (5.6%) |
| Total | 135 (100.0%) | 126 (100.0%) |
Household Income by Mortgage Status in Kidron
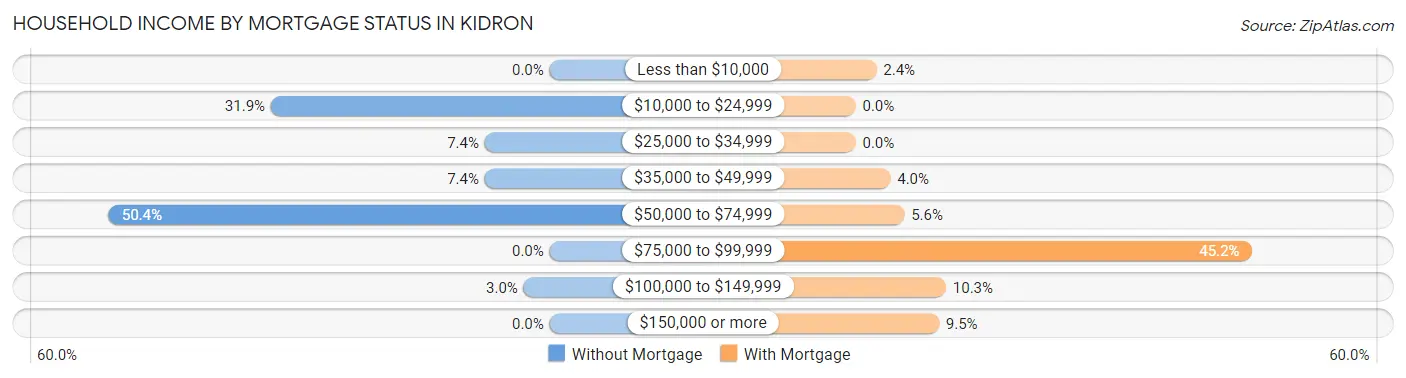
| Household Income | Without Mortgage | With Mortgage |
| Less than $10,000 | 0 (0.0%) | 3 (2.4%) |
| $10,000 to $24,999 | 43 (31.9%) | 0 (0.0%) |
| $25,000 to $34,999 | 10 (7.4%) | 0 (0.0%) |
| $35,000 to $49,999 | 10 (7.4%) | 5 (4.0%) |
| $50,000 to $74,999 | 68 (50.4%) | 7 (5.6%) |
| $75,000 to $99,999 | 0 (0.0%) | 57 (45.2%) |
| $100,000 to $149,999 | 4 (3.0%) | 13 (10.3%) |
| $150,000 or more | 0 (0.0%) | 12 (9.5%) |
| Total | 135 (100.0%) | 126 (100.0%) |
Property Value to Household Income Ratio in Kidron
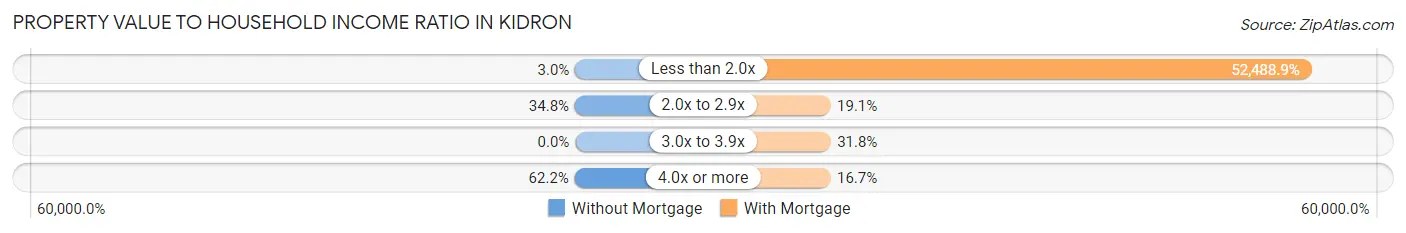
| Value-to-Income Ratio | Without Mortgage | With Mortgage |
| Less than 2.0x | 4 (3.0%) | 66,136 (52,488.9%) |
| 2.0x to 2.9x | 47 (34.8%) | 24 (19.1%) |
| 3.0x to 3.9x | 0 (0.0%) | 40 (31.8%) |
| 4.0x or more | 84 (62.2%) | 21 (16.7%) |
| Total | 135 (100.0%) | 126 (100.0%) |
Real Estate Taxes by Mortgage Status in Kidron
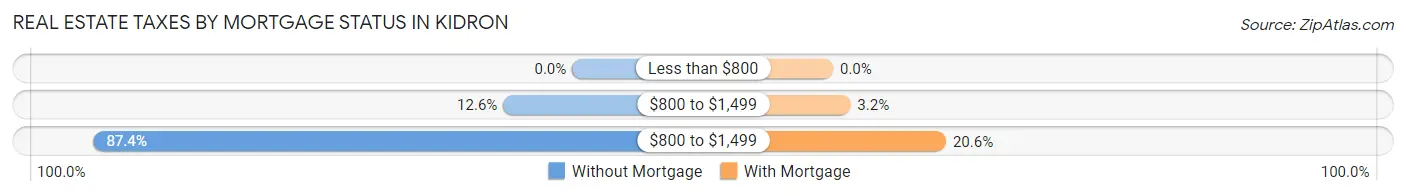
| Property Taxes | Without Mortgage | With Mortgage |
| Less than $800 | 0 (0.0%) | 0 (0.0%) |
| $800 to $1,499 | 17 (12.6%) | 4 (3.2%) |
| $800 to $1,499 | 118 (87.4%) | 26 (20.6%) |
| Total | 135 (100.0%) | 126 (100.0%) |
Health & Disability in Kidron
Health Insurance Coverage by Age in Kidron
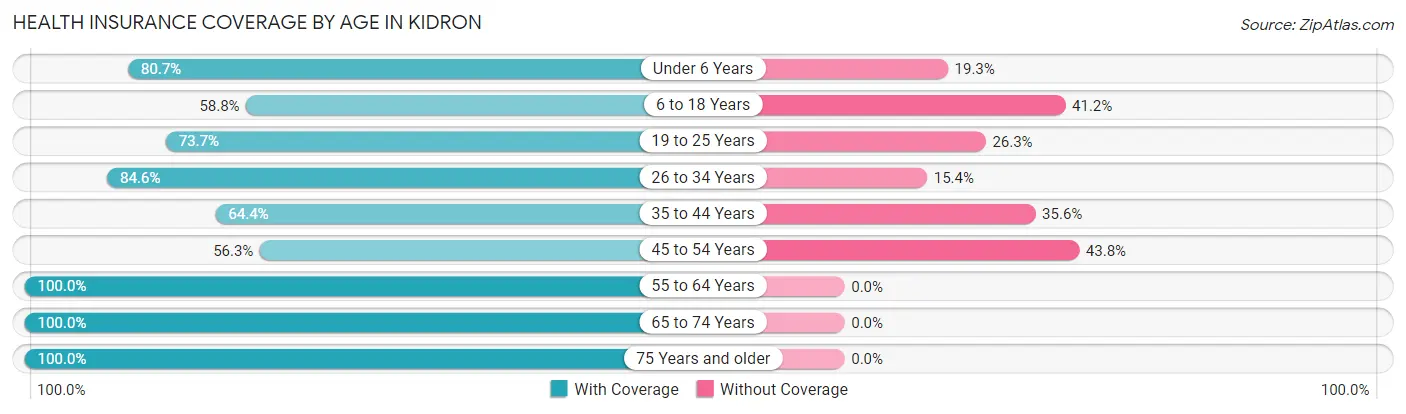
| Age Bracket | With Coverage | Without Coverage |
| Under 6 Years | 88 (80.7%) | 21 (19.3%) |
| 6 to 18 Years | 160 (58.8%) | 112 (41.2%) |
| 19 to 25 Years | 28 (73.7%) | 10 (26.3%) |
| 26 to 34 Years | 121 (84.6%) | 22 (15.4%) |
| 35 to 44 Years | 76 (64.4%) | 42 (35.6%) |
| 45 to 54 Years | 27 (56.2%) | 21 (43.8%) |
| 55 to 64 Years | 82 (100.0%) | 0 (0.0%) |
| 65 to 74 Years | 52 (100.0%) | 0 (0.0%) |
| 75 Years and older | 139 (100.0%) | 0 (0.0%) |
| Total | 773 (77.2%) | 228 (22.8%) |
Health Insurance Coverage by Citizenship Status in Kidron
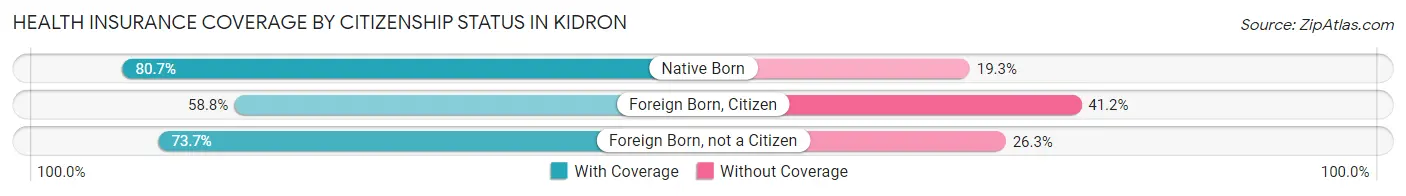
| Citizenship Status | With Coverage | Without Coverage |
| Native Born | 88 (80.7%) | 21 (19.3%) |
| Foreign Born, Citizen | 160 (58.8%) | 112 (41.2%) |
| Foreign Born, not a Citizen | 28 (73.7%) | 10 (26.3%) |
Health Insurance Coverage by Household Income in Kidron
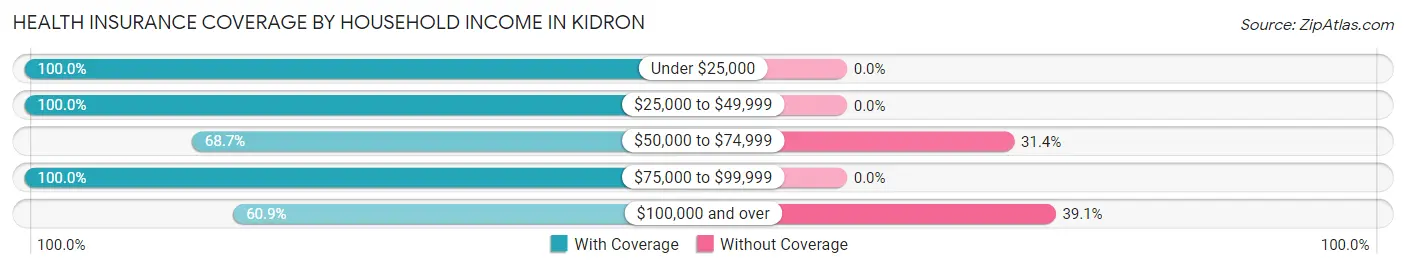
| Household Income | With Coverage | Without Coverage |
| Under $25,000 | 62 (100.0%) | 0 (0.0%) |
| $25,000 to $49,999 | 82 (100.0%) | 0 (0.0%) |
| $50,000 to $74,999 | 311 (68.6%) | 142 (31.4%) |
| $75,000 to $99,999 | 184 (100.0%) | 0 (0.0%) |
| $100,000 and over | 134 (60.9%) | 86 (39.1%) |
Public vs Private Health Insurance Coverage by Age in Kidron
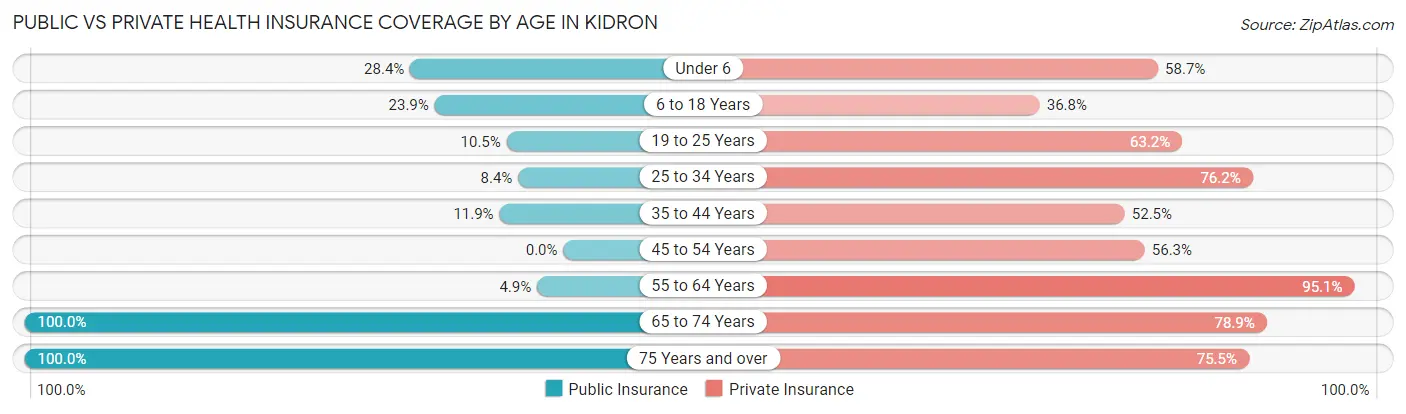
| Age Bracket | Public Insurance | Private Insurance |
| Under 6 | 31 (28.4%) | 64 (58.7%) |
| 6 to 18 Years | 65 (23.9%) | 100 (36.8%) |
| 19 to 25 Years | 4 (10.5%) | 24 (63.2%) |
| 25 to 34 Years | 12 (8.4%) | 109 (76.2%) |
| 35 to 44 Years | 14 (11.9%) | 62 (52.5%) |
| 45 to 54 Years | 0 (0.0%) | 27 (56.2%) |
| 55 to 64 Years | 4 (4.9%) | 78 (95.1%) |
| 65 to 74 Years | 52 (100.0%) | 41 (78.8%) |
| 75 Years and over | 139 (100.0%) | 105 (75.5%) |
| Total | 321 (32.1%) | 610 (60.9%) |
Disability Status by Sex by Age in Kidron
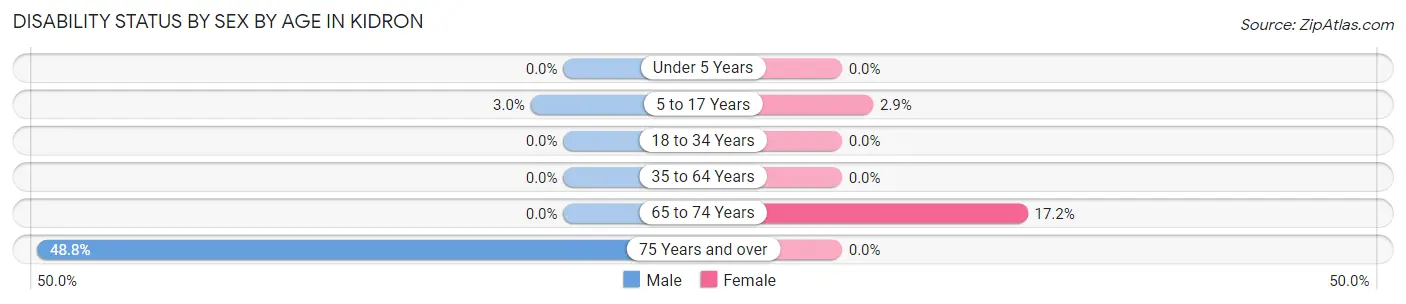
| Age Bracket | Male | Female |
| Under 5 Years | 0 (0.0%) | 0 (0.0%) |
| 5 to 17 Years | 4 (3.0%) | 4 (2.9%) |
| 18 to 34 Years | 0 (0.0%) | 0 (0.0%) |
| 35 to 64 Years | 0 (0.0%) | 0 (0.0%) |
| 65 to 74 Years | 0 (0.0%) | 5 (17.2%) |
| 75 Years and over | 42 (48.8%) | 0 (0.0%) |
Disability Class by Sex by Age in Kidron
Disability Class: Hearing Difficulty
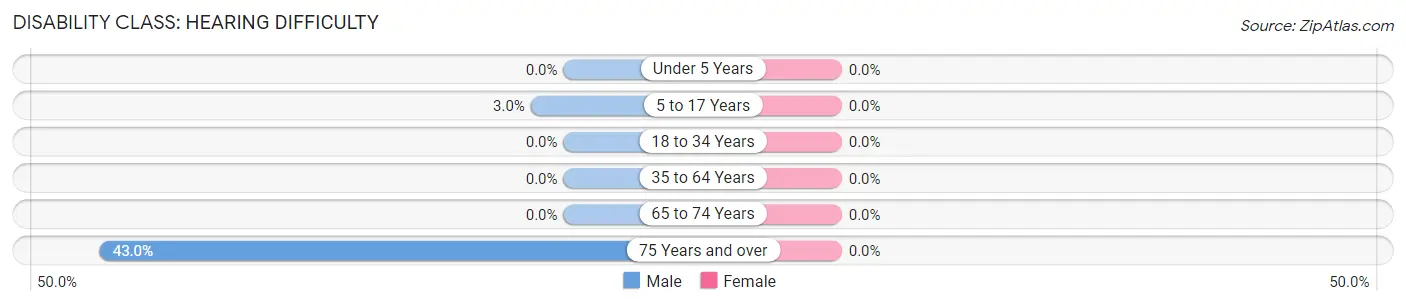
| Age Bracket | Male | Female |
| Under 5 Years | 0 (0.0%) | 0 (0.0%) |
| 5 to 17 Years | 4 (3.0%) | 0 (0.0%) |
| 18 to 34 Years | 0 (0.0%) | 0 (0.0%) |
| 35 to 64 Years | 0 (0.0%) | 0 (0.0%) |
| 65 to 74 Years | 0 (0.0%) | 0 (0.0%) |
| 75 Years and over | 37 (43.0%) | 0 (0.0%) |
Disability Class: Vision Difficulty
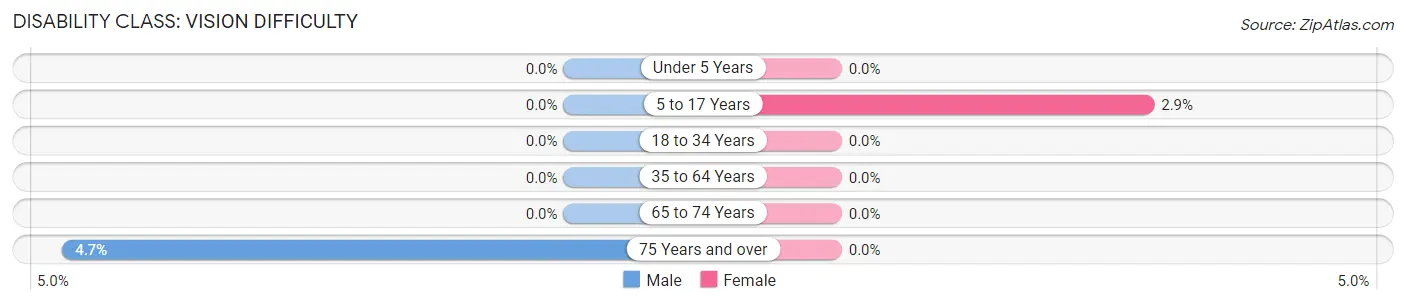
| Age Bracket | Male | Female |
| Under 5 Years | 0 (0.0%) | 0 (0.0%) |
| 5 to 17 Years | 0 (0.0%) | 4 (2.9%) |
| 18 to 34 Years | 0 (0.0%) | 0 (0.0%) |
| 35 to 64 Years | 0 (0.0%) | 0 (0.0%) |
| 65 to 74 Years | 0 (0.0%) | 0 (0.0%) |
| 75 Years and over | 4 (4.6%) | 0 (0.0%) |
Disability Class: Cognitive Difficulty
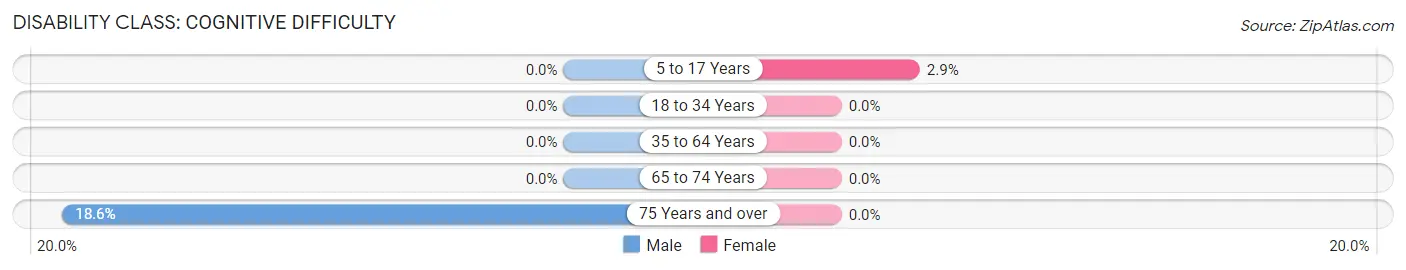
| Age Bracket | Male | Female |
| 5 to 17 Years | 0 (0.0%) | 4 (2.9%) |
| 18 to 34 Years | 0 (0.0%) | 0 (0.0%) |
| 35 to 64 Years | 0 (0.0%) | 0 (0.0%) |
| 65 to 74 Years | 0 (0.0%) | 0 (0.0%) |
| 75 Years and over | 16 (18.6%) | 0 (0.0%) |
Disability Class: Ambulatory Difficulty
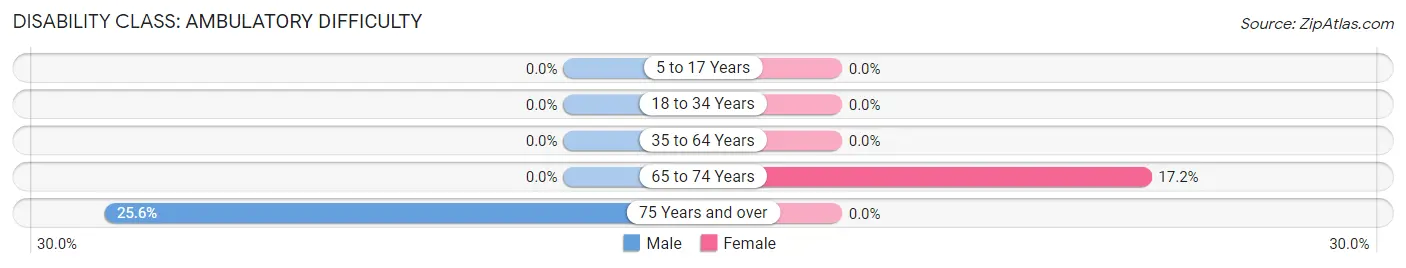
| Age Bracket | Male | Female |
| 5 to 17 Years | 0 (0.0%) | 0 (0.0%) |
| 18 to 34 Years | 0 (0.0%) | 0 (0.0%) |
| 35 to 64 Years | 0 (0.0%) | 0 (0.0%) |
| 65 to 74 Years | 0 (0.0%) | 5 (17.2%) |
| 75 Years and over | 22 (25.6%) | 0 (0.0%) |
Disability Class: Self-Care Difficulty
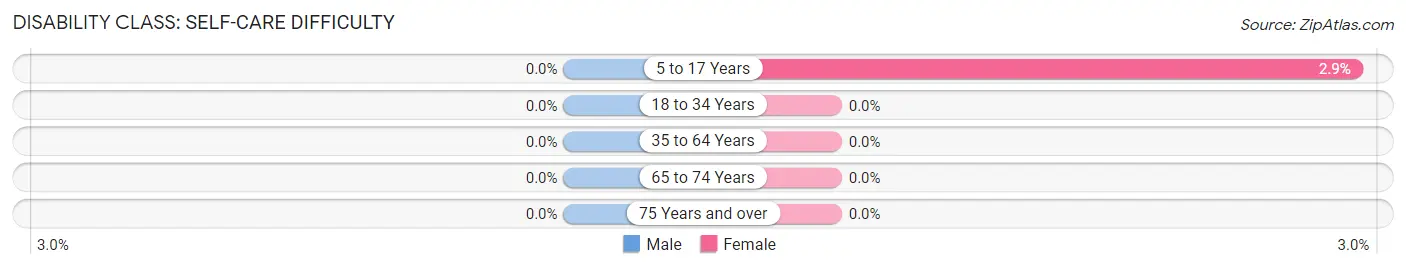
| Age Bracket | Male | Female |
| 5 to 17 Years | 0 (0.0%) | 4 (2.9%) |
| 18 to 34 Years | 0 (0.0%) | 0 (0.0%) |
| 35 to 64 Years | 0 (0.0%) | 0 (0.0%) |
| 65 to 74 Years | 0 (0.0%) | 0 (0.0%) |
| 75 Years and over | 0 (0.0%) | 0 (0.0%) |
Technology Access in Kidron
Computing Device Access in Kidron
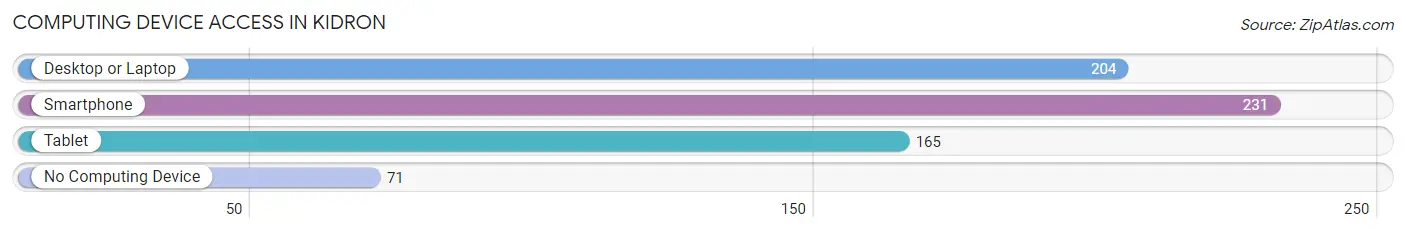
| Device Type | # Households | % Households |
| Desktop or Laptop | 204 | 63.0% |
| Smartphone | 231 | 71.3% |
| Tablet | 165 | 50.9% |
| No Computing Device | 71 | 21.9% |
| Total | 324 | 100.0% |
Internet Access in Kidron
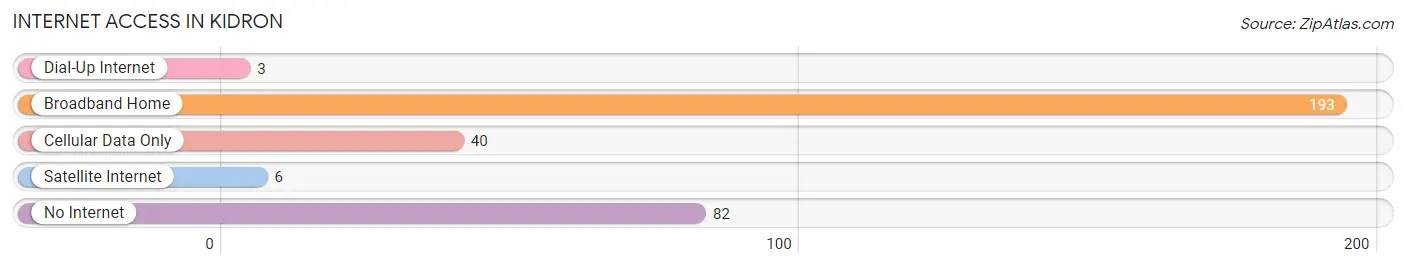
| Internet Type | # Households | % Households |
| Dial-Up Internet | 3 | 0.9% |
| Broadband Home | 193 | 59.6% |
| Cellular Data Only | 40 | 12.3% |
| Satellite Internet | 6 | 1.8% |
| No Internet | 82 | 25.3% |
| Total | 324 | 100.0% |
Kidron Summary
Kidron is a small village located in Wayne County, Ohio, United States. It is situated in the heart of Ohio's Amish Country, and is home to a large Amish population. The village is located on the western edge of Wayne County, and is bordered by the townships of East Union, Paint, and Sugar Creek. The population of Kidron was 1,093 at the 2010 census.
History
Kidron was founded in 1817 by a group of settlers from Pennsylvania. The village was named after Kidron Valley, a valley in the Holy Land. The village was originally a farming community, and the first settlers were mostly of German descent. The village was incorporated in 1867.
In the late 19th century, Kidron became a popular destination for tourists, who were drawn to the area's Amish culture and scenery. The village was also home to a number of businesses, including a hotel, a general store, a blacksmith shop, and a sawmill.
Geography
Kidron is located at 40°51'25" North, 81°48'45" West (40.856944, -81.812500). According to the United States Census Bureau, the village has a total area of 0.6 square miles (1.6 km2), all of it land.
Economy
The economy of Kidron is largely based on agriculture and tourism. The village is home to a number of Amish-owned businesses, including furniture stores, quilt shops, and bakeries. The village also has a number of restaurants, including a popular Amish-style restaurant.
Tourism is an important part of the local economy, as the village is a popular destination for visitors interested in the Amish culture and lifestyle. The village is also home to a number of festivals and events throughout the year, including the Kidron Country Fair and the Kidron Harvest Festival.
Demographics
As of the census of 2010, there were 1,093 people, 431 households, and 305 families residing in the village. The population density was 1,788.3 people per square mile (689.3/km2). There were 463 housing units at an average density of 763.3 per square mile (294.3/km2). The racial makeup of the village was 97.7% White, 0.2% African American, 0.2% Native American, 0.2% Asian, 0.2% from other races, and 1.7% from two or more races. Hispanic or Latino of any race were 0.7% of the population.
There were 431 households, out of which 32.2% had children under the age of 18 living with them, 54.2% were married couples living together, 10.2% had a female householder with no husband present, and 30.2% were non-families. 25.2% of all households were made up of individuals, and 11.2% had someone living alone who was 65 years of age or older. The average household size was 2.54 and the average family size was 3.04.
In the village, the population was spread out, with 25.7% under the age of 18, 7.2% from 18 to 24, 28.2% from 25 to 44, 24.2% from 45 to 64, and 14.7% who were 65 years of age or older. The median age was 38 years. For every 100 females, there were 97.2 males. For every 100 females age 18 and over, there were 94.2 males.
The median income for a household in the village was $41,250, and the median income for a family was $48,750. Males had a median income of $31,250 versus $25,000 for females. The per capita income for the village was $18,945. About 4.2% of families and 6.2% of the population were below the poverty line, including 8.2% of those under age 18 and 5.2% of those age 65 or over.
Common Questions
What is the Total Population of Kidron?
Total Population of Kidron is 1,001.
What is the Total Male Population of Kidron?
Total Male Population of Kidron is 506.
What is the Total Female Population of Kidron?
Total Female Population of Kidron is 495.
What is the Ratio of Males per 100 Females in Kidron?
There are 102.22 Males per 100 Females in Kidron.
What is the Ratio of Females per 100 Males in Kidron?
There are 97.83 Females per 100 Males in Kidron.
What is the Median Population Age in Kidron?
Median Population Age in Kidron is 29.5 Years.
What is the Average Family Size in Kidron
Average Family Size in Kidron is 3.6 People.
What is the Average Household Size in Kidron
Average Household Size in Kidron is 3.1 People.
What is Per Capita Income in Kidron?
Per Capita income in Kidron is $29,759.
What is the Median Family Income in Kidron?
Median Family Income in Kidron is $68,188.
What is the Median Household income in Kidron?
Median Household Income in Kidron is $65,000.
What is Income or Wage Gap in Kidron?
Income or Wage Gap in Kidron is 69.9%.
Women in Kidron earn 30.1 cents for every dollar earned by a man.
What is Inequality or Gini Index in Kidron?
Inequality or Gini Index in Kidron is 0.45.
How Large is the Labor Force in Kidron?
There are 429 People in the Labor Forcein in Kidron.
What is the Percentage of People in the Labor Force in Kidron?
65.2% of People are in the Labor Force in Kidron.
What is the Unemployment Rate in Kidron?
Unemployment Rate in Kidron is 1.2%.