Lucasville, OH
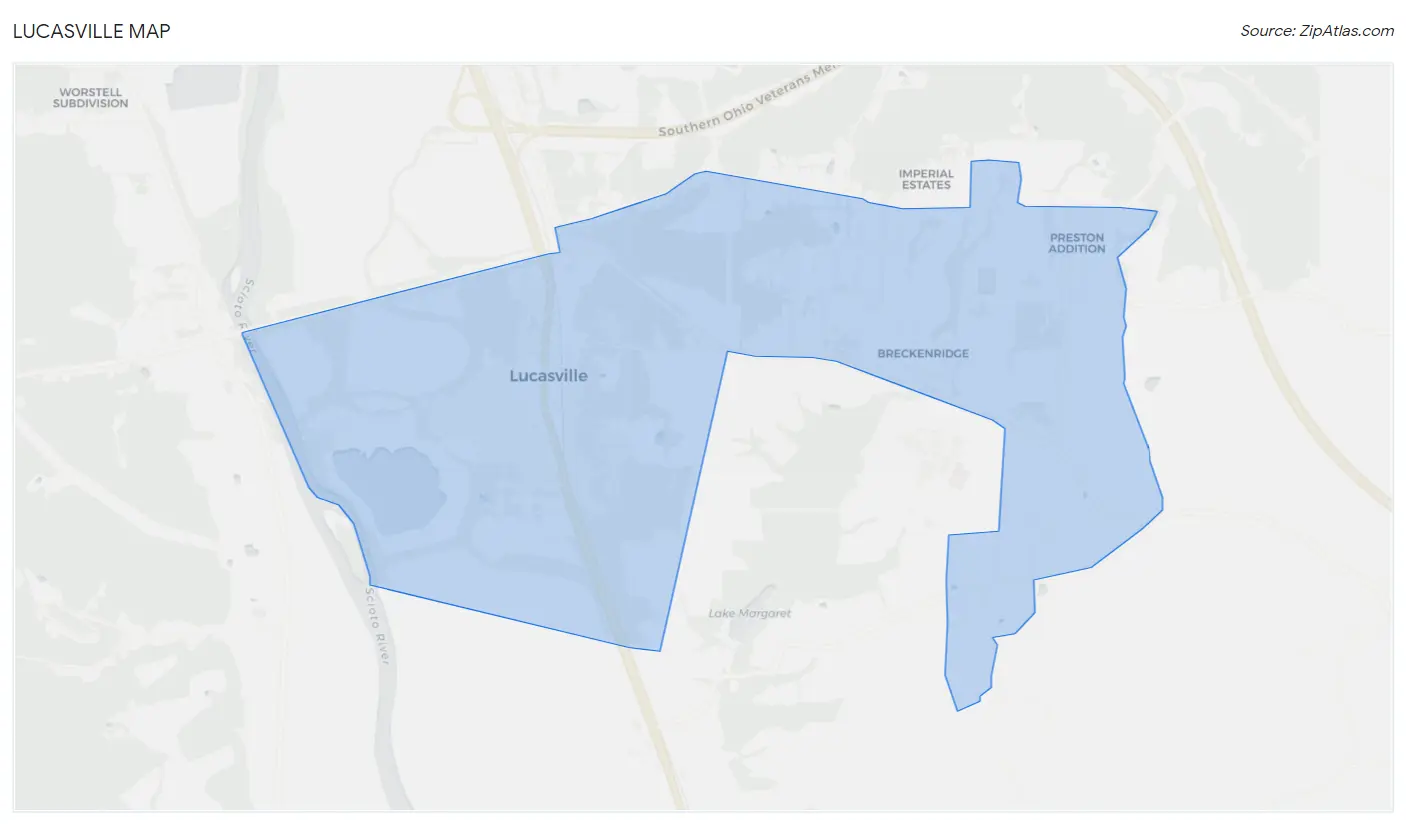
Lucasville Map
Lucasville Overview
1,849
TOTAL POPULATION
984
MALE POPULATION
865
FEMALE POPULATION
113.76
MALES / 100 FEMALES
87.91
FEMALES / 100 MALES
44.9
MEDIAN AGE
3.2
AVG FAMILY SIZE
2.7
AVG HOUSEHOLD SIZE
$32,624
PER CAPITA INCOME
$88,662
AVG FAMILY INCOME
$76,250
AVG HOUSEHOLD INCOME
31.5%
WAGE / INCOME GAP [ % ]
68.5¢/ $1
WAGE / INCOME GAP [ $ ]
0.34
INEQUALITY / GINI INDEX
838
LABOR FORCE [ PEOPLE ]
52.5%
PERCENT IN LABOR FORCE
2.6%
UNEMPLOYMENT RATE
Lucasville Area Codes
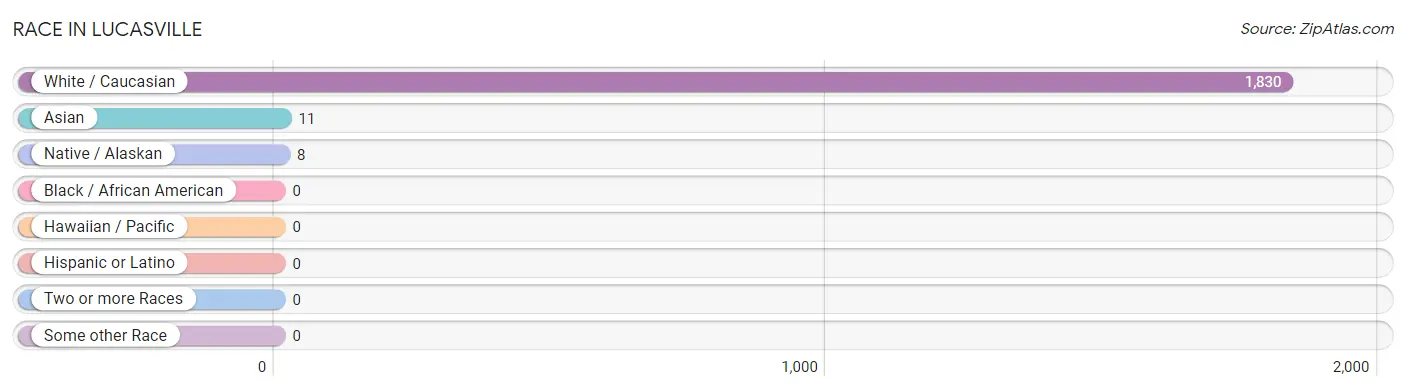
Race in Lucasville
The most populous races in Lucasville are White / Caucasian (1,830 | 99.0%), Asian (11 | 0.6%), and Native / Alaskan (8 | 0.4%).
| Race | # Population | % Population |
| Asian | 11 | 0.6% |
| Black / African American | 0 | 0.0% |
| Hawaiian / Pacific | 0 | 0.0% |
| Hispanic or Latino | 0 | 0.0% |
| Native / Alaskan | 8 | 0.4% |
| White / Caucasian | 1,830 | 99.0% |
| Two or more Races | 0 | 0.0% |
| Some other Race | 0 | 0.0% |
| Total | 1,849 | 100.0% |
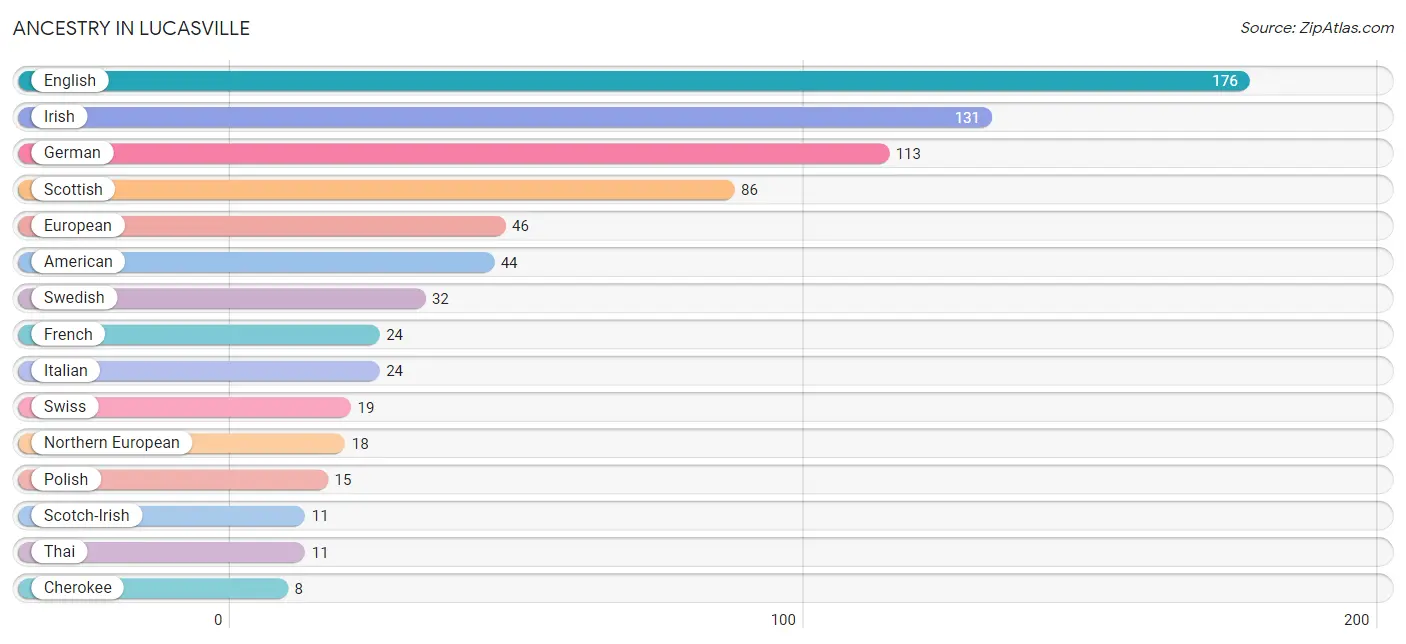
Ancestry in Lucasville
The most populous ancestries reported in Lucasville are English (176 | 9.5%), Irish (131 | 7.1%), German (113 | 6.1%), Scottish (86 | 4.6%), and European (46 | 2.5%), together accounting for 29.8% of all Lucasville residents.
| Ancestry | # Population | % Population |
| American | 44 | 2.4% |
| Cherokee | 8 | 0.4% |
| English | 176 | 9.5% |
| European | 46 | 2.5% |
| French | 24 | 1.3% |
| German | 113 | 6.1% |
| Irish | 131 | 7.1% |
| Italian | 24 | 1.3% |
| Northern European | 18 | 1.0% |
| Polish | 15 | 0.8% |
| Scotch-Irish | 11 | 0.6% |
| Scottish | 86 | 4.6% |
| Swedish | 32 | 1.7% |
| Swiss | 19 | 1.0% |
| Thai | 11 | 0.6% | View All 15 Rows |
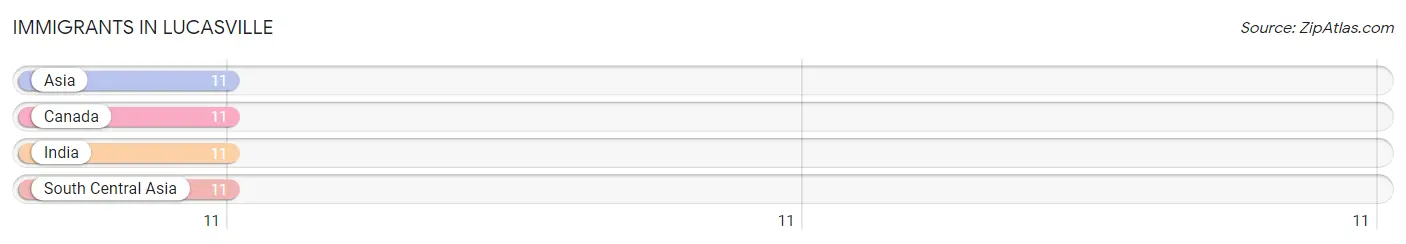
Immigrants in Lucasville
The most numerous immigrant groups reported in Lucasville came from Asia (11 | 0.6%), Canada (11 | 0.6%), India (11 | 0.6%), and South Central Asia (11 | 0.6%), together accounting for 2.4% of all Lucasville residents.
| Immigration Origin | # Population | % Population |
| Asia | 11 | 0.6% |
| Canada | 11 | 0.6% |
| India | 11 | 0.6% |
| South Central Asia | 11 | 0.6% | View All 4 Rows |
Sex and Age in Lucasville
Sex and Age in Lucasville
The most populous age groups in Lucasville are 45 to 49 Years (119 | 12.1%) for men and 75 to 79 Years (107 | 12.4%) for women.
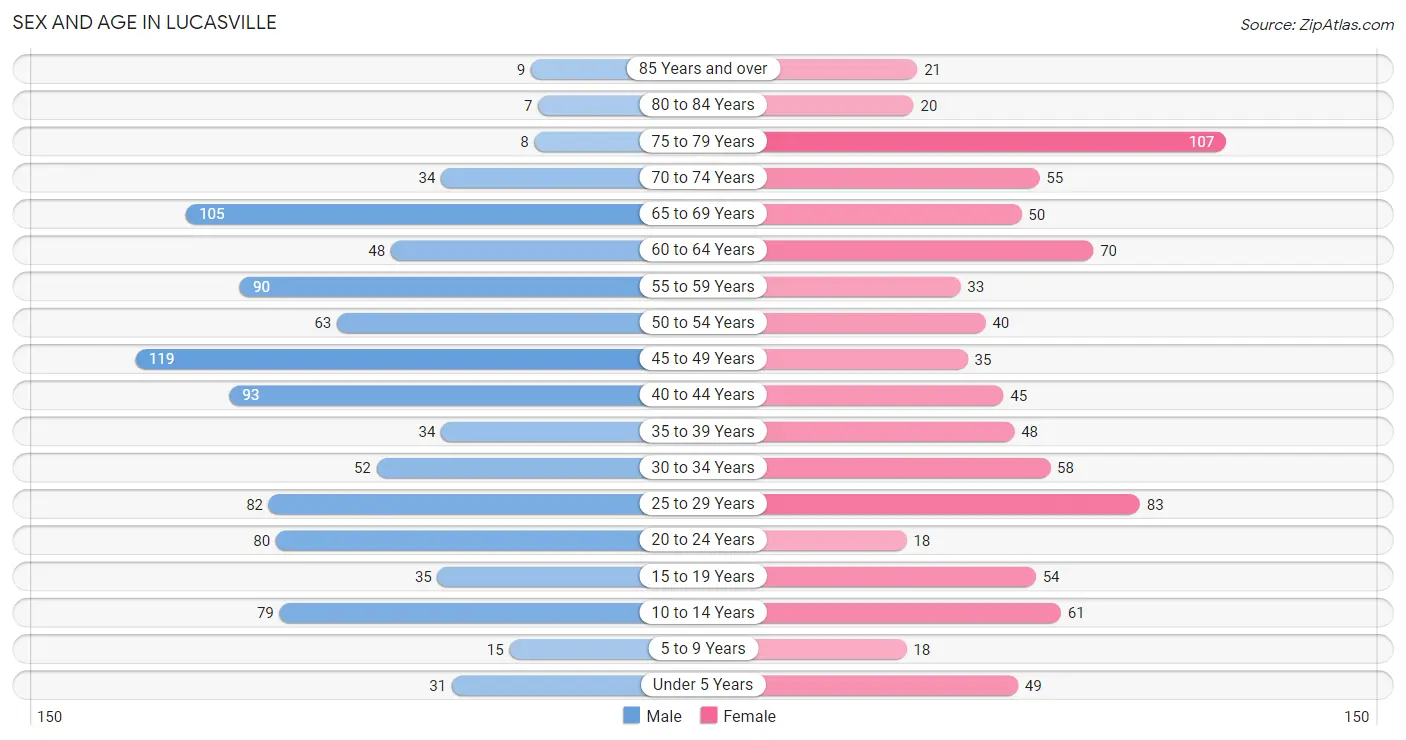
| Age Bracket | Male | Female |
| Under 5 Years | 31 (3.2%) | 49 (5.7%) |
| 5 to 9 Years | 15 (1.5%) | 18 (2.1%) |
| 10 to 14 Years | 79 (8.0%) | 61 (7.0%) |
| 15 to 19 Years | 35 (3.6%) | 54 (6.2%) |
| 20 to 24 Years | 80 (8.1%) | 18 (2.1%) |
| 25 to 29 Years | 82 (8.3%) | 83 (9.6%) |
| 30 to 34 Years | 52 (5.3%) | 58 (6.7%) |
| 35 to 39 Years | 34 (3.5%) | 48 (5.6%) |
| 40 to 44 Years | 93 (9.5%) | 45 (5.2%) |
| 45 to 49 Years | 119 (12.1%) | 35 (4.1%) |
| 50 to 54 Years | 63 (6.4%) | 40 (4.6%) |
| 55 to 59 Years | 90 (9.1%) | 33 (3.8%) |
| 60 to 64 Years | 48 (4.9%) | 70 (8.1%) |
| 65 to 69 Years | 105 (10.7%) | 50 (5.8%) |
| 70 to 74 Years | 34 (3.5%) | 55 (6.4%) |
| 75 to 79 Years | 8 (0.8%) | 107 (12.4%) |
| 80 to 84 Years | 7 (0.7%) | 20 (2.3%) |
| 85 Years and over | 9 (0.9%) | 21 (2.4%) |
| Total | 984 (100.0%) | 865 (100.0%) |
Families and Households in Lucasville
Median Family Size in Lucasville
The median family size in Lucasville is 3.22 persons per family, with married-couple families (347 | 71.7%) accounting for the largest median family size of 3.33 persons per family. On the other hand, single male/father families (107 | 22.1%) represent the smallest median family size with 2.84 persons per family.
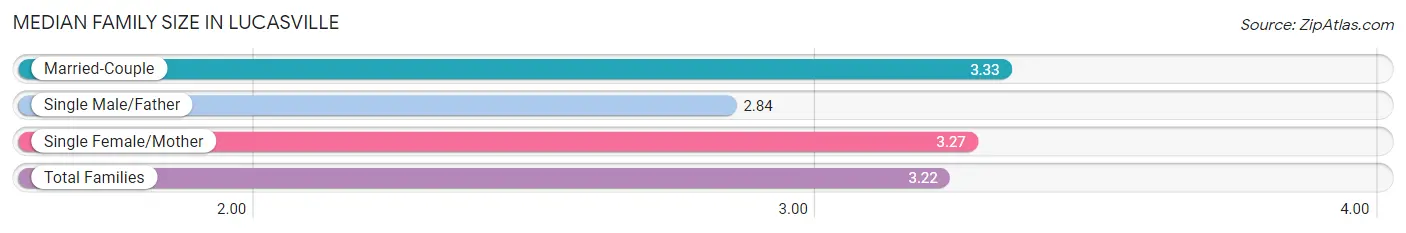
| Family Type | # Families | Family Size |
| Married-Couple | 347 (71.7%) | 3.33 |
| Single Male/Father | 107 (22.1%) | 2.84 |
| Single Female/Mother | 30 (6.2%) | 3.27 |
| Total Families | 484 (100.0%) | 3.22 |
Median Household Size in Lucasville
The median household size in Lucasville is 2.67 persons per household, with single female/mother households (30 | 4.3%) accounting for the largest median household size of 3.53 persons per household. non-family households (208 | 30.1%) represent the smallest median household size with 1.33 persons per household.
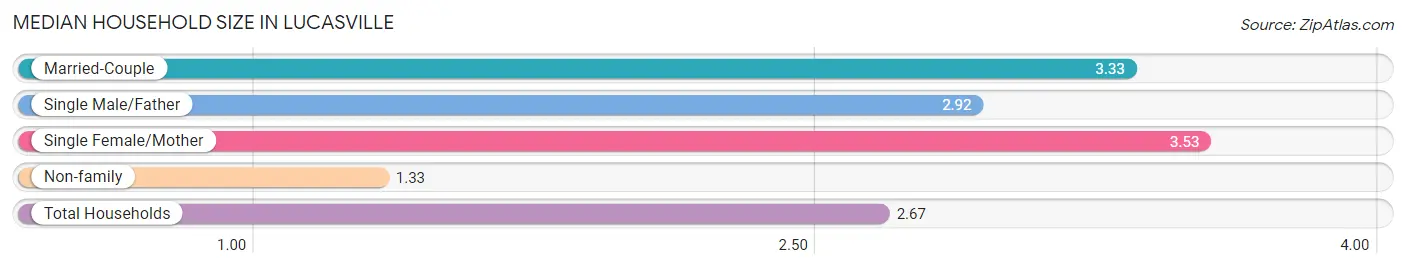
| Household Type | # Households | Household Size |
| Married-Couple | 347 (50.1%) | 3.33 |
| Single Male/Father | 107 (15.5%) | 2.92 |
| Single Female/Mother | 30 (4.3%) | 3.53 |
| Non-family | 208 (30.1%) | 1.33 |
| Total Households | 692 (100.0%) | 2.67 |
Household Size by Marriage Status in Lucasville
Out of a total of 692 households in Lucasville, 484 (69.9%) are family households, while 208 (30.1%) are nonfamily households. The most numerous type of family households are 3-person households, comprising 194, and the most common type of nonfamily households are 1-person households, comprising 150.
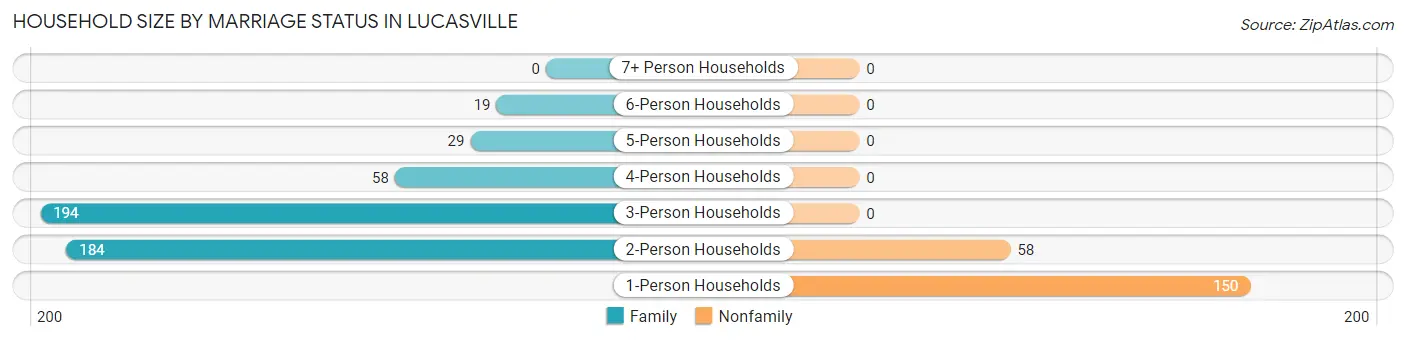
| Household Size | Family Households | Nonfamily Households |
| 1-Person Households | - | 150 (21.7%) |
| 2-Person Households | 184 (26.6%) | 58 (8.4%) |
| 3-Person Households | 194 (28.0%) | 0 (0.0%) |
| 4-Person Households | 58 (8.4%) | 0 (0.0%) |
| 5-Person Households | 29 (4.2%) | 0 (0.0%) |
| 6-Person Households | 19 (2.8%) | 0 (0.0%) |
| 7+ Person Households | 0 (0.0%) | 0 (0.0%) |
| Total | 484 (69.9%) | 208 (30.1%) |
Female Fertility in Lucasville
Fertility by Age in Lucasville
Average fertility rate in Lucasville is 34.0 births per 1,000 women. Women in the age bracket of 20 to 34 years have the highest fertility rate with 75.0 births per 1,000 women. Women in the age bracket of 20 to 34 years acount for 100.0% of all women with births.
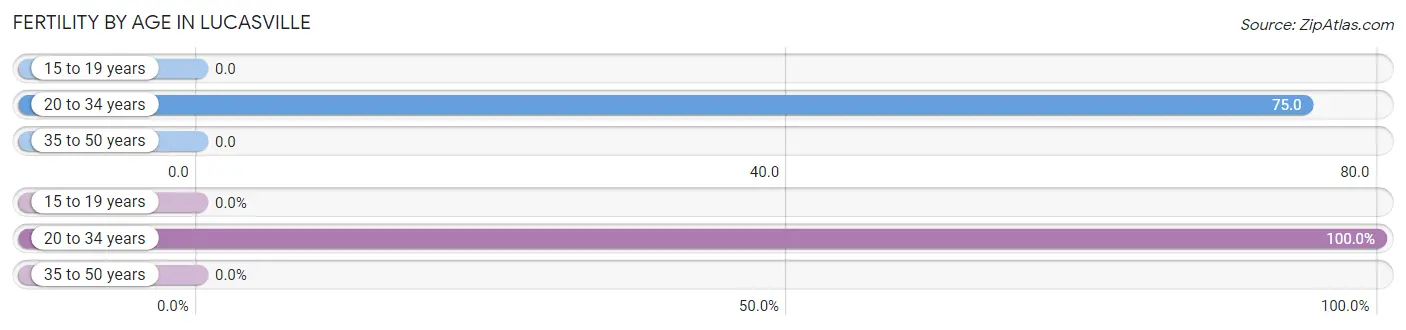
| Age Bracket | Women with Births | Births / 1,000 Women |
| 15 to 19 years | 0 (0.0%) | 0.0 |
| 20 to 34 years | 12 (100.0%) | 75.0 |
| 35 to 50 years | 0 (0.0%) | 0.0 |
| Total | 12 (100.0%) | 34.0 |
Fertility by Age by Marriage Status in Lucasville

| Age Bracket | Married | Unmarried |
| 15 to 19 years | 0 (0.0%) | 0 (0.0%) |
| 20 to 34 years | 0 (0.0%) | 12 (100.0%) |
| 35 to 50 years | 0 (0.0%) | 0 (0.0%) |
| Total | 0 (0.0%) | 12 (100.0%) |
Fertility by Education in Lucasville
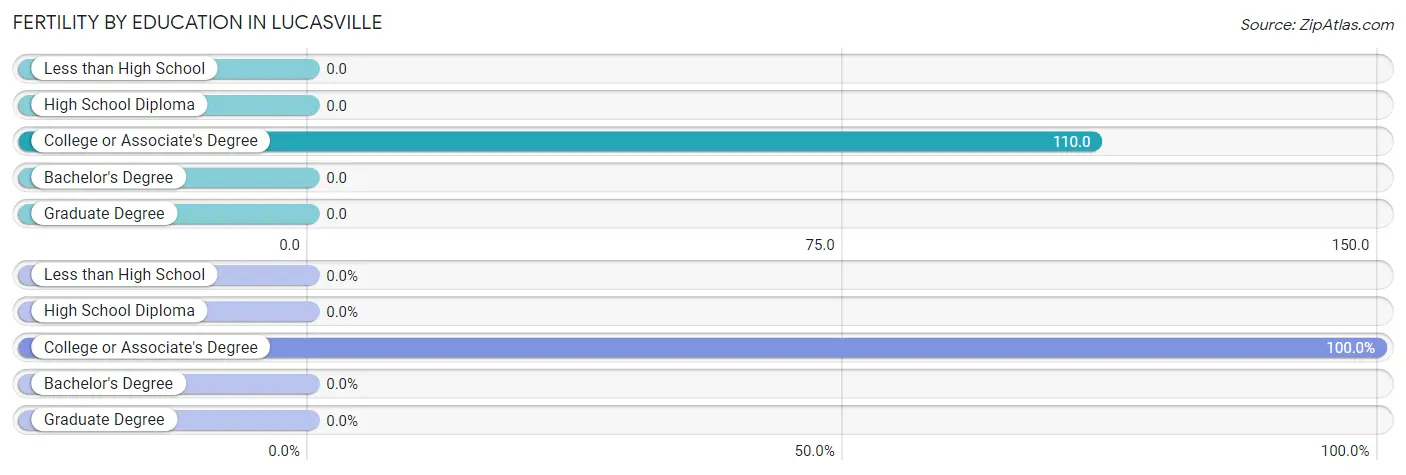
| Educational Attainment | Women with Births | Births / 1,000 Women |
| Less than High School | 0 (0.0%) | 0.0 |
| High School Diploma | 0 (0.0%) | 0.0 |
| College or Associate's Degree | 12 (100.0%) | 110.0 |
| Bachelor's Degree | 0 (0.0%) | 0.0 |
| Graduate Degree | 0 (0.0%) | 0.0 |
| Total | 12 (100.0%) | 34.0 |
Fertility by Education by Marriage Status in Lucasville
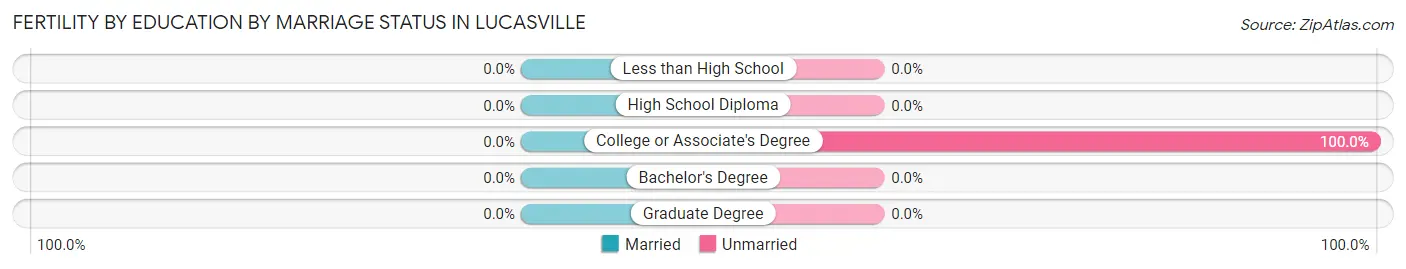
| Educational Attainment | Married | Unmarried |
| Less than High School | 0 (0.0%) | 0 (0.0%) |
| High School Diploma | 0 (0.0%) | 0 (0.0%) |
| College or Associate's Degree | 0 (0.0%) | 12 (100.0%) |
| Bachelor's Degree | 0 (0.0%) | 0 (0.0%) |
| Graduate Degree | 0 (0.0%) | 0 (0.0%) |
| Total | 0 (0.0%) | 12 (100.0%) |
Income in Lucasville
Income Overview in Lucasville
Per Capita Income in Lucasville is $32,624, while median incomes of families and households are $88,662 and $76,250 respectively.
| Characteristic | Number | Measure |
| Per Capita Income | 1,849 | $32,624 |
| Median Family Income | 484 | $88,662 |
| Mean Family Income | 484 | $87,467 |
| Median Household Income | 692 | $76,250 |
| Mean Household Income | 692 | $80,868 |
| Income Deficit | 484 | $0 |
| Wage / Income Gap (%) | 1,849 | 31.51% |
| Wage / Income Gap ($) | 1,849 | 68.49¢ per $1 |
| Gini / Inequality Index | 1,849 | 0.34 |
Earnings by Sex in Lucasville
Average Earnings in Lucasville are $50,000, $61,644 for men and $42,218 for women, a difference of 31.5%.

| Sex | Number | Average Earnings |
| Male | 501 (57.1%) | $61,644 |
| Female | 377 (42.9%) | $42,218 |
| Total | 878 (100.0%) | $50,000 |
Earnings by Sex by Income Bracket in Lucasville
The most common earnings brackets in Lucasville are $75,000 to $99,999 for men (78 | 15.6%) and $65,000 to $74,999 for women (53 | 14.1%).
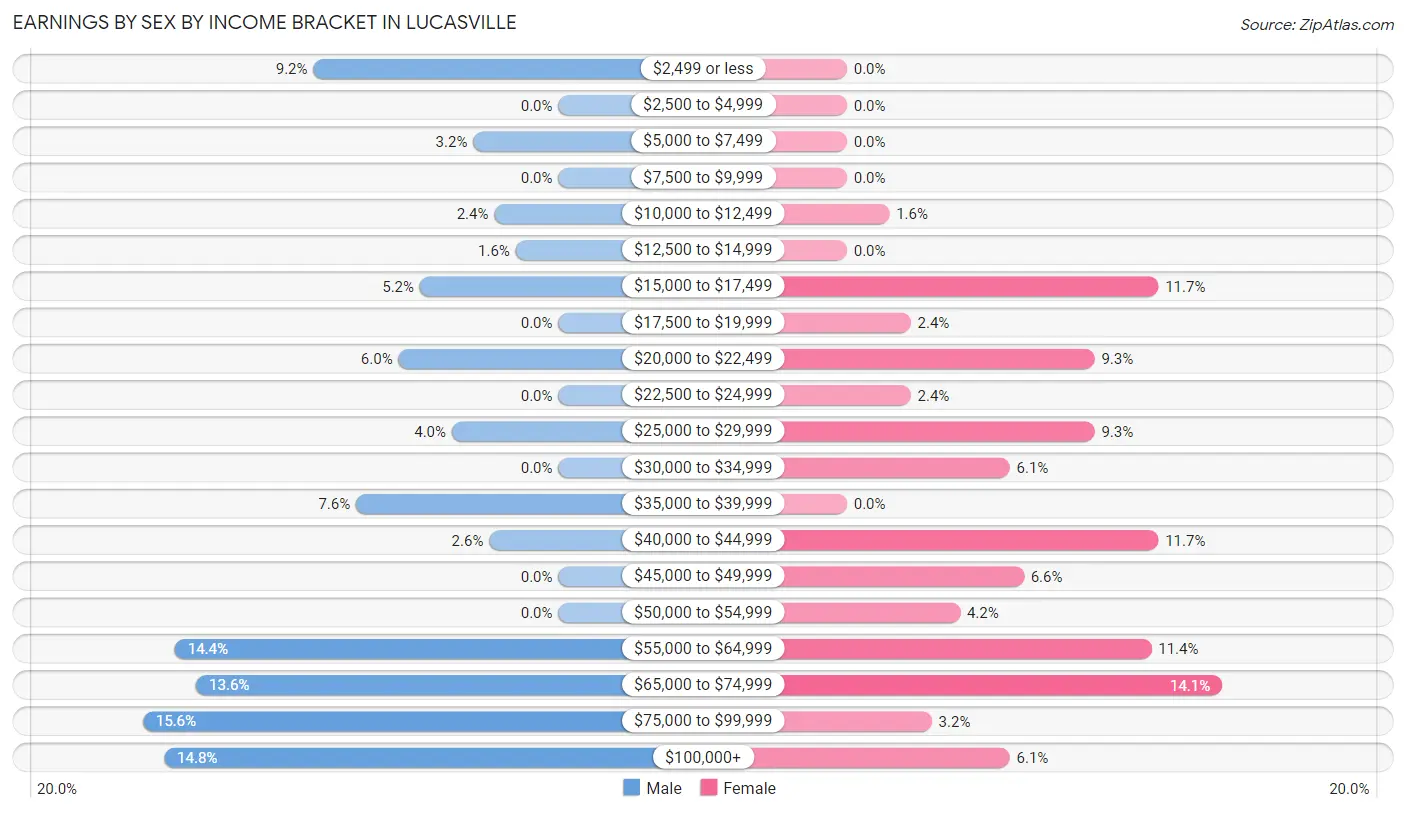
| Income | Male | Female |
| $2,499 or less | 46 (9.2%) | 0 (0.0%) |
| $2,500 to $4,999 | 0 (0.0%) | 0 (0.0%) |
| $5,000 to $7,499 | 16 (3.2%) | 0 (0.0%) |
| $7,500 to $9,999 | 0 (0.0%) | 0 (0.0%) |
| $10,000 to $12,499 | 12 (2.4%) | 6 (1.6%) |
| $12,500 to $14,999 | 8 (1.6%) | 0 (0.0%) |
| $15,000 to $17,499 | 26 (5.2%) | 44 (11.7%) |
| $17,500 to $19,999 | 0 (0.0%) | 9 (2.4%) |
| $20,000 to $22,499 | 30 (6.0%) | 35 (9.3%) |
| $22,500 to $24,999 | 0 (0.0%) | 9 (2.4%) |
| $25,000 to $29,999 | 20 (4.0%) | 35 (9.3%) |
| $30,000 to $34,999 | 0 (0.0%) | 23 (6.1%) |
| $35,000 to $39,999 | 38 (7.6%) | 0 (0.0%) |
| $40,000 to $44,999 | 13 (2.6%) | 44 (11.7%) |
| $45,000 to $49,999 | 0 (0.0%) | 25 (6.6%) |
| $50,000 to $54,999 | 0 (0.0%) | 16 (4.2%) |
| $55,000 to $64,999 | 72 (14.4%) | 43 (11.4%) |
| $65,000 to $74,999 | 68 (13.6%) | 53 (14.1%) |
| $75,000 to $99,999 | 78 (15.6%) | 12 (3.2%) |
| $100,000+ | 74 (14.8%) | 23 (6.1%) |
| Total | 501 (100.0%) | 377 (100.0%) |
Earnings by Sex by Educational Attainment in Lucasville
Average earnings in Lucasville are $62,708 for men and $43,558 for women, a difference of 30.5%. Men with an educational attainment of bachelor's degree enjoy the highest average annual earnings of $93,059, while those with graduate degree education earn the least with $76,932. Women with an educational attainment of bachelor's degree earn the most with the average annual earnings of $73,750, while those with high school diploma education have the smallest earnings of $21,821.
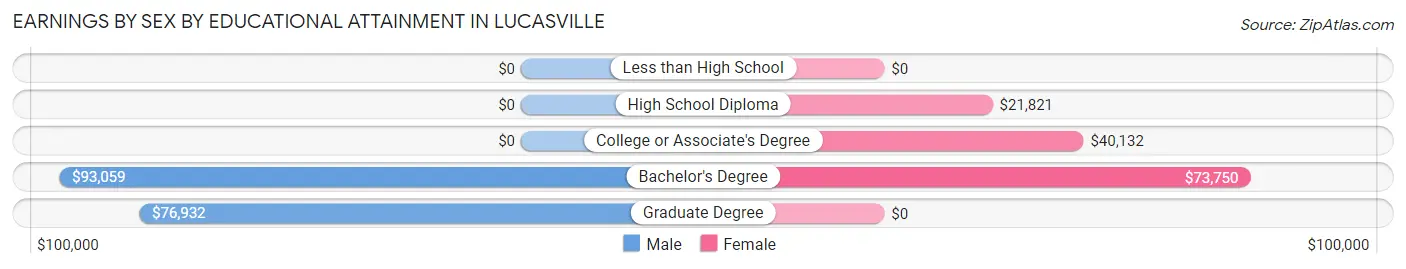
| Educational Attainment | Male Income | Female Income |
| Less than High School | - | - |
| High School Diploma | - | - |
| College or Associate's Degree | - | - |
| Bachelor's Degree | $93,059 | $73,750 |
| Graduate Degree | $76,932 | $0 |
| Total | $62,708 | $43,558 |
Family Income in Lucasville
Family Income Brackets in Lucasville
According to the Lucasville family income data, there are 112 families falling into the $75,000 to $99,999 income range, which is the most common income bracket and makes up 23.1% of all families.
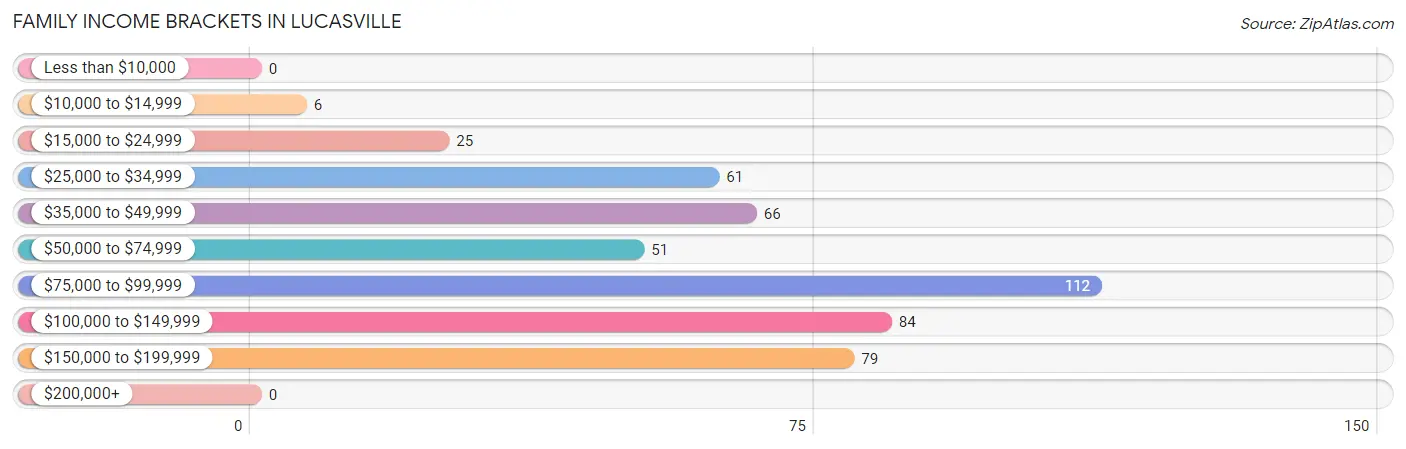
| Income Bracket | # Families | % Families |
| Less than $10,000 | 0 | 0.0% |
| $10,000 to $14,999 | 6 | 1.2% |
| $15,000 to $24,999 | 25 | 5.2% |
| $25,000 to $34,999 | 61 | 12.6% |
| $35,000 to $49,999 | 66 | 13.6% |
| $50,000 to $74,999 | 51 | 10.5% |
| $75,000 to $99,999 | 112 | 23.1% |
| $100,000 to $149,999 | 84 | 17.4% |
| $150,000 to $199,999 | 79 | 16.3% |
| $200,000+ | 0 | 0.0% |
Family Income by Famaliy Size in Lucasville
4-person families (64 | 13.2%) account for the highest median family income in Lucasville with $126,944 per family, while 2-person families (192 | 39.7%) have the highest median income of $44,310 per family member.
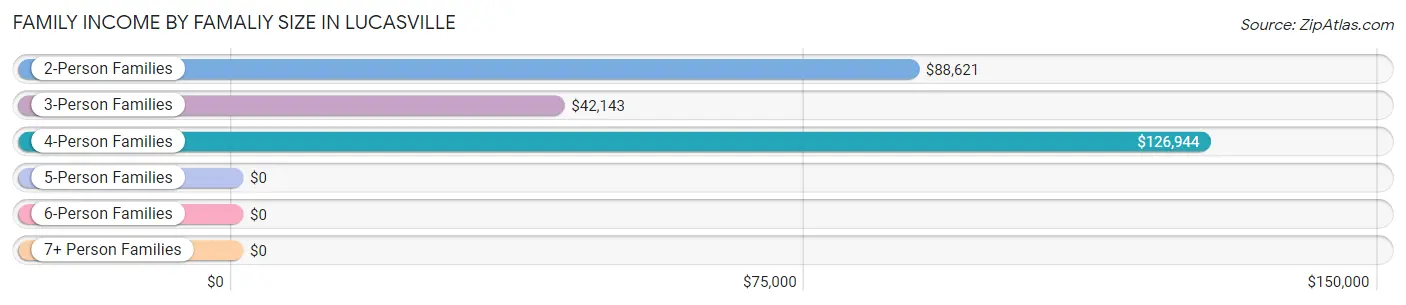
| Income Bracket | # Families | Median Income |
| 2-Person Families | 192 (39.7%) | $88,621 |
| 3-Person Families | 186 (38.4%) | $42,143 |
| 4-Person Families | 64 (13.2%) | $126,944 |
| 5-Person Families | 23 (4.8%) | $0 |
| 6-Person Families | 19 (3.9%) | $0 |
| 7+ Person Families | 0 (0.0%) | $0 |
| Total | 484 (100.0%) | $88,662 |
Family Income by Number of Earners in Lucasville
The median family income in Lucasville is $88,662, with families comprising 2 earners (202) having the highest median family income of $115,921, while families with no earners (117) have the lowest median family income of $33,615, accounting for 41.7% and 24.2% of families, respectively.
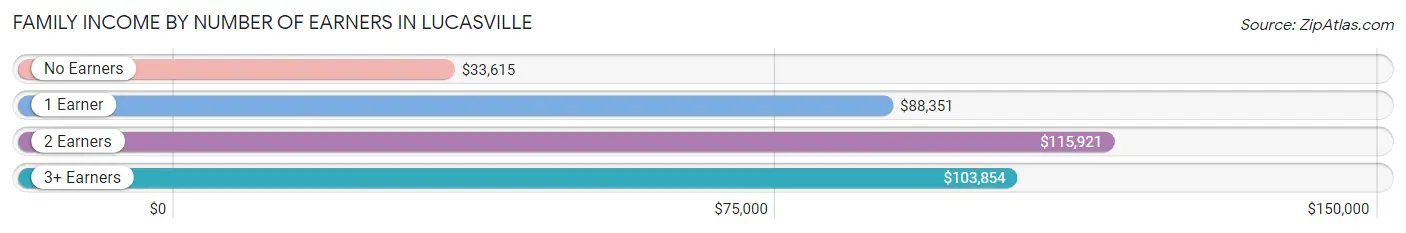
| Number of Earners | # Families | Median Income |
| No Earners | 117 (24.2%) | $33,615 |
| 1 Earner | 136 (28.1%) | $88,351 |
| 2 Earners | 202 (41.7%) | $115,921 |
| 3+ Earners | 29 (6.0%) | $103,854 |
| Total | 484 (100.0%) | $88,662 |
Household Income in Lucasville
Household Income Brackets in Lucasville
With 142 households falling in the category, the $100,000 to $149,999 income range is the most frequent in Lucasville, accounting for 20.5% of all households.
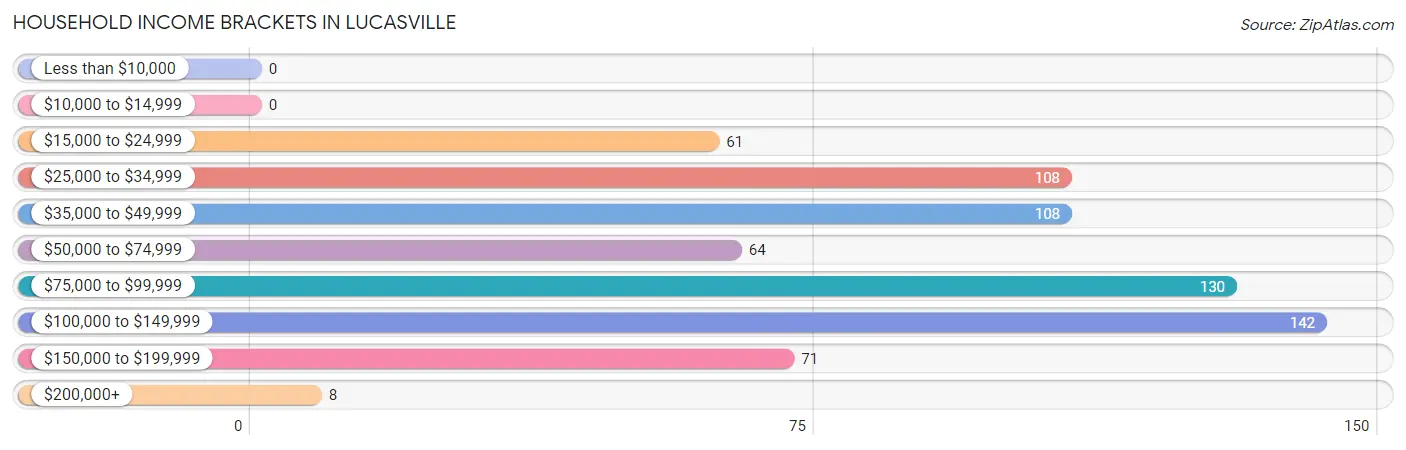
| Income Bracket | # Households | % Households |
| Less than $10,000 | 0 | 0.0% |
| $10,000 to $14,999 | 0 | 0.0% |
| $15,000 to $24,999 | 61 | 8.8% |
| $25,000 to $34,999 | 108 | 15.6% |
| $35,000 to $49,999 | 108 | 15.6% |
| $50,000 to $74,999 | 64 | 9.2% |
| $75,000 to $99,999 | 130 | 18.8% |
| $100,000 to $149,999 | 142 | 20.5% |
| $150,000 to $199,999 | 71 | 10.3% |
| $200,000+ | 8 | 1.2% |
Household Income by Householder Age in Lucasville
The median household income in Lucasville is $76,250, with the highest median household income of $95,625 found in the 45 to 64 years age bracket for the primary householder. A total of 169 households (24.4%) fall into this category. Meanwhile, the 15 to 24 years age bracket for the primary householder has the lowest median household income of $0, with 13 households (1.9%) in this group.
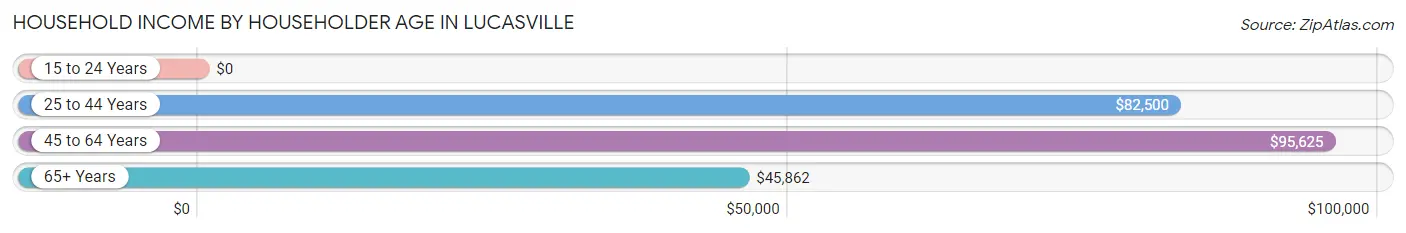
| Income Bracket | # Households | Median Income |
| 15 to 24 Years | 13 (1.9%) | $0 |
| 25 to 44 Years | 256 (37.0%) | $82,500 |
| 45 to 64 Years | 169 (24.4%) | $95,625 |
| 65+ Years | 254 (36.7%) | $45,862 |
| Total | 692 (100.0%) | $76,250 |
Poverty in Lucasville
Income Below Poverty by Sex and Age in Lucasville
With 8.5% poverty level for males and 4.4% for females among the residents of Lucasville, 6 to 11 year old males and 18 to 24 year old females are the most vulnerable to poverty, with 15 males (31.2%) and 6 females (33.3%) in their respective age groups living below the poverty level.
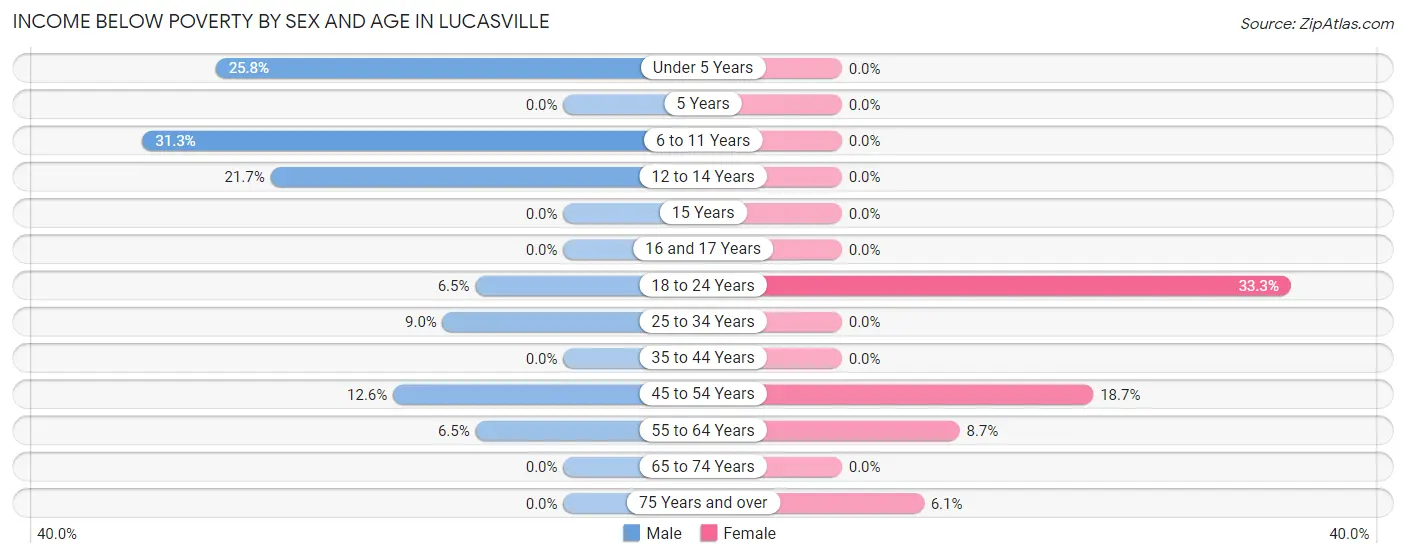
| Age Bracket | Male | Female |
| Under 5 Years | 8 (25.8%) | 0 (0.0%) |
| 5 Years | 0 (0.0%) | 0 (0.0%) |
| 6 to 11 Years | 15 (31.2%) | 0 (0.0%) |
| 12 to 14 Years | 10 (21.7%) | 0 (0.0%) |
| 15 Years | 0 (0.0%) | 0 (0.0%) |
| 16 and 17 Years | 0 (0.0%) | 0 (0.0%) |
| 18 to 24 Years | 7 (6.5%) | 6 (33.3%) |
| 25 to 34 Years | 12 (9.0%) | 0 (0.0%) |
| 35 to 44 Years | 0 (0.0%) | 0 (0.0%) |
| 45 to 54 Years | 23 (12.6%) | 14 (18.7%) |
| 55 to 64 Years | 9 (6.5%) | 9 (8.7%) |
| 65 to 74 Years | 0 (0.0%) | 0 (0.0%) |
| 75 Years and over | 0 (0.0%) | 9 (6.1%) |
| Total | 84 (8.5%) | 38 (4.4%) |
Income Above Poverty by Sex and Age in Lucasville
According to the poverty statistics in Lucasville, males aged 16 and 17 years and females aged under 5 years are the age groups that are most secure financially, with 100.0% of males and 100.0% of females in these age groups living above the poverty line.
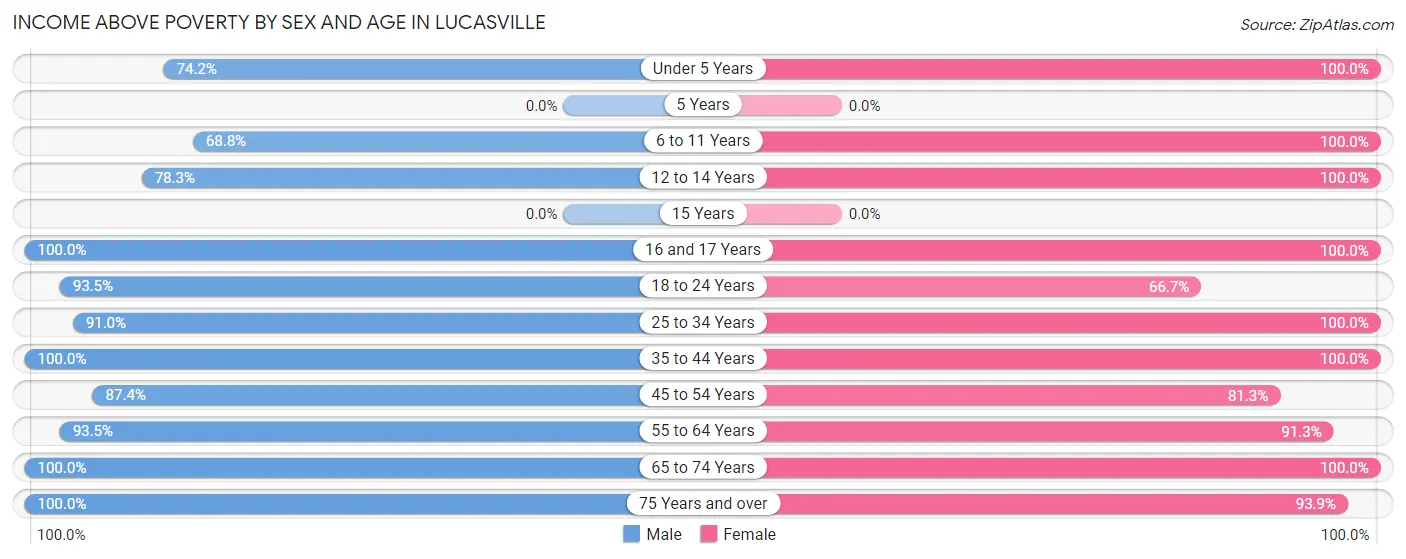
| Age Bracket | Male | Female |
| Under 5 Years | 23 (74.2%) | 49 (100.0%) |
| 5 Years | 0 (0.0%) | 0 (0.0%) |
| 6 to 11 Years | 33 (68.8%) | 61 (100.0%) |
| 12 to 14 Years | 36 (78.3%) | 18 (100.0%) |
| 15 Years | 0 (0.0%) | 0 (0.0%) |
| 16 and 17 Years | 8 (100.0%) | 54 (100.0%) |
| 18 to 24 Years | 100 (93.5%) | 12 (66.7%) |
| 25 to 34 Years | 122 (91.0%) | 141 (100.0%) |
| 35 to 44 Years | 127 (100.0%) | 93 (100.0%) |
| 45 to 54 Years | 159 (87.4%) | 61 (81.3%) |
| 55 to 64 Years | 129 (93.5%) | 94 (91.3%) |
| 65 to 74 Years | 139 (100.0%) | 105 (100.0%) |
| 75 Years and over | 24 (100.0%) | 139 (93.9%) |
| Total | 900 (91.5%) | 827 (95.6%) |
Income Below Poverty Among Married-Couple Families in Lucasville
The poverty statistics for married-couple families in Lucasville show that 2.6% or 9 of the total 347 families live below the poverty line. Families with no children have the highest poverty rate of 5.6%, comprising of 9 families. On the other hand, families with 1 or 2 children have the lowest poverty rate of 0.0%, which includes 0 families.
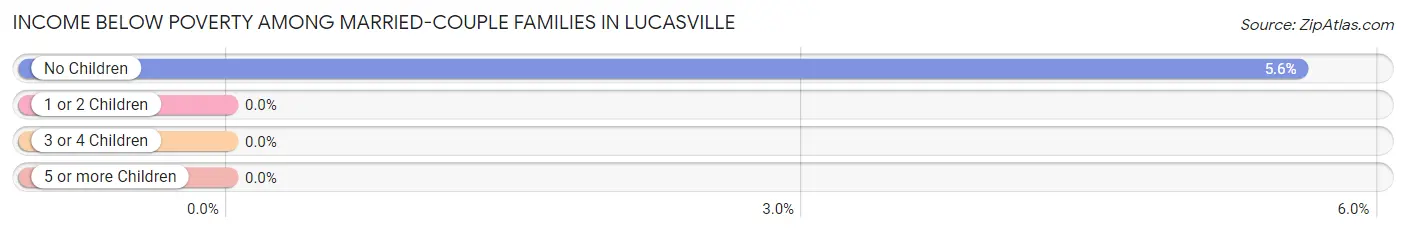
| Children | Above Poverty | Below Poverty |
| No Children | 152 (94.4%) | 9 (5.6%) |
| 1 or 2 Children | 175 (100.0%) | 0 (0.0%) |
| 3 or 4 Children | 11 (100.0%) | 0 (0.0%) |
| 5 or more Children | 0 (0.0%) | 0 (0.0%) |
| Total | 338 (97.4%) | 9 (2.6%) |
Income Below Poverty Among Single-Parent Households in Lucasville
According to the poverty data in Lucasville, 6.5% or 7 single-father households and 50.0% or 15 single-mother households are living below the poverty line. Among single-father households, those with no children have the highest poverty rate, with 7 households (6.5%) experiencing poverty. Likewise, among single-mother households, those with 3 or 4 children have the highest poverty rate, with 6 households (100.0%) falling below the poverty line.
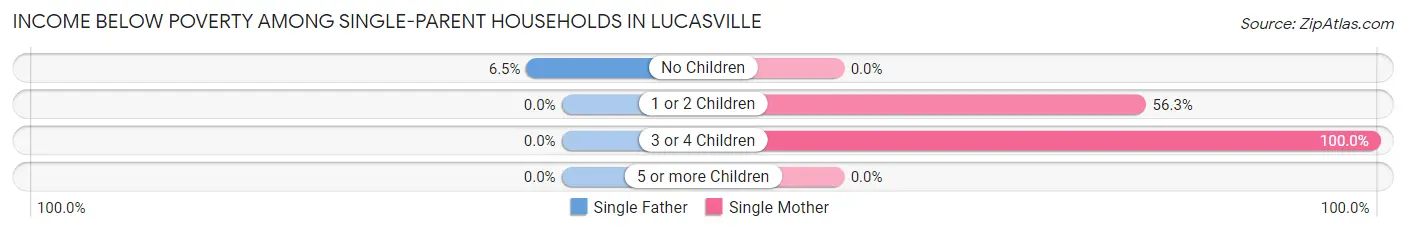
| Children | Single Father | Single Mother |
| No Children | 7 (6.5%) | 0 (0.0%) |
| 1 or 2 Children | 0 (0.0%) | 9 (56.2%) |
| 3 or 4 Children | 0 (0.0%) | 6 (100.0%) |
| 5 or more Children | 0 (0.0%) | 0 (0.0%) |
| Total | 7 (6.5%) | 15 (50.0%) |
Income Below Poverty Among Married-Couple vs Single-Parent Households in Lucasville
The poverty data for Lucasville shows that 9 of the married-couple family households (2.6%) and 22 of the single-parent households (16.1%) are living below the poverty level. Within the married-couple family households, those with no children have the highest poverty rate, with 9 households (5.6%) falling below the poverty line. Among the single-parent households, those with 3 or 4 children have the highest poverty rate, with 6 household (100.0%) living below poverty.
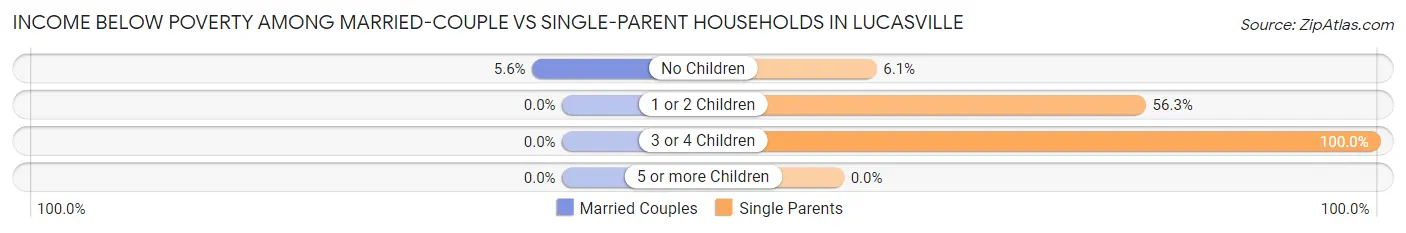
| Children | Married-Couple Families | Single-Parent Households |
| No Children | 9 (5.6%) | 7 (6.1%) |
| 1 or 2 Children | 0 (0.0%) | 9 (56.2%) |
| 3 or 4 Children | 0 (0.0%) | 6 (100.0%) |
| 5 or more Children | 0 (0.0%) | 0 (0.0%) |
| Total | 9 (2.6%) | 22 (16.1%) |
Employment Characteristics in Lucasville
Employment by Class of Employer in Lucasville
Among the 816 employed individuals in Lucasville, private company employees (492 | 60.3%), local government employees (128 | 15.7%), and not-for-profit organizations (100 | 12.2%) make up the most common classes of employment.
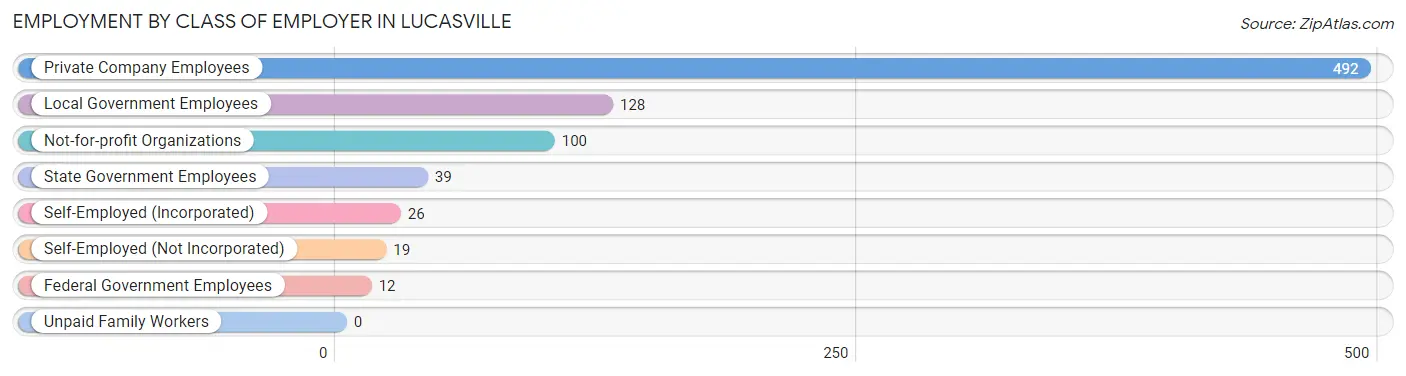
| Employer Class | # Employees | % Employees |
| Private Company Employees | 492 | 60.3% |
| Self-Employed (Incorporated) | 26 | 3.2% |
| Self-Employed (Not Incorporated) | 19 | 2.3% |
| Not-for-profit Organizations | 100 | 12.2% |
| Local Government Employees | 128 | 15.7% |
| State Government Employees | 39 | 4.8% |
| Federal Government Employees | 12 | 1.5% |
| Unpaid Family Workers | 0 | 0.0% |
| Total | 816 | 100.0% |
Employment Status by Age in Lucasville
According to the labor force statistics for Lucasville, out of the total population over 16 years of age (1,596), 52.5% or 838 individuals are in the labor force, with 2.6% or 22 of them unemployed. The age group with the highest labor force participation rate is 25 to 29 years, with 90.9% or 150 individuals in the labor force. Within the labor force, the 16 to 19 years age range has the highest percentage of unemployed individuals, with 100.0% or 8 of them being unemployed.
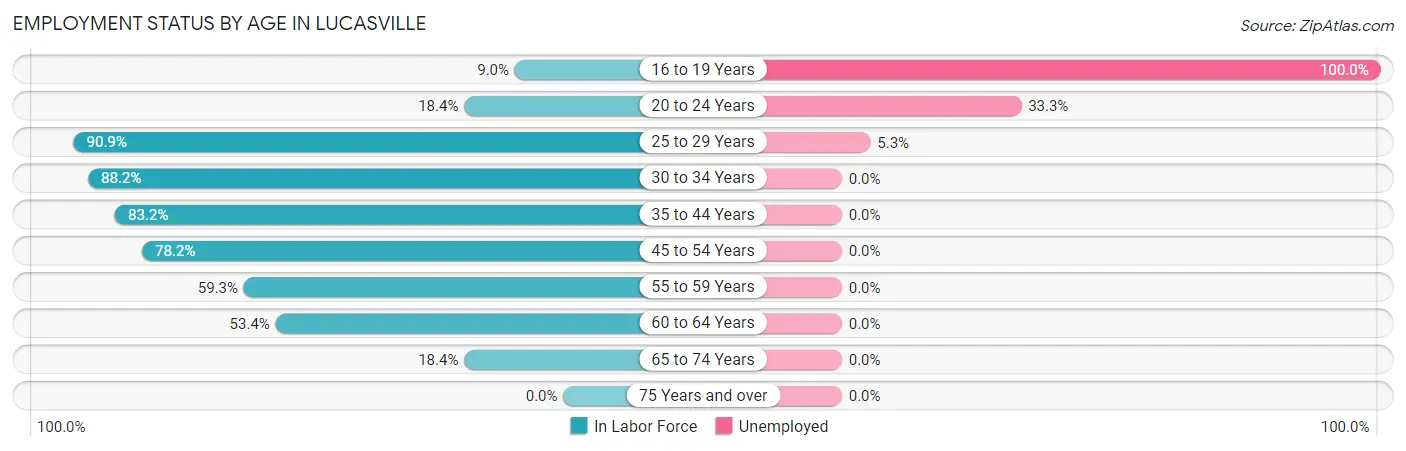
| Age Bracket | In Labor Force | Unemployed |
| 16 to 19 Years | 8 (9.0%) | 8 (100.0%) |
| 20 to 24 Years | 18 (18.4%) | 6 (33.3%) |
| 25 to 29 Years | 150 (90.9%) | 8 (5.3%) |
| 30 to 34 Years | 97 (88.2%) | 0 (0.0%) |
| 35 to 44 Years | 183 (83.2%) | 0 (0.0%) |
| 45 to 54 Years | 201 (78.2%) | 0 (0.0%) |
| 55 to 59 Years | 73 (59.3%) | 0 (0.0%) |
| 60 to 64 Years | 63 (53.4%) | 0 (0.0%) |
| 65 to 74 Years | 45 (18.4%) | 0 (0.0%) |
| 75 Years and over | 0 (0.0%) | 0 (0.0%) |
| Total | 838 (52.5%) | 22 (2.6%) |
Employment Status by Educational Attainment in Lucasville
According to labor force statistics for Lucasville, 77.2% of individuals (767) out of the total population between 25 and 64 years of age (993) are in the labor force, with 1.0% or 8 of them being unemployed. The group with the highest labor force participation rate are those with the educational attainment of high school diploma, with 91.3% or 242 individuals in the labor force. Within the labor force, individuals with less than high school education have the highest percentage of unemployment, with 26.7% or 8 of them being unemployed.

| Educational Attainment | In Labor Force | Unemployed |
| Less than High School | 30 (19.9%) | 40 (26.7%) |
| High School Diploma | 242 (91.3%) | 0 (0.0%) |
| College / Associate Degree | 177 (86.8%) | 0 (0.0%) |
| Bachelor's Degree or higher | 318 (85.3%) | 0 (0.0%) |
| Total | 767 (77.2%) | 10 (1.0%) |
Employment Occupations by Sex in Lucasville
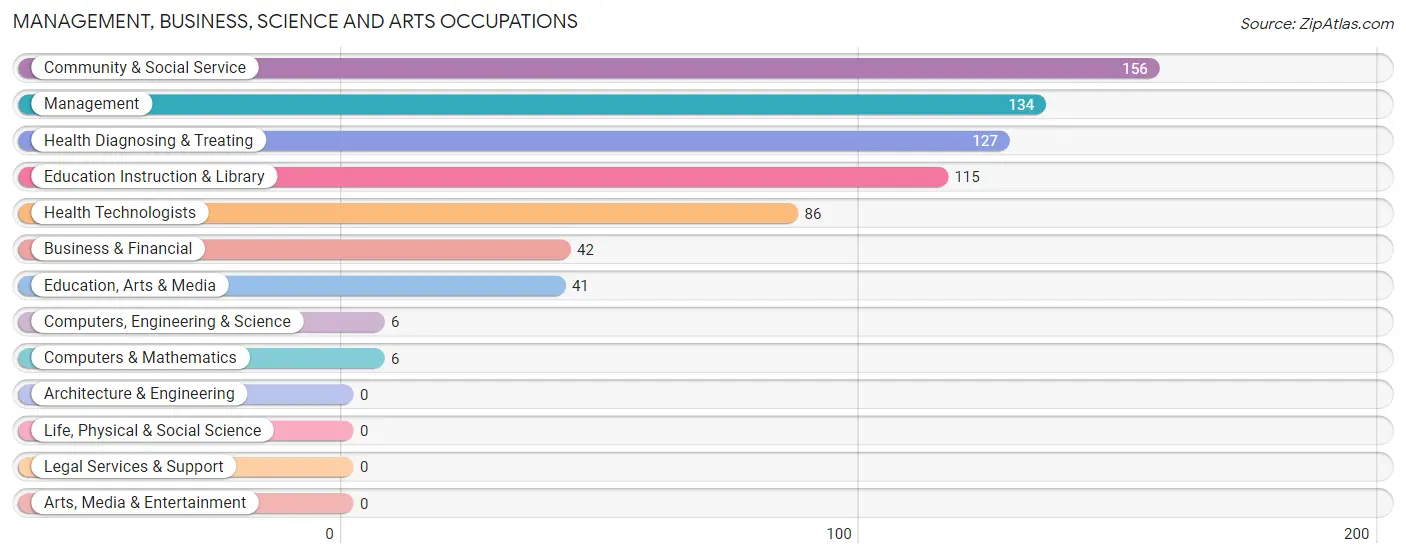
Management, Business, Science and Arts Occupations
The most common Management, Business, Science and Arts occupations in Lucasville are Community & Social Service (156 | 19.1%), Management (134 | 16.4%), Health Diagnosing & Treating (127 | 15.6%), Education Instruction & Library (115 | 14.1%), and Health Technologists (86 | 10.5%).
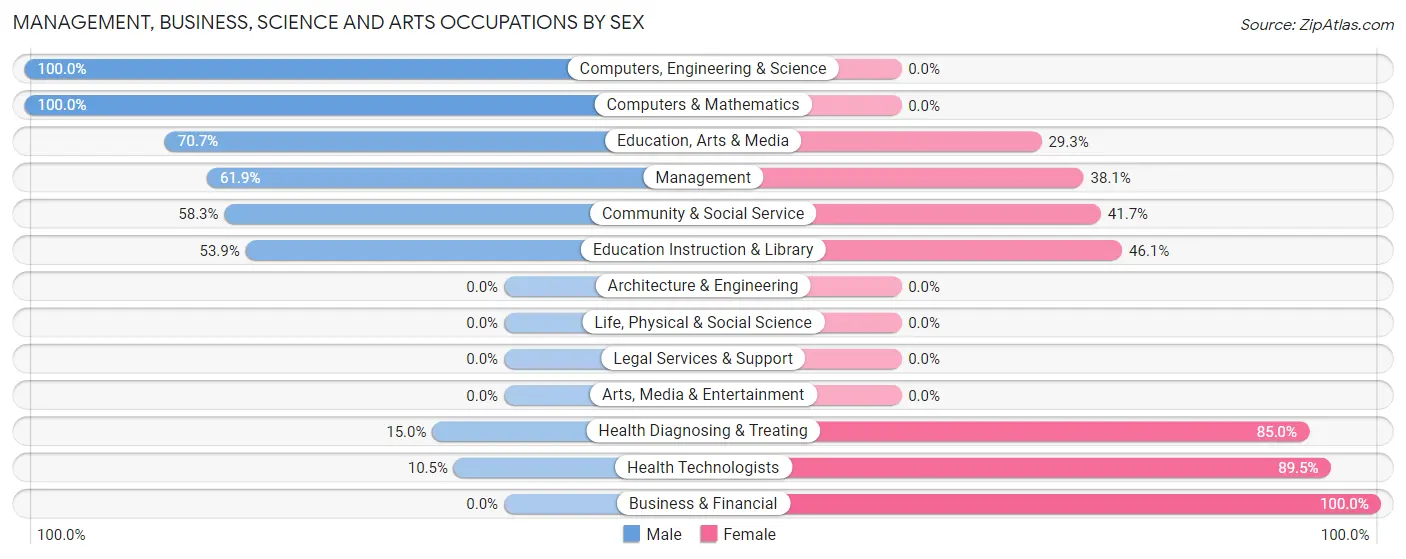
Management, Business, Science and Arts Occupations by Sex
Within the Management, Business, Science and Arts occupations in Lucasville, the most male-oriented occupations are Computers, Engineering & Science (100.0%), Computers & Mathematics (100.0%), and Education, Arts & Media (70.7%), while the most female-oriented occupations are Business & Financial (100.0%), Health Technologists (89.5%), and Health Diagnosing & Treating (85.0%).
| Occupation | Male | Female |
| Management | 83 (61.9%) | 51 (38.1%) |
| Business & Financial | 0 (0.0%) | 42 (100.0%) |
| Computers, Engineering & Science | 6 (100.0%) | 0 (0.0%) |
| Computers & Mathematics | 6 (100.0%) | 0 (0.0%) |
| Architecture & Engineering | 0 (0.0%) | 0 (0.0%) |
| Life, Physical & Social Science | 0 (0.0%) | 0 (0.0%) |
| Community & Social Service | 91 (58.3%) | 65 (41.7%) |
| Education, Arts & Media | 29 (70.7%) | 12 (29.3%) |
| Legal Services & Support | 0 (0.0%) | 0 (0.0%) |
| Education Instruction & Library | 62 (53.9%) | 53 (46.1%) |
| Arts, Media & Entertainment | 0 (0.0%) | 0 (0.0%) |
| Health Diagnosing & Treating | 19 (15.0%) | 108 (85.0%) |
| Health Technologists | 9 (10.5%) | 77 (89.5%) |
| Total (Category) | 199 (42.8%) | 266 (57.2%) |
| Total (Overall) | 445 (54.5%) | 371 (45.5%) |
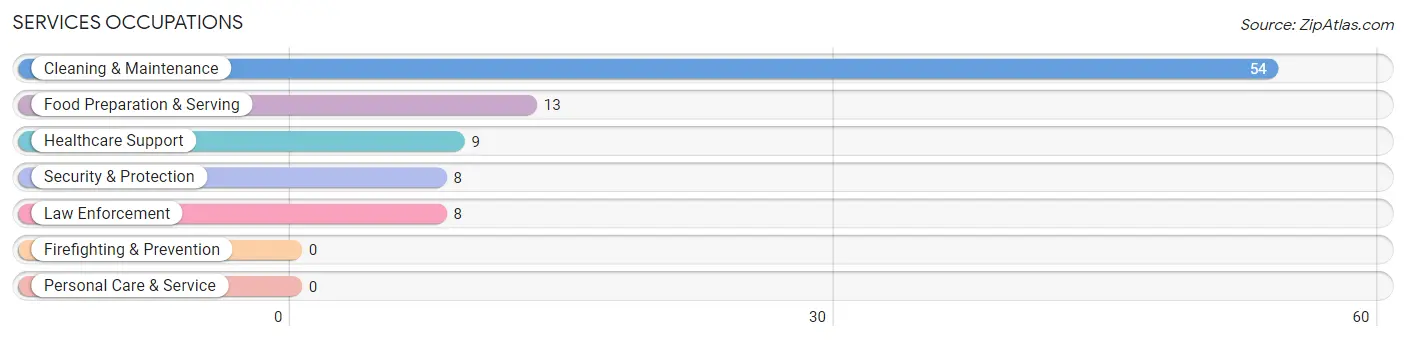
Services Occupations
The most common Services occupations in Lucasville are Cleaning & Maintenance (54 | 6.6%), Food Preparation & Serving (13 | 1.6%), Healthcare Support (9 | 1.1%), Security & Protection (8 | 1.0%), and Law Enforcement (8 | 1.0%).
Services Occupations by Sex
Within the Services occupations in Lucasville, the most male-oriented occupations are Security & Protection (100.0%), Law Enforcement (100.0%), and Food Preparation & Serving (100.0%), while the most female-oriented occupations are Healthcare Support (100.0%), and Cleaning & Maintenance (31.5%).
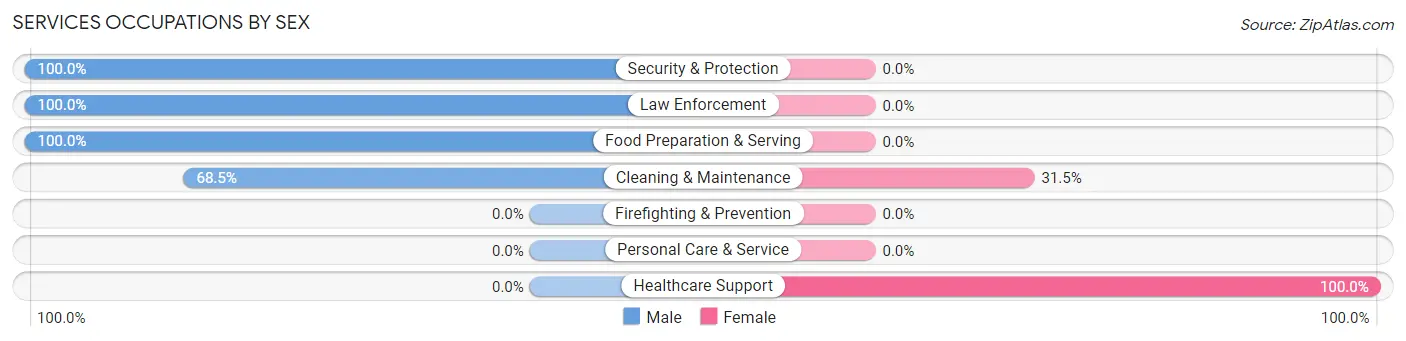
| Occupation | Male | Female |
| Healthcare Support | 0 (0.0%) | 9 (100.0%) |
| Security & Protection | 8 (100.0%) | 0 (0.0%) |
| Firefighting & Prevention | 0 (0.0%) | 0 (0.0%) |
| Law Enforcement | 8 (100.0%) | 0 (0.0%) |
| Food Preparation & Serving | 13 (100.0%) | 0 (0.0%) |
| Cleaning & Maintenance | 37 (68.5%) | 17 (31.5%) |
| Personal Care & Service | 0 (0.0%) | 0 (0.0%) |
| Total (Category) | 58 (69.1%) | 26 (30.9%) |
| Total (Overall) | 445 (54.5%) | 371 (45.5%) |
Sales and Office Occupations
The most common Sales and Office occupations in Lucasville are Office & Administration (62 | 7.6%), and Sales & Related (37 | 4.5%).

Sales and Office Occupations by Sex

| Occupation | Male | Female |
| Sales & Related | 30 (81.1%) | 7 (18.9%) |
| Office & Administration | 12 (19.4%) | 50 (80.6%) |
| Total (Category) | 42 (42.4%) | 57 (57.6%) |
| Total (Overall) | 445 (54.5%) | 371 (45.5%) |
Natural Resources, Construction and Maintenance Occupations
The most common Natural Resources, Construction and Maintenance occupations in Lucasville are , and Construction & Extraction (79 | 9.7%).

Natural Resources, Construction and Maintenance Occupations by Sex

| Occupation | Male | Female |
| Farming, Fishing & Forestry | 0 (0.0%) | 0 (0.0%) |
| Construction & Extraction | 79 (100.0%) | 0 (0.0%) |
| Installation, Maintenance & Repair | 0 (0.0%) | 0 (0.0%) |
| Total (Category) | 79 (100.0%) | 0 (0.0%) |
| Total (Overall) | 445 (54.5%) | 371 (45.5%) |
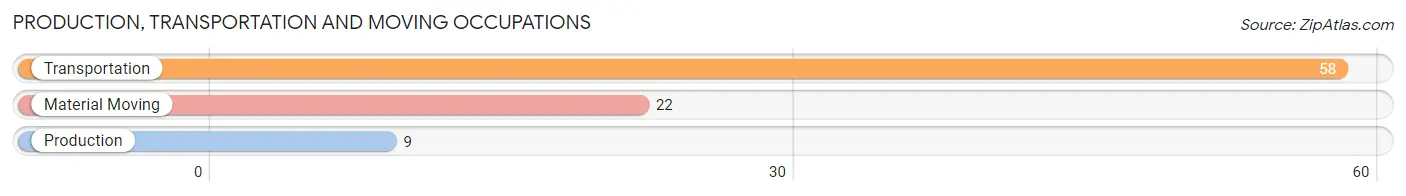
Production, Transportation and Moving Occupations
The most common Production, Transportation and Moving occupations in Lucasville are Transportation (58 | 7.1%), Material Moving (22 | 2.7%), and Production (9 | 1.1%).
Production, Transportation and Moving Occupations by Sex
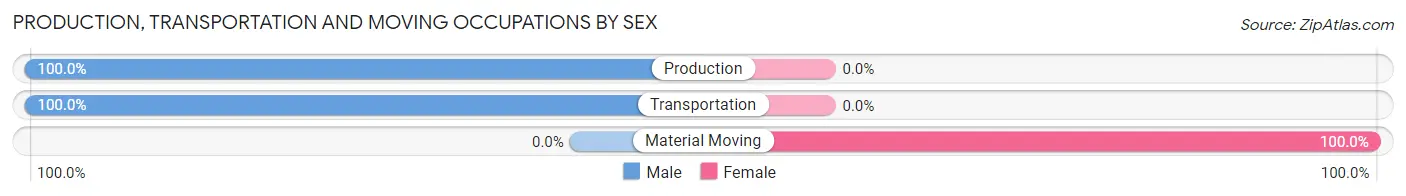
| Occupation | Male | Female |
| Production | 9 (100.0%) | 0 (0.0%) |
| Transportation | 58 (100.0%) | 0 (0.0%) |
| Material Moving | 0 (0.0%) | 22 (100.0%) |
| Total (Category) | 67 (75.3%) | 22 (24.7%) |
| Total (Overall) | 445 (54.5%) | 371 (45.5%) |
Employment Industries by Sex in Lucasville
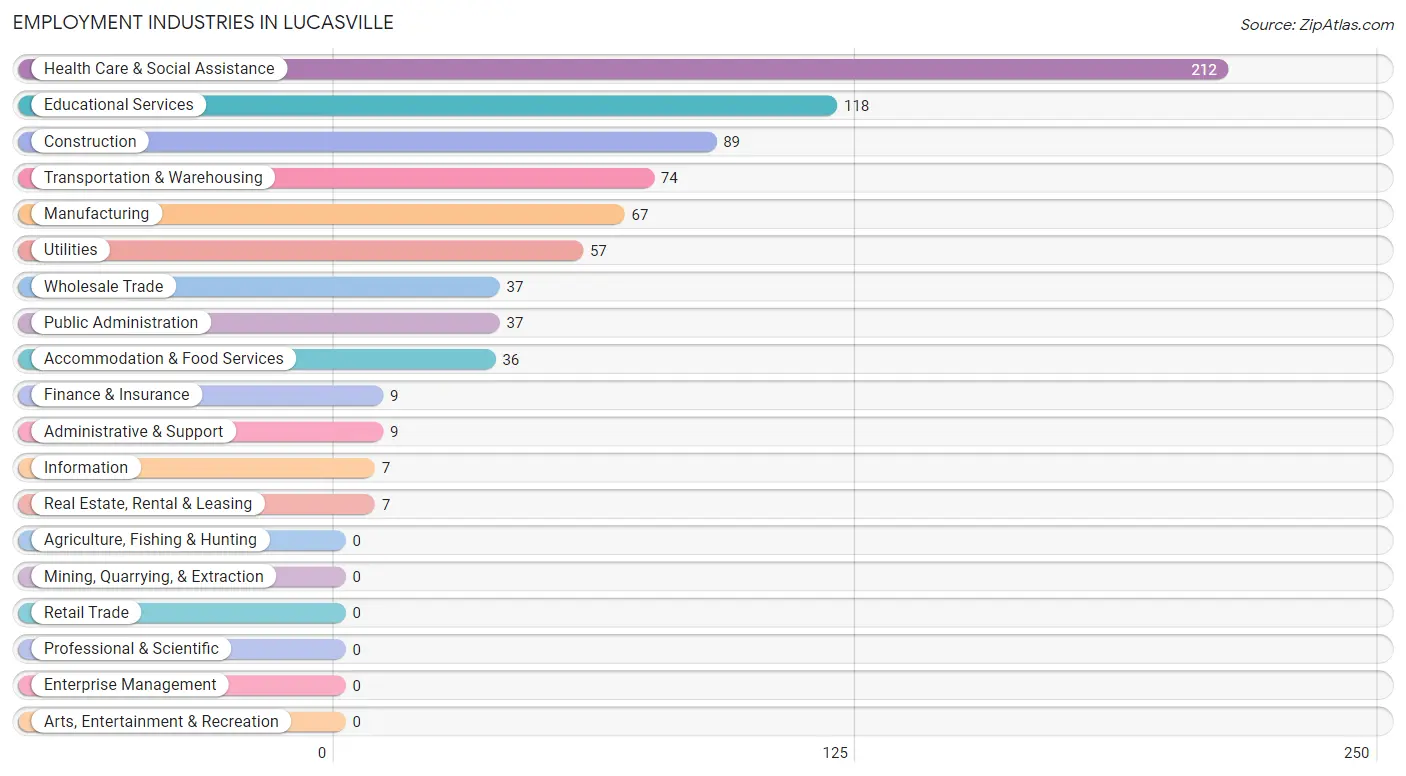
Employment Industries in Lucasville
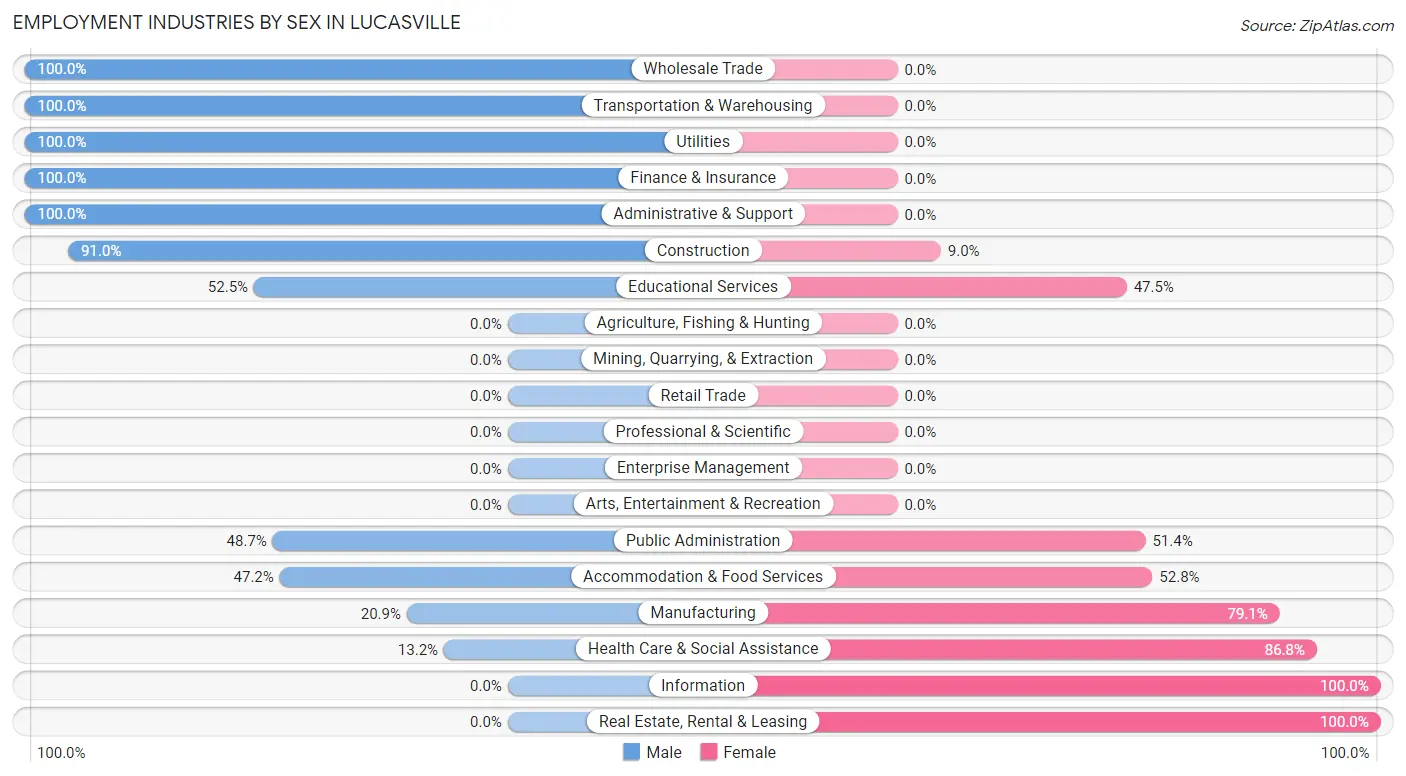
The major employment industries in Lucasville include Health Care & Social Assistance (212 | 26.0%), Educational Services (118 | 14.5%), Construction (89 | 10.9%), Transportation & Warehousing (74 | 9.1%), and Manufacturing (67 | 8.2%).
Employment Industries by Sex in Lucasville
The Lucasville industries that see more men than women are Wholesale Trade (100.0%), Transportation & Warehousing (100.0%), and Utilities (100.0%), whereas the industries that tend to have a higher number of women are Information (100.0%), Real Estate, Rental & Leasing (100.0%), and Health Care & Social Assistance (86.8%).
| Industry | Male | Female |
| Agriculture, Fishing & Hunting | 0 (0.0%) | 0 (0.0%) |
| Mining, Quarrying, & Extraction | 0 (0.0%) | 0 (0.0%) |
| Construction | 81 (91.0%) | 8 (9.0%) |
| Manufacturing | 14 (20.9%) | 53 (79.1%) |
| Wholesale Trade | 37 (100.0%) | 0 (0.0%) |
| Retail Trade | 0 (0.0%) | 0 (0.0%) |
| Transportation & Warehousing | 74 (100.0%) | 0 (0.0%) |
| Utilities | 57 (100.0%) | 0 (0.0%) |
| Information | 0 (0.0%) | 7 (100.0%) |
| Finance & Insurance | 9 (100.0%) | 0 (0.0%) |
| Real Estate, Rental & Leasing | 0 (0.0%) | 7 (100.0%) |
| Professional & Scientific | 0 (0.0%) | 0 (0.0%) |
| Enterprise Management | 0 (0.0%) | 0 (0.0%) |
| Administrative & Support | 9 (100.0%) | 0 (0.0%) |
| Educational Services | 62 (52.5%) | 56 (47.5%) |
| Health Care & Social Assistance | 28 (13.2%) | 184 (86.8%) |
| Arts, Entertainment & Recreation | 0 (0.0%) | 0 (0.0%) |
| Accommodation & Food Services | 17 (47.2%) | 19 (52.8%) |
| Public Administration | 18 (48.6%) | 19 (51.3%) |
| Total | 445 (54.5%) | 371 (45.5%) |
Education in Lucasville
School Enrollment in Lucasville
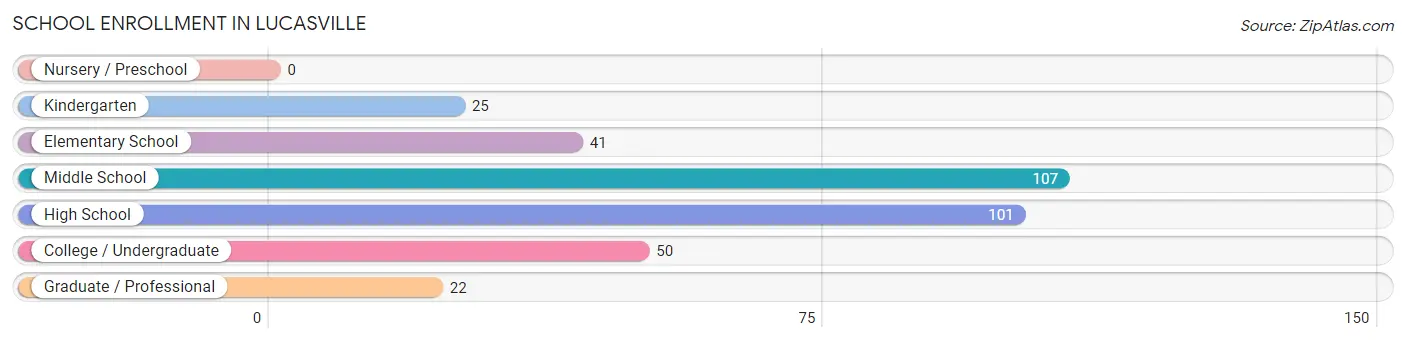
The most common levels of schooling among the 346 students in Lucasville are middle school (107 | 30.9%), high school (101 | 29.2%), and college / undergraduate (50 | 14.4%).
| School Level | # Students | % Students |
| Nursery / Preschool | 0 | 0.0% |
| Kindergarten | 25 | 7.2% |
| Elementary School | 41 | 11.8% |
| Middle School | 107 | 30.9% |
| High School | 101 | 29.2% |
| College / Undergraduate | 50 | 14.4% |
| Graduate / Professional | 22 | 6.4% |
| Total | 346 | 100.0% |
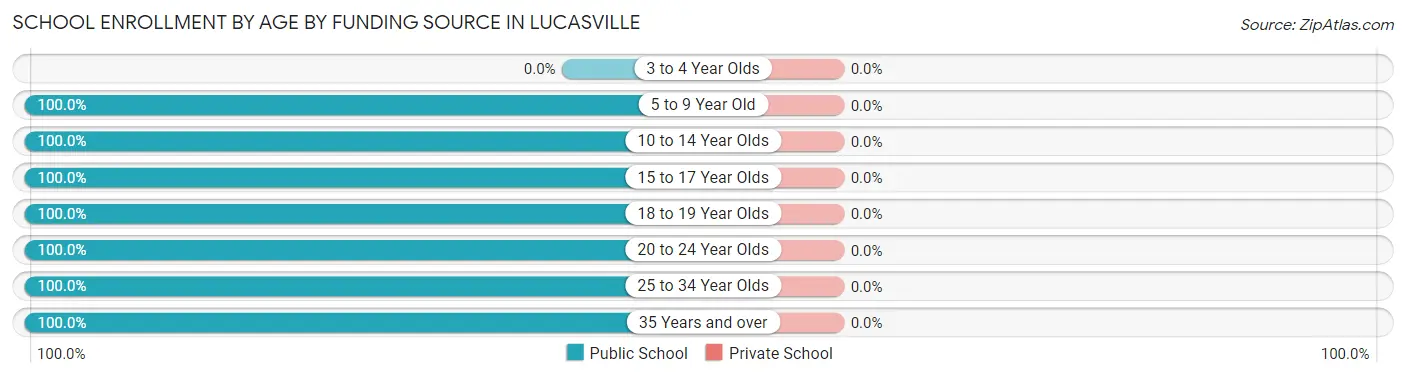
School Enrollment by Age by Funding Source in Lucasville
| Age Bracket | Public School | Private School |
| 3 to 4 Year Olds | 0 (0.0%) | 0 (0.0%) |
| 5 to 9 Year Old | 33 (100.0%) | 0 (0.0%) |
| 10 to 14 Year Olds | 140 (100.0%) | 0 (0.0%) |
| 15 to 17 Year Olds | 62 (100.0%) | 0 (0.0%) |
| 18 to 19 Year Olds | 8 (100.0%) | 0 (0.0%) |
| 20 to 24 Year Olds | 65 (100.0%) | 0 (0.0%) |
| 25 to 34 Year Olds | 15 (100.0%) | 0 (0.0%) |
| 35 Years and over | 23 (100.0%) | 0 (0.0%) |
| Total | 346 (100.0%) | 0 (0.0%) |
Educational Attainment by Field of Study in Lucasville
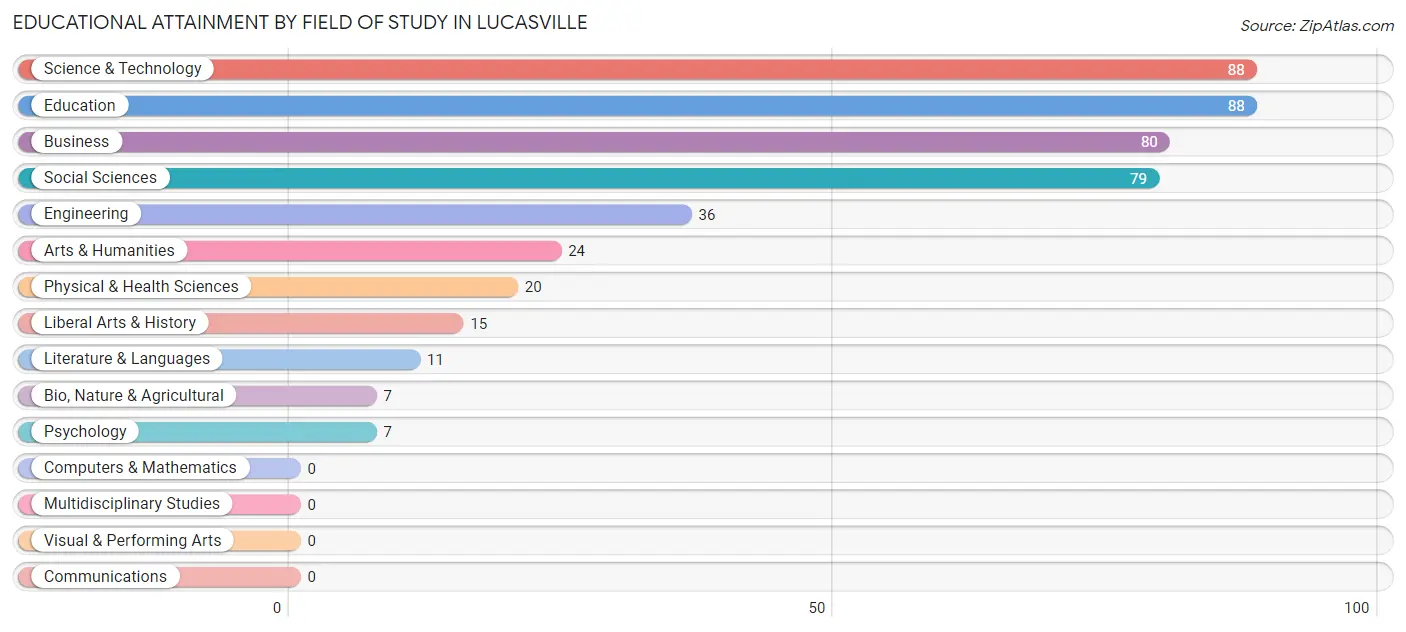
Science & technology (88 | 19.3%), education (88 | 19.3%), business (80 | 17.6%), social sciences (79 | 17.4%), and engineering (36 | 7.9%) are the most common fields of study among 455 individuals in Lucasville who have obtained a bachelor's degree or higher.
| Field of Study | # Graduates | % Graduates |
| Computers & Mathematics | 0 | 0.0% |
| Bio, Nature & Agricultural | 7 | 1.5% |
| Physical & Health Sciences | 20 | 4.4% |
| Psychology | 7 | 1.5% |
| Social Sciences | 79 | 17.4% |
| Engineering | 36 | 7.9% |
| Multidisciplinary Studies | 0 | 0.0% |
| Science & Technology | 88 | 19.3% |
| Business | 80 | 17.6% |
| Education | 88 | 19.3% |
| Literature & Languages | 11 | 2.4% |
| Liberal Arts & History | 15 | 3.3% |
| Visual & Performing Arts | 0 | 0.0% |
| Communications | 0 | 0.0% |
| Arts & Humanities | 24 | 5.3% |
| Total | 455 | 100.0% |
Transportation & Commute in Lucasville
Vehicle Availability by Sex in Lucasville
The most prevalent vehicle ownership categories in Lucasville are males with 3 vehicles (200, accounting for 44.9%) and females with 3 vehicles (147, making up 53.9%).
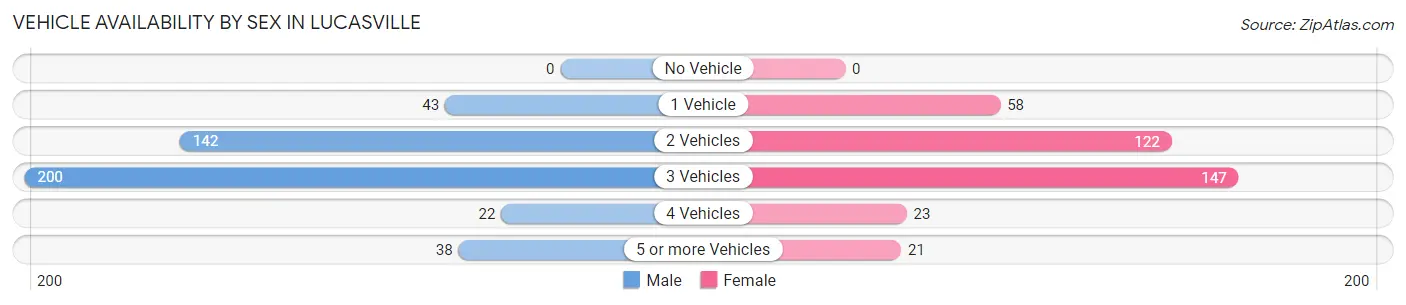
| Vehicles Available | Male | Female |
| No Vehicle | 0 (0.0%) | 0 (0.0%) |
| 1 Vehicle | 43 (9.7%) | 58 (15.6%) |
| 2 Vehicles | 142 (31.9%) | 122 (32.9%) |
| 3 Vehicles | 200 (44.9%) | 147 (39.6%) |
| 4 Vehicles | 22 (4.9%) | 23 (6.2%) |
| 5 or more Vehicles | 38 (8.5%) | 21 (5.7%) |
| Total | 445 (100.0%) | 371 (100.0%) |
Commute Time in Lucasville
The most frequently occuring commute durations in Lucasville are 20 to 24 minutes (194 commuters, 27.3%), 15 to 19 minutes (143 commuters, 20.1%), and 10 to 14 minutes (89 commuters, 12.5%).
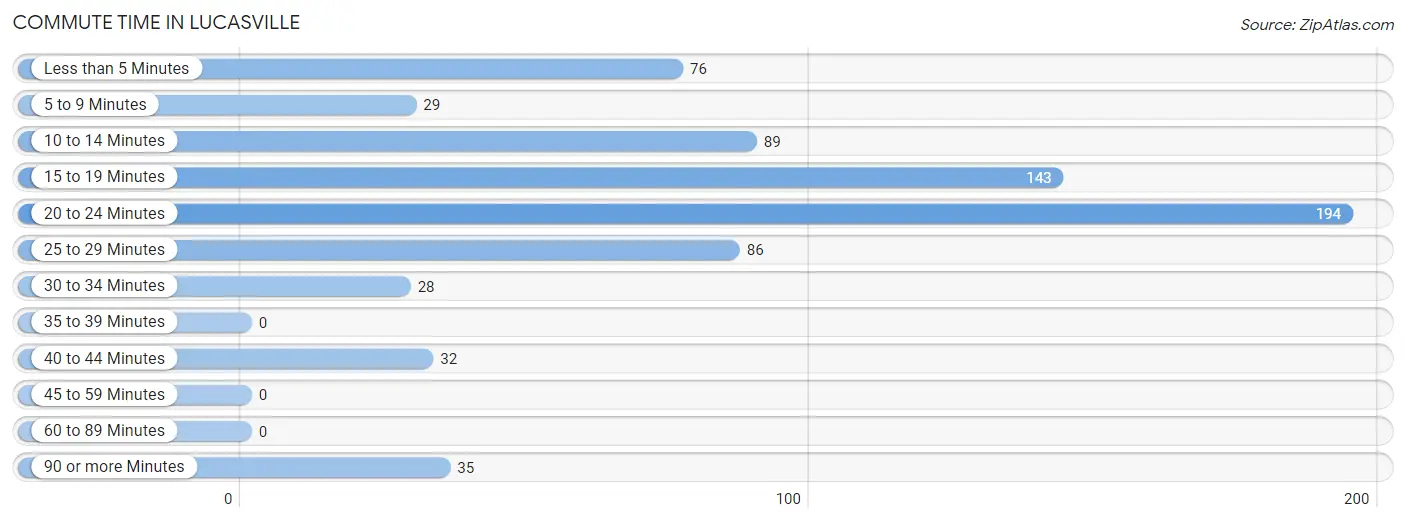
| Commute Time | # Commuters | % Commuters |
| Less than 5 Minutes | 76 | 10.7% |
| 5 to 9 Minutes | 29 | 4.1% |
| 10 to 14 Minutes | 89 | 12.5% |
| 15 to 19 Minutes | 143 | 20.1% |
| 20 to 24 Minutes | 194 | 27.3% |
| 25 to 29 Minutes | 86 | 12.1% |
| 30 to 34 Minutes | 28 | 3.9% |
| 35 to 39 Minutes | 0 | 0.0% |
| 40 to 44 Minutes | 32 | 4.5% |
| 45 to 59 Minutes | 0 | 0.0% |
| 60 to 89 Minutes | 0 | 0.0% |
| 90 or more Minutes | 35 | 4.9% |
Commute Time by Sex in Lucasville
The most common commute times in Lucasville are 15 to 19 minutes (92 commuters, 24.0%) for males and 20 to 24 minutes (155 commuters, 47.3%) for females.
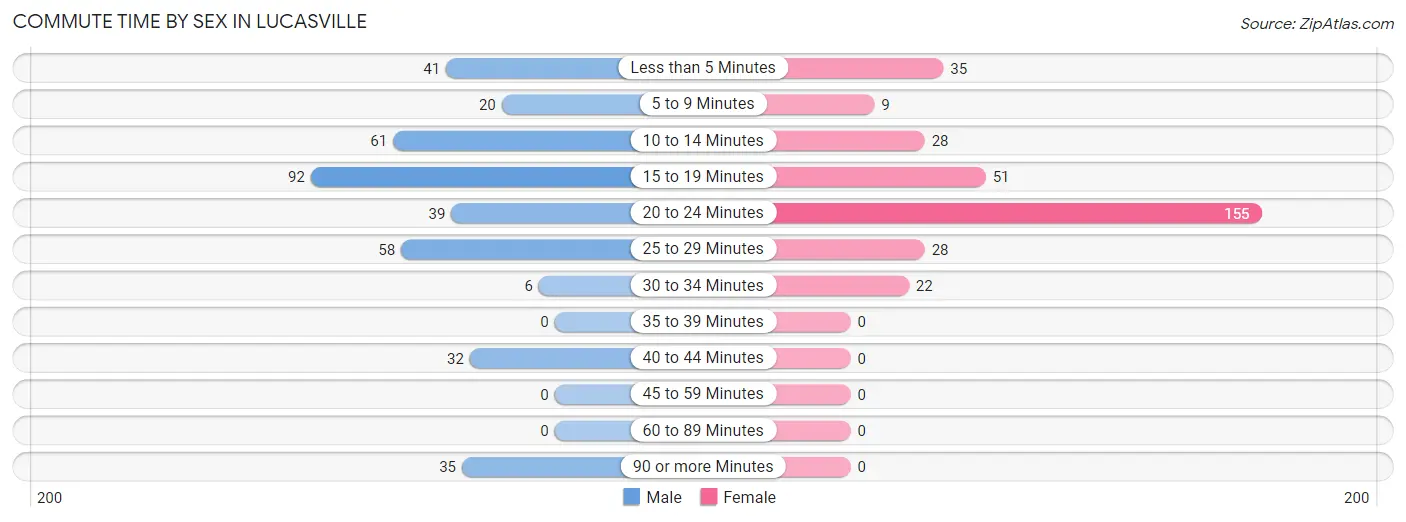
| Commute Time | Male | Female |
| Less than 5 Minutes | 41 (10.7%) | 35 (10.7%) |
| 5 to 9 Minutes | 20 (5.2%) | 9 (2.7%) |
| 10 to 14 Minutes | 61 (15.9%) | 28 (8.5%) |
| 15 to 19 Minutes | 92 (24.0%) | 51 (15.5%) |
| 20 to 24 Minutes | 39 (10.2%) | 155 (47.3%) |
| 25 to 29 Minutes | 58 (15.1%) | 28 (8.5%) |
| 30 to 34 Minutes | 6 (1.6%) | 22 (6.7%) |
| 35 to 39 Minutes | 0 (0.0%) | 0 (0.0%) |
| 40 to 44 Minutes | 32 (8.3%) | 0 (0.0%) |
| 45 to 59 Minutes | 0 (0.0%) | 0 (0.0%) |
| 60 to 89 Minutes | 0 (0.0%) | 0 (0.0%) |
| 90 or more Minutes | 35 (9.1%) | 0 (0.0%) |
Time of Departure to Work by Sex in Lucasville
The most frequent times of departure to work in Lucasville are 6:30 AM to 6:59 AM (110, 28.6%) for males and 6:30 AM to 6:59 AM (86, 26.2%) for females.
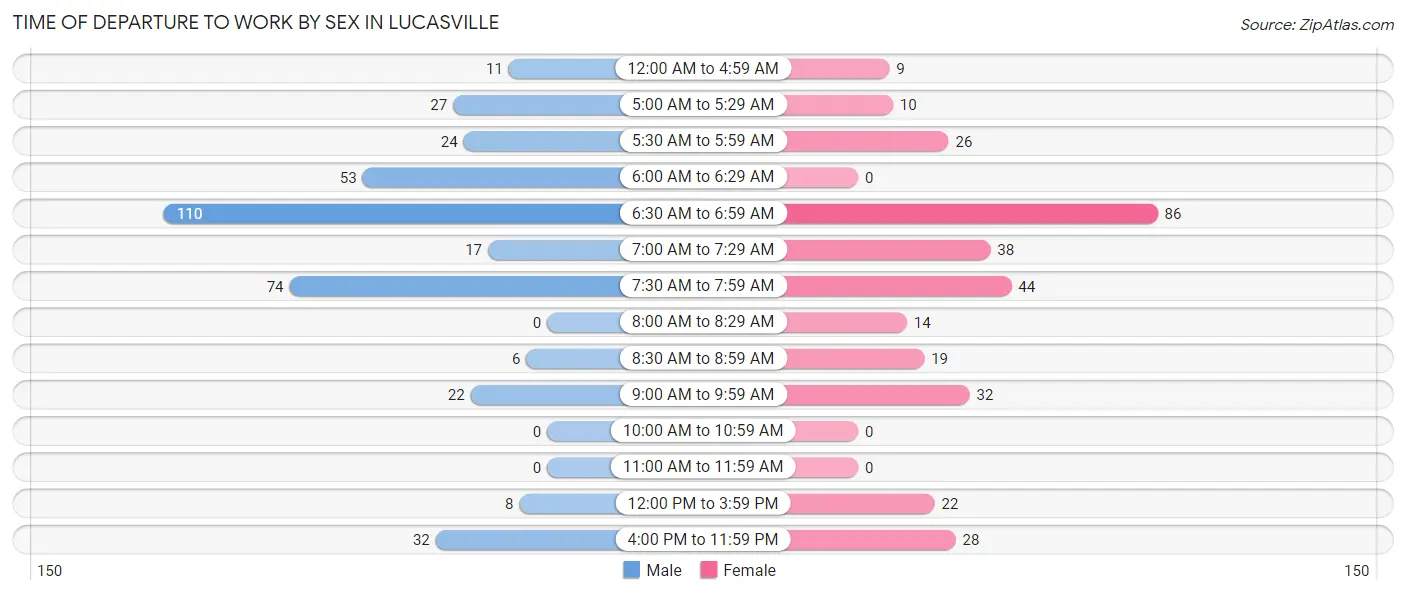
| Time of Departure | Male | Female |
| 12:00 AM to 4:59 AM | 11 (2.9%) | 9 (2.7%) |
| 5:00 AM to 5:29 AM | 27 (7.0%) | 10 (3.0%) |
| 5:30 AM to 5:59 AM | 24 (6.2%) | 26 (7.9%) |
| 6:00 AM to 6:29 AM | 53 (13.8%) | 0 (0.0%) |
| 6:30 AM to 6:59 AM | 110 (28.6%) | 86 (26.2%) |
| 7:00 AM to 7:29 AM | 17 (4.4%) | 38 (11.6%) |
| 7:30 AM to 7:59 AM | 74 (19.3%) | 44 (13.4%) |
| 8:00 AM to 8:29 AM | 0 (0.0%) | 14 (4.3%) |
| 8:30 AM to 8:59 AM | 6 (1.6%) | 19 (5.8%) |
| 9:00 AM to 9:59 AM | 22 (5.7%) | 32 (9.8%) |
| 10:00 AM to 10:59 AM | 0 (0.0%) | 0 (0.0%) |
| 11:00 AM to 11:59 AM | 0 (0.0%) | 0 (0.0%) |
| 12:00 PM to 3:59 PM | 8 (2.1%) | 22 (6.7%) |
| 4:00 PM to 11:59 PM | 32 (8.3%) | 28 (8.5%) |
| Total | 384 (100.0%) | 328 (100.0%) |
Housing Occupancy in Lucasville
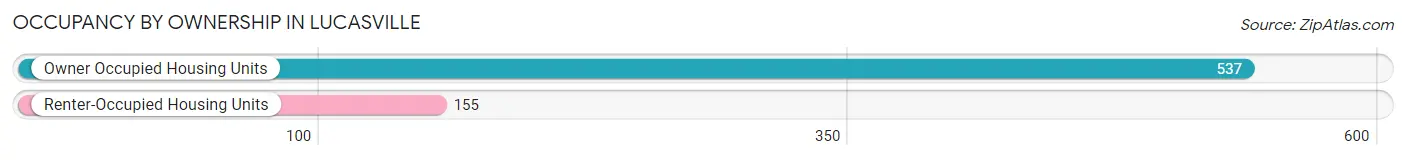
Occupancy by Ownership in Lucasville
Of the total 692 dwellings in Lucasville, owner-occupied units account for 537 (77.6%), while renter-occupied units make up 155 (22.4%).
| Occupancy | # Housing Units | % Housing Units |
| Owner Occupied Housing Units | 537 | 77.6% |
| Renter-Occupied Housing Units | 155 | 22.4% |
| Total Occupied Housing Units | 692 | 100.0% |
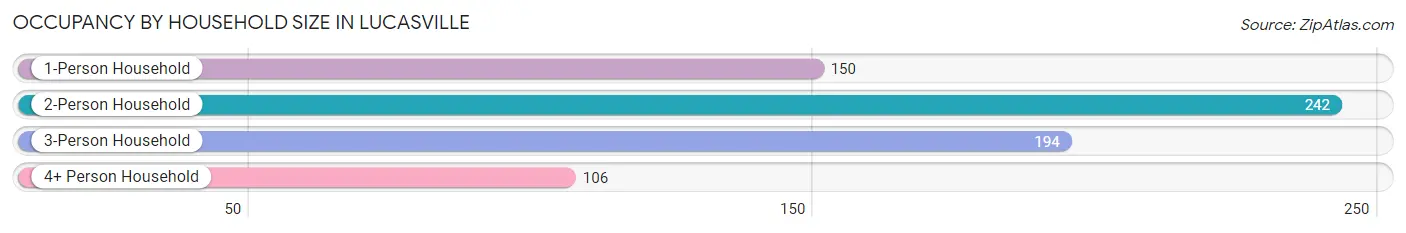
Occupancy by Household Size in Lucasville
| Household Size | # Housing Units | % Housing Units |
| 1-Person Household | 150 | 21.7% |
| 2-Person Household | 242 | 35.0% |
| 3-Person Household | 194 | 28.0% |
| 4+ Person Household | 106 | 15.3% |
| Total Housing Units | 692 | 100.0% |
Occupancy by Ownership by Household Size in Lucasville
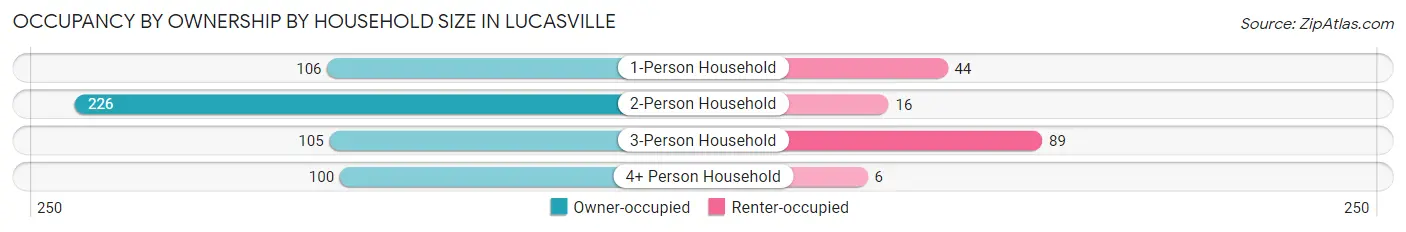
| Household Size | Owner-occupied | Renter-occupied |
| 1-Person Household | 106 (70.7%) | 44 (29.3%) |
| 2-Person Household | 226 (93.4%) | 16 (6.6%) |
| 3-Person Household | 105 (54.1%) | 89 (45.9%) |
| 4+ Person Household | 100 (94.3%) | 6 (5.7%) |
| Total Housing Units | 537 (77.6%) | 155 (22.4%) |
Occupancy by Educational Attainment in Lucasville
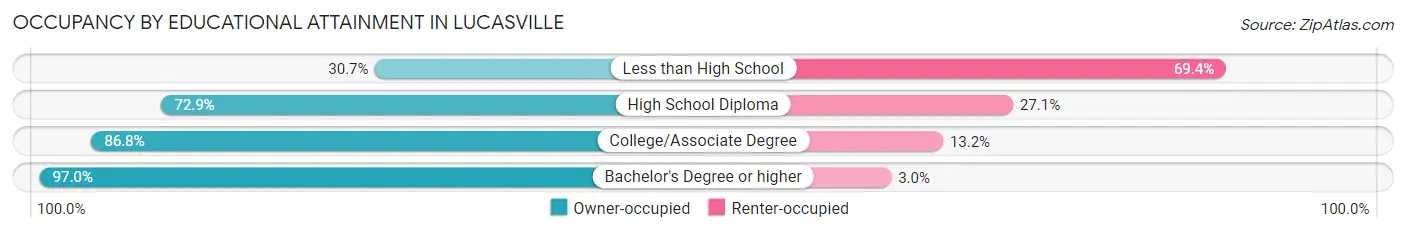
| Household Size | Owner-occupied | Renter-occupied |
| Less than High School | 38 (30.6%) | 86 (69.4%) |
| High School Diploma | 94 (72.9%) | 35 (27.1%) |
| College/Associate Degree | 177 (86.8%) | 27 (13.2%) |
| Bachelor's Degree or higher | 228 (97.0%) | 7 (3.0%) |
Occupancy by Age of Householder in Lucasville
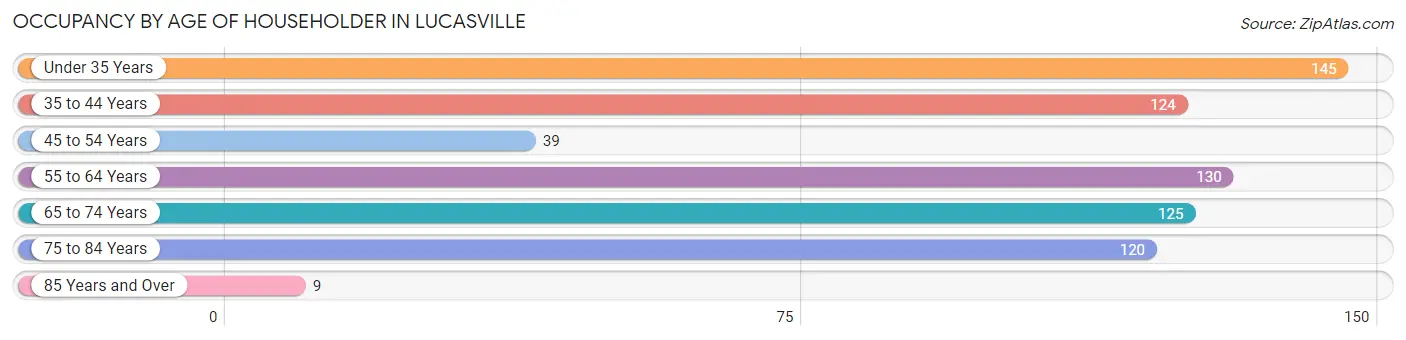
| Age Bracket | # Households | % Households |
| Under 35 Years | 145 | 20.9% |
| 35 to 44 Years | 124 | 17.9% |
| 45 to 54 Years | 39 | 5.6% |
| 55 to 64 Years | 130 | 18.8% |
| 65 to 74 Years | 125 | 18.1% |
| 75 to 84 Years | 120 | 17.3% |
| 85 Years and Over | 9 | 1.3% |
| Total | 692 | 100.0% |
Housing Finances in Lucasville
Median Income by Occupancy in Lucasville
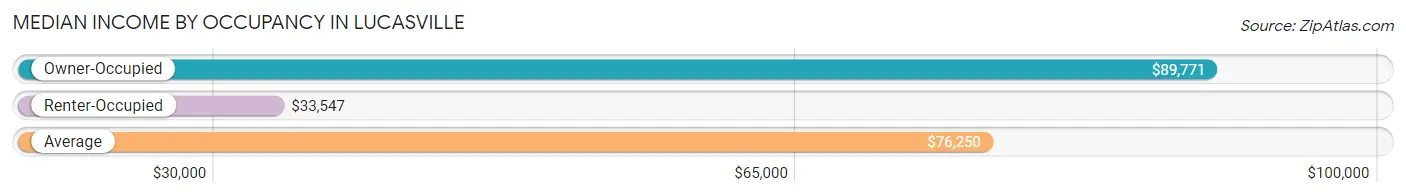
| Occupancy Type | # Households | Median Income |
| Owner-Occupied | 537 (77.6%) | $89,771 |
| Renter-Occupied | 155 (22.4%) | $33,547 |
| Average | 692 (100.0%) | $76,250 |
Occupancy by Householder Income Bracket in Lucasville
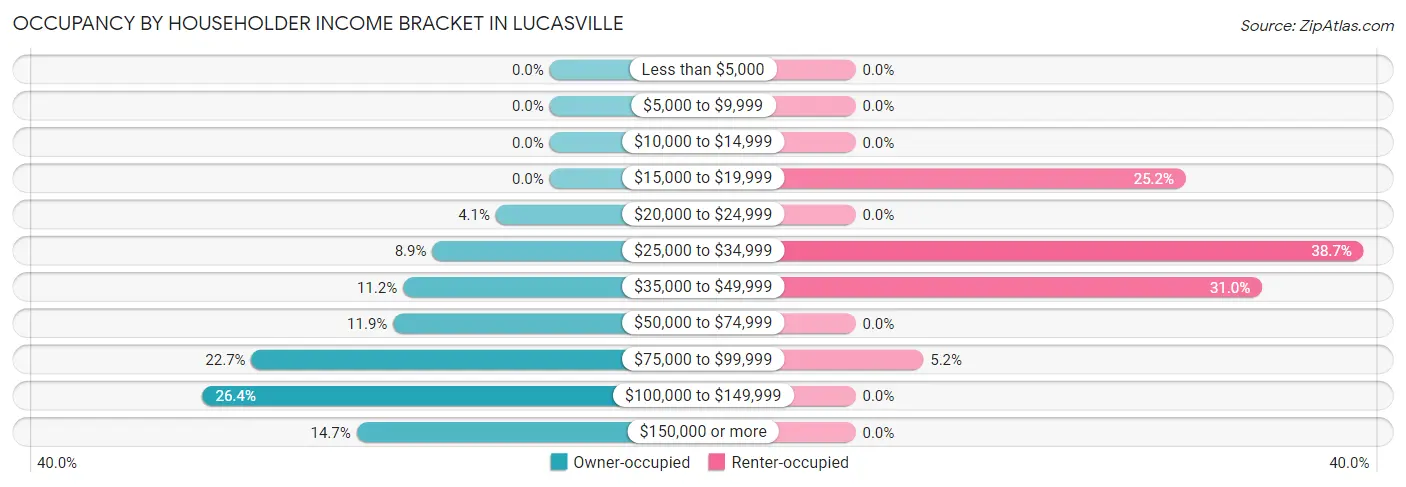
| Income Bracket | Owner-occupied | Renter-occupied |
| Less than $5,000 | 0 (0.0%) | 0 (0.0%) |
| $5,000 to $9,999 | 0 (0.0%) | 0 (0.0%) |
| $10,000 to $14,999 | 0 (0.0%) | 0 (0.0%) |
| $15,000 to $19,999 | 0 (0.0%) | 39 (25.2%) |
| $20,000 to $24,999 | 22 (4.1%) | 0 (0.0%) |
| $25,000 to $34,999 | 48 (8.9%) | 60 (38.7%) |
| $35,000 to $49,999 | 60 (11.2%) | 48 (31.0%) |
| $50,000 to $74,999 | 64 (11.9%) | 0 (0.0%) |
| $75,000 to $99,999 | 122 (22.7%) | 8 (5.2%) |
| $100,000 to $149,999 | 142 (26.4%) | 0 (0.0%) |
| $150,000 or more | 79 (14.7%) | 0 (0.0%) |
| Total | 537 (100.0%) | 155 (100.0%) |
Monthly Housing Cost Tiers in Lucasville
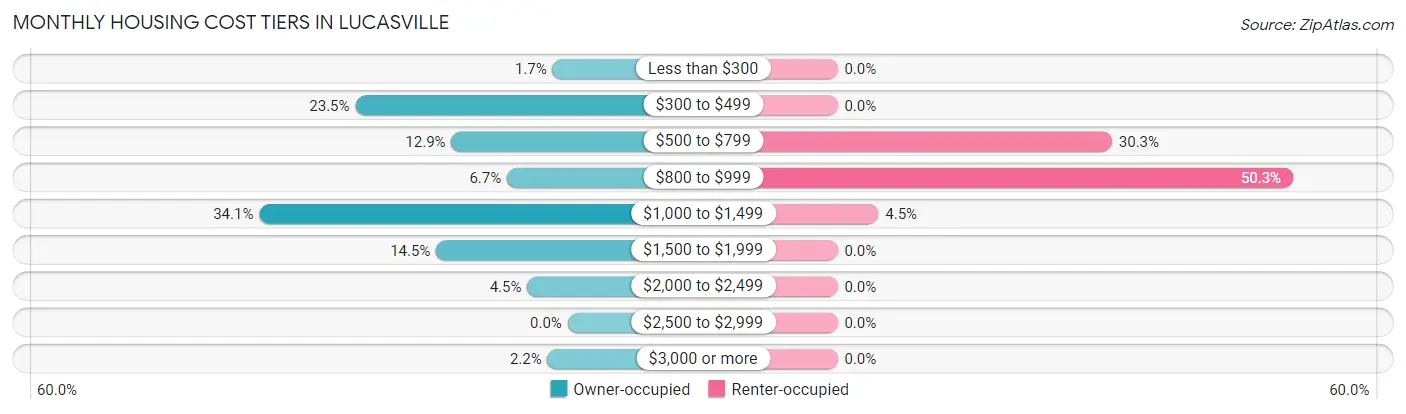
| Monthly Cost | Owner-occupied | Renter-occupied |
| Less than $300 | 9 (1.7%) | 0 (0.0%) |
| $300 to $499 | 126 (23.5%) | 0 (0.0%) |
| $500 to $799 | 69 (12.9%) | 47 (30.3%) |
| $800 to $999 | 36 (6.7%) | 78 (50.3%) |
| $1,000 to $1,499 | 183 (34.1%) | 7 (4.5%) |
| $1,500 to $1,999 | 78 (14.5%) | 0 (0.0%) |
| $2,000 to $2,499 | 24 (4.5%) | 0 (0.0%) |
| $2,500 to $2,999 | 0 (0.0%) | 0 (0.0%) |
| $3,000 or more | 12 (2.2%) | 0 (0.0%) |
| Total | 537 (100.0%) | 155 (100.0%) |
Physical Housing Characteristics in Lucasville
Housing Structures in Lucasville
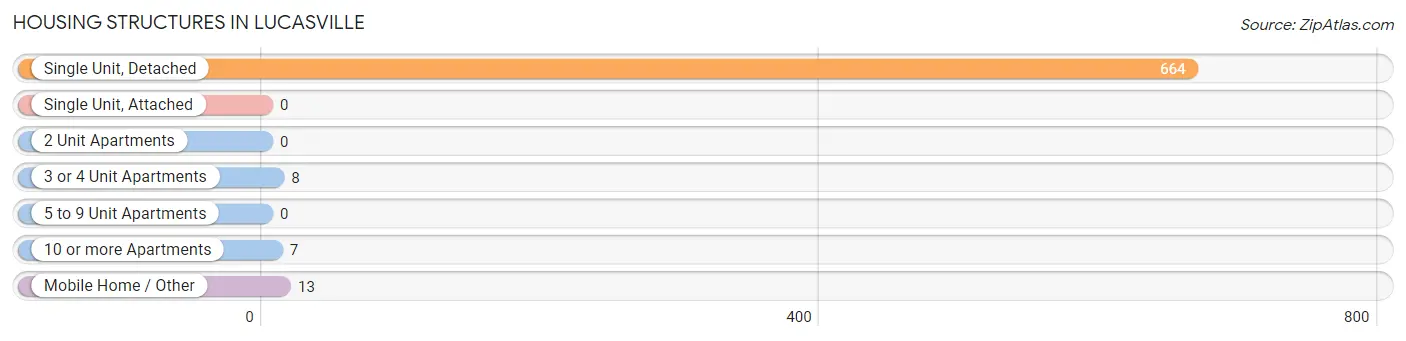
| Structure Type | # Housing Units | % Housing Units |
| Single Unit, Detached | 664 | 96.0% |
| Single Unit, Attached | 0 | 0.0% |
| 2 Unit Apartments | 0 | 0.0% |
| 3 or 4 Unit Apartments | 8 | 1.2% |
| 5 to 9 Unit Apartments | 0 | 0.0% |
| 10 or more Apartments | 7 | 1.0% |
| Mobile Home / Other | 13 | 1.9% |
| Total | 692 | 100.0% |
Housing Structures by Occupancy in Lucasville
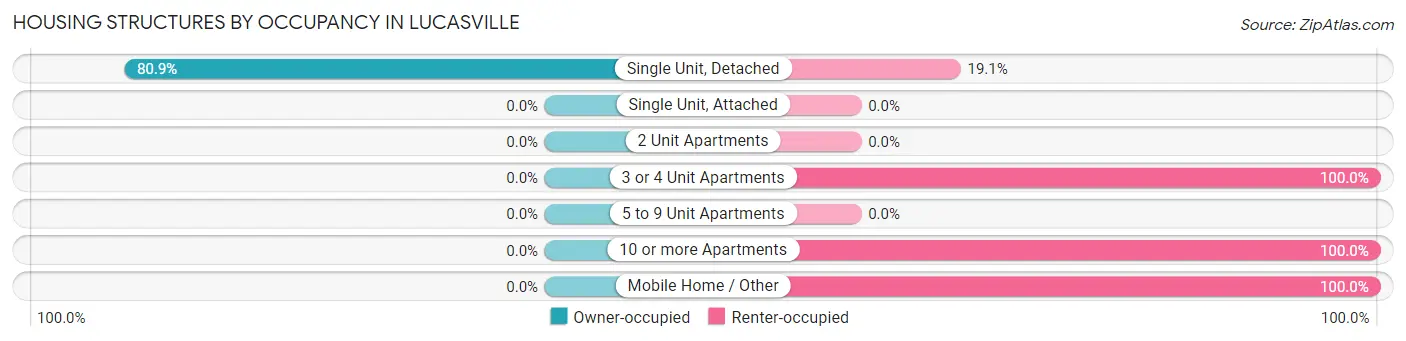
| Structure Type | Owner-occupied | Renter-occupied |
| Single Unit, Detached | 537 (80.9%) | 127 (19.1%) |
| Single Unit, Attached | 0 (0.0%) | 0 (0.0%) |
| 2 Unit Apartments | 0 (0.0%) | 0 (0.0%) |
| 3 or 4 Unit Apartments | 0 (0.0%) | 8 (100.0%) |
| 5 to 9 Unit Apartments | 0 (0.0%) | 0 (0.0%) |
| 10 or more Apartments | 0 (0.0%) | 7 (100.0%) |
| Mobile Home / Other | 0 (0.0%) | 13 (100.0%) |
| Total | 537 (77.6%) | 155 (22.4%) |
Housing Structures by Number of Rooms in Lucasville
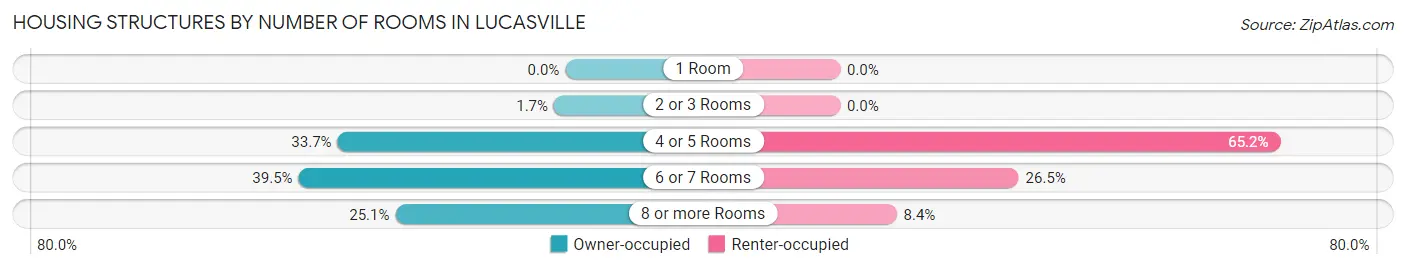
| Number of Rooms | Owner-occupied | Renter-occupied |
| 1 Room | 0 (0.0%) | 0 (0.0%) |
| 2 or 3 Rooms | 9 (1.7%) | 0 (0.0%) |
| 4 or 5 Rooms | 181 (33.7%) | 101 (65.2%) |
| 6 or 7 Rooms | 212 (39.5%) | 41 (26.5%) |
| 8 or more Rooms | 135 (25.1%) | 13 (8.4%) |
| Total | 537 (100.0%) | 155 (100.0%) |
Housing Structure by Heating Type in Lucasville
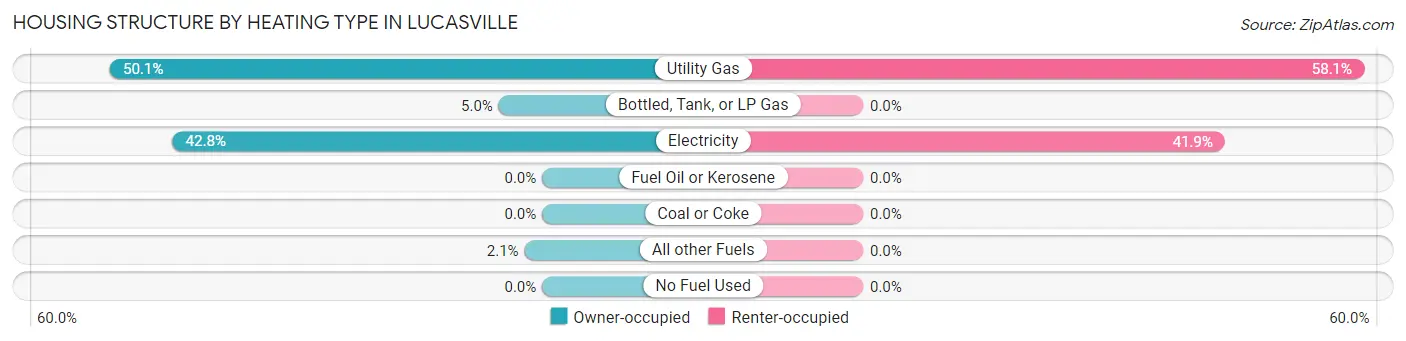
| Heating Type | Owner-occupied | Renter-occupied |
| Utility Gas | 269 (50.1%) | 90 (58.1%) |
| Bottled, Tank, or LP Gas | 27 (5.0%) | 0 (0.0%) |
| Electricity | 230 (42.8%) | 65 (41.9%) |
| Fuel Oil or Kerosene | 0 (0.0%) | 0 (0.0%) |
| Coal or Coke | 0 (0.0%) | 0 (0.0%) |
| All other Fuels | 11 (2.1%) | 0 (0.0%) |
| No Fuel Used | 0 (0.0%) | 0 (0.0%) |
| Total | 537 (100.0%) | 155 (100.0%) |
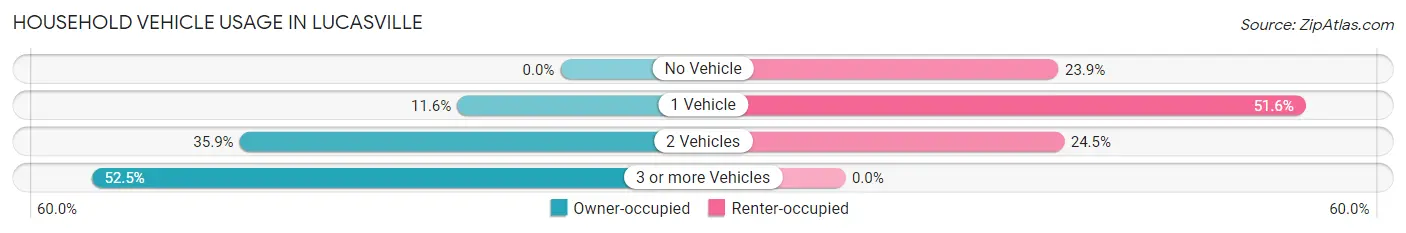
Household Vehicle Usage in Lucasville
| Vehicles per Household | Owner-occupied | Renter-occupied |
| No Vehicle | 0 (0.0%) | 37 (23.9%) |
| 1 Vehicle | 62 (11.6%) | 80 (51.6%) |
| 2 Vehicles | 193 (35.9%) | 38 (24.5%) |
| 3 or more Vehicles | 282 (52.5%) | 0 (0.0%) |
| Total | 537 (100.0%) | 155 (100.0%) |
Real Estate & Mortgages in Lucasville
Real Estate and Mortgage Overview in Lucasville
| Characteristic | Without Mortgage | With Mortgage |
| Housing Units | 214 | 323 |
| Median Property Value | $153,900 | $187,200 |
| Median Household Income | $59,444 | $71 |
| Monthly Housing Costs | $472 | $12 |
| Real Estate Taxes | $1,545 | $13 |
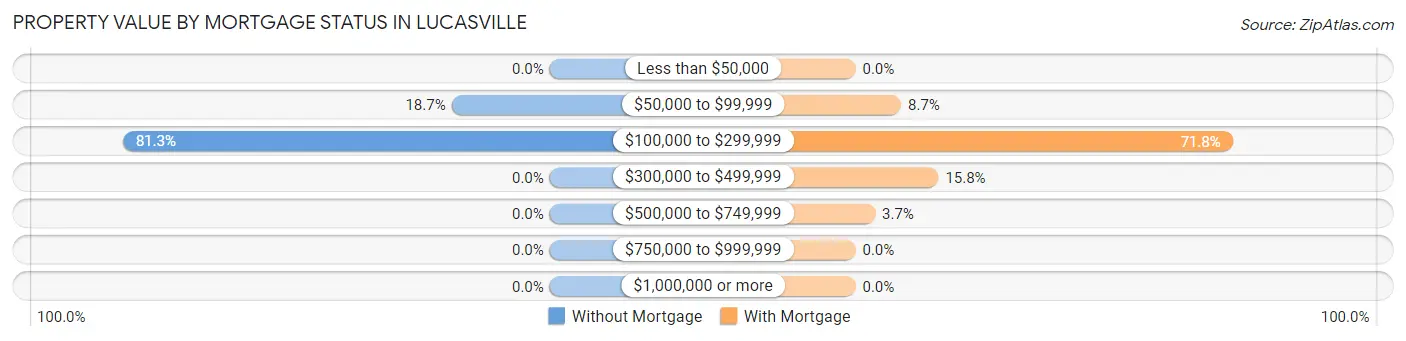
Property Value by Mortgage Status in Lucasville
| Property Value | Without Mortgage | With Mortgage |
| Less than $50,000 | 0 (0.0%) | 0 (0.0%) |
| $50,000 to $99,999 | 40 (18.7%) | 28 (8.7%) |
| $100,000 to $299,999 | 174 (81.3%) | 232 (71.8%) |
| $300,000 to $499,999 | 0 (0.0%) | 51 (15.8%) |
| $500,000 to $749,999 | 0 (0.0%) | 12 (3.7%) |
| $750,000 to $999,999 | 0 (0.0%) | 0 (0.0%) |
| $1,000,000 or more | 0 (0.0%) | 0 (0.0%) |
| Total | 214 (100.0%) | 323 (100.0%) |
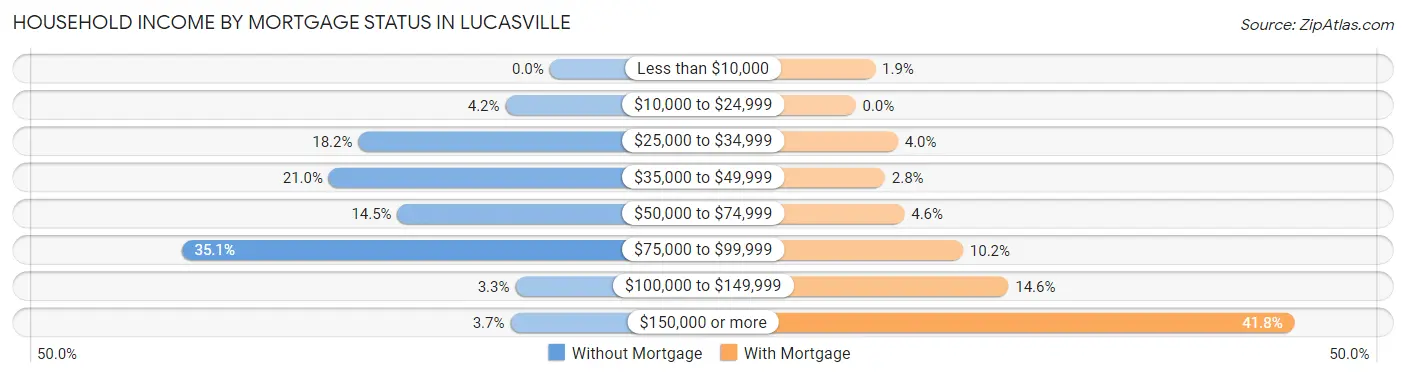
Household Income by Mortgage Status in Lucasville
| Household Income | Without Mortgage | With Mortgage |
| Less than $10,000 | 0 (0.0%) | 6 (1.9%) |
| $10,000 to $24,999 | 9 (4.2%) | 0 (0.0%) |
| $25,000 to $34,999 | 39 (18.2%) | 13 (4.0%) |
| $35,000 to $49,999 | 45 (21.0%) | 9 (2.8%) |
| $50,000 to $74,999 | 31 (14.5%) | 15 (4.6%) |
| $75,000 to $99,999 | 75 (35.0%) | 33 (10.2%) |
| $100,000 to $149,999 | 7 (3.3%) | 47 (14.5%) |
| $150,000 or more | 8 (3.7%) | 135 (41.8%) |
| Total | 214 (100.0%) | 323 (100.0%) |
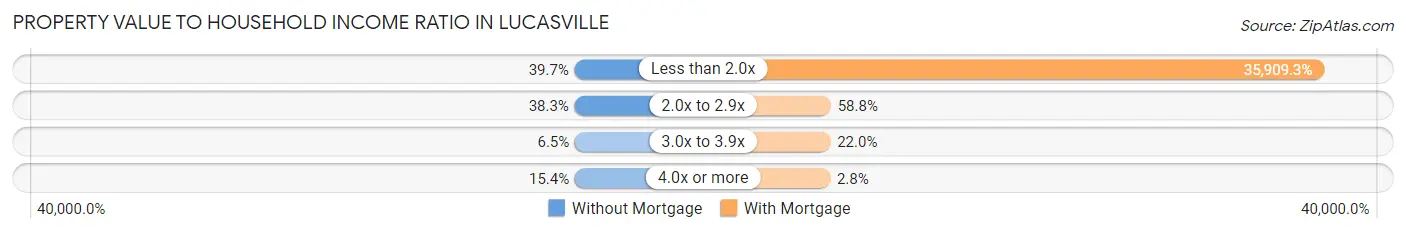
Property Value to Household Income Ratio in Lucasville
| Value-to-Income Ratio | Without Mortgage | With Mortgage |
| Less than 2.0x | 85 (39.7%) | 115,987 (35,909.3%) |
| 2.0x to 2.9x | 82 (38.3%) | 190 (58.8%) |
| 3.0x to 3.9x | 14 (6.5%) | 71 (22.0%) |
| 4.0x or more | 33 (15.4%) | 9 (2.8%) |
| Total | 214 (100.0%) | 323 (100.0%) |
Real Estate Taxes by Mortgage Status in Lucasville

| Property Taxes | Without Mortgage | With Mortgage |
| Less than $800 | 78 (36.4%) | 0 (0.0%) |
| $800 to $1,499 | 26 (12.1%) | 19 (5.9%) |
| $800 to $1,499 | 110 (51.4%) | 96 (29.7%) |
| Total | 214 (100.0%) | 323 (100.0%) |
Health & Disability in Lucasville
Health Insurance Coverage by Age in Lucasville
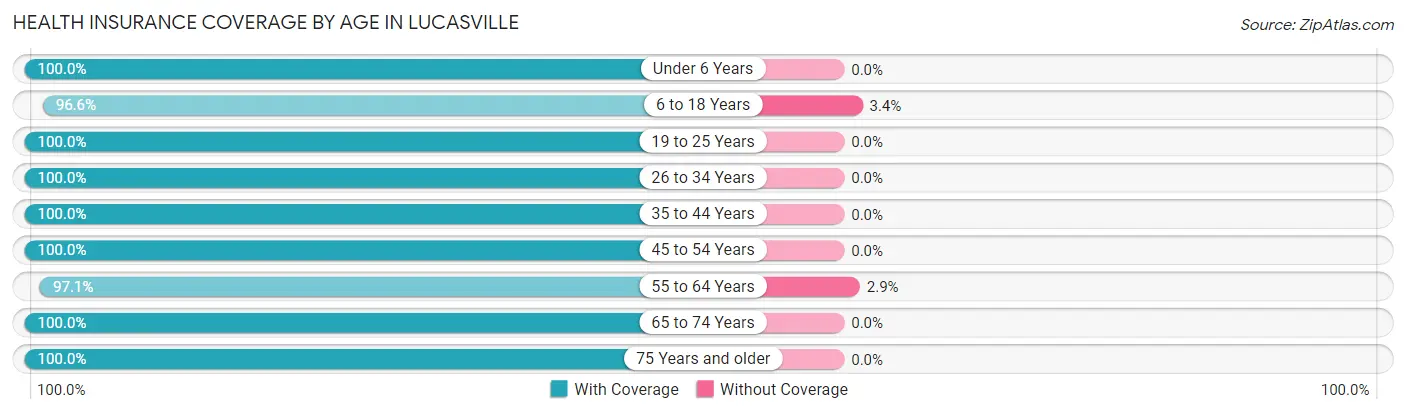
| Age Bracket | With Coverage | Without Coverage |
| Under 6 Years | 80 (100.0%) | 0 (0.0%) |
| 6 to 18 Years | 227 (96.6%) | 8 (3.4%) |
| 19 to 25 Years | 197 (100.0%) | 0 (0.0%) |
| 26 to 34 Years | 203 (100.0%) | 0 (0.0%) |
| 35 to 44 Years | 220 (100.0%) | 0 (0.0%) |
| 45 to 54 Years | 257 (100.0%) | 0 (0.0%) |
| 55 to 64 Years | 234 (97.1%) | 7 (2.9%) |
| 65 to 74 Years | 244 (100.0%) | 0 (0.0%) |
| 75 Years and older | 172 (100.0%) | 0 (0.0%) |
| Total | 1,834 (99.2%) | 15 (0.8%) |
Health Insurance Coverage by Citizenship Status in Lucasville

| Citizenship Status | With Coverage | Without Coverage |
| Native Born | 80 (100.0%) | 0 (0.0%) |
| Foreign Born, Citizen | 227 (96.6%) | 8 (3.4%) |
| Foreign Born, not a Citizen | 197 (100.0%) | 0 (0.0%) |
Health Insurance Coverage by Household Income in Lucasville

| Household Income | With Coverage | Without Coverage |
| Under $25,000 | 98 (100.0%) | 0 (0.0%) |
| $25,000 to $49,999 | 476 (97.0%) | 15 (3.0%) |
| $50,000 to $74,999 | 137 (100.0%) | 0 (0.0%) |
| $75,000 to $99,999 | 313 (100.0%) | 0 (0.0%) |
| $100,000 and over | 810 (100.0%) | 0 (0.0%) |
Public vs Private Health Insurance Coverage by Age in Lucasville
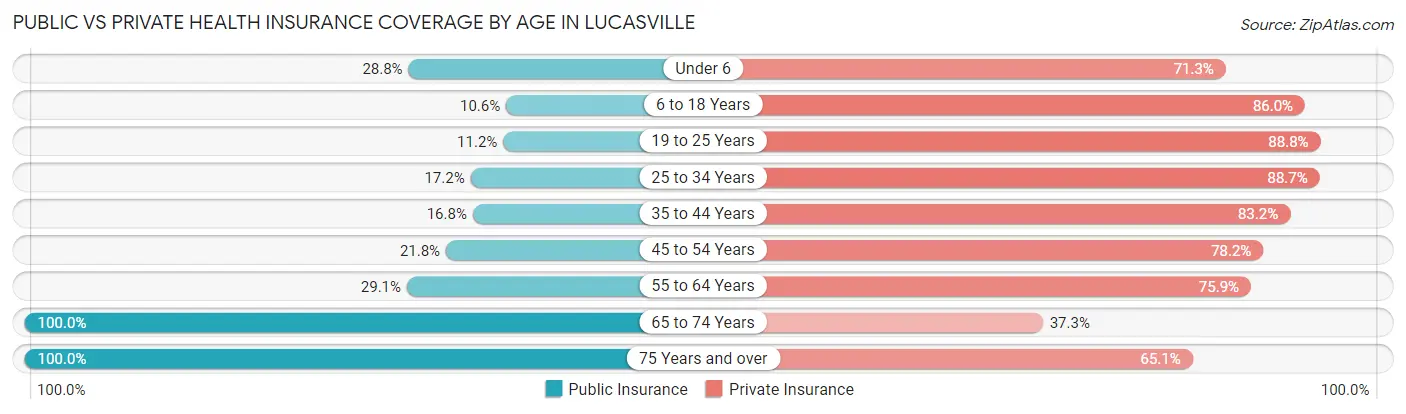
| Age Bracket | Public Insurance | Private Insurance |
| Under 6 | 23 (28.7%) | 57 (71.3%) |
| 6 to 18 Years | 25 (10.6%) | 202 (86.0%) |
| 19 to 25 Years | 22 (11.2%) | 175 (88.8%) |
| 25 to 34 Years | 35 (17.2%) | 180 (88.7%) |
| 35 to 44 Years | 37 (16.8%) | 183 (83.2%) |
| 45 to 54 Years | 56 (21.8%) | 201 (78.2%) |
| 55 to 64 Years | 70 (29.0%) | 183 (75.9%) |
| 65 to 74 Years | 244 (100.0%) | 91 (37.3%) |
| 75 Years and over | 172 (100.0%) | 112 (65.1%) |
| Total | 684 (37.0%) | 1,384 (74.9%) |
Disability Status by Sex by Age in Lucasville
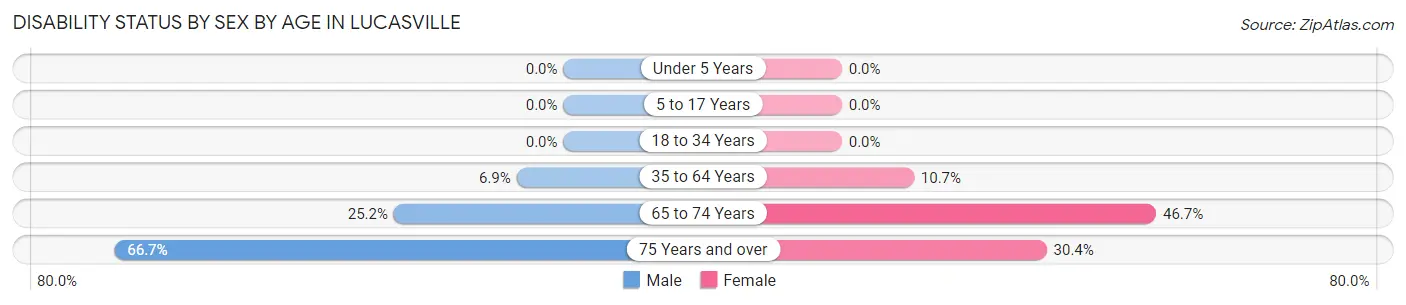
| Age Bracket | Male | Female |
| Under 5 Years | 0 (0.0%) | 0 (0.0%) |
| 5 to 17 Years | 0 (0.0%) | 0 (0.0%) |
| 18 to 34 Years | 0 (0.0%) | 0 (0.0%) |
| 35 to 64 Years | 31 (6.9%) | 29 (10.7%) |
| 65 to 74 Years | 35 (25.2%) | 49 (46.7%) |
| 75 Years and over | 16 (66.7%) | 45 (30.4%) |
Disability Class by Sex by Age in Lucasville
Disability Class: Hearing Difficulty
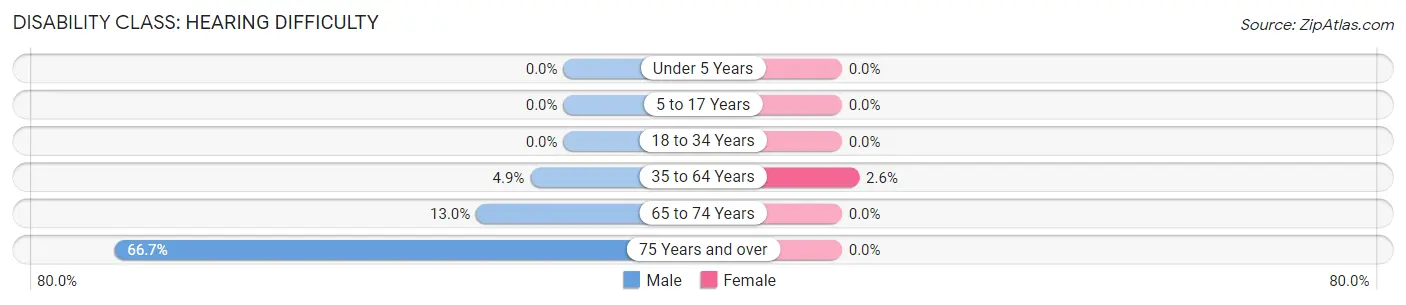
| Age Bracket | Male | Female |
| Under 5 Years | 0 (0.0%) | 0 (0.0%) |
| 5 to 17 Years | 0 (0.0%) | 0 (0.0%) |
| 18 to 34 Years | 0 (0.0%) | 0 (0.0%) |
| 35 to 64 Years | 22 (4.9%) | 7 (2.6%) |
| 65 to 74 Years | 18 (13.0%) | 0 (0.0%) |
| 75 Years and over | 16 (66.7%) | 0 (0.0%) |
Disability Class: Vision Difficulty
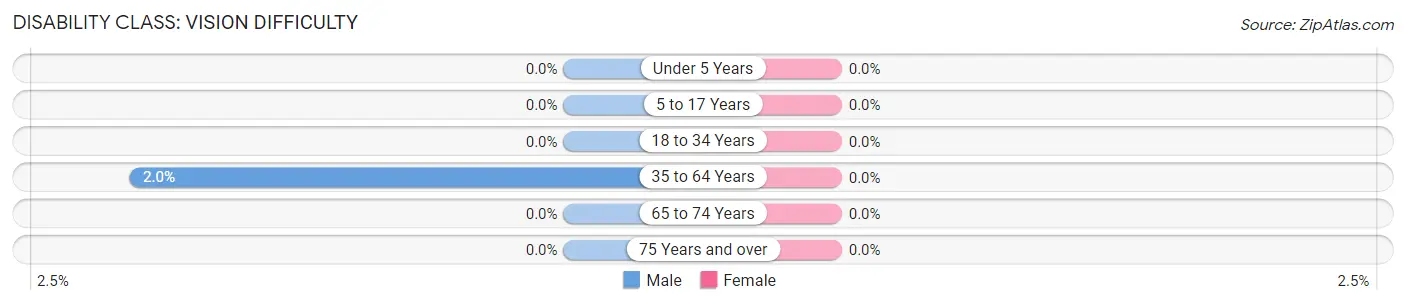
| Age Bracket | Male | Female |
| Under 5 Years | 0 (0.0%) | 0 (0.0%) |
| 5 to 17 Years | 0 (0.0%) | 0 (0.0%) |
| 18 to 34 Years | 0 (0.0%) | 0 (0.0%) |
| 35 to 64 Years | 9 (2.0%) | 0 (0.0%) |
| 65 to 74 Years | 0 (0.0%) | 0 (0.0%) |
| 75 Years and over | 0 (0.0%) | 0 (0.0%) |
Disability Class: Cognitive Difficulty
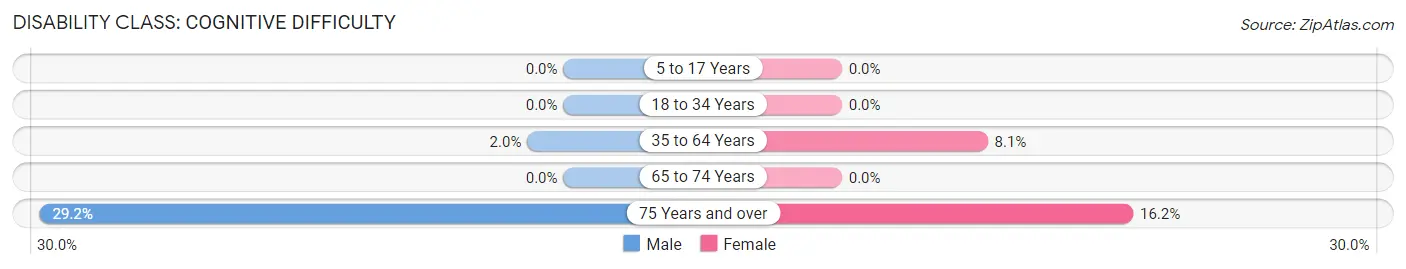
| Age Bracket | Male | Female |
| 5 to 17 Years | 0 (0.0%) | 0 (0.0%) |
| 18 to 34 Years | 0 (0.0%) | 0 (0.0%) |
| 35 to 64 Years | 9 (2.0%) | 22 (8.1%) |
| 65 to 74 Years | 0 (0.0%) | 0 (0.0%) |
| 75 Years and over | 7 (29.2%) | 24 (16.2%) |
Disability Class: Ambulatory Difficulty
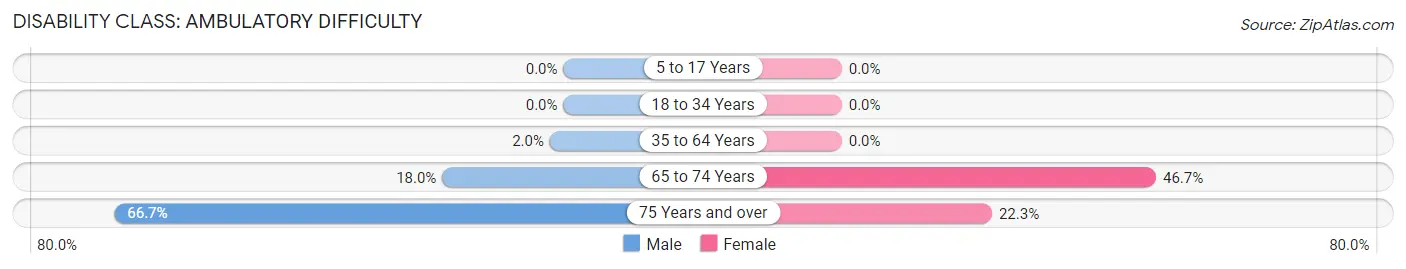
| Age Bracket | Male | Female |
| 5 to 17 Years | 0 (0.0%) | 0 (0.0%) |
| 18 to 34 Years | 0 (0.0%) | 0 (0.0%) |
| 35 to 64 Years | 9 (2.0%) | 0 (0.0%) |
| 65 to 74 Years | 25 (18.0%) | 49 (46.7%) |
| 75 Years and over | 16 (66.7%) | 33 (22.3%) |
Disability Class: Self-Care Difficulty
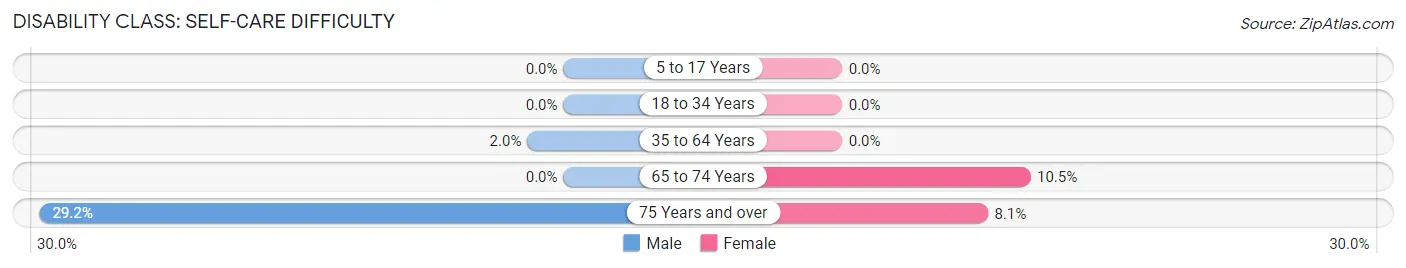
| Age Bracket | Male | Female |
| 5 to 17 Years | 0 (0.0%) | 0 (0.0%) |
| 18 to 34 Years | 0 (0.0%) | 0 (0.0%) |
| 35 to 64 Years | 9 (2.0%) | 0 (0.0%) |
| 65 to 74 Years | 0 (0.0%) | 11 (10.5%) |
| 75 Years and over | 7 (29.2%) | 12 (8.1%) |
Technology Access in Lucasville
Computing Device Access in Lucasville
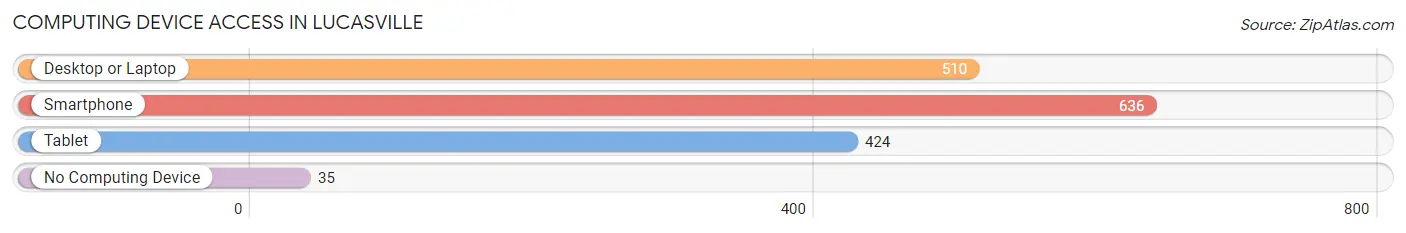
| Device Type | # Households | % Households |
| Desktop or Laptop | 510 | 73.7% |
| Smartphone | 636 | 91.9% |
| Tablet | 424 | 61.3% |
| No Computing Device | 35 | 5.1% |
| Total | 692 | 100.0% |
Internet Access in Lucasville
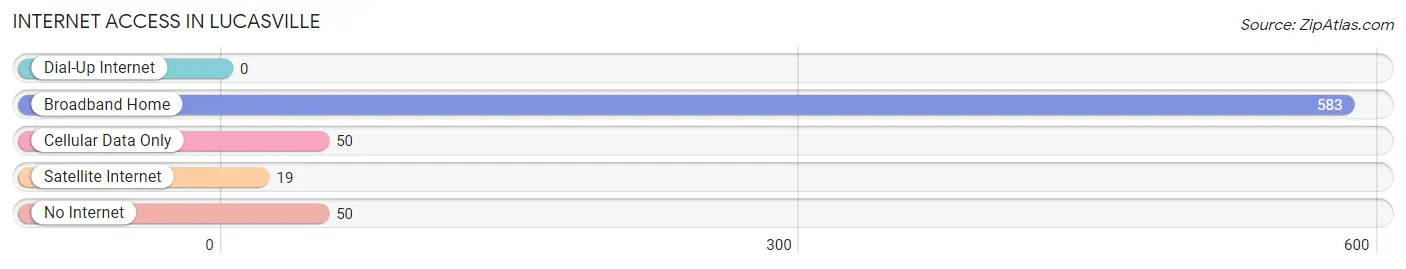
| Internet Type | # Households | % Households |
| Dial-Up Internet | 0 | 0.0% |
| Broadband Home | 583 | 84.3% |
| Cellular Data Only | 50 | 7.2% |
| Satellite Internet | 19 | 2.8% |
| No Internet | 50 | 7.2% |
| Total | 692 | 100.0% |
Lucasville Summary
Lucasville is a small unincorporated community located in Scioto County, Ohio. It is situated along the Ohio River, approximately 10 miles south of Portsmouth. The population of Lucasville was estimated to be 1,845 in 2019.
History
Lucasville was founded in 1817 by William Lucas, a Revolutionary War veteran. The town was originally known as Lucasville Station, and was a stop on the Scioto and Hocking Valley Railroad. The town was officially incorporated in 1854.
In the late 19th century, Lucasville was a major center for the production of coal and iron. The town was home to several coal mines, iron furnaces, and other industries. The town also had a large number of saloons and other businesses.
In the early 20th century, Lucasville was a major center for the production of tobacco. The town was home to several tobacco warehouses and factories. The town also had a large number of stores and other businesses.
Geography
Lucasville is located in Scioto County, Ohio. It is situated along the Ohio River, approximately 10 miles south of Portsmouth. The town is located in a rural area, and is surrounded by farmland and woodlands.
The climate in Lucasville is humid continental, with hot summers and cold winters. The average annual temperature is around 50°F, and the average annual precipitation is around 40 inches.
Economy
The economy of Lucasville is largely based on agriculture and manufacturing. The town is home to several farms, and is a major producer of corn, soybeans, and other crops. The town is also home to several manufacturing companies, including a steel mill and a paper mill.
The town is also home to several retail stores, restaurants, and other businesses. The town is served by several major highways, including US Route 23 and State Route 32.
Demographics
As of the 2019 census, the population of Lucasville was estimated to be 1,845. The racial makeup of the town was 97.3% White, 0.7% African American, 0.3% Native American, 0.2% Asian, and 1.5% from other races. The median household income was $37,917, and the median family income was $45,917.
The town is served by the Lucasville Local School District. The district has one elementary school, one middle school, and one high school. The town is also home to several churches, including the Lucasville United Methodist Church and the Lucasville Baptist Church.
Common Questions
What is the Total Population of Lucasville?
Total Population of Lucasville is 1,849.
What is the Total Male Population of Lucasville?
Total Male Population of Lucasville is 984.
What is the Total Female Population of Lucasville?
Total Female Population of Lucasville is 865.
What is the Ratio of Males per 100 Females in Lucasville?
There are 113.76 Males per 100 Females in Lucasville.
What is the Ratio of Females per 100 Males in Lucasville?
There are 87.91 Females per 100 Males in Lucasville.
What is the Median Population Age in Lucasville?
Median Population Age in Lucasville is 44.9 Years.
What is the Average Family Size in Lucasville
Average Family Size in Lucasville is 3.2 People.
What is the Average Household Size in Lucasville
Average Household Size in Lucasville is 2.7 People.
What is Per Capita Income in Lucasville?
Per Capita income in Lucasville is $32,624.
What is the Median Family Income in Lucasville?
Median Family Income in Lucasville is $88,662.
What is the Median Household income in Lucasville?
Median Household Income in Lucasville is $76,250.
What is Income or Wage Gap in Lucasville?
Income or Wage Gap in Lucasville is 31.5%.
Women in Lucasville earn 68.5 cents for every dollar earned by a man.
What is Inequality or Gini Index in Lucasville?
Inequality or Gini Index in Lucasville is 0.34.
How Large is the Labor Force in Lucasville?
There are 838 People in the Labor Forcein in Lucasville.
What is the Percentage of People in the Labor Force in Lucasville?
52.5% of People are in the Labor Force in Lucasville.
What is the Unemployment Rate in Lucasville?
Unemployment Rate in Lucasville is 2.6%.