Forestville, OH
Forestville Map
Forestville Overview
10,724
TOTAL POPULATION
5,271
MALE POPULATION
5,453
FEMALE POPULATION
96.66
MALES / 100 FEMALES
103.45
FEMALES / 100 MALES
46.7
MEDIAN AGE
3.0
AVG FAMILY SIZE
2.3
AVG HOUSEHOLD SIZE
$49,040
PER CAPITA INCOME
$122,023
AVG FAMILY INCOME
$90,313
AVG HOUSEHOLD INCOME
12.7%
WAGE / INCOME GAP [ % ]
87.3¢/ $1
WAGE / INCOME GAP [ $ ]
0.46
INEQUALITY / GINI INDEX
5,370
LABOR FORCE [ PEOPLE ]
62.3%
PERCENT IN LABOR FORCE
5.7%
UNEMPLOYMENT RATE
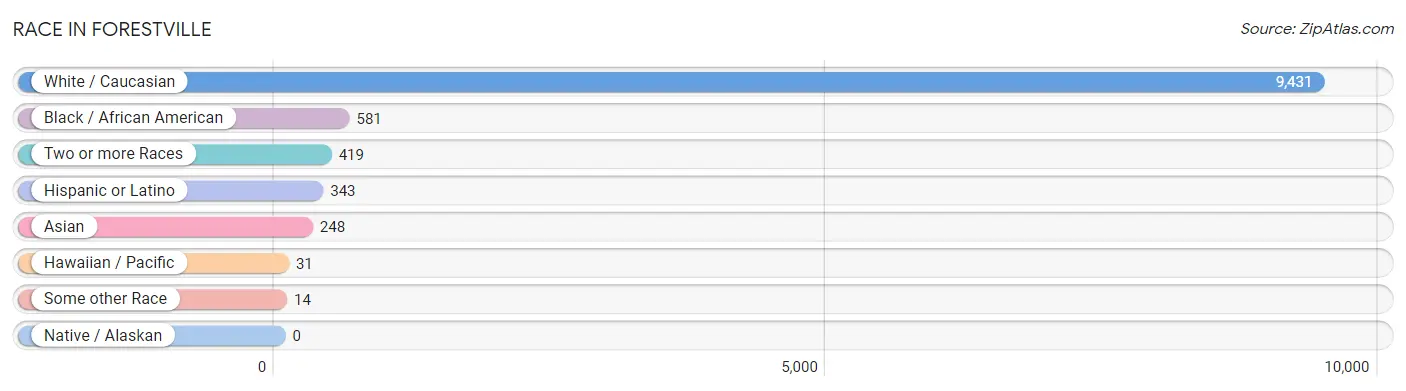
Race in Forestville
The most populous races in Forestville are White / Caucasian (9,431 | 87.9%), Black / African American (581 | 5.4%), and Two or more Races (419 | 3.9%).
| Race | # Population | % Population |
| Asian | 248 | 2.3% |
| Black / African American | 581 | 5.4% |
| Hawaiian / Pacific | 31 | 0.3% |
| Hispanic or Latino | 343 | 3.2% |
| Native / Alaskan | 0 | 0.0% |
| White / Caucasian | 9,431 | 87.9% |
| Two or more Races | 419 | 3.9% |
| Some other Race | 14 | 0.1% |
| Total | 10,724 | 100.0% |
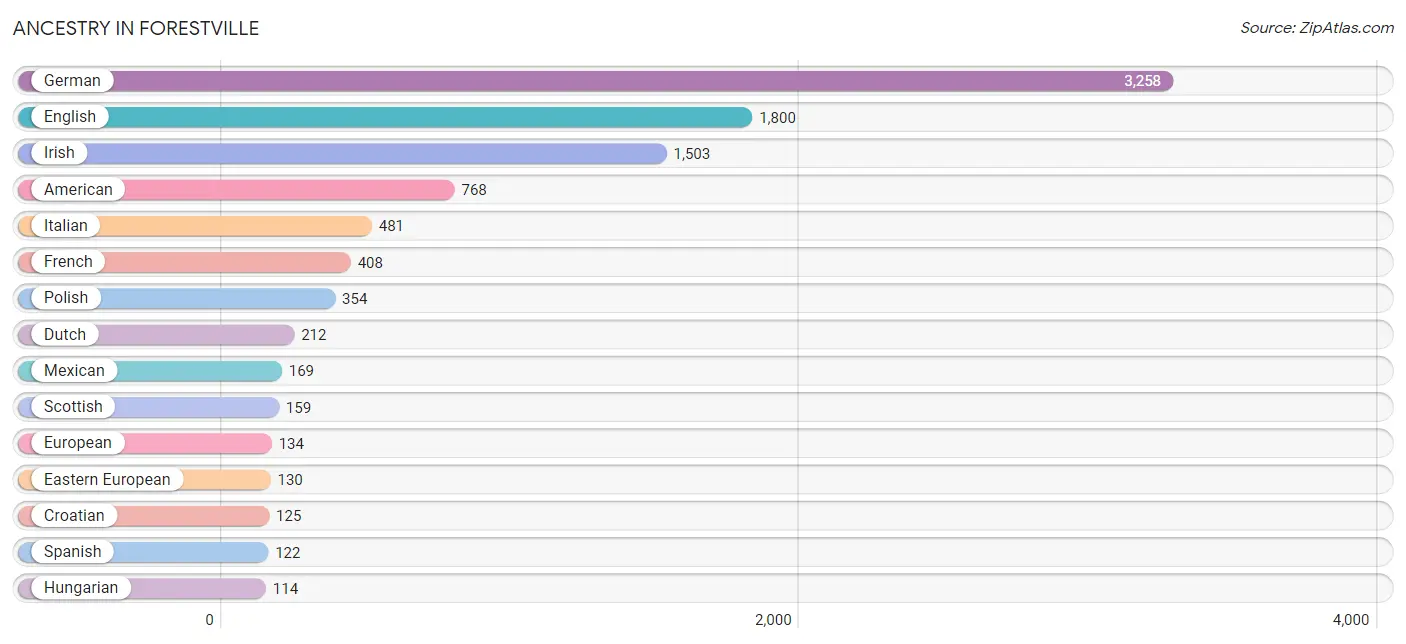
Ancestry in Forestville
The most populous ancestries reported in Forestville are German (3,258 | 30.4%), English (1,800 | 16.8%), Irish (1,503 | 14.0%), American (768 | 7.2%), and Italian (481 | 4.5%), together accounting for 72.8% of all Forestville residents.
| Ancestry | # Population | % Population |
| American | 768 | 7.2% |
| Austrian | 62 | 0.6% |
| Belgian | 49 | 0.5% |
| Bhutanese | 59 | 0.5% |
| British | 53 | 0.5% |
| Croatian | 125 | 1.2% |
| Cuban | 21 | 0.2% |
| Czech | 39 | 0.4% |
| Danish | 11 | 0.1% |
| Dutch | 212 | 2.0% |
| Eastern European | 130 | 1.2% |
| English | 1,800 | 16.8% |
| Ethiopian | 96 | 0.9% |
| European | 134 | 1.3% |
| Finnish | 29 | 0.3% |
| French | 408 | 3.8% |
| French Canadian | 23 | 0.2% |
| German | 3,258 | 30.4% |
| Greek | 54 | 0.5% |
| Hungarian | 114 | 1.1% |
| Indian (Asian) | 38 | 0.4% |
| Irish | 1,503 | 14.0% |
| Italian | 481 | 4.5% |
| Korean | 66 | 0.6% |
| Lithuanian | 25 | 0.2% |
| Mexican | 169 | 1.6% |
| Northern European | 14 | 0.1% |
| Norwegian | 26 | 0.2% |
| Polish | 354 | 3.3% |
| Romanian | 9 | 0.1% |
| Russian | 81 | 0.8% |
| Scandinavian | 40 | 0.4% |
| Scotch-Irish | 79 | 0.7% |
| Scottish | 159 | 1.5% |
| Serbian | 14 | 0.1% |
| Slovak | 14 | 0.1% |
| Spaniard | 31 | 0.3% |
| Spanish | 122 | 1.1% |
| Subsaharan African | 96 | 0.9% |
| Swedish | 34 | 0.3% |
| Swiss | 25 | 0.2% |
| Ukrainian | 93 | 0.9% |
| Welsh | 90 | 0.8% | View All 43 Rows |
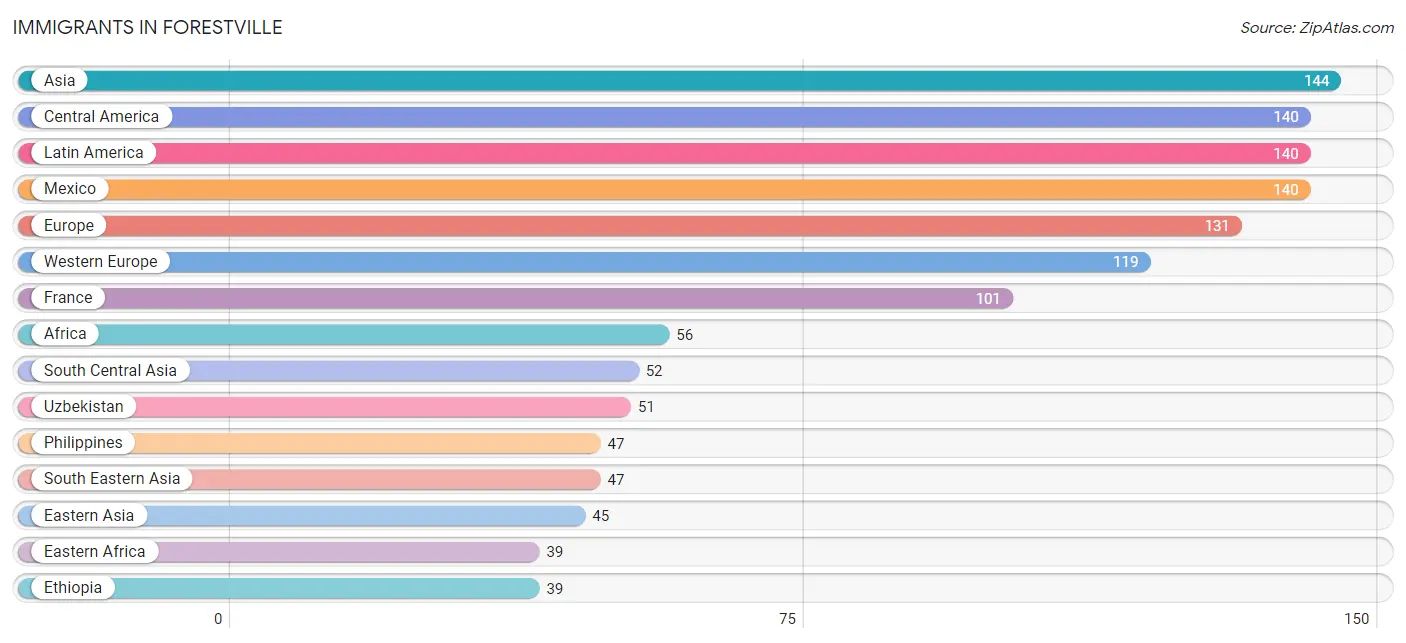
Immigrants in Forestville
The most numerous immigrant groups reported in Forestville came from Asia (144 | 1.3%), Central America (140 | 1.3%), Latin America (140 | 1.3%), Mexico (140 | 1.3%), and Europe (131 | 1.2%), together accounting for 6.5% of all Forestville residents.
| Immigration Origin | # Population | % Population |
| Africa | 56 | 0.5% |
| Asia | 144 | 1.3% |
| Central America | 140 | 1.3% |
| China | 17 | 0.2% |
| Eastern Africa | 39 | 0.4% |
| Eastern Asia | 45 | 0.4% |
| Ethiopia | 39 | 0.4% |
| Europe | 131 | 1.2% |
| France | 101 | 0.9% |
| Greece | 12 | 0.1% |
| India | 1 | 0.0% |
| Japan | 28 | 0.3% |
| Latin America | 140 | 1.3% |
| Mexico | 140 | 1.3% |
| Philippines | 47 | 0.4% |
| South Africa | 17 | 0.2% |
| South Central Asia | 52 | 0.5% |
| South Eastern Asia | 47 | 0.4% |
| Southern Europe | 12 | 0.1% |
| Switzerland | 18 | 0.2% |
| Uzbekistan | 51 | 0.5% |
| Western Europe | 119 | 1.1% | View All 22 Rows |
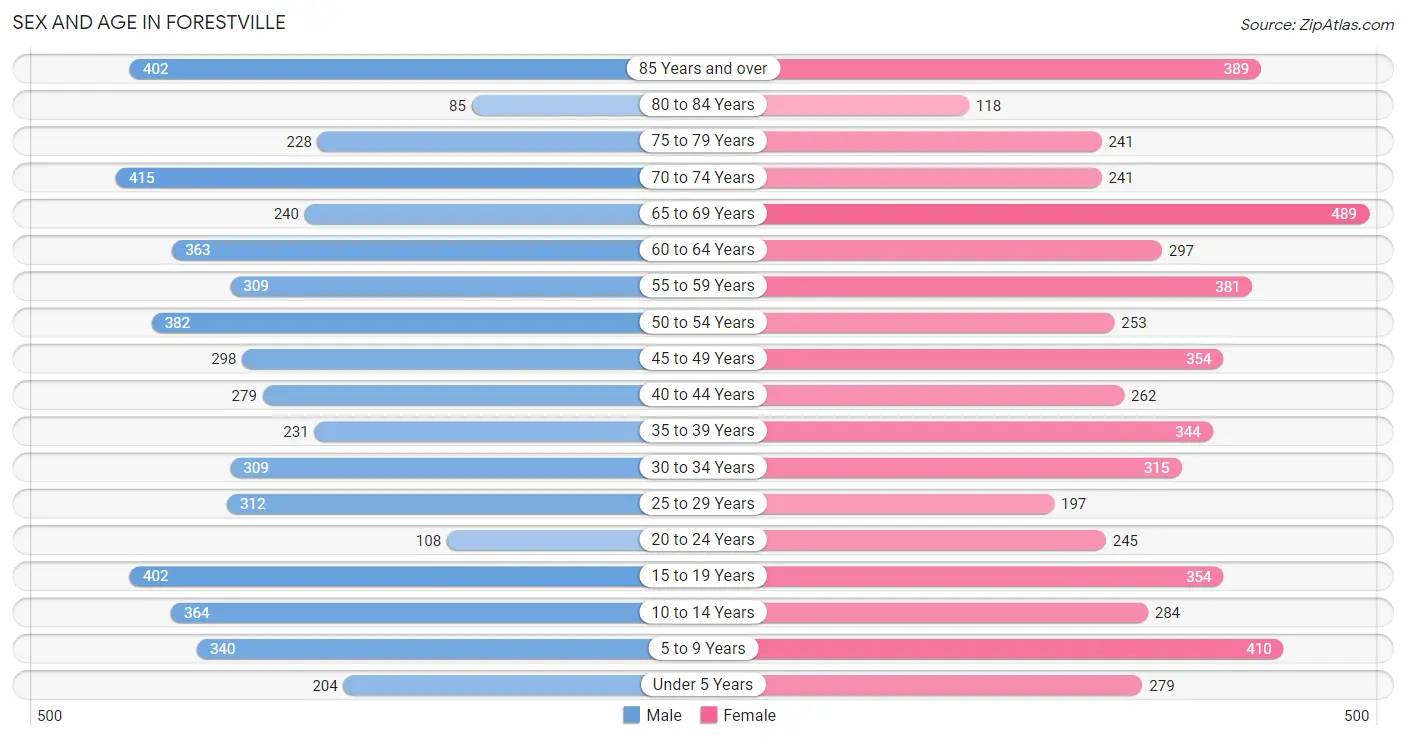
Sex and Age in Forestville
Sex and Age in Forestville
The most populous age groups in Forestville are 70 to 74 Years (415 | 7.9%) for men and 65 to 69 Years (489 | 9.0%) for women.
| Age Bracket | Male | Female |
| Under 5 Years | 204 (3.9%) | 279 (5.1%) |
| 5 to 9 Years | 340 (6.5%) | 410 (7.5%) |
| 10 to 14 Years | 364 (6.9%) | 284 (5.2%) |
| 15 to 19 Years | 402 (7.6%) | 354 (6.5%) |
| 20 to 24 Years | 108 (2.1%) | 245 (4.5%) |
| 25 to 29 Years | 312 (5.9%) | 197 (3.6%) |
| 30 to 34 Years | 309 (5.9%) | 315 (5.8%) |
| 35 to 39 Years | 231 (4.4%) | 344 (6.3%) |
| 40 to 44 Years | 279 (5.3%) | 262 (4.8%) |
| 45 to 49 Years | 298 (5.7%) | 354 (6.5%) |
| 50 to 54 Years | 382 (7.2%) | 253 (4.6%) |
| 55 to 59 Years | 309 (5.9%) | 381 (7.0%) |
| 60 to 64 Years | 363 (6.9%) | 297 (5.4%) |
| 65 to 69 Years | 240 (4.5%) | 489 (9.0%) |
| 70 to 74 Years | 415 (7.9%) | 241 (4.4%) |
| 75 to 79 Years | 228 (4.3%) | 241 (4.4%) |
| 80 to 84 Years | 85 (1.6%) | 118 (2.2%) |
| 85 Years and over | 402 (7.6%) | 389 (7.1%) |
| Total | 5,271 (100.0%) | 5,453 (100.0%) |
Families and Households in Forestville
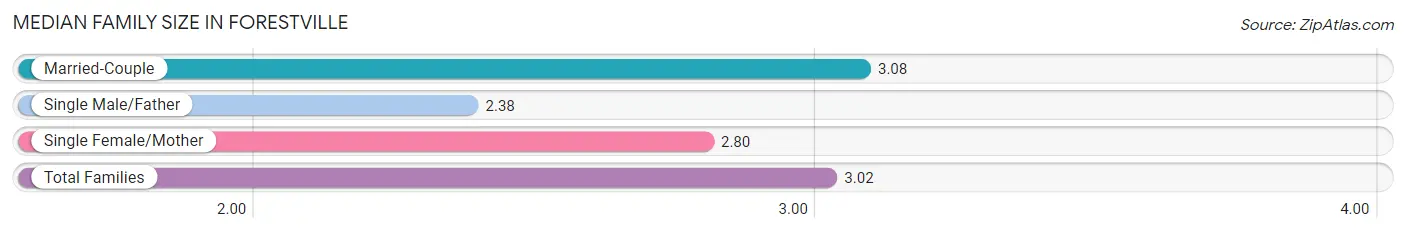
Median Family Size in Forestville
The median family size in Forestville is 3.02 persons per family, with married-couple families (2,342 | 81.9%) accounting for the largest median family size of 3.08 persons per family. On the other hand, single male/father families (108 | 3.8%) represent the smallest median family size with 2.38 persons per family.
| Family Type | # Families | Family Size |
| Married-Couple | 2,342 (81.9%) | 3.08 |
| Single Male/Father | 108 (3.8%) | 2.38 |
| Single Female/Mother | 409 (14.3%) | 2.80 |
| Total Families | 2,859 (100.0%) | 3.02 |
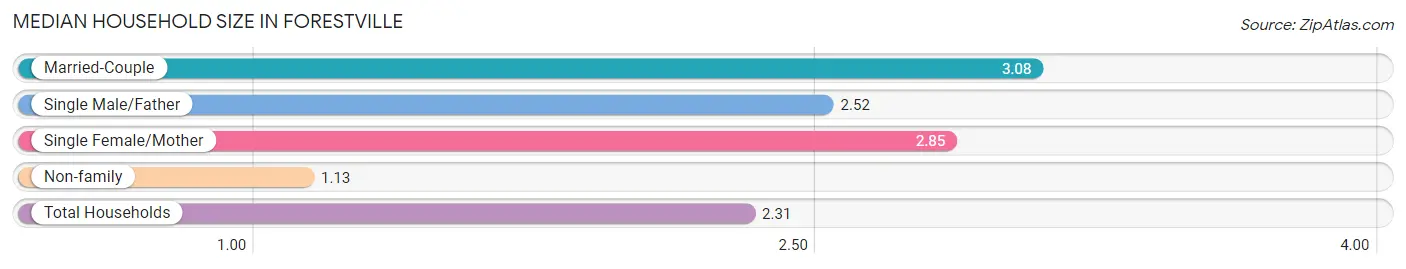
Median Household Size in Forestville
The median household size in Forestville is 2.31 persons per household, with married-couple households (2,342 | 50.9%) accounting for the largest median household size of 3.08 persons per household. non-family households (1,741 | 37.9%) represent the smallest median household size with 1.13 persons per household.
| Household Type | # Households | Household Size |
| Married-Couple | 2,342 (50.9%) | 3.08 |
| Single Male/Father | 108 (2.4%) | 2.52 |
| Single Female/Mother | 409 (8.9%) | 2.85 |
| Non-family | 1,741 (37.9%) | 1.13 |
| Total Households | 4,600 (100.0%) | 2.31 |
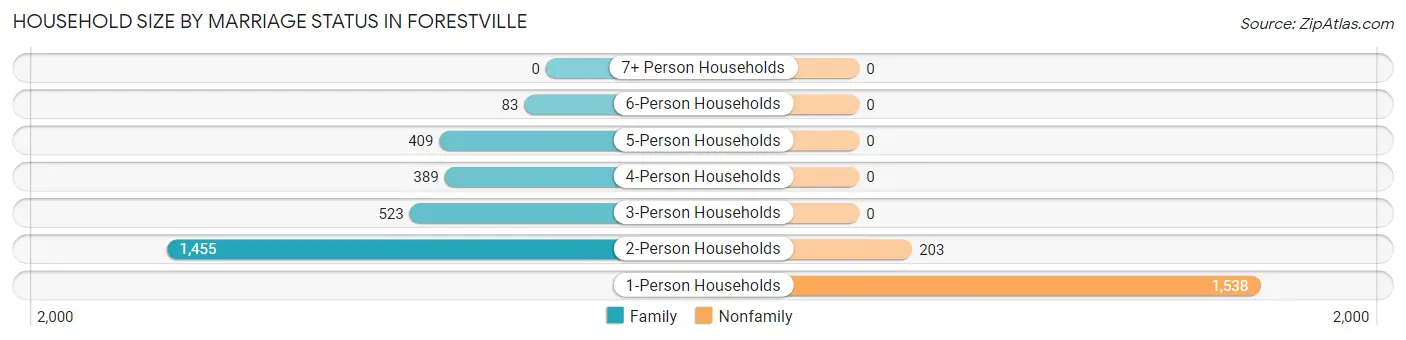
Household Size by Marriage Status in Forestville
Out of a total of 4,600 households in Forestville, 2,859 (62.2%) are family households, while 1,741 (37.9%) are nonfamily households. The most numerous type of family households are 2-person households, comprising 1,455, and the most common type of nonfamily households are 1-person households, comprising 1,538.
| Household Size | Family Households | Nonfamily Households |
| 1-Person Households | - | 1,538 (33.4%) |
| 2-Person Households | 1,455 (31.6%) | 203 (4.4%) |
| 3-Person Households | 523 (11.4%) | 0 (0.0%) |
| 4-Person Households | 389 (8.5%) | 0 (0.0%) |
| 5-Person Households | 409 (8.9%) | 0 (0.0%) |
| 6-Person Households | 83 (1.8%) | 0 (0.0%) |
| 7+ Person Households | 0 (0.0%) | 0 (0.0%) |
| Total | 2,859 (62.2%) | 1,741 (37.9%) |
Female Fertility in Forestville
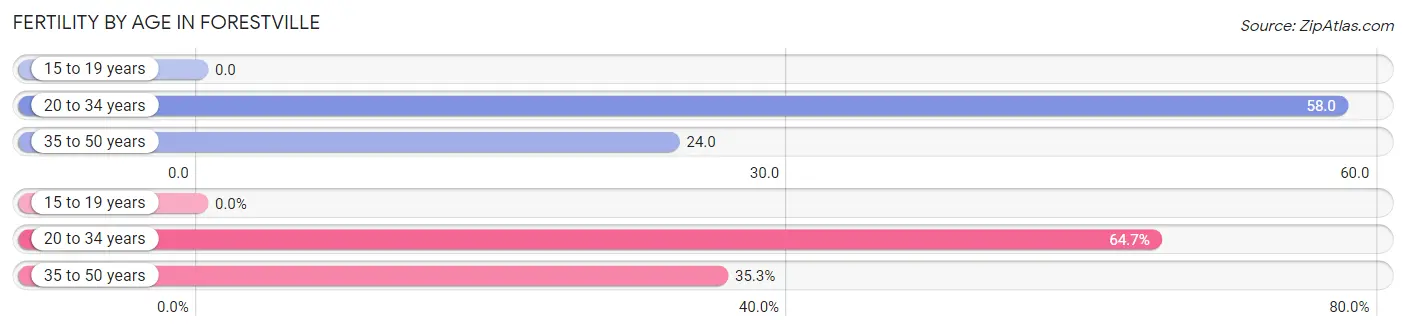
Fertility by Age in Forestville
Average fertility rate in Forestville is 32.0 births per 1,000 women. Women in the age bracket of 20 to 34 years have the highest fertility rate with 58.0 births per 1,000 women. Women in the age bracket of 20 to 34 years acount for 64.7% of all women with births.
| Age Bracket | Women with Births | Births / 1,000 Women |
| 15 to 19 years | 0 (0.0%) | 0.0 |
| 20 to 34 years | 44 (64.7%) | 58.0 |
| 35 to 50 years | 24 (35.3%) | 24.0 |
| Total | 68 (100.0%) | 32.0 |
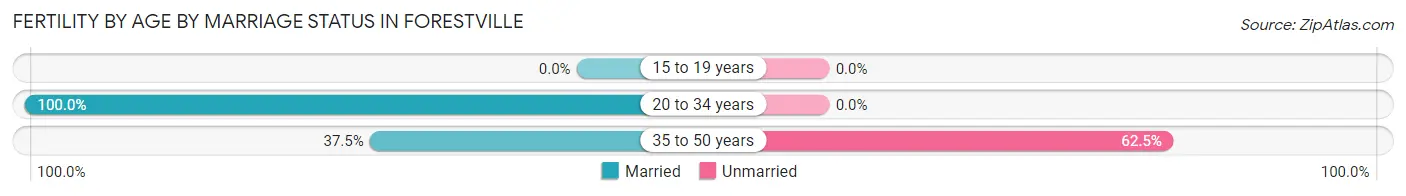
Fertility by Age by Marriage Status in Forestville
77.9% of women with births (68) in Forestville are married. The highest percentage of unmarried women with births falls into 35 to 50 years age bracket with 62.5% of them unmarried at the time of birth, while the lowest percentage of unmarried women with births belong to 20 to 34 years age bracket with 0.0% of them unmarried.
| Age Bracket | Married | Unmarried |
| 15 to 19 years | 0 (0.0%) | 0 (0.0%) |
| 20 to 34 years | 44 (100.0%) | 0 (0.0%) |
| 35 to 50 years | 9 (37.5%) | 15 (62.5%) |
| Total | 53 (77.9%) | 15 (22.1%) |
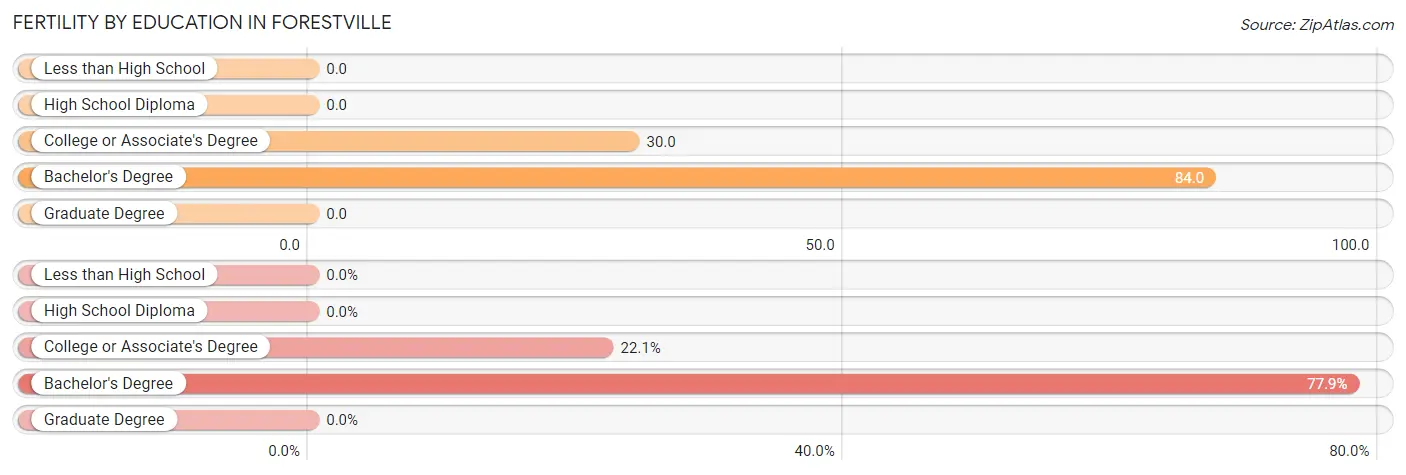
Fertility by Education in Forestville
| Educational Attainment | Women with Births | Births / 1,000 Women |
| Less than High School | 0 (0.0%) | 0.0 |
| High School Diploma | 0 (0.0%) | 0.0 |
| College or Associate's Degree | 15 (22.1%) | 30.0 |
| Bachelor's Degree | 53 (77.9%) | 84.0 |
| Graduate Degree | 0 (0.0%) | 0.0 |
| Total | 68 (100.0%) | 32.0 |
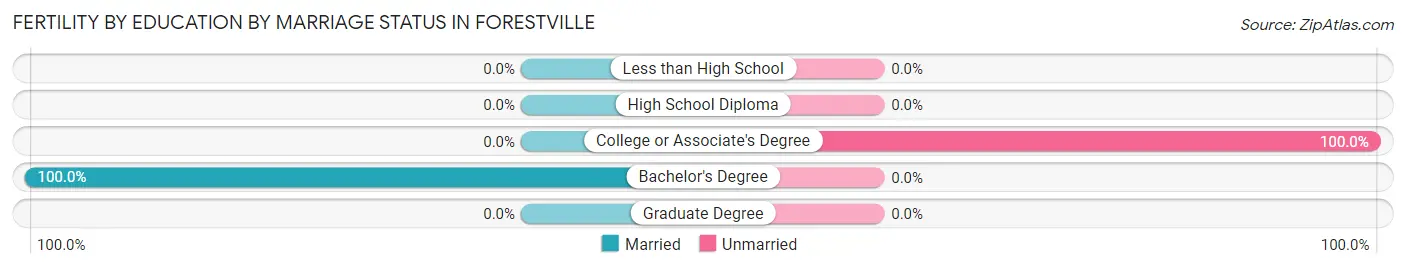
Fertility by Education by Marriage Status in Forestville
22.1% of women with births in Forestville are unmarried. Women with the educational attainment of bachelor's degree are most likely to be married with 100.0% of them married at childbirth, while women with the educational attainment of college or associate's degree are least likely to be married with 100.0% of them unmarried at childbirth.
| Educational Attainment | Married | Unmarried |
| Less than High School | 0 (0.0%) | 0 (0.0%) |
| High School Diploma | 0 (0.0%) | 0 (0.0%) |
| College or Associate's Degree | 0 (0.0%) | 15 (100.0%) |
| Bachelor's Degree | 53 (100.0%) | 0 (0.0%) |
| Graduate Degree | 0 (0.0%) | 0 (0.0%) |
| Total | 53 (77.9%) | 15 (22.1%) |
Income in Forestville
Income Overview in Forestville
Per Capita Income in Forestville is $49,040, while median incomes of families and households are $122,023 and $90,313 respectively.
| Characteristic | Number | Measure |
| Per Capita Income | 10,724 | $49,040 |
| Median Family Income | 2,859 | $122,023 |
| Mean Family Income | 2,859 | $152,421 |
| Median Household Income | 4,600 | $90,313 |
| Mean Household Income | 4,600 | $113,667 |
| Income Deficit | 2,859 | $0 |
| Wage / Income Gap (%) | 10,724 | 12.72% |
| Wage / Income Gap ($) | 10,724 | 87.28¢ per $1 |
| Gini / Inequality Index | 10,724 | 0.46 |
Earnings by Sex in Forestville
Average Earnings in Forestville are $47,513, $51,429 for men and $44,887 for women, a difference of 12.7%.
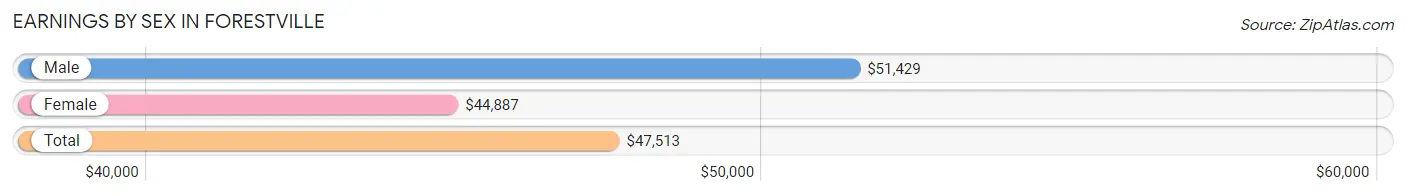
| Sex | Number | Average Earnings |
| Male | 3,062 (53.9%) | $51,429 |
| Female | 2,623 (46.1%) | $44,887 |
| Total | 5,685 (100.0%) | $47,513 |
Earnings by Sex by Income Bracket in Forestville
The most common earnings brackets in Forestville are $100,000+ for men (808 | 26.4%) and $100,000+ for women (445 | 17.0%).
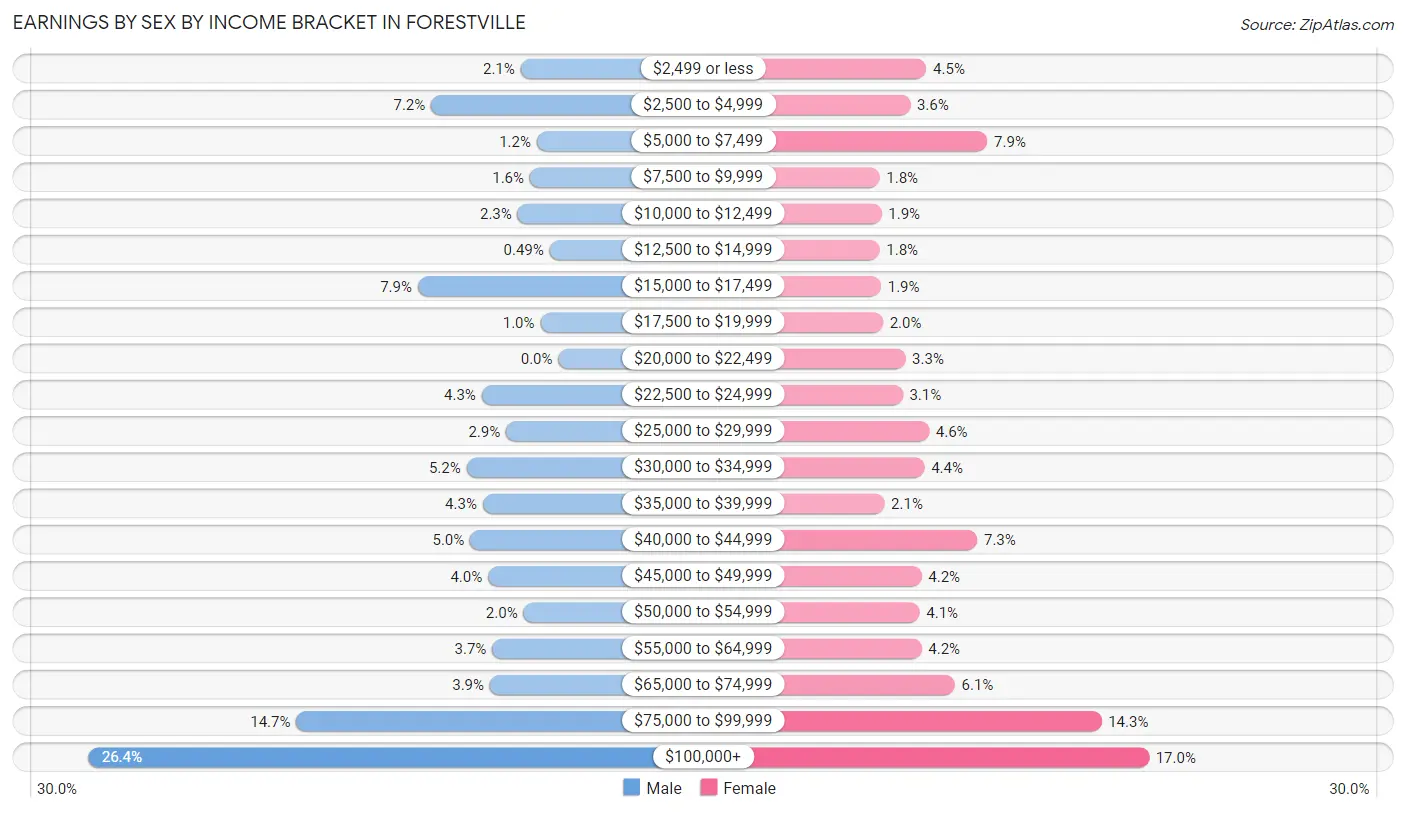
| Income | Male | Female |
| $2,499 or less | 65 (2.1%) | 117 (4.5%) |
| $2,500 to $4,999 | 219 (7.1%) | 93 (3.5%) |
| $5,000 to $7,499 | 37 (1.2%) | 207 (7.9%) |
| $7,500 to $9,999 | 49 (1.6%) | 48 (1.8%) |
| $10,000 to $12,499 | 70 (2.3%) | 51 (1.9%) |
| $12,500 to $14,999 | 15 (0.5%) | 48 (1.8%) |
| $15,000 to $17,499 | 242 (7.9%) | 50 (1.9%) |
| $17,500 to $19,999 | 31 (1.0%) | 53 (2.0%) |
| $20,000 to $22,499 | 0 (0.0%) | 86 (3.3%) |
| $22,500 to $24,999 | 132 (4.3%) | 82 (3.1%) |
| $25,000 to $29,999 | 90 (2.9%) | 121 (4.6%) |
| $30,000 to $34,999 | 158 (5.2%) | 114 (4.3%) |
| $35,000 to $39,999 | 130 (4.3%) | 55 (2.1%) |
| $40,000 to $44,999 | 152 (5.0%) | 192 (7.3%) |
| $45,000 to $49,999 | 121 (4.0%) | 110 (4.2%) |
| $50,000 to $54,999 | 60 (2.0%) | 107 (4.1%) |
| $55,000 to $64,999 | 114 (3.7%) | 110 (4.2%) |
| $65,000 to $74,999 | 118 (3.8%) | 159 (6.1%) |
| $75,000 to $99,999 | 451 (14.7%) | 375 (14.3%) |
| $100,000+ | 808 (26.4%) | 445 (17.0%) |
| Total | 3,062 (100.0%) | 2,623 (100.0%) |
Earnings by Sex by Educational Attainment in Forestville
Average earnings in Forestville are $68,361 for men and $49,223 for women, a difference of 28.0%. Men with an educational attainment of graduate degree enjoy the highest average annual earnings of $118,828, while those with high school diploma education earn the least with $31,677. Women with an educational attainment of graduate degree earn the most with the average annual earnings of $72,866, while those with high school diploma education have the smallest earnings of $33,693.
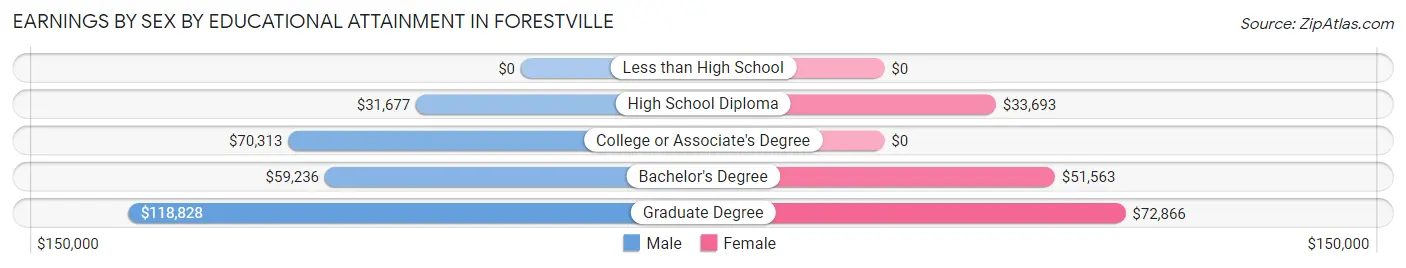
| Educational Attainment | Male Income | Female Income |
| Less than High School | - | - |
| High School Diploma | $31,677 | $33,693 |
| College or Associate's Degree | $70,313 | $0 |
| Bachelor's Degree | $59,236 | $51,563 |
| Graduate Degree | $118,828 | $72,866 |
| Total | $68,361 | $49,223 |
Family Income in Forestville
Family Income Brackets in Forestville
According to the Forestville family income data, there are 658 families falling into the $200,000+ income range, which is the most common income bracket and makes up 23.0% of all families. Conversely, the $10,000 to $14,999 income bracket is the least frequent group with only 34 families (1.2%) belonging to this category.
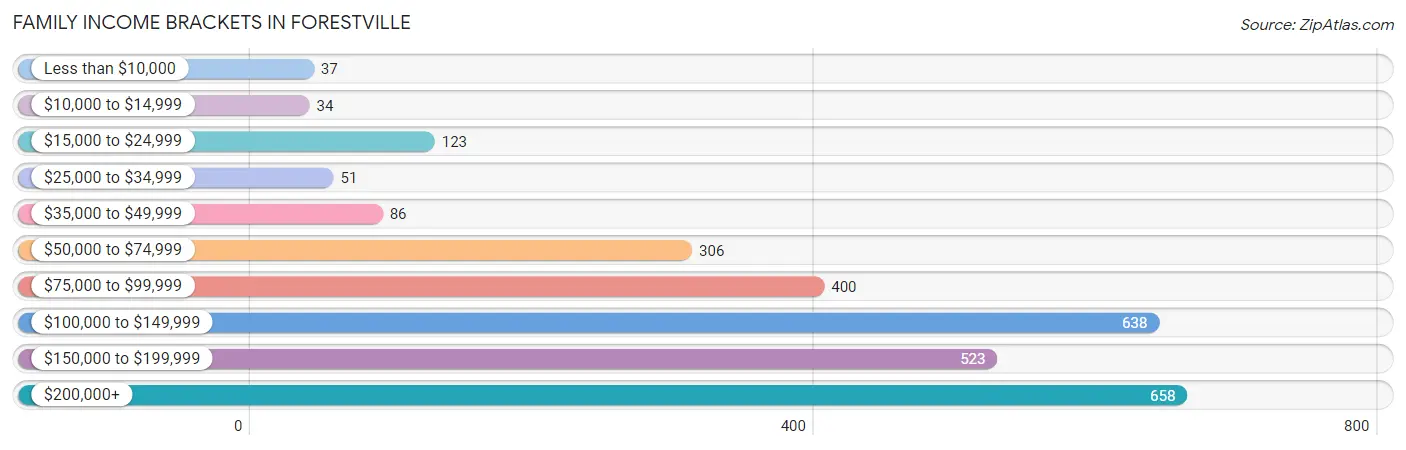
| Income Bracket | # Families | % Families |
| Less than $10,000 | 37 | 1.3% |
| $10,000 to $14,999 | 34 | 1.2% |
| $15,000 to $24,999 | 123 | 4.3% |
| $25,000 to $34,999 | 51 | 1.8% |
| $35,000 to $49,999 | 86 | 3.0% |
| $50,000 to $74,999 | 306 | 10.7% |
| $75,000 to $99,999 | 400 | 14.0% |
| $100,000 to $149,999 | 638 | 22.3% |
| $150,000 to $199,999 | 523 | 18.3% |
| $200,000+ | 658 | 23.0% |
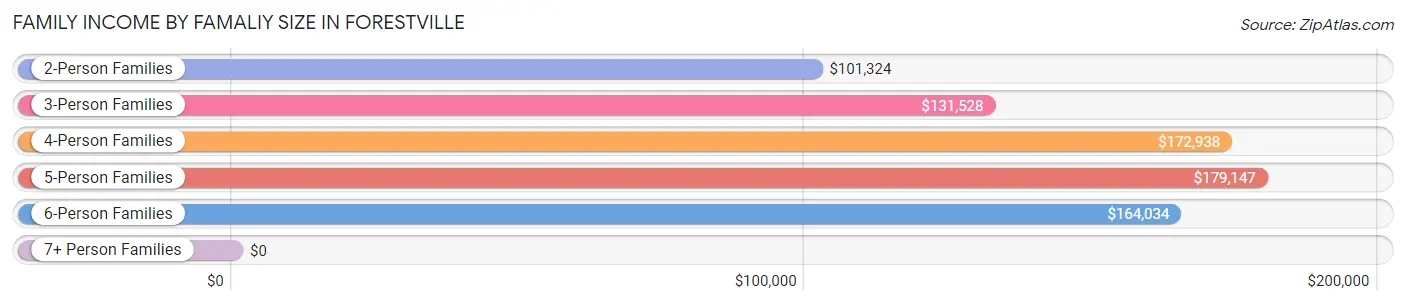
Family Income by Famaliy Size in Forestville
5-person families (409 | 14.3%) account for the highest median family income in Forestville with $179,147 per family, while 2-person families (1,490 | 52.1%) have the highest median income of $50,662 per family member.
| Income Bracket | # Families | Median Income |
| 2-Person Families | 1,490 (52.1%) | $101,324 |
| 3-Person Families | 488 (17.1%) | $131,528 |
| 4-Person Families | 389 (13.6%) | $172,938 |
| 5-Person Families | 409 (14.3%) | $179,147 |
| 6-Person Families | 83 (2.9%) | $164,034 |
| 7+ Person Families | 0 (0.0%) | $0 |
| Total | 2,859 (100.0%) | $122,023 |
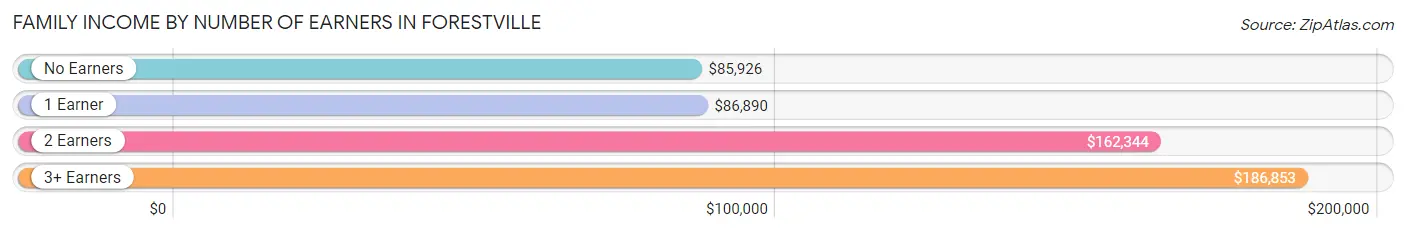
Family Income by Number of Earners in Forestville
The median family income in Forestville is $122,023, with families comprising 3+ earners (493) having the highest median family income of $186,853, while families with no earners (480) have the lowest median family income of $85,926, accounting for 17.2% and 16.8% of families, respectively.
| Number of Earners | # Families | Median Income |
| No Earners | 480 (16.8%) | $85,926 |
| 1 Earner | 867 (30.3%) | $86,890 |
| 2 Earners | 1,019 (35.6%) | $162,344 |
| 3+ Earners | 493 (17.2%) | $186,853 |
| Total | 2,859 (100.0%) | $122,023 |
Household Income in Forestville
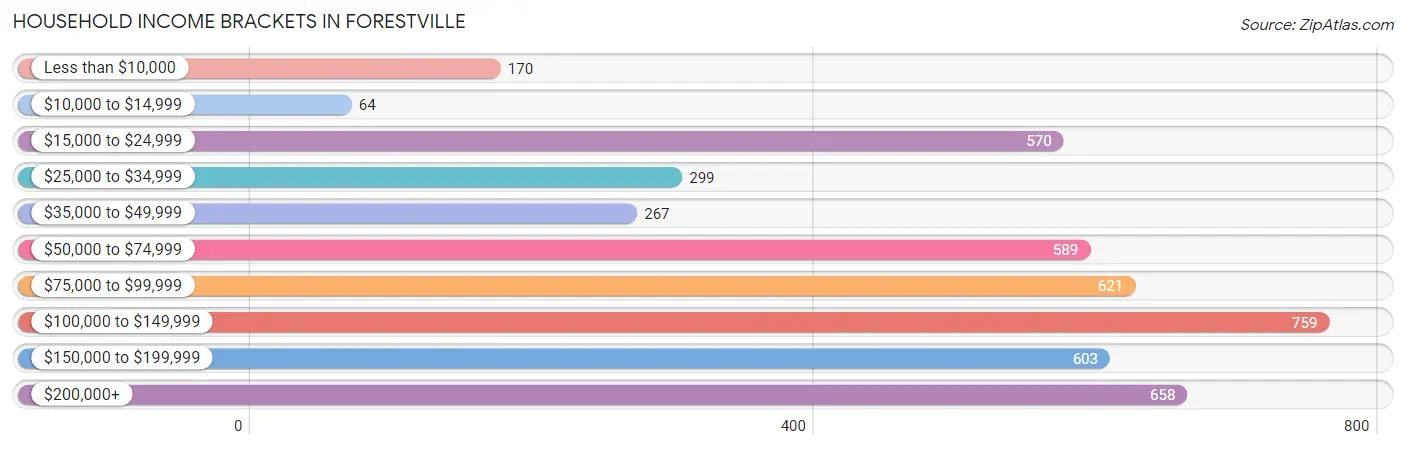
Household Income Brackets in Forestville
With 759 households falling in the category, the $100,000 to $149,999 income range is the most frequent in Forestville, accounting for 16.5% of all households. In contrast, only 64 households (1.4%) fall into the $10,000 to $14,999 income bracket, making it the least populous group.
| Income Bracket | # Households | % Households |
| Less than $10,000 | 170 | 3.7% |
| $10,000 to $14,999 | 64 | 1.4% |
| $15,000 to $24,999 | 570 | 12.4% |
| $25,000 to $34,999 | 299 | 6.5% |
| $35,000 to $49,999 | 267 | 5.8% |
| $50,000 to $74,999 | 589 | 12.8% |
| $75,000 to $99,999 | 621 | 13.5% |
| $100,000 to $149,999 | 759 | 16.5% |
| $150,000 to $199,999 | 603 | 13.1% |
| $200,000+ | 658 | 14.3% |
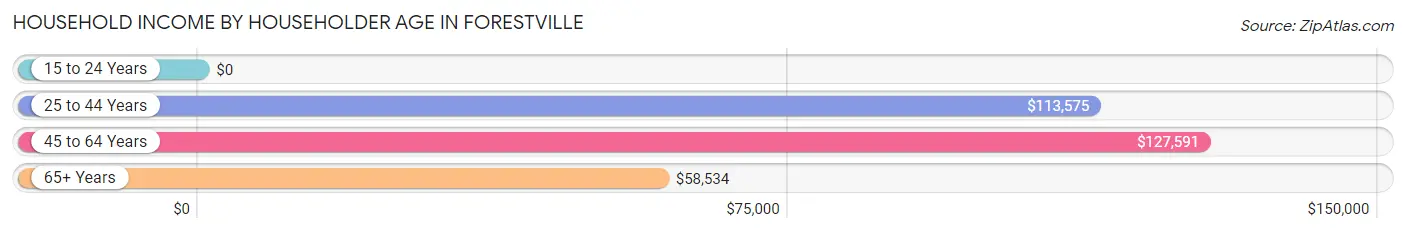
Household Income by Householder Age in Forestville
The median household income in Forestville is $90,313, with the highest median household income of $127,591 found in the 45 to 64 years age bracket for the primary householder. A total of 1,501 households (32.6%) fall into this category. Meanwhile, the 15 to 24 years age bracket for the primary householder has the lowest median household income of $0, with 17 households (0.4%) in this group.
| Income Bracket | # Households | Median Income |
| 15 to 24 Years | 17 (0.4%) | $0 |
| 25 to 44 Years | 1,191 (25.9%) | $113,575 |
| 45 to 64 Years | 1,501 (32.6%) | $127,591 |
| 65+ Years | 1,891 (41.1%) | $58,534 |
| Total | 4,600 (100.0%) | $90,313 |
Poverty in Forestville
Income Below Poverty by Sex and Age in Forestville
With 3.9% poverty level for males and 5.9% for females among the residents of Forestville, 35 to 44 year old males and 16 and 17 year old females are the most vulnerable to poverty, with 41 males (8.0%) and 23 females (22.6%) in their respective age groups living below the poverty level.
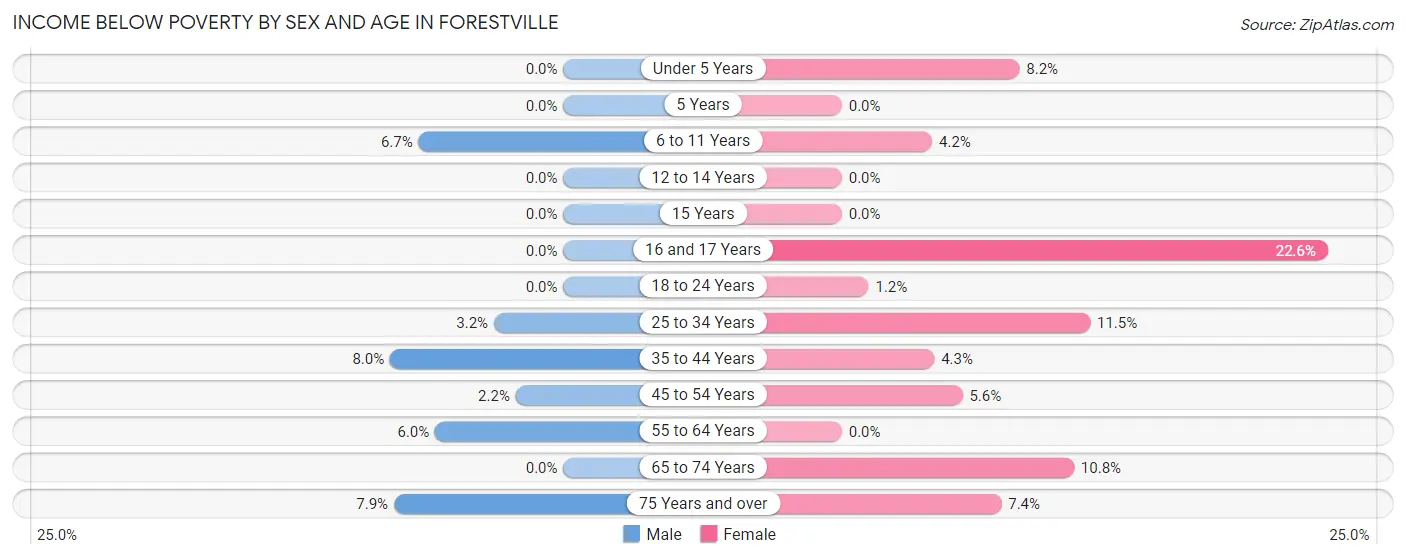
| Age Bracket | Male | Female |
| Under 5 Years | 0 (0.0%) | 23 (8.2%) |
| 5 Years | 0 (0.0%) | 0 (0.0%) |
| 6 to 11 Years | 32 (6.7%) | 22 (4.2%) |
| 12 to 14 Years | 0 (0.0%) | 0 (0.0%) |
| 15 Years | 0 (0.0%) | 0 (0.0%) |
| 16 and 17 Years | 0 (0.0%) | 23 (22.6%) |
| 18 to 24 Years | 0 (0.0%) | 4 (1.2%) |
| 25 to 34 Years | 20 (3.2%) | 59 (11.5%) |
| 35 to 44 Years | 41 (8.0%) | 26 (4.3%) |
| 45 to 54 Years | 15 (2.2%) | 34 (5.6%) |
| 55 to 64 Years | 40 (5.9%) | 0 (0.0%) |
| 65 to 74 Years | 0 (0.0%) | 77 (10.8%) |
| 75 Years and over | 55 (7.9%) | 52 (7.4%) |
| Total | 203 (3.9%) | 320 (5.9%) |
Income Above Poverty by Sex and Age in Forestville
According to the poverty statistics in Forestville, males aged under 5 years and females aged 5 years are the age groups that are most secure financially, with 100.0% of males and 100.0% of females in these age groups living above the poverty line.
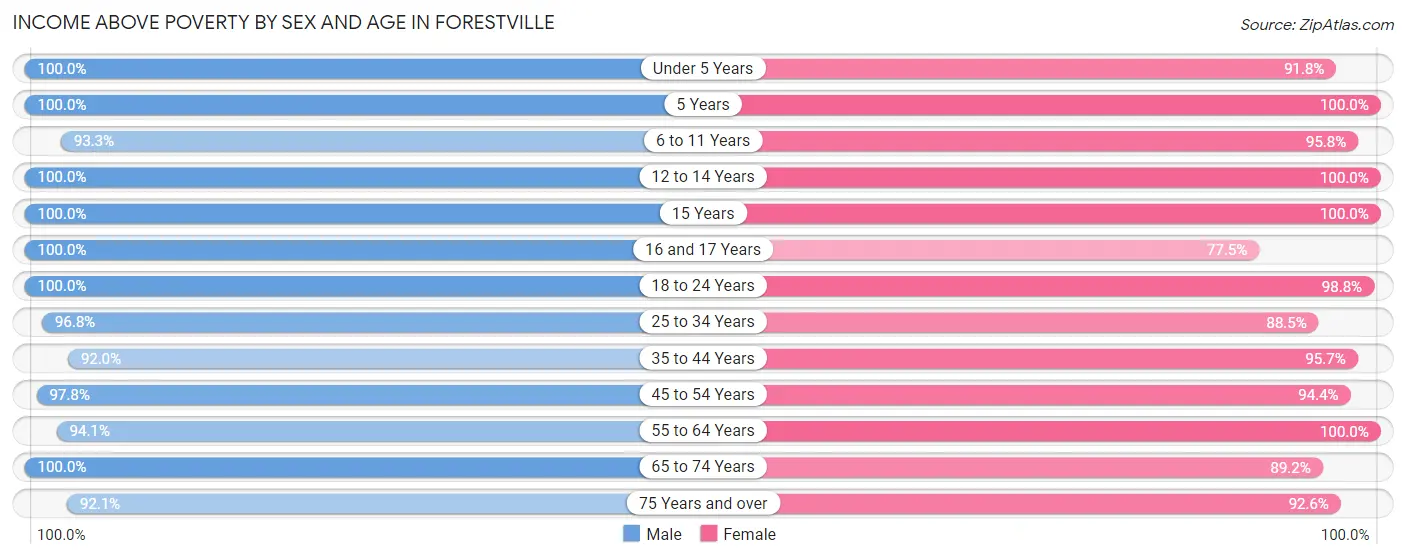
| Age Bracket | Male | Female |
| Under 5 Years | 204 (100.0%) | 256 (91.8%) |
| 5 Years | 53 (100.0%) | 13 (100.0%) |
| 6 to 11 Years | 444 (93.3%) | 503 (95.8%) |
| 12 to 14 Years | 175 (100.0%) | 156 (100.0%) |
| 15 Years | 49 (100.0%) | 175 (100.0%) |
| 16 and 17 Years | 88 (100.0%) | 79 (77.4%) |
| 18 to 24 Years | 373 (100.0%) | 318 (98.8%) |
| 25 to 34 Years | 601 (96.8%) | 453 (88.5%) |
| 35 to 44 Years | 469 (92.0%) | 580 (95.7%) |
| 45 to 54 Years | 665 (97.8%) | 573 (94.4%) |
| 55 to 64 Years | 632 (94.1%) | 678 (100.0%) |
| 65 to 74 Years | 655 (100.0%) | 638 (89.2%) |
| 75 Years and over | 645 (92.1%) | 651 (92.6%) |
| Total | 5,053 (96.1%) | 5,073 (94.1%) |
Income Below Poverty Among Married-Couple Families in Forestville
The poverty statistics for married-couple families in Forestville show that 2.2% or 51 of the total 2,342 families live below the poverty line. Families with 1 or 2 children have the highest poverty rate of 4.3%, comprising of 27 families. On the other hand, families with 3 or 4 children have the lowest poverty rate of 0.0%, which includes 0 families.
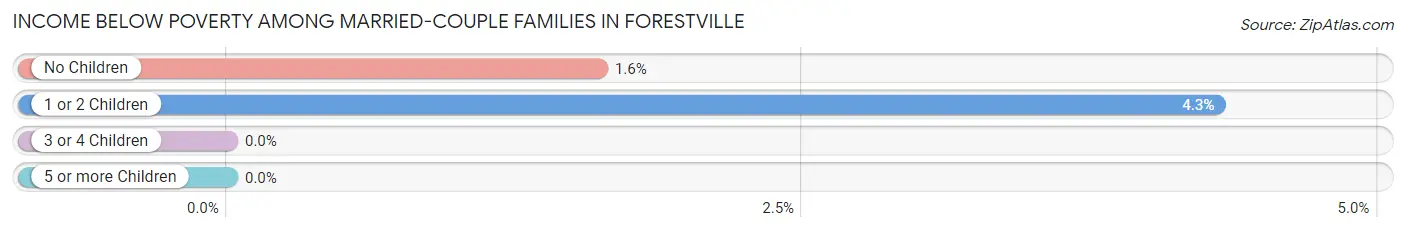
| Children | Above Poverty | Below Poverty |
| No Children | 1,464 (98.4%) | 24 (1.6%) |
| 1 or 2 Children | 601 (95.7%) | 27 (4.3%) |
| 3 or 4 Children | 226 (100.0%) | 0 (0.0%) |
| 5 or more Children | 0 (0.0%) | 0 (0.0%) |
| Total | 2,291 (97.8%) | 51 (2.2%) |
Income Below Poverty Among Single-Parent Households in Forestville
According to the poverty data in Forestville, 17.6% or 19 single-father households and 17.8% or 73 single-mother households are living below the poverty line. Among single-father households, those with 1 or 2 children have the highest poverty rate, with 19 households (28.4%) experiencing poverty. Likewise, among single-mother households, those with no children have the highest poverty rate, with 47 households (29.7%) falling below the poverty line.
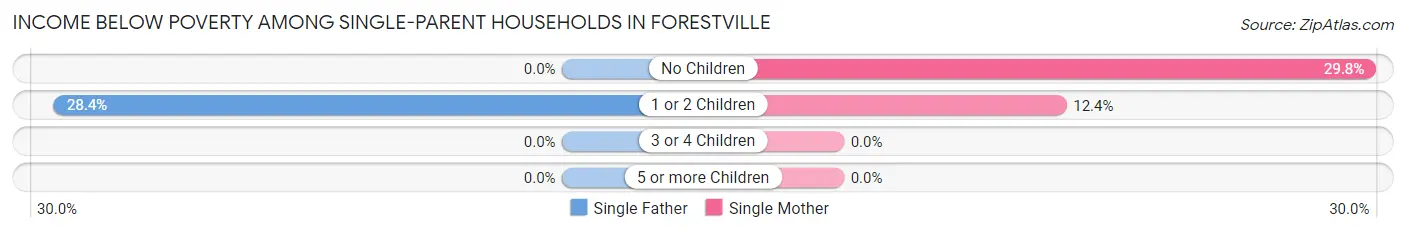
| Children | Single Father | Single Mother |
| No Children | 0 (0.0%) | 47 (29.7%) |
| 1 or 2 Children | 19 (28.4%) | 26 (12.4%) |
| 3 or 4 Children | 0 (0.0%) | 0 (0.0%) |
| 5 or more Children | 0 (0.0%) | 0 (0.0%) |
| Total | 19 (17.6%) | 73 (17.8%) |
Income Below Poverty Among Married-Couple vs Single-Parent Households in Forestville
The poverty data for Forestville shows that 51 of the married-couple family households (2.2%) and 92 of the single-parent households (17.8%) are living below the poverty level. Within the married-couple family households, those with 1 or 2 children have the highest poverty rate, with 27 households (4.3%) falling below the poverty line. Among the single-parent households, those with no children have the highest poverty rate, with 47 household (23.6%) living below poverty.
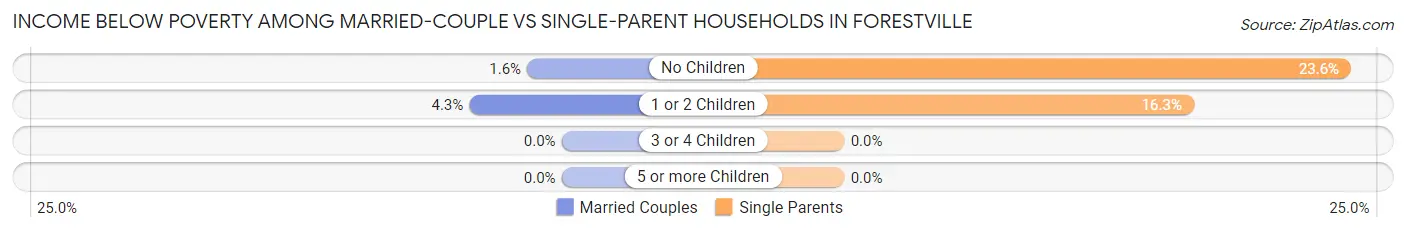
| Children | Married-Couple Families | Single-Parent Households |
| No Children | 24 (1.6%) | 47 (23.6%) |
| 1 or 2 Children | 27 (4.3%) | 45 (16.3%) |
| 3 or 4 Children | 0 (0.0%) | 0 (0.0%) |
| 5 or more Children | 0 (0.0%) | 0 (0.0%) |
| Total | 51 (2.2%) | 92 (17.8%) |
Employment Characteristics in Forestville
Employment by Class of Employer in Forestville
Among the 4,986 employed individuals in Forestville, private company employees (2,925 | 58.7%), not-for-profit organizations (645 | 12.9%), and local government employees (597 | 12.0%) make up the most common classes of employment.
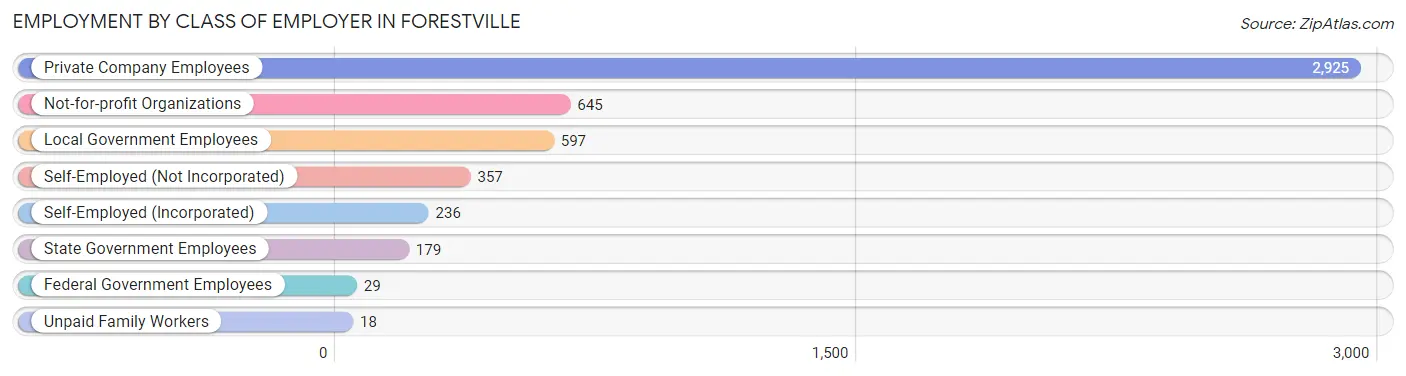
| Employer Class | # Employees | % Employees |
| Private Company Employees | 2,925 | 58.7% |
| Self-Employed (Incorporated) | 236 | 4.7% |
| Self-Employed (Not Incorporated) | 357 | 7.2% |
| Not-for-profit Organizations | 645 | 12.9% |
| Local Government Employees | 597 | 12.0% |
| State Government Employees | 179 | 3.6% |
| Federal Government Employees | 29 | 0.6% |
| Unpaid Family Workers | 18 | 0.4% |
| Total | 4,986 | 100.0% |
Employment Status by Age in Forestville
According to the labor force statistics for Forestville, out of the total population over 16 years of age (8,619), 62.3% or 5,370 individuals are in the labor force, with 5.7% or 306 of them unemployed. The age group with the highest labor force participation rate is 25 to 29 years, with 98.6% or 502 individuals in the labor force. Within the labor force, the 75 years and over age range has the highest percentage of unemployed individuals, with 38.9% or 37 of them being unemployed.
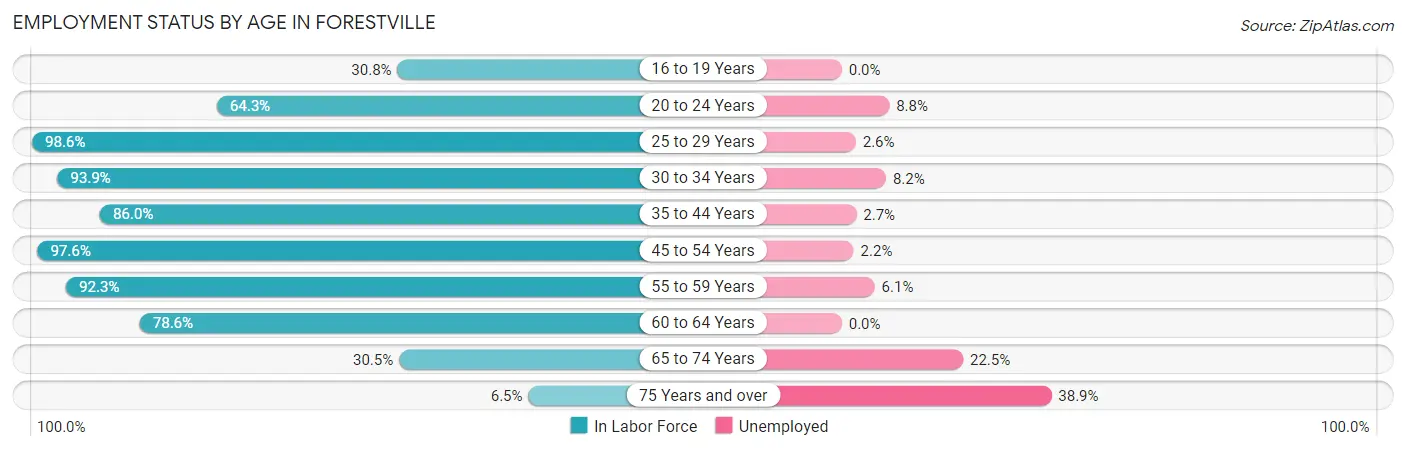
| Age Bracket | In Labor Force | Unemployed |
| 16 to 19 Years | 164 (30.8%) | 0 (0.0%) |
| 20 to 24 Years | 227 (64.3%) | 20 (8.8%) |
| 25 to 29 Years | 502 (98.6%) | 13 (2.6%) |
| 30 to 34 Years | 586 (93.9%) | 48 (8.2%) |
| 35 to 44 Years | 960 (86.0%) | 26 (2.7%) |
| 45 to 54 Years | 1,256 (97.6%) | 28 (2.2%) |
| 55 to 59 Years | 637 (92.3%) | 39 (6.1%) |
| 60 to 64 Years | 519 (78.6%) | 0 (0.0%) |
| 65 to 74 Years | 422 (30.5%) | 95 (22.5%) |
| 75 Years and over | 95 (6.5%) | 37 (38.9%) |
| Total | 5,370 (62.3%) | 306 (5.7%) |
Employment Status by Educational Attainment in Forestville
According to labor force statistics for Forestville, 91.3% of individuals (4,461) out of the total population between 25 and 64 years of age (4,886) are in the labor force, with 3.5% or 156 of them being unemployed. The group with the highest labor force participation rate are those with the educational attainment of less than high school, with 100.0% or 94 individuals in the labor force. Within the labor force, individuals with college / associate degree education have the highest percentage of unemployment, with 9.3% or 93 of them being unemployed.
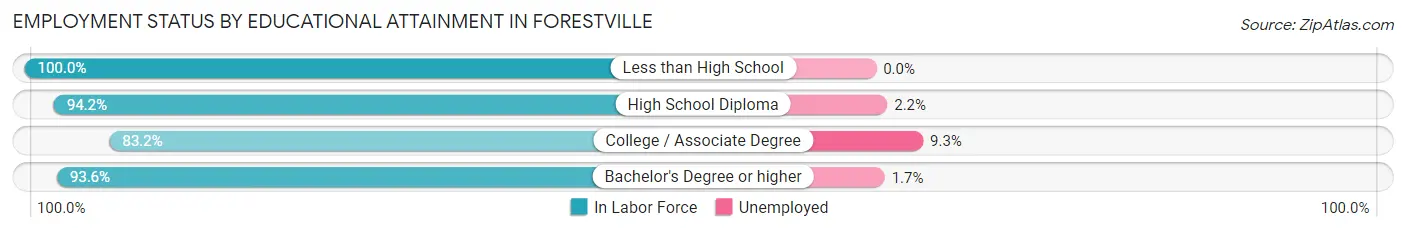
| Educational Attainment | In Labor Force | Unemployed |
| Less than High School | 94 (100.0%) | 0 (0.0%) |
| High School Diploma | 602 (94.2%) | 14 (2.2%) |
| College / Associate Degree | 998 (83.2%) | 112 (9.3%) |
| Bachelor's Degree or higher | 2,765 (93.6%) | 50 (1.7%) |
| Total | 4,461 (91.3%) | 171 (3.5%) |
Employment Occupations by Sex in Forestville
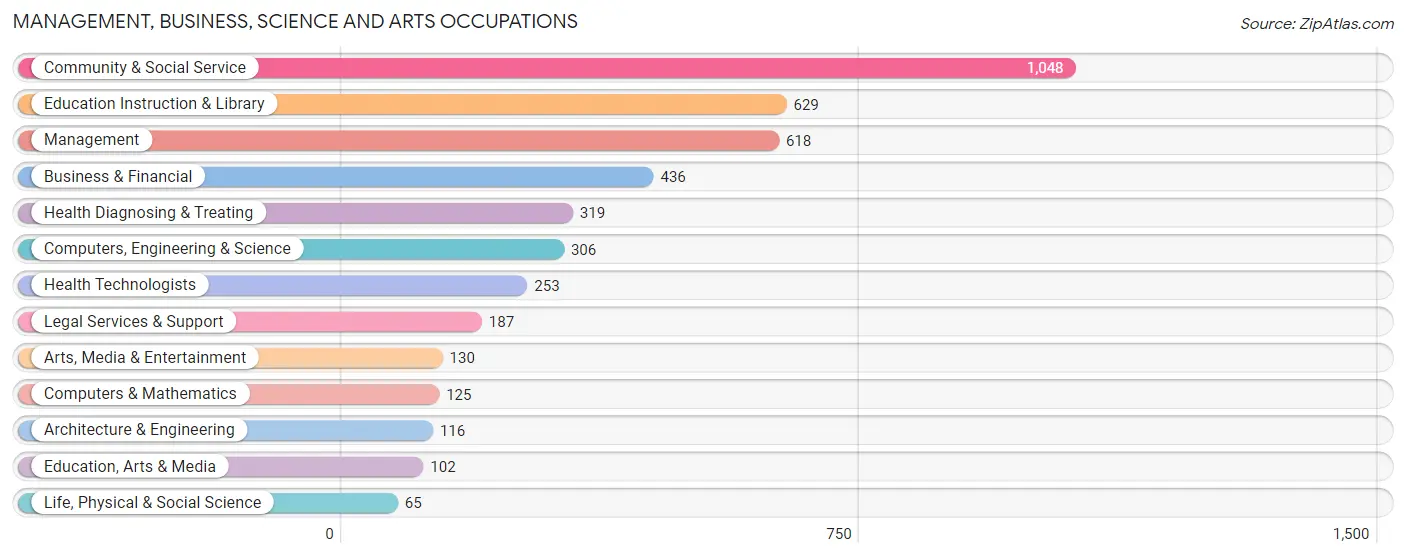
Management, Business, Science and Arts Occupations
The most common Management, Business, Science and Arts occupations in Forestville are Community & Social Service (1,048 | 20.7%), Education Instruction & Library (629 | 12.4%), Management (618 | 12.2%), Business & Financial (436 | 8.6%), and Health Diagnosing & Treating (319 | 6.3%).
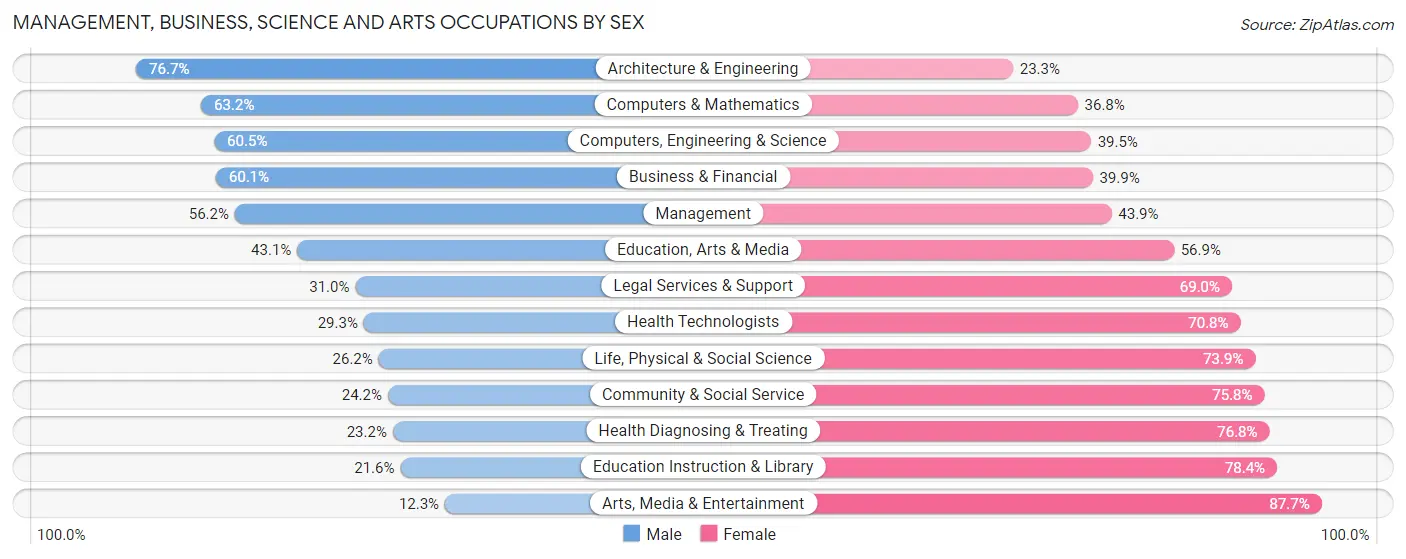
Management, Business, Science and Arts Occupations by Sex
Within the Management, Business, Science and Arts occupations in Forestville, the most male-oriented occupations are Architecture & Engineering (76.7%), Computers & Mathematics (63.2%), and Computers, Engineering & Science (60.5%), while the most female-oriented occupations are Arts, Media & Entertainment (87.7%), Education Instruction & Library (78.4%), and Health Diagnosing & Treating (76.8%).
| Occupation | Male | Female |
| Management | 347 (56.1%) | 271 (43.9%) |
| Business & Financial | 262 (60.1%) | 174 (39.9%) |
| Computers, Engineering & Science | 185 (60.5%) | 121 (39.5%) |
| Computers & Mathematics | 79 (63.2%) | 46 (36.8%) |
| Architecture & Engineering | 89 (76.7%) | 27 (23.3%) |
| Life, Physical & Social Science | 17 (26.2%) | 48 (73.9%) |
| Community & Social Service | 254 (24.2%) | 794 (75.8%) |
| Education, Arts & Media | 44 (43.1%) | 58 (56.9%) |
| Legal Services & Support | 58 (31.0%) | 129 (69.0%) |
| Education Instruction & Library | 136 (21.6%) | 493 (78.4%) |
| Arts, Media & Entertainment | 16 (12.3%) | 114 (87.7%) |
| Health Diagnosing & Treating | 74 (23.2%) | 245 (76.8%) |
| Health Technologists | 74 (29.2%) | 179 (70.8%) |
| Total (Category) | 1,122 (41.1%) | 1,605 (58.9%) |
| Total (Overall) | 2,649 (52.3%) | 2,413 (47.7%) |
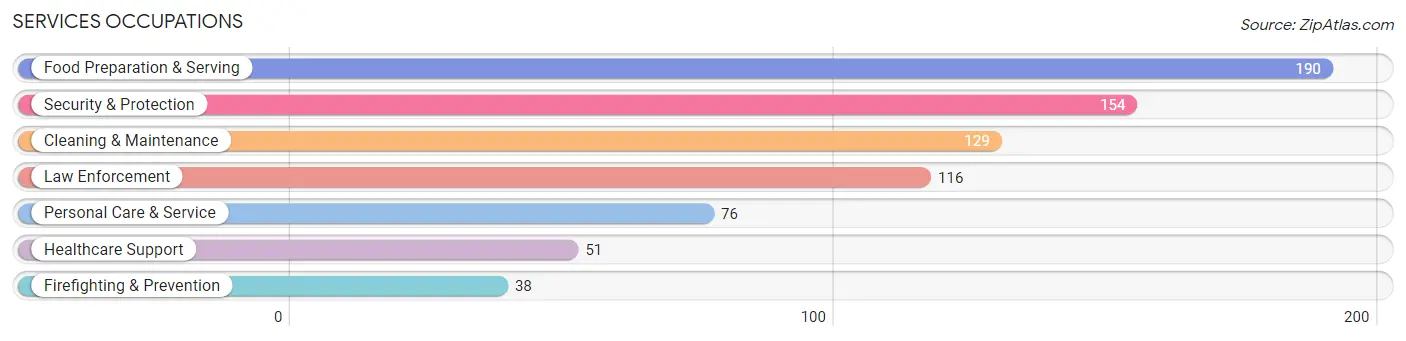
Services Occupations
The most common Services occupations in Forestville are Food Preparation & Serving (190 | 3.7%), Security & Protection (154 | 3.0%), Cleaning & Maintenance (129 | 2.5%), Law Enforcement (116 | 2.3%), and Personal Care & Service (76 | 1.5%).
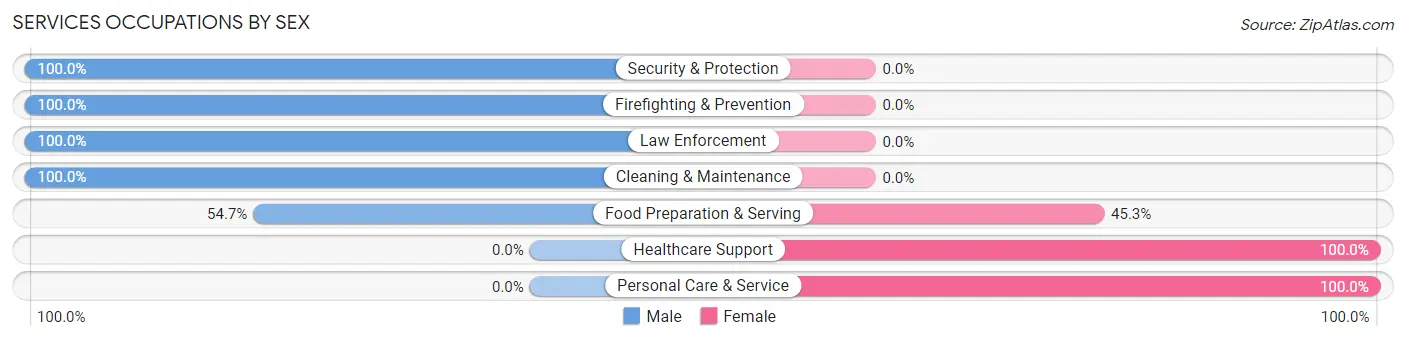
Services Occupations by Sex
Within the Services occupations in Forestville, the most male-oriented occupations are Security & Protection (100.0%), Firefighting & Prevention (100.0%), and Law Enforcement (100.0%), while the most female-oriented occupations are Healthcare Support (100.0%), Personal Care & Service (100.0%), and Food Preparation & Serving (45.3%).
| Occupation | Male | Female |
| Healthcare Support | 0 (0.0%) | 51 (100.0%) |
| Security & Protection | 154 (100.0%) | 0 (0.0%) |
| Firefighting & Prevention | 38 (100.0%) | 0 (0.0%) |
| Law Enforcement | 116 (100.0%) | 0 (0.0%) |
| Food Preparation & Serving | 104 (54.7%) | 86 (45.3%) |
| Cleaning & Maintenance | 129 (100.0%) | 0 (0.0%) |
| Personal Care & Service | 0 (0.0%) | 76 (100.0%) |
| Total (Category) | 387 (64.5%) | 213 (35.5%) |
| Total (Overall) | 2,649 (52.3%) | 2,413 (47.7%) |
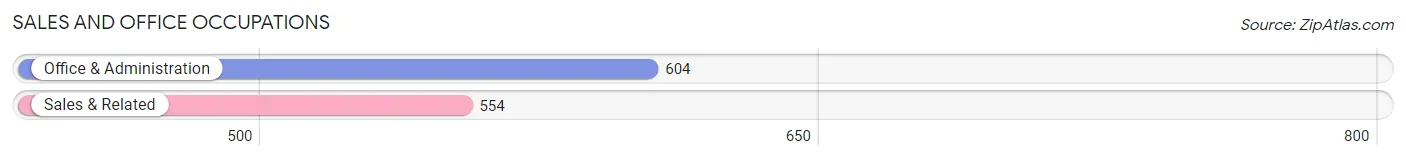
Sales and Office Occupations
The most common Sales and Office occupations in Forestville are Office & Administration (604 | 11.9%), and Sales & Related (554 | 10.9%).
Sales and Office Occupations by Sex
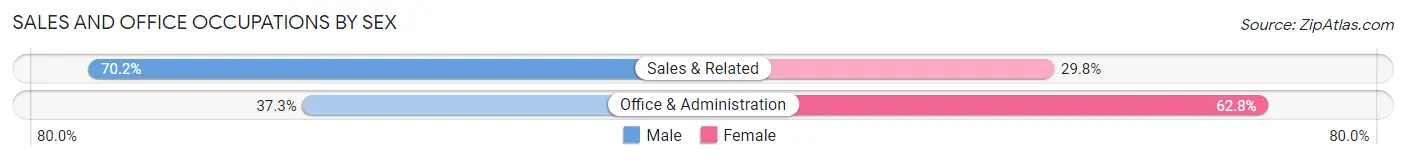
| Occupation | Male | Female |
| Sales & Related | 389 (70.2%) | 165 (29.8%) |
| Office & Administration | 225 (37.2%) | 379 (62.7%) |
| Total (Category) | 614 (53.0%) | 544 (47.0%) |
| Total (Overall) | 2,649 (52.3%) | 2,413 (47.7%) |
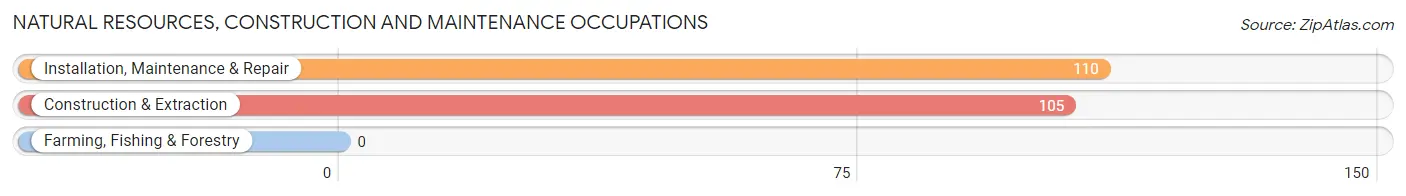
Natural Resources, Construction and Maintenance Occupations
The most common Natural Resources, Construction and Maintenance occupations in Forestville are Installation, Maintenance & Repair (110 | 2.2%), and Construction & Extraction (105 | 2.1%).
Natural Resources, Construction and Maintenance Occupations by Sex
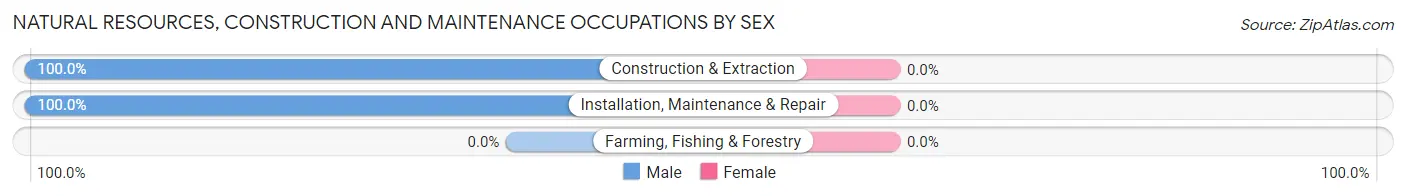
| Occupation | Male | Female |
| Farming, Fishing & Forestry | 0 (0.0%) | 0 (0.0%) |
| Construction & Extraction | 105 (100.0%) | 0 (0.0%) |
| Installation, Maintenance & Repair | 110 (100.0%) | 0 (0.0%) |
| Total (Category) | 215 (100.0%) | 0 (0.0%) |
| Total (Overall) | 2,649 (52.3%) | 2,413 (47.7%) |
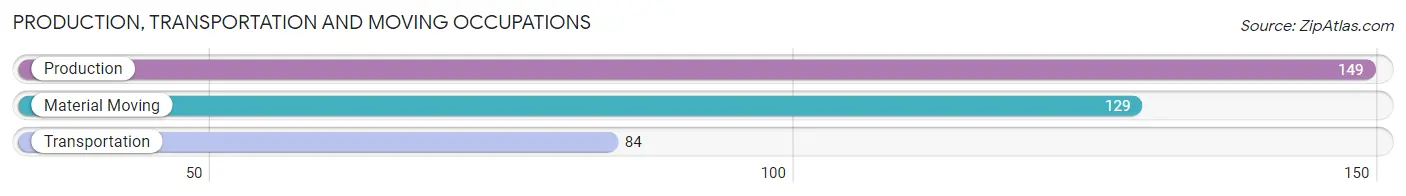
Production, Transportation and Moving Occupations
The most common Production, Transportation and Moving occupations in Forestville are Production (149 | 2.9%), Material Moving (129 | 2.5%), and Transportation (84 | 1.7%).
Production, Transportation and Moving Occupations by Sex
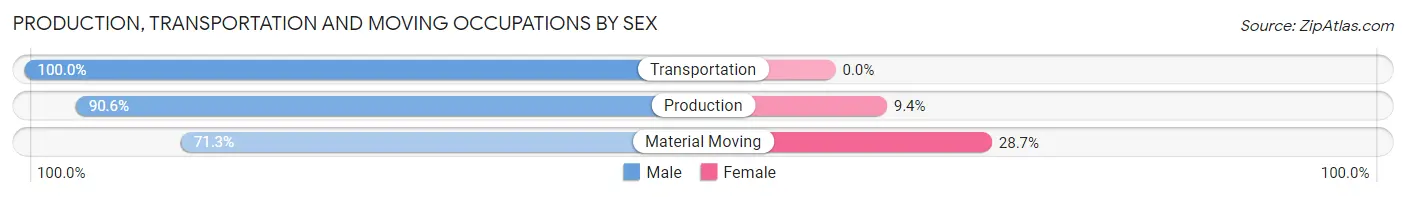
| Occupation | Male | Female |
| Production | 135 (90.6%) | 14 (9.4%) |
| Transportation | 84 (100.0%) | 0 (0.0%) |
| Material Moving | 92 (71.3%) | 37 (28.7%) |
| Total (Category) | 311 (85.9%) | 51 (14.1%) |
| Total (Overall) | 2,649 (52.3%) | 2,413 (47.7%) |
Employment Industries by Sex in Forestville
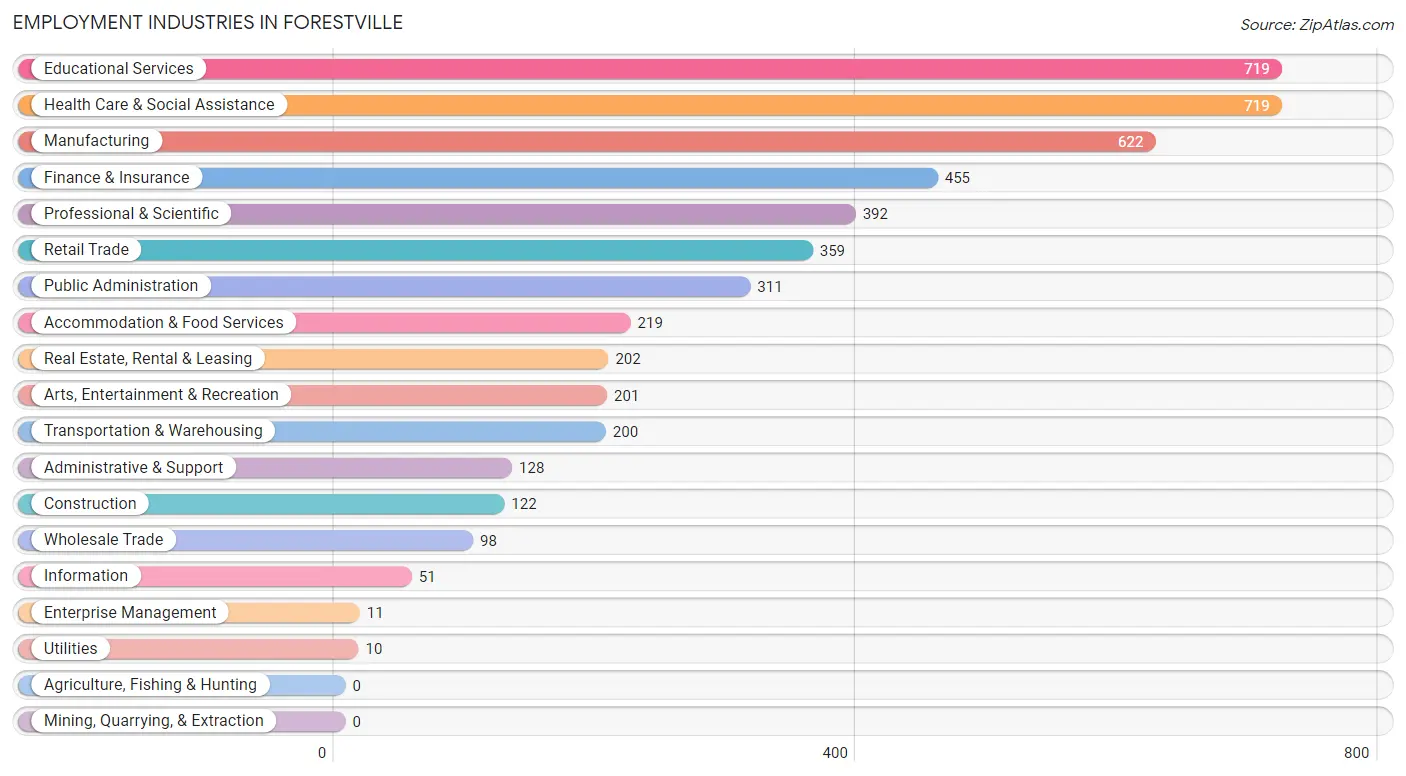
Employment Industries in Forestville
The major employment industries in Forestville include Educational Services (719 | 14.2%), Health Care & Social Assistance (719 | 14.2%), Manufacturing (622 | 12.3%), Finance & Insurance (455 | 9.0%), and Professional & Scientific (392 | 7.7%).
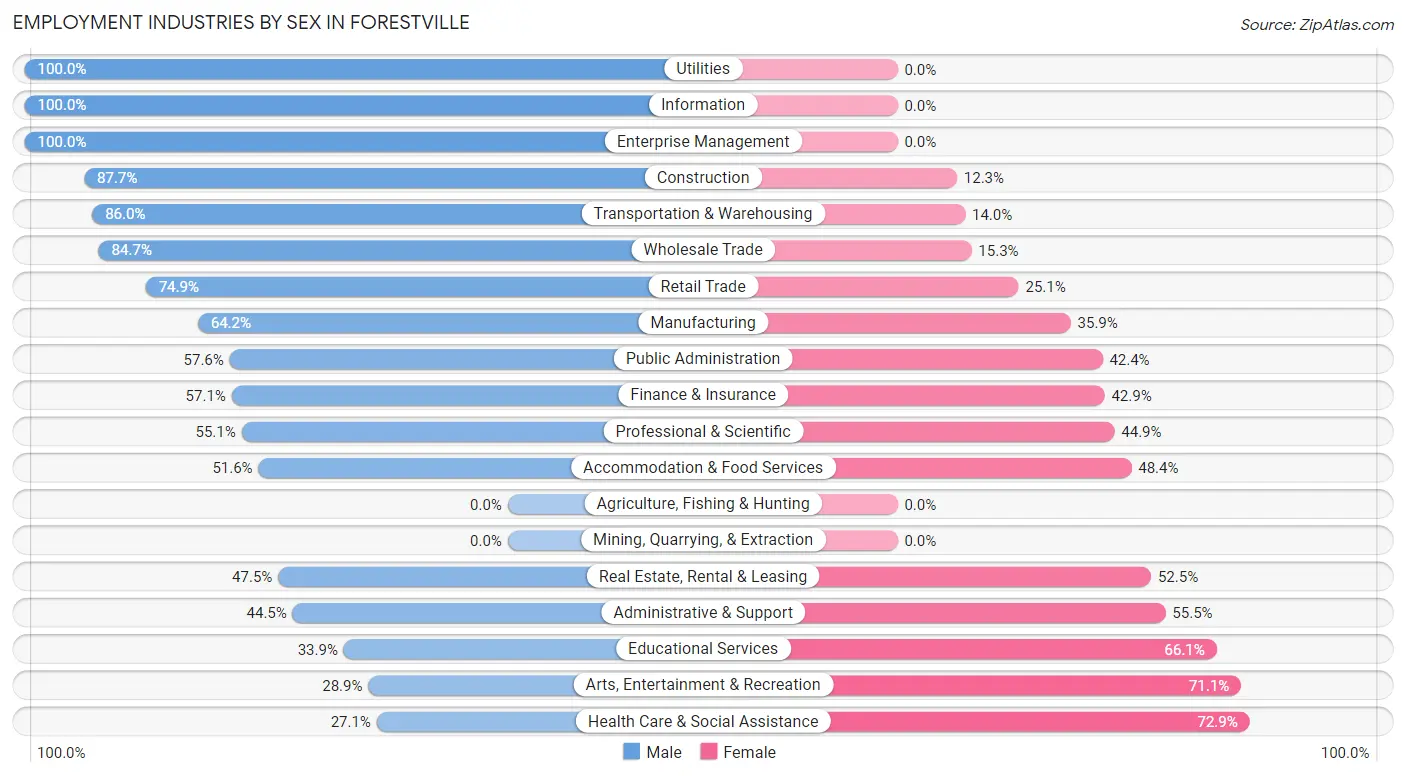
Employment Industries by Sex in Forestville
The Forestville industries that see more men than women are Utilities (100.0%), Information (100.0%), and Enterprise Management (100.0%), whereas the industries that tend to have a higher number of women are Health Care & Social Assistance (72.9%), Arts, Entertainment & Recreation (71.1%), and Educational Services (66.1%).
| Industry | Male | Female |
| Agriculture, Fishing & Hunting | 0 (0.0%) | 0 (0.0%) |
| Mining, Quarrying, & Extraction | 0 (0.0%) | 0 (0.0%) |
| Construction | 107 (87.7%) | 15 (12.3%) |
| Manufacturing | 399 (64.1%) | 223 (35.8%) |
| Wholesale Trade | 83 (84.7%) | 15 (15.3%) |
| Retail Trade | 269 (74.9%) | 90 (25.1%) |
| Transportation & Warehousing | 172 (86.0%) | 28 (14.0%) |
| Utilities | 10 (100.0%) | 0 (0.0%) |
| Information | 51 (100.0%) | 0 (0.0%) |
| Finance & Insurance | 260 (57.1%) | 195 (42.9%) |
| Real Estate, Rental & Leasing | 96 (47.5%) | 106 (52.5%) |
| Professional & Scientific | 216 (55.1%) | 176 (44.9%) |
| Enterprise Management | 11 (100.0%) | 0 (0.0%) |
| Administrative & Support | 57 (44.5%) | 71 (55.5%) |
| Educational Services | 244 (33.9%) | 475 (66.1%) |
| Health Care & Social Assistance | 195 (27.1%) | 524 (72.9%) |
| Arts, Entertainment & Recreation | 58 (28.9%) | 143 (71.1%) |
| Accommodation & Food Services | 113 (51.6%) | 106 (48.4%) |
| Public Administration | 179 (57.6%) | 132 (42.4%) |
| Total | 2,649 (52.3%) | 2,413 (47.7%) |
Education in Forestville
School Enrollment in Forestville
The most common levels of schooling among the 2,825 students in Forestville are elementary school (658 | 23.3%), high school (591 | 20.9%), and college / undergraduate (516 | 18.3%).
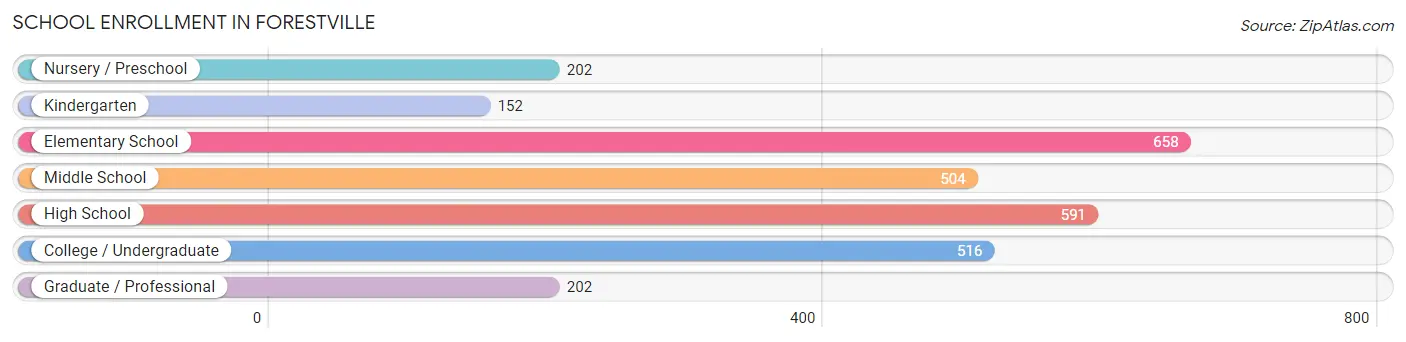
| School Level | # Students | % Students |
| Nursery / Preschool | 202 | 7.1% |
| Kindergarten | 152 | 5.4% |
| Elementary School | 658 | 23.3% |
| Middle School | 504 | 17.8% |
| High School | 591 | 20.9% |
| College / Undergraduate | 516 | 18.3% |
| Graduate / Professional | 202 | 7.1% |
| Total | 2,825 | 100.0% |
School Enrollment by Age by Funding Source in Forestville
Out of a total of 2,825 students who are enrolled in schools in Forestville, 466 (16.5%) attend a private institution, while the remaining 2,359 (83.5%) are enrolled in public schools. The age group of 3 to 4 year olds has the highest likelihood of being enrolled in private schools, with 95 (50.3% in the age bracket) enrolled. Conversely, the age group of 25 to 34 year olds has the lowest likelihood of being enrolled in a private school, with 81 (100.0% in the age bracket) attending a public institution.
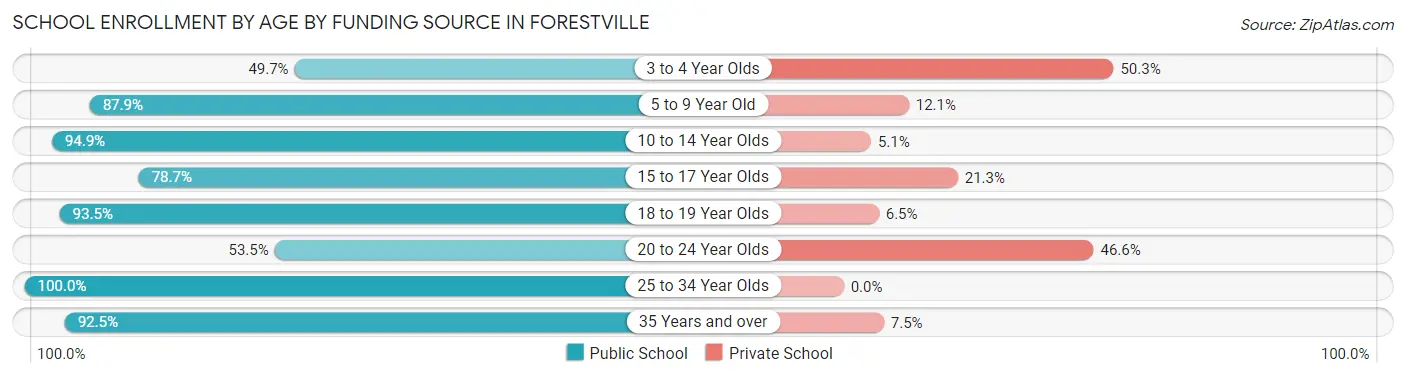
| Age Bracket | Public School | Private School |
| 3 to 4 Year Olds | 94 (49.7%) | 95 (50.3%) |
| 5 to 9 Year Old | 659 (87.9%) | 91 (12.1%) |
| 10 to 14 Year Olds | 615 (94.9%) | 33 (5.1%) |
| 15 to 17 Year Olds | 326 (78.7%) | 88 (21.3%) |
| 18 to 19 Year Olds | 300 (93.5%) | 21 (6.5%) |
| 20 to 24 Year Olds | 147 (53.4%) | 128 (46.6%) |
| 25 to 34 Year Olds | 81 (100.0%) | 0 (0.0%) |
| 35 Years and over | 136 (92.5%) | 11 (7.5%) |
| Total | 2,359 (83.5%) | 466 (16.5%) |
Educational Attainment by Field of Study in Forestville
Business (1,115 | 25.4%), education (565 | 12.9%), science & technology (539 | 12.3%), social sciences (331 | 7.5%), and arts & humanities (268 | 6.1%) are the most common fields of study among 4,390 individuals in Forestville who have obtained a bachelor's degree or higher.
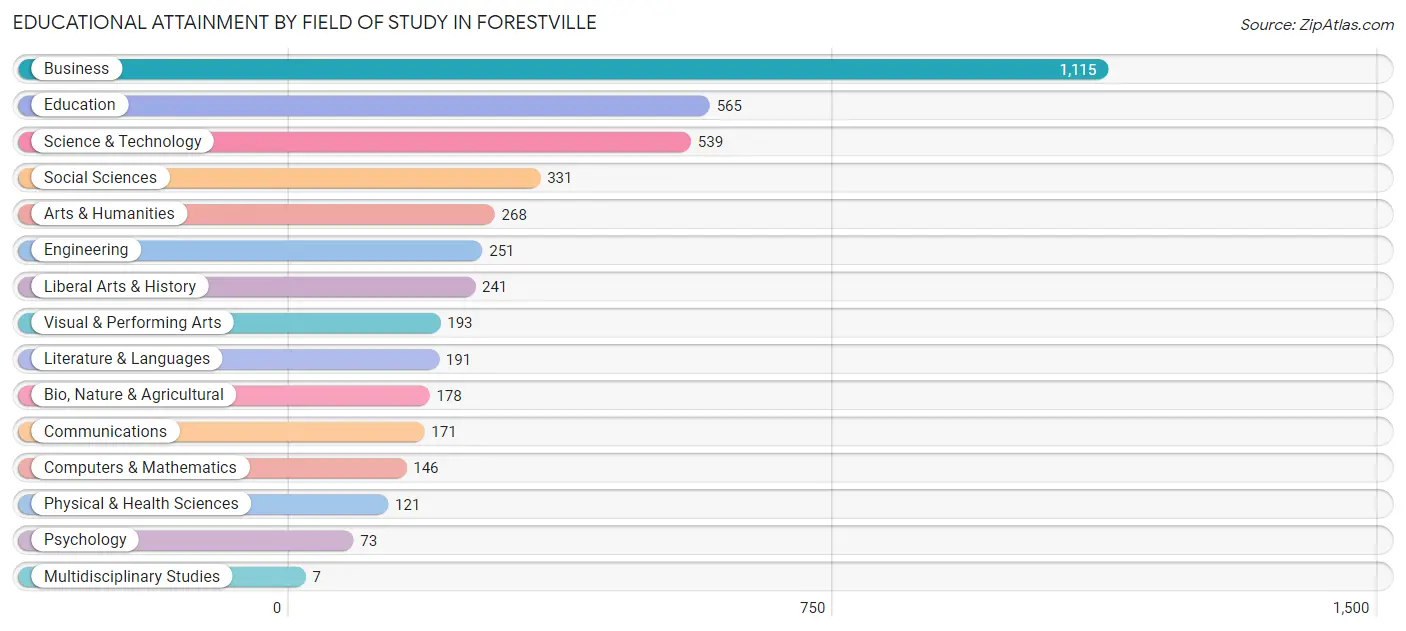
| Field of Study | # Graduates | % Graduates |
| Computers & Mathematics | 146 | 3.3% |
| Bio, Nature & Agricultural | 178 | 4.1% |
| Physical & Health Sciences | 121 | 2.8% |
| Psychology | 73 | 1.7% |
| Social Sciences | 331 | 7.5% |
| Engineering | 251 | 5.7% |
| Multidisciplinary Studies | 7 | 0.2% |
| Science & Technology | 539 | 12.3% |
| Business | 1,115 | 25.4% |
| Education | 565 | 12.9% |
| Literature & Languages | 191 | 4.3% |
| Liberal Arts & History | 241 | 5.5% |
| Visual & Performing Arts | 193 | 4.4% |
| Communications | 171 | 3.9% |
| Arts & Humanities | 268 | 6.1% |
| Total | 4,390 | 100.0% |
Transportation & Commute in Forestville
Vehicle Availability by Sex in Forestville
The most prevalent vehicle ownership categories in Forestville are males with 2 vehicles (1,352, accounting for 52.3%) and females with 2 vehicles (998, making up 56.6%).
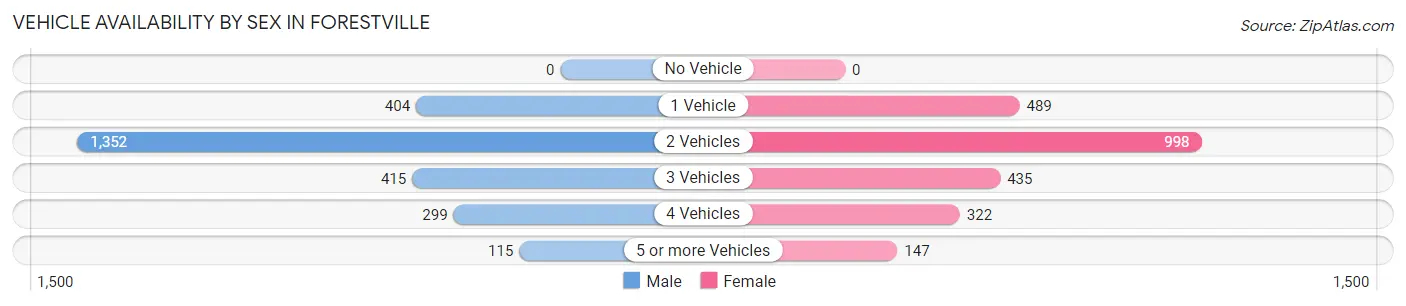
| Vehicles Available | Male | Female |
| No Vehicle | 0 (0.0%) | 0 (0.0%) |
| 1 Vehicle | 404 (15.6%) | 489 (20.4%) |
| 2 Vehicles | 1,352 (52.3%) | 998 (41.7%) |
| 3 Vehicles | 415 (16.1%) | 435 (18.2%) |
| 4 Vehicles | 299 (11.6%) | 322 (13.5%) |
| 5 or more Vehicles | 115 (4.4%) | 147 (6.1%) |
| Total | 2,585 (100.0%) | 2,391 (100.0%) |
Commute Time in Forestville
The most frequently occuring commute durations in Forestville are 30 to 34 minutes (903 commuters, 20.7%), 20 to 24 minutes (681 commuters, 15.6%), and 25 to 29 minutes (629 commuters, 14.4%).
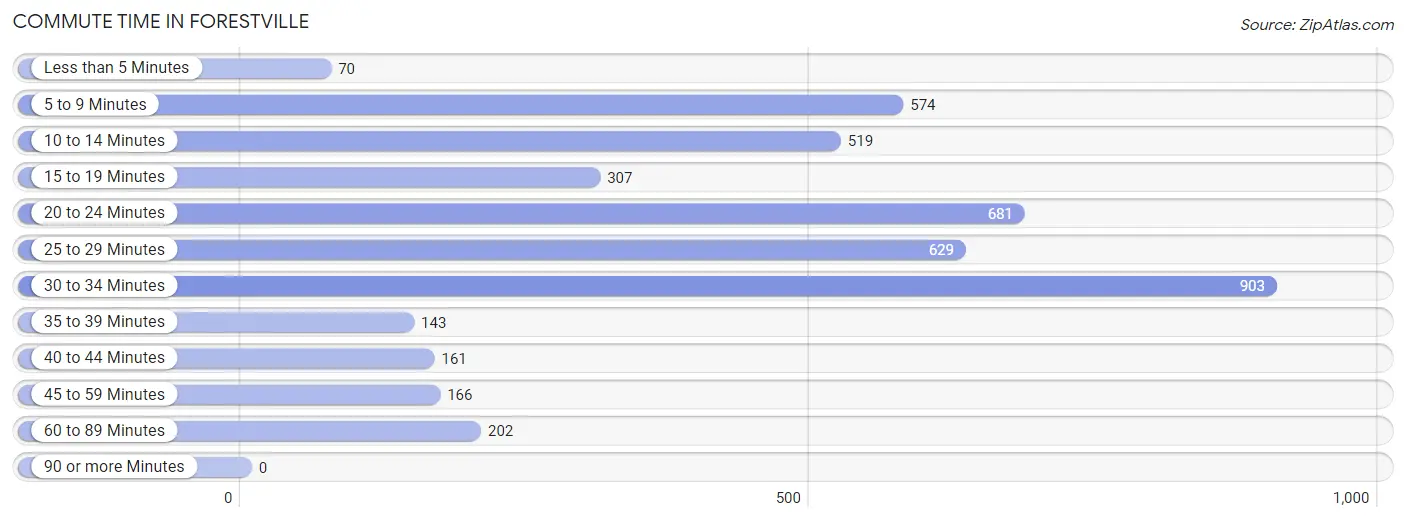
| Commute Time | # Commuters | % Commuters |
| Less than 5 Minutes | 70 | 1.6% |
| 5 to 9 Minutes | 574 | 13.2% |
| 10 to 14 Minutes | 519 | 11.9% |
| 15 to 19 Minutes | 307 | 7.0% |
| 20 to 24 Minutes | 681 | 15.6% |
| 25 to 29 Minutes | 629 | 14.4% |
| 30 to 34 Minutes | 903 | 20.7% |
| 35 to 39 Minutes | 143 | 3.3% |
| 40 to 44 Minutes | 161 | 3.7% |
| 45 to 59 Minutes | 166 | 3.8% |
| 60 to 89 Minutes | 202 | 4.6% |
| 90 or more Minutes | 0 | 0.0% |
Commute Time by Sex in Forestville
The most common commute times in Forestville are 30 to 34 minutes (630 commuters, 26.5%) for males and 5 to 9 minutes (363 commuters, 18.3%) for females.
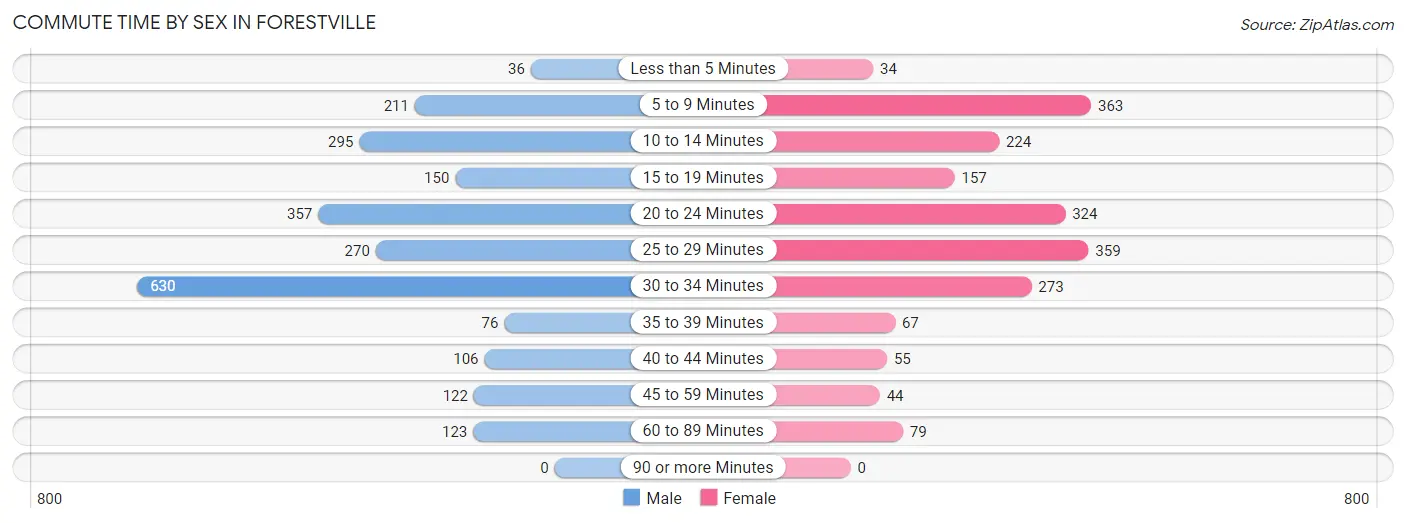
| Commute Time | Male | Female |
| Less than 5 Minutes | 36 (1.5%) | 34 (1.7%) |
| 5 to 9 Minutes | 211 (8.9%) | 363 (18.3%) |
| 10 to 14 Minutes | 295 (12.4%) | 224 (11.3%) |
| 15 to 19 Minutes | 150 (6.3%) | 157 (7.9%) |
| 20 to 24 Minutes | 357 (15.0%) | 324 (16.4%) |
| 25 to 29 Minutes | 270 (11.4%) | 359 (18.1%) |
| 30 to 34 Minutes | 630 (26.5%) | 273 (13.8%) |
| 35 to 39 Minutes | 76 (3.2%) | 67 (3.4%) |
| 40 to 44 Minutes | 106 (4.5%) | 55 (2.8%) |
| 45 to 59 Minutes | 122 (5.1%) | 44 (2.2%) |
| 60 to 89 Minutes | 123 (5.2%) | 79 (4.0%) |
| 90 or more Minutes | 0 (0.0%) | 0 (0.0%) |
Time of Departure to Work by Sex in Forestville
The most frequent times of departure to work in Forestville are 7:30 AM to 7:59 AM (450, 18.9%) for males and 8:30 AM to 8:59 AM (310, 15.7%) for females.
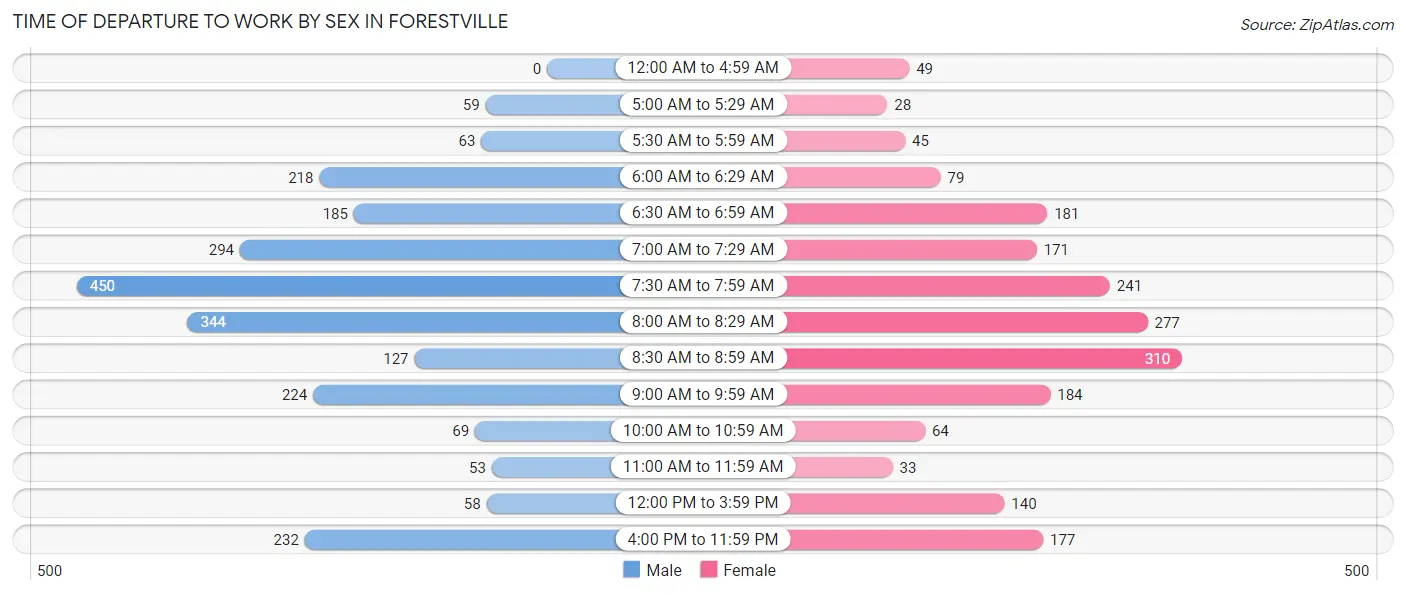
| Time of Departure | Male | Female |
| 12:00 AM to 4:59 AM | 0 (0.0%) | 49 (2.5%) |
| 5:00 AM to 5:29 AM | 59 (2.5%) | 28 (1.4%) |
| 5:30 AM to 5:59 AM | 63 (2.6%) | 45 (2.3%) |
| 6:00 AM to 6:29 AM | 218 (9.2%) | 79 (4.0%) |
| 6:30 AM to 6:59 AM | 185 (7.8%) | 181 (9.1%) |
| 7:00 AM to 7:29 AM | 294 (12.4%) | 171 (8.6%) |
| 7:30 AM to 7:59 AM | 450 (18.9%) | 241 (12.2%) |
| 8:00 AM to 8:29 AM | 344 (14.5%) | 277 (14.0%) |
| 8:30 AM to 8:59 AM | 127 (5.3%) | 310 (15.7%) |
| 9:00 AM to 9:59 AM | 224 (9.4%) | 184 (9.3%) |
| 10:00 AM to 10:59 AM | 69 (2.9%) | 64 (3.2%) |
| 11:00 AM to 11:59 AM | 53 (2.2%) | 33 (1.7%) |
| 12:00 PM to 3:59 PM | 58 (2.4%) | 140 (7.1%) |
| 4:00 PM to 11:59 PM | 232 (9.8%) | 177 (8.9%) |
| Total | 2,376 (100.0%) | 1,979 (100.0%) |
Housing Occupancy in Forestville
Occupancy by Ownership in Forestville
Of the total 4,600 dwellings in Forestville, owner-occupied units account for 3,091 (67.2%), while renter-occupied units make up 1,509 (32.8%).
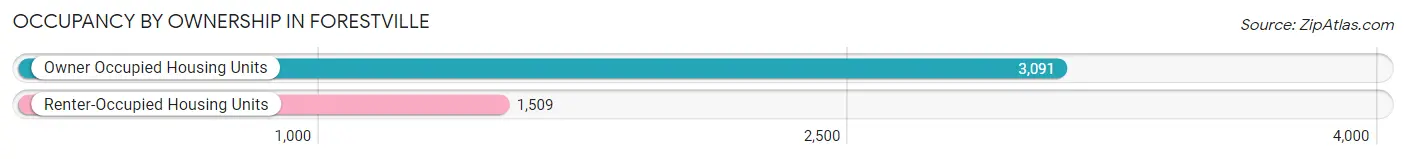
| Occupancy | # Housing Units | % Housing Units |
| Owner Occupied Housing Units | 3,091 | 67.2% |
| Renter-Occupied Housing Units | 1,509 | 32.8% |
| Total Occupied Housing Units | 4,600 | 100.0% |
Occupancy by Household Size in Forestville
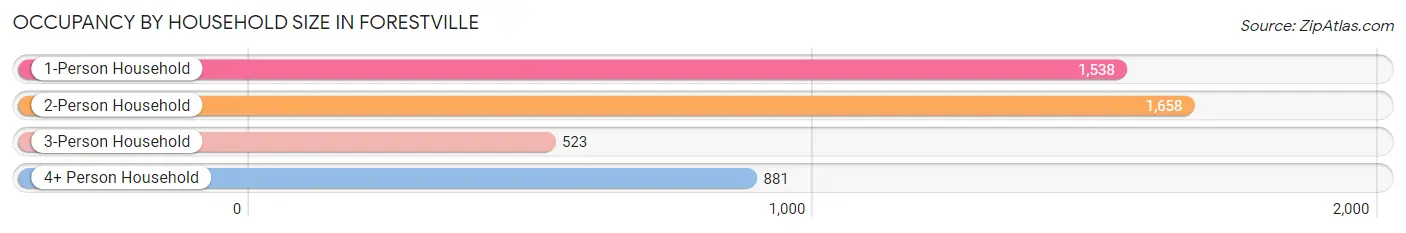
| Household Size | # Housing Units | % Housing Units |
| 1-Person Household | 1,538 | 33.4% |
| 2-Person Household | 1,658 | 36.0% |
| 3-Person Household | 523 | 11.4% |
| 4+ Person Household | 881 | 19.2% |
| Total Housing Units | 4,600 | 100.0% |
Occupancy by Ownership by Household Size in Forestville
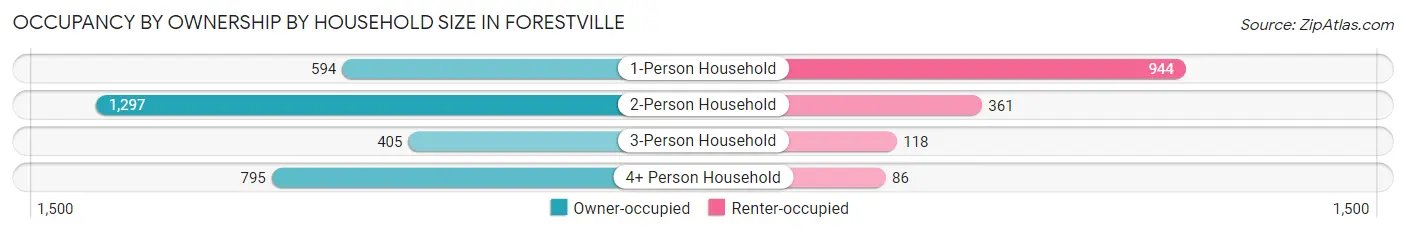
| Household Size | Owner-occupied | Renter-occupied |
| 1-Person Household | 594 (38.6%) | 944 (61.4%) |
| 2-Person Household | 1,297 (78.2%) | 361 (21.8%) |
| 3-Person Household | 405 (77.4%) | 118 (22.6%) |
| 4+ Person Household | 795 (90.2%) | 86 (9.8%) |
| Total Housing Units | 3,091 (67.2%) | 1,509 (32.8%) |
Occupancy by Educational Attainment in Forestville
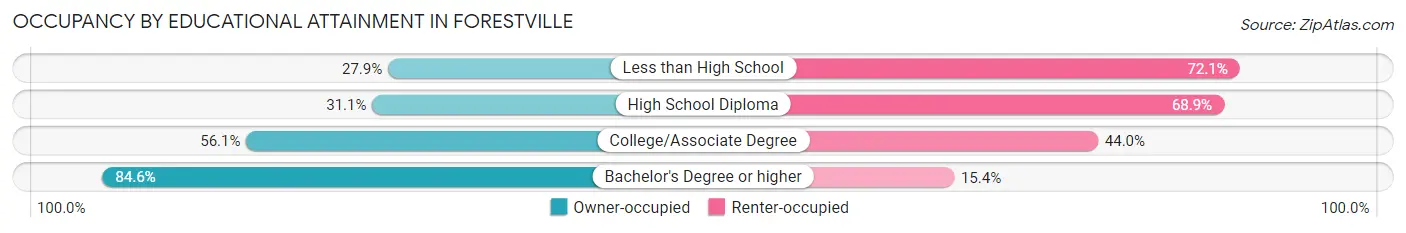
| Household Size | Owner-occupied | Renter-occupied |
| Less than High School | 19 (27.9%) | 49 (72.1%) |
| High School Diploma | 228 (31.1%) | 506 (68.9%) |
| College/Associate Degree | 723 (56.0%) | 567 (44.0%) |
| Bachelor's Degree or higher | 2,121 (84.6%) | 387 (15.4%) |
Occupancy by Age of Householder in Forestville
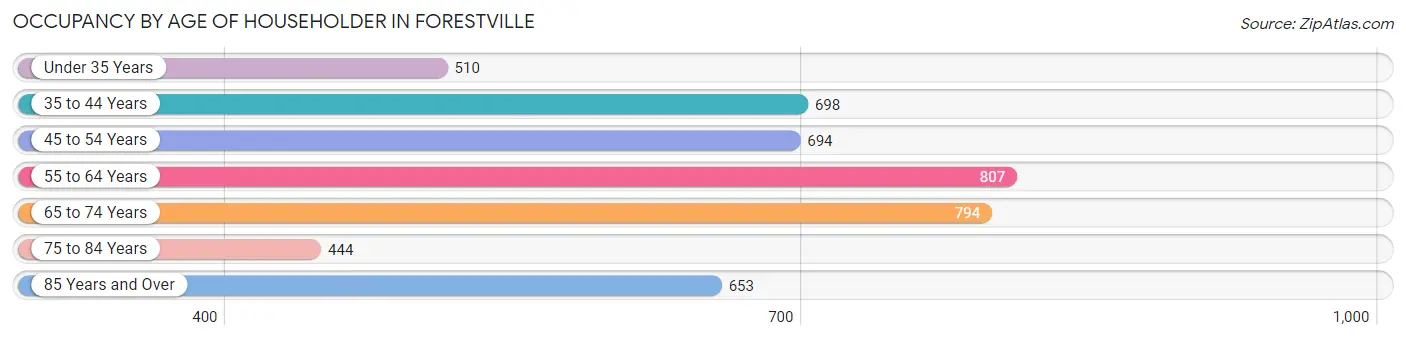
| Age Bracket | # Households | % Households |
| Under 35 Years | 510 | 11.1% |
| 35 to 44 Years | 698 | 15.2% |
| 45 to 54 Years | 694 | 15.1% |
| 55 to 64 Years | 807 | 17.5% |
| 65 to 74 Years | 794 | 17.3% |
| 75 to 84 Years | 444 | 9.7% |
| 85 Years and Over | 653 | 14.2% |
| Total | 4,600 | 100.0% |
Housing Finances in Forestville
Median Income by Occupancy in Forestville
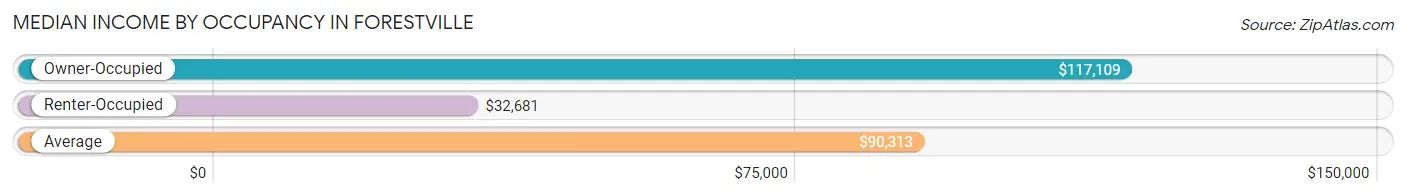
| Occupancy Type | # Households | Median Income |
| Owner-Occupied | 3,091 (67.2%) | $117,109 |
| Renter-Occupied | 1,509 (32.8%) | $32,681 |
| Average | 4,600 (100.0%) | $90,313 |
Occupancy by Householder Income Bracket in Forestville
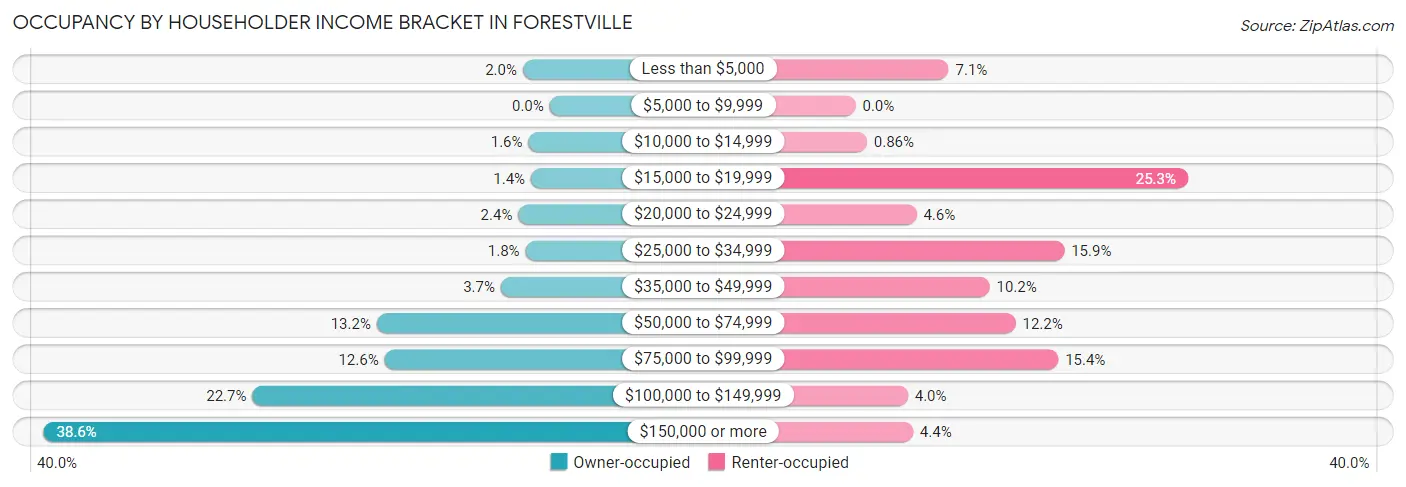
| Income Bracket | Owner-occupied | Renter-occupied |
| Less than $5,000 | 63 (2.0%) | 107 (7.1%) |
| $5,000 to $9,999 | 0 (0.0%) | 0 (0.0%) |
| $10,000 to $14,999 | 50 (1.6%) | 13 (0.9%) |
| $15,000 to $19,999 | 44 (1.4%) | 382 (25.3%) |
| $20,000 to $24,999 | 74 (2.4%) | 70 (4.6%) |
| $25,000 to $34,999 | 57 (1.8%) | 240 (15.9%) |
| $35,000 to $49,999 | 115 (3.7%) | 154 (10.2%) |
| $50,000 to $74,999 | 407 (13.2%) | 184 (12.2%) |
| $75,000 to $99,999 | 389 (12.6%) | 233 (15.4%) |
| $100,000 to $149,999 | 700 (22.7%) | 60 (4.0%) |
| $150,000 or more | 1,192 (38.6%) | 66 (4.4%) |
| Total | 3,091 (100.0%) | 1,509 (100.0%) |
Monthly Housing Cost Tiers in Forestville
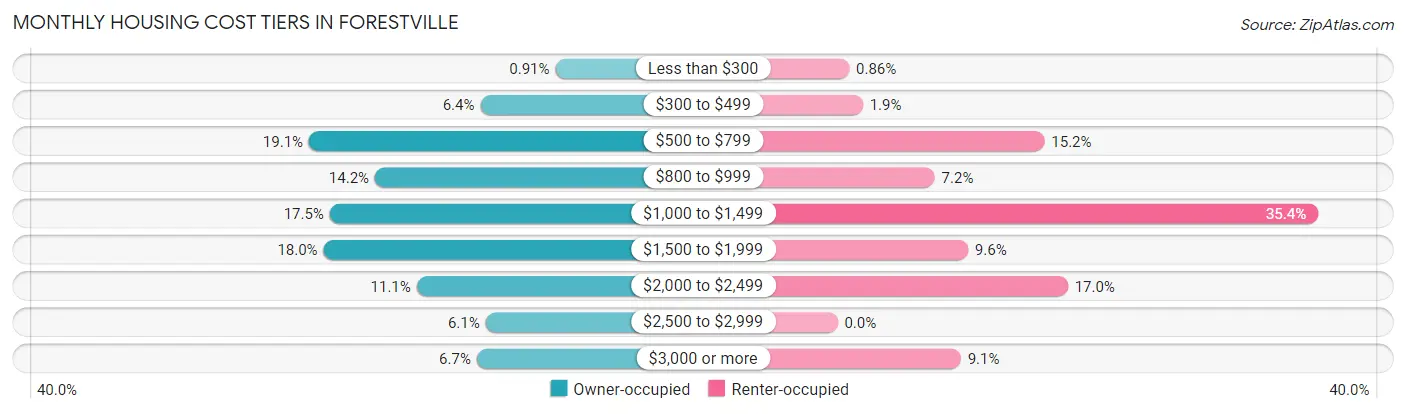
| Monthly Cost | Owner-occupied | Renter-occupied |
| Less than $300 | 28 (0.9%) | 13 (0.9%) |
| $300 to $499 | 199 (6.4%) | 28 (1.9%) |
| $500 to $799 | 589 (19.1%) | 230 (15.2%) |
| $800 to $999 | 439 (14.2%) | 108 (7.2%) |
| $1,000 to $1,499 | 542 (17.5%) | 534 (35.4%) |
| $1,500 to $1,999 | 556 (18.0%) | 145 (9.6%) |
| $2,000 to $2,499 | 344 (11.1%) | 256 (17.0%) |
| $2,500 to $2,999 | 187 (6.0%) | 0 (0.0%) |
| $3,000 or more | 207 (6.7%) | 137 (9.1%) |
| Total | 3,091 (100.0%) | 1,509 (100.0%) |
Physical Housing Characteristics in Forestville
Housing Structures in Forestville
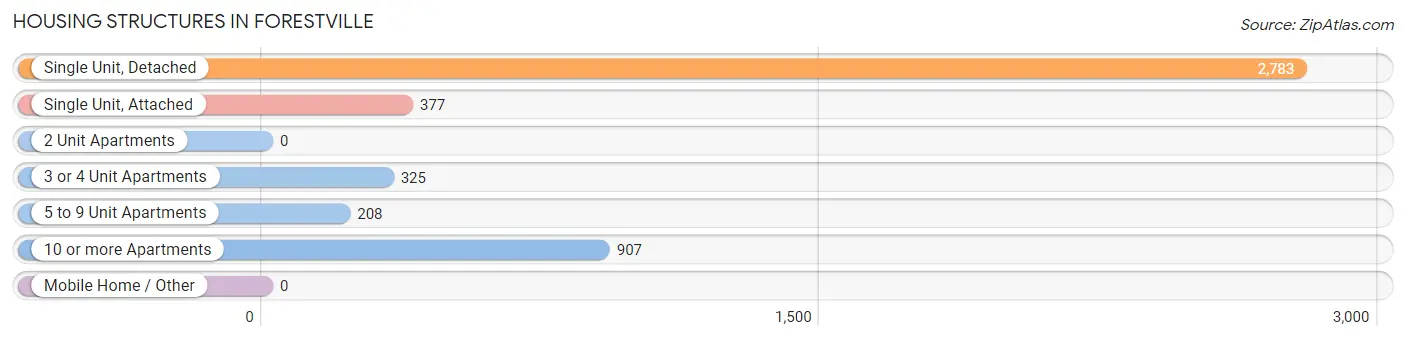
| Structure Type | # Housing Units | % Housing Units |
| Single Unit, Detached | 2,783 | 60.5% |
| Single Unit, Attached | 377 | 8.2% |
| 2 Unit Apartments | 0 | 0.0% |
| 3 or 4 Unit Apartments | 325 | 7.1% |
| 5 to 9 Unit Apartments | 208 | 4.5% |
| 10 or more Apartments | 907 | 19.7% |
| Mobile Home / Other | 0 | 0.0% |
| Total | 4,600 | 100.0% |
Housing Structures by Occupancy in Forestville
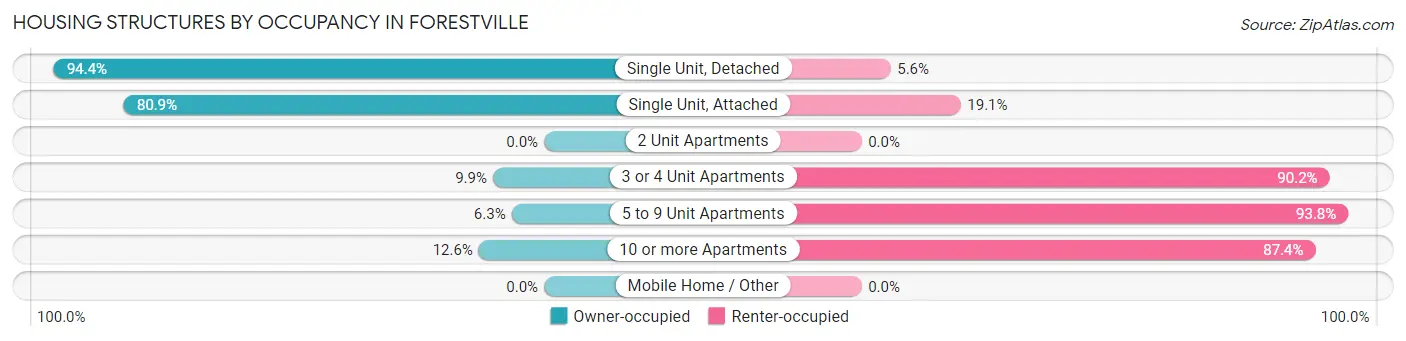
| Structure Type | Owner-occupied | Renter-occupied |
| Single Unit, Detached | 2,627 (94.4%) | 156 (5.6%) |
| Single Unit, Attached | 305 (80.9%) | 72 (19.1%) |
| 2 Unit Apartments | 0 (0.0%) | 0 (0.0%) |
| 3 or 4 Unit Apartments | 32 (9.9%) | 293 (90.1%) |
| 5 to 9 Unit Apartments | 13 (6.2%) | 195 (93.8%) |
| 10 or more Apartments | 114 (12.6%) | 793 (87.4%) |
| Mobile Home / Other | 0 (0.0%) | 0 (0.0%) |
| Total | 3,091 (67.2%) | 1,509 (32.8%) |
Housing Structures by Number of Rooms in Forestville
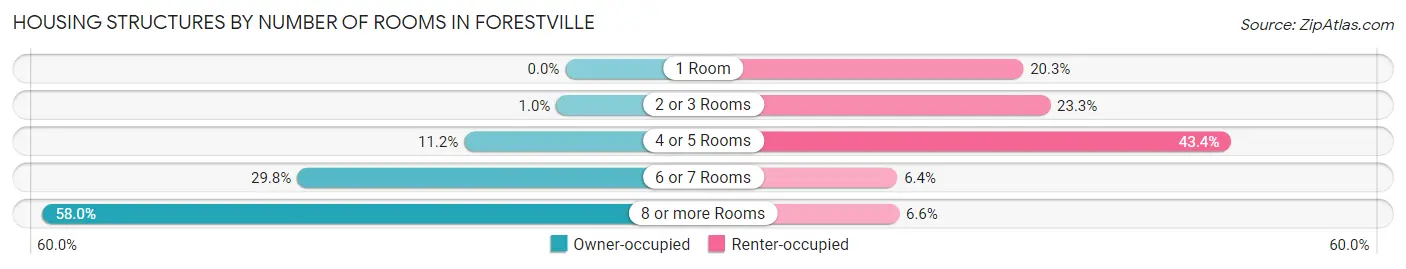
| Number of Rooms | Owner-occupied | Renter-occupied |
| 1 Room | 0 (0.0%) | 307 (20.3%) |
| 2 or 3 Rooms | 31 (1.0%) | 352 (23.3%) |
| 4 or 5 Rooms | 347 (11.2%) | 655 (43.4%) |
| 6 or 7 Rooms | 920 (29.8%) | 96 (6.4%) |
| 8 or more Rooms | 1,793 (58.0%) | 99 (6.6%) |
| Total | 3,091 (100.0%) | 1,509 (100.0%) |
Housing Structure by Heating Type in Forestville
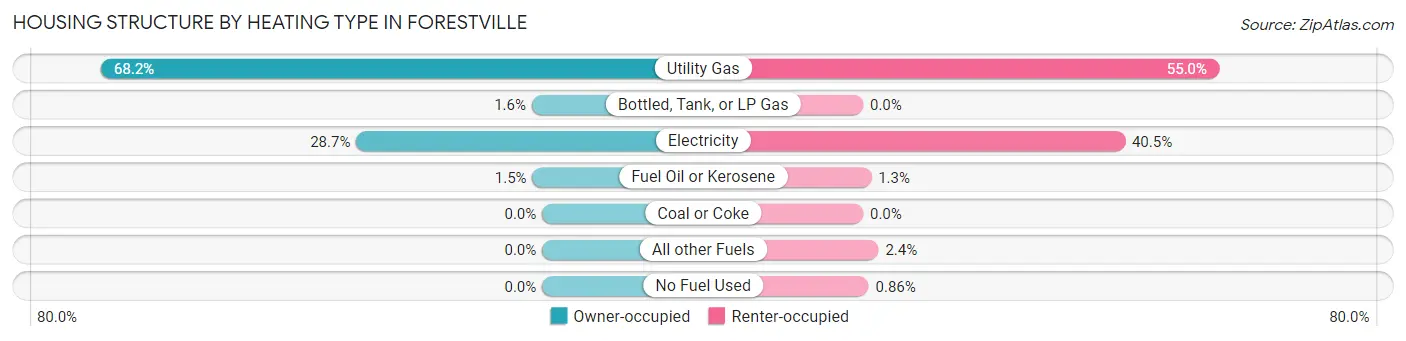
| Heating Type | Owner-occupied | Renter-occupied |
| Utility Gas | 2,108 (68.2%) | 830 (55.0%) |
| Bottled, Tank, or LP Gas | 49 (1.6%) | 0 (0.0%) |
| Electricity | 888 (28.7%) | 611 (40.5%) |
| Fuel Oil or Kerosene | 46 (1.5%) | 19 (1.3%) |
| Coal or Coke | 0 (0.0%) | 0 (0.0%) |
| All other Fuels | 0 (0.0%) | 36 (2.4%) |
| No Fuel Used | 0 (0.0%) | 13 (0.9%) |
| Total | 3,091 (100.0%) | 1,509 (100.0%) |
Household Vehicle Usage in Forestville
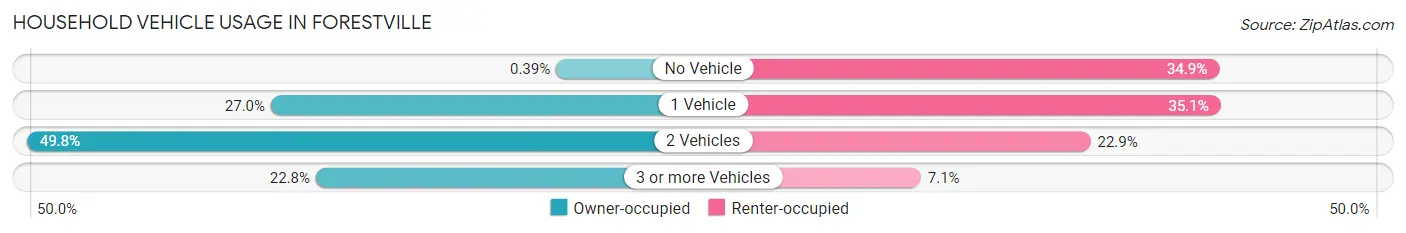
| Vehicles per Household | Owner-occupied | Renter-occupied |
| No Vehicle | 12 (0.4%) | 527 (34.9%) |
| 1 Vehicle | 835 (27.0%) | 529 (35.1%) |
| 2 Vehicles | 1,539 (49.8%) | 346 (22.9%) |
| 3 or more Vehicles | 705 (22.8%) | 107 (7.1%) |
| Total | 3,091 (100.0%) | 1,509 (100.0%) |
Real Estate & Mortgages in Forestville
Real Estate and Mortgage Overview in Forestville
| Characteristic | Without Mortgage | With Mortgage |
| Housing Units | 1,390 | 1,701 |
| Median Property Value | $247,200 | $293,800 |
| Median Household Income | $107,500 | $686 |
| Monthly Housing Costs | $773 | $207 |
| Real Estate Taxes | $4,433 | $13 |
Property Value by Mortgage Status in Forestville
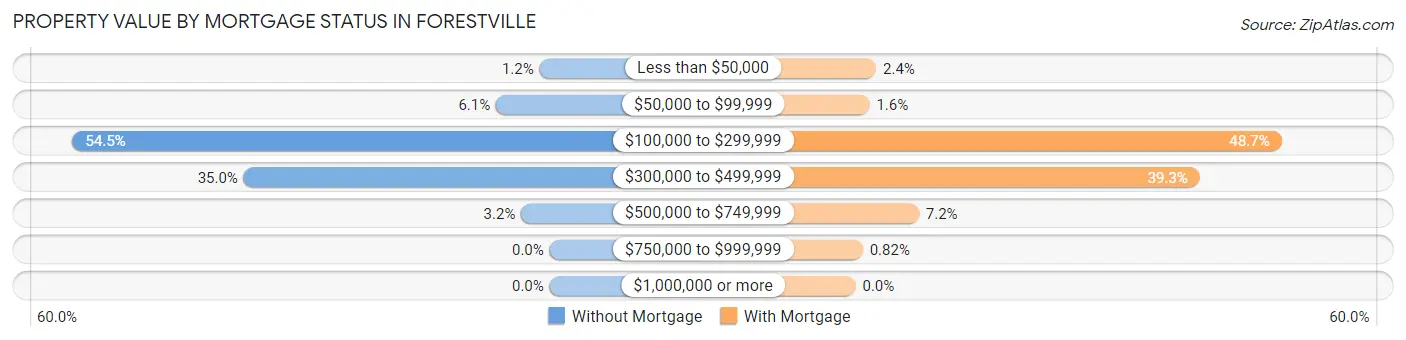
| Property Value | Without Mortgage | With Mortgage |
| Less than $50,000 | 16 (1.1%) | 40 (2.4%) |
| $50,000 to $99,999 | 85 (6.1%) | 27 (1.6%) |
| $100,000 to $299,999 | 758 (54.5%) | 828 (48.7%) |
| $300,000 to $499,999 | 486 (35.0%) | 669 (39.3%) |
| $500,000 to $749,999 | 45 (3.2%) | 123 (7.2%) |
| $750,000 to $999,999 | 0 (0.0%) | 14 (0.8%) |
| $1,000,000 or more | 0 (0.0%) | 0 (0.0%) |
| Total | 1,390 (100.0%) | 1,701 (100.0%) |
Household Income by Mortgage Status in Forestville
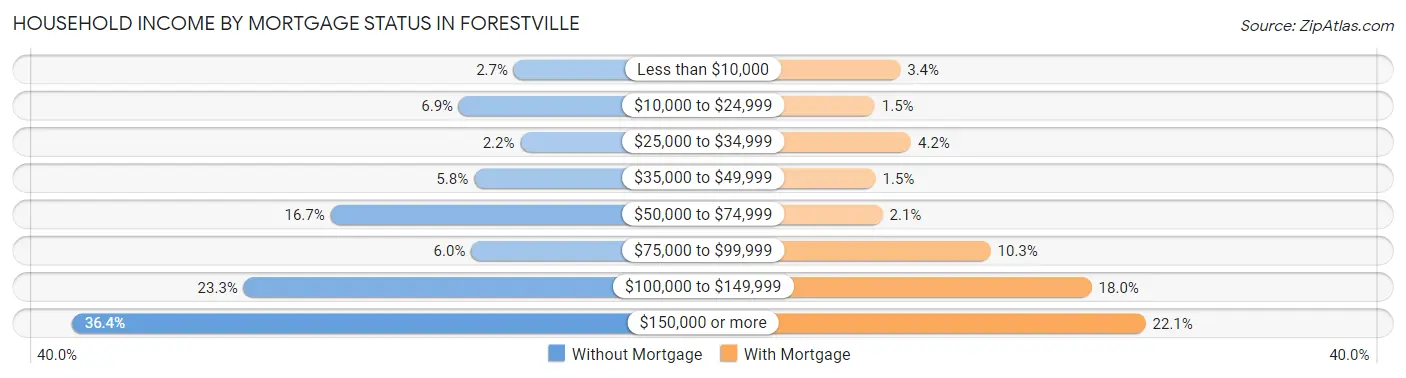
| Household Income | Without Mortgage | With Mortgage |
| Less than $10,000 | 38 (2.7%) | 58 (3.4%) |
| $10,000 to $24,999 | 96 (6.9%) | 25 (1.5%) |
| $25,000 to $34,999 | 31 (2.2%) | 72 (4.2%) |
| $35,000 to $49,999 | 80 (5.8%) | 26 (1.5%) |
| $50,000 to $74,999 | 232 (16.7%) | 35 (2.1%) |
| $75,000 to $99,999 | 83 (6.0%) | 175 (10.3%) |
| $100,000 to $149,999 | 324 (23.3%) | 306 (18.0%) |
| $150,000 or more | 506 (36.4%) | 376 (22.1%) |
| Total | 1,390 (100.0%) | 1,701 (100.0%) |
Property Value to Household Income Ratio in Forestville
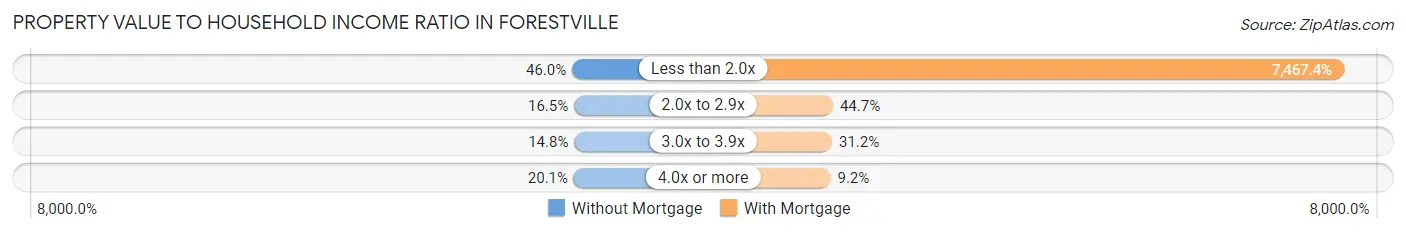
| Value-to-Income Ratio | Without Mortgage | With Mortgage |
| Less than 2.0x | 639 (46.0%) | 127,021 (7,467.4%) |
| 2.0x to 2.9x | 229 (16.5%) | 761 (44.7%) |
| 3.0x to 3.9x | 205 (14.7%) | 530 (31.2%) |
| 4.0x or more | 279 (20.1%) | 156 (9.2%) |
| Total | 1,390 (100.0%) | 1,701 (100.0%) |
Real Estate Taxes by Mortgage Status in Forestville
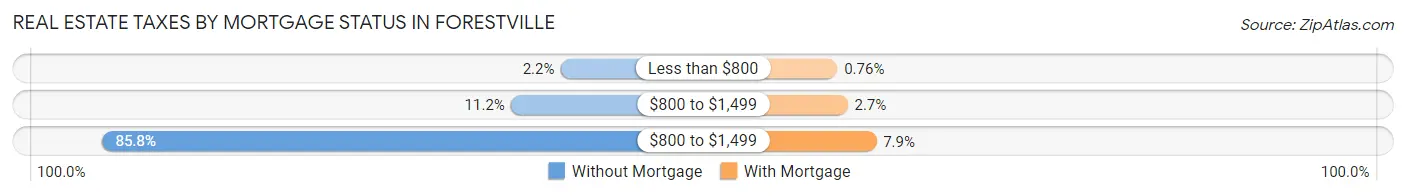
| Property Taxes | Without Mortgage | With Mortgage |
| Less than $800 | 30 (2.2%) | 13 (0.8%) |
| $800 to $1,499 | 156 (11.2%) | 45 (2.6%) |
| $800 to $1,499 | 1,192 (85.8%) | 134 (7.9%) |
| Total | 1,390 (100.0%) | 1,701 (100.0%) |
Health & Disability in Forestville
Health Insurance Coverage by Age in Forestville
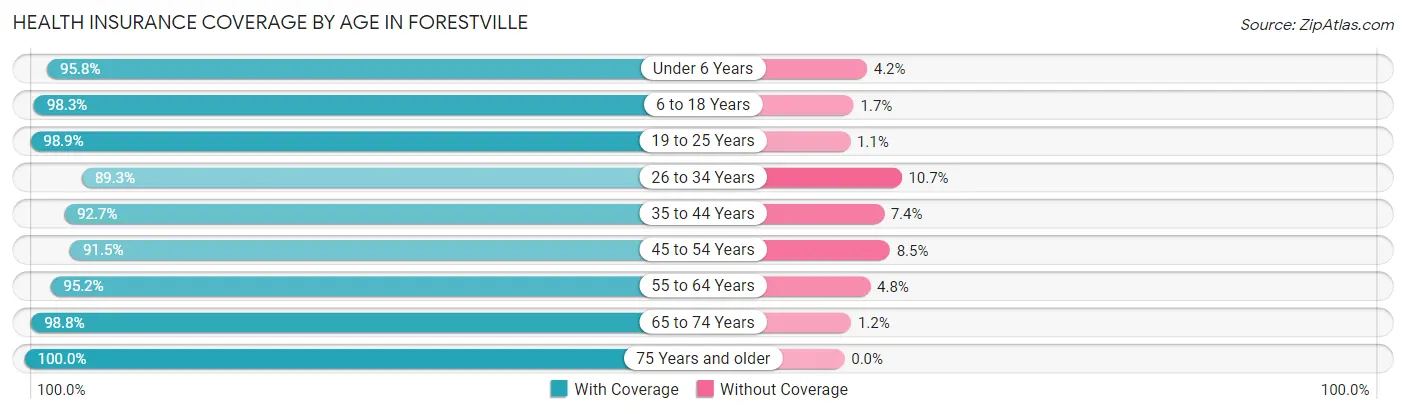
| Age Bracket | With Coverage | Without Coverage |
| Under 6 Years | 526 (95.8%) | 23 (4.2%) |
| 6 to 18 Years | 1,805 (98.3%) | 32 (1.7%) |
| 19 to 25 Years | 651 (98.9%) | 7 (1.1%) |
| 26 to 34 Years | 964 (89.3%) | 115 (10.7%) |
| 35 to 44 Years | 1,034 (92.6%) | 82 (7.3%) |
| 45 to 54 Years | 1,178 (91.5%) | 109 (8.5%) |
| 55 to 64 Years | 1,285 (95.2%) | 65 (4.8%) |
| 65 to 74 Years | 1,353 (98.8%) | 17 (1.2%) |
| 75 Years and older | 1,403 (100.0%) | 0 (0.0%) |
| Total | 10,199 (95.8%) | 450 (4.2%) |
Health Insurance Coverage by Citizenship Status in Forestville
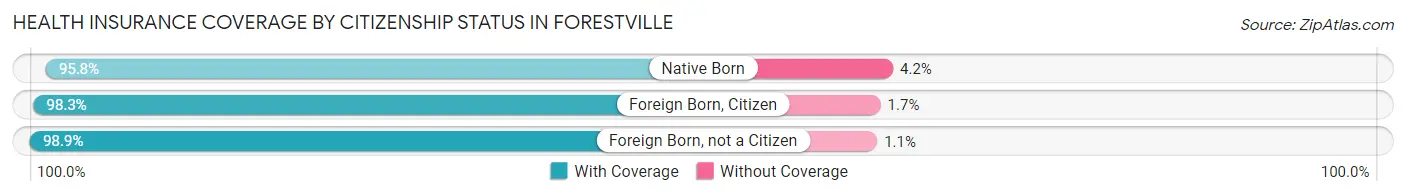
| Citizenship Status | With Coverage | Without Coverage |
| Native Born | 526 (95.8%) | 23 (4.2%) |
| Foreign Born, Citizen | 1,805 (98.3%) | 32 (1.7%) |
| Foreign Born, not a Citizen | 651 (98.9%) | 7 (1.1%) |
Health Insurance Coverage by Household Income in Forestville
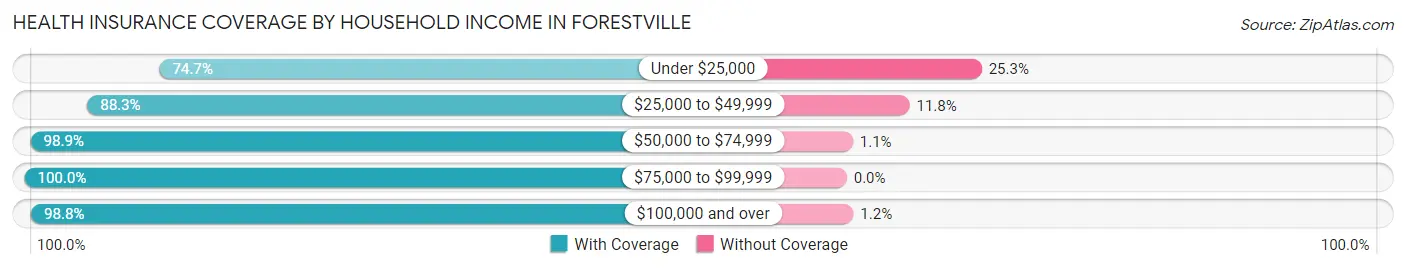
| Household Income | With Coverage | Without Coverage |
| Under $25,000 | 789 (74.7%) | 267 (25.3%) |
| $25,000 to $49,999 | 616 (88.2%) | 82 (11.7%) |
| $50,000 to $74,999 | 1,132 (98.9%) | 13 (1.1%) |
| $75,000 to $99,999 | 1,426 (100.0%) | 0 (0.0%) |
| $100,000 and over | 6,219 (98.8%) | 78 (1.2%) |
Public vs Private Health Insurance Coverage by Age in Forestville
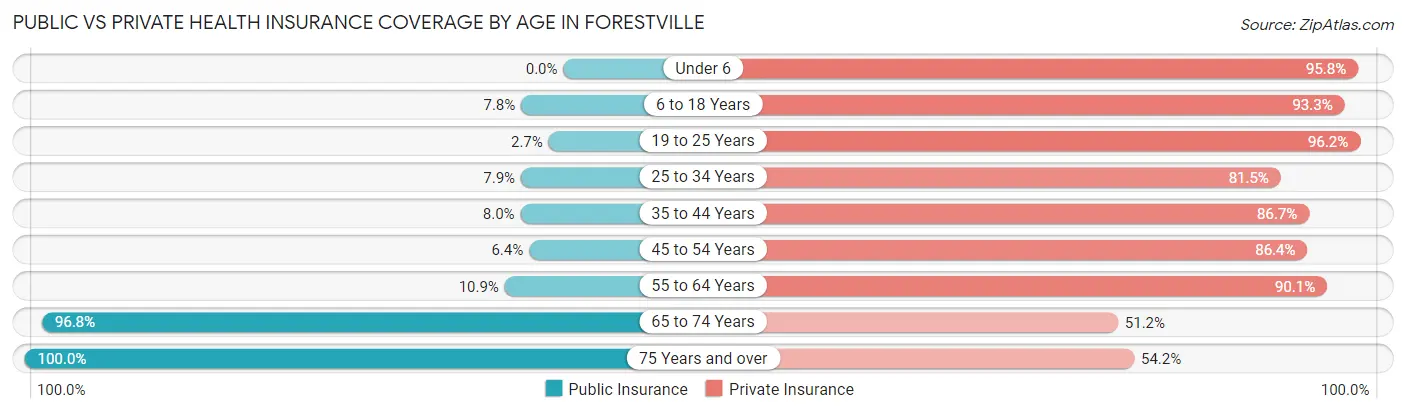
| Age Bracket | Public Insurance | Private Insurance |
| Under 6 | 0 (0.0%) | 526 (95.8%) |
| 6 to 18 Years | 144 (7.8%) | 1,714 (93.3%) |
| 19 to 25 Years | 18 (2.7%) | 633 (96.2%) |
| 25 to 34 Years | 85 (7.9%) | 879 (81.5%) |
| 35 to 44 Years | 89 (8.0%) | 968 (86.7%) |
| 45 to 54 Years | 82 (6.4%) | 1,112 (86.4%) |
| 55 to 64 Years | 147 (10.9%) | 1,216 (90.1%) |
| 65 to 74 Years | 1,326 (96.8%) | 702 (51.2%) |
| 75 Years and over | 1,403 (100.0%) | 761 (54.2%) |
| Total | 3,294 (30.9%) | 8,511 (79.9%) |
Disability Status by Sex by Age in Forestville
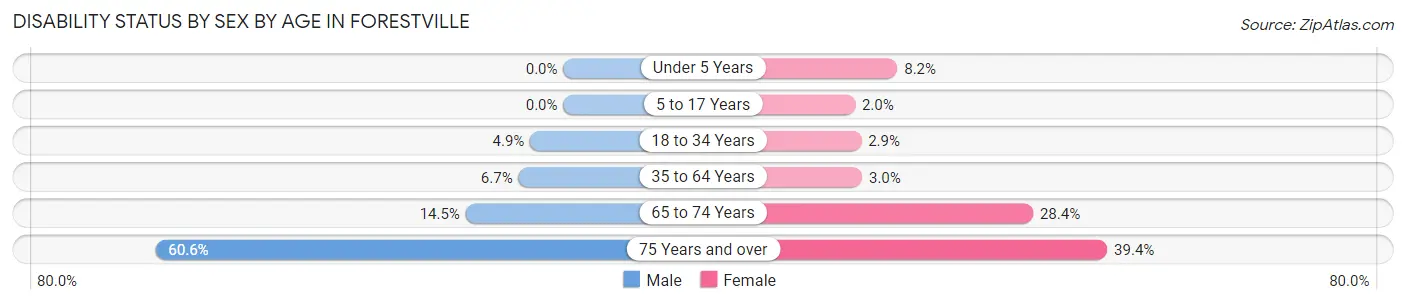
| Age Bracket | Male | Female |
| Under 5 Years | 0 (0.0%) | 23 (8.2%) |
| 5 to 17 Years | 0 (0.0%) | 19 (2.0%) |
| 18 to 34 Years | 49 (4.9%) | 24 (2.9%) |
| 35 to 64 Years | 124 (6.7%) | 57 (3.0%) |
| 65 to 74 Years | 95 (14.5%) | 203 (28.4%) |
| 75 Years and over | 424 (60.6%) | 277 (39.4%) |
Disability Class by Sex by Age in Forestville
Disability Class: Hearing Difficulty
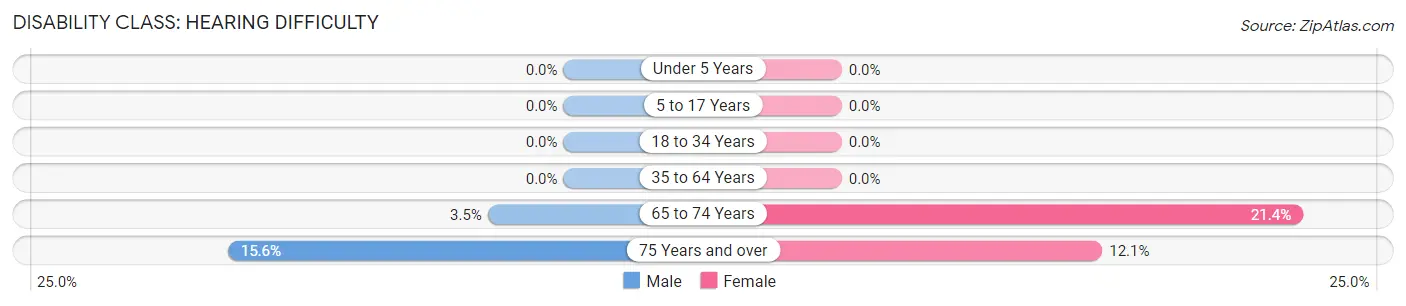
| Age Bracket | Male | Female |
| Under 5 Years | 0 (0.0%) | 0 (0.0%) |
| 5 to 17 Years | 0 (0.0%) | 0 (0.0%) |
| 18 to 34 Years | 0 (0.0%) | 0 (0.0%) |
| 35 to 64 Years | 0 (0.0%) | 0 (0.0%) |
| 65 to 74 Years | 23 (3.5%) | 153 (21.4%) |
| 75 Years and over | 109 (15.6%) | 85 (12.1%) |
Disability Class: Vision Difficulty
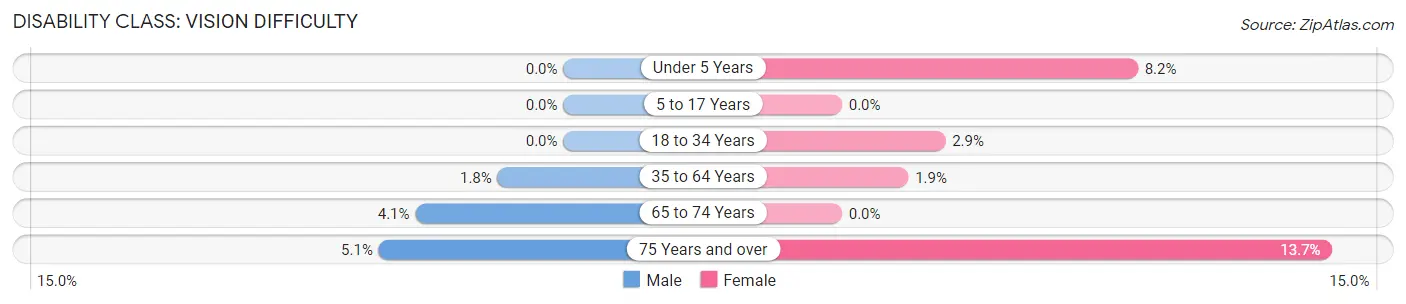
| Age Bracket | Male | Female |
| Under 5 Years | 0 (0.0%) | 23 (8.2%) |
| 5 to 17 Years | 0 (0.0%) | 0 (0.0%) |
| 18 to 34 Years | 0 (0.0%) | 24 (2.9%) |
| 35 to 64 Years | 34 (1.8%) | 35 (1.8%) |
| 65 to 74 Years | 27 (4.1%) | 0 (0.0%) |
| 75 Years and over | 36 (5.1%) | 96 (13.7%) |
Disability Class: Cognitive Difficulty
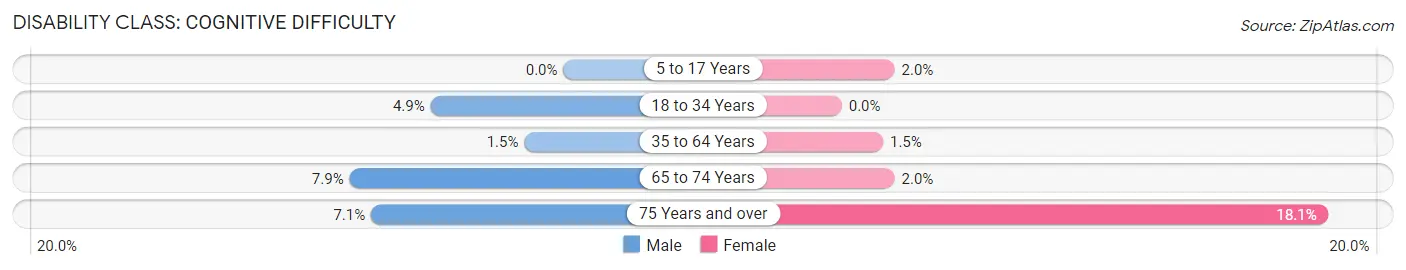
| Age Bracket | Male | Female |
| 5 to 17 Years | 0 (0.0%) | 19 (2.0%) |
| 18 to 34 Years | 49 (4.9%) | 0 (0.0%) |
| 35 to 64 Years | 27 (1.5%) | 29 (1.5%) |
| 65 to 74 Years | 52 (7.9%) | 14 (2.0%) |
| 75 Years and over | 50 (7.1%) | 127 (18.1%) |
Disability Class: Ambulatory Difficulty
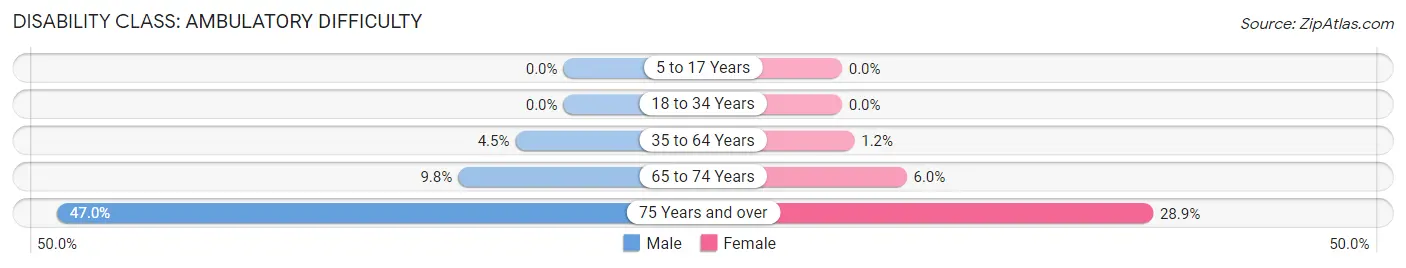
| Age Bracket | Male | Female |
| 5 to 17 Years | 0 (0.0%) | 0 (0.0%) |
| 18 to 34 Years | 0 (0.0%) | 0 (0.0%) |
| 35 to 64 Years | 83 (4.5%) | 22 (1.2%) |
| 65 to 74 Years | 64 (9.8%) | 43 (6.0%) |
| 75 Years and over | 329 (47.0%) | 203 (28.9%) |
Disability Class: Self-Care Difficulty
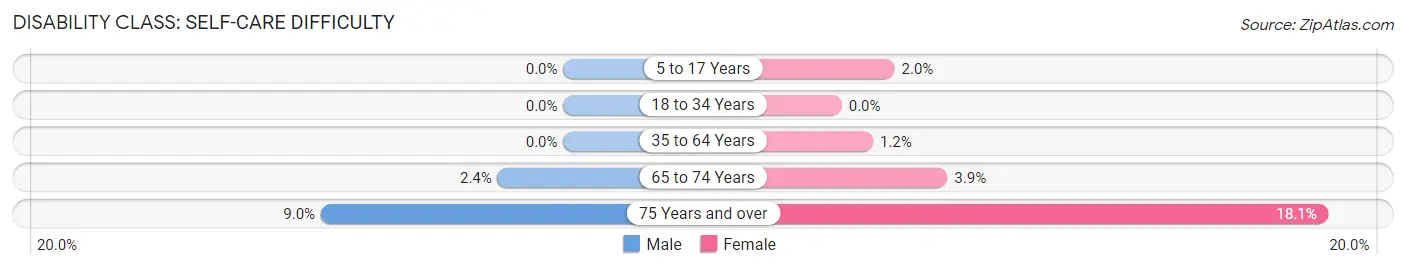
| Age Bracket | Male | Female |
| 5 to 17 Years | 0 (0.0%) | 19 (2.0%) |
| 18 to 34 Years | 0 (0.0%) | 0 (0.0%) |
| 35 to 64 Years | 0 (0.0%) | 22 (1.2%) |
| 65 to 74 Years | 16 (2.4%) | 28 (3.9%) |
| 75 Years and over | 63 (9.0%) | 127 (18.1%) |
Technology Access in Forestville
Computing Device Access in Forestville
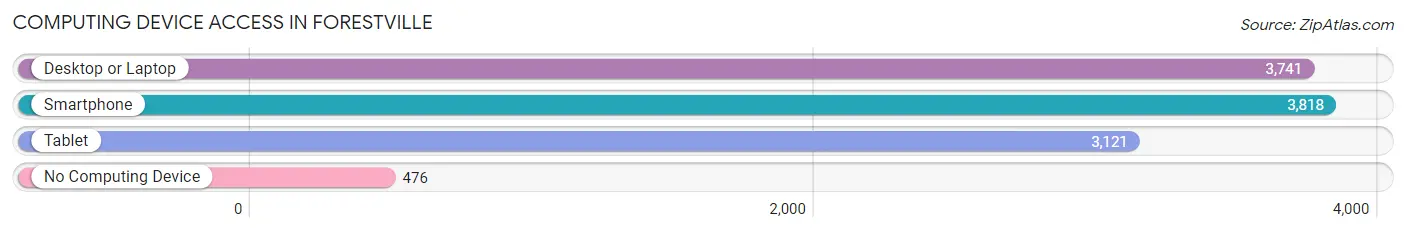
| Device Type | # Households | % Households |
| Desktop or Laptop | 3,741 | 81.3% |
| Smartphone | 3,818 | 83.0% |
| Tablet | 3,121 | 67.8% |
| No Computing Device | 476 | 10.3% |
| Total | 4,600 | 100.0% |
Internet Access in Forestville
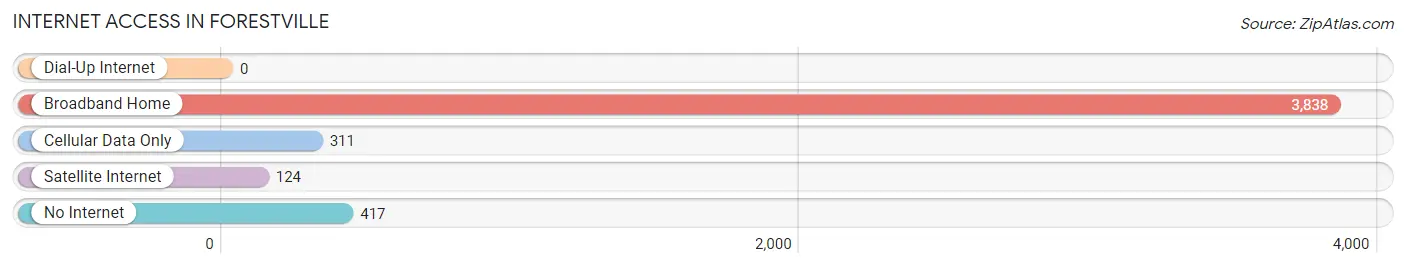
| Internet Type | # Households | % Households |
| Dial-Up Internet | 0 | 0.0% |
| Broadband Home | 3,838 | 83.4% |
| Cellular Data Only | 311 | 6.8% |
| Satellite Internet | 124 | 2.7% |
| No Internet | 417 | 9.1% |
| Total | 4,600 | 100.0% |
Forestville Summary
History
The small village of Forestville, Ohio is located in Trumbull County, in the northeastern part of the state. It is situated on the banks of the Mahoning River, and is part of the Youngstown-Warren-Boardman metropolitan area. The village was founded in 1818 by a group of settlers from Connecticut, and was originally known as “Connecticut Settlement”. The name was changed to Forestville in 1820, and the village was incorporated in 1845.
The village was originally a farming community, and the main crops were wheat, corn, and oats. The village also had a sawmill, a gristmill, and a woolen mill. In the late 19th century, the village began to grow and develop, and several businesses were established, including a brickyard, a furniture factory, and a canning factory.
The village was also home to several churches, including the First Presbyterian Church, which was founded in 1820, and the Forestville Methodist Church, which was founded in 1845. The village also had a school, which was established in 1845.
Geography
Forestville is located in Trumbull County, in the northeastern part of Ohio. It is situated on the banks of the Mahoning River, and is part of the Youngstown-Warren-Boardman metropolitan area. The village covers an area of 1.2 square miles, and has a population of approximately 1,400 people.
The village is located in a rural area, and is surrounded by farmland. The terrain is mostly flat, with some rolling hills. The climate is humid continental, with hot summers and cold winters.
Economy
The economy of Forestville is largely based on agriculture. The main crops are corn, wheat, and oats. The village also has several small businesses, including a furniture factory, a brickyard, and a canning factory.
The village is also home to several churches, and the local school district serves the village and the surrounding area. The village also has a post office, a library, and a few restaurants.
Demographics
As of the 2010 census, the population of Forestville was 1,400 people. The racial makeup of the village was 97.4% White, 0.7% African American, 0.3% Native American, 0.3% Asian, and 1.3% from other races. The median household income was $37,500, and the median family income was $45,000.
The village has a high rate of poverty, with 28.3% of the population living below the poverty line. The unemployment rate is also high, at 8.3%. The village has a high rate of home ownership, with 81.3% of the population owning their own homes.
Conclusion
Forestville is a small village located in Trumbull County, Ohio. It was founded in 1818, and was originally a farming community. The village has since grown and developed, and now has several small businesses, churches, and a school. The economy is largely based on agriculture, and the village has a high rate of poverty and unemployment. The population is mostly White, with a small percentage of African Americans, Native Americans, and Asians.
Common Questions
What is the Total Population of Forestville?
Total Population of Forestville is 10,724.
What is the Total Male Population of Forestville?
Total Male Population of Forestville is 5,271.
What is the Total Female Population of Forestville?
Total Female Population of Forestville is 5,453.
What is the Ratio of Males per 100 Females in Forestville?
There are 96.66 Males per 100 Females in Forestville.
What is the Ratio of Females per 100 Males in Forestville?
There are 103.45 Females per 100 Males in Forestville.
What is the Median Population Age in Forestville?
Median Population Age in Forestville is 46.7 Years.
What is the Average Family Size in Forestville
Average Family Size in Forestville is 3.0 People.
What is the Average Household Size in Forestville
Average Household Size in Forestville is 2.3 People.
What is Per Capita Income in Forestville?
Per Capita income in Forestville is $49,040.
What is the Median Family Income in Forestville?
Median Family Income in Forestville is $122,023.
What is the Median Household income in Forestville?
Median Household Income in Forestville is $90,313.
What is Income or Wage Gap in Forestville?
Income or Wage Gap in Forestville is 12.7%.
Women in Forestville earn 87.3 cents for every dollar earned by a man.
What is Inequality or Gini Index in Forestville?
Inequality or Gini Index in Forestville is 0.46.
How Large is the Labor Force in Forestville?
There are 5,370 People in the Labor Forcein in Forestville.
What is the Percentage of People in the Labor Force in Forestville?
62.3% of People are in the Labor Force in Forestville.
What is the Unemployment Rate in Forestville?
Unemployment Rate in Forestville is 5.7%.