St Martin, OH
St Martin Map
St Martin Overview
135
TOTAL POPULATION
56
MALE POPULATION
79
FEMALE POPULATION
70.89
MALES / 100 FEMALES
141.07
FEMALES / 100 MALES
49.0
MEDIAN AGE
2.7
AVG FAMILY SIZE
2.3
AVG HOUSEHOLD SIZE
$41,519
PER CAPITA INCOME
$127,308
AVG FAMILY INCOME
$125,769
AVG HOUSEHOLD INCOME
0.37
INEQUALITY / GINI INDEX
80
LABOR FORCE [ PEOPLE ]
62.0%
PERCENT IN LABOR FORCE
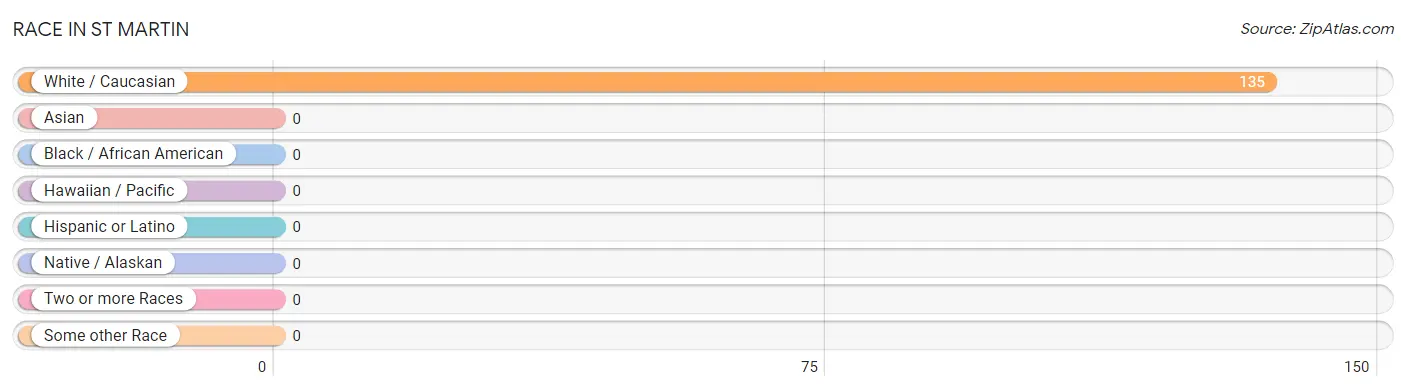
Race in St Martin
The most populous races in St Martin are , and White / Caucasian (135 | 100.0%).
| Race | # Population | % Population |
| Asian | 0 | 0.0% |
| Black / African American | 0 | 0.0% |
| Hawaiian / Pacific | 0 | 0.0% |
| Hispanic or Latino | 0 | 0.0% |
| Native / Alaskan | 0 | 0.0% |
| White / Caucasian | 135 | 100.0% |
| Two or more Races | 0 | 0.0% |
| Some other Race | 0 | 0.0% |
| Total | 135 | 100.0% |
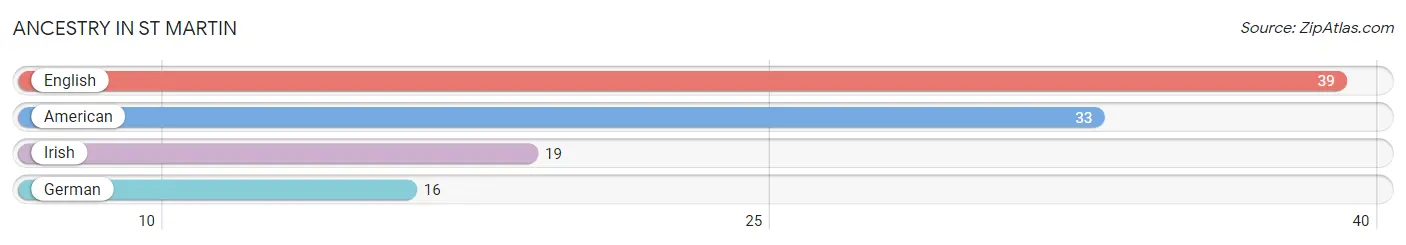
Ancestry in St Martin
The most populous ancestries reported in St Martin are English (39 | 28.9%), American (33 | 24.4%), Irish (19 | 14.1%), and German (16 | 11.8%), together accounting for 79.2% of all St Martin residents.
| Ancestry | # Population | % Population |
| American | 33 | 24.4% |
| English | 39 | 28.9% |
| German | 16 | 11.8% |
| Irish | 19 | 14.1% | View All 4 Rows |
Immigrants in St Martin

| Immigration Origin | # Population | % Population | View All 0 Rows |
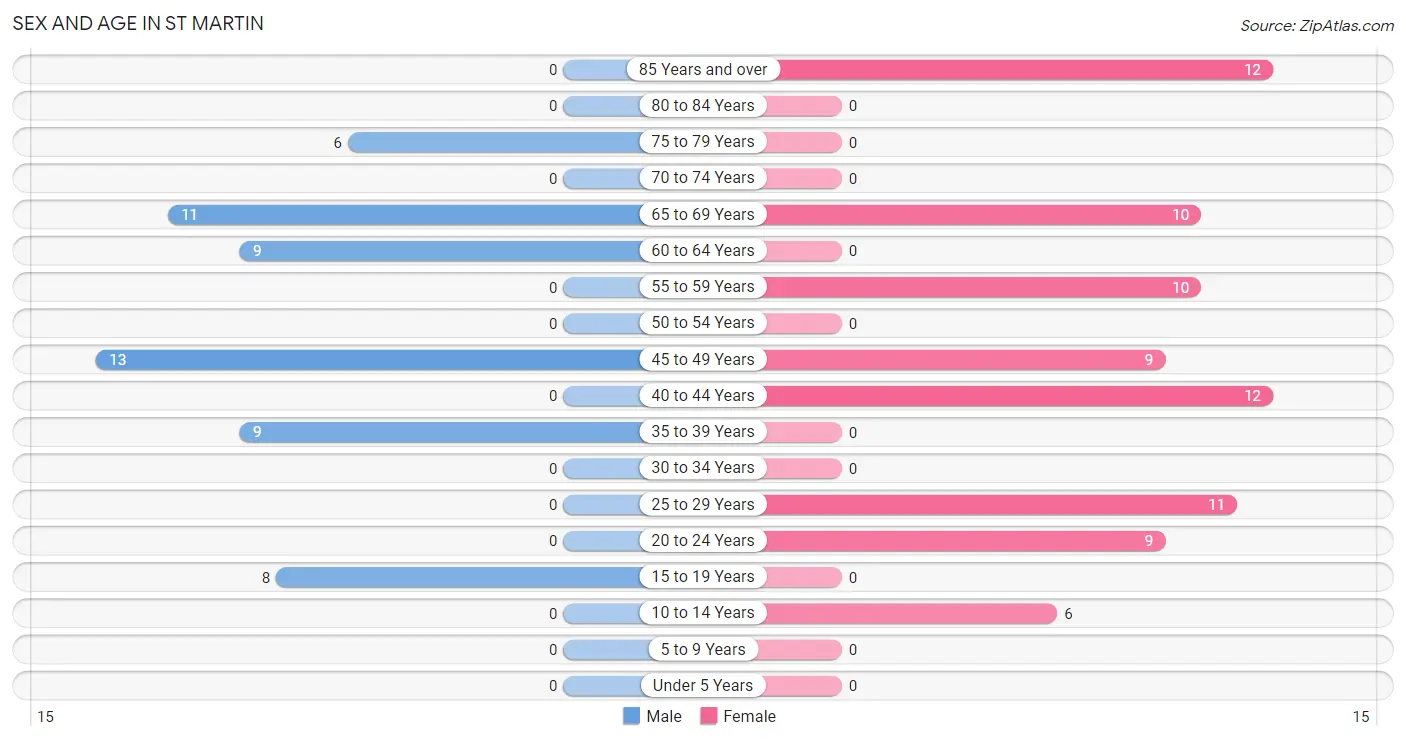
Sex and Age in St Martin
Sex and Age in St Martin
The most populous age groups in St Martin are 45 to 49 Years (13 | 23.2%) for men and 40 to 44 Years (12 | 15.2%) for women.
| Age Bracket | Male | Female |
| Under 5 Years | 0 (0.0%) | 0 (0.0%) |
| 5 to 9 Years | 0 (0.0%) | 0 (0.0%) |
| 10 to 14 Years | 0 (0.0%) | 6 (7.6%) |
| 15 to 19 Years | 8 (14.3%) | 0 (0.0%) |
| 20 to 24 Years | 0 (0.0%) | 9 (11.4%) |
| 25 to 29 Years | 0 (0.0%) | 11 (13.9%) |
| 30 to 34 Years | 0 (0.0%) | 0 (0.0%) |
| 35 to 39 Years | 9 (16.1%) | 0 (0.0%) |
| 40 to 44 Years | 0 (0.0%) | 12 (15.2%) |
| 45 to 49 Years | 13 (23.2%) | 9 (11.4%) |
| 50 to 54 Years | 0 (0.0%) | 0 (0.0%) |
| 55 to 59 Years | 0 (0.0%) | 10 (12.7%) |
| 60 to 64 Years | 9 (16.1%) | 0 (0.0%) |
| 65 to 69 Years | 11 (19.6%) | 10 (12.7%) |
| 70 to 74 Years | 0 (0.0%) | 0 (0.0%) |
| 75 to 79 Years | 6 (10.7%) | 0 (0.0%) |
| 80 to 84 Years | 0 (0.0%) | 0 (0.0%) |
| 85 Years and over | 0 (0.0%) | 12 (15.2%) |
| Total | 56 (100.0%) | 79 (100.0%) |
Families and Households in St Martin
Median Family Size in St Martin
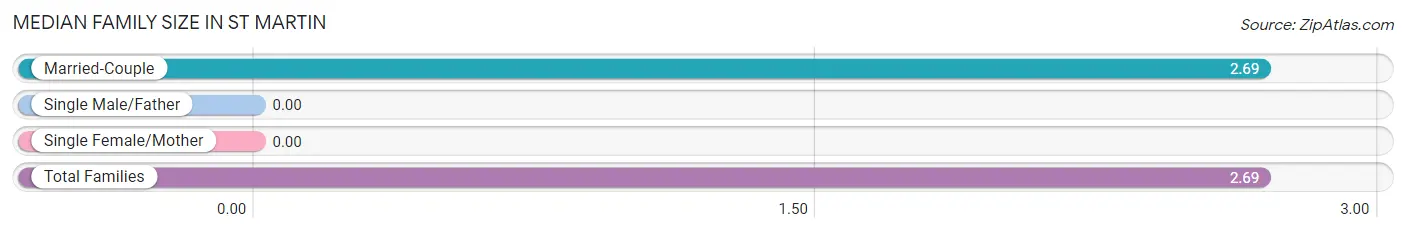
| Family Type | # Families | Family Size |
| Married-Couple | 42 (100.0%) | 2.69 |
| Single Male/Father | 0 (0.0%) | - |
| Single Female/Mother | 0 (0.0%) | - |
| Total Families | 42 (100.0%) | 2.69 |
Median Household Size in St Martin
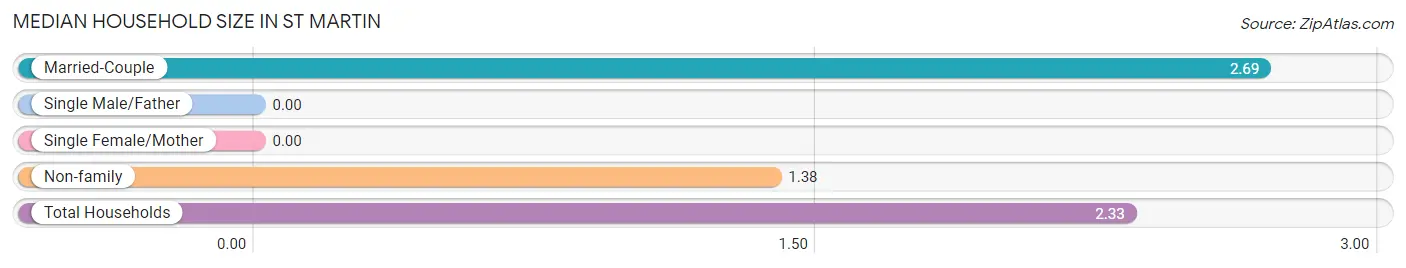
| Household Type | # Households | Household Size |
| Married-Couple | 42 (72.4%) | 2.69 |
| Single Male/Father | 0 (0.0%) | - |
| Single Female/Mother | 0 (0.0%) | - |
| Non-family | 16 (27.6%) | 1.38 |
| Total Households | 58 (100.0%) | 2.33 |
Household Size by Marriage Status in St Martin
Out of a total of 58 households in St Martin, 42 (72.4%) are family households, while 16 (27.6%) are nonfamily households. The most numerous type of family households are 3-person households, comprising 33, and the most common type of nonfamily households are 2-person households, comprising 10.
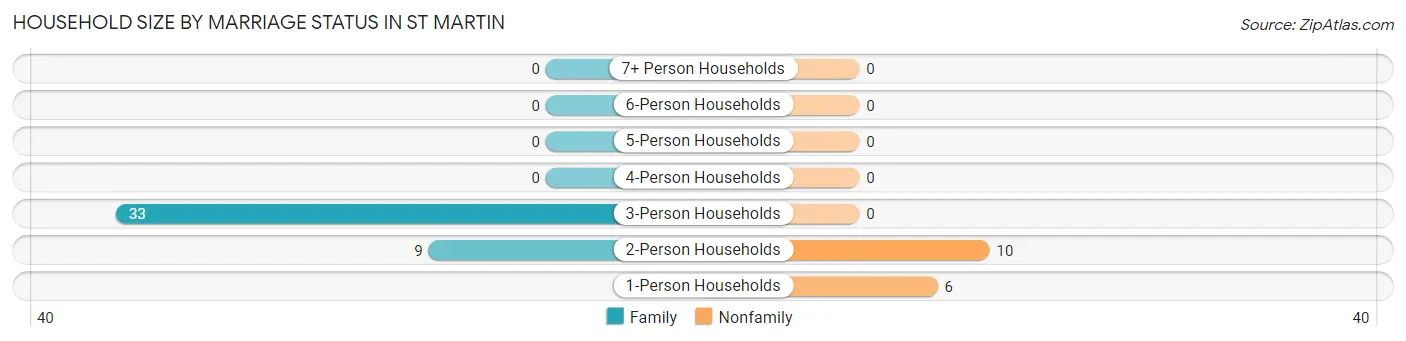
| Household Size | Family Households | Nonfamily Households |
| 1-Person Households | - | 6 (10.3%) |
| 2-Person Households | 9 (15.5%) | 10 (17.2%) |
| 3-Person Households | 33 (56.9%) | 0 (0.0%) |
| 4-Person Households | 0 (0.0%) | 0 (0.0%) |
| 5-Person Households | 0 (0.0%) | 0 (0.0%) |
| 6-Person Households | 0 (0.0%) | 0 (0.0%) |
| 7+ Person Households | 0 (0.0%) | 0 (0.0%) |
| Total | 42 (72.4%) | 16 (27.6%) |
Female Fertility in St Martin
Fertility by Age in St Martin
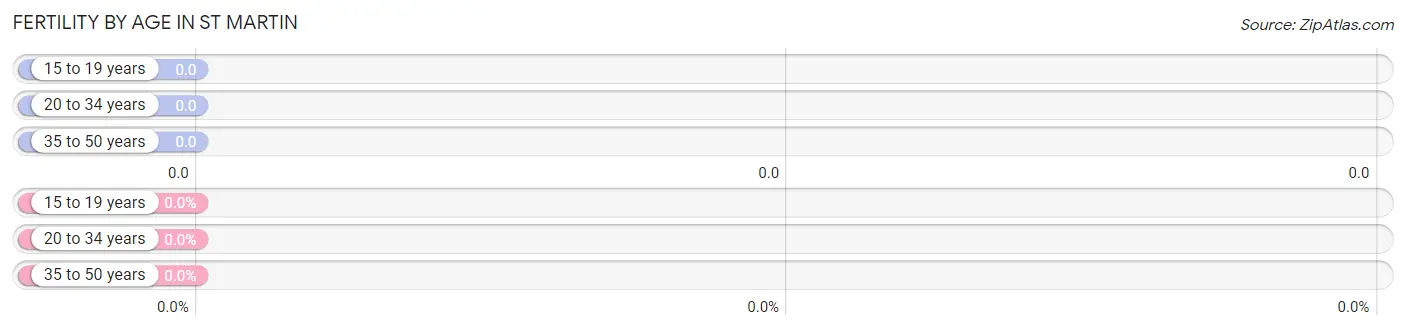
| Age Bracket | Women with Births | Births / 1,000 Women |
| 15 to 19 years | 0 (0.0%) | 0.0 |
| 20 to 34 years | 0 (0.0%) | 0.0 |
| 35 to 50 years | 0 (0.0%) | 0.0 |
| Total | 0 (0.0%) | 0.0 |
Fertility by Age by Marriage Status in St Martin
| Age Bracket | Married | Unmarried |
| 15 to 19 years | 0 (0.0%) | 0 (0.0%) |
| 20 to 34 years | 0 (0.0%) | 0 (0.0%) |
| 35 to 50 years | 0 (0.0%) | 0 (0.0%) |
| Total | 0 (0.0%) | 0 (0.0%) |
Fertility by Education in St Martin
| Educational Attainment | Women with Births | Births / 1,000 Women |
| Less than High School | 0 (0.0%) | 0.0 |
| High School Diploma | 0 (0.0%) | 0.0 |
| College or Associate's Degree | 0 (0.0%) | 0.0 |
| Bachelor's Degree | 0 (0.0%) | 0.0 |
| Graduate Degree | 0 (0.0%) | 0.0 |
| Total | 0 (0.0%) | 0.0 |
Fertility by Education by Marriage Status in St Martin
| Educational Attainment | Married | Unmarried |
| Less than High School | 0 (0.0%) | 0 (0.0%) |
| High School Diploma | 0 (0.0%) | 0 (0.0%) |
| College or Associate's Degree | 0 (0.0%) | 0 (0.0%) |
| Bachelor's Degree | 0 (0.0%) | 0 (0.0%) |
| Graduate Degree | 0 (0.0%) | 0 (0.0%) |
| Total | 0 (0.0%) | 0 (0.0%) |
Income in St Martin
Income Overview in St Martin
Per Capita Income in St Martin is $41,519, while median incomes of families and households are $127,308 and $125,769 respectively.
| Characteristic | Number | Measure |
| Per Capita Income | 135 | $41,519 |
| Median Family Income | 42 | $127,308 |
| Mean Family Income | 42 | $127,440 |
| Median Household Income | 58 | $125,769 |
| Mean Household Income | 58 | $96,252 |
| Income Deficit | 42 | $0 |
| Wage / Income Gap (%) | 135 | 0.00% |
| Wage / Income Gap ($) | 135 | 100.00¢ per $1 |
| Gini / Inequality Index | 135 | 0.37 |
Earnings by Sex in St Martin
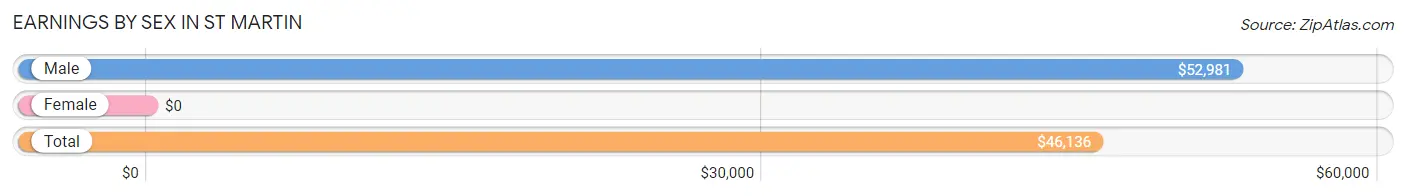
| Sex | Number | Average Earnings |
| Male | 39 (48.7%) | $52,981 |
| Female | 41 (51.2%) | $0 |
| Total | 80 (100.0%) | $46,136 |
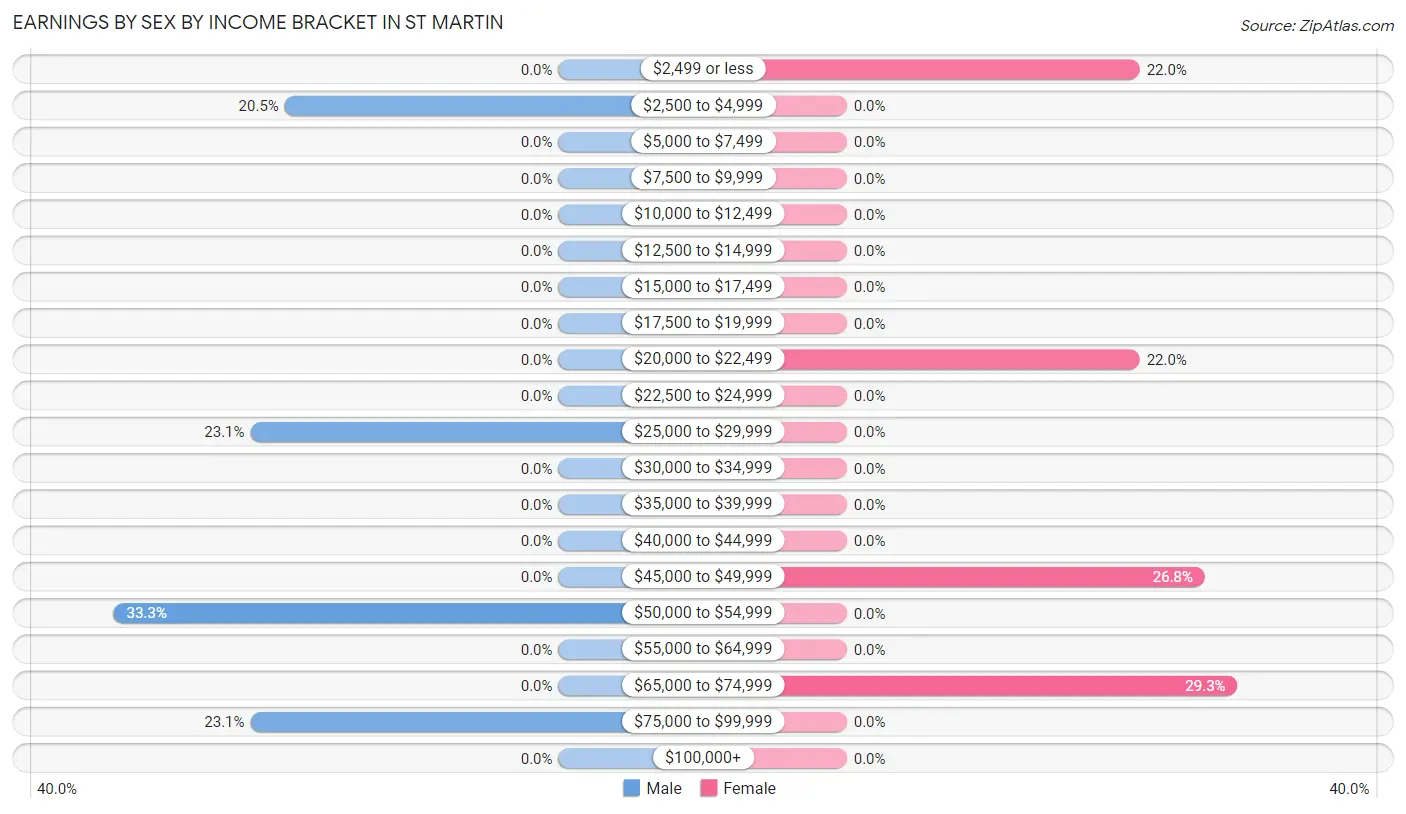
Earnings by Sex by Income Bracket in St Martin
The most common earnings brackets in St Martin are $50,000 to $54,999 for men (13 | 33.3%) and $65,000 to $74,999 for women (12 | 29.3%).
| Income | Male | Female |
| $2,499 or less | 0 (0.0%) | 9 (22.0%) |
| $2,500 to $4,999 | 8 (20.5%) | 0 (0.0%) |
| $5,000 to $7,499 | 0 (0.0%) | 0 (0.0%) |
| $7,500 to $9,999 | 0 (0.0%) | 0 (0.0%) |
| $10,000 to $12,499 | 0 (0.0%) | 0 (0.0%) |
| $12,500 to $14,999 | 0 (0.0%) | 0 (0.0%) |
| $15,000 to $17,499 | 0 (0.0%) | 0 (0.0%) |
| $17,500 to $19,999 | 0 (0.0%) | 0 (0.0%) |
| $20,000 to $22,499 | 0 (0.0%) | 9 (22.0%) |
| $22,500 to $24,999 | 0 (0.0%) | 0 (0.0%) |
| $25,000 to $29,999 | 9 (23.1%) | 0 (0.0%) |
| $30,000 to $34,999 | 0 (0.0%) | 0 (0.0%) |
| $35,000 to $39,999 | 0 (0.0%) | 0 (0.0%) |
| $40,000 to $44,999 | 0 (0.0%) | 0 (0.0%) |
| $45,000 to $49,999 | 0 (0.0%) | 11 (26.8%) |
| $50,000 to $54,999 | 13 (33.3%) | 0 (0.0%) |
| $55,000 to $64,999 | 0 (0.0%) | 0 (0.0%) |
| $65,000 to $74,999 | 0 (0.0%) | 12 (29.3%) |
| $75,000 to $99,999 | 9 (23.1%) | 0 (0.0%) |
| $100,000+ | 0 (0.0%) | 0 (0.0%) |
| Total | 39 (100.0%) | 41 (100.0%) |
Earnings by Sex by Educational Attainment in St Martin
| Educational Attainment | Male Income | Female Income |
| Less than High School | - | - |
| High School Diploma | - | - |
| College or Associate's Degree | - | - |
| Bachelor's Degree | - | - |
| Graduate Degree | - | - |
| Total | $53,750 | $46,591 |
Family Income in St Martin
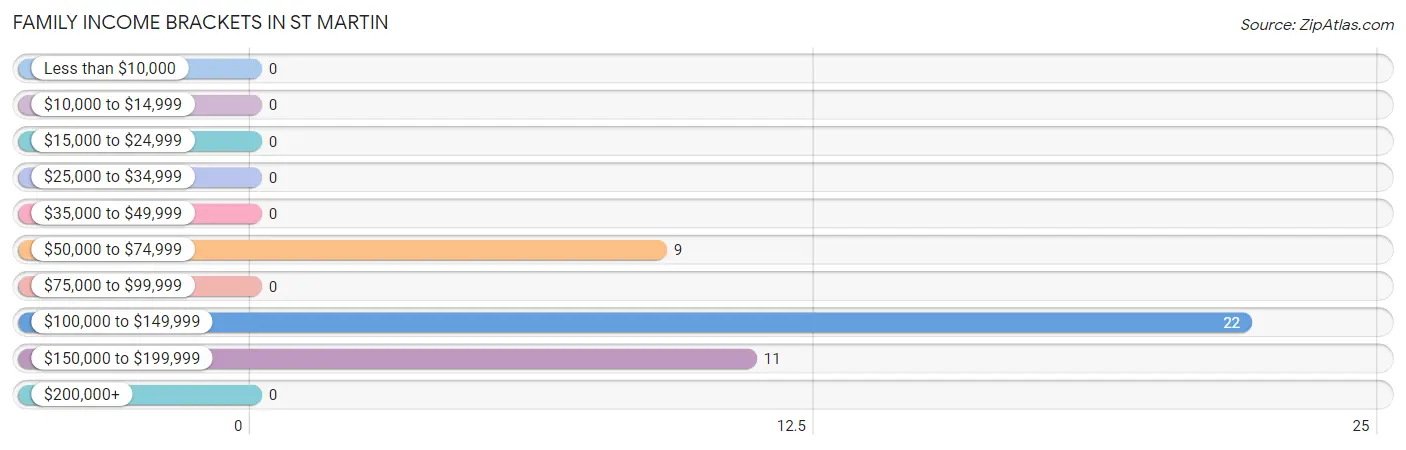
Family Income Brackets in St Martin
According to the St Martin family income data, there are 22 families falling into the $100,000 to $149,999 income range, which is the most common income bracket and makes up 52.4% of all families.
| Income Bracket | # Families | % Families |
| Less than $10,000 | 0 | 0.0% |
| $10,000 to $14,999 | 0 | 0.0% |
| $15,000 to $24,999 | 0 | 0.0% |
| $25,000 to $34,999 | 0 | 0.0% |
| $35,000 to $49,999 | 0 | 0.0% |
| $50,000 to $74,999 | 9 | 21.4% |
| $75,000 to $99,999 | 0 | 0.0% |
| $100,000 to $149,999 | 22 | 52.4% |
| $150,000 to $199,999 | 11 | 26.2% |
| $200,000+ | 0 | 0.0% |
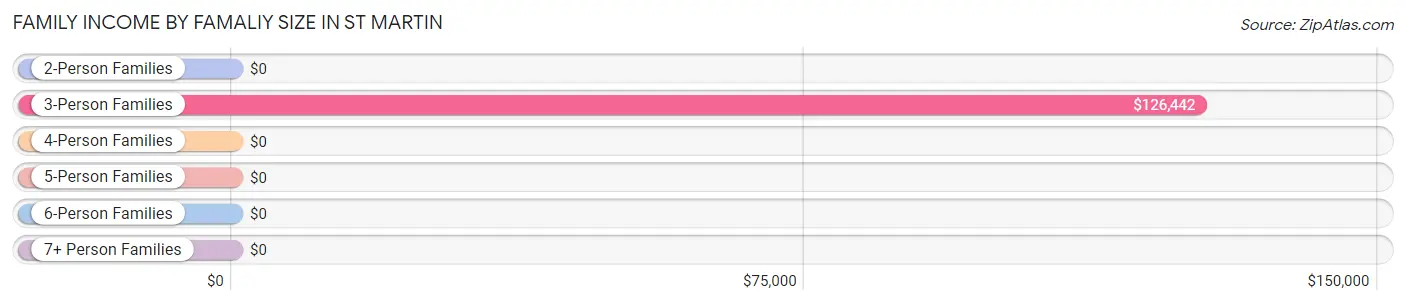
Family Income by Famaliy Size in St Martin
3-person families (33 | 78.6%) account for the highest median family income in St Martin with $126,442 per family, while 3-person families (33 | 78.6%) have the highest median income of $42,147 per family member.
| Income Bracket | # Families | Median Income |
| 2-Person Families | 9 (21.4%) | $0 |
| 3-Person Families | 33 (78.6%) | $126,442 |
| 4-Person Families | 0 (0.0%) | $0 |
| 5-Person Families | 0 (0.0%) | $0 |
| 6-Person Families | 0 (0.0%) | $0 |
| 7+ Person Families | 0 (0.0%) | $0 |
| Total | 42 (100.0%) | $127,308 |
Family Income by Number of Earners in St Martin
| Number of Earners | # Families | Median Income |
| No Earners | 11 (26.2%) | $0 |
| 1 Earner | 0 (0.0%) | $0 |
| 2 Earners | 9 (21.4%) | $0 |
| 3+ Earners | 22 (52.4%) | $0 |
| Total | 42 (100.0%) | $127,308 |
Household Income in St Martin
Household Income Brackets in St Martin
With 22 households falling in the category, the $100,000 to $149,999 income range is the most frequent in St Martin, accounting for 37.9% of all households.
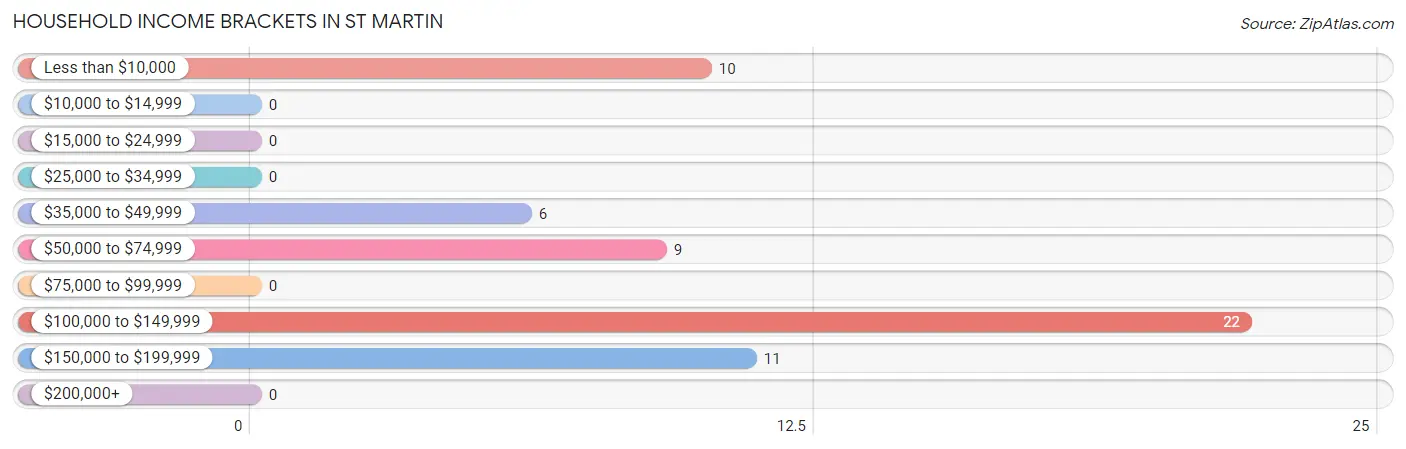
| Income Bracket | # Households | % Households |
| Less than $10,000 | 10 | 17.2% |
| $10,000 to $14,999 | 0 | 0.0% |
| $15,000 to $24,999 | 0 | 0.0% |
| $25,000 to $34,999 | 0 | 0.0% |
| $35,000 to $49,999 | 6 | 10.3% |
| $50,000 to $74,999 | 9 | 15.5% |
| $75,000 to $99,999 | 0 | 0.0% |
| $100,000 to $149,999 | 22 | 37.9% |
| $150,000 to $199,999 | 11 | 19.0% |
| $200,000+ | 0 | 0.0% |
Household Income by Householder Age in St Martin
| Income Bracket | # Households | Median Income |
| 15 to 24 Years | 0 (0.0%) | $0 |
| 25 to 44 Years | 9 (15.5%) | $0 |
| 45 to 64 Years | 32 (55.2%) | $0 |
| 65+ Years | 17 (29.3%) | $0 |
| Total | 58 (100.0%) | $125,769 |
Poverty in St Martin
Income Below Poverty by Sex and Age in St Martin
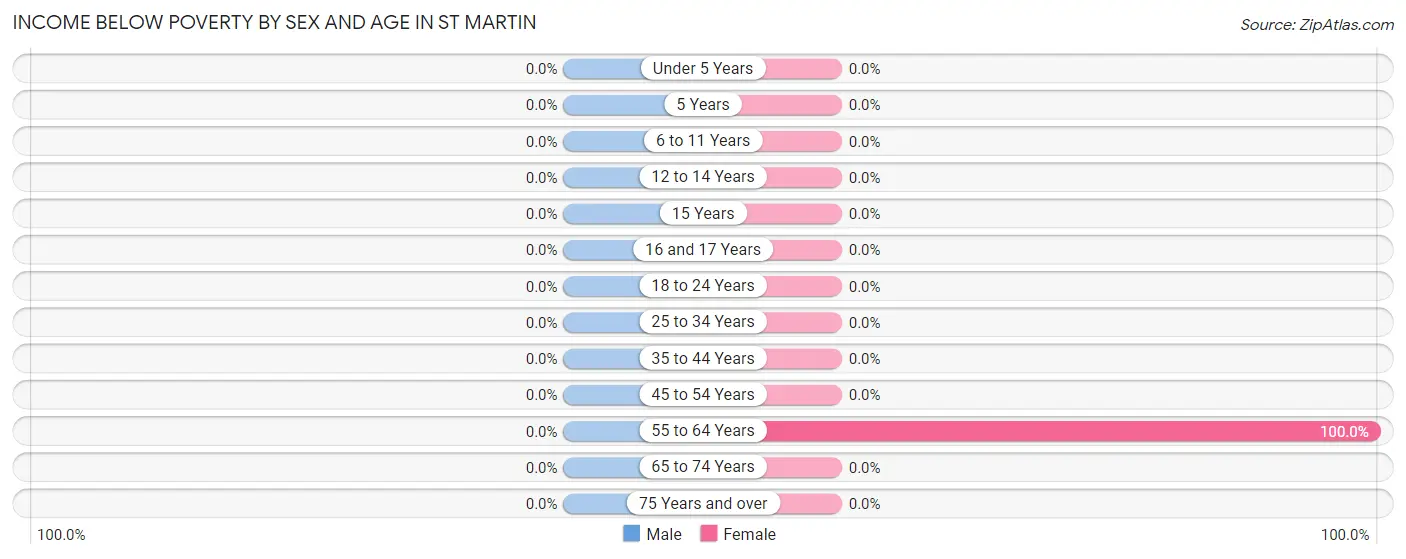
| Age Bracket | Male | Female |
| Under 5 Years | 0 (0.0%) | 0 (0.0%) |
| 5 Years | 0 (0.0%) | 0 (0.0%) |
| 6 to 11 Years | 0 (0.0%) | 0 (0.0%) |
| 12 to 14 Years | 0 (0.0%) | 0 (0.0%) |
| 15 Years | 0 (0.0%) | 0 (0.0%) |
| 16 and 17 Years | 0 (0.0%) | 0 (0.0%) |
| 18 to 24 Years | 0 (0.0%) | 0 (0.0%) |
| 25 to 34 Years | 0 (0.0%) | 0 (0.0%) |
| 35 to 44 Years | 0 (0.0%) | 0 (0.0%) |
| 45 to 54 Years | 0 (0.0%) | 0 (0.0%) |
| 55 to 64 Years | 0 (0.0%) | 10 (100.0%) |
| 65 to 74 Years | 0 (0.0%) | 0 (0.0%) |
| 75 Years and over | 0 (0.0%) | 0 (0.0%) |
| Total | 0 (0.0%) | 10 (13.7%) |
Income Above Poverty by Sex and Age in St Martin
According to the poverty statistics in St Martin, males aged 16 and 17 years and females aged 18 to 24 years are the age groups that are most secure financially, with 100.0% of males and 100.0% of females in these age groups living above the poverty line.
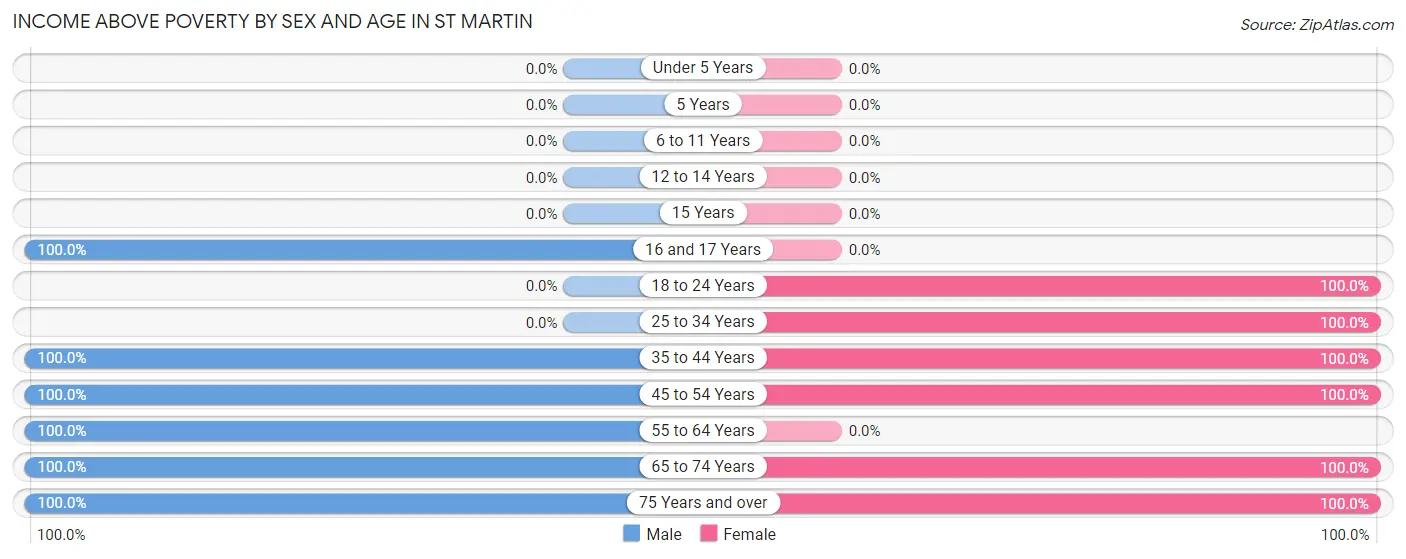
| Age Bracket | Male | Female |
| Under 5 Years | 0 (0.0%) | 0 (0.0%) |
| 5 Years | 0 (0.0%) | 0 (0.0%) |
| 6 to 11 Years | 0 (0.0%) | 0 (0.0%) |
| 12 to 14 Years | 0 (0.0%) | 0 (0.0%) |
| 15 Years | 0 (0.0%) | 0 (0.0%) |
| 16 and 17 Years | 8 (100.0%) | 0 (0.0%) |
| 18 to 24 Years | 0 (0.0%) | 9 (100.0%) |
| 25 to 34 Years | 0 (0.0%) | 11 (100.0%) |
| 35 to 44 Years | 9 (100.0%) | 12 (100.0%) |
| 45 to 54 Years | 13 (100.0%) | 9 (100.0%) |
| 55 to 64 Years | 9 (100.0%) | 0 (0.0%) |
| 65 to 74 Years | 11 (100.0%) | 10 (100.0%) |
| 75 Years and over | 6 (100.0%) | 12 (100.0%) |
| Total | 56 (100.0%) | 63 (86.3%) |
Income Below Poverty Among Married-Couple Families in St Martin
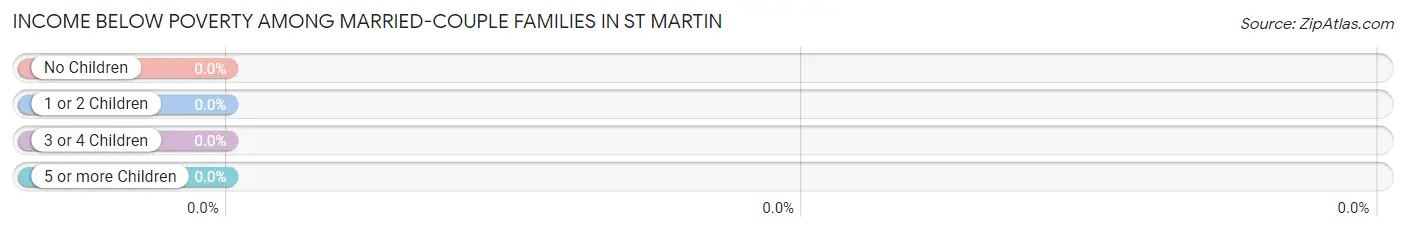
| Children | Above Poverty | Below Poverty |
| No Children | 29 (100.0%) | 0 (0.0%) |
| 1 or 2 Children | 13 (100.0%) | 0 (0.0%) |
| 3 or 4 Children | 0 (0.0%) | 0 (0.0%) |
| 5 or more Children | 0 (0.0%) | 0 (0.0%) |
| Total | 42 (100.0%) | 0 (0.0%) |
Income Below Poverty Among Single-Parent Households in St Martin
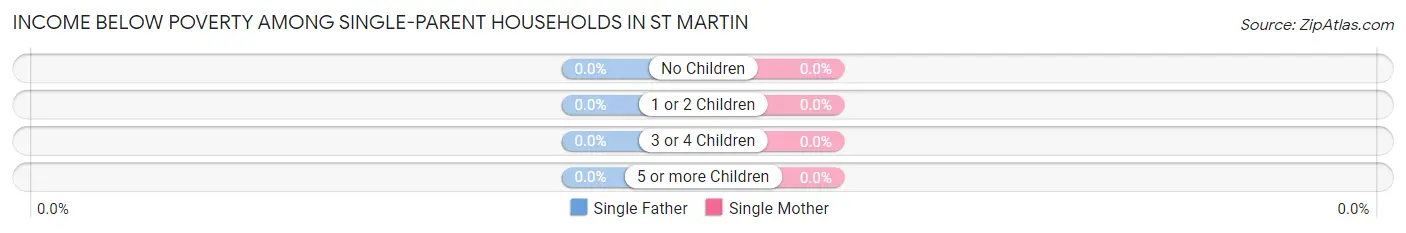
| Children | Single Father | Single Mother |
| No Children | 0 (0.0%) | 0 (0.0%) |
| 1 or 2 Children | 0 (0.0%) | 0 (0.0%) |
| 3 or 4 Children | 0 (0.0%) | 0 (0.0%) |
| 5 or more Children | 0 (0.0%) | 0 (0.0%) |
| Total | 0 (0.0%) | 0 (0.0%) |
Income Below Poverty Among Married-Couple vs Single-Parent Households in St Martin
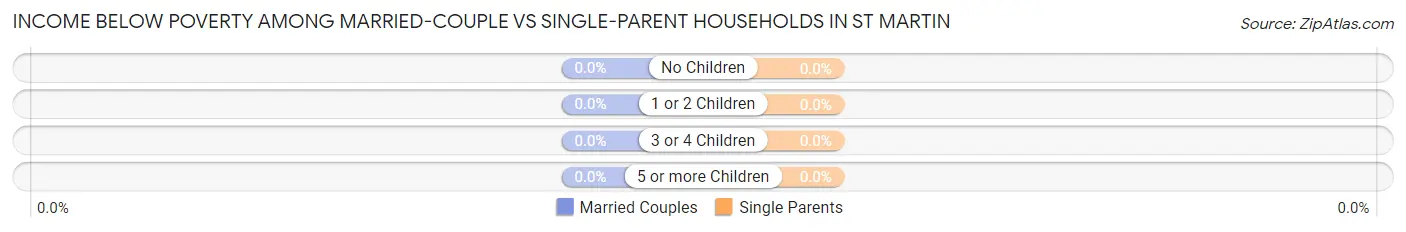
| Children | Married-Couple Families | Single-Parent Households |
| No Children | 0 (0.0%) | 0 (0.0%) |
| 1 or 2 Children | 0 (0.0%) | 0 (0.0%) |
| 3 or 4 Children | 0 (0.0%) | 0 (0.0%) |
| 5 or more Children | 0 (0.0%) | 0 (0.0%) |
| Total | 0 (0.0%) | 0 (0.0%) |
Employment Characteristics in St Martin
Employment by Class of Employer in St Martin
Among the 80 employed individuals in St Martin, private company employees (50 | 62.5%), not-for-profit organizations (12 | 15.0%), and self-employed (not incorporated) (9 | 11.3%) make up the most common classes of employment.
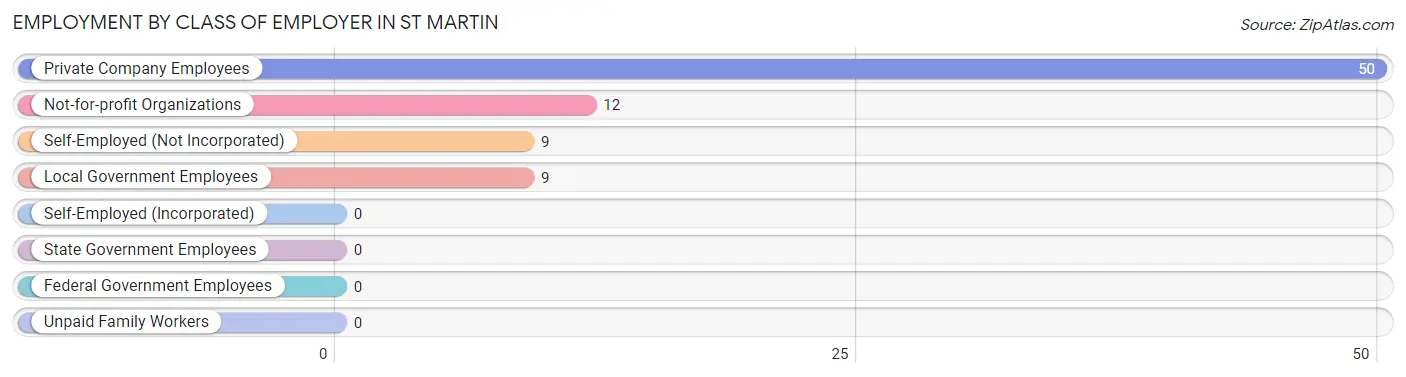
| Employer Class | # Employees | % Employees |
| Private Company Employees | 50 | 62.5% |
| Self-Employed (Incorporated) | 0 | 0.0% |
| Self-Employed (Not Incorporated) | 9 | 11.3% |
| Not-for-profit Organizations | 12 | 15.0% |
| Local Government Employees | 9 | 11.3% |
| State Government Employees | 0 | 0.0% |
| Federal Government Employees | 0 | 0.0% |
| Unpaid Family Workers | 0 | 0.0% |
| Total | 80 | 100.0% |
Employment Status by Age in St Martin
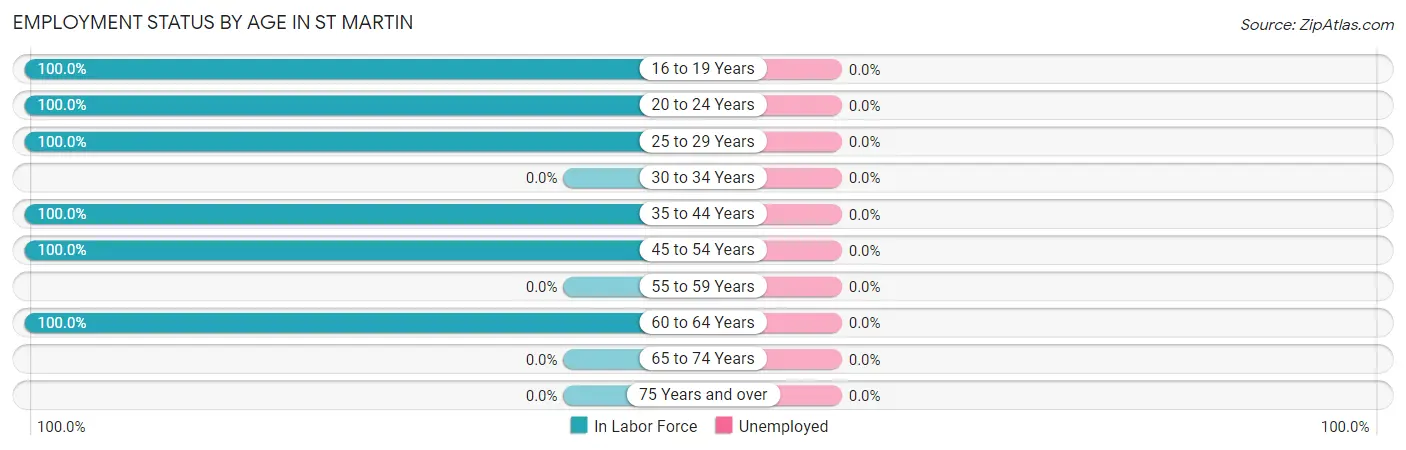
| Age Bracket | In Labor Force | Unemployed |
| 16 to 19 Years | 8 (100.0%) | 0 (0.0%) |
| 20 to 24 Years | 9 (100.0%) | 0 (0.0%) |
| 25 to 29 Years | 11 (100.0%) | 0 (0.0%) |
| 30 to 34 Years | 0 (0.0%) | 0 (0.0%) |
| 35 to 44 Years | 21 (100.0%) | 0 (0.0%) |
| 45 to 54 Years | 22 (100.0%) | 0 (0.0%) |
| 55 to 59 Years | 0 (0.0%) | 0 (0.0%) |
| 60 to 64 Years | 9 (100.0%) | 0 (0.0%) |
| 65 to 74 Years | 0 (0.0%) | 0 (0.0%) |
| 75 Years and over | 0 (0.0%) | 0 (0.0%) |
| Total | 80 (62.0%) | 0 (0.0%) |
Employment Status by Educational Attainment in St Martin
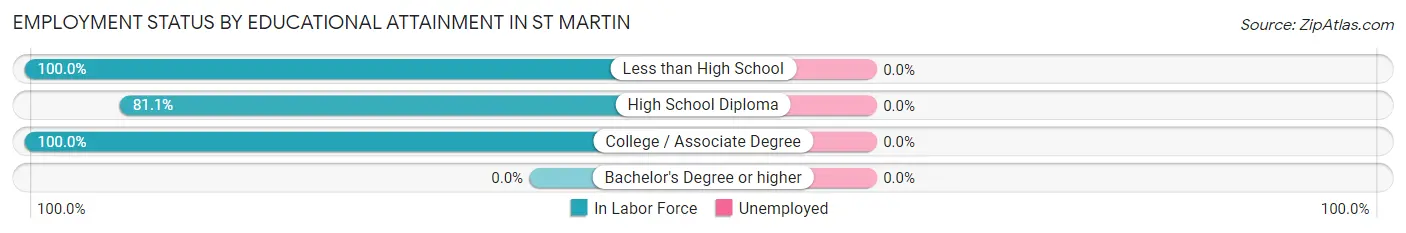
| Educational Attainment | In Labor Force | Unemployed |
| Less than High School | 9 (100.0%) | 0 (0.0%) |
| High School Diploma | 43 (81.1%) | 0 (0.0%) |
| College / Associate Degree | 11 (100.0%) | 0 (0.0%) |
| Bachelor's Degree or higher | 0 (0.0%) | 0 (0.0%) |
| Total | 63 (86.3%) | 0 (0.0%) |
Employment Occupations by Sex in St Martin
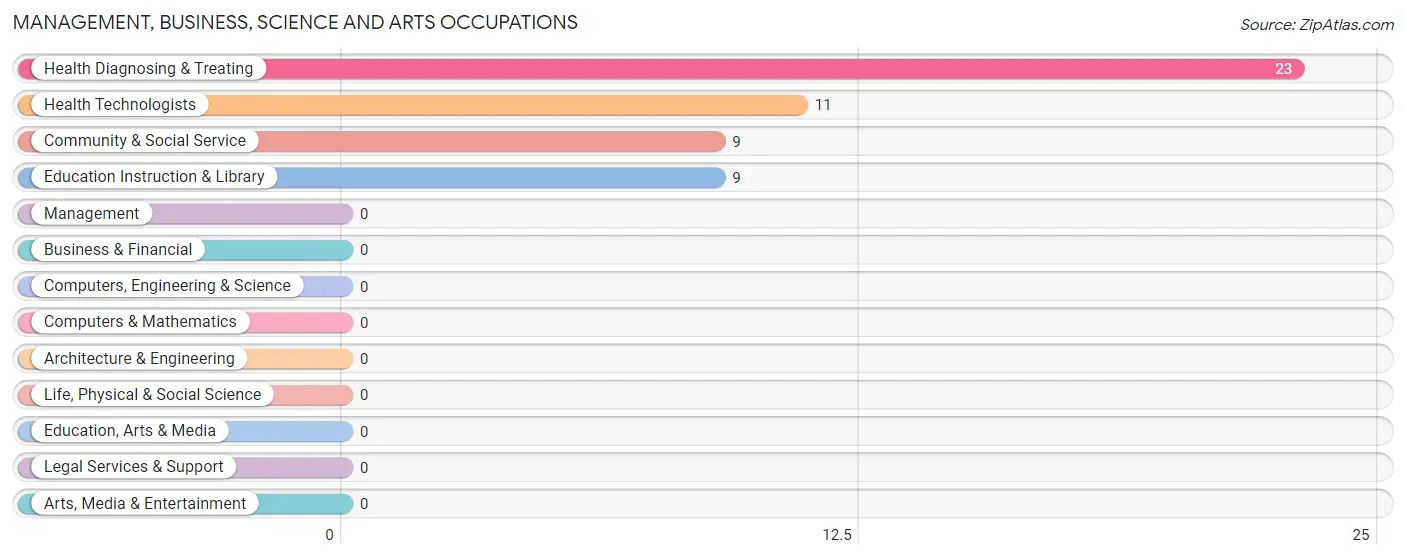
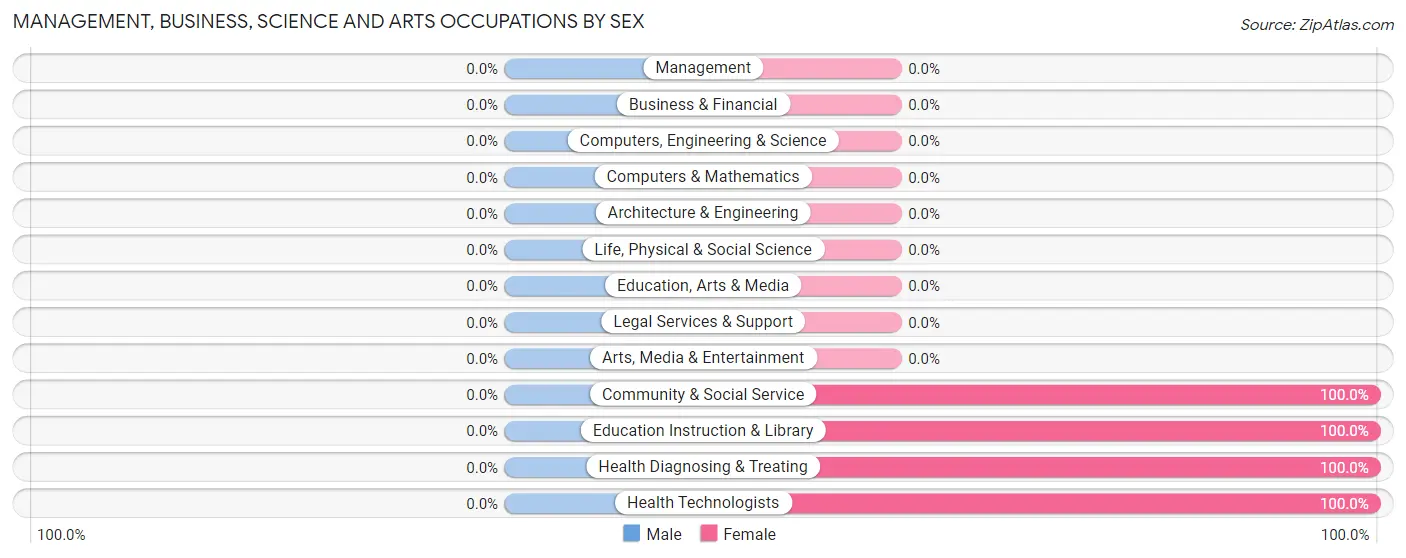
Management, Business, Science and Arts Occupations
The most common Management, Business, Science and Arts occupations in St Martin are Health Diagnosing & Treating (23 | 28.7%), Health Technologists (11 | 13.8%), Community & Social Service (9 | 11.3%), and Education Instruction & Library (9 | 11.3%).
Management, Business, Science and Arts Occupations by Sex
| Occupation | Male | Female |
| Management | 0 (0.0%) | 0 (0.0%) |
| Business & Financial | 0 (0.0%) | 0 (0.0%) |
| Computers, Engineering & Science | 0 (0.0%) | 0 (0.0%) |
| Computers & Mathematics | 0 (0.0%) | 0 (0.0%) |
| Architecture & Engineering | 0 (0.0%) | 0 (0.0%) |
| Life, Physical & Social Science | 0 (0.0%) | 0 (0.0%) |
| Community & Social Service | 0 (0.0%) | 9 (100.0%) |
| Education, Arts & Media | 0 (0.0%) | 0 (0.0%) |
| Legal Services & Support | 0 (0.0%) | 0 (0.0%) |
| Education Instruction & Library | 0 (0.0%) | 9 (100.0%) |
| Arts, Media & Entertainment | 0 (0.0%) | 0 (0.0%) |
| Health Diagnosing & Treating | 0 (0.0%) | 23 (100.0%) |
| Health Technologists | 0 (0.0%) | 11 (100.0%) |
| Total (Category) | 0 (0.0%) | 32 (100.0%) |
| Total (Overall) | 39 (48.7%) | 41 (51.2%) |
Services Occupations
The most common Services occupations in St Martin are , and Food Preparation & Serving (9 | 11.3%).
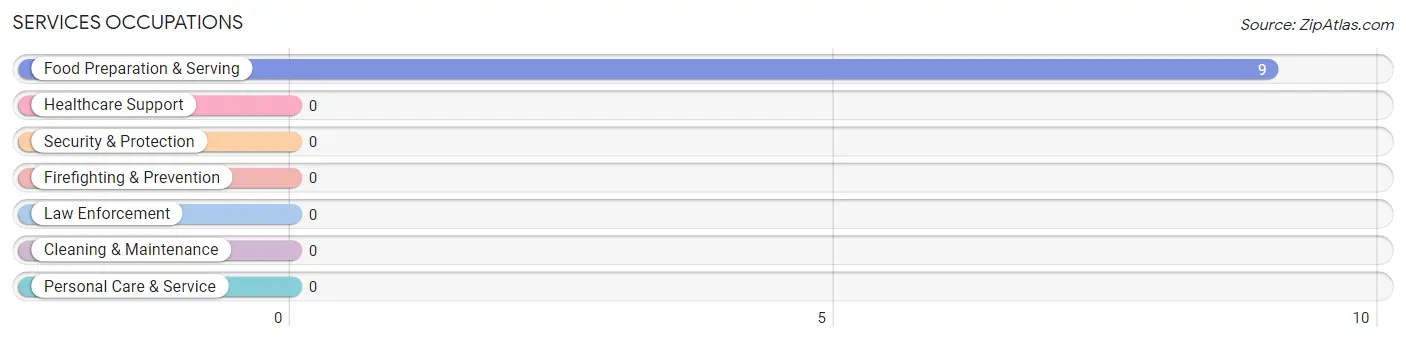
Services Occupations by Sex
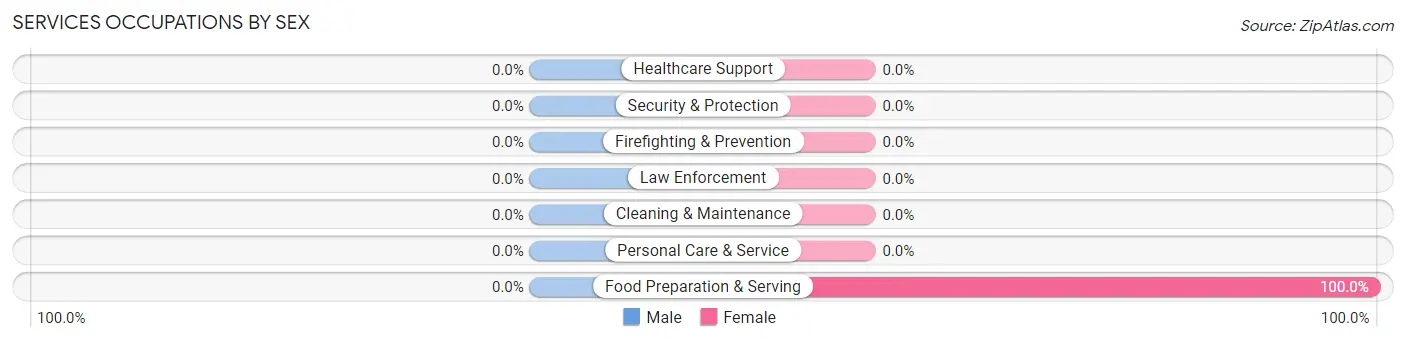
| Occupation | Male | Female |
| Healthcare Support | 0 (0.0%) | 0 (0.0%) |
| Security & Protection | 0 (0.0%) | 0 (0.0%) |
| Firefighting & Prevention | 0 (0.0%) | 0 (0.0%) |
| Law Enforcement | 0 (0.0%) | 0 (0.0%) |
| Food Preparation & Serving | 0 (0.0%) | 9 (100.0%) |
| Cleaning & Maintenance | 0 (0.0%) | 0 (0.0%) |
| Personal Care & Service | 0 (0.0%) | 0 (0.0%) |
| Total (Category) | 0 (0.0%) | 9 (100.0%) |
| Total (Overall) | 39 (48.7%) | 41 (51.2%) |
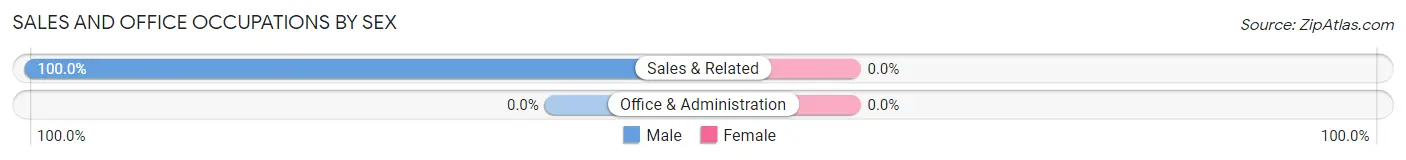
Sales and Office Occupations
The most common Sales and Office occupations in St Martin are , and Sales & Related (9 | 11.3%).
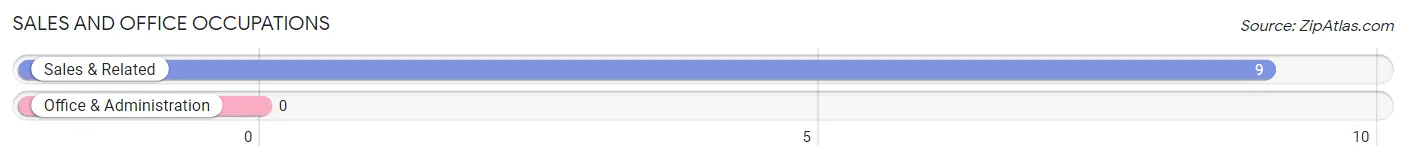
Sales and Office Occupations by Sex
| Occupation | Male | Female |
| Sales & Related | 9 (100.0%) | 0 (0.0%) |
| Office & Administration | 0 (0.0%) | 0 (0.0%) |
| Total (Category) | 9 (100.0%) | 0 (0.0%) |
| Total (Overall) | 39 (48.7%) | 41 (51.2%) |
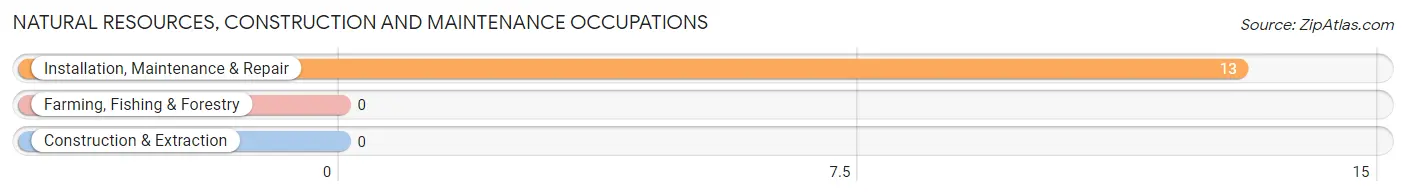
Natural Resources, Construction and Maintenance Occupations
The most common Natural Resources, Construction and Maintenance occupations in St Martin are , and Installation, Maintenance & Repair (13 | 16.3%).
Natural Resources, Construction and Maintenance Occupations by Sex
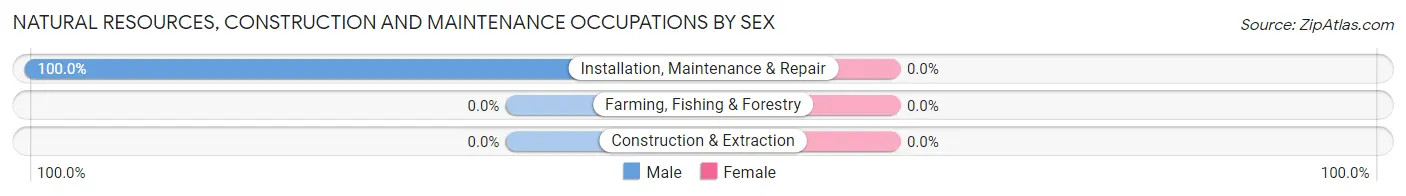
| Occupation | Male | Female |
| Farming, Fishing & Forestry | 0 (0.0%) | 0 (0.0%) |
| Construction & Extraction | 0 (0.0%) | 0 (0.0%) |
| Installation, Maintenance & Repair | 13 (100.0%) | 0 (0.0%) |
| Total (Category) | 13 (100.0%) | 0 (0.0%) |
| Total (Overall) | 39 (48.7%) | 41 (51.2%) |
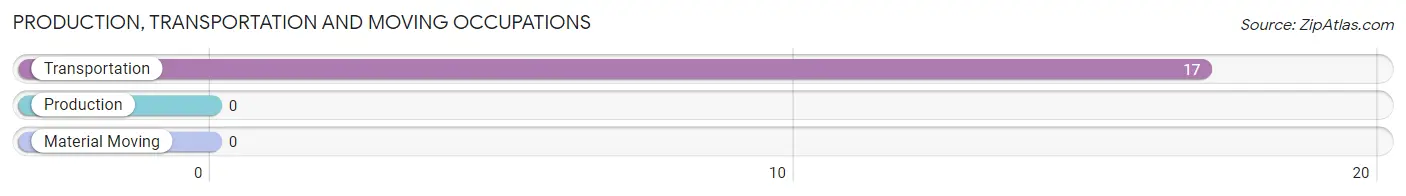
Production, Transportation and Moving Occupations
The most common Production, Transportation and Moving occupations in St Martin are , and Transportation (17 | 21.2%).
Production, Transportation and Moving Occupations by Sex
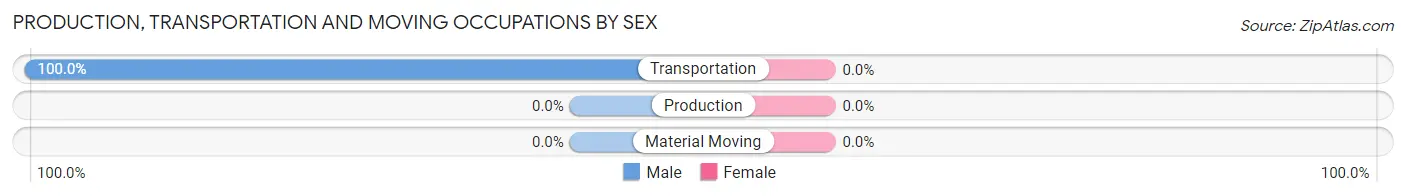
| Occupation | Male | Female |
| Production | 0 (0.0%) | 0 (0.0%) |
| Transportation | 17 (100.0%) | 0 (0.0%) |
| Material Moving | 0 (0.0%) | 0 (0.0%) |
| Total (Category) | 17 (100.0%) | 0 (0.0%) |
| Total (Overall) | 39 (48.7%) | 41 (51.2%) |
Employment Industries by Sex in St Martin
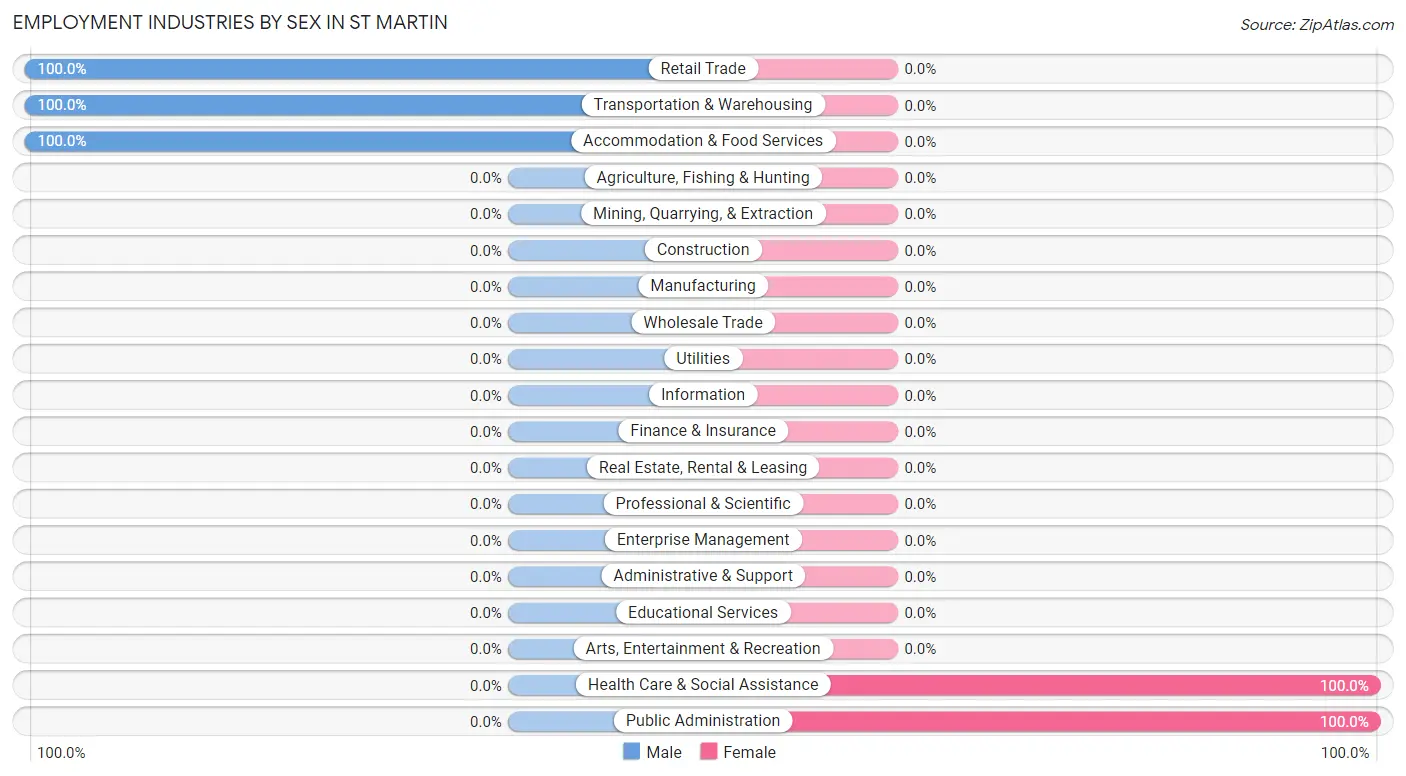
Employment Industries in St Martin
The major employment industries in St Martin include Health Care & Social Assistance (32 | 40.0%), Retail Trade (22 | 27.5%), Transportation & Warehousing (9 | 11.3%), Public Administration (9 | 11.3%), and Accommodation & Food Services (8 | 10.0%).
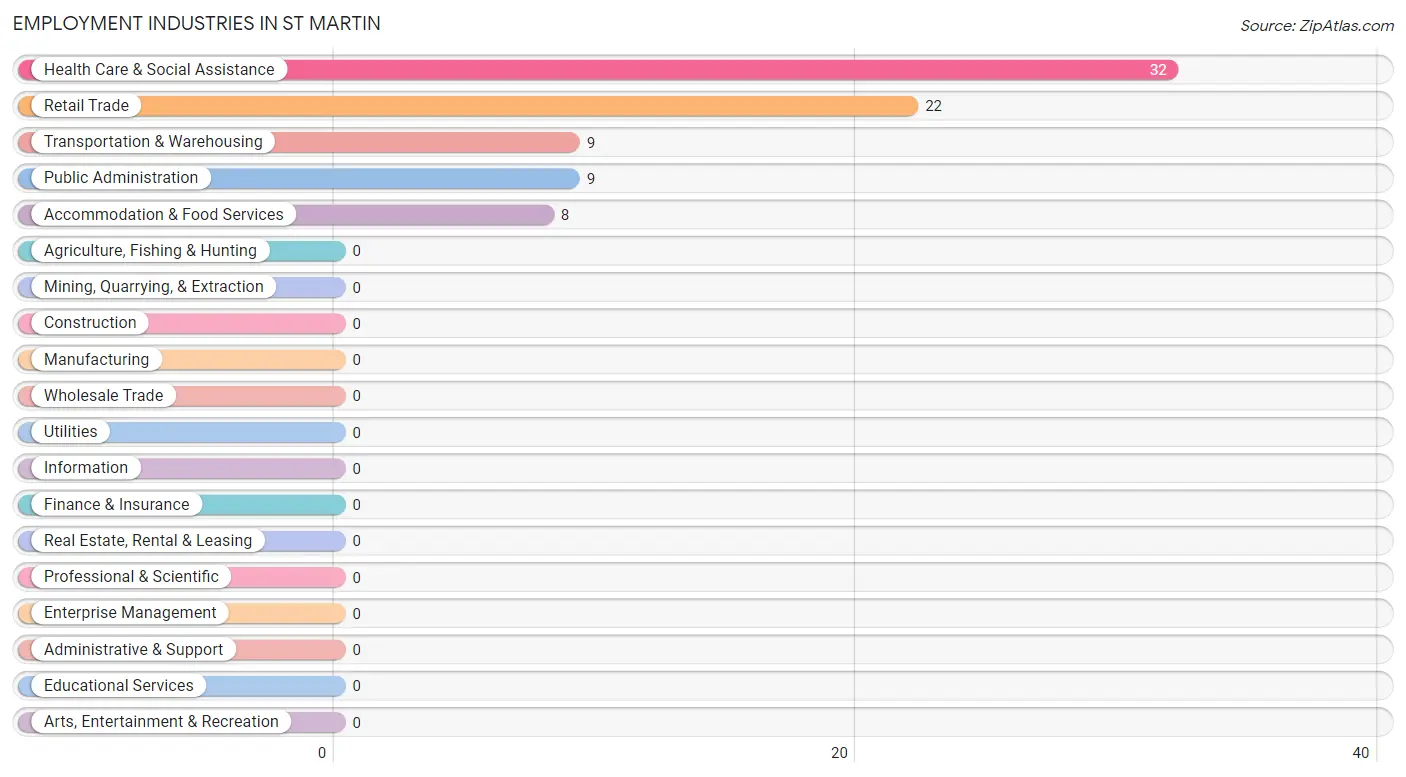
Employment Industries by Sex in St Martin
The St Martin industries that see more men than women are Retail Trade (100.0%), Transportation & Warehousing (100.0%), and Accommodation & Food Services (100.0%), whereas the industries that tend to have a higher number of women are Health Care & Social Assistance (100.0%), and Public Administration (100.0%).
| Industry | Male | Female |
| Agriculture, Fishing & Hunting | 0 (0.0%) | 0 (0.0%) |
| Mining, Quarrying, & Extraction | 0 (0.0%) | 0 (0.0%) |
| Construction | 0 (0.0%) | 0 (0.0%) |
| Manufacturing | 0 (0.0%) | 0 (0.0%) |
| Wholesale Trade | 0 (0.0%) | 0 (0.0%) |
| Retail Trade | 22 (100.0%) | 0 (0.0%) |
| Transportation & Warehousing | 9 (100.0%) | 0 (0.0%) |
| Utilities | 0 (0.0%) | 0 (0.0%) |
| Information | 0 (0.0%) | 0 (0.0%) |
| Finance & Insurance | 0 (0.0%) | 0 (0.0%) |
| Real Estate, Rental & Leasing | 0 (0.0%) | 0 (0.0%) |
| Professional & Scientific | 0 (0.0%) | 0 (0.0%) |
| Enterprise Management | 0 (0.0%) | 0 (0.0%) |
| Administrative & Support | 0 (0.0%) | 0 (0.0%) |
| Educational Services | 0 (0.0%) | 0 (0.0%) |
| Health Care & Social Assistance | 0 (0.0%) | 32 (100.0%) |
| Arts, Entertainment & Recreation | 0 (0.0%) | 0 (0.0%) |
| Accommodation & Food Services | 8 (100.0%) | 0 (0.0%) |
| Public Administration | 0 (0.0%) | 9 (100.0%) |
| Total | 39 (48.7%) | 41 (51.2%) |
Education in St Martin
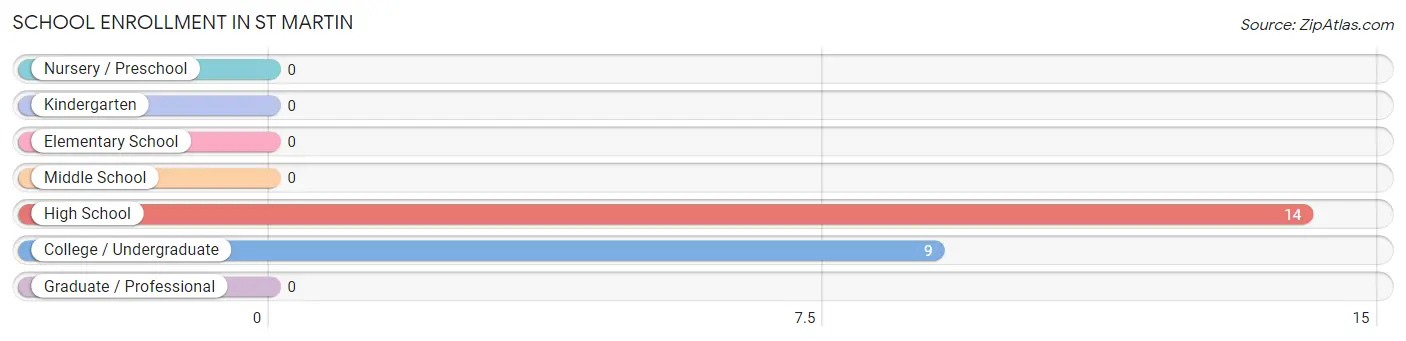
School Enrollment in St Martin
The most common levels of schooling among the 23 students in St Martin are high school (14 | 60.9%), and college / undergraduate (9 | 39.1%).
| School Level | # Students | % Students |
| Nursery / Preschool | 0 | 0.0% |
| Kindergarten | 0 | 0.0% |
| Elementary School | 0 | 0.0% |
| Middle School | 0 | 0.0% |
| High School | 14 | 60.9% |
| College / Undergraduate | 9 | 39.1% |
| Graduate / Professional | 0 | 0.0% |
| Total | 23 | 100.0% |
School Enrollment by Age by Funding Source in St Martin
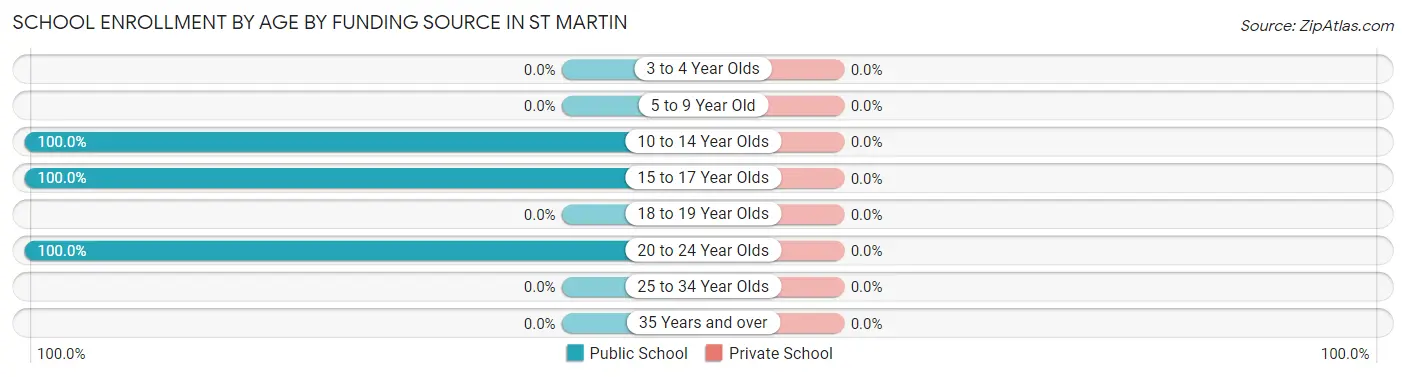
| Age Bracket | Public School | Private School |
| 3 to 4 Year Olds | 0 (0.0%) | 0 (0.0%) |
| 5 to 9 Year Old | 0 (0.0%) | 0 (0.0%) |
| 10 to 14 Year Olds | 6 (100.0%) | 0 (0.0%) |
| 15 to 17 Year Olds | 8 (100.0%) | 0 (0.0%) |
| 18 to 19 Year Olds | 0 (0.0%) | 0 (0.0%) |
| 20 to 24 Year Olds | 9 (100.0%) | 0 (0.0%) |
| 25 to 34 Year Olds | 0 (0.0%) | 0 (0.0%) |
| 35 Years and over | 0 (0.0%) | 0 (0.0%) |
| Total | 23 (100.0%) | 0 (0.0%) |
Educational Attainment by Field of Study in St Martin
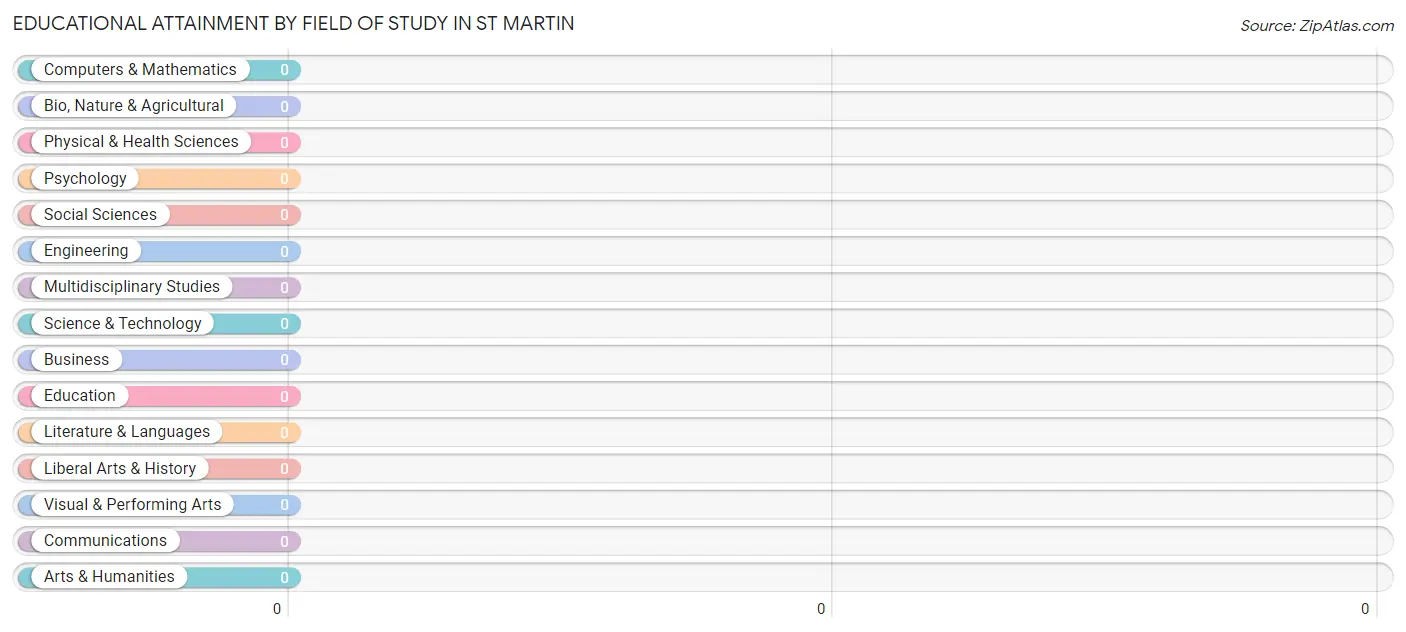
| Field of Study | # Graduates | % Graduates |
| Computers & Mathematics | 0 | 0.0% |
| Bio, Nature & Agricultural | 0 | 0.0% |
| Physical & Health Sciences | 0 | 0.0% |
| Psychology | 0 | 0.0% |
| Social Sciences | 0 | 0.0% |
| Engineering | 0 | 0.0% |
| Multidisciplinary Studies | 0 | 0.0% |
| Science & Technology | 0 | 0.0% |
| Business | 0 | 0.0% |
| Education | 0 | 0.0% |
| Literature & Languages | 0 | 0.0% |
| Liberal Arts & History | 0 | 0.0% |
| Visual & Performing Arts | 0 | 0.0% |
| Communications | 0 | 0.0% |
| Arts & Humanities | 0 | 0.0% |
| Total | 0 | 0.0% |
Transportation & Commute in St Martin
Vehicle Availability by Sex in St Martin
The most prevalent vehicle ownership categories in St Martin are males with 5 or more vehicles (21, accounting for 53.8%) and females with 5 or more vehicles (12, making up 51.2%).
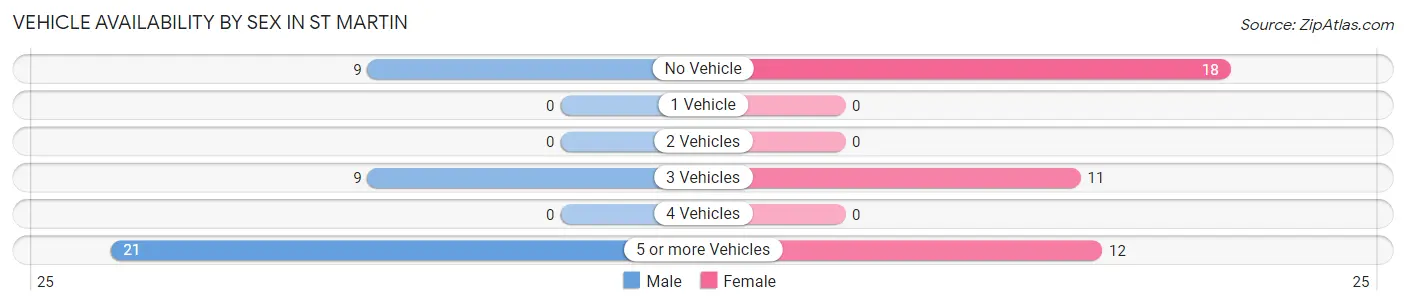
| Vehicles Available | Male | Female |
| No Vehicle | 9 (23.1%) | 18 (43.9%) |
| 1 Vehicle | 0 (0.0%) | 0 (0.0%) |
| 2 Vehicles | 0 (0.0%) | 0 (0.0%) |
| 3 Vehicles | 9 (23.1%) | 11 (26.8%) |
| 4 Vehicles | 0 (0.0%) | 0 (0.0%) |
| 5 or more Vehicles | 21 (53.8%) | 12 (29.3%) |
| Total | 39 (100.0%) | 41 (100.0%) |
Commute Time in St Martin
The most frequently occuring commute durations in St Martin are 5 to 9 minutes (18 commuters, 22.5%), 25 to 29 minutes (13 commuters, 16.3%), and 45 to 59 minutes (12 commuters, 15.0%).
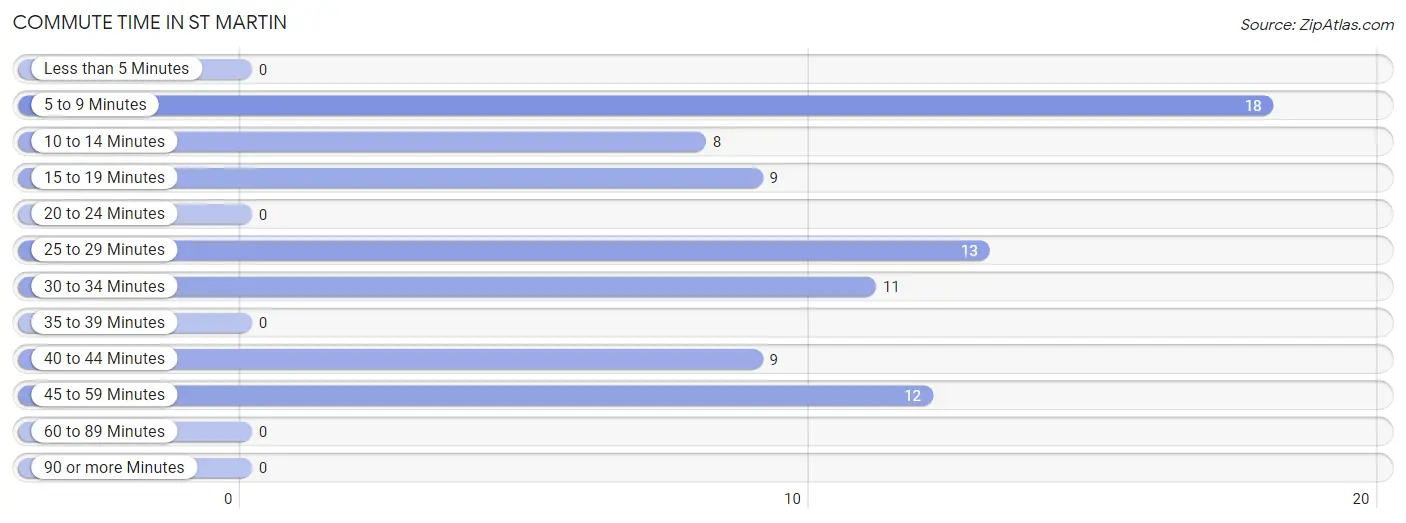
| Commute Time | # Commuters | % Commuters |
| Less than 5 Minutes | 0 | 0.0% |
| 5 to 9 Minutes | 18 | 22.5% |
| 10 to 14 Minutes | 8 | 10.0% |
| 15 to 19 Minutes | 9 | 11.3% |
| 20 to 24 Minutes | 0 | 0.0% |
| 25 to 29 Minutes | 13 | 16.3% |
| 30 to 34 Minutes | 11 | 13.8% |
| 35 to 39 Minutes | 0 | 0.0% |
| 40 to 44 Minutes | 9 | 11.3% |
| 45 to 59 Minutes | 12 | 15.0% |
| 60 to 89 Minutes | 0 | 0.0% |
| 90 or more Minutes | 0 | 0.0% |
Commute Time by Sex in St Martin
The most common commute times in St Martin are 25 to 29 minutes (13 commuters, 33.3%) for males and 45 to 59 minutes (12 commuters, 29.3%) for females.
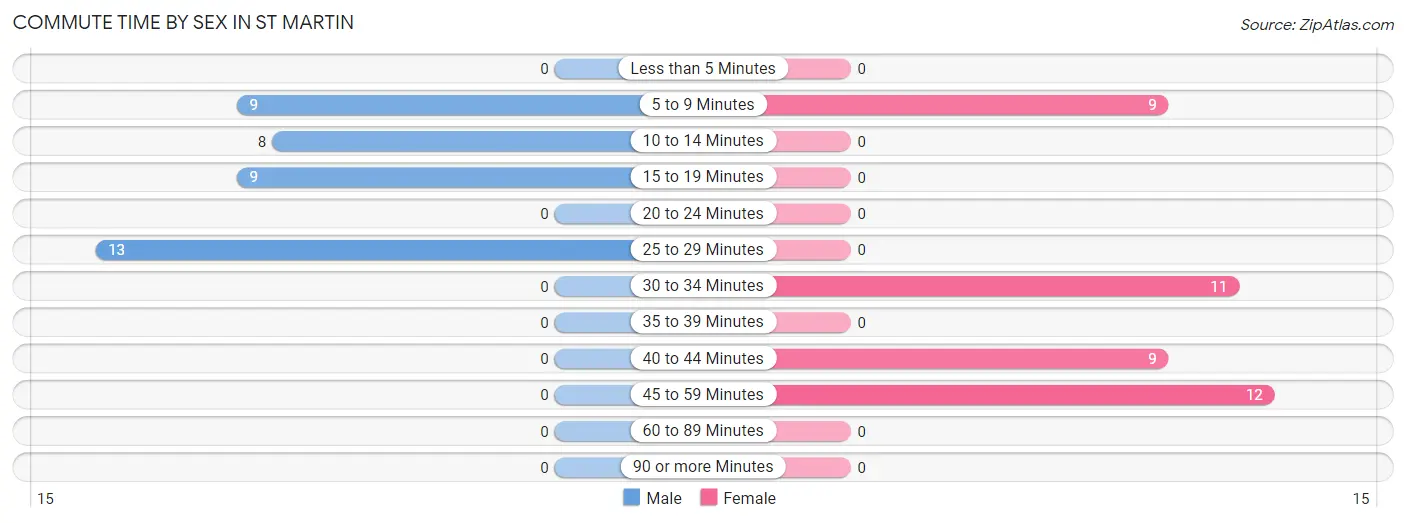
| Commute Time | Male | Female |
| Less than 5 Minutes | 0 (0.0%) | 0 (0.0%) |
| 5 to 9 Minutes | 9 (23.1%) | 9 (22.0%) |
| 10 to 14 Minutes | 8 (20.5%) | 0 (0.0%) |
| 15 to 19 Minutes | 9 (23.1%) | 0 (0.0%) |
| 20 to 24 Minutes | 0 (0.0%) | 0 (0.0%) |
| 25 to 29 Minutes | 13 (33.3%) | 0 (0.0%) |
| 30 to 34 Minutes | 0 (0.0%) | 11 (26.8%) |
| 35 to 39 Minutes | 0 (0.0%) | 0 (0.0%) |
| 40 to 44 Minutes | 0 (0.0%) | 9 (22.0%) |
| 45 to 59 Minutes | 0 (0.0%) | 12 (29.3%) |
| 60 to 89 Minutes | 0 (0.0%) | 0 (0.0%) |
| 90 or more Minutes | 0 (0.0%) | 0 (0.0%) |
Time of Departure to Work by Sex in St Martin
The most frequent times of departure to work in St Martin are 7:30 AM to 7:59 AM (22, 56.4%) for males and 7:00 AM to 7:29 AM (18, 43.9%) for females.
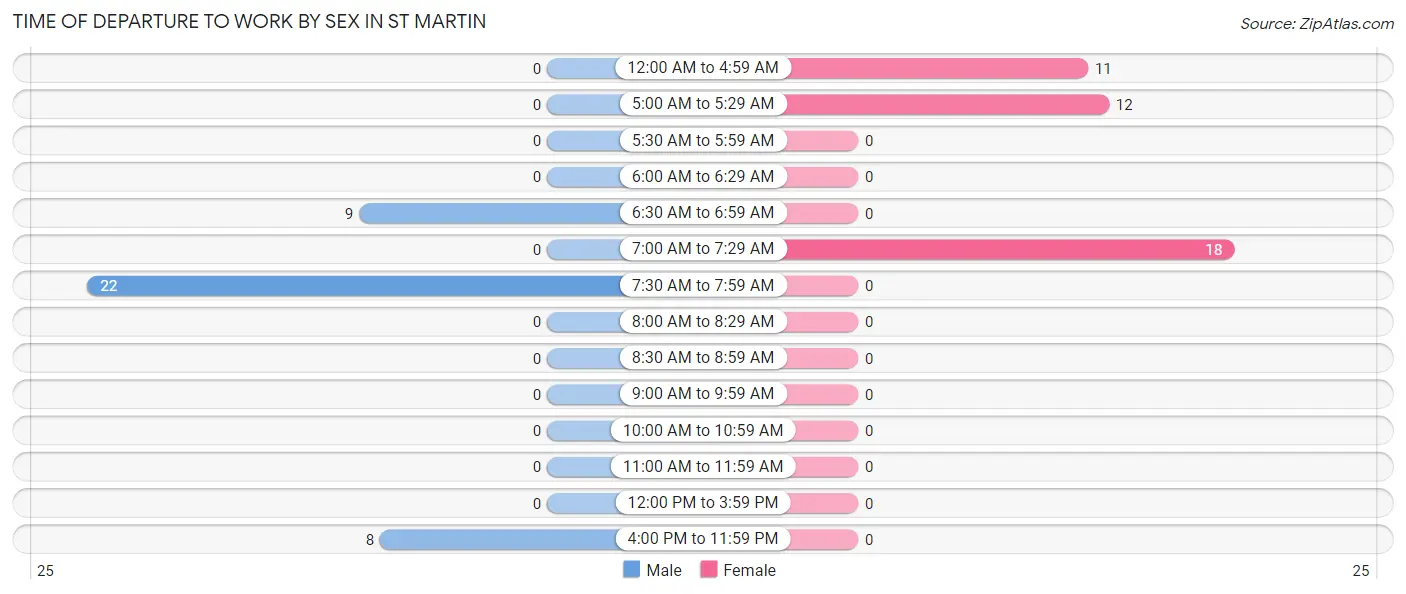
| Time of Departure | Male | Female |
| 12:00 AM to 4:59 AM | 0 (0.0%) | 11 (26.8%) |
| 5:00 AM to 5:29 AM | 0 (0.0%) | 12 (29.3%) |
| 5:30 AM to 5:59 AM | 0 (0.0%) | 0 (0.0%) |
| 6:00 AM to 6:29 AM | 0 (0.0%) | 0 (0.0%) |
| 6:30 AM to 6:59 AM | 9 (23.1%) | 0 (0.0%) |
| 7:00 AM to 7:29 AM | 0 (0.0%) | 18 (43.9%) |
| 7:30 AM to 7:59 AM | 22 (56.4%) | 0 (0.0%) |
| 8:00 AM to 8:29 AM | 0 (0.0%) | 0 (0.0%) |
| 8:30 AM to 8:59 AM | 0 (0.0%) | 0 (0.0%) |
| 9:00 AM to 9:59 AM | 0 (0.0%) | 0 (0.0%) |
| 10:00 AM to 10:59 AM | 0 (0.0%) | 0 (0.0%) |
| 11:00 AM to 11:59 AM | 0 (0.0%) | 0 (0.0%) |
| 12:00 PM to 3:59 PM | 0 (0.0%) | 0 (0.0%) |
| 4:00 PM to 11:59 PM | 8 (20.5%) | 0 (0.0%) |
| Total | 39 (100.0%) | 41 (100.0%) |
Housing Occupancy in St Martin
Occupancy by Ownership in St Martin
Of the total 58 dwellings in St Martin, owner-occupied units account for 48 (82.8%), while renter-occupied units make up 10 (17.2%).
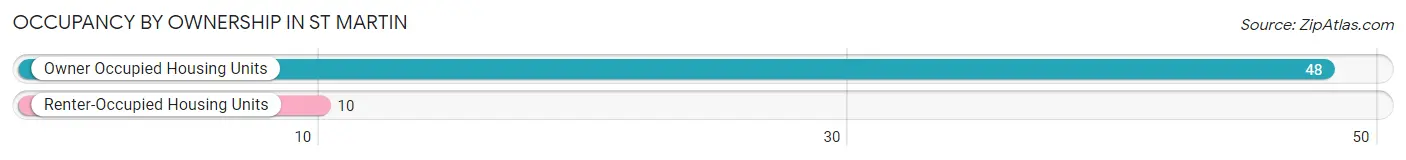
| Occupancy | # Housing Units | % Housing Units |
| Owner Occupied Housing Units | 48 | 82.8% |
| Renter-Occupied Housing Units | 10 | 17.2% |
| Total Occupied Housing Units | 58 | 100.0% |
Occupancy by Household Size in St Martin
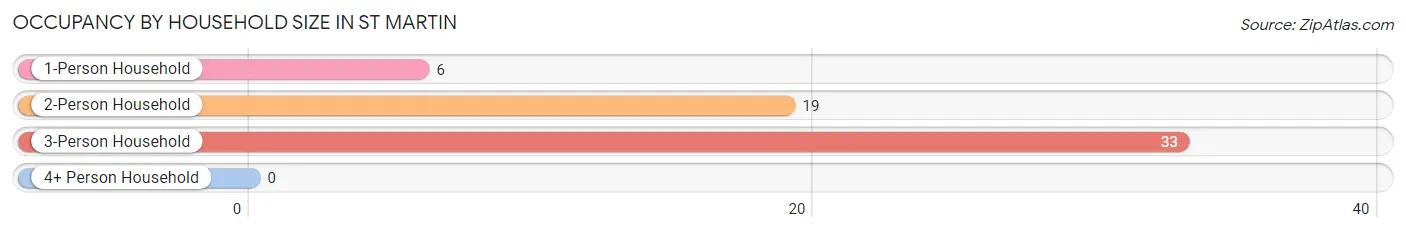
| Household Size | # Housing Units | % Housing Units |
| 1-Person Household | 6 | 10.3% |
| 2-Person Household | 19 | 32.8% |
| 3-Person Household | 33 | 56.9% |
| 4+ Person Household | 0 | 0.0% |
| Total Housing Units | 58 | 100.0% |
Occupancy by Ownership by Household Size in St Martin
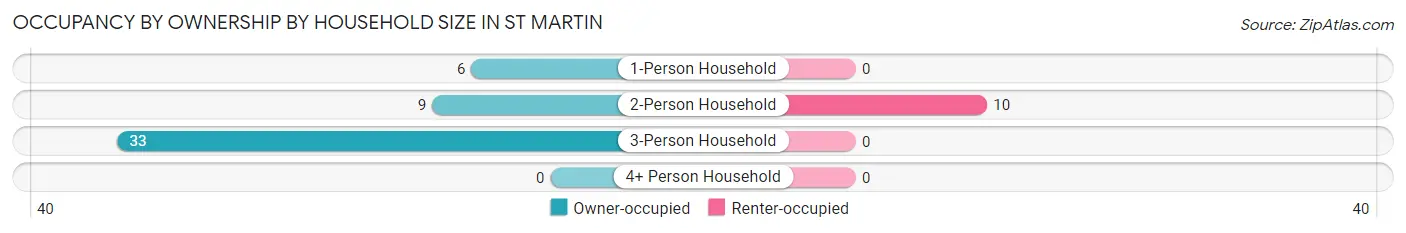
| Household Size | Owner-occupied | Renter-occupied |
| 1-Person Household | 6 (100.0%) | 0 (0.0%) |
| 2-Person Household | 9 (47.4%) | 10 (52.6%) |
| 3-Person Household | 33 (100.0%) | 0 (0.0%) |
| 4+ Person Household | 0 (0.0%) | 0 (0.0%) |
| Total Housing Units | 48 (82.8%) | 10 (17.2%) |
Occupancy by Educational Attainment in St Martin
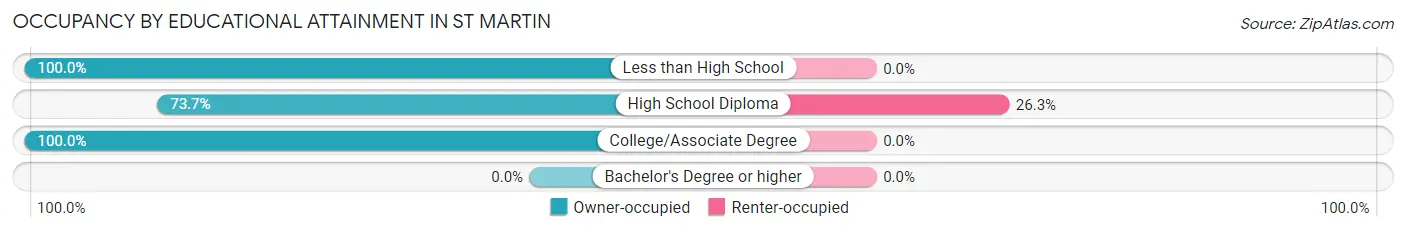
| Household Size | Owner-occupied | Renter-occupied |
| Less than High School | 9 (100.0%) | 0 (0.0%) |
| High School Diploma | 28 (73.7%) | 10 (26.3%) |
| College/Associate Degree | 11 (100.0%) | 0 (0.0%) |
| Bachelor's Degree or higher | 0 (0.0%) | 0 (0.0%) |
Occupancy by Age of Householder in St Martin
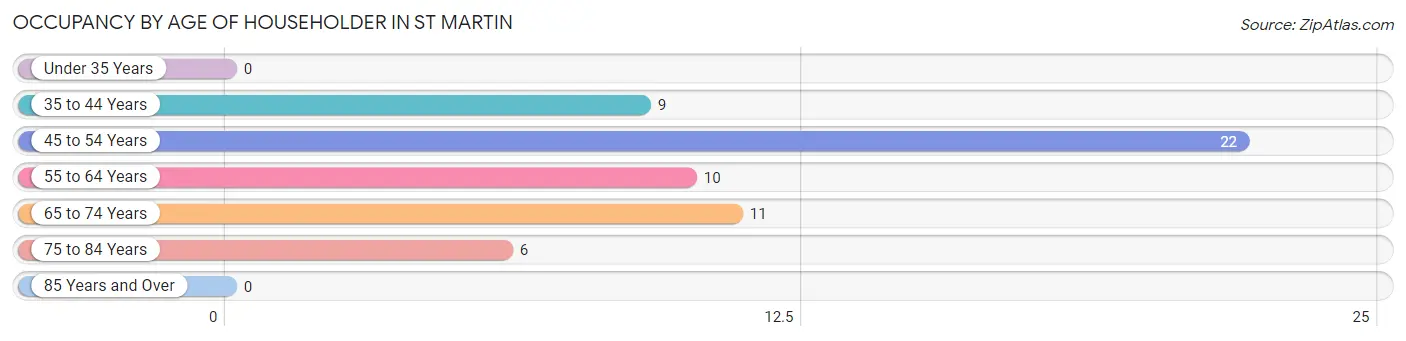
| Age Bracket | # Households | % Households |
| Under 35 Years | 0 | 0.0% |
| 35 to 44 Years | 9 | 15.5% |
| 45 to 54 Years | 22 | 37.9% |
| 55 to 64 Years | 10 | 17.2% |
| 65 to 74 Years | 11 | 19.0% |
| 75 to 84 Years | 6 | 10.3% |
| 85 Years and Over | 0 | 0.0% |
| Total | 58 | 100.0% |
Housing Finances in St Martin
Median Income by Occupancy in St Martin
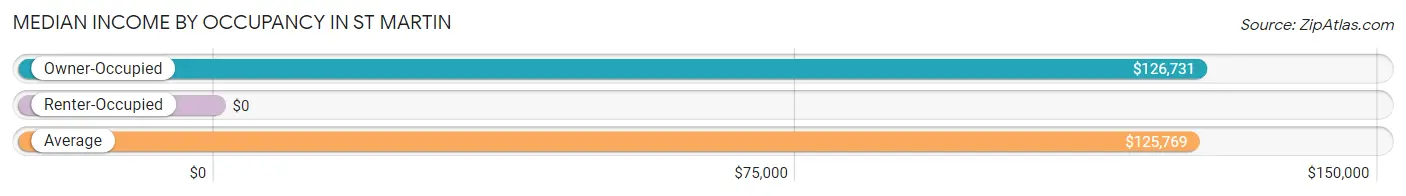
| Occupancy Type | # Households | Median Income |
| Owner-Occupied | 48 (82.8%) | $126,731 |
| Renter-Occupied | 10 (17.2%) | $0 |
| Average | 58 (100.0%) | $125,769 |
Occupancy by Householder Income Bracket in St Martin
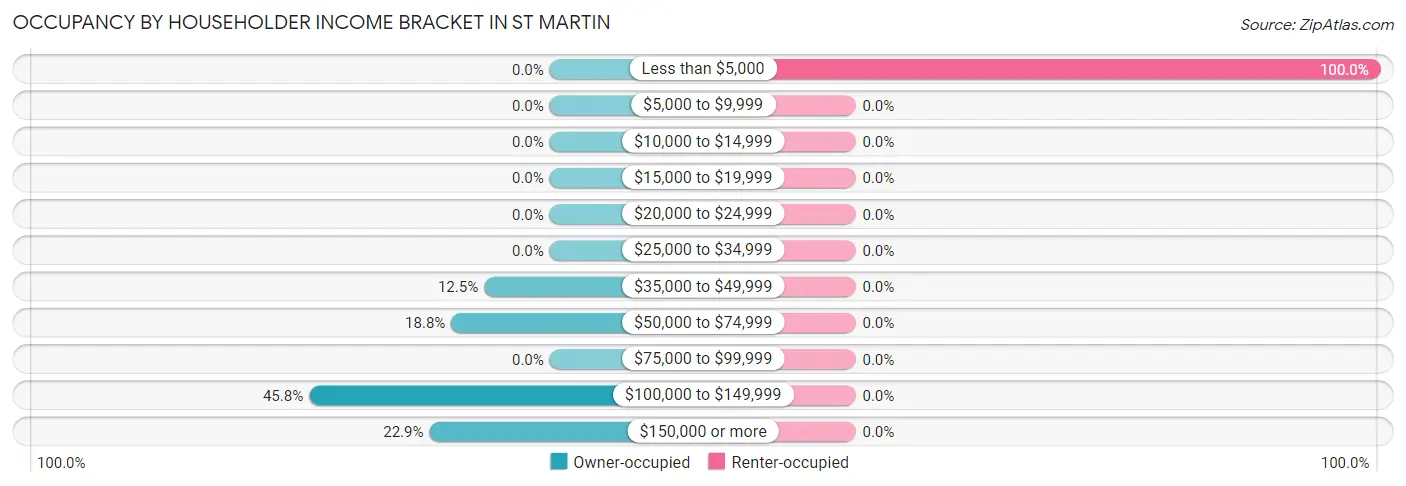
| Income Bracket | Owner-occupied | Renter-occupied |
| Less than $5,000 | 0 (0.0%) | 10 (100.0%) |
| $5,000 to $9,999 | 0 (0.0%) | 0 (0.0%) |
| $10,000 to $14,999 | 0 (0.0%) | 0 (0.0%) |
| $15,000 to $19,999 | 0 (0.0%) | 0 (0.0%) |
| $20,000 to $24,999 | 0 (0.0%) | 0 (0.0%) |
| $25,000 to $34,999 | 0 (0.0%) | 0 (0.0%) |
| $35,000 to $49,999 | 6 (12.5%) | 0 (0.0%) |
| $50,000 to $74,999 | 9 (18.8%) | 0 (0.0%) |
| $75,000 to $99,999 | 0 (0.0%) | 0 (0.0%) |
| $100,000 to $149,999 | 22 (45.8%) | 0 (0.0%) |
| $150,000 or more | 11 (22.9%) | 0 (0.0%) |
| Total | 48 (100.0%) | 10 (100.0%) |
Monthly Housing Cost Tiers in St Martin
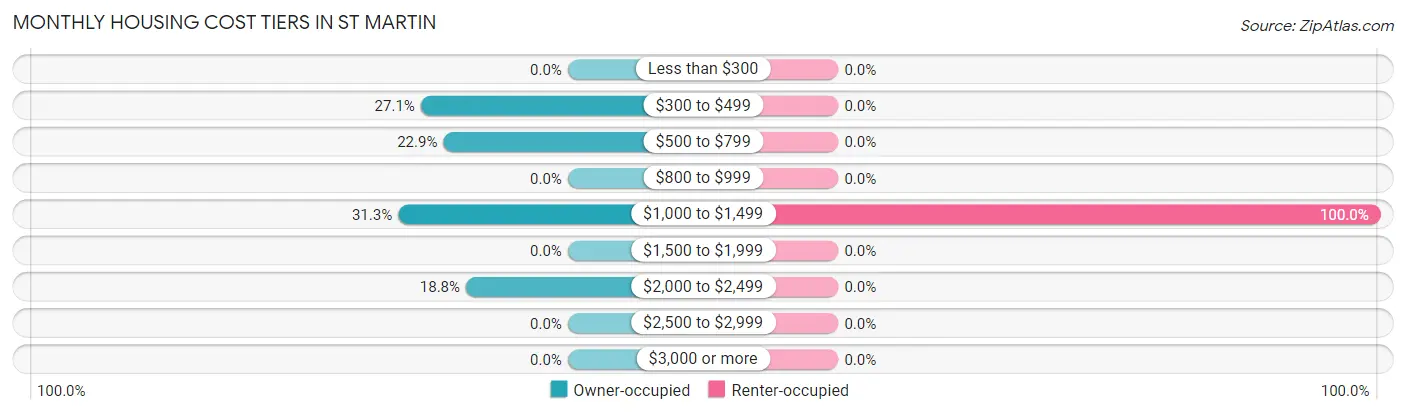
| Monthly Cost | Owner-occupied | Renter-occupied |
| Less than $300 | 0 (0.0%) | 0 (0.0%) |
| $300 to $499 | 13 (27.1%) | 0 (0.0%) |
| $500 to $799 | 11 (22.9%) | 0 (0.0%) |
| $800 to $999 | 0 (0.0%) | 0 (0.0%) |
| $1,000 to $1,499 | 15 (31.2%) | 10 (100.0%) |
| $1,500 to $1,999 | 0 (0.0%) | 0 (0.0%) |
| $2,000 to $2,499 | 9 (18.8%) | 0 (0.0%) |
| $2,500 to $2,999 | 0 (0.0%) | 0 (0.0%) |
| $3,000 or more | 0 (0.0%) | 0 (0.0%) |
| Total | 48 (100.0%) | 10 (100.0%) |
Physical Housing Characteristics in St Martin
Housing Structures in St Martin
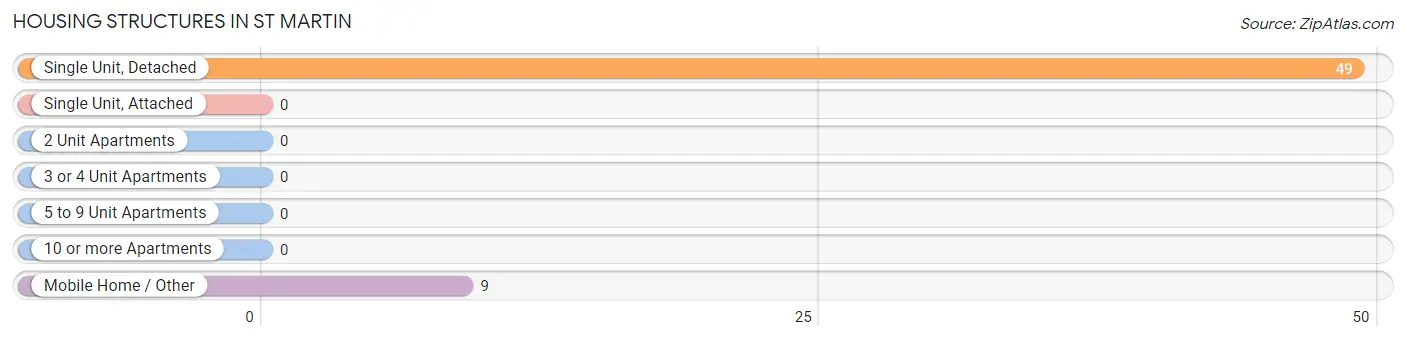
| Structure Type | # Housing Units | % Housing Units |
| Single Unit, Detached | 49 | 84.5% |
| Single Unit, Attached | 0 | 0.0% |
| 2 Unit Apartments | 0 | 0.0% |
| 3 or 4 Unit Apartments | 0 | 0.0% |
| 5 to 9 Unit Apartments | 0 | 0.0% |
| 10 or more Apartments | 0 | 0.0% |
| Mobile Home / Other | 9 | 15.5% |
| Total | 58 | 100.0% |
Housing Structures by Occupancy in St Martin
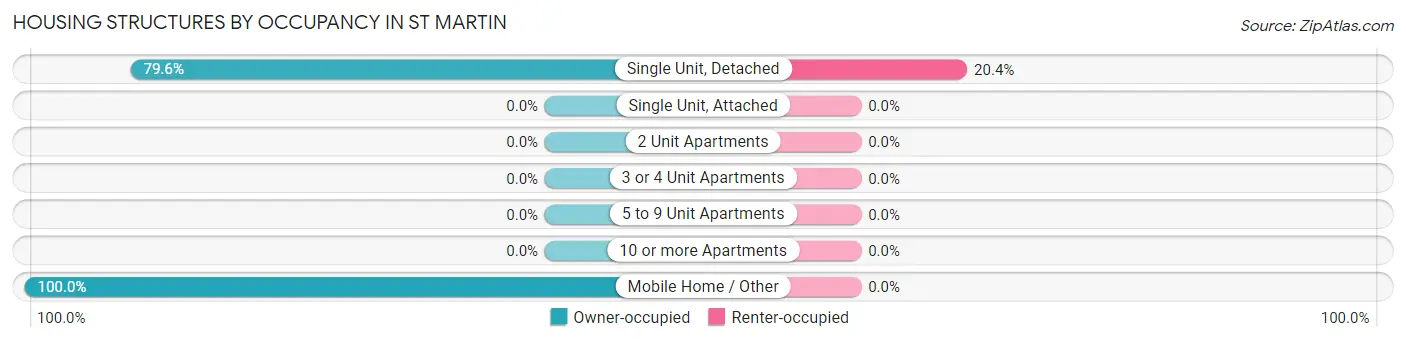
| Structure Type | Owner-occupied | Renter-occupied |
| Single Unit, Detached | 39 (79.6%) | 10 (20.4%) |
| Single Unit, Attached | 0 (0.0%) | 0 (0.0%) |
| 2 Unit Apartments | 0 (0.0%) | 0 (0.0%) |
| 3 or 4 Unit Apartments | 0 (0.0%) | 0 (0.0%) |
| 5 to 9 Unit Apartments | 0 (0.0%) | 0 (0.0%) |
| 10 or more Apartments | 0 (0.0%) | 0 (0.0%) |
| Mobile Home / Other | 9 (100.0%) | 0 (0.0%) |
| Total | 48 (82.8%) | 10 (17.2%) |
Housing Structures by Number of Rooms in St Martin
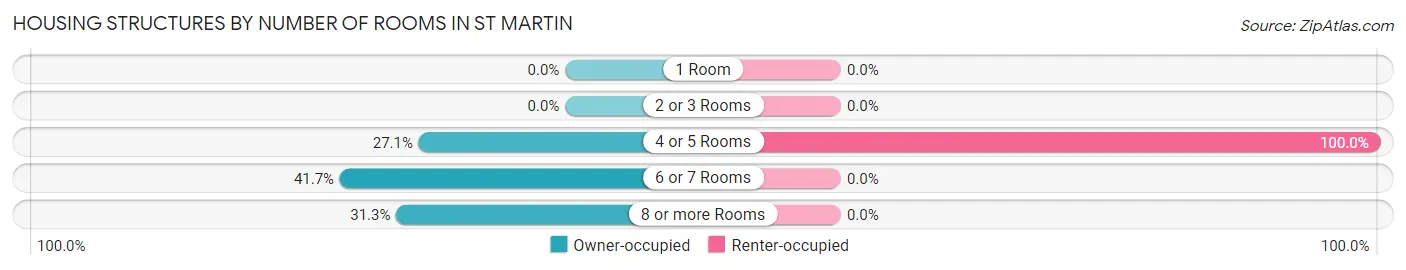
| Number of Rooms | Owner-occupied | Renter-occupied |
| 1 Room | 0 (0.0%) | 0 (0.0%) |
| 2 or 3 Rooms | 0 (0.0%) | 0 (0.0%) |
| 4 or 5 Rooms | 13 (27.1%) | 10 (100.0%) |
| 6 or 7 Rooms | 20 (41.7%) | 0 (0.0%) |
| 8 or more Rooms | 15 (31.2%) | 0 (0.0%) |
| Total | 48 (100.0%) | 10 (100.0%) |
Housing Structure by Heating Type in St Martin
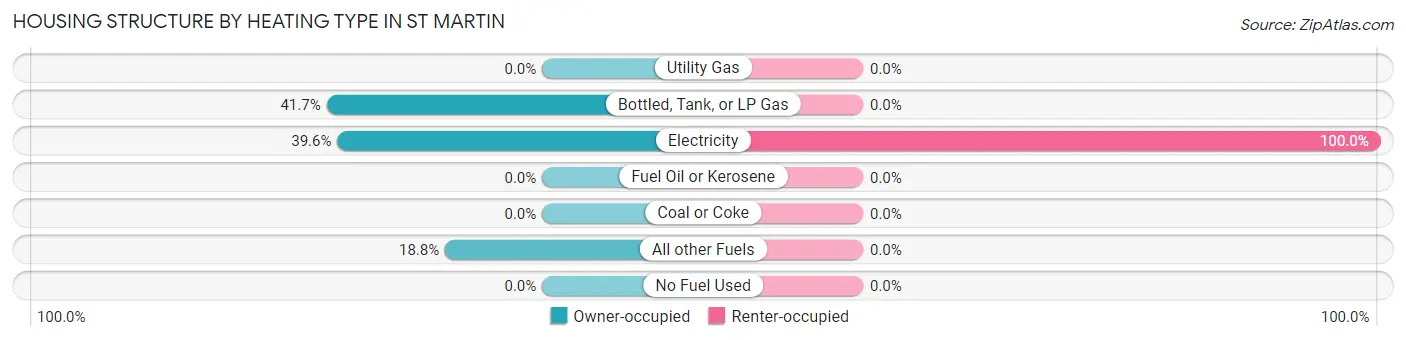
| Heating Type | Owner-occupied | Renter-occupied |
| Utility Gas | 0 (0.0%) | 0 (0.0%) |
| Bottled, Tank, or LP Gas | 20 (41.7%) | 0 (0.0%) |
| Electricity | 19 (39.6%) | 10 (100.0%) |
| Fuel Oil or Kerosene | 0 (0.0%) | 0 (0.0%) |
| Coal or Coke | 0 (0.0%) | 0 (0.0%) |
| All other Fuels | 9 (18.8%) | 0 (0.0%) |
| No Fuel Used | 0 (0.0%) | 0 (0.0%) |
| Total | 48 (100.0%) | 10 (100.0%) |
Household Vehicle Usage in St Martin
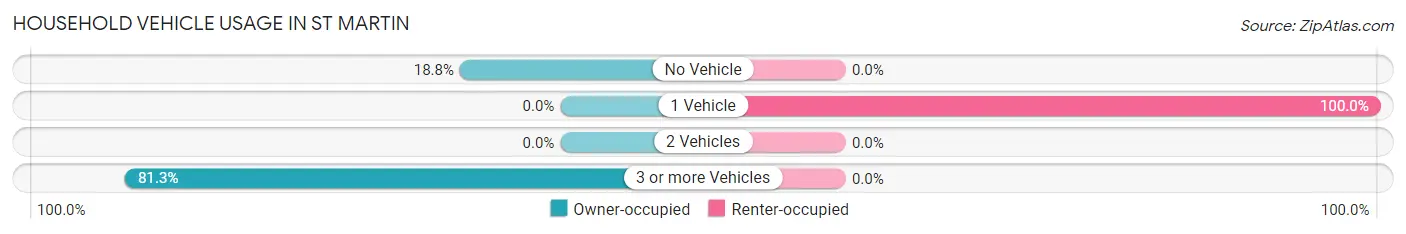
| Vehicles per Household | Owner-occupied | Renter-occupied |
| No Vehicle | 9 (18.8%) | 0 (0.0%) |
| 1 Vehicle | 0 (0.0%) | 10 (100.0%) |
| 2 Vehicles | 0 (0.0%) | 0 (0.0%) |
| 3 or more Vehicles | 39 (81.2%) | 0 (0.0%) |
| Total | 48 (100.0%) | 10 (100.0%) |
Real Estate & Mortgages in St Martin
Real Estate and Mortgage Overview in St Martin
| Characteristic | Without Mortgage | With Mortgage |
| Housing Units | 24 | 24 |
| Median Property Value | - | - |
| Median Household Income | - | - |
| Monthly Housing Costs | - | - |
| Real Estate Taxes | - | - |
Property Value by Mortgage Status in St Martin
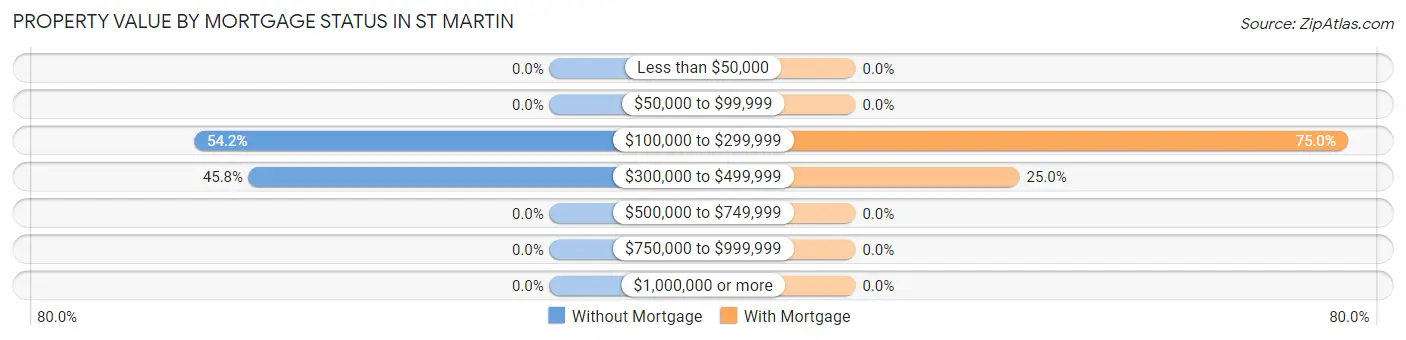
| Property Value | Without Mortgage | With Mortgage |
| Less than $50,000 | 0 (0.0%) | 0 (0.0%) |
| $50,000 to $99,999 | 0 (0.0%) | 0 (0.0%) |
| $100,000 to $299,999 | 13 (54.2%) | 18 (75.0%) |
| $300,000 to $499,999 | 11 (45.8%) | 6 (25.0%) |
| $500,000 to $749,999 | 0 (0.0%) | 0 (0.0%) |
| $750,000 to $999,999 | 0 (0.0%) | 0 (0.0%) |
| $1,000,000 or more | 0 (0.0%) | 0 (0.0%) |
| Total | 24 (100.0%) | 24 (100.0%) |
Household Income by Mortgage Status in St Martin
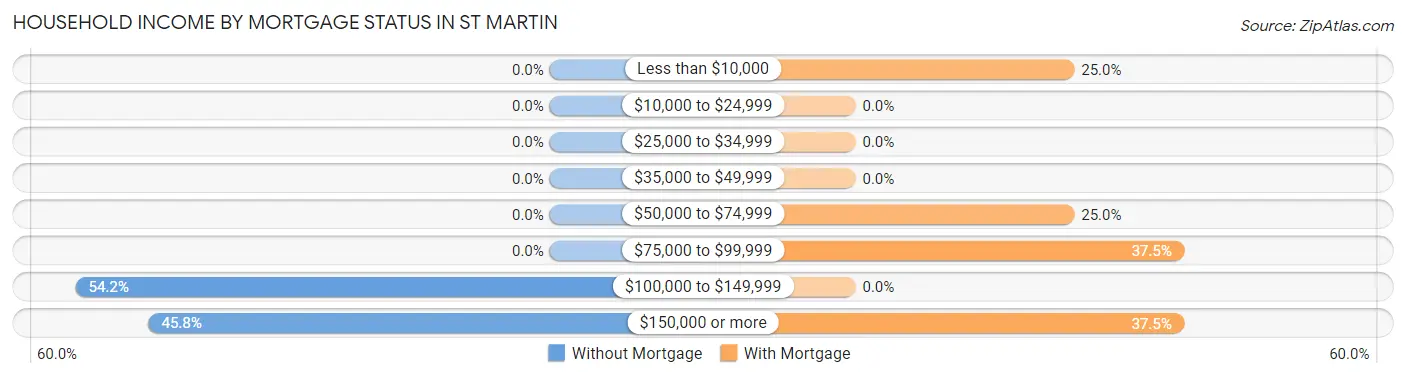
| Household Income | Without Mortgage | With Mortgage |
| Less than $10,000 | 0 (0.0%) | 6 (25.0%) |
| $10,000 to $24,999 | 0 (0.0%) | 0 (0.0%) |
| $25,000 to $34,999 | 0 (0.0%) | 0 (0.0%) |
| $35,000 to $49,999 | 0 (0.0%) | 0 (0.0%) |
| $50,000 to $74,999 | 0 (0.0%) | 6 (25.0%) |
| $75,000 to $99,999 | 0 (0.0%) | 9 (37.5%) |
| $100,000 to $149,999 | 13 (54.2%) | 0 (0.0%) |
| $150,000 or more | 11 (45.8%) | 9 (37.5%) |
| Total | 24 (100.0%) | 24 (100.0%) |
Property Value to Household Income Ratio in St Martin
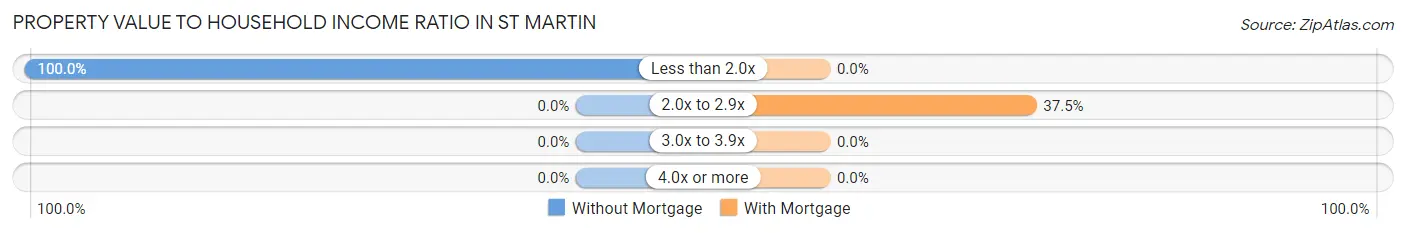
| Value-to-Income Ratio | Without Mortgage | With Mortgage |
| Less than 2.0x | 24 (100.0%) | 0 (0.0%) |
| 2.0x to 2.9x | 0 (0.0%) | 9 (37.5%) |
| 3.0x to 3.9x | 0 (0.0%) | 0 (0.0%) |
| 4.0x or more | 0 (0.0%) | 0 (0.0%) |
| Total | 24 (100.0%) | 24 (100.0%) |
Real Estate Taxes by Mortgage Status in St Martin
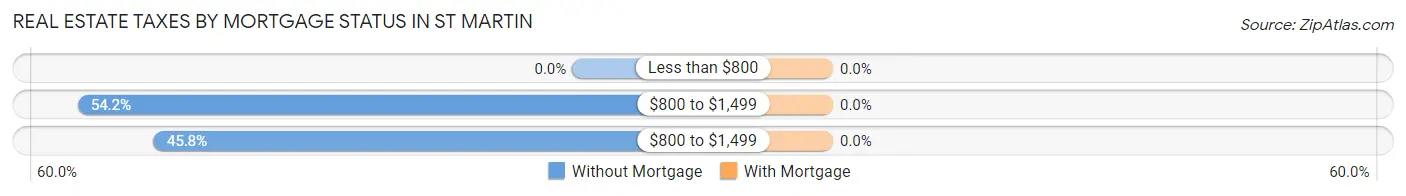
| Property Taxes | Without Mortgage | With Mortgage |
| Less than $800 | 0 (0.0%) | 0 (0.0%) |
| $800 to $1,499 | 13 (54.2%) | 0 (0.0%) |
| $800 to $1,499 | 11 (45.8%) | 0 (0.0%) |
| Total | 24 (100.0%) | 24 (100.0%) |
Health & Disability in St Martin
Health Insurance Coverage by Age in St Martin
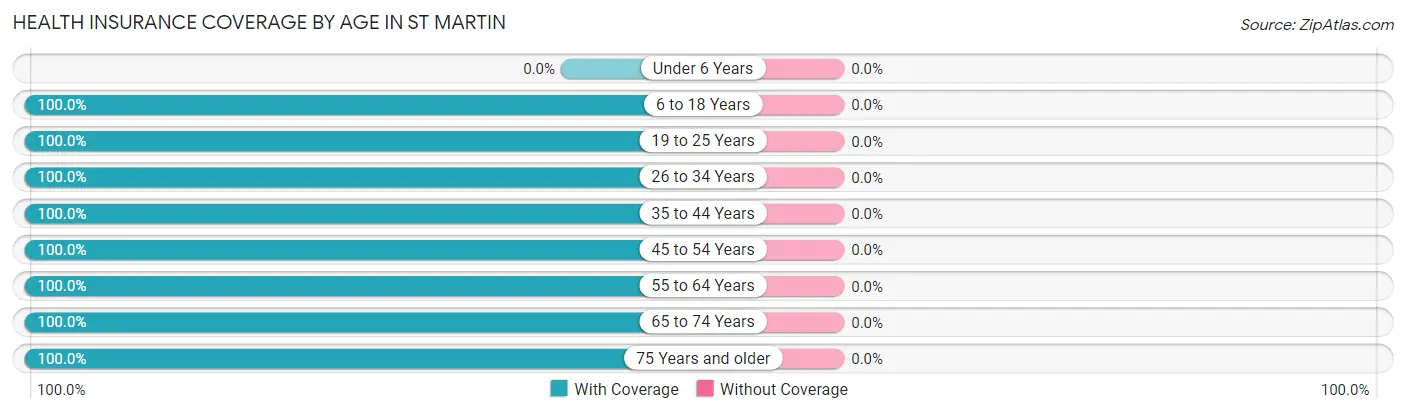
| Age Bracket | With Coverage | Without Coverage |
| Under 6 Years | 0 (0.0%) | 0 (0.0%) |
| 6 to 18 Years | 14 (100.0%) | 0 (0.0%) |
| 19 to 25 Years | 9 (100.0%) | 0 (0.0%) |
| 26 to 34 Years | 11 (100.0%) | 0 (0.0%) |
| 35 to 44 Years | 21 (100.0%) | 0 (0.0%) |
| 45 to 54 Years | 22 (100.0%) | 0 (0.0%) |
| 55 to 64 Years | 19 (100.0%) | 0 (0.0%) |
| 65 to 74 Years | 21 (100.0%) | 0 (0.0%) |
| 75 Years and older | 18 (100.0%) | 0 (0.0%) |
| Total | 135 (100.0%) | 0 (0.0%) |
Health Insurance Coverage by Citizenship Status in St Martin
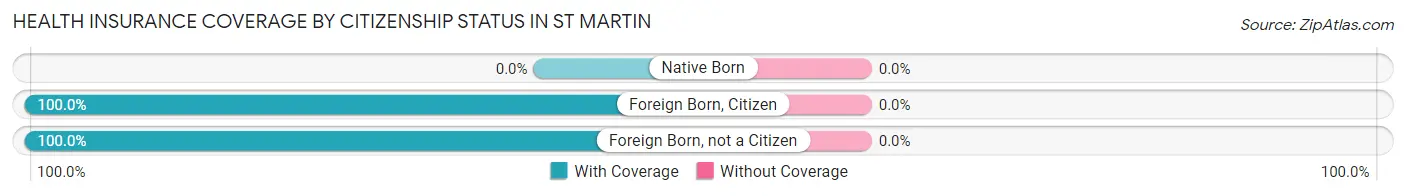
| Citizenship Status | With Coverage | Without Coverage |
| Native Born | 0 (0.0%) | 0 (0.0%) |
| Foreign Born, Citizen | 14 (100.0%) | 0 (0.0%) |
| Foreign Born, not a Citizen | 9 (100.0%) | 0 (0.0%) |
Health Insurance Coverage by Household Income in St Martin
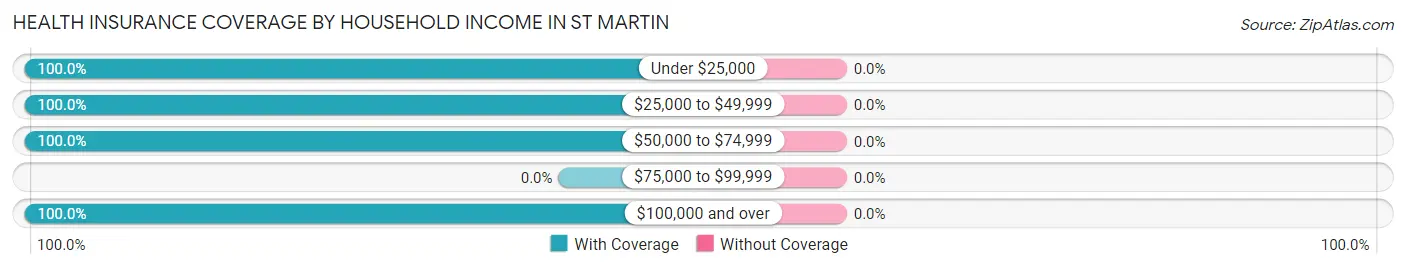
| Household Income | With Coverage | Without Coverage |
| Under $25,000 | 16 (100.0%) | 0 (0.0%) |
| $25,000 to $49,999 | 6 (100.0%) | 0 (0.0%) |
| $50,000 to $74,999 | 27 (100.0%) | 0 (0.0%) |
| $75,000 to $99,999 | 0 (0.0%) | 0 (0.0%) |
| $100,000 and over | 86 (100.0%) | 0 (0.0%) |
Public vs Private Health Insurance Coverage by Age in St Martin
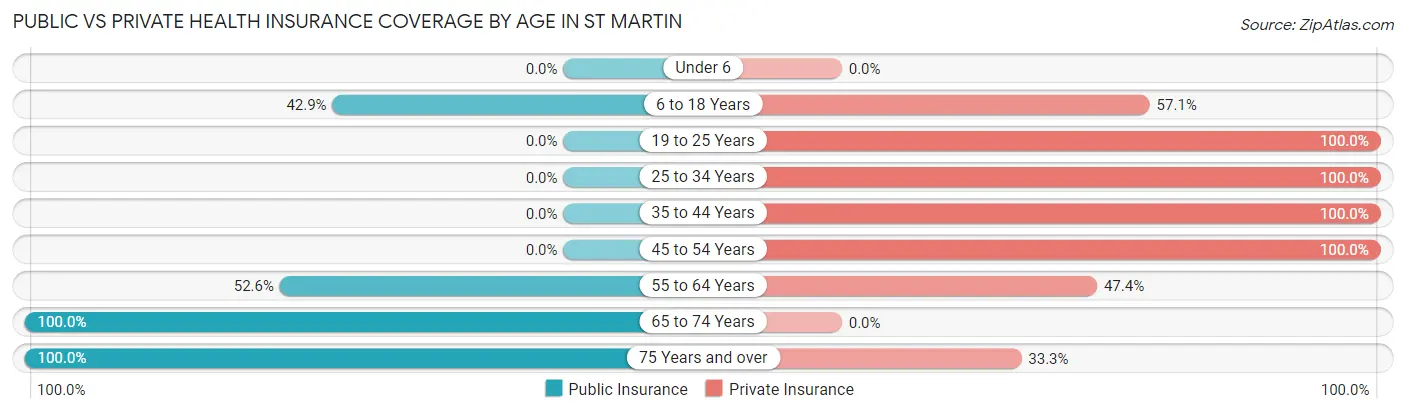
| Age Bracket | Public Insurance | Private Insurance |
| Under 6 | 0 (0.0%) | 0 (0.0%) |
| 6 to 18 Years | 6 (42.9%) | 8 (57.1%) |
| 19 to 25 Years | 0 (0.0%) | 9 (100.0%) |
| 25 to 34 Years | 0 (0.0%) | 11 (100.0%) |
| 35 to 44 Years | 0 (0.0%) | 21 (100.0%) |
| 45 to 54 Years | 0 (0.0%) | 22 (100.0%) |
| 55 to 64 Years | 10 (52.6%) | 9 (47.4%) |
| 65 to 74 Years | 21 (100.0%) | 0 (0.0%) |
| 75 Years and over | 18 (100.0%) | 6 (33.3%) |
| Total | 55 (40.7%) | 86 (63.7%) |
Disability Status by Sex by Age in St Martin
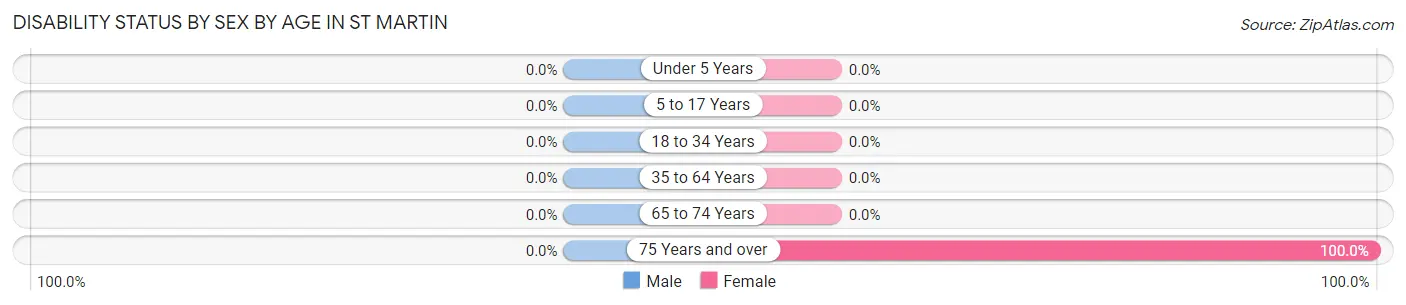
| Age Bracket | Male | Female |
| Under 5 Years | 0 (0.0%) | 0 (0.0%) |
| 5 to 17 Years | 0 (0.0%) | 0 (0.0%) |
| 18 to 34 Years | 0 (0.0%) | 0 (0.0%) |
| 35 to 64 Years | 0 (0.0%) | 0 (0.0%) |
| 65 to 74 Years | 0 (0.0%) | 0 (0.0%) |
| 75 Years and over | 0 (0.0%) | 12 (100.0%) |
Disability Class by Sex by Age in St Martin
Disability Class: Hearing Difficulty
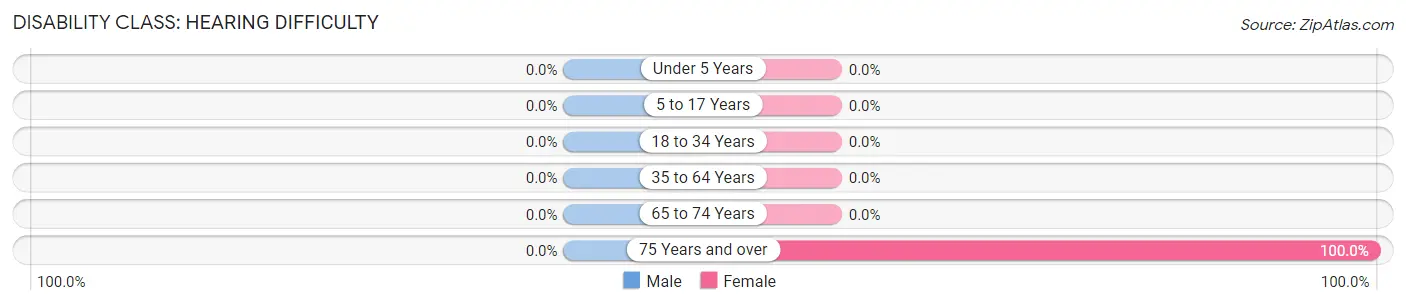
| Age Bracket | Male | Female |
| Under 5 Years | 0 (0.0%) | 0 (0.0%) |
| 5 to 17 Years | 0 (0.0%) | 0 (0.0%) |
| 18 to 34 Years | 0 (0.0%) | 0 (0.0%) |
| 35 to 64 Years | 0 (0.0%) | 0 (0.0%) |
| 65 to 74 Years | 0 (0.0%) | 0 (0.0%) |
| 75 Years and over | 0 (0.0%) | 12 (100.0%) |
Disability Class: Vision Difficulty

| Age Bracket | Male | Female |
| Under 5 Years | 0 (0.0%) | 0 (0.0%) |
| 5 to 17 Years | 0 (0.0%) | 0 (0.0%) |
| 18 to 34 Years | 0 (0.0%) | 0 (0.0%) |
| 35 to 64 Years | 0 (0.0%) | 0 (0.0%) |
| 65 to 74 Years | 0 (0.0%) | 0 (0.0%) |
| 75 Years and over | 0 (0.0%) | 0 (0.0%) |
Disability Class: Cognitive Difficulty
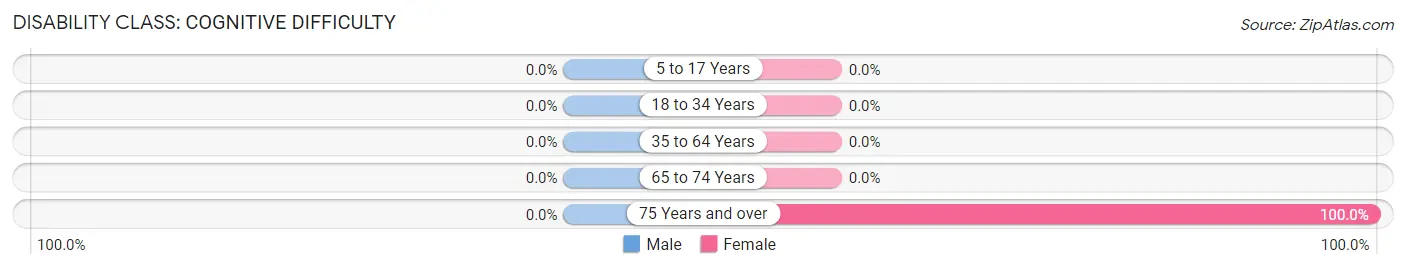
| Age Bracket | Male | Female |
| 5 to 17 Years | 0 (0.0%) | 0 (0.0%) |
| 18 to 34 Years | 0 (0.0%) | 0 (0.0%) |
| 35 to 64 Years | 0 (0.0%) | 0 (0.0%) |
| 65 to 74 Years | 0 (0.0%) | 0 (0.0%) |
| 75 Years and over | 0 (0.0%) | 12 (100.0%) |
Disability Class: Ambulatory Difficulty

| Age Bracket | Male | Female |
| 5 to 17 Years | 0 (0.0%) | 0 (0.0%) |
| 18 to 34 Years | 0 (0.0%) | 0 (0.0%) |
| 35 to 64 Years | 0 (0.0%) | 0 (0.0%) |
| 65 to 74 Years | 0 (0.0%) | 0 (0.0%) |
| 75 Years and over | 0 (0.0%) | 12 (100.0%) |
Disability Class: Self-Care Difficulty
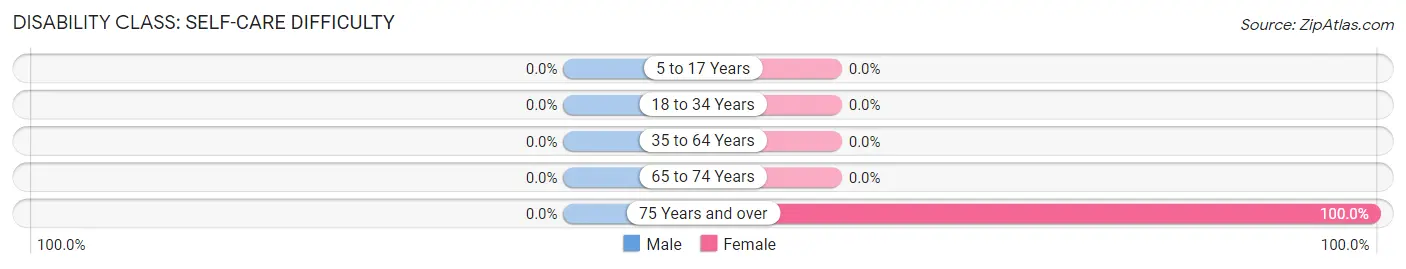
| Age Bracket | Male | Female |
| 5 to 17 Years | 0 (0.0%) | 0 (0.0%) |
| 18 to 34 Years | 0 (0.0%) | 0 (0.0%) |
| 35 to 64 Years | 0 (0.0%) | 0 (0.0%) |
| 65 to 74 Years | 0 (0.0%) | 0 (0.0%) |
| 75 Years and over | 0 (0.0%) | 12 (100.0%) |
Technology Access in St Martin
Computing Device Access in St Martin
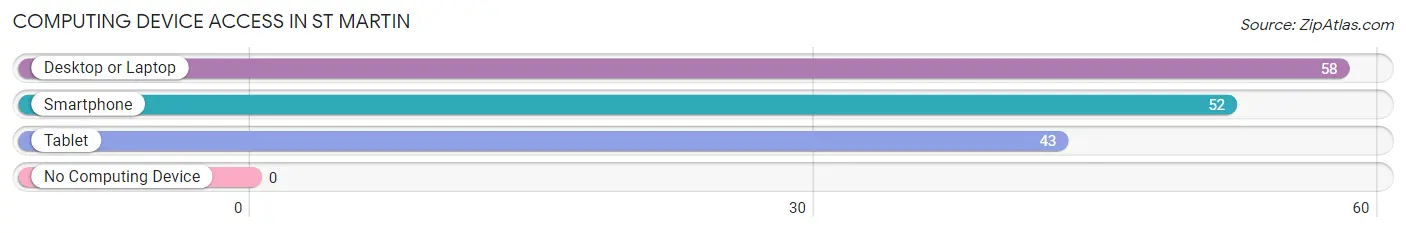
| Device Type | # Households | % Households |
| Desktop or Laptop | 58 | 100.0% |
| Smartphone | 52 | 89.7% |
| Tablet | 43 | 74.1% |
| No Computing Device | 0 | 0.0% |
| Total | 58 | 100.0% |
Internet Access in St Martin
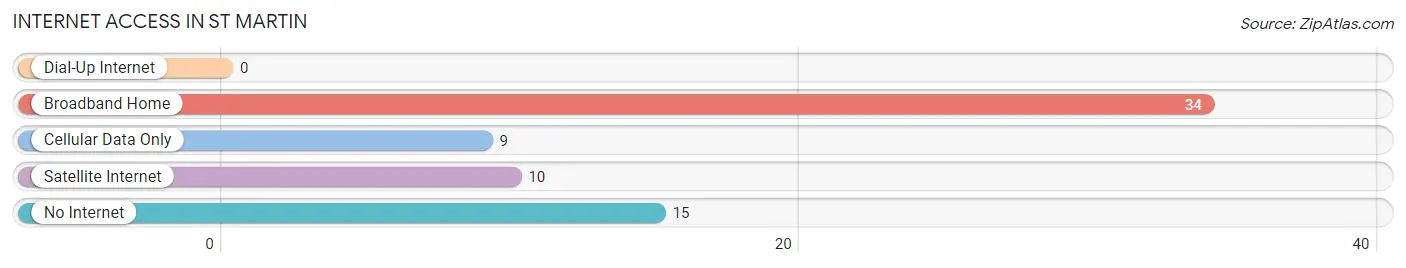
| Internet Type | # Households | % Households |
| Dial-Up Internet | 0 | 0.0% |
| Broadband Home | 34 | 58.6% |
| Cellular Data Only | 9 | 15.5% |
| Satellite Internet | 10 | 17.2% |
| No Internet | 15 | 25.9% |
| Total | 58 | 100.0% |
St Martin Summary
Martin, Ohio is a small village located in the southeastern corner of Auglaize County, Ohio. It is situated on the banks of the Auglaize River, and is part of the Wapakoneta Micropolitan Statistical Area. The village has a population of approximately 1,000 people, and is home to a variety of businesses, including a grocery store, a hardware store, a bank, and a post office.
History
The area that is now Martin, Ohio was first settled in 1832 by a group of German immigrants. The village was originally known as “New Bremen”, after the German city of Bremen. The village was renamed “Martin” in 1837, after the first postmaster, John Martin.
The village of Martin was officially incorporated in 1845. During the late 19th century, the village was a thriving agricultural community, with a variety of businesses, including a flour mill, a sawmill, a blacksmith shop, and a general store.
Geography
Martin is located in the southeastern corner of Auglaize County, Ohio. It is situated on the banks of the Auglaize River, and is part of the Wapakoneta Micropolitan Statistical Area. The village has a total area of 0.6 square miles, all of which is land.
Economy
The economy of Martin is largely based on agriculture. The village is home to a variety of farms, including dairy farms, beef farms, and vegetable farms. The village also has a variety of businesses, including a grocery store, a hardware store, a bank, and a post office.
Demographics
As of the 2010 census, the village of Martin had a population of 1,000 people. The racial makeup of the village was 97.2% White, 0.7% African American, 0.2% Native American, 0.2% Asian, 0.2% from other races, and 1.7% from two or more races. Hispanic or Latino of any race were 0.7% of the population.
The median income for a household in the village was $41,250, and the median income for a family was $48,750. The per capita income for the village was $19,945. About 8.2% of families and 10.2% of the population were below the poverty line, including 14.3% of those under age 18 and none of those age 65 or over.
Conclusion
Martin, Ohio is a small village located in the southeastern corner of Auglaize County, Ohio. It is situated on the banks of the Auglaize River, and is part of the Wapakoneta Micropolitan Statistical Area. The village has a population of approximately 1,000 people, and is home to a variety of businesses, including a grocery store, a hardware store, a bank, and a post office. The economy of Martin is largely based on agriculture, and the village is home to a variety of farms, including dairy farms, beef farms, and vegetable farms. The racial makeup of the village is predominantly White, with a small percentage of African American, Native American, Asian, and other races. The median income for a household in the village is $41,250, and the median income for a family is $48,750.
Common Questions
What is the Total Population of St Martin?
Total Population of St Martin is 135.
What is the Total Male Population of St Martin?
Total Male Population of St Martin is 56.
What is the Total Female Population of St Martin?
Total Female Population of St Martin is 79.
What is the Ratio of Males per 100 Females in St Martin?
There are 70.89 Males per 100 Females in St Martin.
What is the Ratio of Females per 100 Males in St Martin?
There are 141.07 Females per 100 Males in St Martin.
What is the Median Population Age in St Martin?
Median Population Age in St Martin is 49.0 Years.
What is the Average Family Size in St Martin
Average Family Size in St Martin is 2.7 People.
What is the Average Household Size in St Martin
Average Household Size in St Martin is 2.3 People.
What is Per Capita Income in St Martin?
Per Capita income in St Martin is $41,519.
What is the Median Family Income in St Martin?
Median Family Income in St Martin is $127,308.
What is the Median Household income in St Martin?
Median Household Income in St Martin is $125,769.
What is Inequality or Gini Index in St Martin?
Inequality or Gini Index in St Martin is 0.37.
How Large is the Labor Force in St Martin?
There are 80 People in the Labor Forcein in St Martin.
What is the Percentage of People in the Labor Force in St Martin?
62.0% of People are in the Labor Force in St Martin.